Article

Land Use Has Changed through the Last 200 Years in Various Production Areas of South Bohemia

Department of Landscape Management, Faculty of Agriculture and Technology, University of South Bohemia in Ceske Budejovice, Studentska 1668, 370 05 Ceske Budejovice, Czech Republic
*
Author to whom correspondence should be addressed.
Land 2022, 11(10), 1619; https://doi.org/10.3390/land11101619
Submission received: 29 August 2022 / Revised: 12 September 2022 / Accepted: 18 September 2022 / Published: 22 September 2022
(This article belongs to the Collection Land Use Transitions and Land System Science)

Abstract

:
This article focuses on land use changes in the area of interest in the southern part of the Czech Republic (South Bohemia Region). Land use changes have been assessed at several time levels over nearly two centuries. Unlike similar studies, two types of materials were used as source data and compared. Specifically, these are historical maps or aerial photographs and the Corine Land Cover database. The evolution of land use was examined on a representative set of sixty cadastral areas, which evenly cover the territory of three different production areas of the South Bohemia Region. Each production area was then evaluated both as a whole and separately. The paper’s results confirm the trend of decreasing the share of intensively used agricultural land (arable land), especially in worse natural conditions, like in other countries of the Central European region. An essential result of the publication was also the demonstration of the unique development of the post-1948 period when there was a significant difference in land use development between the border forage production areas and the rest of the agriculturally used parts of the region.

1. Introduction

The change in the structure and use of the landscape in the Czech Republic primarily reflects the individual phases of the historical and socio-economic development of the territory, as well as the political organisation of the state, as in other European countries. Since the middle of the 19th century, these were changes caused by war conflicts, their direct and indirect consequences, changes in the state system, and related political acts.
At first, it is necessary to define two basic terms: land use and land cover. The term land use includes both the natural and socio-economic parts. It is a phenomenon changeable over time, like the term landscape [1]. Land cover is defined internationally as the observed biophysical cover of the earth’s surface [2]. According to [3,4], land cover is the current combination of land use and vegetation covering a given surface. On the other hand, land use is also defined by [5] as a concrete manifestation of human activity in space and time that incorporates historical, economic, social, and cultural potential. It is an intersection between natural conditions of the territory, technical possibilities, and human knowledge.
Land use is closely related to efforts to divide territories based on natural production ability. This effort is included in many attempts to classify parts of the region into individual production areas [6,7,8]. The regionalisation of agricultural production is an effort to maximise the use of production power in agriculture with the help of natural conditions and production quality [9,10]. From the historical point of view, the production ability was divided based on soil quality. This classification was highly dependent on the knowledge of soil properties and the whole complex of other factors [11,12]. The entire Czechoslovak Republic as the area of interest has been divided into four primary production areas since 1918. The delimitation of these areas was based on the known conditions of soil, climatic, production, and economic properties, the composition of cultures, and the spectrum of crops and varieties cultivated [13]. The system included a maize production area (maize-beet-type), a beet area (beet-type), a grain area (grain-feed type), a potato area (potato-grain type,) and a forage area (fodder type with a focus on breeding). The last revision of production areas took place in 2003 when the number of production areas was reduced to four, according to European common production areas, namely a maize area with three sub-areas, a beet area with three sub-areas, a potato area with three sub-areas and a mountain area divided into two sub-areas [3,14].
Changes in land use motivated by production intentions then vary according to the prevailing natural conditions and societal interests at a particular time [15,16,17]. Changes manifest themselves at different intensities and scales [18]. Hand in hand with the actual changes in land use on the ground, changes in the administrative registration of the use of areas in the various registers enacted in the different countries are also to be reflected [19]. These administrative records are then used for various economic activities, such as subsidies for agricultural and non-agricultural activities in the landscape [20], construction and technical plans, nature and landscape conservation, etc. [21,22]. If land use changes are made arbitrarily without the consent of the responsible institutions and a proper administrative record, several irregularities arise, which can lead to further problems such as erosion problems, flood risks, landslides, land inaccessibility, etc. [23,24].
Typically, the most significant part of the land use in the European area has always been agricultural land or, in less favourable areas, especially in mountainous areas, forest cover [25,26]. This has been the status quo without a notable change since the end of the region’s colonisation, which in the case of the Czech Republic was around the 15th century [5,17,19,27,28]. Changes in land use have occurred only sporadically and became more pronounced with the beginning of the Industrial Revolution in the 19th century and with social changes in individual regions [29,30,31]. These changes were associated with the intensification of agricultural production to the detriment of stable areas such as wetlands and forests on the one hand and the increase in built-up areas, particularly for transport infrastructure and industrial buildings, on the other [32,33]. These changes have continued throughout the 20th century, often dealing with the consequences of wars and subsequent geopolitical changes [34,35,36]. By the turn of the 20th and 21st centuries, changes in land use in European countries began to move in two distinct directions [37,38]. In less favoured areas, there has been a significant extensification of agricultural production, with traditional agrarian land use being replaced by more environmentally friendly land uses such as forests, water bodies or grassland [39,40,41], and in the vicinity of larger villages, there has been significant urbanisation [42,43,44,45], i.e., an increase in built-up areas, particularly at the expense of arable land [46,47,48].
Data from various sources are commonly used to figure out changes in land use. The most common data come from cadastral maps and land registry records [49,50,51]. The second group of studies involves land use reconstructions using aerial photographs and orthophotos [5,19,52,53,54]. In contrast to these studies, a group of papers deals with treating changes in land cover at larger spatial scales based on interpreting the Corine Land Cover database [55,56,57]. Each variant of the data used has its specificities. Some studies compare several selected variants’ accuracy and predictive power [58,59], which this publication does not aim to do.
This paper aimed to demonstrate the differences in the development of individual production areas defined in the model area of the South Bohemia Region in the Czech Republic between 1848 and 2019 based on the analysis of long-term land use change as it is captured on maps and aerial images within the model area.
The hypothesis is that land use development has always been determined by the area’s location about the productive capacity of the soils. Based on this hypothesis, we chose one research question for this study:
RQ1: What are the most significant land use changes observed in the different production areas of the area of interest?

2. Materials and Methods

The South Bohemian Region was chosen as an area of interest for analysing land use changes. The reason for the choice of this site is the region’s distribution in three production areas with quite different conditions, ranging from the almost flat north-eastern part with traditional intensive agriculture through the transitional central hilly part to the mountainous southern part of the region with large forest areas. The set of sixty cadastral territories (Figure 1) was selected based on changes in individual production areas defined by [60]. These territories are evenly represented in the whole area of the monitored region, where twenty sites of interest were selected in each of the three production areas–(potato (P), grain (G), and forage (F) production area—in the South Bohemian Region. The characteristics and percentages of individual production areas within the South Bohemia Region are presented in Table 1 below.

2.1. Choice of the Cadastral Territories

The sites were selected according to the criteria of average change for the whole monitored period of 1848–2019. The land use area database determined the value of the change index was determined according to [61]. This way, a set of sixty cadastral territories was chosen and analysed. The selected cadastral areas are comparable in the area and perimeter of the plots. All the regions have an area between 515.94 ha and 865.85 ha, which is the average area of cadastral areas in the Czech Republic. The perimeter of the cadastral areas varies between 6.12 km and 14.73 km. This shows the relative evenness of the cadastral areas’ rims, regardless of their size, due to the administrative division of the units without regard to natural boundaries such as watercourses or land use boundaries.

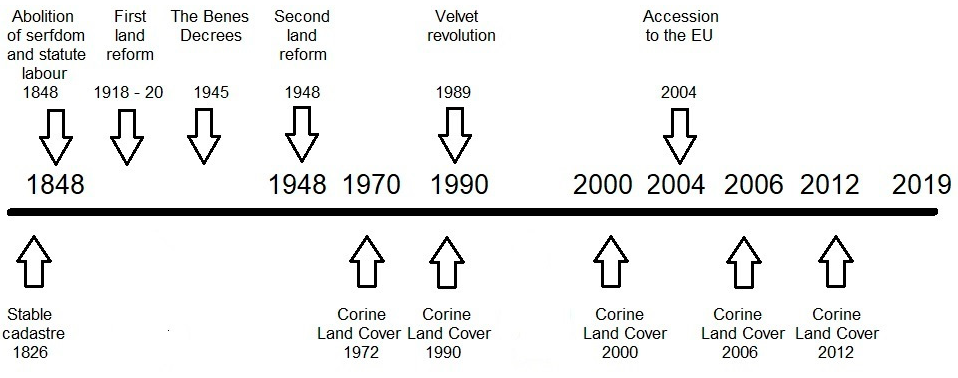
2.2. Choice of Periods

The availability of data predetermined the choice of periods. Land use records have been carried out for the territory of the current Czech Republic for a long time—practically since the first inventories of all land in the revision of the Theresian Cadastre in 1757. Still, the first relevant, usable land use data comes from establishing the Stable Cadastre in 1817. This inventory of soils was carried out between 1826–1843 in the territory of the present South Bohemian Region. The year 1848 was chosen as the starting point for checking and use development; then, all data sources are available, both in written and graphical form. The year 2019 was selected as the end of the interval, i.e., the current state of use of the area. Due to the length of the monitored interval (almost 200 years since the first registered data of stable cadastre), partial milestones were selected within this framework, which continually defines the territory’s fundamental political, social, and economic changes.
The year 1948 was chosen as the first milestone. The period thus defined (1848–1948) was marked by two war conflicts and land reforms. The year 1990 was the second milestone. This year marks the transition from a socialist concept of society and economy to a free market economy. The period up to 1990 has been marked by changes from small-scale agricultural technologies to large-scale and centrally managed economies. The second land reform, whose consequences became apparent at the beginning of this period, is a significant factor.
The third milestone was the year 2004. This year divides the period before accession to the European Union and when the Czech Republic became a full member of the European Union on 1 May 2004. This milestone was chosen on changes both to access to subsidy titles and demographic and socio-economic changes by allowing the free movement of people, capital, and labour after accession to the European Union.
Despite these periods, the analysis of land use changes was supplemented by an analysis of data from the CORINE Land Cover database (CoORdination of Information on the Environment). Regarding the data and the data collection interval, the years 1972, 1990, 2000, 2006 and 2012 were chosen as partial milestones only for this analysis.
The individual milestones and their justification in terms of historical events within the study area are clearly illustrated in Figure 2.

2.3. Data Sources

Data for processing this article were taken from digital databases and archival materials from the Czech Office for Surveying, Mapping and Cadastre, the Czech Statistical Office, and the State Regional Archive. Land use in the area was evaluated from two different perspectives in several time horizons.
  • Aerial imagery and map data
For the analysis of changes in actual land use, free available series of black and white aerial photographs from 1947–1953 were used as the oldest aerial photographs (chosen for analysis in 1948). The later period was selected for comparison of data after 1990. Pictures in black and white scale with worse resolution were used in 1990–2000. After 2000, the images are in better resolution in colour scale, at a three-year refresh interval. These were used for the analysis years 2004 and 2019. Data from aerial photography are available through the WMS service of the Czech Office for Surveying, Mapping, and Cadastre. The spatial resolution of the aerial photographs was significantly refined during the period under review. The oldest aerial photographs covering the period between 1947 and 1953 are in black and white form, with pixel sizes ranging from 0.7 m to 1 m depending on the exact time the image was taken. For modern orthophoto maps from 1990 until 2008, all images were taken with a pixel size of 0.5 m, regardless of whether the image was taken in colour or black and white. Between 2009 and 2015, all images were taken at a resolution of 0.25 m, and then, after 2015, even at a pixel size of 0.20 m.
Due to the brief period covered by aerial photography data compared to the length of the period recorded in the cadastral registers, one of the historical maps, which faithfully captures the use of the area under investigation, is often used as a comparative historical basis. In this case, the map of the above-mentioned Stable Cadastre from 1826 to 1843 (marked in the analysis for simplification of the year-recorded state of 1848) was used as a comparative source. Just as pixel size is essential for good interpretability of aerial imagery, scale is important for map inputs. For the map sources used in this publication, map scales range from 1:2880 for the Stable Cadastre maps to 1:2000 or 1:1000 for the emerging Land Cadastre maps of the early 20th century. The data it sof the stable cadastre were taken from the web server.archivnimapy.cuzk.cz.
Figure 3 shows an example of each of the map sources used, namely a Stable Cadastral map (A), an aerial photograph from the 1950s (B), an aerial photograph from 1990 (C) and an aerial photograph from 2019 (D).
  • CORINE Land Cover Data
The data of the CORINE Land cover database (CoORdination of Information on the Environment) have been available for the European continent since the 1970s of the 20th century. For this work, data evaluated for 1972, 1990, 2000, 2006, and 2012 with the usual pixel size of 30 × 30 m were used. Because of this small detail, Corine Land Cover data were used only as supplementary information on land use development within the studied territory. All data from the Corine Land Cover database were taken from the Agency for Nature Conservation and Landscape Protection.
A summary of the spatial parameters of the aerial imagery, mapping, and Corine Land Cover imagery is provided in Table 2.

2.4. Data Analysis and Evaluation

First and simultaneously, the essential prerequisite for successful analysis and evaluation of all data is their areal and factual comparability. The spatial comparability assumes that the surveyed territorial units are stable in their area. The system of cadastral division is practically stabilised throughout the period under review, but the boundaries of individual departments may have changed over time. Although the surveyed sample of cadastral territories did not show more significant spatial variability during the period under review, separate map sources and images were standardised to the cadastral area corresponding to the boundaries as of 31 December 2014. The Stable Cadastre maps were the only exception when it was necessary to go ahead with more correction in space. The reason is another administrative territorialisation within the Austro-Hungarian monarchy. If the cadastral area at that time was smaller than the present, neighbouring cadastral areas were also used for analysis so that the entire space was filled with map background. Otherwise, the map was cut off by the border of the current cadastral area. In the case of historical status, data from all sub-parts belonging to the existing territorial unit were added in cadastral areas smaller than at present. Otherwise, the data were corrected according to the preserved written records of the Stable Cadastre and Land Register.
The factual comparability of land-use data lies in the inconsistency of the registered land use categories. The most significant number of land use categories was recorded in maps of a Stable Cadastre from the mid-19th century. More than fifty categories of land use have been found in this type of map document legend. Over time, individual classes were reduced. The main reason was the simplification of cadastral records and the disappearance of some use categories. There is a last reduction in land use categories to the current number of ten types. The legend converter of each map input is given in Table A1 in Appendix A of this article.
The actual analysis of the map data and historical aerial photographs was performed using ESRI ArcGIS 10.6. software. The maps attached through WMS (Web Mapping Services) were later vectorised. The objects of the vectorisation were all the separate parcels, or land blocks, contained within the map frame. An attribute table was created for each shapefile where essential characteristics such as area [m2] were calculated for each polygon, and all necessary land use information was added. The primary advantage of the Corine Land Cover data source is the digital form of the data. For this reason, it was only necessary to unify the characteristics for each map feature within the attribute tables.
The analysis of the resulting image material was carried out manually, where the individual land use types were classified based on standardised methods mentioned, e.g., in [3,8] and based on the authors’ experience with image interpretation. The interpretability of the data varies from period to period depending on the images’ quality, spatial resolution, and the time of year in which the photo was taken. In the case of the oldest map data in stable cadastral maps, interpretability is facilitated by the map key and parcel markings. An analogous situation occurs in interpreting Corine Land Cover data, where the classification is already prepared in the source document. In these cases, only the digitisation of the acquired material is sufficient for land use interpretation. Here, the reconstruction effect is then 100%. In the case of aerial images, identifying forest areas, water areas, and built-up areas are unquestionable for all types of images, regardless of their age. Even in these cases, the reconstruction effect is practically 100%, and no calibration of the acquired data is needed. The only problem is, therefore, the differentiation of arable land, grassland, and pastures, where, especially in older black and white images with lower resolution, it is difficult to identify with 100% certainty the several types of land use. The authors are aware of this fact, and several measures have been taken to reduce the potential error. First, calibration was carried out on several cadastral areas with data records of archives in the digital State Regional Archive, namely chronicles, records of agricultural companies, etc. Subsequently, the individual images were reinterpreted after gaining experience in distinguishing the diverse types of land use. All aerial photographs were classified by the same person, resulting in the same amount of possible variation in all cases. In the case of significant ambiguities, individual cases were re-evaluated using additional supporting material, specifically for the post-1948 period from the Comprehensive Land Survey field records, which contain data on the actual land use of each cadastral area. After this adjustment, the effect can be assessed as extremely high; in line with [33], the impact ranges between 85.00% and 96.00%.

3. Results

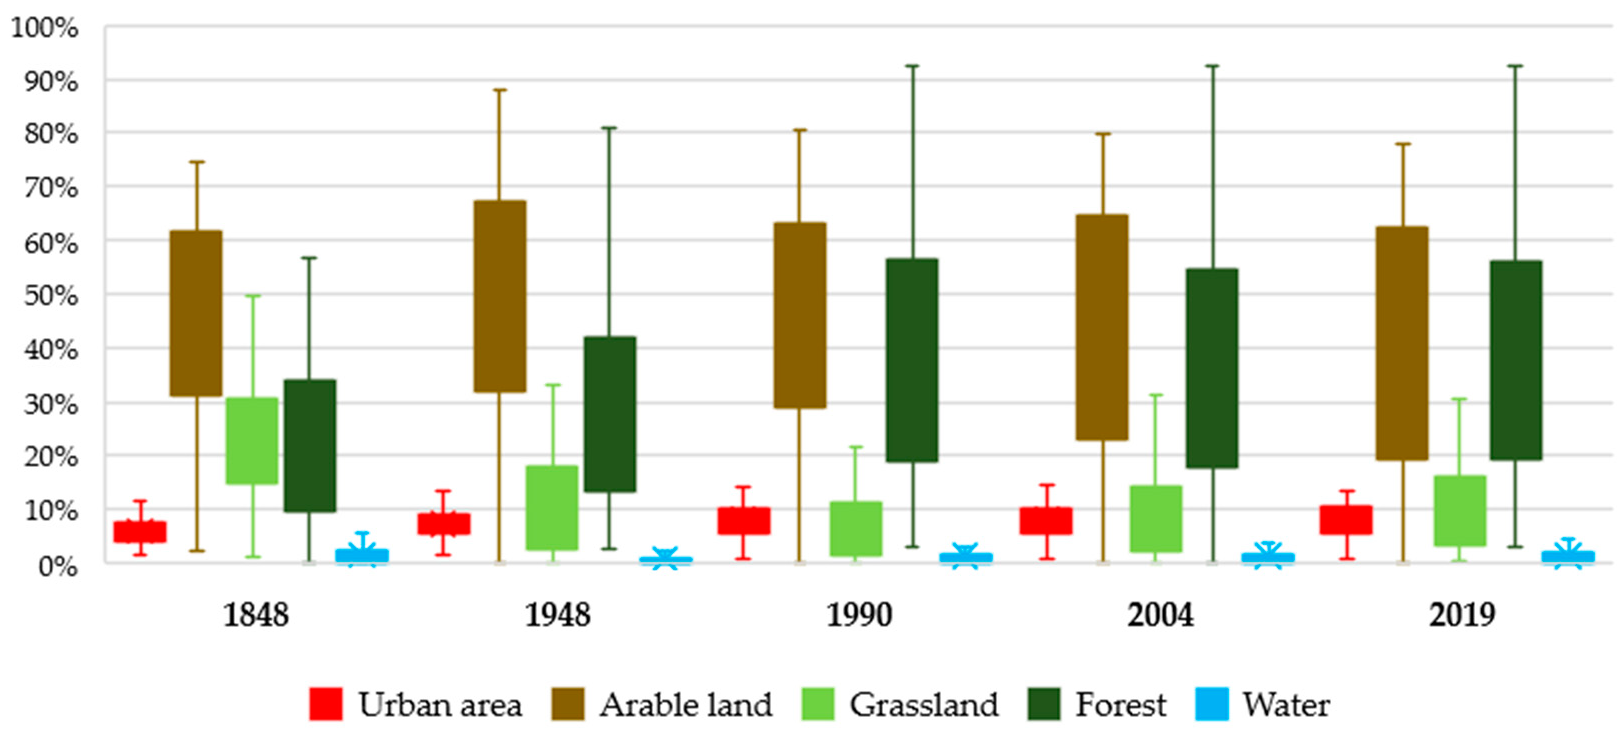
3.1. The Changes in the Authentic Representation of Individual Land Use Categories Based on Map Sources and Aerial Photographs

The analysed cadastral territories can still have an agricultural character (Figure 4). The most notable change in the whole monitored period is the gradual decrease in the acreage of categories of agricultural parcels at the expense of forest land and built-up areas, from the original average of 69.14% of farm parcels in 1848 to the current 52.31%. The change was caused by an increase in the built-up area, especially in the vicinity of cities. The increase in built-up areas is also related to expanding roads and railways. The total increase in built-up areas is 2.31%. The rise in afforestation is an even more meaningful change in agricultural land loss, by 13.30%.
Regarding land use development in individual production areas, it is possible to trace two separate groups within the analysed cadastral, which are characterised by a similar development. These two homogeneous groups have cadastral territories with the same land-use development. The first group consists of cadastral areas belonging to the cereal and potato production areas. The second group includes the cadastral areas of the forage production area.
The first group of cadastral areas in potato and cereal production areas is characterised by a remarkably similar distribution of land use categories (Figure 5). The most significant percentage of the site belongs to agricultural land, of which arable land dominates. Its representation during the monitored period ranges between 53.24% and 61.92 % on average. However, it is also possible to trace extremes within the forty cadastral territories that fall within these two production areas. The lowest share of arable land is at 10.54%; the opposite extreme is cadastral territories, with an arable land share of about 87.00%. In these high-production areas, a low percentage of arable land is associated with areas protected for water or ecological purposes. On the other hand, there is no apparent reason for a rare high rate of arable land. These are usually areas where the use of one agricultural entity with a long tradition of crop production prevails.
The category of permanent grassland has long been present (since 1948) in this group of cadastral territories only in a minor part of the area. Moreover, this area is constantly decreasing during the period under review. The average percentage is around 6.51%. A higher proportion of permanent grassland was recorded in these localities only at the beginning of the period between 1848 and 1948 when this higher percentage (17.89% on average) was associated with the presence of municipal pastures. At present, there are also several cadastres where the presence of permanent grassland is zero or a meagre percentage. Interestingly, within these cadastral territories, there is almost no category of water surface, which is incredibly unusual for the cereal production area in the South Bohemian region due to the pond systems found in this production area. The average representation of this type of land use is only 2.25% of the cadastral area in terms of changes; these production areas are characterised by only a tiny variation in the percentage of the different land use categories. A more notable difference is only a slight increase in the arable land at the expense of permanent grassland, especially in the grain industry between 1848–1948. However, this change is only minor, on average, 6.61%. Changes in other categories are in the order of 1.00–3.00%, which corresponds to common changes within the man-used area. These are expected changes in the extension of development, expansion of the network of roads, planting small elements of greenery in the landscape, construction of small water reservoirs, etc.
The reason for this invariability is the high fertility of agricultural land commodities across different periods. The forage area documented a different situation in the third analysed production area (Figure 5). In the cadastral areas of this production area, a gradual decrease of the agricultural regions is typical at the expense of forest areas. Since the beginning of the period under review, these cadastral areas have been characterised by significantly lower agrarian land, especially arable land. As early as 1848, the average percentage of these fields was 28.50%. However, even in these localities, there are significant disproportions in arable land during the monitored period. In several cadastral territories, the percentage of arable land is zero during the analysed period. These are cadastral areas with higher altitudes. In these localities, crop production was only a secondary source of livelihood for the population within the small-area fields. On the contrary, cadastral areas at the very edge of the fodder area reach maximum exposure, i.e., where it passes to the neighbouring potato production area. In the middle of the last century, the representation of arable land reached 73.48%. Instead, these values correspond to more fertile production areas.
In the long term, forest land has the highest percentage of fodder areas. The rate of afforestation is significantly higher than in the earlier potato or cereal area, reaching, on average, 57.67%. As in the previously analysed group, there are almost no water bodies in these cadastral territories. The percentage of water bodies corresponds to an average of 1.32%. The cadastral area of Lipno nad Vltavou occupies a very exceptional position in this respect, where the water area forms 20.40% of the total area of the cadastral area due to the presence of the Lipno dam constructed between 1952 and 1959.
Unlike the other two analysed production areas, the forage production area is characterised by considerable variability during the reporting period. In the first analysed period (in 1848), the distribution of individual production categories of land use was flat-arable land, permanent grassland, and forest land were represented by balanced parts. The reason for the even distribution of the individual types of land use was, in the past, the effort to achieve self-sufficiency of inhabitants in terms of the production of basic food. However, significant changes have shifted the equilibrium arrangement towards non-agricultural land use during the whole period. The root cause can be seen in the localisation of the fodder production area in the border area, where the original population was gradually displaced from the middle of the last century for several reasons. Due to the decline in population and the disappearance of traditional settlements in these localities, a large part of agricultural land was abandoned and underwent later spontaneous or managed afforestation. This change was quantified to a maximum of 34.85%.

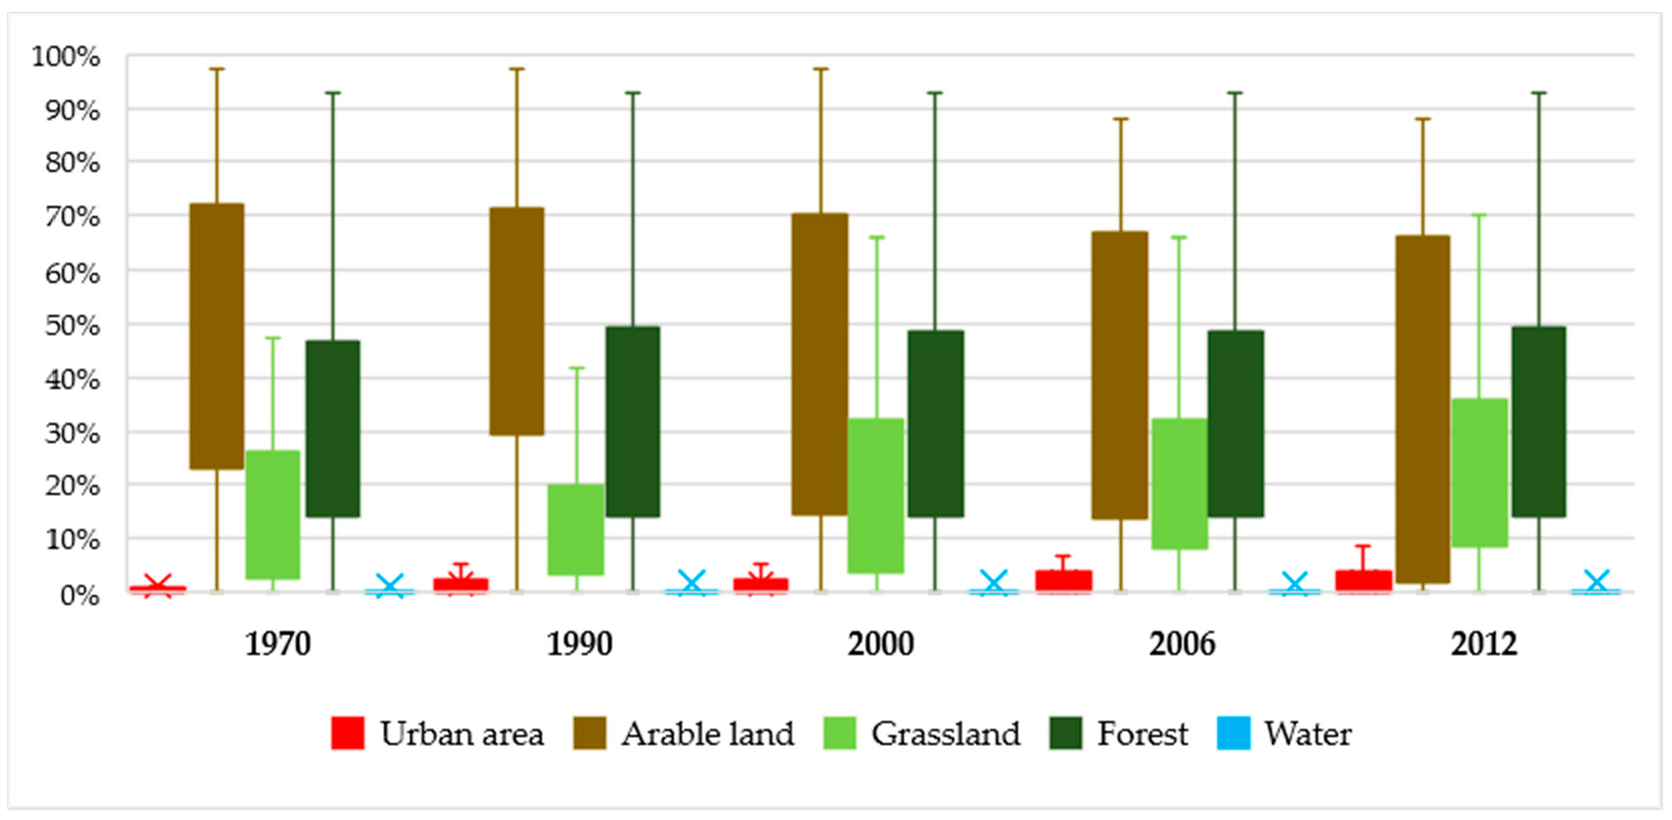
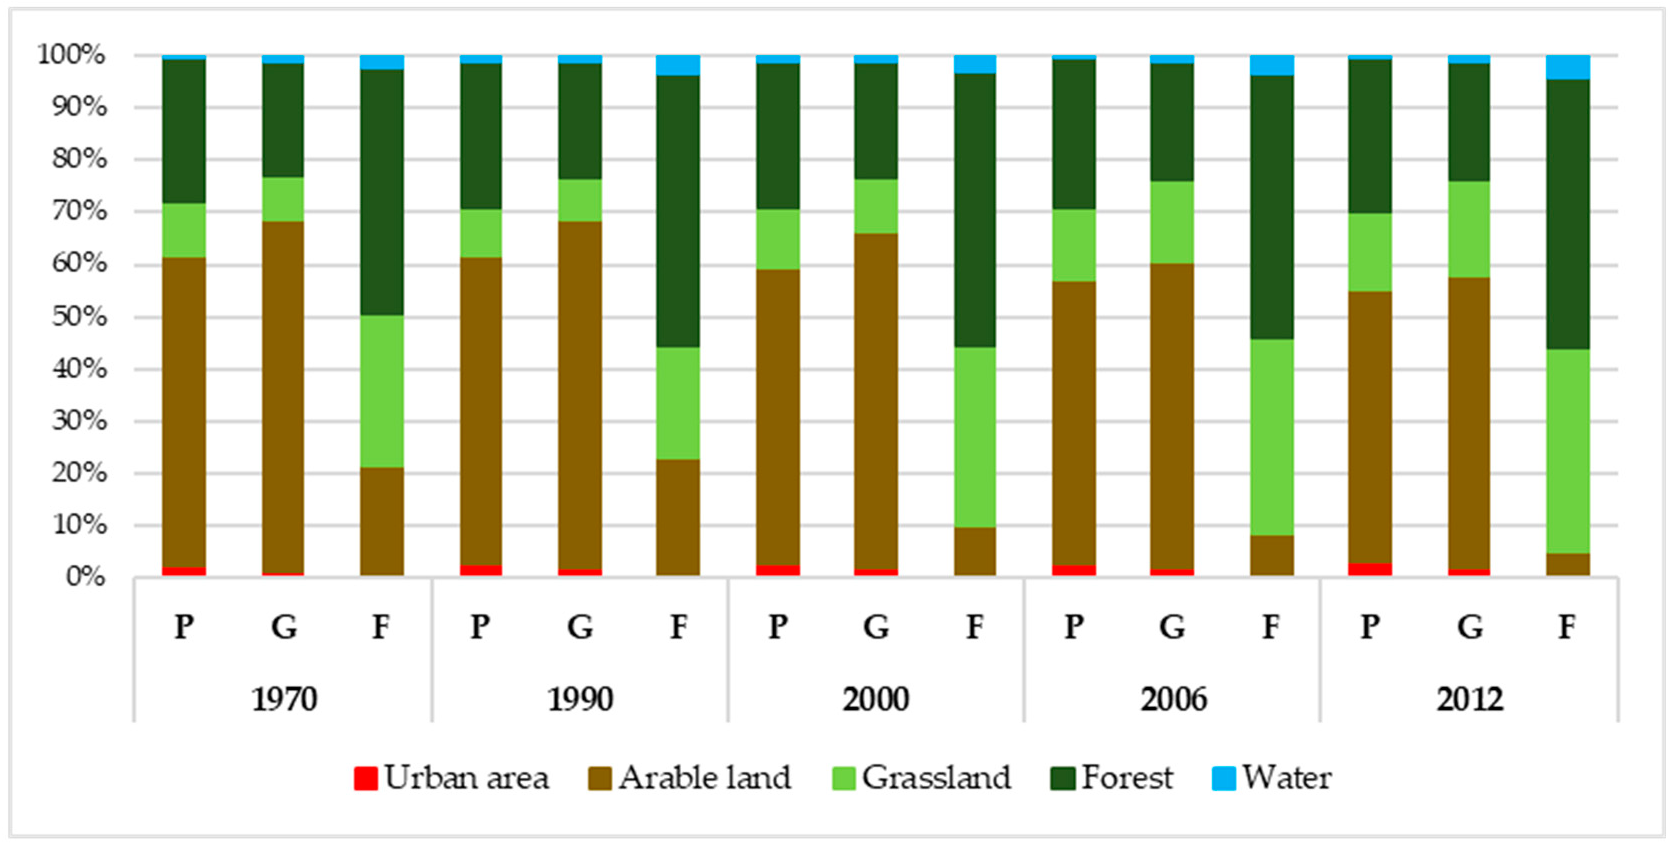
3.2. The Changes in the Accurate Representation of Individual Land Use Categories Based on Corine Land Cover

Another way to assess land use in terms of actual land use is the possibility of using Corine Land Cover. The results partially copy the land use distribution in historical maps and aerial photographs. Even though the values of the percentage of individual types of parcels are within the same ranges, several differences arise from the exceedingly small detail of the basic unit, which can be distinguished in the cadastral territory (Figure 6). Significant differences can be seen in the percentage of built-up areas. The reason is often scattered development, especially in less populated areas, where individual objects are below the limit of detection within larger units. These buildings are included in the surrounding agricultural or forest complexes.
The potato and forage production area does not differ significantly from the earlier land use assessment based on the analysis of historical maps and aerial photographs (Figure 7). The difference is exceedingly small, and the distribution of the individual land use categories almost corresponds to the earlier analysis. The only fundamental difference is the representation of the built-up area, as already said in the overall view. The reason for this has been mentioned earlier.
Significant differences arise only in the analysis of cadastral territories in the forage production area (Figure 7). In addition to the reduced detection of built-up areas, the fundamental difference lies in the percentage of arable land, permanent grassland, and forest areas. According to an analysis of the Corine Land Cover database, arable land was only about 20.00% between 1970 and 2000 and up to 4.50% in 2012. In contrast, historical maps and aerial photographs analysis yields 17.00% to 20.00% over the entire 2000–2019 period. A significant difference is the high share of permanent grassland (more than 37.00% after 1990) and forest land (more than 51.00% after 1990). In the last analysis, such a high percentage of permanent crops was never achieved in the forage area. The water surface is the only category that does not differ significantly in any analysis. The reason is the presence of a large area of the Lipno dam, which is stable and unchangeable. Thus, all changes in the category of water bodies in other cadastral areas are insignificant. The difference between historical maps and aerial photography is not found because of the large surface area of the continuous water surface, which is easily detectable from satellite images with a coarse raster.

4. Discussion

4.1. The Comparison of the Land Use Change within the European Context

If we look at the findings from the perspective of the wider Central European region, it is possible to conclude that the development of individual regions is similar. The results are comparable with countries that shared identical social consequences during the period under review as the territory under analysis. The percentage representation of the individual land use categories in the initial period of interest, 1848–1948, is virtually identical in all countries of the Central European region of the former Austro-Hungarian Empire, Germany, and Prussia, respectively. As illustrated by [30,31,62,63,64,65,66], these countries, in line with our results, focused on a balanced representation of all key land types necessary for the self-sustaining life of the local population. Arable land was predominant, with a percentage of 30.00% and 50.00% in all the regions mentioned, depending on altitude. At higher altitudes, the trend towards reducing the rate of arable land, particularly in the more mountainous parts of central Europe, was confirmed, especially at the expense of pastures and woodland [29,63]. In contrast, the sign lowland areas confirm a higher trend towards developing agricultural land, not only in the form of arable land but also, for example, vineyards [30,31]. In the subsequent periods analysed (after 1948), the results of this study correspond, unlike the first time, only with the countries in the so-called Eastern Bloc. The development of previously similarly shaped states such as Austria or the southwestern part of Germany, as described by [54,63], took a different direction under the pressure of market economy, urbanisation and, in many cases, more stress on the protection of landscape areas. Countries such as the Czech Republic, Poland, and Slovakia, for example, shared a development that corresponds with the findings in this article. There has been intense pressure to develop large-scale agricultural technologies, reflected in the pressure force development of arable land and another agrarian land, even in areas entirely unsuitable for agriculture [32,33]. Comparable growth across all Central European countries is only noticeable in the increase of urbanised areas, as confirmed by our results and numerous studies such as [42,44,67,68].
One of the results of the analysis of land use changes in this work was that, in the middle of the 19th century (1848), the most significant part of the area was agricultural land, of which arable land dominated. Its representation during the monitored period ranges between 53.24% and 61.92% on average. These results are also confirmed by [69], who describe arable land in the Czech Republic around 1830 as the dominant part of the territory, covering, as in the sixty cadastral areas surveyed, 50.00% of the area. In addition, the representation of permanent grassland in the analysed areas (17.00% on average) corresponds to the representation of meadows and pastures in the whole territory of the present Czech Republic described by [70]. In addition, Refs. [9,69] quantified the proportion of permanent grassland in 18.00% of the territory. The partial reporting period of 1848–1948 was characterised by relative stability in land use. This is also confirmed by [70,71]. Areas for growing new crops, such as root crops, legumes, or fodder, gradually expanded from 6.00% of the total area in 1830 to 16.00% in 1910.
Significant changes in land use occurred after the Second World War, or between 1948 and 1990. Between 1948 and 1989, agricultural land in the cadastral areas under review decreased by an average of 12.00% (arable land was reduced by 7.00% and grassland by 26.00%), while forest area increased by an average of 10.00%. These changes are also confirmed in their publications by [70] for the territory of today’s Czech Republic and [72], which describes the extent of agricultural land reduction by more than 15.00%. A separate chapter is transforming rural land into significantly developing built-up areas. The change of built-up land affected mainly the agglomerations of cities (increase even in tens of percent). On the contrary, these areas are associated with a decline in built-up areas in connection with the displacement of the traditional German population and establishing of a closed border zone, as will be described below. The increase in built-up areas in the second half of the 20th century is documented practically throughout the European site, as evidenced in his work, for example, [73] for the German Ruhr region (due to expanding industrial zones and new urban development), [62] for Slovakia (expansion of agricultural plants and living areas), [74] for the entire area of the present Czech Republic (construction of industrial and farming areas, development of urban agglomerations), [34] for the Swiss Alps (expansion of residential housing) or [35] in general for the whole European continent (expansion of industrial sites and residential areas).
The period after 1990 to the present (2019) in the group of sixty analysed cadastral areas in terms of changes in land use is characterised by a continuous decline in arable land at the expense of permanent crops, especially permanent grassland. The percentage of intensively used agricultural land decreased from more than 50.00% to the current average of 35%. In the analysed group of cadastral territories, as well as in the rest of the Czech Republic, after 1990, a significant decrease in both arable land and all agricultural land was recorded, as described by [70]. This is due to the collapse of many large food factories in the first years of transformation after the 1989 revolution and increased interest in non-productive landscape functions. Urbanisation was the second most crucial process of agricultural land loss between 1990 and 2016. The overall average increase of built-up areas in the cadastral areas analysed is not compared to the national average described, e.g., [46] or [5]. Still, in some cadastral areas (e.g., Lipno nad Vltavou or Klokoty), it reaches up to 15.00%. The reason for the lower extent of urbanisation and especially suburbanisation in this period, in the monitored group of cadastral territories, is the significant absence of large agglomerations and transport arteries with which authors such as in [70] or [47] combine the most significant expansion of built-up area at the expense of agricultural land. Despite the development expansion of built-up areas, the total percentage of this type of land use in the group of sixty analysed cadastral areas is around 7.50%, which corresponds to the European average. Currently, urbanised regions of the twelve original EU countries cover, on average, approximately 10.00% of the total area, with significant variations between countries and territories, according to [35]. In the Rhine basin, for example, for the Netherlands, the urbanisation rate is 12.50%, while, for France, it is only 6.40%. A study [48] suggests that future growth in European urban areas is expected to be about 0.10% per year. The increase in development at the expense of traditional agricultural sites is not a phenomenon in Europe alone. Many more significant increases occur, especially in emerging economies, as demonstrated by the example of China [7], where growth is quantified between 2000 and 2009 to nearly 30.00% at the expense of traditional rice plantations and agricultural land.

4.2. The Comparison of the Land Use Changes from the Perspective of Production Areas

Significant fluctuations among the land use types are seen across the cadastral areas under review according to their belonging to individual production areas.
The changes in the period 1848–1948 highly reflected the localisation of the area in terms of production areas or altitude and soil properties. In traditional agricultural areas (grain and potato production areas), the share of agricultural land was stable between 1848 and 1948. This fact is also confirmed by [61]. Meadows and pastures in fertile lowlands have been converted to arable land; the ponds were dried to obtain land for growing sugar beet and wheat in lowland conditions, respectively, for growing wheat and potatoes in higher altitudes. More potatoes began to be produced in the Bohemian-Moravian Highlands, meadows were often forested in less fertile mountain regions, and some were harvested [5]. This fact was supported by analyses in twenty cadastral areas being grain production areas. Here, the most significant changes in the categories of agricultural parcels were recorded in this period. However, the increase of arable land in the examined area was proved at the expense of permanent grassland by an average of 12.00%. The higher, less fertile forage area recorded an utterly different development. This area’s high proportion of permanent grasslands used as pastures is essential. In twenty analysed cadastral areas within the fodder production area in 1848, they occupied 38.00% of the size of checked sites on average. Similarly, Refs. [75,76] describe in this period the fundamental development of agro-pastoral systems in the less fertile part of Flanders. However, the significant increase in the afforestation of the forage production area from 1848–1948 is a far more notable change. The growth of forest stands was estimated at 13.00% on average. The reason for such a significant increase was primarily the commercial interest of landowners from the nobility, as confirmed in his study also by the authors of [5], who describe in their work that the afforestation of the mountainous region of South Bohemia, especially Šumava, was managed by landowners, the noble family of the Schwarzenbergs. The reason was a change in business activities to a much more profitable forestry industry. The second reason for the significant increase in forest areas, which was also found in the analysis of twenty cadastral areas in the fodder production area, was the outflow of the population in the period after the First World War connected with leaving the land and leaving it fallow. Subsequently, as described in the Results chapter, these plots were subject to a spontaneous succession. The growth of abandoned land and the conversion of less fertile arable land into meadows and forests in the traditionally relatively densely populated Sudetes is also described by [77]. In addition, Ref. [74] confirms this fact by almost double the index of change in the not yet forested part of Šumava, Krušné hory, Orlické hory and Krkonoše. Like the selected sample of cadastral areas in the forage production area, spontaneous afforestation of mountain landscapes in Europe appears to be part of a worldwide trend, as described, for example, by [78] for the Mediterranean, [79] in the Pyrenees or [80] for the mountain region of central Norway. As confirmed by [73], this regional marginalisation also occurred in the Black Forest region. A notable finding was the exceedingly minor increase in built-up land across the monitored cadastral territories, even though the monitored period 1848–1948 covers the entire period of the industrial revolution. Overall, the increase in development in the cadastral parts of interest was 4.00%. The weak impact of industrialisation and urbanism is also described by [5] for the whole contemporary Czech Republic except for conurbations of cities or [81] for the territory of Liberec and Jablonec regions.
Changes in the distribution of individual land use categories between 1948 and 1990 were recorded to a greater extent in twenty cadastral areas in the forage production area. Here, during the analysis of aerial photographs after 1948, the most significant decrease in the acreage of agricultural land was recorded at the expense of forest areas. This change was estimated at 18.50% on average; in extreme cases, forest areas increased by more than 38.00%. As described by [82], the loss of agricultural land in the border region by 15.00% and the loss of arable land by 9.00 also represent these changes related to the displacement of most of the forage production areas in the period at once after the Second World War. Reducing agricultural land in mountain marginal areas at the expense of spontaneous succession of shrubbery and forest areas have also been described in other European countries, as reported by [83]. This study describes the rapid abandonment of agricultural land in the second half of the 20th century across all European mountain areas. In addition, Ref. [84] confirms these results for Western European countries. The question of marginalisation of areas with less favourable natural conditions, associated with the loss of agricultural land at the expense of shrubs and forests, or at least the transfer of traditional arable land to less intensive permanent grassland, in the second half of the 20th century, is described for the European continent. This is illustrated by a study by [85] for eastern and southeastern France, [86] for the southern and southeastern parts of Sweden, [87] for the south part of Norway, [88] for the submontane regions of Austria, [38] for the mountainous areas of Germany, or [89,90] for the mountainous regions across the European continent. Contrary to these marginal areas, as in the case of the results of the twenty cadastral areas in the forage production area, the extensive transformation of agricultural parcels into forest areas has been described throughout the European period in the [91] study and traditionally rural areas such as the Ruhr region in the [73] study.
The primary process of this change in land use between 1990 and 2000 is reflected in the establishment of large areas of permanent grassland (meadows and pastures), especially in mountain areas. This change affects only a few percentage points in the analysed cadastral territories. Still, this change is much more significant in the fodder production area, and the maximum grassing values are recorded up to 39.00% (e.g., cadastral territory Jenín). The increase of extensive grassland areas in less favourable conditions for traditional crop production has also been documented in other parts of Europe, not only in the countries of the former Eastern Bloc, as described, for example, by [9] or [82], but also in Western European countries, as illustrated by the study [37] for Jutland in Denmark or [92] for the Lahn-Dill highland area in the western part of Hesse, Germany. Interestingly, the decline in visual acuity around 2000 affected not only European countries but also countries in the so-called third world, such as China, where a significant decrease in visual acuity (by 12.00%) was recorded in Kunshan province as described [7]. In connection with the built-up areas, the phenomenon of brownfields is seen in the cadastral territories after 1990. This is particularly the issue of agro brownfields, i.e., sites around agricultural areas, especially buildings for livestock production from 1948–1990. These built-up areas occur in forage production areas, e.g., in the cadastral area Radčice u Malont or Jenín [17]. In addition, Ref. [4] dealt with the issue of agro-brown fields in their work. The last of the described changes in land use is the expansion of forest areas, which continues from the earlier period of 1948–1990. Similarly to the period described above, these changes affect the mountain areas of the forage and grain production area, where afforestation is associated not only with spontaneous succession but also with protective afforestation of newly emerging areas of nature and landscape protection. The increase in forest areas is lower than in the period described above, on the order of one per cent. The rate of afforestation in these areas is 48.00% on average, well above the average of similar regions, e.g., in southern Romania [11], where afforestation currently stands at 38.70% in mountainous locations, in Austria, where afforestation is around 39.00%, in Germany or France, afforestation of mountain areas is around 28.00–29.00%, or even in the United Kingdom with afforestation of only about 10.00% of the total area of higher altitudes. In contrast, quite different results were recorded in the mountainous conditions of neighbouring Slovakia, where the current afforestation of mountain areas is estimated at a significantly higher average than found in the cadastral territories analysed (even considering extreme values) at more than 81.00% [62].

5. Conclusions

Based on the research carried out in the area of interest in the South Bohemian Region in the southern part of the Czech Republic, it was found that over the last nearly two centuries, there have been significant differences in the cultural landscape, which are partly comparable with the surrounding countries in the Central European region. During the period under study, there has been a decline in the area used to produce agricultural commodities, particularly in areas less favourable to agriculture. This trend is also clear to a lesser extent in areas with better natural conditions, but the reasons are hugely different. In forage-growing regions, there has been pressure to convert areas to less intensive use for accessibility, reflected in actual land use. Sites of former arable land were administratively transferred to other areas and then left to spontaneous succession or grassed over and not used further. This phenomenon is unique compared to other countries in the vicinity. The remaining arable land in the forage areas disappeared gradually, especially around 2000, when many areas were converted to grassland under subsidies. They are stable in areas with more intensive agriculture (potato and cereal production areas). However, here too, a steady trend towards reducing the proportion of intensively farmed arable land has still been observed. The decline is due to the increasing urbanisation of the area and the stabilisation of parts of the higher regions in the form of the expansion of forest cover, as well as water areas, for example, to combat drought.

Author Contributions

Conceptualization, J.M. and V.M.; methodology, J.M.; software, V.M., T.P. and N.N.; resources, J.M. and V.M.; writing—original draft preparation, J.M.; writing—review and editing, V.M., T.P.; visualization, N.N.; supervision, J.M. All authors have read and agreed to the published version of the manuscript.

Funding

This research was funded by the project of the Technological Agency of the Czech Republic Nr. TL02000322 Thermal comfort in villages: feeling of inhabitants, physical reality, role of greenery and by the project of South Bohemian University in Ceske Budejovice GAJU No. 045/2019/Z Influence of landscape management on ecosystems, landscape function and organisms.

Data Availability Statement

The data were provided by the Czech Office of Surveying and Cadastre, the Czech Statistical Office, and the Digital Archive in Trebon. All the data were freely distributed.

Conflicts of Interest

The authors declare no conflict of interest.

Appendix A

Table A1. Comparison of individual land use categories over the period under review by type of source files and map legends.
Land
Registry
Since 2000
Land
Registry
Until 2000
Land
Cadastre
Stable
Cadastre
Corine
Land
Cover
Arable landArable landArable landFieldField
Field with fruit trees, vine trees, olive trees
Saffron, tobacco, and rice fields
Fields alternating pasture
Field with firewood
Arable land outside irrigated areas
Areas under permanent irrigation
Rice fields
GrasslandPermanent grasslandMeadowsMeadowsMeadows and wet meadows
Meadows with fruit trees, firewood, vine trees
Annual crops added to permanent crops.
Complex systems of cultures and plots
Agricultural areas with natural vegetation
Agro-forestry areas
PasturesPasturesPastures
Pastures with fruit and productive trees
Alpine pastures
Natural pastures
GardensGardensGardensGardensVegetable gardens
Fruit gardens
Ornamental gardens
VineyardsVineyardsVineyardVineyardsVineyards
Vineyards with trees or field crops and meadows
Vineyards paths
Vineyards
HopyardsHopyardsHopyardsHopyardsHopyards
OrchardsFruit orchardFruit orchard Citrus field
Chestnut forest
Orchard or chestnut forest
Olive forest
Fruit orchards and shrubs
Olive groves
WaterWater bodiesWater bodiesWetlands, lakes, pondsPonds and lakes with reeds
Lakes without reeds
Ponds without reeds
Peat bogs and fens
Rivers and streams
Inland swamps
Peat bogs
Seaside marshes
Coastal zones
Watercourses
Water areas
Lagoons
Sea and oceans
ForestForest landForest landForestDeciduous forest
Coniferous forest
High-tree mixed forest
Low-tree young forest
Woodland Meadows
Shrubs
Park
Woodland and fire plots
Deciduous forests
Coniferous forests
Mixed forests
Bogs and heaths, scrubby formations
Transitional stages of forest and scrub
Other areasOther areasOther areasBarren landBare rocks
Snow and ice fields
Glaciers
Deserts
Quarry
Gravel pits, sand pits, clay pits, peat bogs and loam
Manipulation areas
Beaches, dunes, sands
Bare rocks
Areas with sparse vegetation
Burnt areas
Glaciers and permanent snow
Urban areasBuilt-up areas and courtyardsBuilt-up areas and courtyardsBuilt-up areas and courtyardsCross, Chapel
Execution site
Hunting lodge
Guest house
Post office, Police station
Wine cellar
Grain mills, Sawmill, Oil mills, Powder mill
Paper mill, Brickworks, Glassworks, Blacksmith
Public building, Spa
Residential building
Farm building
Ruins
Urban areas
Industrial or commercial zones
Road and railway
Port zones
Airports
Mining of rocks
Landfills
Construction sites
Urban greenery
Facilities for sports and recreation
Other areasRoad
Paved road, Rural road
Road with alley
Footpath
Stone embankment
Railway, Horse railway

References

  1. García-Martín, M.; Quintas-Soriano, C.; Torralba, M.; Wolpert, F.; Plieninger, T. Landscape Change in Europe. In Sustainable Land Management in a European Context; Springer: Cham, Switzerland, 2021; pp. 17–37. [Google Scholar]
  2. Food and Agriculture Organization of the United Nations. Land Resources. Available online: http://www.fao.org/nr/land/use/en/ (accessed on 9 August 2014).
  3. Bičík, I.; Himiyama, Y.; Feranec, J.; Kupková, L. Land Use/Cover Changes in Selected Regions in the World; Vol. IX. IGU-LUCC Research Reports; Charles University in Prague: Prague, Czech Republic, 2014; Volume IX. [Google Scholar]
  4. Zhang, S.; Guan, Z.; Liu, Y.; Zheng, F. Land Use/Cover Change and Its Relationship with Regional Development in Xixian New Area, China. Sustainability 2022, 14, 6889. [Google Scholar] [CrossRef]
  5. Bičík, I.; Kupková, L.; Jeleček, L.; Kabrda, J.; Štych, P.; Janoušek, Z.; Winklerová, J. Land Use Changes in the Czech Republic 1845–2010: Socio-Economic Driving Forces; Springer International Publishing: Cham, Switzerland, 2015; ISBN 978-3-319-17670-3. [Google Scholar]
  6. Primdahl, J. Agricultural Landscapes as Places of Production and for Living in Owner’s versus Producer’s Decision Making and the Implications for Planning. Landsc. Urban Plan. 1999, 46, 143–150. [Google Scholar] [CrossRef]
  7. Long, H.; Tang, G.; Li, X.; Heilig, G.K. Socio-Economic Driving Forces of Land-Use Change in Kunshan, the Yangtze River Delta Economic Area of China. J. Environ. Manag. 2007, 83, 351–364. [Google Scholar] [CrossRef] [PubMed]
  8. Davison, C.; Rahbek, C.; Morueta-Holme, N. Land-Use Change and Biodiversity: Challenges for Assembling Evidence on the Greatest Threat to Nature. Glob. Chang. Biol. 2021, 27, 5414–5429. [Google Scholar] [CrossRef] [PubMed]
  9. Kuemmerle, T.; Levers, C.; Erb, K.; Estel, S.; Jepsen, M.R.; Mueller, D.; Plutzar, C.; Sturck, J.; Verkerk, P.J.; Verburg, P.H.; et al. Hotspots of Land Use Change in Europe. Environ. Res. Lett. 2016, 11, 064020. [Google Scholar] [CrossRef]
  10. Kupková, L.; Bičík, I.; Jeleček, L. At the Crossroads of European Landscape Changes: Major Processes of Landscape Change in Czechia since the Middle of the 19th Century and Their Driving Forces. Land 2021, 10, 34. [Google Scholar] [CrossRef]
  11. Levers, C.; Schneider, M.; Prishchepov, A.V.; Estel, S.; Kuemmerle, T. Spatial Variation in Determinants of Agricultural Land Abandonment in Europe. Sci. Total Environ. 2018, 644, 95–111. [Google Scholar] [CrossRef]
  12. Jukneliene, D.; Kazanaviciute, V.; Valciukiene, J.; Atkoceviciene, V.; Mozgeris, G. Spatiotemporal Patterns of Land-Use Changes in Lithuania. Land 2021, 10, 619. [Google Scholar] [CrossRef]
  13. Novák, V. Přirozené Zemědělské Krajiny a Výrobní Oblasti v Republice Československé [Natural Agricultural Landscapes and Production Areas in the Czechoslovak Republic]; Státní úřad statistický: Praha, Czech Republic, 1925. (In Czech) [Google Scholar]
  14. Campbell, B.D.; Smith, D.M.S.; Pastures, G. A Synthesis of Recent Global Change Research on Pasture and Rangeland Production: Reduced Uncertainties and Their Management Implications. Agric. Ecosyst. Environ. 2000, 82, 39–55. [Google Scholar] [CrossRef]
  15. Wnek, A.; Kudas, D.; Stych, P. National Level Land-Use Changes in Functional Urban Areas in Poland, Slovakia, and Czechia. Land 2021, 10, 39. [Google Scholar] [CrossRef]
  16. Váchal, J.; Váchalová, R.; Vlčková, Z.; Moravcová, J.; Koupilová, M. Anthropoecological Zoning of Farmland as a Basis for Land Adjustment Design. Ekol. Bratisl. 2006, 25, 145–161. [Google Scholar]
  17. Moravcová, J.; Koupilová, M.; Pavlíček, T.; Zemek, F.; Kvítek, T.; Pečenka, J. Analysis of Land Consolidation Projects and Their Impact on Land Use Change, Landscape Structure, and Agricultural Land Resource Protection: Case Studies of Pilsen-South and Pilsen-North (Czech Republic). Landsc. Ecol. Eng. 2017, 13, 1–13. [Google Scholar] [CrossRef]
  18. Banzhaf, E.; Kindler, A. Land Use Changes and Population Development in Shrinking Urban Regions—Exemplified on the City of Leipzig, Germany. In Land Use/Cover Changes in Selected Regions in the World; Himiyama, Y., Ed.; Oxford and IBH Publishing: New Delhi, India, 2005; pp. 43–47. ISBN 4-907651-04-X. [Google Scholar]
  19. Skaloš, J.; Engstová, B. Methodology for Mapping Non-Forest Wood Elements Using Historic Cadastral Maps and Aerial Photographs as a Basis for Management. J. Environ. Manag. 2010, 91, 831–843. [Google Scholar] [CrossRef] [PubMed]
  20. Tomaney, J.; Krawchenko, T.; McDonald, C. Regional Planning and Rural Development: Evidence from the OECD. In The Routledge Companion to Rural Planning; Routledge: London, UK, 2019; pp. 170–182. [Google Scholar]
  21. Zysk, E.; Dawidowicz, A.; Nowak, M.; Figurska, M.; Źróbek, S.; Źróbek, R.; Burandt, J. Organizational Aspects of the Concept of a Green Cadastre for Rural Areas. Land Use Policy 2020, 91, 104373. [Google Scholar] [CrossRef]
  22. Yìldiz, O.; Coruhlu, Y.E.; Biyik, C. Registration of Agricultural Areas towards the Development of a Future Turkish Cadastral System. Land Use Policy 2018, 78, 207–218. [Google Scholar] [CrossRef]
  23. Borowiec, N.; Marmol, U. Using LiDAR System as a Data Source for Agricultural Land Boundaries. Remote Sens. 2022, 14, 1048. [Google Scholar] [CrossRef]
  24. Popescul, S. Initial Data Analysis for the Establishment of the Agricultural Cadastral System in Straseni District, the Republic of Moldova. Cadastru Și Drept. 2022, 55, 287–291. [Google Scholar]
  25. Schulp, C.J.; Levers, C.; Kuemmerle, T.; Tieskens, K.F.; Verburg, P.H. Mapping and Modelling Past and Future Land Use Change in Europe’s Cultural Landscapes. Land Use Policy 2019, 80, 332–344. [Google Scholar] [CrossRef]
  26. Manton, M.; Angelstam, P.; Naumov, V. Effects of Land Use Intensification on Avian Predator Assemblages: A Comparison of Landscapes with Different Histories in Northern Europe. Diversity 2019, 11, 70. [Google Scholar] [CrossRef]
  27. Kolejka, J.; Krejčí, T.; Nováková, E. The Pre-Industrial Landscape in Moravia. The Case Study of Inventory and Analysis of the Ancient Land Use Structures in the Czech Republic. Land Use Policy 2020, 97, 104712. [Google Scholar] [CrossRef]
  28. Fanta, V.; Beneš, J.; Zouhar, J.; Rakava, V.; Šitnerová, I.; Janečková Molnárová, K.; Šmejda, L.; Sklenicka, P. Ecological and Historical Factors behind the Spatial Structure of the Historical Field Patterns in the Czech Republic. Sci. Rep. 2022, 12, 1–20. [Google Scholar]
  29. Krausmann, F. Land Use and Socio-Economic Metabolism in Pre-Industrial Agricultural Systems: Four Nineteenth-Century Austrian Villages in Comparison; Inst. of Social Ecology, IFF-Fac. for Interdisciplinary Studies: Klagenfurt, Austria, 2009. [Google Scholar]
  30. Szántay, A. Rural Commons in Eighteenth-Century Hungary. Jahrb. Für Gesch. Ländlichen Raumes 2015, 12, 91–102. [Google Scholar]
  31. Kiss, A.; Sümeghy, Z.; Czinege, A.; Karancsi, Z. Wine and Land Use in Nagymaros, Northern Hungary: A Case Study from the Danube Bend. Acta Climatol. Chorol. Univ. Szeged. 2005, 38–39, 97–109. [Google Scholar]
  32. Pazúr, R.; Bolliger, J. Land Changes in Slovakia: Past Processes and Future Directions. Appl. Geogr. 2017, 85, 163–175. [Google Scholar] [CrossRef]
  33. Himiyama, Y.; Bičík, I. Land Use, Cover Changes in Selected Regions in the World; IGU-LUCC: Asahikava, Japan, 2002. [Google Scholar]
  34. Schneeberger, N.; Bürgi, M.; Hersperger, A.M.; Ewald, K. Driving Forces and Rates of Landscape Change as a Promising Combination for Landscape Change Research—An Application on the Northern Fringe of the Swiss Alps. Land Use Policy 2007, 24, 349–361. [Google Scholar] [CrossRef]
  35. Bouma, J.; Varallyay, G.; Batjes, N. Principal Land Use Changes Anticipated in Europe. Agric. Ecosyst. Environ. 1998, 67, 103–119. [Google Scholar] [CrossRef]
  36. Bartos, M. Influence of Large-Scale Farming Methods on Soil Exploitation in Czechoslovakia. In Land Transform. Agric; Wolman, M.G., Fournier, F.G.A., Eds.; John Wiley and Sons Ltd.: Hong Kong, China, 1987; pp. 147–149. [Google Scholar]
  37. Kristensen, L.S.; Thenail, C.; Kristensen, S.P. Landscape Changes in Agrarian Landscapes in the 1990s: The Interaction between Farmers and the Farmed Landscape. A Case Study from Jutland, Denmark. J. Environ. Manag. 2004, 71, 231–244. [Google Scholar] [CrossRef] [PubMed]
  38. Reger, B.; Otte, A.; Waldhardt, R. Identifying Patterns of Land-Cover Change and Their Physical Attributes in a Marginal European Landscape. Landsc. Urban Plan. 2007, 81, 104–113. [Google Scholar] [CrossRef]
  39. Abdullah, S.A.; Nakagoshi, N. Changes in Agricultural Landscape Pattern and Its Spatial Relationship with Forestland in the State of Selangor, Peninsular Malaysia. Landsc. Urban Plan. 2008, 87, 147–155. [Google Scholar] [CrossRef]
  40. Bilotta, G.S.; Brazier, R.E.; Haygarth, P.M.; Macleod, C.J.A.; Butler, R.; Granger, S.; Krueger, T.; Freer, J.; Quinton, J. Rethinking the Contribution of Drained and Undrained Grasslands to Sediment-Related Water Quality Problems. J. Environ. Qual. 2008, 37, 906–914. [Google Scholar] [CrossRef]
  41. Brussaard, L.; Bakker, J.P.; Olff, H. Biodiversity of Soil Biota and Plants in Abandoned Arable Fields and Grasslands under Restoration Management. Biodivers. Conserv. 1996, 5, 211–221. [Google Scholar] [CrossRef]
  42. Enyedi, G. Urbanisation in East Central Europe: Social Processes and Societal Responses in the State Socialist Systems. Urban Stud. 1992, 29, 869–880. [Google Scholar] [CrossRef]
  43. Jayasinghe-Mudalige, U.; Weersink, A.; Deaton, B.J.; Trant, M. Effect of Urbanisation on the Adoption of Environmental Management Systems in Canadian Agriculture. Int. J. Agric. Resour. Gov. Ecol. 2007, 6, 316–325. [Google Scholar]
  44. Dadashpoor, H.; Azizi, P.; Moghadasi, M. Land Use Change, Urbanization, and Change in Landscape Pattern in a Metropolitan Area. Sci. Total Environ. 2019, 655, 707–719. [Google Scholar] [CrossRef]
  45. Nuissl, H.; Siedentop, S. Urbanisation and Land Use Change. In Sustainable Land Management in a European Context; Springer: Cham, Switzerland, 2021; pp. 75–99. [Google Scholar]
  46. Bičík, I.; Jeleček, L. Land Use and Landscape Changes in Czechia during the Period of Transition 1990–2007. Geografie 2009, 114, 263–281. [Google Scholar] [CrossRef]
  47. Hubacek, K.; Vazquez, J. The Economics of Land-Use Change. In Economics Interactions with Othe Disciplines; International Institute for Applied Systems Analysis: Laxenburg, Austria, 2002; Volume II, p. 43. [Google Scholar]
  48. Veldkamp, A.; Lambin, E.F. Predicting Land-Use Change. Agric. Ecosyst. Environ. 2001, 85, 1–6. [Google Scholar] [CrossRef]
  49. Vuorela, N.; Alho, P.; Kalliola, R. Systematic Assessment of Maps as Source Information in Landscape-Change Research. Landsc. Res. 2002, 27, 141–166. [Google Scholar] [CrossRef]
  50. Femenia-Ribera, C.; Mora-Navarro, G.; Pérez, L.J.S. Evaluating the Use of Old Cadastral Maps. Land Use Policy 2022, 114, 105984. [Google Scholar] [CrossRef]
  51. Frajer, J.; Fiedor, D. A Historical Curiosity or a Source of Accurate Spatial Information on Historical Land Use? The Issue of Accuracy of Old Cadastres in the Example of Josephian Cadastre from the Habsburg Empire. Land Use Policy 2021, 100, 104937. [Google Scholar] [CrossRef]
  52. Haberl, H.; Erb, K.-H.; Krausmann, F.; Adensam, H.; Schulz, N.B. Land-Use Change and Socio-Economic Metabolism in Austria—Part II: Land-Use Scenarios for 2020. Land Use Policy 2003, 20, 21–39. [Google Scholar] [CrossRef]
  53. Cousins, S.A. Analysis of Land-Cover Transitions Based on 17th and 18th Century Cadastral Maps and Aerial Photographs. Landsc. Ecol. 2001, 16, 41–54. [Google Scholar] [CrossRef]
  54. Bender, O.; Boehmer, H.J.; Jens, D.; Schumacher, K.P. Analysis of Land-Use Change in a Sector of Upper Franconia (Bavaria, Germany) since 1850 Using Land Register Records. Landsc. Ecol. 2005, 20, 149–163. [Google Scholar] [CrossRef]
  55. Śleszyński, P.; Gibas, P.; Sudra, P. The Problem of Mismatch between the CORINE Land Cover Data Classification and the Development of Settlement in Poland. Remote Sens. 2020, 12, 2253. [Google Scholar] [CrossRef]
  56. Feranec, J.; Hazeu, G.; Christensen, S.; Jaffrain, G. Corine Land Cover Change Detection in Europe (Case Studies of the Netherlands and Slovakia). Land Use Policy 2007, 24, 234–247. [Google Scholar] [CrossRef]
  57. Diaz-Pacheco, J.; Gutiérrez, J. Exploring the Limitations of CORINE Land Cover for Monitoring Urban Land-Use Dynamics in Metropolitan Areas. J. Land Use Sci. 2014, 9, 243–259. [Google Scholar] [CrossRef]
  58. Ostafin, K.; Kaim, D.; Troll, M.; Maciejowski, W. The Authorship of the Second Military Survey of Galicia and Austrian Silesia at the Scale 1: 28,800 and the Consistency of Sheet Content Based on Selected Examples. Pol. Cartogr. Rev. 2020, 52, 141–151. [Google Scholar] [CrossRef]
  59. Ostafin, K.; Pietrzak, M.; Kaim, D. Impact of the Cartographer’s Position and Topographic Accessibility on the Accuracy of Historical Land Use Information: Case of the Second Military Survey Maps of the Habsburg Empire. ISPRS Int. J. Geo-Inf. 2021, 10, 820. [Google Scholar] [CrossRef]
  60. Němec, J. Bonitace a Oceňování Zemědělské Půdy České Republiky [Bonitation and Valuation of Agricultural Soil of the Czech Republic]; Výzkumný ústav zemědělské ekonomiky: Praha, Czech Republic, 2001; ISBN 80-85898-90-X. (In Czech) [Google Scholar]
  61. Bičík, I. Analýza Dat o Využití Půdy k Hodnocení Dlouhodobých Změn Krajiny. [Analysis of Land Use Data to Assess Long-Term Landscape Change]. Geogr. Slovaca 1995, 10, 25–29. (In Czech) [Google Scholar]
  62. Kanianska, R.; Kizeková, M.; Nováček, J.; Zeman, M. Land-Use and Land-Cover Changes in Rural Areas during Different Political Systems: A Case Study of Slovakia from 1782 to 2006. Land Use Policy 2014, 36, 554–566. [Google Scholar] [CrossRef]
  63. Krausmann, F.; Haberl, H. Land-Use Change and Socio-Economic Metabolism. A Macro View of Austria 1830–2000. In Socioecological Transition and Global Changes; Fischer-Kowalski, M., Haberl, H., Eds.; Edward Elgar: Cheltenham, UK, 2007; pp. 31–59. [Google Scholar]
  64. Krausmann, F. Land Use and Industrial Modernization: An Empirical Analysis of Human Influence on the Functioning of Ecosystems in Austria 1830–1995. Land Use Policy 2001, 18, 17–26. [Google Scholar] [CrossRef]
  65. Devátỳ, J.; Dostál, T.; Hösl, R.; Krása, J.; Strauss, P. Effects of Historical Land Use and Land Pattern Changes on Soil Erosion–Case Studies from Lower Austria and Central Bohemia. Land Use Policy 2019, 82, 674–685. [Google Scholar] [CrossRef]
  66. Rašín, R.; Chromỳ, P. Land Use and Land Cover Development along the Czech-Austrian Boundary. In Land Use/Cover Change in Selected Regions in the World; Bičík, I., Himiyama, Y., Feranec, J., Eds.; Issued by IGU Commission on LUCC; IGU-LUCC Research Reports; Institute of Geography, Hokkaido University of Education: Asahikawa, Japan, 2010; Volume V, Part VII; pp. 57–65. ISBN 978-4-907651-05-9. [Google Scholar]
  67. Antrop, M. Changing Patterns in the Urbanized Countryside of Western Europe. Landsc. Ecol. 2000, 15, 257–270. [Google Scholar] [CrossRef]
  68. Antrop, M. Landscape Change and the Urbanization Process in Europe. Landsc. Urban Plan. 2004, 67, 9–26. [Google Scholar] [CrossRef]
  69. Kuskova, P.; Gingrich, S.; Krausmann, F. Long Term Changes in Social Metabolism and Land Use in Czechoslovakia, 1830–2000: An Energy Transition under Changing Political Regimes. Ecol. Econ. 2008, 68, 394–407. [Google Scholar] [CrossRef]
  70. Bičík, I.; Jeleček, L.; Štěpánek, V. Land-Use Changes and Their Social Driving Forces in Czechia in the 19th and 20th Centuries. Land Use Policy 2001, 18, 65–73. [Google Scholar] [CrossRef]
  71. Bičík, I. Land Use in the Czech Republic 1845–1948–1990. Methodology, Interpretation, Contexts. Acta Univ. Carol. Geogr. 1998, 32, 247–255. [Google Scholar]
  72. Štěpánek, V. The Iron Curtain and Its Impact on the Environment in the Czech Republic. Acta Univ. Carol.-Geogr. 1992, 27, 59–63. [Google Scholar]
  73. Bruns, D.; Ipsen, D.; Bohnet, I. Landscape Dynamics in Germany. Landsc. Urban Plan. 2000, 47, 143–158. [Google Scholar] [CrossRef]
  74. Bičík, I.; Götz, A.; Jančák, V.; Jeleček, L.; Mejsnarová, L.; Štěpánek, V. Land Use/Land Cover Changes in the Czech Republic 1845–1995. Geogr. ČGS 1996, 101, 92–109. [Google Scholar] [CrossRef]
  75. Antrop, M. The Concept of Traditional Landscapes as a Base for Landscape Evaluation and Planning. The Example of Flanders Region. Landsc. Urban Plan. 1997, 38, 105–117. [Google Scholar] [CrossRef]
  76. Sevenant, M.; Antrop, M. The Use of Latent Classes to Identify Individual Differences in the Importance of Landscape Dimensions for Aesthetic Preference. Land Use Policy 2010, 27, 827–842. [Google Scholar] [CrossRef]
  77. Sklenička, P.; Molnárová, K.; Brabec, E.; Kumble, P.; Pittnerová, B.; Pixová, K.; Šálek, M. Remnants of Medieval Field Patterns in the Czech Republic: Analysis of Driving Forces behind Their Disappearance with Special Attention to the Role of Hedgerows. Agric. Ecosyst. Environ. 2009, 129, 465–473. [Google Scholar] [CrossRef]
  78. Bourbouze, A.; Gibon, A. Ressources Individuelles Ou Ressources Collectives? L’impact Du Statut Des Ressources Sur La Gestion des Systèmes d’élevage Des Régions Du Pourtour Méditerranéen [The Impact of Resource Status on the Management of Livestock Systems in Mediterranean Regions]. Options Méditerranéennes 1999, 27, 289–309. (In French) [Google Scholar]
  79. Chevalier, M. La Vie Humaine Dans Les Pyrénées Ariégeoises [Human Life in the Ariegean Pyrenees]; JSTOR: New York, NY, USA, 1956. (In French) [Google Scholar]
  80. Olsson, E.G.A.; Austrheim, G.; Grenne, S.N. Landscape Change Patterns in Mountains, Land Use and Environmental Diversity, Mid-Norway 1960–1993. Landsc. Ecol. 2000, 15, 155–170. [Google Scholar] [CrossRef]
  81. Bičík, I.; Štěpánek, V. Changing Land-Use Patterns in Liberec and Jablonec Districts; Barlow, M., Dostal, P., Hampl, M., Eds.; Territory, Society and Administration; Institute Voor Soc. Geogr: Amsterdam, The Netherlands, 1994; pp. 57–64. [Google Scholar]
  82. Sklenička, P. Temporal Changes in Pattern of One Agricultural Bohemian Landscape during the Period 1938–1998. Ekol.-Bratisl. 2002, 21, 181–191. [Google Scholar]
  83. MacDonald, D.; Crabtree, J.R.; Wiesinger, G.; Dax, T.; Stamou, N.; Fleury, P.; Lazpita, J.G.; Gibon, A. Agricultural Abandonment in Mountain Areas of Europe: Environmental Consequences and Policy Response. J. Environ. Manag. 2000, 59, 47–69. [Google Scholar] [CrossRef]
  84. Meeus, J.H. The Transformation of Agricultural Landscapes in Western Europe. Sci. Total Environ. 1993, 129, 171–190. [Google Scholar] [CrossRef]
  85. Poudevigne, I.; Alard, D. Landscape and Agricultural Patterns in Rural Areas: A Case Study in the Brionne Basin, Normandy, France. J. Environ. Manag. 1997, 50, 335–349. [Google Scholar] [CrossRef]
  86. Skånes, H.; Bunce, R. Directions of Landscape Change (1741–1993) in Virestad, Sweden—Characterised by Multivariate Analysis. Landsc. Urban Plan. 1997, 38, 61–75. [Google Scholar] [CrossRef]
  87. Fjellstad, W.; Dramstad, W.E. Patterns of Change in Two Contrasting Norwegian Agricultural Landscapes. Landsc. Urban Plan. 1999, 45, 177–191. [Google Scholar] [CrossRef]
  88. Krausmann, F.; Haberl, H.; Schulz, N.B.; Erb, K.-H.; Darge, E.; Gaube, V. Land-Use Change and Socio-Economic Metabolism in Austria—Part I: Driving Forces of Land-Use Change: 1950–1995. Land Use Policy 2003, 20, 1–20. [Google Scholar] [CrossRef]
  89. Baldock, D. Indicators for High Nature Value Farming Systems in Europe. Environ. In Indic. Agric. Policy; Brouwer, F.M., Crabtree, J.R., Eds.; CAB Publishing: Bellingham, WA, USA, 1999; pp. 121–135. [Google Scholar]
  90. Baldock, D.; Beaufoy, G.; Brouwer, F. Farming at the Margins: Abandonment or Redeployment of Agricultural Land in Europe; Institute for European Environmental Policy: London, UK, 1996. [Google Scholar]
  91. Mather, A.S. The Forest Transition. Area 1992, 24, 367–379. [Google Scholar]
  92. Reger, B.; Mattern, T.; Otte, A.; Waldhardt, R. Assessing the Spatial Distribution of Grassland Age in a Marginal European Landscape. J. Environ. Manag. 2009, 90, 2900–2909. [Google Scholar] [CrossRef] [PubMed]
Figure 1. Map of selected cadastral territories.
Land 11 01619 g001
Figure 2. Illustration of selected milestones and their historical justification.
Land 11 01619 g002
Figure 3. The example of sources used for the analysis of real land use data ((A)—stable cadastre, (B)—aerial photograph 1950s, (C)—aerial photograph 1990, (D)—aerial photograph 2019).
Land 11 01619 g003
Figure 4. Average percentage values of land use categories representation in all checked cadastral territories for individual years based on analysis of actual land use.
Land 11 01619 g004
Figure 5. Average percentage values of land use categories represented by region of production (P—potato, G—grain, F—forage) for individual years based on an analysis of the actual land use.
Land 11 01619 g005
Figure 6. Average percentage values of land use categories representation in all checked cadastral territories for individual years based on the Corine Land Cover Analysis.
Land 11 01619 g006
Figure 7. Average percentage values of land use categories represented by region of production (P—potato, G—grain, F—forage) for individual years based on an analysis of actual land use according to the Corine Land Cover.
Land 11 01619 g007
Table 1. Characteristics of production areas in the South Bohemian region according to [60].
Grain
Production Area
(G)
Potato
Production Area
(P)
Forage
Production Area
(F)
Area [km2]4552.323044.292461.39
Elevation [m n. m.]300–600400–650over 600
Reliefslightly wavy to
sloping
moderately wavy to steeply slopinghorizontally structured with a high slope
Average temperature [°C]5–8.55–85–6
Average precipitation [mm]550–700550–900over 700
Incidence of dry growing seasons [%]5–405–300–5
Average arable land [%]over 60over 60over 50
Average permanent culture [%]4.5–6.52.5–32.5–3
Average forest landlow-moderatemoderate-highhigh–extremely high
Table 2. The spatial resolution and scales of the used real land use datasets.
Map Scale
Pixel Size [m]
Maps of Stable Cadastre1:2880
Maps of Land Cadastre1:1000 (1:2000)
Aerial photographs 1947–19530.7–1
Aerial photographs 1990–2008 0.50
Aerial photographs 2009–2015 0.25
Aerial photographs since 20150.20
Corine Land Cover30.00
Publisher’s Note: MDPI stays neutral with regard to jurisdictional claims in published maps and institutional affiliations.

