
Ecosystem Services Valuation for the Sustainable Land Use Management by Nature-Based Solution (NbS) in the Common Agricultural Policy Actions: A Case Study on the Foglia River Basin (Marche Region, Italy)


Abstract
:1. Introduction
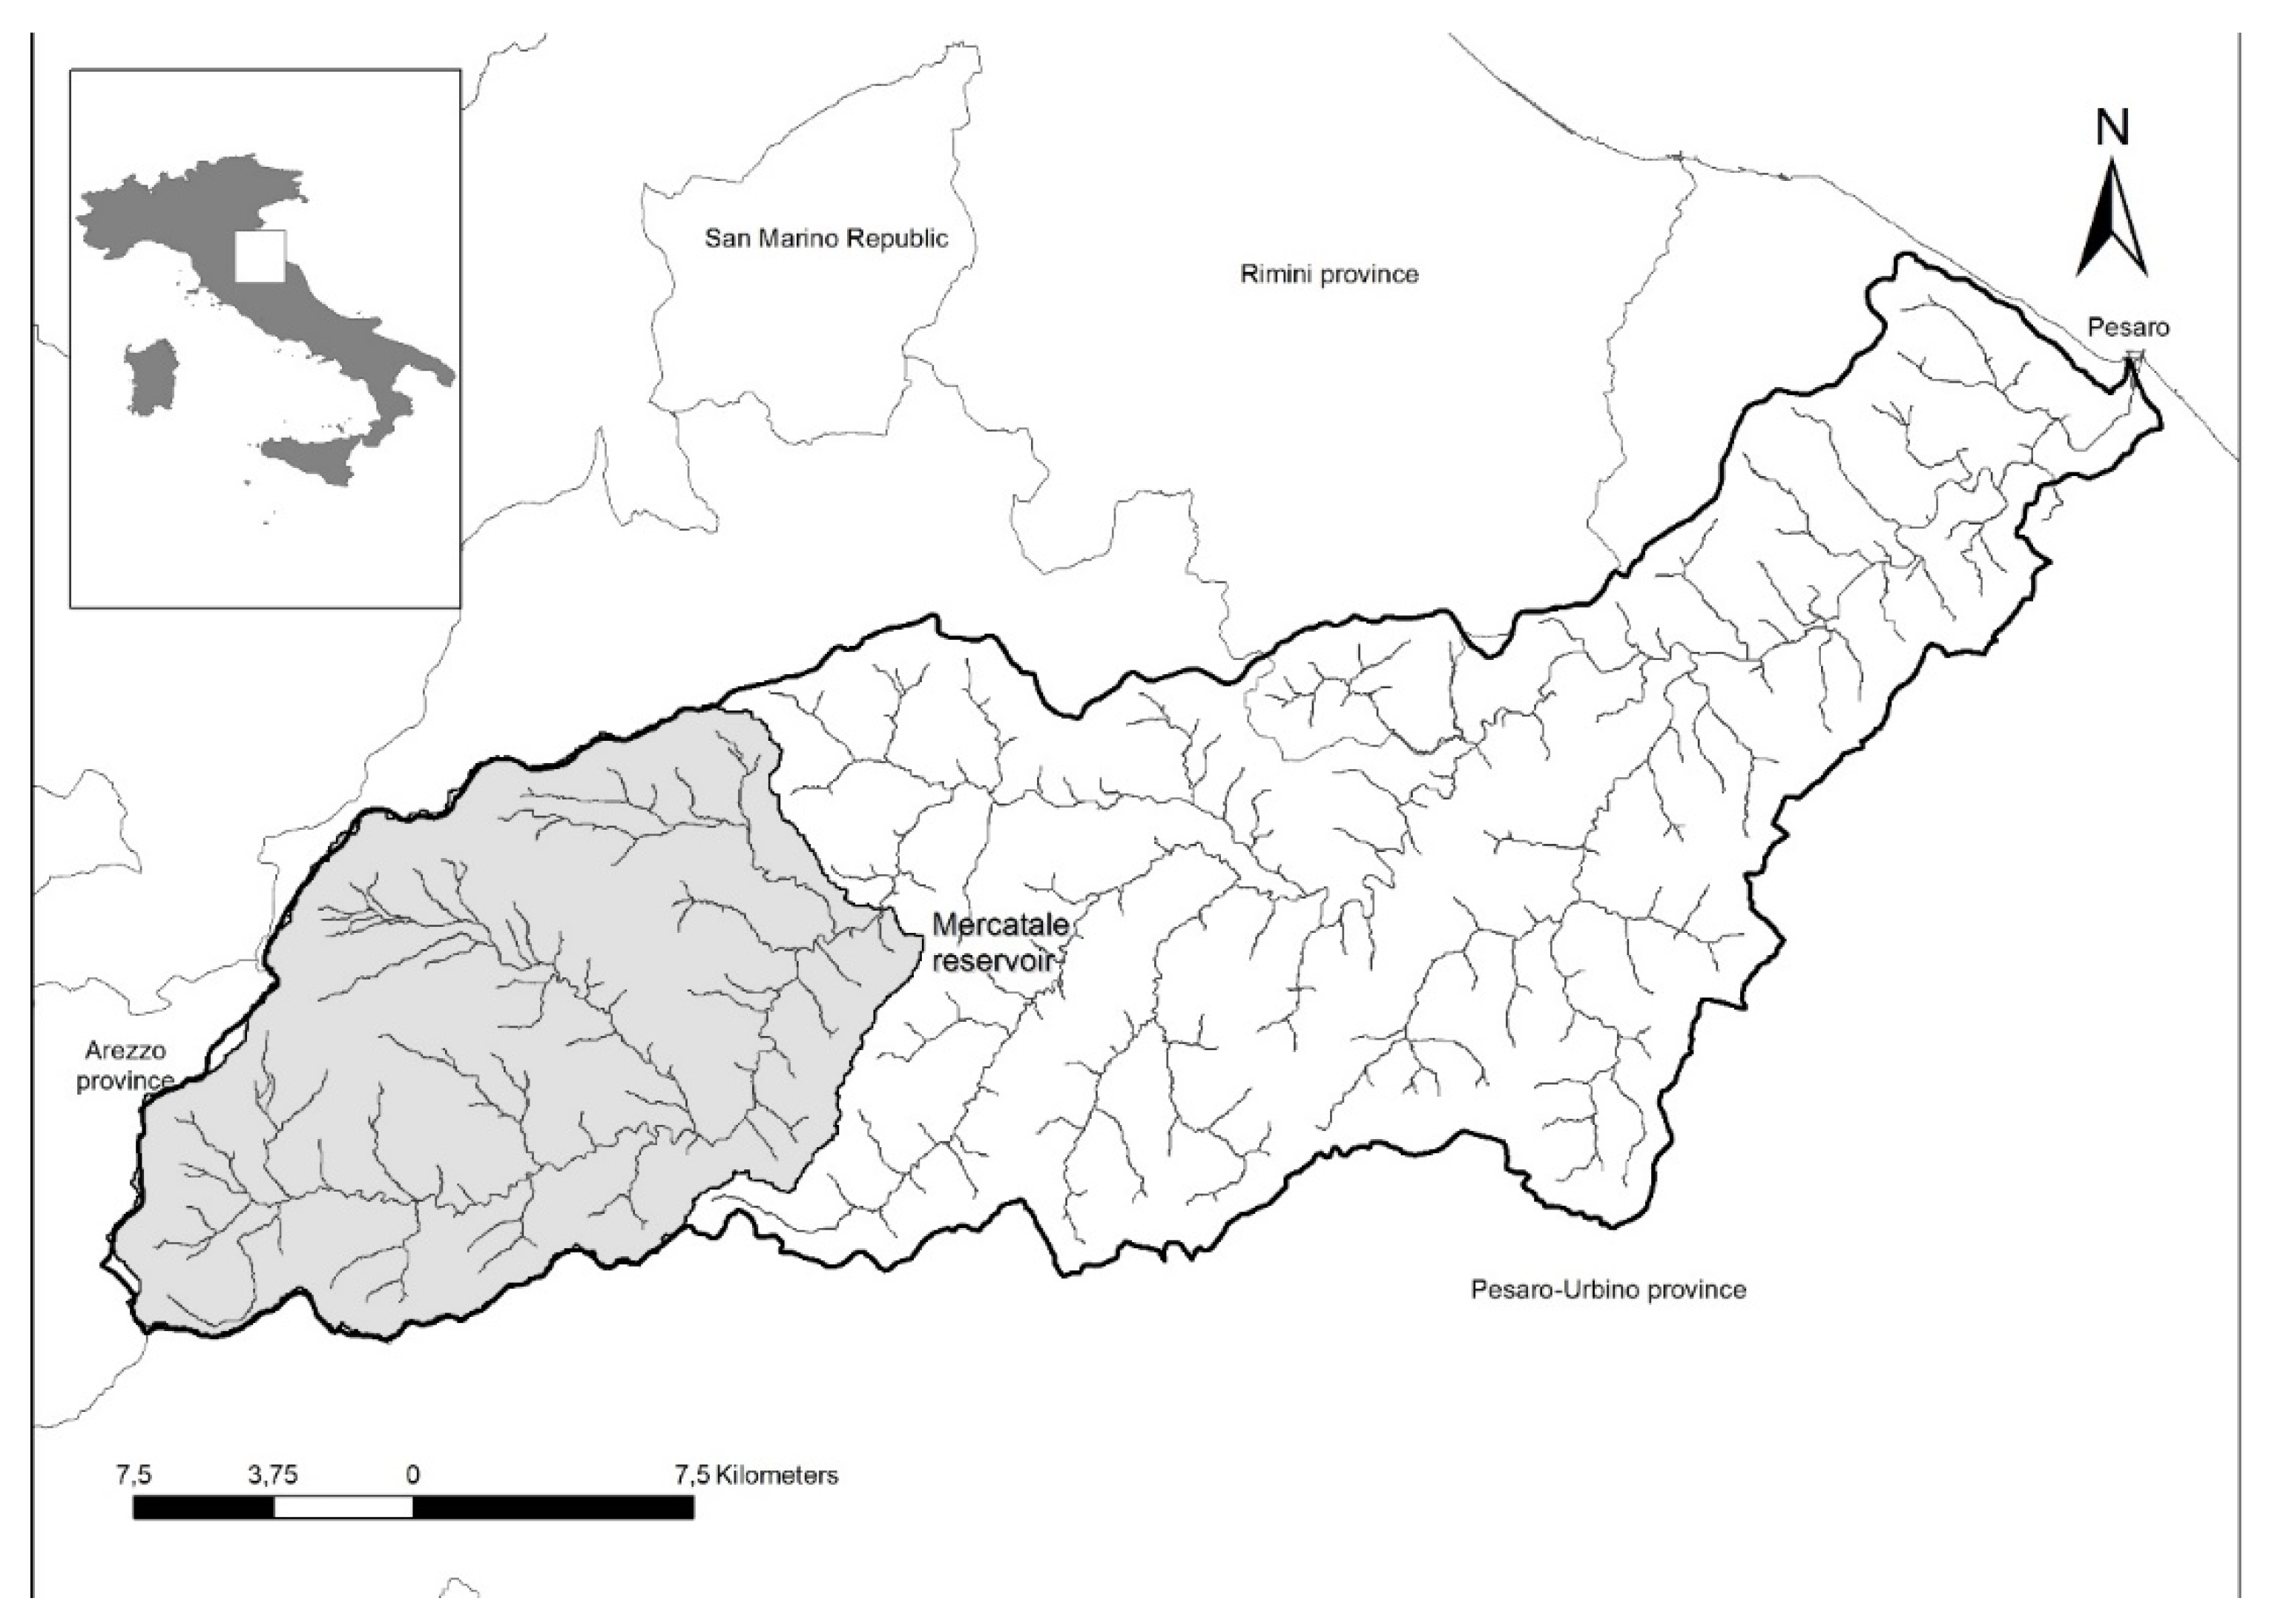
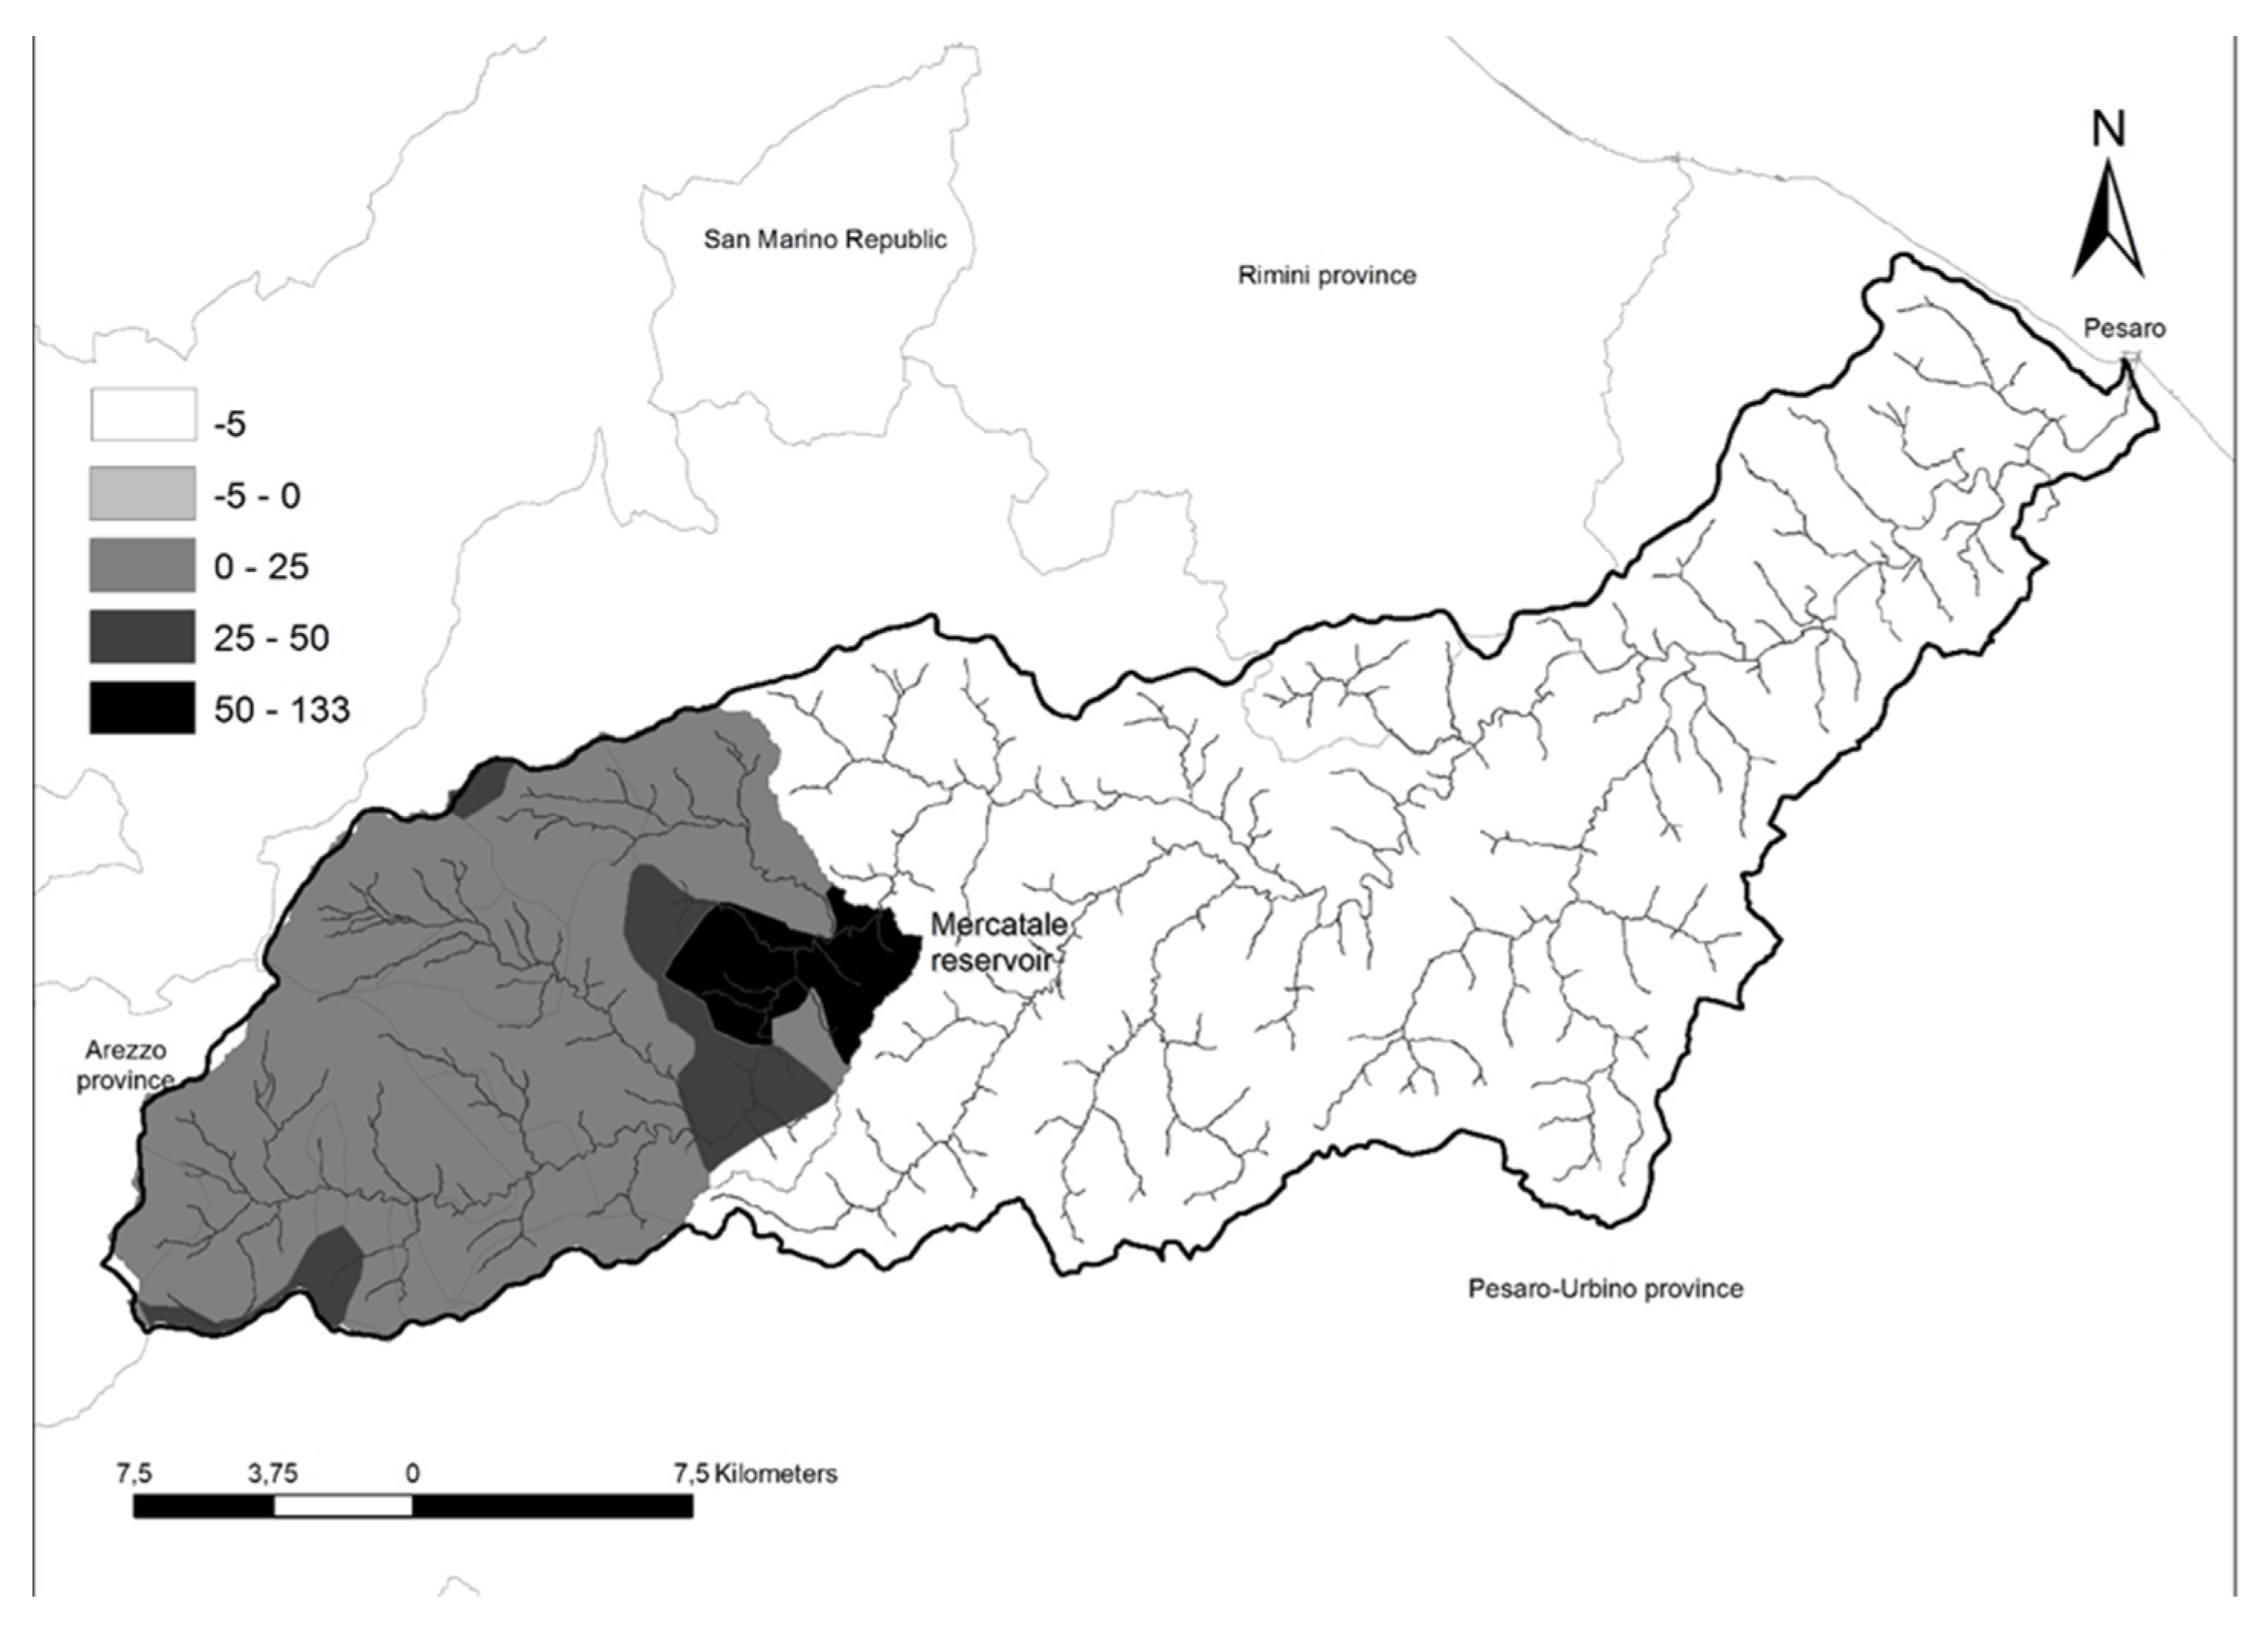
2. Study Area
3. Materials and Methods
3.1. Water Regulation and Supply
3.2. Erosion Protection
- A = estimated average soil loss (ton ha−1 y−1).
- R = rainfall-runoff erosivity factor (Jm−2 mmh−1).
- K = soil erodibility factor (t ha−1 R unit).
- L = slope length factor (dimensionless).
- S = slope steepness factor (dimensionless).
- C = cover-management factor (dimensionless).
- P = support practice factor (dimensionless).
3.3. N Balance
3.4. Developing Scenarios
3.4.1. Scenarios at Upper River Basin Scale
- T0 scenario: state of the art from 2008 land use map [57] with 2% of the arable land cover as a bare surface in winter (Agriculture Regional Information System).
- T0_bis scenario: improving from the T0 scenario, the Urban Development plan for discontinuous urban fabric, industrial units, services and public facilities, parking, roads.
- AAA scenario: from the T0 scenario, some agri-environmental actions are developed: addition of wooded buffer strips (European Reg. n 1305/2013) [80] of 5 m along with the first drainage network and 3 m along with the secondary drainage network, grassing vineyards (measure 10.1 RDP 2014–2020), winter cover for arable land (measure 10.1 RDP 2014–2020), the addition of herbaceous vegetation (3 m) along the road neighboring arable land and along the erosion furrows (5 m), variation of P parameter about RUSLE model from 1 to 0.5 and 0.6 [72], considering that 15% of arable land (slope class < 13%) are subject to contour plowing (it is the farming practice of plowing and/or planting across a slope following its elevation contour lines. These contour lines create a water break, which reduces the formation of rills and gullies during times of heavy water run-off, which is a major cause of soil erosion).
- AAA bis scenario: from AAA scenario, it is assumed that arable land with a slope > 20% is transformed into grassland (e.g., alfalfa). This action aims to promote land management that minimizes potential erosion. In particular, this action could permit the conversion of almost 4500 hectares of arable land in grasslands that represent a specific habitat for some species of animals and plants, increasing the biodiversity level.
3.4.2. Scenarios at Farming Scale
- Vineyards: because of the failure of the production chain and the difficulties in promoting the product (high average age);
- Orchards: because of the high installation costs, the lack of fruit and vegetables local sector, and the inadequate training of farmers to never practiced crops;
- Olive groves: because of weather and altitude problems.
- T0: actual traditional agronomic practices;
- T1: minimum tillage practices in the 35% of arable land;
- T2: conservation agriculture techniques: no-tillage, direct seeding and working bands on arable crops, crop residues left in an agricultural field, ban on continuous cropping;
- T3: conversion of arable land to grassland, meadows permanent grass of specialized perennial crops (vines, olives, and fruit), and creation of not used buffer zones along the watersheds (5% of the farming area).
4. Results
4.1. Land Use Change
4.2. Evaluation of Selected Ecosystem Services at Upper River Basin Scale
4.2.1. Water Regulation and Supply
4.2.2. Erosion Protection
4.2.3. N Balance
4.3. Evaluation of Selected Ecosystem Services at Farming Scale
5. Discussion
6. Conclusions
- Build resilience scenarios to help make informed choices about the most advantageous agricultural practices and to consider these values for sustainable management and monitoring of the territory.
- Develop synergistic actions so that the territory can offer an effective and lasting response to climate change.
- Maintain a greater focus on ecosystem services support efforts to emphasize multifunctionality in agriculture, to manage a broader set of ecosystem services, including provisioning, but also cultural services, which rarely have a price on the market, thus highlighting the potential of the role of farmers in a very diverse landscape context.
- Develop opportunities regarding the payment of ESs as recognition of the maintenance of functions useful to the territory and structures of collective interest, such as—in this case—the Mercatale basin for irrigation purposes.
Supplementary Materials
Author Contributions
Funding
Informed Consent Statement
Data Availability Statement
Acknowledgments
Conflicts of Interest
References
- FAO. Global agriculture towards 2050. In High Level Expert Forum—How to Feed the World in 2050; FAO: Rome, Italy, 2009; Available online: http://www.fao.org/fileadmin/templates/wsfs/docs/Issues_papers/HLEF2050_Global_Agriculture.pdf (accessed on 20 November 2021).
- European Commission. The CAP towards 2020. Impact Assessment of Alternative Policy Options; European Commission: Brussels, Belgium, 2011. [Google Scholar]
- WEF. The Global Risks Report 2020, 15th ed.; Insight Report; WEF: Colony, Switzerland, 2020. [Google Scholar]
- Tilman, D.; Cassman, K.G.; Matson, P.A.; Naylor, R.; Polasky, S. Agricultural sustainability and intensive production practices. Nature 2002, 418, 671–677. [Google Scholar] [CrossRef]
- ISPRA. Guidelines for the Hydrogeological Assessment and Its Mitigation through Measures and Interventions in Agriculture and Forestry; Manuali e Linee Guida: Roma, Italy, 2013; p. 98. (In Italian) [Google Scholar]
- Zhang, W.; Ricketts, T.H.; Kremen, C.; Carney, K.; Swinton, S.M. Ecosystem services and dis-services to agriculture. Ecol. Econ. 2007, 64, 253–260. [Google Scholar] [CrossRef] [Green Version]
- Quinn, J.E.; Brandle, J.R.; Johnson, R.J. A farm-scale biodiversity and ecosystem services assessment tool: The healthy farm index. Pap. Nat. Resour. 2013, 11, 176–192. [Google Scholar] [CrossRef] [Green Version]
- Zanten, B.T.; Verburg, P.H.; Espinosa, M.; Gomez-y-Paloma, S.; Galimberti, G.; Kantelhardt, J.; Kapfer, M.; Lefebvre, M.; Manrique, R.; Piorr, A.; et al. European agricultural landscapes, common agricultural policy and ecosystem services: A review. Agron. Sustain. Dev. 2012, 34, 309–325. [Google Scholar] [CrossRef] [Green Version]
- Notte, A.L.; Marongiu, S.; Masiero, M.; Molfetta, P.; Molignoni, R.; Cesaro, L. Livestock and Ecosystem Services: An Exploratory Approach to Assess Agri-Environment-Climate Payments of RDP in Trentino. Land 2015, 4, 688–710. [Google Scholar] [CrossRef] [Green Version]
- Rega, C.; Spaziante, A. Linking ecosystem services to agri-environmental schemes through SEA: A case study from Northern Italy. Environ. Impact Assess. Rev. 2013, 40, 47–53. [Google Scholar] [CrossRef]
- Batie, S. Sustainable development: Challenges to the profession of agricultural economics. Am. J. Agric. Econ. 1989, 71, 1083–1101. [Google Scholar] [CrossRef] [Green Version]
- Notte, A.L.; Scolozzi, R.; Molfetta, P.; Gubert, F.; Molignoni, R.; Franchi, R.; Pecile, A. Environment-climate payments for the rural development programs 2014–2020. The case of the autonomous province of Trento. Ann. Di Bot. 2014, 4, 91–96. [Google Scholar]
- Page, G.; Bellotti, B. Farmers value on-farm ecosystem services as important, but what are the impediments to participation in PES schemes? Sci. Total Environ. 2015, 515–516, 12–19. [Google Scholar] [CrossRef]
- De Clerck, F.J.; Jones, S.K.; Attwood, S.; Bossio, D.; Girvetz, E.; Chaplin-Kramer, B.; Enfors, E.; Fremier, A.K.; Gordon, L.J.; Kizito, F.; et al. Agricultural ecosystems and their services: The vanguard of sustainability? Curr. Opin. Environ. Sustain. 2016, 23, 92–99. [Google Scholar] [CrossRef] [Green Version]
- Swinton, S.M.; Lupi, F.; Robertson, G.P.; Hamilton, S.K. Ecosystem services and agriculture: Cultivating agricultural ecosystems for diverse benefits. Ecol. Econ. 2007, 64, 245–252. [Google Scholar] [CrossRef]
- Tixier, P.; Peyrard, N.; Aubertot, J.N.; Gaba, S.; Radoszycki, J.; Caron-Lormier, G.; Vinatier, F.; Mollot, G.; Sabbadin, R. Chapter Seven—Modelling Interaction Networks for Enhanced Ecosystem Services in Agroecosystems. Adv. Ecol. Res. 2013, 49, 437–480. [Google Scholar]
- Garrod, G. Greening the CAP: How the improved design and implementation of agrienvironment schemes can enhance the delivery of environmental benefits. J. Environ. Plan. Manag. 2009, 52, 571–574. [Google Scholar] [CrossRef]
- Poole, A.E.; DSalazar, R.B.; Macdonald, D.W. Optimizing agri-environment schemes to improve river health and conservation value. Agric. Ecosyst. Environ. 2013, 181, 157–168. [Google Scholar] [CrossRef]
- Matthews, A. Greening agricultural payments in the EU’s Common Agricultural Policy. Bio-Based Appl. Econ. 2013, 2, 1–27. [Google Scholar]
- Maes, J.; Jacobs, S. Nature-Based Solutions for Europe’s Sustainable Development. Conserv. Lett. 2017, 10, 121–124. [Google Scholar] [CrossRef] [Green Version]
- Jack, B. Ecosystem Services: European Agricultural Law and Rural Development. In Law and Agroecology—A Transdisciplinary Dialogue; Monteduro, M., Buongiorno, P., Di Benedetto, S., Isoni, A., Eds.; Springer: Berlin/Heidelberg, Germany, 2014; pp. 127–150. [Google Scholar]
- Whittingham, M.J. The future of agri-environment schemes: Biodiversity gains and ecosystem service delivery? J. Appl. Ecol. 2011, 48, 509–513. [Google Scholar] [CrossRef]
- Macfadyen, S.; Cunningham, S.A.; Costamagna, A.C.; Schellhorn, N.A. Managing ecosystem services and biodiversity conservation in agricultural landscapes: Are the solutions the same? J. Appl. Ecol. 2012, 49, 690–694. [Google Scholar] [CrossRef]
- Prager, K.G.; Reed, M.; Scott, A. Encouraging collaboration for the provision of ecosystem services at a landscape scale—Rethinking agri-environmental payments. Land Use Policy 2012, 29, 244–249. [Google Scholar] [CrossRef]
- Dale, V.H.; Polasky, S. Measures of the effects of agricultural practices on ecosystem services. Ecol. Econ. 2007, 64, 286–296. [Google Scholar] [CrossRef]
- De Groot, R.S.; Alkemade, R.; Braat, L.; Hein, L.; Willemen, L. Challenges in integrating the concept of ecosystem services and values in landscape planning, management and decision making. Ecol. Complex. 2010, 7, 260–272. [Google Scholar] [CrossRef]
- TEEB. The Economics of Ecosystems and Biodiversity Ecological and Economic Foundations; Pushpam, K., Ed.; Earthscan: London, UK; Earthscan: Washington, DC, USA, 2010. [Google Scholar]
- Power, A.G. Ecosystem services and agriculture: Tradeoffs and synergies. Philos. Trans. R. Soc. B Biol. Sci. 2010, 365, 2959–2971. [Google Scholar] [CrossRef]
- Gaglio, M.; Aschonitis, V.; Gissi, E.; Castaldelli, G.; Fano, E.A. Non-Market Ecosystem Services of Agricultural Land and Priorities Towards a More Sustainable Agriculture in Italy. J. Agric. Food Dev. 2016, 2, 23–31. [Google Scholar] [CrossRef]
- Morri, E.; Pruscini, F.; Scolozzi, R.; Santolini, R. A forest ecosystem services evaluation at the river basin scale: Supply and demand between coastal areas and upstream lands (Italy). Ecol. Indic. 2014, 37, 210–219. [Google Scholar] [CrossRef]
- Santolini, R.; Morri, E.; Pasini, G.; Giovagnoli, G.; Morolli, C.; Salmoiraghi, G. Assessing the quality of riparian areas: The case of River Ecosystem Quality Index applied to the Marecchia river (Italy). Int. J. River Basin Manag. 2015, 13, 1–16. [Google Scholar] [CrossRef]
- Reed, M.S.; Moxey, A.; Prager, K.; Hanley, N.; Skates, J.; Bonn, A.; Evans, C.; Glenk, K.; Thomson, K. Improving the link between payments and the provision of ecosystem services in agri-environment Schemes. Ecosyst. Serv. 2014, 9, 44–53. [Google Scholar] [CrossRef] [Green Version]
- Sattler, C.; Nagel, U.J. Factors affecting farmers’ acceptance of conservation measures. A case study from north-eastern Germany. Land Use Policy 2010, 27, 70–77. [Google Scholar] [CrossRef]
- De Francesco, E.; Gatto, P.; Runge, F.; Trestini, S. Factors affecting farmers’ participation in agri- environmental measures: A Northern Italian perspective. J. Agric. Econ. 2007, 59, 114–131. [Google Scholar]
- Bertoni, D.; Cavicchioli, D.; Pretolani, R.; Olper, A. Determinants of agri-environmental measures adoption: Do institutional constraints matter? Environ. Econ. 2012, 3, 8–19. [Google Scholar]
- Matzdorf, B.; Lorenz, J. How cost-effective are result-oriented agri-environmental measures? An empirical analysis in Germany. Land Use Policy 2010, 27, 535–544. [Google Scholar] [CrossRef]
- Millennium Ecosystem Assessment. Living Beyond Our Means: Natural Assets and Human Well-Being; Island Press: Washington, DC, USA, 2005. [Google Scholar]
- Gordon, L.J.; Finlayson, M.; Falkenmark, M. Managing water in agriculture for food production and other ecosystem services. Agric. Water Manag. 2010, 97, 512–519. [Google Scholar] [CrossRef]
- Pretty, J.N.; Noble, A.D.; Bossio, D.; Dixon, J.; Hine, R.E.; de Vries, F.; Morison, J.I.L. Resource-conserving agriculture increases yields in developing countries. Environ. Sci. Technol. 2006, 40, 1114–1119. [Google Scholar] [CrossRef] [PubMed] [Green Version]
- Baulcombe, D.; Crute, I.; Davies, B.; Dunwell, J.; Gale, M.; Jones JPretty, J.; Sutherland, W.; Toulmin, C. Reaping the Benefits: Science and the Sustainable Intensification of Global Agriculture; The Royal Society: London, UK, 2009. [Google Scholar]
- Hoffmann, H.; Schomers, S.; Meyer, C.; Klas Sander, K.; Hickey, V.; Feuerbacher, A. Agriculture and Ecosystem Services. Ref. Modul. Food Sci. 2019, 3, 9–13. [Google Scholar] [CrossRef]
- Brauman, K.A.; Daily, G.C.; Ka’eo Duarte, T.; Mooney, H.A. The Nature and Value of Ecosystem Services: An Overview Highlighting Hydrologic Services. 2Annu. Rev. Environ. Resourc. 2007, 32, 67–98. [Google Scholar] [CrossRef]
- Santolini, R.; Morri, E.; D’Ambrogi, S. Connectivity and Ecosystem Services in the Alps. In Alpine Nature 2030 Creating Ecological Connectivity for Generations to Come; Federal Ministry for the Environment, Nature Conservation, Building and Nuclear Safety (BMUB) Public Relations Division: Berlin, Germany, 2016; p. 251. ISBN 978-3-00-053702-8. [Google Scholar]
- Coates, J.B.; Tharme, R.; Herrero, M. Water-related Ecosystem Services and Food Security. In Managing Water and Agroecosystems for Food Security; Eline, B., Ed.; CAB International: Wallingford, UK, 2013; pp. 29–41. [Google Scholar]
- Bartoli, M.; Racchetti, E.; Delconte, C.A.; Sacchi, E.; Soana, E.; Laini, A.; Longhi, D.; Viaroli, P. Nitrogen balance and fate in a heavily impacted watershed (Oglio River, Northern Italy): In quest of the missing sources and sinks. Biogeosciences 2012, 9, 361–373. [Google Scholar] [CrossRef] [Green Version]
- Palomo, I.; Martín-López, B.; Potschin, M.; Haines-Young, R.; Montes, C. National Parks, buffer zones and surrounding lands: Mapping ecosystem service flows. Ecosyst. Serv. 2013, 4, 104–116. [Google Scholar] [CrossRef]
- Sandhu, H.S.; Wratten, S.D.; Cullen, R.; Case, B. The future of farming: The value of ecosystem services in conventional and organic arable land. An experimental approach. Ecol. Econ. 2008, 64, 835–848. [Google Scholar] [CrossRef]
- Romero, M.N.; Oteros-Rozas, E.; Gonzalez, J.A.; Martın-Lopez, B. Exploring the knowledge landscape of ecosystem services assessments in Mediterranean agroecosystems: Insights for future research. Environ. Sci. Policy 2014, 37, 121–133. [Google Scholar] [CrossRef]
- Costanza, R.; D’arge, R.; De Groot, R.; Farber, S.; Grasso, M.; Hannon, B.; Limburg, K.; Naeem, S.; O’neill, R.V.; Paruelo, J.; et al. The value of the world’s ecosystem services and natural capital. Nature 1997, 387, 253. [Google Scholar] [CrossRef]
- Schirpke, U.; Marino, D.; Marucci, A.; Palmieri, M.; Scolozzi, R. Operationalising ecosystem services for effective management of protected areas: Experiences and challenges. Ecosyst. Serv. 2017, 28, 105–114. [Google Scholar] [CrossRef]
- Scolozzi, R.; Morri, E.; Santolini, R. Delphi-based change assessment in ecosystem service values to support strategic spatial planning in Italian landscapes. Ecol. Indic. 2012, 21, 134–144. [Google Scholar] [CrossRef]
- Scolozzi, R.; Schirpke, U.; Morri, E.; D’Amato, D.; Santolini, R. Ecosystem services-based SWOT analysis of protected areas for conservation strategies. J. Environ. Manag. 2014, 146, 543–551. [Google Scholar] [CrossRef] [PubMed]
- Robertson, G.P.; Swinton, S.M. Reconciling agricultural productivity and environmental integrity: A grand challenge for agriculture. Front. Ecol. Environ. 2005, 3, 38–46. [Google Scholar] [CrossRef]
- Rosa, S.D.L.; Privitera, R. Characterization of non-urbanized areas for land-use planning of agricultural and green infrastructure in urban contexts. Landsc. Urban. Plan. 2013, 109, 94–106. [Google Scholar] [CrossRef]
- Rosa, S.D.L.; Barbarossa, L.; Privitera, R.; Martinico, F.; Greca, P.L. Agriculture and the City: A Method for Sustainable Planning of New Forms of Agriculture in Urban Contexts. Land Use Policy 2014, 41, 290–303. [Google Scholar] [CrossRef]
- Smith, S.; Rowcroft, P.; Everard, M.; Couldrick, L.; Reed, M.; Rogers, H.; Quick, T.; Eves, C.; White, C. Payments for Ecosystem Services: A Best Practice Guide; Defra: London, UK, 2013. [Google Scholar]
- Morri, E. Environmental State of Foglia River Basin: River Functionality and Ecosystem Services. Ph.D. Thesis, Urbino University, Marche Region, Italy, 2012. [Google Scholar]
- Rusco, E.; Maréchal, B.; Tiberi, M.; Bernacconi, C.; Ciabocco, G.; Ricci, P.; Spurio, E. Case Study—Italy Sustainable Agriculture and Soil Conservation (SoCoProject); JRC Technical Notes; EUR 24131 EN/9; Office for Official Publications of the European Communities: Luxembourg, 2009. [Google Scholar]
- Bonan, G.B. Forests and climate change: Forcings, feedbacks, and the climatebenefits of forests. Science 2008, 320, 1444–1449. [Google Scholar] [CrossRef] [Green Version]
- Hümann, M.; Schüler, G.; Müller, C.; Schneider, R.; Johst, M.; Caspari, T. Identification of runoff processes—The impact of different forest types and soil properties on runoff formation and floods. J. Hydrol. 2011, 409, 637–649. [Google Scholar] [CrossRef]
- Nedkov, S.; Burkhard, B. Flood regulating ecosystem services—Mapping supply and demand in the Etropole Municipality. Bulgaria. Ecol. Indic. 2012, 21, 67–79. [Google Scholar] [CrossRef]
- Amici, M.; Spina, R. Average Annual and Seasonal Precipitation of Marche Region for the Period 1950–2000; Centre for Ecology and Climate, Civil Protection Ancona, Marche Region: Ancona, Italy, 2002; p. 103. (In Italian) [Google Scholar]
- Spina, R.; Stortini, S.; Fusari, R.; Scuterini, C.; Di Marino, M. Climatological Characterization of the Marche Region: Average Temperature Range for the 1950–2000 Period; Centre for Ecology and Climate, Civil Protection Marche Region: Ancona, Italy, 2002; p. 56. [Google Scholar]
- IPPC Intergovernmental Panel on Climate Change. WG1 Report Climate Change: The Physical Science Basis; IPPC: Geneva, Switzerland, 2007. [Google Scholar]
- Zhang, L.; Dawes, W.R.; Walker, G.R. The response of mean annual evapotranspiration to vegetation changes at catchment scale. Water Resour. Res. 2001, 37, 701–708. [Google Scholar] [CrossRef]
- Allen, R.G.; Pereira, L.S.; Raes, D.; Smith, M. Crop Evapotranspiration; FAO Irrigation and Drainage Paper; FAO: Rome, Italy, 1998; p. 56. [Google Scholar]
- Marche Region 2010. General Price List. Available online: http://contrattipubblici.regione.marche.it/Servizi-On-line/Servizi-on-line-di-libera-consultazione/Prezzario (accessed on 3 September 2014). (In Italian).
- Costantini, E.A.C.; Dazzi, C. The Soils of Italy; Springer Science & Business Media: Berlin/Heidelberg, Germany, 2013; p. 354. [Google Scholar]
- Renard, K.G.; Foster, G.R.; Weesies, G.A. Predicting Soil Erosion by Water: A Guide to Conservation Planning with the Revised Universal Soil Loss Equation (RUSLE); USDA Agricultural Handbook: Washington, DC, USA, 1997; p. 404. Available online: http://www.ars.usda.gov/SP2UserFiles/Place/64080530/RUSLE/AH_703.pdf (accessed on 3 September 2015).
- Diodato, N.; Ceccarelli, M.; Bellocchi, G. GIS-aided evaluation of evapotranspiration at multiple spatial and temporal climate patterns using geoindicators. Ecol. Indic. 2010, 10, 1009–1016. [Google Scholar] [CrossRef]
- Pelton, J.; Frazier, E.; Pickilingis, E. Calculating Slope Length Factor (LS) in the Revised Universal Soil Loss Equation (RUSLE); 2014. Available online: http://gis4geomorphology.com/ (accessed on 2 January 2015).
- Kirkby, M.J.; Morgan, R.P.C. Soil Erosion; Wiley: New York, NY, USA, 1980; p. 312. [Google Scholar]
- Oenema, O.; Kros, H.; de Vries, W. Approaches and uncertainties in nutrient budgets: Implications for nutrient management and environmental policies. Europ. J. Agron. 2003, 20, 3–16. [Google Scholar] [CrossRef]
- Bartoli, M.; Soana, E.; Laini, A.; Nizzoli, D.; Pinardi, M.; Racchetti, E.; Gardi, C.; Viaroli, P.; Acutis, M.; Salmaso, F.; et al. Cross Comparison of Nitrogen Sources, Sinks and Transport within River Basins: The Italian Nitrogen Network initiative (INN). In Proceedings of the XXIV Congresso Società Italiana di Ecologia: L’Ecologia Oggi: Responsabilità E Governance, Ferrara, Italy, 15–17 September 2014; p. 135. [Google Scholar]
- Soana, E.; Racchetti, E.; Laini, A.; Bartoli, M.; Viaroli, P. Soil Budget, Net Export, and Potential Sinks of Nitrogen in the Lower Oglio River Watershed (Northern Italy). Clean Soil Air Water 2011, 39, 956–965. [Google Scholar] [CrossRef]
- Soana, E.; Longhi, D.; Racchetti, E.; Pinardi, M.; Laini, A.; Bolpagni, R.; Castaldelli, G.; Bartoli, M.; Fano, E.A.; Viaroli, P. Small Services over Large Areas: The Need for New Paradigms for the Secondary Hydrographic Network. In Proceedings of the XXIII SitE Conference, Ancona, Italy, 16–18 September 2013. (In Italian). [Google Scholar]
- Castaldelli, G.; Soana, E.; Racchetti, E.; Vincenzi, F.; Fano, A.E.; Bartoli, M. Vegetated canals mitigate nitrogen surplus in agricultural watersheds. Agric. Ecosyst. Environ. 2014, 212, 253–262. [Google Scholar] [CrossRef]
- Cole, L.J.; Stockan, J.; Helliwell, R. Managing riparian buffer strips to optimize ecosystem services: A review. Agric. Ecosyst. Environ. 2020, 296, 106891. [Google Scholar] [CrossRef]
- García-Díaz, A.; Bienes, R.; Sastre, B.; Novara, A.; Gristina, L.; Cerdà, A. Nitrogen losses in vineyards under different types of soil groundcover. A field runoff simulator approach in Central Spain. Agric. Ecosyst. Environ. 2017, 236, 256–267. [Google Scholar] [CrossRef]
- European Parliament and Council. Regulation (UE) N. 1305/2013 on Support for Rural Development by the European Agricultural Fund for Rural Development (EAFRD) and Repealing Council Regulation (EC); No. 1698/2005; European Parliament and Council: Strasbourg, France, 2013. [Google Scholar]
- Tvinnereim, E.; Zelljadt, E.; Yakymenko, N.; Mazzacurati, E. Carbon; Point Carbon: Amsterdam, The Netherland, 2011; Available online: www.pointcarbon.com (accessed on 3 September 2015).
- Birkás, M.; Jolánkai, M.; Gyuricza, C.; Percze, A. Tillage effects on compaction, earthworms and other soil quality indicators in Hungary. Soil Tillage Res. 2004, 78, 185–196. [Google Scholar] [CrossRef]
- Bengtsson, J.; Bullock, J.M.; Egoh, B.; Everson, C.; Everson, T.; O’Connor, T.; O’Farrell, P.J.; Smith, H.G.; Lindborg, R. Grasslands—more important for ecosystem services than you might think. Ecosphere 2019, 2, e02582. [Google Scholar] [CrossRef]
- Li, J.; Ren, Z.; Zhou, Z. Ecosystem services and their values: A case study in the Qinba mountains of China. Ecol. Res. 2006, 21, 597–604. [Google Scholar] [CrossRef]
- BenDor, T.K.; Livengood, A.; Lester, W.T.; Davis, A.; Yonavjak, L. Defining and evaluating the ecological restoration economy. Restor. Ecol. 2015, 23, 209–219. [Google Scholar] [CrossRef]
- Santolini, R.; Morri, E. Ecological Criteria for the Introduction of Evaluation and Remuneration of Ecosystem Services (SE) in Design and Planning (Italian) in La Dimensione Europea Del Consumo Di Suolo E Le Politiche Nazionali. CRCS Rapporto; INU Istituto Nazionale di urbanistica: Roma, Italy, 2017; pp. 149–154. [Google Scholar]
- Pagiola, S.; Platais, G. Introduction to Payments for Environmental Services, PowerPoint presentation, ESSD Week 2005—Learning days. Available online: www.unescap.org.com (accessed on 10 September 2015).
- Wunder, S.; Engel, S.; Pagiola, S. Taking Stock: A Comparative Analysis of Payments for Environmental Services Programs in Developed and Developing Countries. Ecol. Econ. 2008, 65, 834–852. [Google Scholar] [CrossRef]
- Pellegrino, D.; Schirpke, U.; Marino, D. How to support the effective management of Natura 2000 sites? J. Environ. Plan. Manag. 2016, 60, 383–398. [Google Scholar] [CrossRef]
- European Commission. An Action Plan for Nature, Citizens and Economy; Final Report, COM (2017) 198 final; European Commission: Brussels, Belgium, 2015. [Google Scholar]
- European Commission. Towards an EU research and innovation policy agenda for nature-based solutions and re-naturing cities. In Final Report of the Horizon 2020 Expert Group on Nature-Based Solutions and Re-Naturing Cities (Full Version European Commission); European Commission: Brussels, Belgium, 2015. [Google Scholar]
- Seddon, N.; Chausson, A.; Berry, P.; Girardin, C.A.; Smith, A.; Turner, B. Understanding the value and limits of nature-based solutions to climate change and other global challenges. Philos. Trans. R. Soc. B 2020, 375, 20190120. [Google Scholar] [CrossRef] [Green Version]
- UNESCO. Nature-based solutions for water. In The United Nations World Water Development Report; United Nations Educational, Scientific and Cultural Organization (UNESCO): Paris, France, 2018. [Google Scholar]
- Cohen-Shacham, E.; Walters, G.; Janzen, C.; Maginnis, S. Nature-Based Solutions to Address Global Societal Challenges; IUCN: Gland, Switzerland, 2016; p. 97. Available online: https://doi.org/10.2305/IUCN.CH.2016.13.en (accessed on 20 November 2021).
- Heuvel, J.V.; Centinari, M. Under-Vine Vegetation Mitigates the Impacts of Excessive Precipitation in Vineyards. Front. Plant Sci. 2021, 12, 713135. [Google Scholar] [CrossRef]


| Land Use Classes | Efficiency of Water Conservation EW (% of S) |
|---|---|
| Urban area (industrial, road, urban fabric); bare rocks | 0 |
| Arable land | 17 |
| Continue and discontinue grasslands; complex cultivation patterns; Sclerophyllous vegetation | 33 |
| Shrubby buffer strips; vineyards; transitional woodland-shrub | 50 |
| Broad-leaved forest, hygrophilous forest, mixed forest; arboreous buffer strips | 67 |
| Coniferous forest or mixed (mainly coniferous) | 83 |
| Water bodies, water courses | 100 |
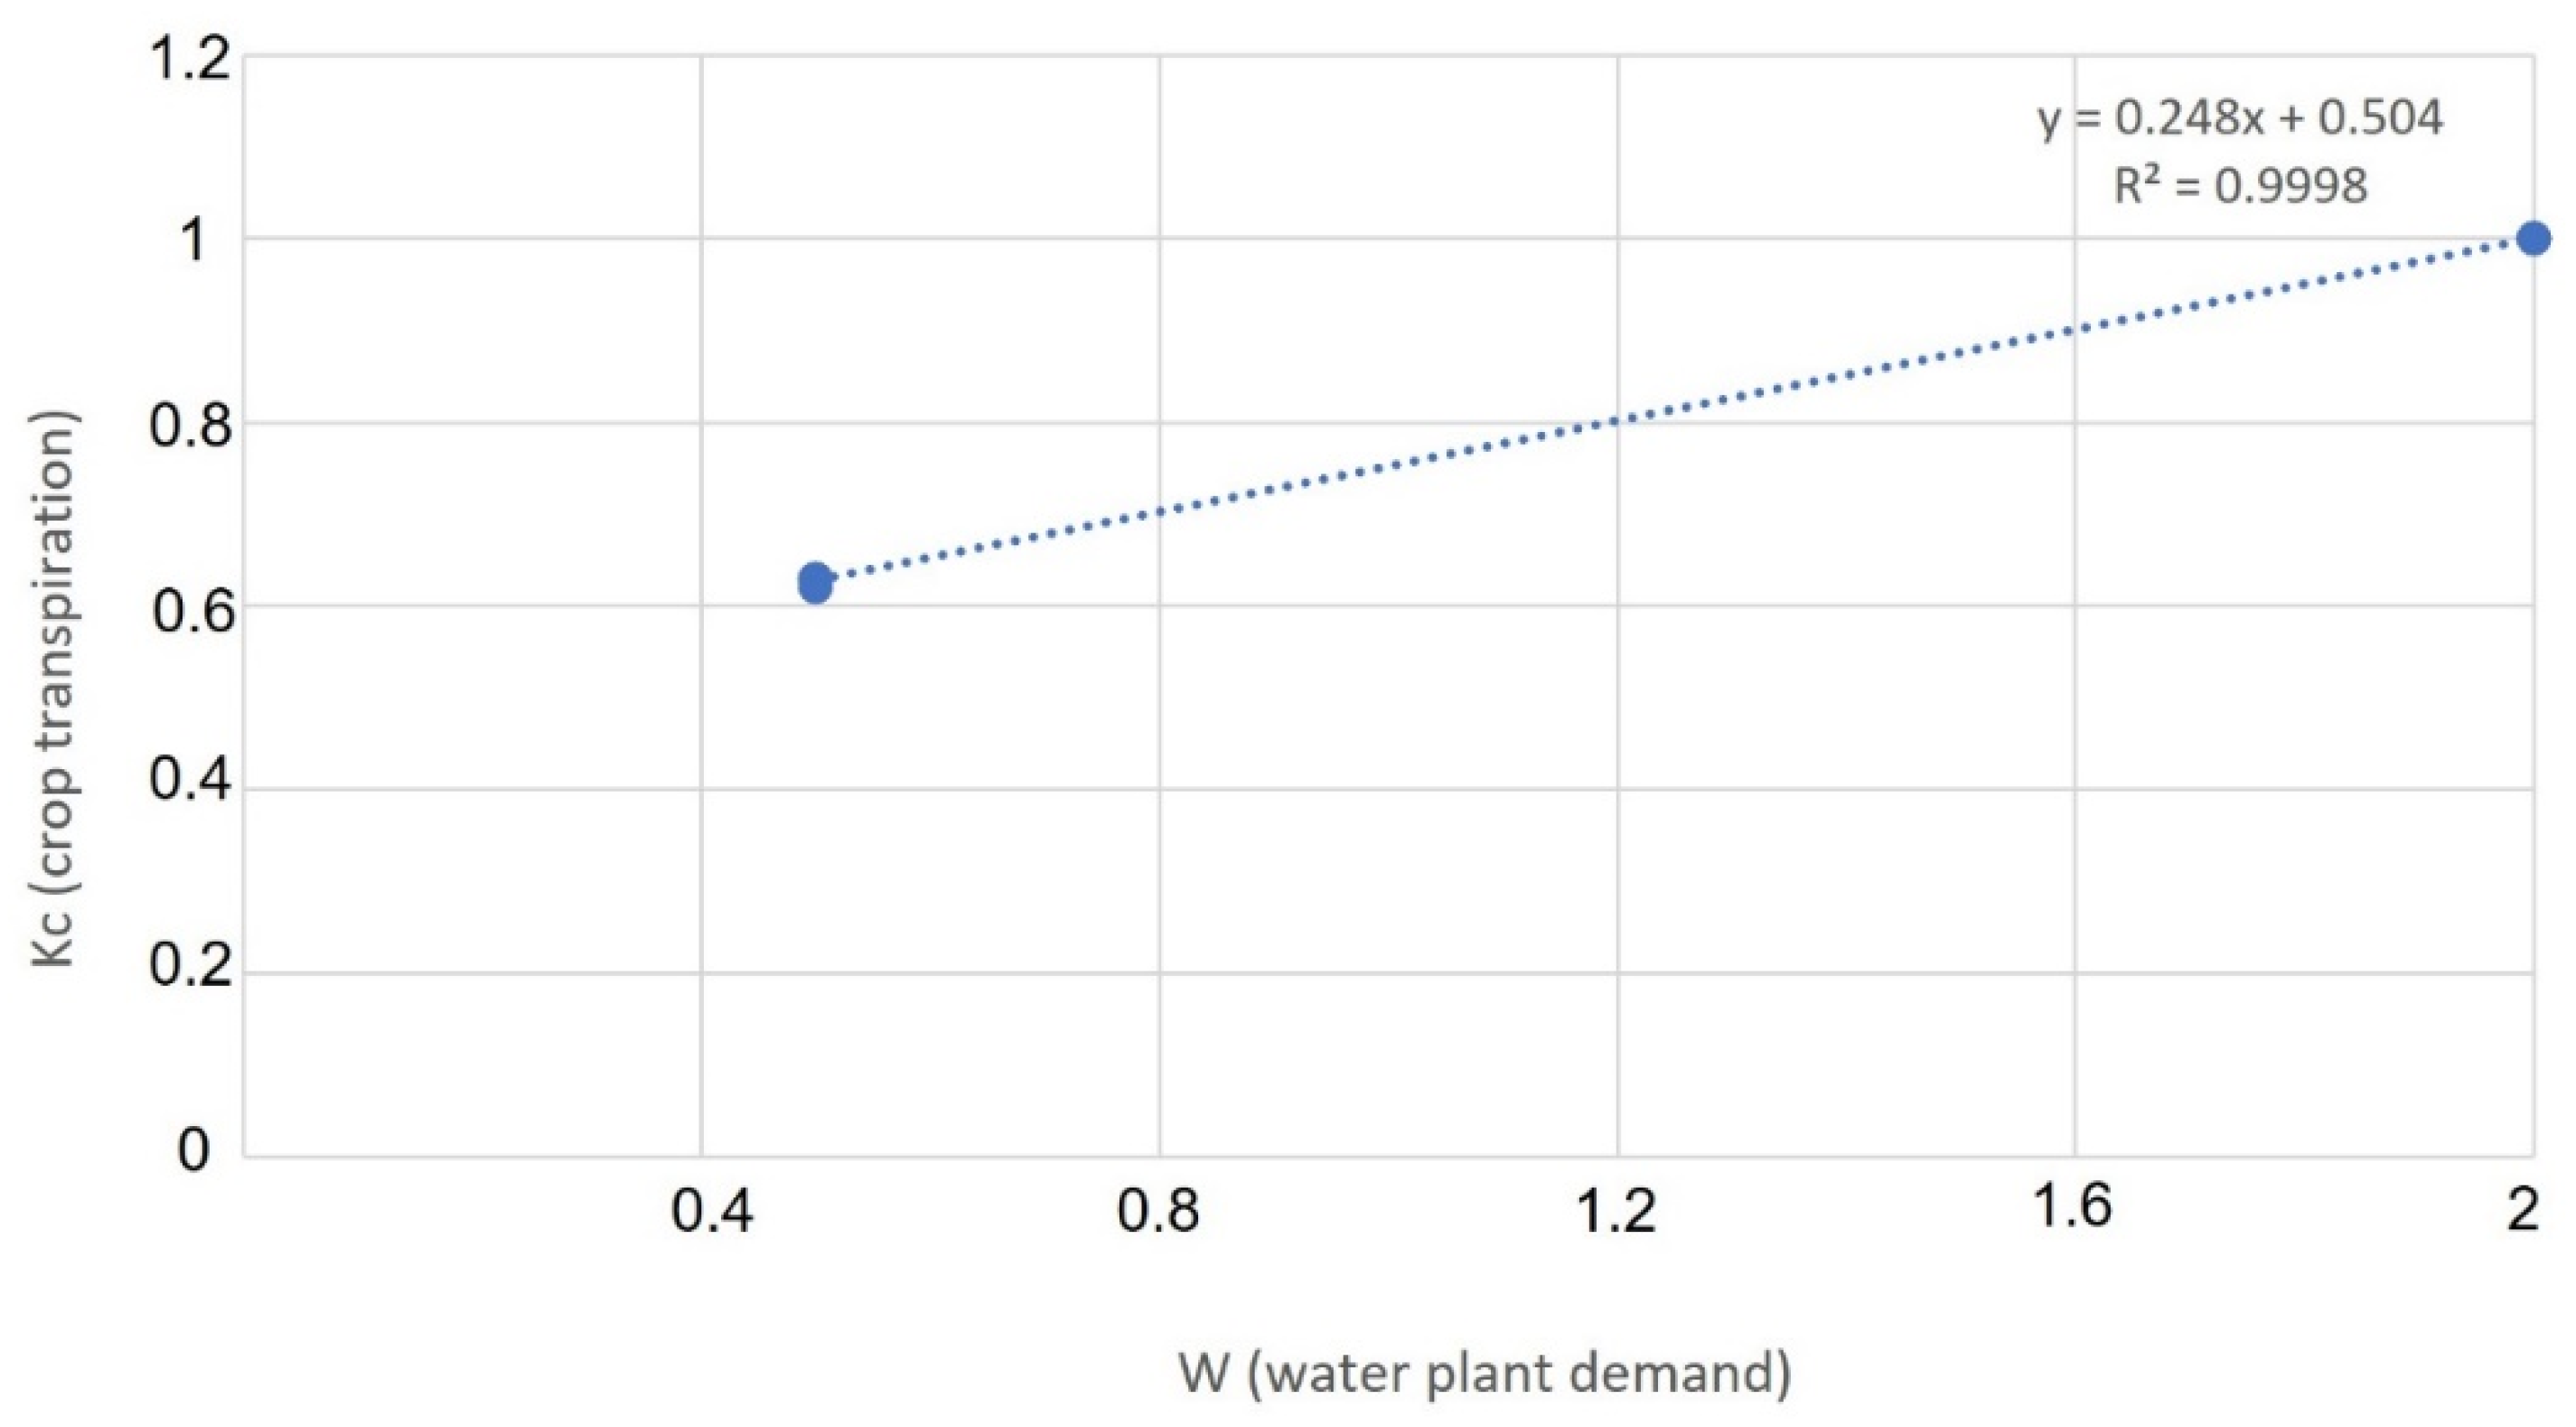
| Land Use Classes | C | Kc | W |
|---|---|---|---|
| Transitional woodland-shrub | 0.01 | 0.8 | 1.2 |
| Sclerophyllous vegetation | 0.01 | 0.8 | 1.2 |
| Industrial and commercial units | 0 | 0.001 | 0.1 |
| Sport and recreation ports | 0.01 | 0.63 | 0.5 |
| Green urban areas | 0.01 | 0.63 | 0.5 |
| Water bodies | 0 | 1 | 0.1 |
| Broad-leaved forest (Fagus) | 0.01 | 1 | 2 |
| Broad-leaved forest (Quercus) | 0.01 | 1 | 2 |
| Hygrophilous forest | 0.01 | 1 | 2 |
| Coniferous forest | 0.01 | 1 | 2 |
| Broad-leaved forest | 0.01 | 1 | 2 |
| Mixed forest (mainly coniferous) | 0.01 | 1 | 2 |
| Mixed forest (mainly broad-leaved) | 0.01 | 1 | 2 |
| Construction sites | 0 | 0.001 | 0.1 |
| Water courses | 0 | 1 | 0.1 |
| Shrubby buffer strips | 0.01 | 0.63 | 0.5 |
| Arboreous buffer strips | 0.01 | 0.63 | 0.5 |
| Continue grasslands | 0 | 0.001 | 0.1 |
| Discontinue grasslands | 0.55 | 0.001 | 0.1 |
| Road and rail networks | 0.335 | 0.62 | 0.5 |
| Bare rocks | 0.55 | 0.001 | 0.3 |
| Arable land | 0.335 | 0.67 | 0.8 |
| Arable land-bare surface | 0 | 0.001 | 0.1 |
| Complex cultivation patterns | 0.55 | 0.7 | 0.2 |
| Urban fabric | 0.28 | 0.67 | 0.5 |
| Vineyards | 0.01 | 0.8 | 1.2 |
| Grassing vineyards | 0.01 | 1 | 2 |
| Erosion Classes | Slope Classes (%) | p-Value |
|---|---|---|
| 1 | 1–2 | 0.6 |
| 2 | 3–8 | 0.5 |
| 3 | 9–13 | 0.6 |
| 4 | 14–16 | 0.7 |
| 5 | 17–20 | 0.8 |
| 6 | 21–25 | 0.9 |
| - | T0 | T0_bis | AAA | AAA_bis | ||||
|---|---|---|---|---|---|---|---|---|
| - | Area | |||||||
| - | ha | % | ha | % | ha | % | ha | % |
| Transitional woodland-shrub | 682.0 | 3.0 | 682 | 3.0 | 681.9 | 3.0 | 681.9 | 3.0 |
| Sclerophyllous vegetation | 364.6 | 1.6 | 364.6 | 1.6 | 364.6 | 1.6 | 364.6 | 1.6 |
| Industrial and commercial units | 56.9 | 0.2 | 111.6 | 0.5 | 111.6 | 0.5 | 111.6 | 0.5 |
| Sport and recreation ports | 18.2 | 0.1 | 18.2 | 0.1 | 18.1 | 0.1 | 18.1 | 0.1 |
| Green urban areas | 352.7 | 1.5 | 333.5 | 1.5 | 330.6 | 1.5 | 330.6 | 1.5 |
| Water bodies | 54.6 | 0.2 | 54.6 | 0.2 | 54.6 | 0.2 | 54.6 | 0.2 |
| Broad-leaved forest (Fagus) | 35.6 | 0.2 | 35.6 | 0.2 | 35.6 | 0.2 | 35.6 | 0.2 |
| Broad-leaved forest (Quercus) | 6411.6 | 28.2 | 6410 | 28.2 | 6409 | 28.2 | 6409 | 28.2 |
| Hygrophilous forest | 245.7 | 1.1 | 245.1 | 1.1 | 245.1 | 1.1 | 245.1 | 1.1 |
| Coniferous forest | 489.8 | 2.2 | 489.6 | 2.2 | 489.3 | 2.1 | 489.3 | 2.1 |
| Broad-leaved forest | 0.3 | 0.0 | 0.3 | 0.0 | 0.3 | 0.0 | 0.3 | 0.0 |
| Mixed forest (mainly coniferous) | 113.9 | 0.5 | 113.8 | 0.5 | 113.8 | 0.5 | 113.8 | 0.5 |
| Mixed forest (mainly broad leaved) | 2041.5 | 9.0 | 2041 | 9.0 | 2040 | 9.0 | 2040 | 9.0 |
| Construction sites | 3 | 0.0 | 2.2 | 0.0 | 2.2 | 0.0 | 2.2 | 0.0 |
| Water courses | 48.5 | 0.2 | 48.4 | 0.2 | 48.4 | 0.2 | 48.4 | 0.2 |
| Shrubby buffer strips | 0 | 0.0 | 0 | 0.0 | 25.3 | 0.1 | 25.3 | 0.1 |
| Arboreous buffer strips | 0 | 0.0 | 0 | 0.0 | 7.8 | 0.0 | 7.5 | 0.0 |
| Continue grasslands | 1842.4 | 8.1 | 1838 | 8.1 | 2039 | 9.0 | 6520 | 28.6 |
| Discontinue grasslands | 259.1 | 1.1 | 254 | 1.1 | 252.8 | 1.1 | 252.8 | 1.1 |
| Road and rail networks | 578.4 | 2.5 | 569.9 | 2.5 | 569.8 | 2.5 | 569.8 | 2.5 |
| Bare rocks | 228 | 1.0 | 228 | 1.0 | 226.9 | 1.0 | 226.9 | 1.0 |
| Arable land | 8663.8 | 38.1 | 8562 | 37.6 | 8407 | 36.9 | 3926 | 17.2 |
| Arable land-bare surface | 75.3 | 0.3 | 72 | 0.3 | 0 | 0.0 | 0 | 0.0 |
| Complex cultivation patterns | 54 | 0.2 | 54 | 0.2 | 52.6 | 0.2 | 52.6 | 0.2 |
| Urban fabric | 124.1 | 0.5 | 223 | 1.0 | 219.6 | 1.0 | 219.6 | 1.0 |
| Vineyards | 18.3 | 0.1 | 18.3 | 0.1 | 0 | 0.0 | 0 | 0.0 |
| Grassing vineyards | 0 | 0.0 | 0 | 0.0 | 17.9 | 0.1 | 17.9 | 0.1 |
| Total | 22,762.3 | |||||||
| Scenarios | ||||
|---|---|---|---|---|
| Available Water | T0 | T0_bis | AAA | AAA_bis |
| Mm3 | 100.73 | 100.77 | 100.66 | 100.72 |
| Water regulation and supply service | ||||
| Mm3 | 36.91 | 36.18 | 36.77 | 39.85 |
| € × 106 (0.35 € m3−1 bulk water cost) | 12.92 | 12.66 | 12.87 | 13.95 |
| € ha−1 | 569 | 557 | 566 | 614 |
| Scenarios | ||||
|---|---|---|---|---|
| T0 | T0-bis | AAA | AAA_bis | |
| soil loss_Erosion (t y−1) | 688,978 | 672,307 | 649,975 | 265,750 |
| difference with t0 (t y−1) | - | −16,671 | −39,002 | −423,227 |
| difference with t0 (%) | - | −2.4 | −5.7 | −61.4 |
| difference with t0 (m3 y−1) (considering 1.4 gr/cm3 soil bulk density) | - | −11,908 | −27,859 | −302,305 |
| Erosion protection value (106 €) (41 €/m3 Marche Region, 2010) | - | 0.49 | 1.14 | 12.39 |
| Forest area (ha) | 9338 | 9336 | 9334 | 9334 |
| Erosion protection value by forest (€) | 784,407 | 784,189 | 784,031 | 784,031 |
| Erosion protection value by applying RDP measures (€) | - | - | 358,184 | 11,610,486 |
| Erosion protection value by applying RDP measures (€ ha−1) | 15.8 | 511 | ||
| Soil System Budget | ||||
|---|---|---|---|---|
| Foglia River Basin | Upper Foglia River Basin | |||
| Input | Tons N yr−1 | % | Tons N yr−1 | % |
| Livestock manure | 1388 | 19 | 515 | 70 |
| Synthetic fertilizers | 520 | 7 | 104 | 14 |
| Biological fixation | 5075 | 71 | 72 | 10 |
| Atmospheric deposition | 172 | 2 | 45 | 6 |
| Σ input | 7156 | 100 | 736 | 100 |
| Output | Tons N yr−1 | % | ||
| Crop uptake | 4918 | 91 | 292 | 62 |
| NH3 volatilization | 320 | 6 | 119 | 25 |
| Denitrification in soils | 191 | 3 | 62 | 13 |
| Σ output | 5429 | 100 | 473 | 100 |
| Input-output | 1727 | 264 | ||
| Farm Extension (ha) Involved in the RDP Measurement | Payments to Farmers Deriving from RDP Measures Adoption (€) | Erosion Protection Value (€) | Erosion Decrease (%) | Water Regulation and Supply Value (€) | CO2 Sequestration (Surface Layer) (€) | Biodiversity | Fertility Soil Improvement | Fuels Use Saving as Avoided CO2 (€) | |||
|---|---|---|---|---|---|---|---|---|---|---|---|
| F1 farm | |||||||||||
| Scenario T0 | 189.73 | 44,850 | medium | ||||||||
| Scenario T1 | 55.09 | 8264 | 4451 | 17 | 6170 | 68,312 | - | good | 319 | ||
| Scenario T2 | 157.41 | 39,354 | 19,270 | 74 | 17,630 | 395,257 | >1.5–4 time number of earthworms | good | 913 | ||
| Scenario T3 | 179.98 | 50,940 | 24,893 | 95 | 30,956 | 451,922 | >1.5–4 time number of earthworms | good | 1043 | ||
| F2 farm | |||||||||||
| Scenario T0 | 118.4 | 27,934 | medium | ||||||||
| Scenario T1 | 31.11 | 4667 | 4656 | 19 | 3484 | 38,576 | - | good | 180 | ||
| Scenario T2 | 88.89 | 22,222 | 17,747 | 74 | 9956 | 223,203 | >1.5–4 time number of earthworms | good | 515 | ||
| Scenario T3 | 120.16 | 32,414 | 22,726 | 94 | 20,667 | 301,712 | >1.5–4 time number of earthworms | good | 697 | ||
| F1 farm | Scenario T0 | Scenario T1 | Scenario T2 | Scenario T3 | F2 farm | Scenario T0 | Scenario T1 | Scenario T2 | Scenario T3 | ||
| Farm Extension (ha) Involved in | the RDP Measurement | 189.73 | 55.09 | 157.41 | 179.98 | 118.4 | 31.11 | 88.89 | 120.16 | ||
| Payments to Farmers Deriving from RDP Measures Adoption (€) | 44.85 | 8264 | 39,354 | 50.94 | 27,934 | 4667 | 22,222 | 32,414 | |||
| Erosion Protection Value (€) | 4451 | 19,27 | 24,893 | 4656 | 17,747 | 22,726 | |||||
| Erosion Decrease (%) | 17 | 74 | 95 | 19 | 74 | 94 | |||||
| Water Regulation and Supply Value (€) | 6170 | 17.63 | 30,956 | 3484 | 9956 | 20,667 | |||||
| CO2 Sequestration | (Surface Layer) (€) | 68,312 | 395,257 | 451,922 | 38,576 | 223,203 | 301,712 | ||||
| Biodiversity | - | >1.5–4 time number of earthworms | >1.5–4 time number of earthworms | - | >1.5–4 time number of earthworms | >1.5–4 time number of earthworms | |||||
| Fertility Soil Improvement | medium | good | good | good | medium | good | good | good | |||
| Fuels Use Saving as Avoided CO2 (€) | 319 | 913 | 1043 | 180 | 515 | 697 | |||||
Publisher’s Note: MDPI stays neutral with regard to jurisdictional claims in published maps and institutional affiliations. |
© 2021 by the authors. Licensee MDPI, Basel, Switzerland. This article is an open access article distributed under the terms and conditions of the Creative Commons Attribution (CC BY) license (https://creativecommons.org/licenses/by/4.0/).
Share and Cite
Morri, E.; Santolini, R. Ecosystem Services Valuation for the Sustainable Land Use Management by Nature-Based Solution (NbS) in the Common Agricultural Policy Actions: A Case Study on the Foglia River Basin (Marche Region, Italy). Land 2022, 11, 57. https://doi.org/10.3390/land11010057
Morri E, Santolini R. Ecosystem Services Valuation for the Sustainable Land Use Management by Nature-Based Solution (NbS) in the Common Agricultural Policy Actions: A Case Study on the Foglia River Basin (Marche Region, Italy). Land. 2022; 11(1):57. https://doi.org/10.3390/land11010057
Chicago/Turabian StyleMorri, Elisa, and Riccardo Santolini. 2022. "Ecosystem Services Valuation for the Sustainable Land Use Management by Nature-Based Solution (NbS) in the Common Agricultural Policy Actions: A Case Study on the Foglia River Basin (Marche Region, Italy)" Land 11, no. 1: 57. https://doi.org/10.3390/land11010057