Article

Substituting Organic Fertilizer for Chemical Fertilizer: Evidence from Apple Growers in China

1
College of Economics and Management, China Center for Food Security Studies, Nanjing Agricultural University, Nanjing 210095, China
2
Department of Agricultural Economics, Sociology, and Education, Penn State University, University Park, PA 16802, USA
*
Author to whom correspondence should be addressed.
Land 2021, 10(8), 858; https://doi.org/10.3390/land10080858
Submission received: 16 June 2021 / Revised: 3 August 2021 / Accepted: 12 August 2021 / Published: 16 August 2021
(This article belongs to the Section Soil-Sediment-Water Systems)

Abstract

:
This study investigates the key factors affecting farmers’ decisions to use chemical fertilizer and/or organic fertilizer in Chinese apple production. This study calculates partial output elasticities and elasticities of the substitution between organic and chemical fertilizer, using a stochastic frontier production function model and data for 2017–2019. Subsequently, it analyzes how different sales channels impact the partial output elasticities of organic fertilizer. It also examines the impact of economic incentives on organic fertilizer use and technical inefficiency levels in apple production. The empirical results indicate that the organic matter in organic fertilizer has a medium level of substitutability with nitrogen, phosphorus, and potassium in chemical fertilizer. Further, the results indicate that an increase in the total number of available sales channels incentivizes farms to use more organic fertilizer to optimize apple quantity at the expense of the quality. Contrary, the use of any of the three most commonly used sales channels among apple growers (dealer door-to-door purchases, enterprise sales for juice pressing, and apple brokers) has the opposite effect on the use of organic fertilizer. From these findings, the subsidized provision of organic fertilizer and educating apple farmers about the economic and ecological benefits of sustainable land management measures are suggested. Finally, the study suggests measures to improve farmers’ income, sustainable land management, and lowering the footprint of chemical fertilizers in apple production in China.

1. Introduction

Since the green revolution, chemical fertilizers have played an indispensable role in agricultural production, and have seen a significant increase in global utilization [1,2]. In Chinese agriculture, chemical fertilizers increased crop production by nearly two-thirds (approximately 65%) [3,4]. However, recent evidence indicates an excessive use of chemical fertilizers (the sum of the NPK nutrients) in China (341 kg per hectare), which is higher than the international environmental safe use limit—that is, 225 kg per hectare [5,6]. Further, when it comes to fruit plants, the average per hectare application of chemical fertilizers in China is more than twice that of Japan, and 6–7 times that of the United States and the European Union, respectively [7]. In recent years, the amount of chemical fertilizer used in apple orchards, in various provinces of China, ranged from 600 to 2010 kg per hectare (the sum of the NPK nutrients)—indicating both a high level of use and large differences in application between provinces (National Bureau of Statistics of China, 2013–2019. Compilation of National Agricultural Product Costs and Benefits of 2013–2019. Available online: https://data.cnki.net/yearbook/Single/N2019120280 (accessed on 7 March 2021)). Excessive chemical fertilizer application has been widely documented to adversely affect the physical and chemical properties of soil, such as the compaction and acidification of the soil [8,9]. Correspondingly, it negatively impacts crop quality, causes non-point source water pollution, and releases nitrous oxide (N2O), a greenhouse gas that contributes to climate change [10,11]. Moreover, from the perspective of economic efficiency, excessive application of chemical fertilizer has led to an increase in agricultural production costs that, in turn, has reduced the international competitiveness of Chinese agricultural products [7,12,13]. This suggests that evidence is needed to address the role of various factors affecting the use of organic fertilizer and chemical fertilizer at the farm level.
Recent studies suggest a broader promotion of organic fertilizer as an alternative to chemical fertilizer [14,15,16,17]. The application of commercial organic fertilizers is becoming increasingly extensive because of the expanding market for organic food [18]. In China, commercial organic fertilizers have two agricultural industry standards (NY525-2012 and NY884-2012), which govern organic content, acceptable pH, worm mortality, and number of fecal coliforms. The former standard is for organic fertilizer without effective living bacteria, and the latter is for bioorganic fertilizer with effective living bacteria. This study of organic fertilizer mainly refers to these two types. Organic fertilizers also contain a range of micronutrients, trace elements, physiologically active compounds, etc., while chemical (mineral) fertilizers are mainly based on N, P, and K, with some supplemental microelements (this study follows the convention in the literature [5,12,14,15,16,17,19,20] of referring to inorganic (mineral) fertilizer as chemical fertilizer). In terms of the net benefits to the farmers and soil, organic fertilizer has several advantages over chemical fertilizer [19]. First, organic fertilizer increases the soil microbial activity, which transforms the already available N, P, and K into forms that can be easily absorbed by plants, and therefore improves soil productivity [20]. Second, the application of organic fertilizer can significantly increase the total porosity and soil organic matter, improving the soil’s physical and chemical properties [21]. Third, the organic matter and humus in organic fertilizer can improve the utilization rate of chemical fertilizer by improving the soil water-holding capacity and conserving moisture in upland areas, preventing irrigated fields from hardening, which leads to improvement in root nutrient uptake [22]. Fourth, the application of organic fertilizer can significantly improve crop quality, by promoting nutrient balance, coordinating nitrogen supply performance, and enhancing carbon and nitrogen metabolism [23].
Organic fertilizers provide numerous advantages over chemical fertilizers, yet their application is limited in China. Notably, Yang and Fang [24] reported that the use of organic fertilizer is decreasing among Chinese farmers. Several factors affect the broader use of organic fertilizer. First, farmers need to utilize four times more organic fertilizer materials than chemical fertilizer materials (in quantity terms), to achieve the same yield potential [25]. Second, most of the farmers in China produce low-value agricultural commodities—such as wheat and rice—which usually require extensive chemical fertilizer to ensure profitability [26,27]. Third, a high degree of land fragmentation, fragile environment, and farmers’ inadequate training and knowledge negatively affect the adoption of organic fertilizer at the farm level [28]. Fourth, the higher costs associated with organic fertilizers materials—almost four times higher, per kg, than chemical fertilizers materials in China—limit their use among smallholder farmers. However, China provides a range of unparalleled supports to promote organic farming, such as supporting on-farm infrastructure, subsidizing organic certification, marketing assistance, and farmers’ training. Arguably, promoting the use of organic farming for high-value products—such as apples and peaches —holds significant economic benefits for farmers, because these products can bring a premium price in the broader consumer market in China. Further, utilizing multiple sales channels might help realize a broader use of organic fertilizer and, therefore, reduce the use of chemical fertilizer [27]. According to Läpple [29], high volatility in premium prices for organic commodities discourages the organic promoting practices at the farm level. Many researchers argue that this variation could be reduced through improved access to multiple sales channels, which offers farmers greater flexibility to adjust their sales channels, based on transaction costs, to achieve higher prices and profits [27,30,31]. Rebelo et al. [32] found that the choice of sales channel significantly affects the price premiums received for wine in Europe. Despite the considerable transformation in agricultural value chains, the apple market in China is still characterized by high transaction costs, creating significant market uncertainties for apple producers [33,34]. While price premiums have a significant role to play in determining the profitability of organic products, there remain major knowledge gaps, regarding whether and how this process will unfold in China.
Recent evidence revealed that organic producers face difficulty in selling their agricultural products [35]. Existing literature has also explored the role of the farming experience, part-time employment, farm credit, agriculture advisory service, and social capital, on the adoption of organic fertilizer [6,28,36,37]. Abebe and Debebe [38] explored the influence of household head age, family labor, and livestock holding, on the use of organic fertilizer. Likewise, the influence of risk attitudes [39,40], factor substitution [6,41], land characteristics [42,43], policy impacts [28,44,45], and farm size [17,46] on the application of organic fertilizer(s) has been rigorously explored. Yet, there is a lack of evidence regarding the role of multiple sales channels on the use of organic fertilizer in China. Studying the influence of sales channels on the use of organic fertilizer is important for several reasons. First, rural and urban citizens’ higher income and consumption structure in China has increased, several-fold, the demand for organic products. Second, it may help policymakers transform value chains, to ensure a year-round continuous supply of abundant and nutritious food. Third, promoting organic fertilizer(s) through multiple sales channels can broaden the range of organic commodities on both the producer and consumer ends. Fourth, as the global organic food market is rapidly expanding, organic products’ prices are generally 30–80% higher in China than non-organic products, and the global price premium is generally higher than 50% (data were obtained from the Baibai Safety Net; available online: https://www.bbaqw.com/cs/102491.htm (accessed on 3 February 2021)). In a market economy, a greater demand for organic products drives production decisions and supply, leading farmers to increase the application of organic fertilizers. Developing an understanding of how the diversity of sales channels affects farmers’ decision-making for organic and chemical fertilizer, will provide an insight into the ways to promote organic fertilizer while reducing the use of chemical fertilizer.
To summarize, the previous literature has primarily investigated the application of chemical and organic fertilizer separately. Little research has paid attention to the relationship and extent of substitution between organic fertilizer and chemical fertilizer, at the farm level. To this end, we developed a conceptual framework of organic fertilizer use and sales channels, to elaborate on the posited context (see Figure 1). This framework illustrates the relationship between organic fertilizer and chemical fertilizer, and provides insights that can help promote organic fertilizer while reducing the use of chemical fertilizer. This study investigates the key factors affecting farmers’ decisions to use chemical and/or organic fertilizer in Chinese apple production. China is the largest producer of apples, accounting for about one-half of the global production, and apples rank first in China among fruits, in terms of the planted area. To accomplish this objective, first, this study develops a stochastic frontier production function model and uses farm-level data for 2017–2019. Second, we use the production function results to calculate the farm- and year-specific partial output elasticities for apples, with respect to organic fertilizer and chemical fertilizer. Third, it uses the production function results to calculate the elasticities of substitution between organic and chemical fertilizer. Fourth, it analyzes how different sales channels for apples impact the partial output elasticities of organic fertilizer and, in turn, the economic incentives to use organic fertilizer. Finally, it explores how different sales channels affect the levels of technical inefficiency in apple production in China.
The rest of the paper is organized as follows. Section 2 presents the data and methods. The empirical results are presented and discussed in Section 3. Section 4 presents the conclusions and a way forward.

2. Data and Methods

2.1. Data

The data used in this study consist of farm-level inputs, outputs, sales channels, and control variables for apple farms from Shaanxi Province, China. Data were collected for three years (2017–2019) in 54 villages located in four counties (Huangling, Luochuan, Pucheng, and Yanchuan), from 459 farms—containing 1377 observations in total (see Figure 2). Shaanxi ranks third among Chinese provinces in apple production, and it is one of three provinces in the Loess Plateau (along with Shanxi and Gansu provinces) that together account for about half of Chinese apple production.

2.1.1. Output and Input Variables

There are the following two output (yield) variables: the first measures output in quantity (kilograms) per hectare, while the second measures output in value (yuan) per hectare. The second output variable captures both quantity and quality insofar as quality influences prices received for apples. Inputs in the dataset include organic fertilizers, chemical fertilizers, hired labor, family labor, machinery, and other material inputs (primarily pesticides and irrigation water). Similarly to output, these inputs could be measured in value terms or physical units. Instead of choosing between these two options, this study uses them both by running two sets of regressions, a first set where inputs are measured in value terms (yuan per hectare) and a second set where inputs are measured in physical units per hectare. When using physical units, organic fertilizer is measured by the kilograms per hectare of organic matter, nitrogen, phosphorus, potassium, and the number per hectare of bacteria in the fertilizer. Manure is included as a separate input, distinct from organic fertilizer, which is purchased from off-farm suppliers. Chemical fertilizer is measured by the kilograms per hectare of nitrogen, phosphorus, and potassium. Labor is divided into family labor and hired labor, both measured in hours per hectare. Machinery is measured by its power in kilowatts per hectare.
Table 1 presents variable definitions and summary statistics. On average, the farms in the sample spend about twice as much on chemical fertilizer as on organic fertilizer per hectare. In quantity terms, the average total NPK (the sum of the three nutrients) is about 1761 kg per hectare for chemical fertilizer versus about 746 kg per hectare for organic fertilizer. In contrast, on average, the organic fertilizer applied has more P than N or K, while the opposite is the case for chemical fertilizer.

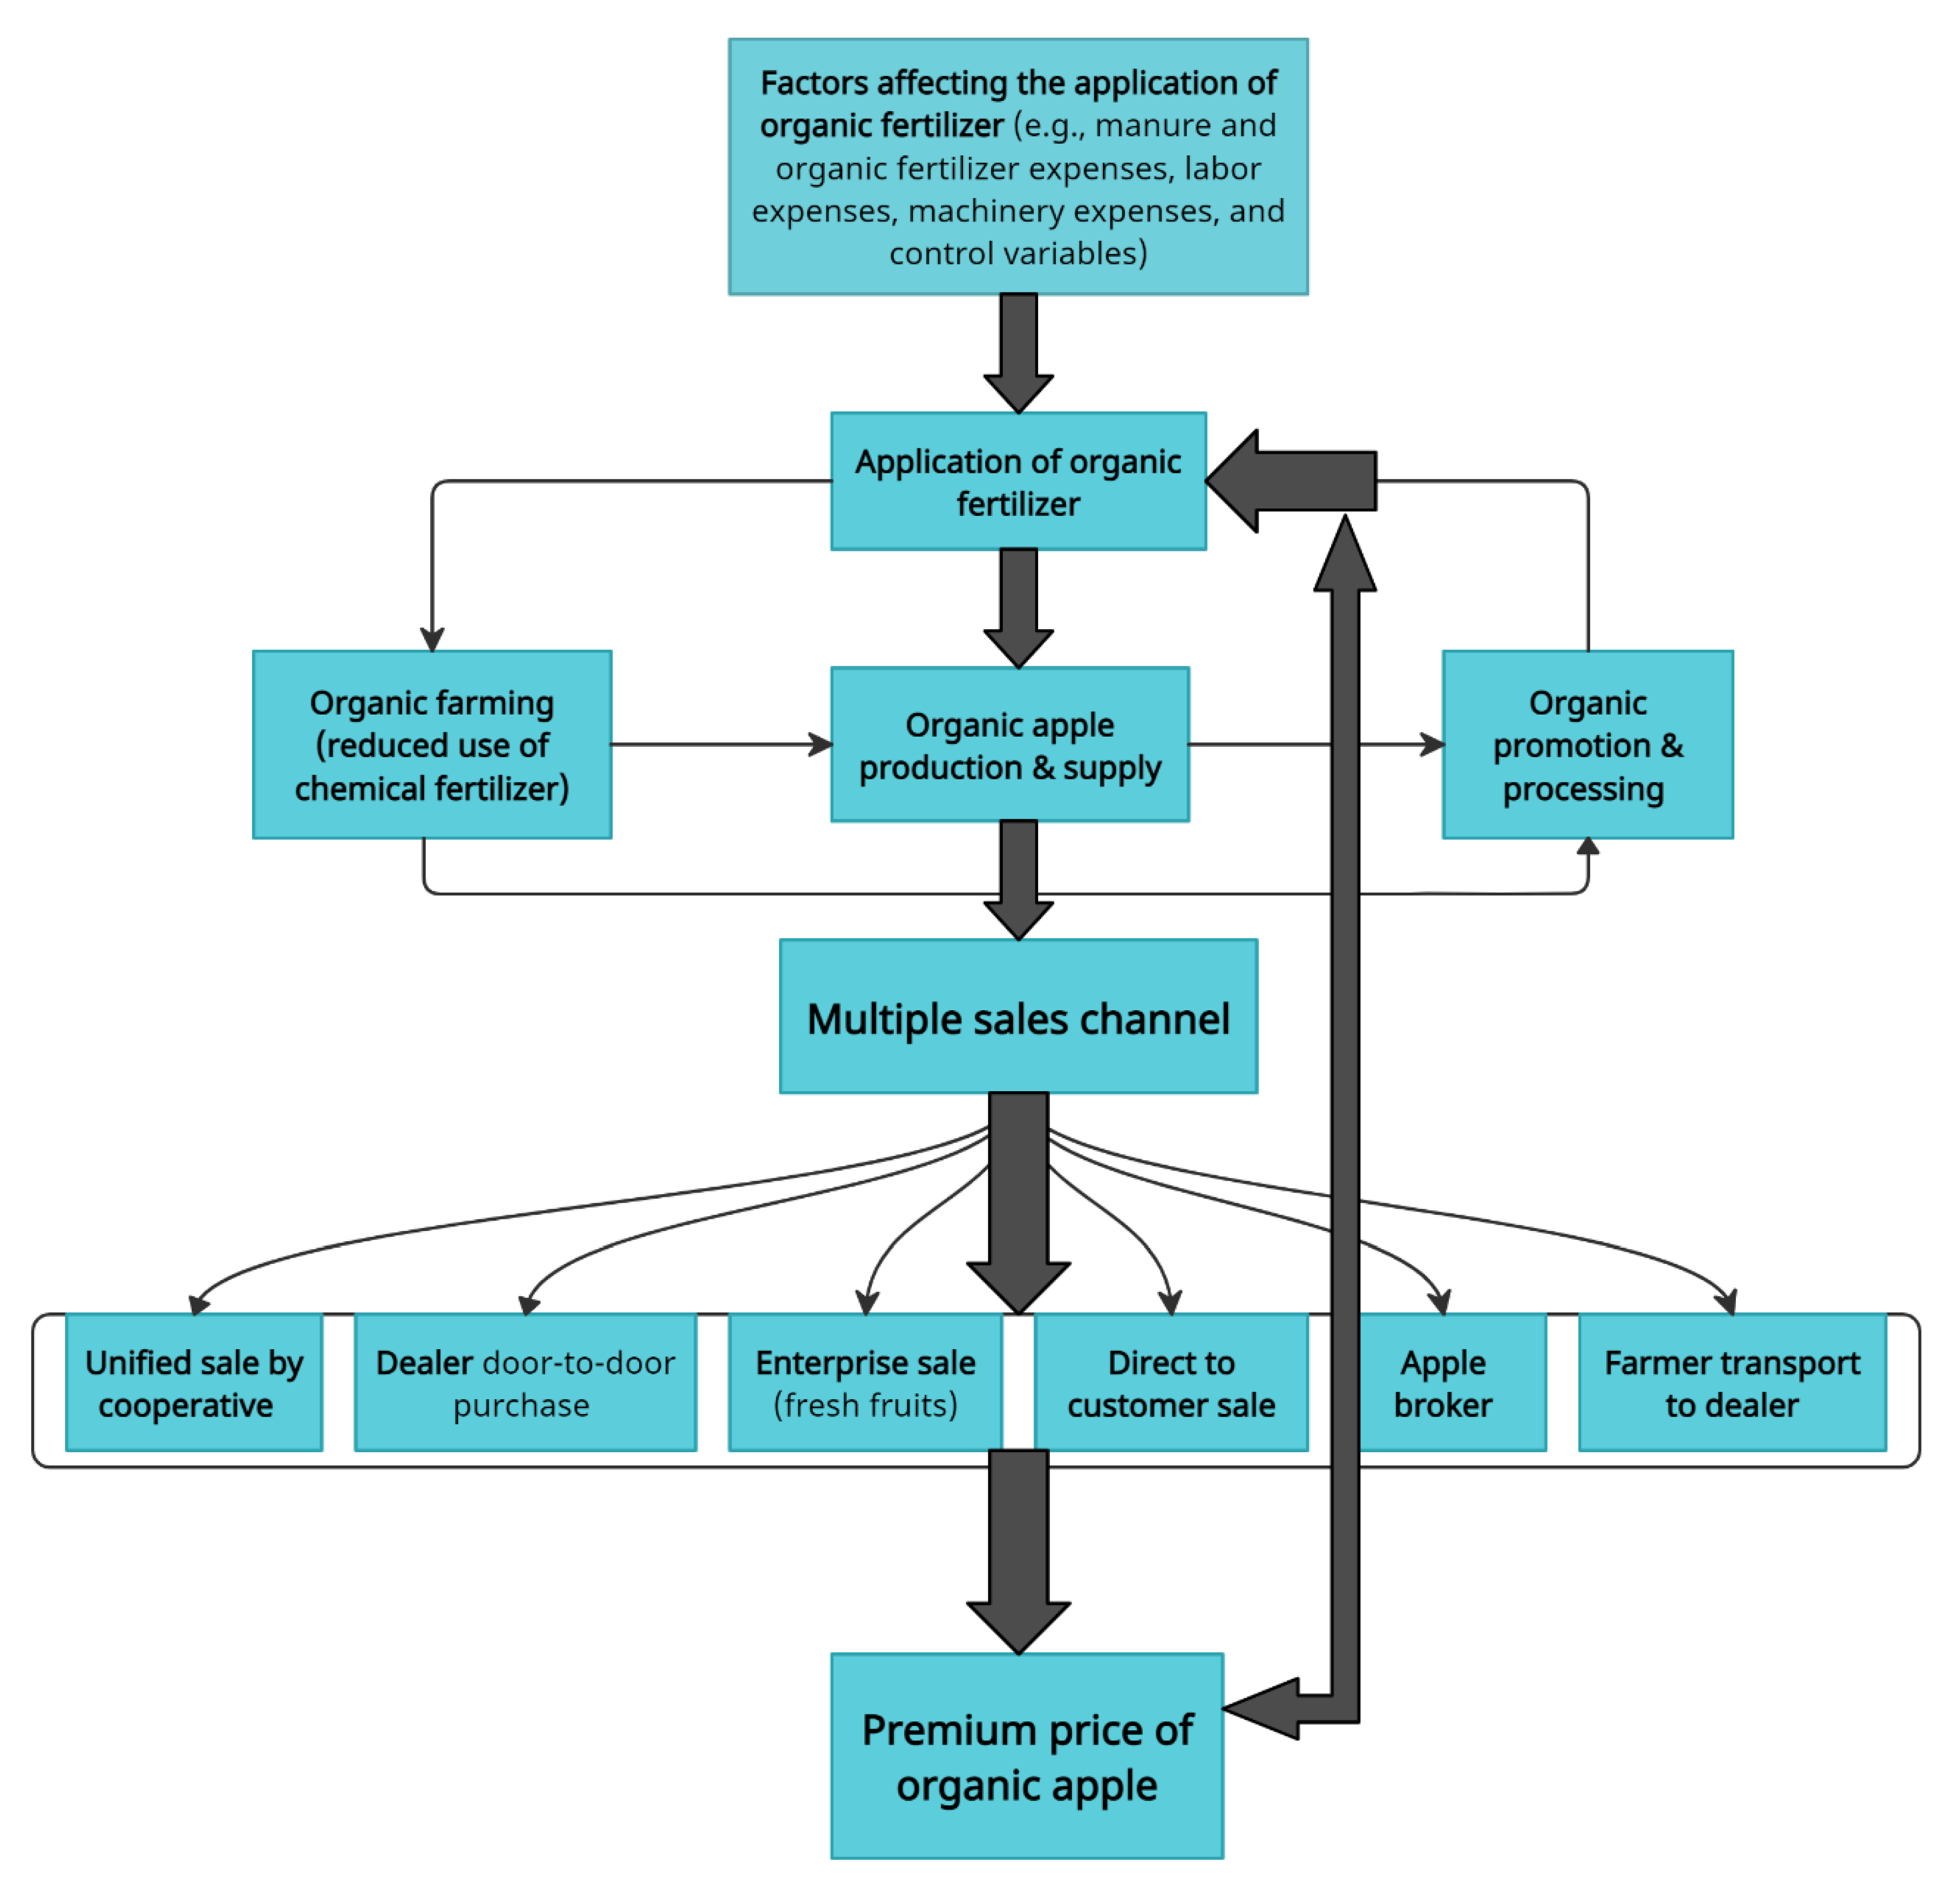
2.1.2. Sales Channels

The availability of various sales channels was measured by the total number of sales channels a farm has. We used dummy variables for whether a farm has individual sales channels. Sales channels were categorized as follows: (1) unified sales by cooperatives, (2) dealer door-to-door purchases, (3) enterprise sales (fresh fruit), (4) direct-to-consumer sales, (5) apple broker, (6) enterprise sales (juice pressing), and (7) farmers transporting apples to dealers. In this study, we define having a sales channel as using that channel at least once during the three years 2017–2019. A farm might or might not use a specific channel in any given year, depending on the price offered by that channel and the farmer’s apple crop quality that year. For example, a low-quality crop may be more likely to be used for juice pressing, while high-quality produce may be more likely to be sold directly to consumers.
Table 2 presents summary statistics for the sales channel variables. Every farm has at least one sales channel, and on average, farms have about 1.6 sales channels in total. The most common sales channel is dealer door-to-door purchases (85%), followed by enterprise sales (juice pressing) (57%) and apple brokers (12%). The least common sales channel is unified sales by cooperatives (0.4%), followed by direct-to-consumer sales (1.7%).

2.1.3. Control Variables

This study includes variables measuring farm-specific environmental conditions for growing apples as control variables. A series of dummy variables are included, measuring farmers’ perceptions of the quality of their soil—whether the soil lacks certain nutrient(s), the soil lacks nothing, or the farmer does not know what, if anything, the soil might lack. Control variables also include the number of years a farmer believes a newly planted apple tree on that farm would require before it begins to bear fruit. Likewise, a dummy variable is included to capture a farmer’s perception of whether the current year represents a high point or low point in the apple production cycle on his farm. Apple production tends to be cyclical because older plants have the following alternate bearing problem: when yields are high one year, they tend to be low the next. Further, the percentage loss in the farm’s apple production due to natural disasters was included as a control variable, and a dummy variable was included for whether or not the farm has received a subsidy for organic fertilizer. Climate variables include the following: (1) average total rainfall from 15 March to 30 September, (2) average daily hours of sunlight from 15 March to 30 September, and (3) average daily temperature during three periods (15 March–15 April, 16–30 April, and 1 May–30 September). County dummy variables were also included as control variables in some of the regressions. Definitions and summary statistics for the control variables are presented in Table 3.
One interesting point in Table 3 is that 77% of apple farmers in the study sample were not aware of what soil nutrients, if any, their soil might lack. Other studies have also found a lack of knowledge among farmers in China about soil quality and plant nutrients [47,48].

2.2. Production Function, Partial Output Elasticities, and Elasticity of Substitution

2.2.1. Stochastic Frontier Production Function

This study uses the stochastic frontier production function proposed by Aigner et al. [49] and Meeusen and van Den Broeck [50]; the following expression indicates its general form:
l n y i = f ( x i ; β ) + v i u i ,           i = 1 , , N
where y i is the output of farm i , x i is a vector of inputs, typically in logarithms, β is a parameter vector, f ( · ) is a function of the inputs and parameters, v i is a random variable capturing measurement errors and other sources of non-systematic statistical noise, and u i is a non-negative random variable representing technical inefficiency (the farm’s distance from the technological frontier). Further, v i is usually assumed to follow a normal distribution that is independent of u i , while u i is assumed to follow one of a number of distributions, such as the half-normal [49], truncated normal [51], or gamma [52].
Schmidt and Sickles [53] proposed a panel stochastic frontier model that is more suitable for panel data. It takes the following general form:
l n y i t = f ( x i t ; β ) + v i t u i ,           i = 1 , , N ;     t = 1 , , T
where the subscript t represents time. The technical inefficiency term in Equation (2), u i , is not indexed on time, meaning that a farm’s level of inefficiency is time-invariant. Fixed effects or random effects methods can be used to estimate this model under different conditions. Other estimators can be found in the literature [54,55,56].

2.2.2. Translog Model

Equation (2) presents a general production model in which the form of f ( · ) must be specified to estimate the model. One popular form, which this study uses, is the transcendental logarithmic (translog), as follows:
l n y i t = α t + j = 1 M β j l n x i j t + 0.5 j = 1 M k = 1 M β j k ( l n x i j t ) ( l n x i k t ) + l = 1 L θ l z i l t + v i t u i , i = 1 , , N ;   j , k = 1 , , M ; l = 1 , , L ;   t = 1 , , T
The parameters to be estimated are α t (the intercept for time t ), the β j , β j k , and θ l . Output ( y i t ) in this study is measured in the following two ways: yield in kilograms per hectare, and the value of output in yuan per hectare. The expression x i j t indicates inputs, including chemical fertilizer, organic fertilizer, family labor, hired labor, machinery, and other inputs. The expression z i l t refers to control variables. The parameters on the input interaction terms are symmetric, i.e., β j k = β k j for all j and k . The translog is a flexible functional form that allows for varying relationships between each input and output, and different degrees of substitutability between inputs.
This study uses a procedure developed by Battese and Coelli [54] to estimate the parameters of Equation (3). In this procedure, the terms v i t are assumed to be independently and identically distributed (iid), with the distribution being normal with a zero mean. Moreover, the u i are iid with a truncated normal distribution. The assumption that a farm’s level of inefficiency is time-invariant is reasonable in this study because the study’s panel data span only three years (2017–2019), rather than a longer period over which a farm could learn from experience and improve its efficiency.

2.2.3. Partial Output Elasticities

The partial output elasticity of an input is the relative change in output caused by a relative change in the input, under the condition that the quantities of the other inputs and the level of technical efficiency remain unchanged. Given the translog production function in Equation (3), the partial output elasticity for input j on-farm i at time t is given as follows:
η i j t = l n y i t l n x i j t = β j + k = 1 M β j k l n x i k t
The impact of a change in input k on the partial output elasticity for input j depends on the value of β j k . In particular, whether the partial output elasticity of input j increases, stays the same, or declines as use of that input increases depends on the sign of β j j . In terms of the marginal product of input j , a sufficient condition to satisfy the standard assumptions that it is positive and diminishing in the quantity of that input is 0 < η i j t < 1 and β j j 0 .
Partial output elasticities for chemical and organic fertilizer are of greater interest because they directly affect the incentives to use those inputs. Omitting the subscripts for the farm ( i ) and time ( t ) for ease of exposition, profit maximization implies that x j / y = ( p / w j ) η j , where p is the output price and w j is the cost of input j . Holding prices constant, a larger value for η j implies a larger ratio x j / y .

2.2.4. Direct Elasticity of Substitution

The direct (or Hicks) elasticity of substitution is defined as the relative change in the ratio of two inputs divided by the relative change in the marginal rate of substitution between these two inputs, under the assumption that output is held constant and the level of technical efficiency remains unchanged. Given the translog production function in Equation (3), and for ease of exposition omitting the subscripts for farm ( i ) and time ( t ), the direct elasticity of substitution between inputs j and k ( j k ) is given by the following [57]:
σ j k = l n ( x j / x k ) l n ( M P k / M P j ) = ( η j + η k ) / [ η j + η k + 2 β j k β j j ( η k / η j ) β k k ( η j / η k ) ]
where M P j is the marginal product of input j . Under the standard assumptions that the marginal products of inputs are positive and the production function is quasi-concave, it can be shown that σ j k > 0 . The translog production function is not necessarily quasi-concave at all input levels. Still, real-world conditions such as non-divisible inputs or restrictions on input usage can give rise to non-quasi-concavity [58].
In this study, the elasticities of substitution are of key interest because they measure the technical feasibility of substituting one input for another, chemical fertilizer and organic fertilizer. The greater the value of an elasticity of substitution, the easier it is for apple producers to substitute chemical and organic fertilizer.

2.3. Sales Channels and Partial Output Elasticities for Chemical and Organic Fertilizer

This study uses regression models to estimate the impacts of different sales channels for apples on the time-specific partial output elasticities for chemical and organic fertilizer. Using the stochastic frontier model estimation results and the estimated partial output elasticities ( η ^ i j t ) calculated from Equation (4), the regression models are of the following form:
η ^ i j t = γ j + h = 1 H λ h s i h t + l = 1 L φ l z i l t + e i j t
where the s i h t are measures of the sales channels used by farm i during time t , the z i l t are control variables, the e i j t are iid random errors with zero mean, and the γ j , λ h , and φ l are parameters to be estimated.

2.4. Sales Channels and Technical Inefficiency

This study uses regression models to estimate the impacts of different sales channels for apples on the time-specific estimated values of technical inefficiency. Since u i is a non-negative random variable representing technical inefficiency (the farm’s distance from the frontier), this study estimates the following regression models:
u ^ i = δ + h = 1 H ρ h s i h + l = 1 L μ l z i l + ε i
where u ^ i is estimated technical inefficiency based on the stochastic frontier model estimation results, the s i h are measures of the sales channels used by farm i over the three-year period 2017–2019, the z i l are averages of the control variables for 2017–2019, the ε i are iid random errors following a truncated normal distribution, and δ , ρ h , and μ l are parameters to be estimated.

3. Estimation Results and Discussion

3.1. Partial Output Elasticities

Table 4 reports the estimated mean partial output elasticities when the inputs are measured in value terms. It represents the results based on the frontier production function in Equation (3) (see Appendix A, Table A1). The dependent variable in panel A is the log of yield quantity (kilograms per hectare), while in panel B, it is the log of yield value (yuan per hectare). The results in panels A and B are mostly consistent, except for organic fertilizer and family labor. The estimated mean partial output elasticity for organic fertilizer is positive and statistically significant in Panel A. In contrast, it is not statistically significant in Panel B. These results suggest that spending more on organic fertilizer is not associated with a change in the market price received by smallholders for apples, i.e., there does not appear to be a price premium associated with organic fertilizer expenditures. This is consistent with Uematsu and Mishra’s finding that certified organic farmers do not earn significantly higher incomes than conventional farmers, implying that a lack of economic incentives can be an important barrier to using more organic fertilizer [59]. The estimated mean partial output elasticities for chemical fertilizer expenditures are positive and statistically significant. One unexpected finding is the very high partial output elasticities for the “other input” category. This might reflect that this category includes irrigation, since water is a strongly scarce input for apple production in the Loess Plateau. Similar findings have been reported by Dai et al. [60], implying that water optimization plays a significant role in apple nitrogen uptake in the Loess Plateau of China. Thus, it indicates that the scarcity of key inputs in the regional context cannot be ignored while assessing the use of any sustainable land management technology and/or organic fertilizer. It significantly affects farmers’ decision-making.
These findings suggest that the application of organic fertilizers and sustainable land management themes can be promoted via linking them with the subsidized provision of advanced irrigation systems (i.e., drip irrigation), which supports the use of organic fertilizers. Further, incentives for using other sustainable land management strategies, such as the subsidized provision of organic fertilizer, could foster their broader use at the farm level.
Table 5 reports the estimated mean partial output elasticities when the inputs are measured in physical units. Except for the “other input” category, which is measured in value terms, because it combines different inputs, we measured all the inputs in physical units. Again, these results are based on the estimation results for the frontier production function in Equation (3) (see Appendix A, Table A2). The dependent variable in panel C is the log of yield quantity (kilograms per hectare), while in panel D, it is the log of yield value (yuan per hectare). The results in panels C and D are mostly consistent. The estimated mean partial output elasticities for organic matter in organic fertilizer are positive and significant in panels C and D. The estimated mean partial output elasticity for bacteria count in organic fertilizer is negative and significant in panel D. The differences between the estimated mean partial output elasticities for organic matter in panels C and D are not significant. These results once again find that the application of organic fertilizer is not related to receiving a premium price. Hence, they suggest that regional factors—such as climate, soil quality, and irrigation water availability—play a more important role in the use of organic fertilizer. Arguably, these results indicate that sustainable land management strategies have spatial differences in their uptake, which are largely attributed to the suitability of various measures that are implemented by farmers.
In contrast to organic fertilizer K, the estimated mean partial output elasticities for chemical fertilizer K are positive and significant in panels C and D. The estimated mean partial output elasticities for organic fertilizer P and chemical fertilizer P are not significant. Chemical fertilizer P has a low absorption rate in the semi-arid climate of the Loess Plateau, because the unavailability of ample irrigation affects the potential uptake of P by apple plants. Regarding this finding, prior results lend support, by indicating that organic fertilizer has no obvious effect on promoting phosphorus utilization in plants [12]. The ratio of P in chemical fertilizer, among the sampled farms to that in organic fertilizer, is about 1.5, which is less than the corresponding ratios for nitrogen (2.8) or potassium (3.2). However, considering that chemical fertilizer P has a low absorption rate in the semi-arid climate of the Loess Plateau [12], there may be room for policy approaches that encourage apple farmers to reduce chemical fertilizer and increase the use of organic fertilizer as a source for P. The estimated mean partial output elasticities for chemical fertilizer N and P, and organic fertilizer P and K, are not statistically significant. Similar to the results in Table 4, the results in Table 5 show that the estimated mean partial output elasticities for the “other input” category are positive, statistically significant, and quite large. Given these results, the adoption of organic fertilizer in a semi-arid climate might be a sound gauge for promoting sustainable land management, because it can improve the soil quality through improved water-holding capacity and soil organic matter. Likewise, promoting such measures could significantly improve farmers’ income and longer-term land-use sustainability, while reducing the footprint of chemical fertilizers on apple production.

3.2. Elasticities of Substitution between Organic Fertilizer and Chemical Fertilizer

The estimated mean values for the direct elasticities of substitution between organic fertilizer and chemical fertilizer are shown in Table 6. The estimates in the second column in Table 6 are based on the estimation results for the frontier production function in Equation (3), when the yield is measured in kg/ha. The estimates in the third column are based on the results when the yield is measured in yuan/ha. Thirteen of the twenty-point estimates in Table 6 are within the vicinity of one (±0.2), the Cobb–Douglas case, representing a medium level of substitutability between organic fertilizer and chemical fertilizer. Four of the other seven-point estimates involve chemical fertilizer P and are smaller—chemical P and organic matter (both when the yield is measured in quantity and in value), chemical P and bacteria (yield measured in value), and chemical and organic P (yield measured in value). These results are also consistent with the results reported in Table 4 and Table 5, namely, that chemical fertilizer P has a low absorption rate in the semi-arid climate of the Loess Plateau, and organic fertilizer generally does not enhance phosphorus utilization in plants [12]. Hence, it can be argued that the lower suitability and/or non-availability of appropriate technologies reduce the use of organic-promoting, sustainable land management measures in a semi-arid climate.
On a nutrient basis (N, P, and K), the substitutability between organic and chemical fertilizer is found as we expected. Notably, the results indicate the presence of substitutability between organic matter and bacteria in organic fertilizer and chemical fertilizer N, P, and K. This suggests that organic matter and bacteria can activate the N, P, and K that are already present in the soil, and, therefore, can help reduce the amount of chemical fertilizer needed to achieve a potential level of nutrient uptake by apple trees. These findings suggest that developing organic fertilizer that contains sufficient organic matter and bacteria might work as an effective tool to promote the broader use of organic fertilizer. Further, it can lead to the reduced use of chemical fertilizer and reduced cost of production, through optimizing the use of nutrients that are already available to plants. Moreover, a broader use of organic fertilizer can be a valuable tool for sustainable resource management—particularly water and land in semi-arid regions—where it can improve the ecological and economic benefits to local communities as well.

3.3. Sales Channels, Partial Output Elasticities for Organic Fertilizer and Technical Inefficiency

3.3.1. Partial Output Elasticities

In this study, one of the research questions seeks to answer the impact of different sales channels on apple production. Therefore, we need to find how these sales channels shape the production frontier in apple production and the distance of farms from this frontier. Table 7 reports the results based on the ordinary least squares (OLS) regression of the estimated partial output elasticities for organic matter, bacteria, and N, P, and K, in organic fertilizer, on the sales channels and control variables. There are two sets of results for the organic fertilizer variable, one with the yield measured in kg/ha and the other with the yield measured in yuan/ha.
The results in Table 7 indicate that the total number of available sales channels has no significant effect (organic matter and bacteria count), or a positive effect (organic N, P, K) on the partial output elasticities, when the yield is measured in quantity terms. However, when the yield is measured in value terms, the effect is significantly negative in all cases, except for bacteria count, where it is positive and significant. These results suggest that, in general, an increase in the total number of available sales channels provides incentives to use more organic fertilizer, to pursue apple quantity at the expense of quality, to the point where the value per hectare declines. Further, having multiple sales channels might reduce a farm’s incentive to pursue quality, since low-quality products that would sell at a low price in one channel might sell at a higher price in another channel. Hence, availing various sales channels might improve the apple growers’ gross income. Importantly, as discussed in the prior sections, arid climate, water scarcity, and the unavailability of suitable organic fertilizer in the Loess Plateau, increase the use of chemical fertilizer. Contrary, the results for bacteria count indicate that farmers are concerned with sustainable land management in organic apple production. Given these results, registration of apple growers and branding their products in terms of the sustainable land management measures and organic practices used, might create a differential change, where sales channels would also foster the uptake of sustainable land management measures in apple production.
Concerning individual sales channels, dealer door-to-door purchases (the most common sales channel, see Table 2) are estimated to have a positive and significant impact on the partial output elasticities for organic matter, organic N, organic P, and organic K, when the yield is measured in value terms. The effect on partial output elasticities for organic N and K is negative and statistically significant when the yield is measured in quantity terms. On the other hand, dealer door-to-door purchases are estimated to have a negative impact on the partial output elasticity for bacteria count, under both measures of yield. With this exception, dealer door-to-door purchases appear to incentivize the use of organic fertilizer, to shift away from a focus on apple quantity and towards a focus on quality, raising the value per hectare. It indicates that the direct contact of apple growers with dealer door-to-door purchases tends to focus on apple quality, rather than quantity. Thus, strengthening the linkage of dealers with farmers can promote the broader application of organic fertilizer among apple farmers. Further, this linkage could help boost the broader uptake of other sustainable land management measures, such as drip irrigation, animal manure, and crop rotation, which are quite appropriate remedies for the current state of sustainability issues in the Loess Plateau.
The enterprise sales for juice pressing (the second most common sales channel) are estimated to positively and significantly impact the partial output elasticities for organic matter, organic P, and organic K when the yield is measured in value terms. Likewise, this sales channel is estimated to have a significant negative impact on the partial output elasticities for organic N, organic P, and organic K. Similar to dealer door-to-door purchases, enterprise sales for juice pressing seem to incentivize the use of organic fertilizer, to shift away from quantity and towards quality. The story is also generally the same for apple brokers (the third most common sales channel) and direct-to-consumer sales. Farms with these four kinds of sales channels are using organic fertilizer to pursue apple quality. Interestingly, these findings indicate that the greater the extent of the direct contact of apple farmers with end consumers, the greater the demand for quality and, therefore, the application of organic fertilizer. Hence, transformation in the value chains linking farmers and end consumers would better drive the demand for quality, where price incentives can boost the application of organic fertilizer. These findings are consistent with empirical work by Lu et al. [61], finding that a greater economic transformation in China is creating profound opportunities for organic products. These results imply that greater consumer awareness could help stimulate a scalable adoption of sustainable land management practices hand-in-hand with organic production.

3.3.2. Technical Inefficiency

Table 8 presents the results of regression models estimating technical inefficiency as a function of the sales channels and control variables. Since we assumed that technical inefficiency does not change over time, the results in Table 8 are based on that assumption. In this study, we used the average prices of explanatory variables for 2017–2019, and accordingly applied regression models. The results from column 11, where the yield is measured in quantity terms, indicate that a larger number of available sales channels reduces the technical inefficiency. Enterprise sales for juice pressing and enterprise sales for fresh fruit are estimated, to increase the technical inefficiency. None of the sales channel variables are statistically significant in column 12, where the yield is taken in value terms. This implies that farmers adopt chemical fertilizers to maximize their output, where utilizing multiple sales channels can reduce the quality concerns and help receive higher prices. As these results are mixed, this suggests that having more sales channels can encourage farms to become more efficient, perhaps because additional sales channels represent additional sources of information for farmers, about the best practices in apple production. The results for enterprise sales might be due to inefficiencies arising as farms strive to meet the enterprise buyers’ production (quantity) expectations. Simultaneously, the results above, for the partial output elasticities, indicate that farms with enterprise sales for juice pressing complement apple quality. Those two factors, which offset each other, might explain why the enterprise sales are not significant in column 12. Arguably, the inclusion of quality attributes in apple pricing and marketing could help encourage the adoption of sustainable land management practices in apple production.
The results indicate that the unified sale by the cooperatives sales channel does not significantly impact the technical inefficiency. These results differ somewhat from Ma et al. [62], who found higher technical efficiency for apple farmers who are members of cooperatives than those who are not members. However, the results of this study are not directly comparable to theirs, because being a cooperative member is not the same as using the cooperative as a sales channel. The empirical work of Hao et al. [63] complements this study’s findings, implying that apple farmers who are cooperative members tend to utilize several sales channels, and only about 14% of the cooperative members in their survey sample utilized the cooperative as a sales channel. Another related, though not directly comparable study, by Ma and Abdulai [64], found that apple yields and farm household income were about 5% higher among apple farms that were cooperative members than those of nonmembers.

4. Conclusions, Policy Implications and Way Forward

Overuse of chemical fertilizer in China causes severe damages to soil physical and chemical properties, resulting in soil compaction, soil acidification, and non-point source water pollution. This study investigates the key factors affecting farmers’ decisions to use chemical fertilizer and/or organic fertilizer in Chinese apple production. Using a stochastic frontier production function model and data set for 2017–2019 from apple farms in the Loess Plateau, this study calculates the partial output elasticities and substitution elasticities between organic and chemical fertilizer. Further, it analyzes the following two-fold impacts: (1) how different sales channels for apple output marketing impact the partial output elasticities of organic fertilizer, and (2) whether different sales channels offer economic incentives to farmers to use organic fertilizer. Lastly, this work analyzes the effect of different sales channels on the levels of technical inefficiency in apple production. This study provides several insights into policy and practice. It extends the existing literature on the substitution effect of organic and chemical fertilizer, sales channels, pricing mechanisms for organic products, and sustainable land management measures.
The findings of this study provide several insights for farmers, policymakers, and institutions. First, the findings indicate that the partial output elasticities for organic matter in organic fertilizer are positive and statistically significant, both when the apple yield is measured in quantity terms (kg/ha) and value terms (yuan/ha). These results suggest that policy approaches that are directed at educating apple farmers about the benefits of organic matter in organic fertilizer, could promote greater use of organic fertilizer and less use of chemical fertilizer. Second, the findings indicate that organic matter in organic fertilizer has a medium level of substitutability (substitution elasticities around one) with nitrogen, phosphorus, and potassium in chemical fertilizer. Thus, the provision of organic fertilizer containing a sufficient amount of organic matter and bacteria can reduce the use of chemical fertilizer, hand-in-hand with the cost of production. Further, encouraging farmers to test their soil for nutrient deficiencies would offer a broader scope for better training farmers regarding the effectiveness of organic fertilizer and adopting related land management measures, i.e., drip irrigation, animal manure, and crop rotation. Third, the findings indicate that the partial output elasticity for phosphorus (P) in organic fertilizer is not significant, but neither is that for P in chemical fertilizer. Thus, promoting organic fertilizer use as a source for P and subsidized provision of advanced irrigation systems (i.e., drip irrigation), is recommended. Likewise, encouraging sustainable land management measures—such as crop rotation and animal manure—could help boost soil organic matter and water-holding capacity.
Lastly, the empirical results indicate that an increase in the total number of available sales channels drives output optimization decisions, which, in turn, incentivize farmers to use more organic fertilizer to pursue apple quantity at the expense of quality. At the same time, using any of the three most common sales channels (dealer door-to-door purchases, enterprise sales for juice pressing, and apple brokers) tends to induce apple quality, and therefore complements the use of organic fertilizer. These findings imply that the apple market in China is still characterized by high transaction costs, and significant price uncertainty exists for apple farmers. Policy actions that encourage apple market pricing mechanisms, based on quality attributes, could enhance price premiums for apple quality, and increase incentives to use organic fertilizer and related sustainable land management measures. Adopting these land management measures is desirable, since climate change and water scarcity have adversely affected apple production and farmers’ incomes in the Loess Plateau in China.
This study highlights several avenues for future research. First, the current study examines organic and chemical fertilizer substitution among smallholder apple growers. Future studies could compare the degree of substitutability, depending on the farm’s ownership and management structure—whether that involves landholders, shareholders, or renters. Second, future studies could compare the use of organic fertilizer among various marketing channels, such as forward contracting, online selling, and direct selling to consumers. Lastly, future studies could explore the impact of institutional factors on the substitutability of organic and chemical fertilizer, and broader implementation of sustainable land management among smallholders.

Author Contributions

P.F., D.A. and G.L. conceived and designed the study; P.F. and G.L. collected the data; P.F. and D.A. analyzed the data; P.F., D.A., G.L., A.S. and Q.Q. wrote the first draft paper; P.F., D.A., G.L. and A.S. contributed to revising the paper and adjusted the framing of the first draft and enriched it to the final draft for submission. All authors have read and agreed to the published version of the manuscript.

Funding

This work was funded by the National Natural Science Foundation of China (Grant number: 72073070; 71573135), and Jiangsu Agricultural Industry Technology System (JATS [2020] 428). For D.A., this work was supported in part by the US Department of Agriculture, National Institute of Food and Agriculture (Hatch project 1010333).

Data Availability Statement

Data sharing not applicable.

Conflicts of Interest

The authors declare no conflict of interest.

Appendix A

This Appendix presents the production function estimation results, with inputs measured in value terms (Table A1) and in physical units (Table A2). There are two sets of results in each case, one where the yield is measured in quantity terms (kg/ha) and one where the yield is measured in value terms (yuan/ha).
Table A1. Production function estimation results with inputs measured in value terms.
Panel A1-1Panel A1-2
(Yield is in kg/ha)(Yield is in yuan/ha)
VariablesCoeff.z-StatisticsCoeff.z-Statistics
ln(Manure expense) 0.0390.780.0330.49
ln(Organic fertilizer expense)0.0640.92−0.021−0.22
ln(Chemical fertilizer expense)0.1231.340.0790.64
ln(Hired labor expense)0.0230.560.0100.18
ln(Family labor expense)−0.390−1.05−0.333−0.67
ln(Machinery expense)0.0961.050.0690.56
ln(Other input expense)0.5450.983.130 ***4.22
ln(Manure expense) × ln(Organic fertilizer expense)−0.001 *−1.84−0.002 **−2.37
ln(Manure expense) × ln(Chemical fertilizer expense)0.003 ***3.860.004 ***4.18
ln(Manure expense) × ln(Hired labor expense)−0.000−1.14−0.001−1.07
ln(Manure expense) × ln(Family labor expense)0.0010.170.0051.08
ln(Manure expense) × ln(Machinery expense)−0.004 ***−3.45−0.006 ***−4.28
ln(Manure expense) × ln(Other input expense)−0.003−0.63−0.006−0.95
ln(Organic fertilizer expense) × ln(Chemical fertilizer expense)0.0011.140.0010.80
ln(Organic fertilizer expense) × ln(Hired labor expense)−0.001 *−1.88−0.001 **−2.48
ln(Organic fertilizer expense) × ln(Family labor expense)−0.010−1.58−0.001−0.09
ln(Organic fertilizer expense) × ln(Machinery expense)−0.001 *−1.71−0.002 *−1.81
ln(Organic fertilizer expense) × ln(Other input expense)0.0050.800.0040.46
ln(Chemical fertilizer expense) × ln(Hired labor expense)−0.001−1.55−0.001−1.25
ln(Chemical fertilizer expense) × ln(Family labor expense)−0.003−0.27−0.001−0.09
ln(Chemical fertilizer expense) × ln(Machinery expense)−0.003 **−2.52−0.003 **−2.14
ln(Chemical fertilizer expense) × ln(Other input expense)−0.007−0.83−0.003−0.25
ln(Hired labor expense) × ln(Family labor expense)−0.003−1.04−0.002−0.58
ln(Hired labor expense) × ln(Machinery expense)0.001 *1.7000.001 **2.09
ln(Hired labor expense) × ln(Other input expense)0.0040.870.0040.75
ln(Family labor expense) × ln(Machinery expense)−0.012−1.43−0.005−0.48
ln(Family labor expense) × ln(Other input expense)0.0611.500.0400.73
ln(Machinery expense) × ln(Other input expense)0.0030.39−0.003−0.36
ln(Manure expense) × ln(Manure expense)0.0031.580.006 **1.99
ln(Organic fertilizer expense) × ln(Organic fertilizer expense)0.0021.17−0.001−0.41
ln(Chemical fertilizer expense) × ln(Chemical fertilizer expense)0.008 ***5.660.009 ***4.55
ln(Hired labor expense) × ln(Hired labor expense)0.005 ***3.9400.009 ***5.5
ln(Family labor expense) × ln(Family labor expense)0.007 **2.220.009 **2.25
ln(Machinery expense) × ln(Machinery expense)0.0021.310.004 **2.15
ln(Other input expense) × ln(Other input expense)−0.043−1.37−0.164 ***−3.98
Control variables
Soil lacks N0.0890.52−0.056−0.25
Soil lacks K0.1601.300.1621.00
Soil lacks P0.1080.890.320 **2.01
Soil lacks trace elements0.1341.210.2331.61
Soil lacks organic matter0.0280.330.228 **2.03
Soil does not lack anything0.2591.120.2410.8
Years to bear fruit0.008 **2.28−0.005−1.00
Production cycle stage0.200 ***6.000.203 ***4.52
Natural disaster−0.005 ***−11.78−0.006 ***−10.93
Subsidy for organic fertilizer0.122 ***3.090.0691.31
Rain−0.000−0.27−0.000 *−1.76
Sunlight0.000 **2.23−0.001 ***−4.35
Temperature 1−0.006 **−2.380.017 ***4.7
Temperature 20.011 ***3.81−0.018 ***−4.41
Temperature 30.0000.420.003 **2.32
Constant5.3140.25−4.246−0.18
Sigma−0.970 ***−20.41−0.408 ***−8.68
Gamma−0.093−0.76−0.170−1.35
Mu2.6210.123.0060.13
Observations13771377
Number of farms459459
Note: *** p < 0.01, ** p < 0.05, * p < 0.1.
Table A2. Production function estimation results with inputs measured in physical units.
Panel A2-1Panel A2-2
(Yield is in kg/ha)(Yield is in yuan/ha)
VariablesCoeff.z-StatisticsCoeff.z-Statistics
ln(manure quantity)−0.013−0.44−0.028−0.71
ln(Organic matter)0.1871.29−0.132−0.63
ln(Bacteria count)−0.056−0.66−0.019−0.17
ln(Organic fertilizer N)0.0920.12−0.808−0.81
ln(Organic fertilizer P)0.0960.080.8100.52
ln(Organic fertilizer K)−0.159−0.100.1490.07
ln(Chemical fertilizer N)0.1730.43−0.359−0.66
ln(Chemical fertilizer P)−0.207−0.320.3940.45
ln(Chemical fertilizer K)0.0660.11−0.023−0.03
ln(Hired labor quantity)0.084 ***2.670.102 **2.42
ln(Family labor quantity)0.335 **2.290.2071.06
ln(Machinery quantity)0.307 ***2.710.325 **2.14
ln(manure quantity) × ln(Organic matter)0.008 ***10.680.013 ***10.27
ln(manure quantity) × ln(Bacteria count)−0.006 ***4.78−0.009 ***5.81
ln(manure quantity) × ln(Organic fertilizer N)0.004−5.530.002−6.43
ln(manure quantity) × ln(Organic fertilizer P)0.0110.570.0010.25
ln(manure quantity) × ln(Organic fertilizer K)−0.0150.90−0.0040.03
ln(manure quantity) × ln(Chemical fertilizer N)0.003−0.910.005 *−0.16
ln(manure quantity) × ln(Chemical fertilizer P)−0.0081.52−0.0101.86
ln(manure quantity) × ln(Chemical fertilizer K)0.006−1.530.007−1.5
ln(manure quantity) × ln(Hired labor quantity)0.0001.22−0.0001.06
ln(manure quantity) × ln(Family labor quantity)0.0040.080.007−0.48
ln(manure quantity) × ln(Machinery quantity)0.0001.080.0011.43
ln(Organic matter) × ln(Bacteria count)0.017 **0.100.0170.54
ln(Organic matter) × ln(Organic fertilizer N)−0.1852.05−0.0581.47
ln(Organic matter) × ln(Organic fertilizer P)−0.192−1.450.063−0.34
ln(Organic matter) × ln(Organic fertilizer K)0.379−1.07−0.0200.26
ln(Organic matter) × ln(Chemical fertilizer N)−0.0091.380.029−0.05
ln(Organic matter) × ln(Chemical fertilizer P)0.019−0.27−0.0300.65
ln(Organic matter) × ln(Chemical fertilizer K)−0.0040.450.005−0.52
ln(Organic matter) × ln(Hired labor quantity)0.001−0.100.0010.11
ln(Organic matter) × ln(Family labor quantity)−0.0101.270.0200.54
ln(Organic matter) × ln(Machinery quantity)0.007 **−0.620.014 ***0.84
ln(Bacteria count) × ln(Organic fertilizer N)0.0222.04−0.0062.97
ln(Bacteria count) × ln(Organic fertilizer P)0.0050.46−0.012−0.09
ln(Bacteria count) × ln(Organic fertilizer K)−0.0270.180.019−0.34
ln(Bacteria count) × ln(Chemical fertilizer N)0.011−0.37−0.0180.2
ln(Bacteria count) × ln(Chemical fertilizer P)−0.0210.500.014−0.57
ln(Bacteria count) × ln(Chemical fertilizer K)0.006−0.74−0.0000.37
ln(Bacteria count) × ln(Hired labor quantity)−0.001 **0.25−0.0010
ln(Bacteria count) × ln(Family labor quantity)−0.005−2.03−0.014−1.63
ln(Bacteria count) × ln(Machinery quantity)−0.007 ***−0.51−0.012 ***−1.06
ln(Organic fertilizer N × ln(Organic fertilizer P)0.019−3.340.639−4.16
ln(Organic fertilizer N × ln(Organic fertilizer K)0.5360.06−0.8741.51
ln(Organic fertilizer N × ln(Chemical fertilizer N)0.0650.90−0.032−1.09
ln(Organic fertilizer N × ln(Chemical fertilizer P)−0.0021.40−0.063−0.51
ln(Organic fertilizer N × ln(Chemical fertilizer K)−0.010−0.020.110−0.41
ln(Organic fertilizer N × ln(Hired labor quantity)0.005−0.090.0030.73
ln(Organic fertilizer N × ln(Family labor quantity)0.0090.930.0360.38
ln(Organic fertilizer N × ln(Machinery quantity)−0.0070.160.0190.48
ln(Organic fertilizer P × ln(Organic fertilizer K0.078−0.27−0.9570.57
ln(Organic fertilizer P × ln(Chemical fertilizer N)0.0720.15−0.007−1.43
ln(Organic fertilizer P × ln(Chemical fertilizer P)0.0581.360.197−0.1
ln(Organic fertilizer P × ln(Chemical fertilizer K)−0.1280.31−0.1760.79
ln(Organic fertilizer P × ln(Hired labor quantity)0.001−0.71−0.005−0.72
ln(Organic fertilizer P × ln(Family labor quantity)0.0870.07−0.009−0.37
ln(Organic fertilizer P × ln(Machinery quantity)0.0220.780.013−0.06
ln(Organic fertilizer K × ln(Chemical fertilizer N)−0.1390.500.0450.21
ln(Organic fertilizer K × ln(Chemical fertilizer P)−0.063−1.57−0.1500.38
ln(Organic fertilizer K × ln(Chemical fertilizer K)0.145−0.230.077−0.41
ln(Organic fertilizer K × ln(Hired labor quantity)−0.0060.550.0030.21
ln(Organic fertilizer K × ln(Family labor quantity)−0.098−0.40−0.0310.17
ln(Organic fertilizer K × ln(Machinery quantity)−0.016−0.66−0.033−0.16
ln(Chemical fertilizer N × ln(Chemical fertilizer P)0.023−0.25−0.038−0.36
ln(Chemical fertilizer N × ln(Chemical fertilizer K)0.0080.420.046−0.5
ln(Chemical fertilizer N × ln(Hired labor quantity)−0.0030.20−0.0030.81
ln(Chemical fertilizer N × ln(Family labor quantity)−0.002−1.490.051−0.96
ln(Chemical fertilizer N × ln(Machinery quantity)−0.011−0.050.0031.24
ln(Chemical fertilizer P × ln(Chemical fertilizer K)0.015−0.6−0.0080.13
ln(Chemical fertilizer P × ln(Hired labor quantity)0.0030.80.009 *−0.33
ln(Chemical fertilizer P × ln(Family labor quantity)0.0220.86−0.0591.94
ln(Chemical fertilizer P × ln(Machinery quantity)0.0070.370.020−0.74
ln(Chemical fertilizer K × ln(Hired labor quantity)−0.0010.38−0.007 *0.75
ln(Chemical fertilizer K × ln(Family labor quantity)−0.019−0.430.015−1.79
ln(Chemical fertilizer K × ln(Machinery quantity)0.004−0.35−0.0240.2
ln(Hired labor quantity) × ln(Family labor quantity)−0.0040.32−0.005−1.43
ln(Hired labor quantity) × ln(Machinery quantity)−0.000−1.19−0.001−0.93
ln(Family labor quantity) × ln(Machinery quantity)−0.033 **−0.34−0.030−0.57
ln(manure quantity) × ln(manure quantity)−0.000−2.350.004−1.61
ln(Organic matter) × ln(Organic matter)−0.022 **−0.13−0.026 *1.33
ln(Bacteria count) × ln(Bacteria count)−0.001−200.001−1.76
ln(Organic fertilizer N) × ln(Organic fertilizer N)−0.234−0.20.1550.38
ln(Organic fertilizer P) × ln(Organic fertilizer P)0.005−0.960.0850.48
ln(Organic fertilizer K) × ln(Organic fertilizer K)−0.4040.100.9711.24
ln(Chemical fertilizer N) × ln(Chemical fertilizer N)−0.031−0.74−0.0151.33
ln(Chemical fertilizer P) × ln(Chemical fertilizer P)−0.013−0.910.010−0.31
ln(Chemical fertilizer K) × ln(Chemical fertilizer K)0.007−0.710.013 **0.41
ln(Hired labor quantity) × ln(Chemical fertilizer K)0.004 ***1.400.008 ***2.01
ln(Family labor quantity) × ln(Family labor quantity)0.0083.280.0114.52
ln(Machinery quantity) × ln(Machinery quantity)0.0021.530.004 **1.5
ln(Other input expense)0.442 ***1.630.579 ***2.16
Control variables
Soil lacks N0.1560.900.0500.22
Soil lacks K0.1631.340.1640.97
Soil lacks P0.0820.700.2321.49
Soil lacks trace elements0.0760.700.2061.44
Soil lacks organic matter0.0480.560.214 *1.93
Soil does not lack anything0.2361.060.2250.78
Years to bear fruit0.010 ***2.75−0.004−0.87
Production cycle stage0.217 ***6.480.241 ***5.35
Natural disaster−0.005 ***−12.41−0.007 ***−11.33
Subsidy for organic fertilizer0.103 ***2.660.0430.83
Rain−0.000−0.32−0.000−0.99
Sunlight0.000 **2.31−0.001 ***−3.56
Temperature 1−0.006 **−1.980.017 ***4.37
Temperature 20.010 ***2.92−0.021 ***−4.31
Temperature 30.0000.120.0021.39
Constant2.8910.103.585 **2.19
Sigma−1.020 ***−21.54−0.421 ***−2.99
Gamma−0.152−1.20−0.128−0.43
Mu2.4100.081.2171.55
Observations13771377
Number of farms459459
Note: *** p < 0.01, ** p < 0.05, * p < 0.1.

References

  1. FAO. The Future of Food and Agriculture–Trends and Challenges; FAO: Rome, Italy, 2017; Available online: http://www.fao.org/3/i6583e/i6583e.pdf (accessed on 1 December 2020).
  2. Mylona, K.; Maragkoudakis, P.; Miko, L.; Bock, A.-K.; Wollgast, J.; Caldeira, S.; Ulberth, F. Future of food safety and nutrition-Seeking win-wins, coping with trade-offs. Food Policy 2018, 74, 143–146. [Google Scholar] [CrossRef]
  3. Jiao, X.; Lyu, Y.; Wu, X.; Li, H.; Cheng, L.; Zhang, C.; Yuan, L.; Jiang, R.; Jiang, B.; Rengel, Z. Grain production versus resource and environmental costs: Towards increasing sustainability of nutrient use in China. J. Exp. Bot. 2016, 67, 4935–4949. [Google Scholar] [CrossRef]
  4. Tilman, D.; Cassman, K.G.; Matson, P.A.; Naylor, R.; Polasky, S. Agricultural sustainability and intensive production practices. Nature 2002, 418, 671–677. [Google Scholar] [CrossRef]
  5. Wu, Y. Chemical fertilizer use efficiency and its determinants in China’s farming sector: Implications for environmental protection. China Agric. Econ. Rev. 2011, 3, 117–130. [Google Scholar] [CrossRef]
  6. Yang, Y.; He, Y.; Li, Z. Social capital and the use of organic fertilizer: An empirical analysis of Hubei Province in China. Environ. Sci. Pollut. Res. 2020, 27, 1–12. [Google Scholar] [CrossRef]
  7. Wu, H.; Ge, Y. Excessive Application of Fertilizer, Agricultural Non-Point Source Pollution, and Farmers’ Policy Choice. Sustainability 2019, 11, 1165. [Google Scholar] [CrossRef] [Green Version]
  8. Guo, J.H.; Liu, X.J.; Zhang, Y.; Shen, J.L.; Han, W.X.; Zhang, W.F.; Christie, P.; Goulding, K.W.T.; Vitousek, P.M.; Zhang, F.S. Significant acidification in major Chinese croplands. Science 2010, 327, 1008–1010. [Google Scholar] [CrossRef] [Green Version]
  9. Gu, B.; Ju, X.; Chang, J.; Ge, Y.; Vitousek, P.M. Integrated reactive nitrogen budgets and future trends in China. Proc. Natl. Acad. Sci. USA 2015, 112, 8792–8797. [Google Scholar] [CrossRef] [Green Version]
  10. Liu, X. Thoughts of China’s food security strategy in the new era. J. Agric. Sci. Technol. 2013, 15, 1–6. [Google Scholar]
  11. Liu, Z.; Wang, S.; Xue, B.; Li, R.; Geng, Y.; Yang, T.; Li, Y.; Dong, H.; Luo, Z.; Tao, W. Emergy-based indicators of the environmental impacts and driving forces of non-point source pollution from crop production in China. Ecol. Indic. 2021, 121, 107023. [Google Scholar] [CrossRef]
  12. Tang, J.W.; Lin, Z.A.; Xu, J.X.; Qi, J.; Wang, Y.H. Effect of organic manure and chemical fertilizer on soil nutrient. Soil Fertil. Sci. China 2006, 3, 44–47. [Google Scholar]
  13. Yang, H.S. Resource management, soil fertility and sustainable crop production: Experiences of China. Agric. Ecosyst. Environ. 2006, 116, 27–33. [Google Scholar] [CrossRef]
  14. Bhatt, M.K.; Labanya, R.; Joshi, H.C. Influence of long-term chemical fertilizers and organic manures on soil fertility-A review. Univers. J. Agric. Res. 2019, 7, 177–188. [Google Scholar] [CrossRef]
  15. Kang, Y.; Hao, Y.; Shen, M.; Zhao, Q.; Li, Q.; Hu, J. Impacts of supplementing chemical fertilizers with organic fertilizers manufactured using pig manure as a substrate on the spread of tetracycline resistance genes in soil. Ecotoxicol. Environ. Saf. 2016, 130, 279–288. [Google Scholar] [CrossRef]
  16. Kochakinezhad, H.; Peyvast, G.-A.; Kashi, A.-K.; Olfati, J.-A.; Asadi, A. A comparison of organic and chemical fertilizers for tomato production. J. Org. Syst. 2012, 7, 14–25. [Google Scholar]
  17. Wang, Y.; Zhu, Y.; Zhang, S.; Wang, Y. What could promote farmers to replace chemical fertilizers with organic fertilizers? J. Clean. Prod. 2018, 199, 882–890. [Google Scholar] [CrossRef]
  18. Wang, C.; Huang, C.; Qian, J.; Xiao, J.; Li, H.; Wen, Y.; He, X.; Ran, W.; Shen, Q.; Yu, G. Rapid and accurate evaluation of the quality of commercial organic fertilizers using near infrared spectroscopy. PLoS ONE 2014, 9, e88279. [Google Scholar] [CrossRef]
  19. Linquist, B.A.; Phengsouvanna, V.; Sengxue, P. Benefits of organic residues and chemical fertilizer to productivity of rain-fed lowland rice and to soil nutrient balances. Nutr. Cycl. Agroecosyst. 2007, 79, 59–72. [Google Scholar] [CrossRef]
  20. He, L.-L.; Zhong, Z.; Yang, H. Effects on soil quality of biochar and straw amendment in conjunction with chemical fertilizers. J. Integr. Agric. 2017, 16, 704–712. [Google Scholar] [CrossRef] [Green Version]
  21. Du, Z.-L.; Wu, W.-L.; Zhang, Q.-Z.; Guo, Y.; Meng, F. Long-term manure amendments enhance soil aggregation and carbon saturation of stable pools in North China plain. J. Integr. Agric. 2014, 13, 2276–2285. [Google Scholar] [CrossRef]
  22. Ayuke, F.O.; Brussaard, L.; Vanlauwe, B.; Six, J.; Lelei, D.K.; Kibunja, C.N.; Pulleman, M.M. Soil fertility management: Impacts on soil macrofauna, soil aggregation and soil organic matter allocation. Appl. Soil Ecol. 2011, 48, 53–62. [Google Scholar] [CrossRef]
  23. Wang, X.; Fan, J.; Xing, Y.; Xu, G.; Wang, H.; Deng, J.; Wang, Y.; Zhang, F.; Li, P.; Li, Z. The effects of mulch and nitrogen fertilizer on the soil environment of crop plants. Adv. Agron. 2019, 153, 121–173. [Google Scholar]
  24. Yang, X.; Fang, S. Practices, perceptions, and implications of fertilizer use in East-Central China. Ambio 2015, 44, 647–652. [Google Scholar] [CrossRef] [PubMed] [Green Version]
  25. Dawe, D.; Dobermann, A.; Ladha, J.K.; Yadav, R.L.; Bao, L.; Gupta, R.K.; Lal, P.; Panaullah, G.; Sariam, O.; Singh, Y. Do organic amendments improve yield trends and profitability in intensive rice systems? Field Crop. Res. 2003, 83, 191–213. [Google Scholar] [CrossRef]
  26. Hashimi, R.; Matsuura, E.; Komatsuzaki, M. Effects of Cultivating Rice and Wheat with and without Organic Fertilizer Application on Greenhouse Gas Emissions and Soil Quality in Khost, Afghanistan. Sustainability 2020, 12, 6508. [Google Scholar] [CrossRef]
  27. Ma, W.; Ma, C.; Su, Y.; Nie, Z. Organic farming: Does acquisition of the farming information influence Chinese apple farmers’ willingness to adopt? China Agric. Econ. Rev. 2017, 9, 211–224. [Google Scholar] [CrossRef]
  28. Liu, G.; Xie, H. Simulation of Regulation Policies for Fertilizer and Pesticide Reduction in Arable Land Based on Farmers’ Behavior—Using Jiangxi Province as an Example. Sustainability 2019, 11, 136. [Google Scholar] [CrossRef] [Green Version]
  29. Läpple, D. Adoption and abandonment of organic farming: An empirical investigation of the Irish drystock sector. J. Agric. Econ. 2010, 61, 697–714. [Google Scholar] [CrossRef]
  30. Acs, S.; Berentsen, P.; Huirne, R.; Van Asseldonk, M. Effect of yield and price risk on conversion from conventional to organic farming. Aust. J. Agric. Resour. Econ. 2009, 53, 393–411. [Google Scholar] [CrossRef] [Green Version]
  31. Brentari, E.; Levaggi, R.; Zuccolotto, P. Pricing strategies for Italian red wine. Food Qual. Prefer. 2011, 22, 725–732. [Google Scholar] [CrossRef]
  32. Rebelo, J.; Lourenço-Gomes, L.; Gonçalves, T.; Caldas, J. A hedonic price analysis for the Portuguese wine market: Does the distribution channel matter? J. Appl. Econ. 2019, 22, 40–59. [Google Scholar] [CrossRef] [Green Version]
  33. Hou, J.; Huo, X. Transaction Costs and Farm-to-Market Linkages: Empirical Evidence from China Apple Producers. In Proceedings of the International Association of Agricultural Economists 2015 Conference, Milan, Italy, 9–14 August 2015. [Google Scholar]
  34. Wang, L.; Huo, X. Transaction costs comparison between cooperatives and conventional apple producers: A case study of Northwestern China. Ann. Public Coop. Econ. 2014, 85, 233–255. [Google Scholar]
  35. Huang, Y.Z.; Luo, X.F.; Liu, D.; Yu, W.Z.; Tang, L. Factors affecting farmers’ adoption of organic fertilizer instead of chemical fertilizer—explaining the phenomenon of farmers’ little behavior with strong willingness. Resour. Environ. Yangtze Basin 2019, 28, 632–641. [Google Scholar]
  36. Ajewole, O.C. Farmers response to adoption of commercially available organic fertilizers in Oyo state, Nigeria. Afr. J. Agric. Res. 2010, 5, 2497–2503. [Google Scholar]
  37. Reganold, J.P.; Wachter, J.M. Organic agriculture in the twenty-first century. Nat. Plants 2016, 2, 15221. [Google Scholar] [CrossRef] [PubMed]
  38. Abebe, G.; Debebe, S. Factors affecting use of organic fertilizer among smallholder farmers in Sekela district of Amhara region, Northwestern Ethiopia. Cogent Food Agric. 2019, 5, 1669398. [Google Scholar] [CrossRef]
  39. Wu, H.; Hao, H.; Lei, H.; Ge, Y.; Shi, H.; Song, Y. Farm Size, Risk Aversion and Overuse of Fertilizer: The Heterogeneity of Large-Scale and Small-Scale Wheat Farmers in Northern China. Land 2021, 10, 111. [Google Scholar] [CrossRef]
  40. Xue, C.; Zhang, T.; Yao, S.; Guo, Y. Effects of Households’ Fertilization Knowledge and Technologies on Over-Fertilization: A Case Study of Grape Growers in Shaanxi, China. Land 2020, 9, 321. [Google Scholar] [CrossRef]
  41. Zheng, W.; He, Z.; Xu, X. Evaluation of over fertilization in main grain crops in Jiangsu and its influencing factors. Res. Agric. Mod. 2017, 38, 666–672. [Google Scholar]
  42. Li, W.; Ruiz-Menjivar, J.; Zhang, L.; Zhang, J. Climate change perceptions and the adoption of low-carbon agricultural technologies: Evidence from rice production systems in the Yangtze River Basin. Sci. Total Environ. 2021, 759, 143554. [Google Scholar] [CrossRef]
  43. Wu, Y.; Xi, X.; Tang, X.; Luo, D.; Gu, B.; Lam, S.K.; Vitousek, P.M.; Chen, D. Policy distortions, farm size, and the overuse of agricultural chemicals in China. Proc. Natl. Acad. Sci. USA 2018, 115, 7010–7015. [Google Scholar] [CrossRef] [Green Version]
  44. Li, S.; Zhang, Y.; Nadolnyak, D.; Wesley, J.D.; Zhang, Y. Fertilizer industry subsidies in China: Who are the beneficiaries? China Agric. Econ. Rev. 2014, 6, 433–451. [Google Scholar] [CrossRef]
  45. Li, Y.; Zhang, W.; Ma, L.; Huang, G.; Oenema, O.; Zhang, F.; Dou, Z. An analysis of China’s fertilizer policies: Impacts on the industry, food security, and the environment. J. Environ. Qual. 2013, 42, 972–981. [Google Scholar] [CrossRef] [PubMed]
  46. Sher, A.; Abbas, A.; Mazhar, S.; Azadi, H.; Lin, G. Fostering sustainable ventures: Drivers of sustainable start-up intentions among aspiring university students in Pakistan. J. Clean. Prod. 2020, 262, 121269. [Google Scholar] [CrossRef]
  47. Liu, Y.; Ruiz-Menjivar, J.; Zhang, L.; Zhang, J.; Swisher, M.E. Technical training and rice farmers’ adoption of low-carbon management practices: The case of soil testing and formulated fertilization technologies in Hubei, China. J. Clean. Prod. 2019, 226, 454–462. [Google Scholar] [CrossRef]
  48. Pan, D.; Kong, F.; Zhang, N.; Ying, R. Knowledge training and the change of fertilizer use intensity: Evidence from wheat farmers in China. J. Environ. Manag. 2017, 197, 130–139. [Google Scholar] [CrossRef]
  49. Aigner, D.; Lovell, C.A.K.; Schmidt, P. Formulation and estimation of stochastic frontier production function models. J. Econom. 1977, 6, 21–37. [Google Scholar] [CrossRef]
  50. Meeusen, W.; van Den Broeck, J. Efficiency estimation from Cobb-Douglas production functions with composed error. Int. Econ. Rev. 1977, 18, 435–444. [Google Scholar] [CrossRef]
  51. Stevenson, R.E. Likelihood functions for generalized stochastic frontier estimation. J. Econom. 1980, 13, 57–66. [Google Scholar] [CrossRef]
  52. Greene, W.H. A gamma-distributed stochastic frontier model. J. Econom. 1990, 46, 141–163. [Google Scholar] [CrossRef] [Green Version]
  53. Schmidt, P.; Sickles, R.C. Production frontiers and panel data. J. Bus. Econ. Stat. 1984, 2, 367–374. [Google Scholar]
  54. Battese, G.E.; Coelli, T.J. Prediction of firm-level technical efficiencies with a generalized frontier production function and panel data. J. Econom. 1988, 38, 387–399. [Google Scholar] [CrossRef]
  55. Kumbhakar, S.C. Production frontiers, panel data, and time-varying technical inefficiency. J. Econom. 1990, 46, 201–211. [Google Scholar] [CrossRef]
  56. Sickles, R.C. Panel estimators and the identification of firm-specific efficiency levels in parametric, semiparametric and nonparametric settings. J. Econom. 2005, 126, 305–334. [Google Scholar] [CrossRef] [Green Version]
  57. Stern, D.I. Derivation of the Hicks, or direct, elasticity of substitution using the input distance function. Econ. Lett. 2010, 108, 349–351. [Google Scholar] [CrossRef]
  58. Henningsen, A.; Henning, C.H.C.A. Imposing regional monotonicity on translog stochastic production frontiers with a simple three-step procedure. J. Product. Anal. 2009, 32, 217–229. [Google Scholar] [CrossRef] [Green Version]
  59. Uematsu, H.; Mishra, A.K. Organic farmers or conventional farmers: Where’s the money? Ecol. Econ. 2012, 78, 55–62. [Google Scholar] [CrossRef]
  60. DAI, Z.; FEI, L.; Jian, Z.; HUANG, D.; LIU, T. Optimization of water and nitrogen management for surge-root irrigated apple trees in the Loess Plateau of China. J. Integr. Agric. 2021, 20, 260–273. [Google Scholar] [CrossRef]
  61. Lu, H.; Zhang, P.; Hu, H.; Xie, H.; Yu, Z.; Chen, S. Effect of the grain-growing purpose and farm size on the ability of stable land property rights to encourage farmers to apply organic fertilizers. J. Environ. Manag. 2019, 251, 109621. [Google Scholar] [CrossRef]
  62. Ma, W.; Renwick, A.; Yuan, P.; Ratna, N. Agricultural cooperative membership and technical efficiency of apple farmers in China: An analysis accounting for selectivity bias. Food Policy 2018, 81, 122–132. [Google Scholar] [CrossRef]
  63. Hao, J.; Bijman, J.; Gardebroek, C.; Heerink, N.; Heijman, W.; Huo, X. Cooperative membership and farmers’ choice of marketing channels–Evidence from apple farmers in Shaanxi and Shandong Provinces, China. Food Policy 2018, 74, 53–64. [Google Scholar] [CrossRef]
  64. Ma, W.; Abdulai, A. Does cooperative membership improve household welfare? Evidence from apple farmers in China. Food Policy 2016, 58, 94–102. [Google Scholar] [CrossRef]
Figure 1. Conceptual framework of the application of organic fertilizer at farm level.
Land 10 00858 g001
Figure 2. Description of the study area.
Land 10 00858 g002
Table 1. Inputs and outputs: definitions and summary statistics.
VariableDefinition (Unit)MeanSD
Yield quantityApple yield (kilograms/hectare)21,334.54215,659.826
Yield valueValue of apple yield (yuan/hectare)73,291.89662,067.129
Inputs measured in value terms
Manure expenses Cost of manure (yuan/hectare)1081.2366092.374
Organic fertilizer expensesCost of organic fertilizer (yuan/hectare)7256.2626812.736
Chemical fertilizer expensesCost of chemical fertilizer (yuan/hectare)14,581.61315,940.643
Hired labor expensesCost of hired labor (yuan/hectare)12,646.02616,975.909
Family labor expensesCost of family labor(yuan/hectare)56,930.87848,056.499
Machinery expensesCost of machinery (yuan/hectare)3564.0144320.171
Other inputs expensesCost of other inputs (yuan/hectare)12,308.8809938.363
Inputs measured in physical units
Manure quantityQuantity of manure (kilograms/hectare)3318.94813,735.943
Organic matterQuantity of organic matter in organic fertilizer (kilograms/hectare)1822.6341548.943
Bacteria countCount of number of bacteria in organic fertilizer per hectare7,390,00013,300,000
Organic fertilizer NQuantity of nitrogen in organic fertilizer (kilograms/hectare)226.266411.165
Organic fertilizer PQuantity of phosphorus in organic fertilizer (kilograms/hectare)322.624504.546
Organic fertilizer KQuantity of potassium in organic fertilizer (kilograms/hectare)197.086310.634
Chemical fertilizer NQuantity of nitrogen in chemical fertilizer (kilograms/hectare)638.112584.502
Chemical fertilizer PQuantity of phosphorus in chemical fertilizer (kilograms/hectare)485.134441.874
Chemical fertilizer KQuantity of potassium in chemical fertilizer (kilograms/hectare)637.459725.032
Hired labor quantityHired labor (hours/hectare)1040.2801787.203
Family labor quantityFamily labor (hours/hectare)4437.7343433.827
Machinery quantityMachinery power (kilowatts/hectare)2789.7004851.341
Table 2. Sales channels: definitions and summary statistics.
VariableDefinition (Unit)MeanSD
Number of available sales channels Total number of sales channels1.6350.516
Dummy variables for individual sales channels
Unified sales by cooperativesYes = 1; no = 00.0040.066
Dealer door-to-door purchasesYes = 1; no = 00.8540.353
Enterprise sales (fresh fruit)Yes = 1; no = 00.0150.123
Direct-to-consumer salesYes = 1; no = 00.0170.131
Apple brokerYes = 1; no = 00.1220.327
Enterprise sales (juice pressing)Yes = 1; no = 00.5730.495
Farmers transport apples to dealersYes = 1; no = 00.0500.218
Table 3. Control variables: definitions and summary statistics.
VariableDefinition/UnitMeanSD
Dummy variables for farmers’ perception of soil quality
Soil lacks NYes = 1; no = 00.0220.146
Soil lacks KYes = 1; no = 00.0440.204
Soil lacks PYes = 1; no = 00.0410.199
Soil lacks trace elementsYes = 1; no = 00.0480.214
Soil lacks organic matterYes = 1; no = 00.0850.279
Soil does not lack anythingYes = 1; no = 00.0110.104
Farmer does not knowYes = 1; no = 00.7730.419
Years to bear fruitYears a new apple tree requires to bear fruit11.0347.001
Production cycle stageStage of apple production cycle (high = 1; low = 0)0.6510.477
Natural disasterPercentage of production lost due to natural disasters (%)26.40840.643
Subsidy for organic fertilizer Yes = 1; no = 00.2800.449
RainfallAverage total rainfall (cm), March 15–September 4026.34035.507
SunlightAverage daily hours of sunlight, 15 March–30 September 15.86212.467
Temperature 1Average daily temperature (°C), 15 March–15 April10.6651.786
Temperature 2Average daily temperature (°C), 16–30 April13.9941.390
Temperature 3Average daily temperature (°C), 1 May–30 September16.5916.932
County dummy: HuanglingYes = 1; no = 00.2140.410
County dummy: LuochuanYes = 1; no = 00.2660.442
County dummy: PuchengYes = 1; no = 00.2350.424
County dummy: YanchuanYes = 1; no = 00.2850.452
Table 4. Estimated mean values of partial output elasticities with inputs measured in value terms.
Panel A
(Yield is in kg/ha)
Panel B
(Yield is in yuan/ha)
InputElasticityZElasticityZ
Manure expense−0.009−0.75−0.016−1.03
Organic fertilizer expense0.023 *1.790.0030.17
Chemical fertilizer expense0.065 ***4.910.068 ***3.82
Hired labor expense0.032 ***6.470.045 ***7.05
Family labor expense0.061 *1.940.0390.94
Machinery expense0.0020.200.0150.92
Other input expense0.837 ***2.882.087 ***5.42
Control variables included
Soil quality dummiesYesYes
Years to bear fruitYesYes
Production cycle stageYesYes
Natural disasterYesYes
Subsidy for organic fertilizerYesYes
RainfallYesYes
SunlightYesYes
Temperature 1, 2, and 3YesYes
Total number of observations (3 per farm)13771377
Number of farms459459
Note: *** p < 0.01, * p < 0.1.
Table 5. Estimated mean values of partial output elasticities with inputs measured in physical units.
Panel C
(Yield is in kg/ha)
Panel D
(Yield is in yuan/ha)
InputElasticityZElasticityZ
Manure quantity0.0070.61−0.011−0.72
Organic matter0.191 **2.370.194 *1.80
Bacteria count−0.027−0.94−0.079 **−1.98
Organic fertilizer N−1.125−1.08−0.430−0.31
Organic fertilizer P−0.442−0.321.5890.86
Organic fertilizer K0.2160.151.3850.69
Chemical fertilizer N0.1630.72−0.048−0.15
Chemical fertilizer P0.0871.06−0.010−0.09
Chemical fertilizer K0.079 *1.820.131 **2.25
Hired labor quantity0.036 ***5.760.051 ***6.27
Family labor quantity 0.0521.230.0490.87
Machinery quantity0.0100.800.0181.08
Other input expense0.442 ***10.680.579 ***10.27
Control variables included
Soil quality dummiesYesYes
Years to bear fruitYesYes
Production cycle stageYesYes
Natural disasterYesYes
Subsidy for organic fertilizerYesYes
RainfallYesyes
SunlightYesYes
Temperature 1, 2, and 3YesYes
Number of observations (3 per farm)13771377
Number of farms459459
Note: *** p < 0.01, ** p < 0.05, * p < 0.1.
Table 6. Estimated mean values of direct elasticities of substitution.
Input PairElasticity of Substitution (Yield is in kg/ha)Elasticity of Substitution (Yield is in yuan/ha)
Organic fertilizer expense and chemical fertilizer expense1.0800.745
Organic matter (organic fertilizer) and chemical fertilizer N0.9051.066
Organic matter (organic fertilizer) and chemical fertilizer P0.7840.581
Organic matter (organic fertilizer) and chemical fertilizer K1.0620.975
Bacteria count (organic fertilizer) and chemical fertilizer N0.9260.914
Bacteria count (organic fertilizer) and chemical fertilizer P5.5850.635
Bacteria count (organic fertilizer) and chemical fertilizer K0.8190.846
Organic fertilizer N and chemical fertilizer N0.8911.125
Organic fertilizer P and chemical fertilizer P1.1680.443
Organic fertilizer K and chemical fertilizer K0.4131.051
Table 7. Estimated determinants of partial output elasticities for organic fertilizer.
(1)(2)(3)(4)(5)(6)(7)(8)(9)(10)
Partial Output Elasticity for
Organic Matter
Partial Output Elasticity for
Bacteria Count
Partial Output Elasticity for
Organic Fertilizer N
Partial Output Elasticity for
Organic Fertilizer P
Partial Output Elasticity for
Organic Fertilizer K
VariablesYield in kg/haYield in yuan/haYield in kg/haYield in yuan/haYield in kg/haYield in yuan/haYield in kg/haYield in yuan/haYield in kg/haYield in yuan/ha
Number of available sales channels−0.001−0.079 ***0.0040.026 ***0.821 ***−0.191 ***0.161 ***−0.655 ***0.603 **−2.186 ***
(−0.07)(−4.71)(0.48)(2.62)(7.55)(−2.71)(2.83)(−10.69)(2.45)(−5.63)
Sales channel dummies
Unified sales by cooperatives0.0700.181 **−0.046−0.1050.2550.0250.279−0.285−0.253−0.397
(0.93)(2.55)(−1.08)(−1.49)(0.19)(0.09)(0.57)(−0.23)(−0.36)(−0.12)
Dealer door-to-door purchases0.0310.108 *−0.028 **−0.053 ***−0.737 **0.273 ***−0.0330.616 *−0.955 ***2.358 ***
(0.71)(1.91)(−2.24)(−2.98)(−2.06)(4.26)(−0.24)(1.90)(−4.61)(2.63)
Enterprise sales (fresh fruit)0.029−0.000−0.0040.023 *0.3500.0590.049−0.208−0.067−0.485
(0.47)(−0.00)(−0.42)(1.73)(0.35)(0.29)(0.17)(-0.24)(−0.07)(−0.17)
Direct-to-consumer sales−0.0030.060 *−0.0010.002−1.549 ***0.345 *−0.3871.392 ***−1.3194.460 ***
(−0.12)(1.91)(-0.02)(0.03)(−16.91)(1.92)(−1.42)(9.84)(−1.60)(5.88)
Apple broker0.0290.112 **−0.042 ***−0.066 ***−0.628 **0.346 ***0.1280.633 ***−1.315 ***2.436 ***
(0.70)(2.28)(−3.48)(−6.32)(−2.29)(4.42)(0.82)(2.92)(−5.43)(4.16)
Enterprise sales (juice pressing)0.0070.061 ***0.002−0.018−0.650 ***0.118−0.137 ***0.508 ***−0.491 **1.815 ***
(0.43)(3.56)(0.12)(−0.93)(−3.14)(1.43)(−2.86)(3.31)(−2.35)(3.16)
Farmers transport apples to dealers----------
Control variables included
Soil quality dummiesYesYesYesYesYesYesYesYesYesYes
Years to bear fruitYesYesYesYesYesYesYesYesYesYes
Production cycle stageYesYesYesYesYesYesYesYesYesYes
Natural disasterYesYesYesYesYesYesYesYesYesYes
Subsidy for organic fertilizerYesYesYesYesYesYesYesYesYesYes
RainfallYesYesYesYesYesYesYesYesYesYes
SunlightYesYesYesYesYesYesYesYesYesYes
Temperature 1, 2, and 3YesYesYesYesYesYesYesYesYesYes
County dummiesYesYesYesYesYesYesYesYesYesYes
Constant0.112−0.173 ***0.0600.0634.468 ***−2.833 ***0.992 **−2.024 **7.881 ***−19.004 ***
(1.14)(−2.58)(1.41)(1.08)(4.20)(−7.87)(2.17)(−2.47)(11.23)(−7.09)
Number of observations (3 per farm)1377137713771377137713771377137713771377
Number of farms459459459459459459459459459459
Note: robust z-statistics in parentheses; *** p < 0.01, ** p < 0.05, * p < 0.1.
Table 8. Estimated determinants of technical inefficiency.
VariablesTechnical Inefficiency
(11)(12)
Yield in kg/haYield in yuan/ha
Number of available sales channels −0.103 ***−0.044
(−8.67)(−0.99)
Sales channel dummies
Unified sales by cooperatives−0.077−0.197
(−0.30)(−1.22)
Dealer door-to-door purchases0.0690.020
(0.82)(0.16)
Enterprise sales (fresh fruit)0.154 **0.063
(5.31)(0.58)
Direct-to-consumer sales−0.091−0.171
(−0.62)(−1.68)
Apple broker0.0590.148
(0.40)(0.72)
Enterprise sales (juice pressing)0.082 *−0.002
(2.71)(−0.03)
Farmers transport apples to dealers--
Control variables included
Soil quality dummiesYesYes
Years to bear fruitYesYes
Production cycle stageYesYes
Natural disasterYesYes
Subsidy for organic fertilizerYesYes
RainfallYesYes
SunlightYesYes
Temperature 1, 2, and 3YesYes
County dummiesYesYes
Constant2.344 ***1.231 **
(0.160)(0.355)
Number of observations459459
Note: robust t-statistics in parentheses; *** p < 0.01, ** p < 0.05, * p < 0.1.
Publisher’s Note: MDPI stays neutral with regard to jurisdictional claims in published maps and institutional affiliations.

