
Sustainable Landscape Planning to Mitigate Wildlife–Vehicle Collisions
by
 ,
,
Ancuta Fedorca
1,2,† ,
,
Mihai Fedorca
1,2,†,
Ovidiu Ionescu
1,2,
Ramon Jurj
1,
Georgeta Ionescu
1 and
Marius Popa
1,2,* 1
Wildlife Department, National Institute for Research and Development in Forestry Marin Dracea, 077190 Voluntari, Romania
2
Silviculture Department, Faculty of Silviculture and Forest Engineering, Transilvania University of Brașov, 500036 Brașov, Romania
*
Author to whom correspondence should be addressed.
†
Ancuta Fedorca and Mihai Fedorca are equally contributing authors.
Land 2021, 10(7), 737; https://doi.org/10.3390/land10070737
Submission received: 11 June 2021
/
Revised: 5 July 2021
/
Accepted: 12 July 2021
/
Published: 14 July 2021
(This article belongs to the Collection Land Systems in Transition: Challenges, Approaches, and Pathways for a Sustainable Development)
Abstract
:Road development, traffic intensification, and collisions with wildlife represent a danger both for road safety and species conservation. For planners, deciding which mitigation methods to apply is often problematic. Through a kernel density estimate, we analyzed 715 crossing locations and wildlife–vehicle collisions (WVCs) involving brown bears, lynx, wolf, red deer, roe deer, and wild boar in the Southeastern Carpathian Mountains. We identified 25 WVC hotspots, of which eight require urgent mitigation of existing infrastructure. Moreover, many of these hotspots are in Natura 2000 sites, along road sections where vegetation is in close proximity, animal movement is the highest, and driver visibility is low. Our study is the first in Romania to recommend practical solutions to remediate WVC hotspots and benefit sustainable landscape management.
1. Introduction
Natural populations and habitats are affected by roads in numerous ways, such as wildlife–vehicle collisions (WVCs), gene flow restrictions, and decreased landscape connectivity [1,2], especially in combination with habitat loss and land-use changes [3]. The frequency of wildlife–vehicle collisions is likely to increase as road networks and traffic volume continue to expand [4,5]. Moreover, species diversity and abundance near roads decrease with increasing traffic volume [6,7].
Many studies over time found that WVCs were not random but spatially clustered [8,9], and their probability was mainly predicated on accident datasets [10,11], wildlife movement data [12], expert opinion, literature-based model [13], or landscape-based approaches for delineating hotspots [14]. Other methods have applied clustering approaches [15,16] or assessed roads based on segments of equal length, with WVC data aggregated later [17,18].
Recent techniques have used fatality-based habitat identification and characterization [19], whereas kernel density estimation (KDE) remains the conventional spatial element for hotspot clustering [16,20,21]. Important causes of WVCs were identified in previous studies, such as road characteristics, traffic volume, visibility, and intersections [11,22,23]. Nevertheless, the driving forces behind mitigation efforts were human safety and economics [20,21].
Given the existing tools and methods, new infrastructure could benefit from spatial mapping, connectivity models, and explicit guidelines [22], so that road administrators can implement long-term cost-effective mitigation measures with multiple benefits [23]. Identifying wildlife road-crossings and wildlife–vehicle collisions hotspots should become priority preventive measures [4,24]. If an area is of high importance for wildlife crossing and a collision hotspot, that is where mitigation efforts should begin [25,26].
Some of Europe’s highest populations of large carnivores, namely brown bear (Ursus arctos), lynx (Lynx lynx) and wolf (Canis lupus), are found in the Romanian Carpathians [27], and they share space with their prey, such as red deer (Cervus elaphus), wild boar (Sus scrofa), chamois (Rupicapra rupicapra), and roe deer (Capreolus capreolus) [28]. These large carnivores do not have any natural predators, so road and train accidents are the leading causes of mortality [29]. Bears and wolves are known to avoid paved roads and are restricted by high-volume roads: more than 10,000 vehicles in a month for wolves [30] and approximately 100 cars in an hour for grizzly bears [31]; lynx avoid high-volume roads as well [32]. Regarding ungulates, increases in movement often lead to more WVCs during early summer and fall during mating, dispersal, or daily foraging and resting [33].
By using a KDE, a study in Italy focusing on red and roe deer identified WVC hotspots and road sections with the highest risk for drivers [34]. A similar approach in Iran proposed mitigation strategies based on KDE results and adjusting locations of wildlife warning signs [35].
Along with intensified traffic, vehicle ownership is growing, and in certain areas, the number of cars registered in 24 h is double what it was a decade ago [17,23,36]. The road infrastructure was not designed to carry such traffic; consequently, crossing locations and collision hotspots for species with protected status and species of general conservation concern need to be prioritized in mitigation efforts [25,37], so the nature of WVCs is likely to change [38].
This study is the first model-based estimation of WVC hotspots in Southeastern Romanian Carpathians designed to inform the development of effective road mitigation strategies for landscape planning and traffic safety.
2. Materials and Methods
2.1. Study Area
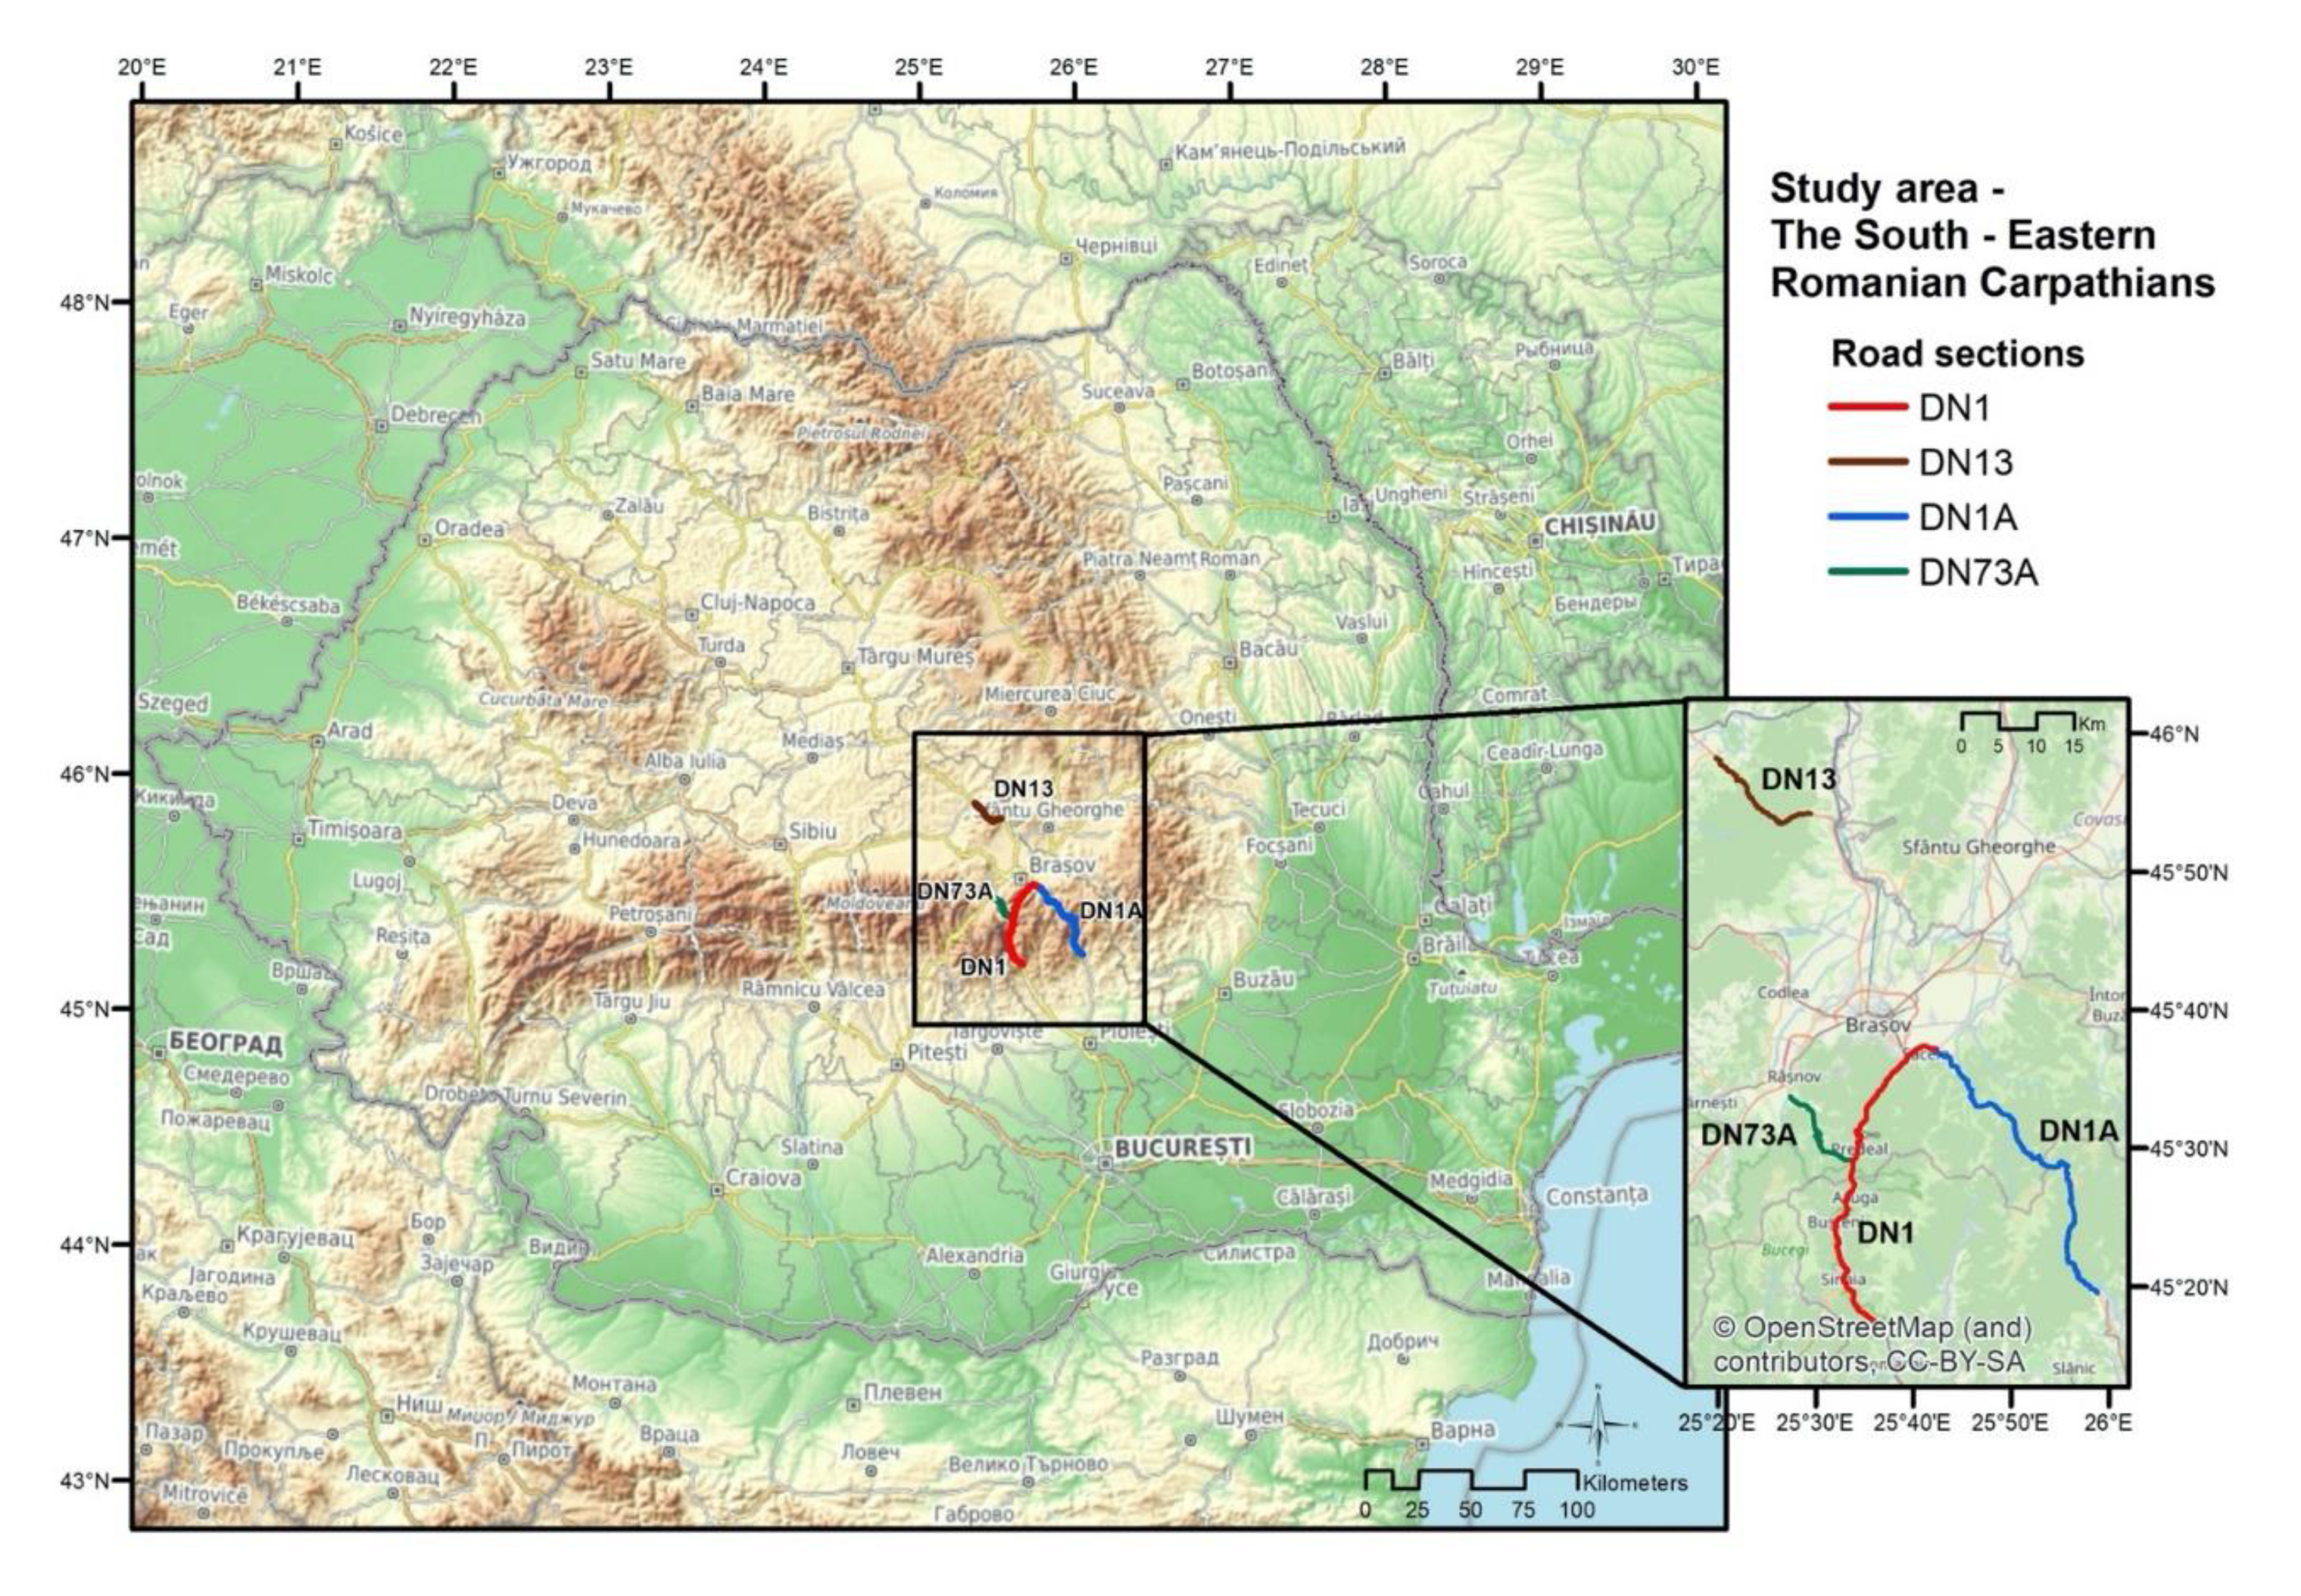
The study area (45.6427° N, 25.5887° E) overlaps Brasov and Prahova counties and includes Romania’s most popular tourist regions (Busteni, Sinaia, Predeal, Azuga, and Brasov), which have the most crowded roads: DN1, DN1A, DN73, and DN13 [36] (Table 1). According to CORINE Land Cover 2018 v.2020_20u1 (https://land.copernicus.eu/pan-european/corine-land-cover/clc2018?tab=download (accessed on 20 December 2020)), the forests in the area are all mesophyllous with local variation: the vicinity of DN1 is mostly mixed deciduous/broad-leaved coniferous followed by mountain beech; near DN13, mountain beech predominates, followed by hill beech; around DN73A, the forest is mostly mixed deciduous/broad-leaved-coniferous; and around DN1A, there is mostly mountain beech followed by mixed deciduous/broad-leaved coniferous. In 2019, official traffic police reports on these roads showed WVCs involving 30 roe deer, 9 wild boars, 19 brown bears, and 3 wolves. Landscape elements may be a critical cause [38]. Our research focuses on four case studies represented in Figure 1, with the following location of each road:
2.2. Sampling and Field Survey
From 2018 to 2019, we conducted a field survey of 715 GPS locations with experts from National Research Institute for Research and Development in Forestry Marin Dracea (INCDS Marin Dracea) to evaluate the effects of roads and railways on wildlife. The varied dataset included data on animal WVCs and crossing locations. Species included brown bear (Ursus arctos), wolf (Canis lupus), lynx (Lynx lynx), red deer (Cervus elaphus), wild boar (Sus scrofa), and roe deer (Capreolus capreolus). The case studies on the four roads (DN1, DN1A, DN73, and DN13) are represented in Figure 1, along with the section of each road that had the greatest traffic throughout the year [36].
Experts conducted inventories on both lanes of the roads, and observations were classified as road/train mortality (M), road crossing (T), road crossing using underpasses (P), wildlife direct observation next to the road (V), or tracks next to the road (without confirmation for road crossing) (I). Ten experts performed 200 surveys over 138.34 km. Railway fatalities (19 brown bears) were also considered. However, we suspect that the total number of animals killed by train collisions was underestimated because engineers do not report fatalities involving smaller species.
2.3. Data Analysis
To analyze the risk of a WVC, we had to apply weighted factors to each collision hotspot. For species (S), we used a three-point scale, attributing the highest score (3) to large carnivores (brown bears, lynx, and wolf); 2 for red deer, roe deer, and wild boar; and 1 for smaller animals (badger, European pine marten, red fox, hare, and squirrel).
For the number of animals at a specific location (N), we assigned 1 point if one was seen, and 2 if there was more than one. Data were ranked on a scale of importance (T), from the lowest to highest risk of collision: mortality (M), highest score; road crossing (RC), average score; road crossing using an existing underpass (P) or wildlife presence next to the road (V), medium to low score; and a track next to the road (without crossing the road) (I), the lowest score. We estimated the risk of wildlife collision by using the following formula:
- Wildlife collision hotspot = S × N × T
- S—species
- large carnivores = 1 point,
- red deer, roe deer and wild boar = 2 points
- badger, European pine marten, red fox, hare, squirrel and other species = 3 points.
- N—number of individuals at a certain location:
- 1 individual = 1 point,
- more individuals = 2 points.
- T—types of data:
- M = 5 points, P = 4 points, RC = 3 points, V = 2 points, I = 1 point.
Furthermore, to estimate high-density accident zones, we used a kernel density estimate (KDE) analysis of the hotspots [35,39]. The study was conducted by using ESRI ArcGIS version 10.3.1 with Spatial Analyst extension and the free “Custom Home Range Tools Toolbox for ArcGIS” [40], available from GISInEcology.com/Home_Range_Tools.zip. This tool created a KDE and 95 and 50% volume contours from a point data layer of locations where an accident or animal presence was recorded near the road. KDE calculated the density of the point features around each output raster cell. Conceptually, a smoothly curved surface was fitted through each point [41]. The surface value was the highest at the location of the point, lower with increasing distance, and zero at the search radius distance from the point since only a circular neighborhood is valid. The density at each output raster cell was calculated by adding the kernel surface values where they overlay the raster cell center; the kernel function was based on the quartic kernel function [40].
2.4. Speed Limits and Existing Local Mitigation Measures
To analyze the effects of roads on wildlife movements, we also collected information regarding speed limits, sector lengths, and warning signs for wildlife (WSW) (Table 2).
Furthermore, we analyzed local options for mitigating collisions and providing safe wildlife crossings [3,42], together with modern systems such as Animal Vehicle Collision Prevention Systems (AVC PS) and Virtual Fence (https://life.safe-crossing.eu/techniques (accessed on 20 November 2020). Moreover, we tested their surface clusters with the WVC hotspots to determine the optimal local mitigation measures.
3. Results
3.1. Kernel Densities Estimate Analysis for WVC Hotspots
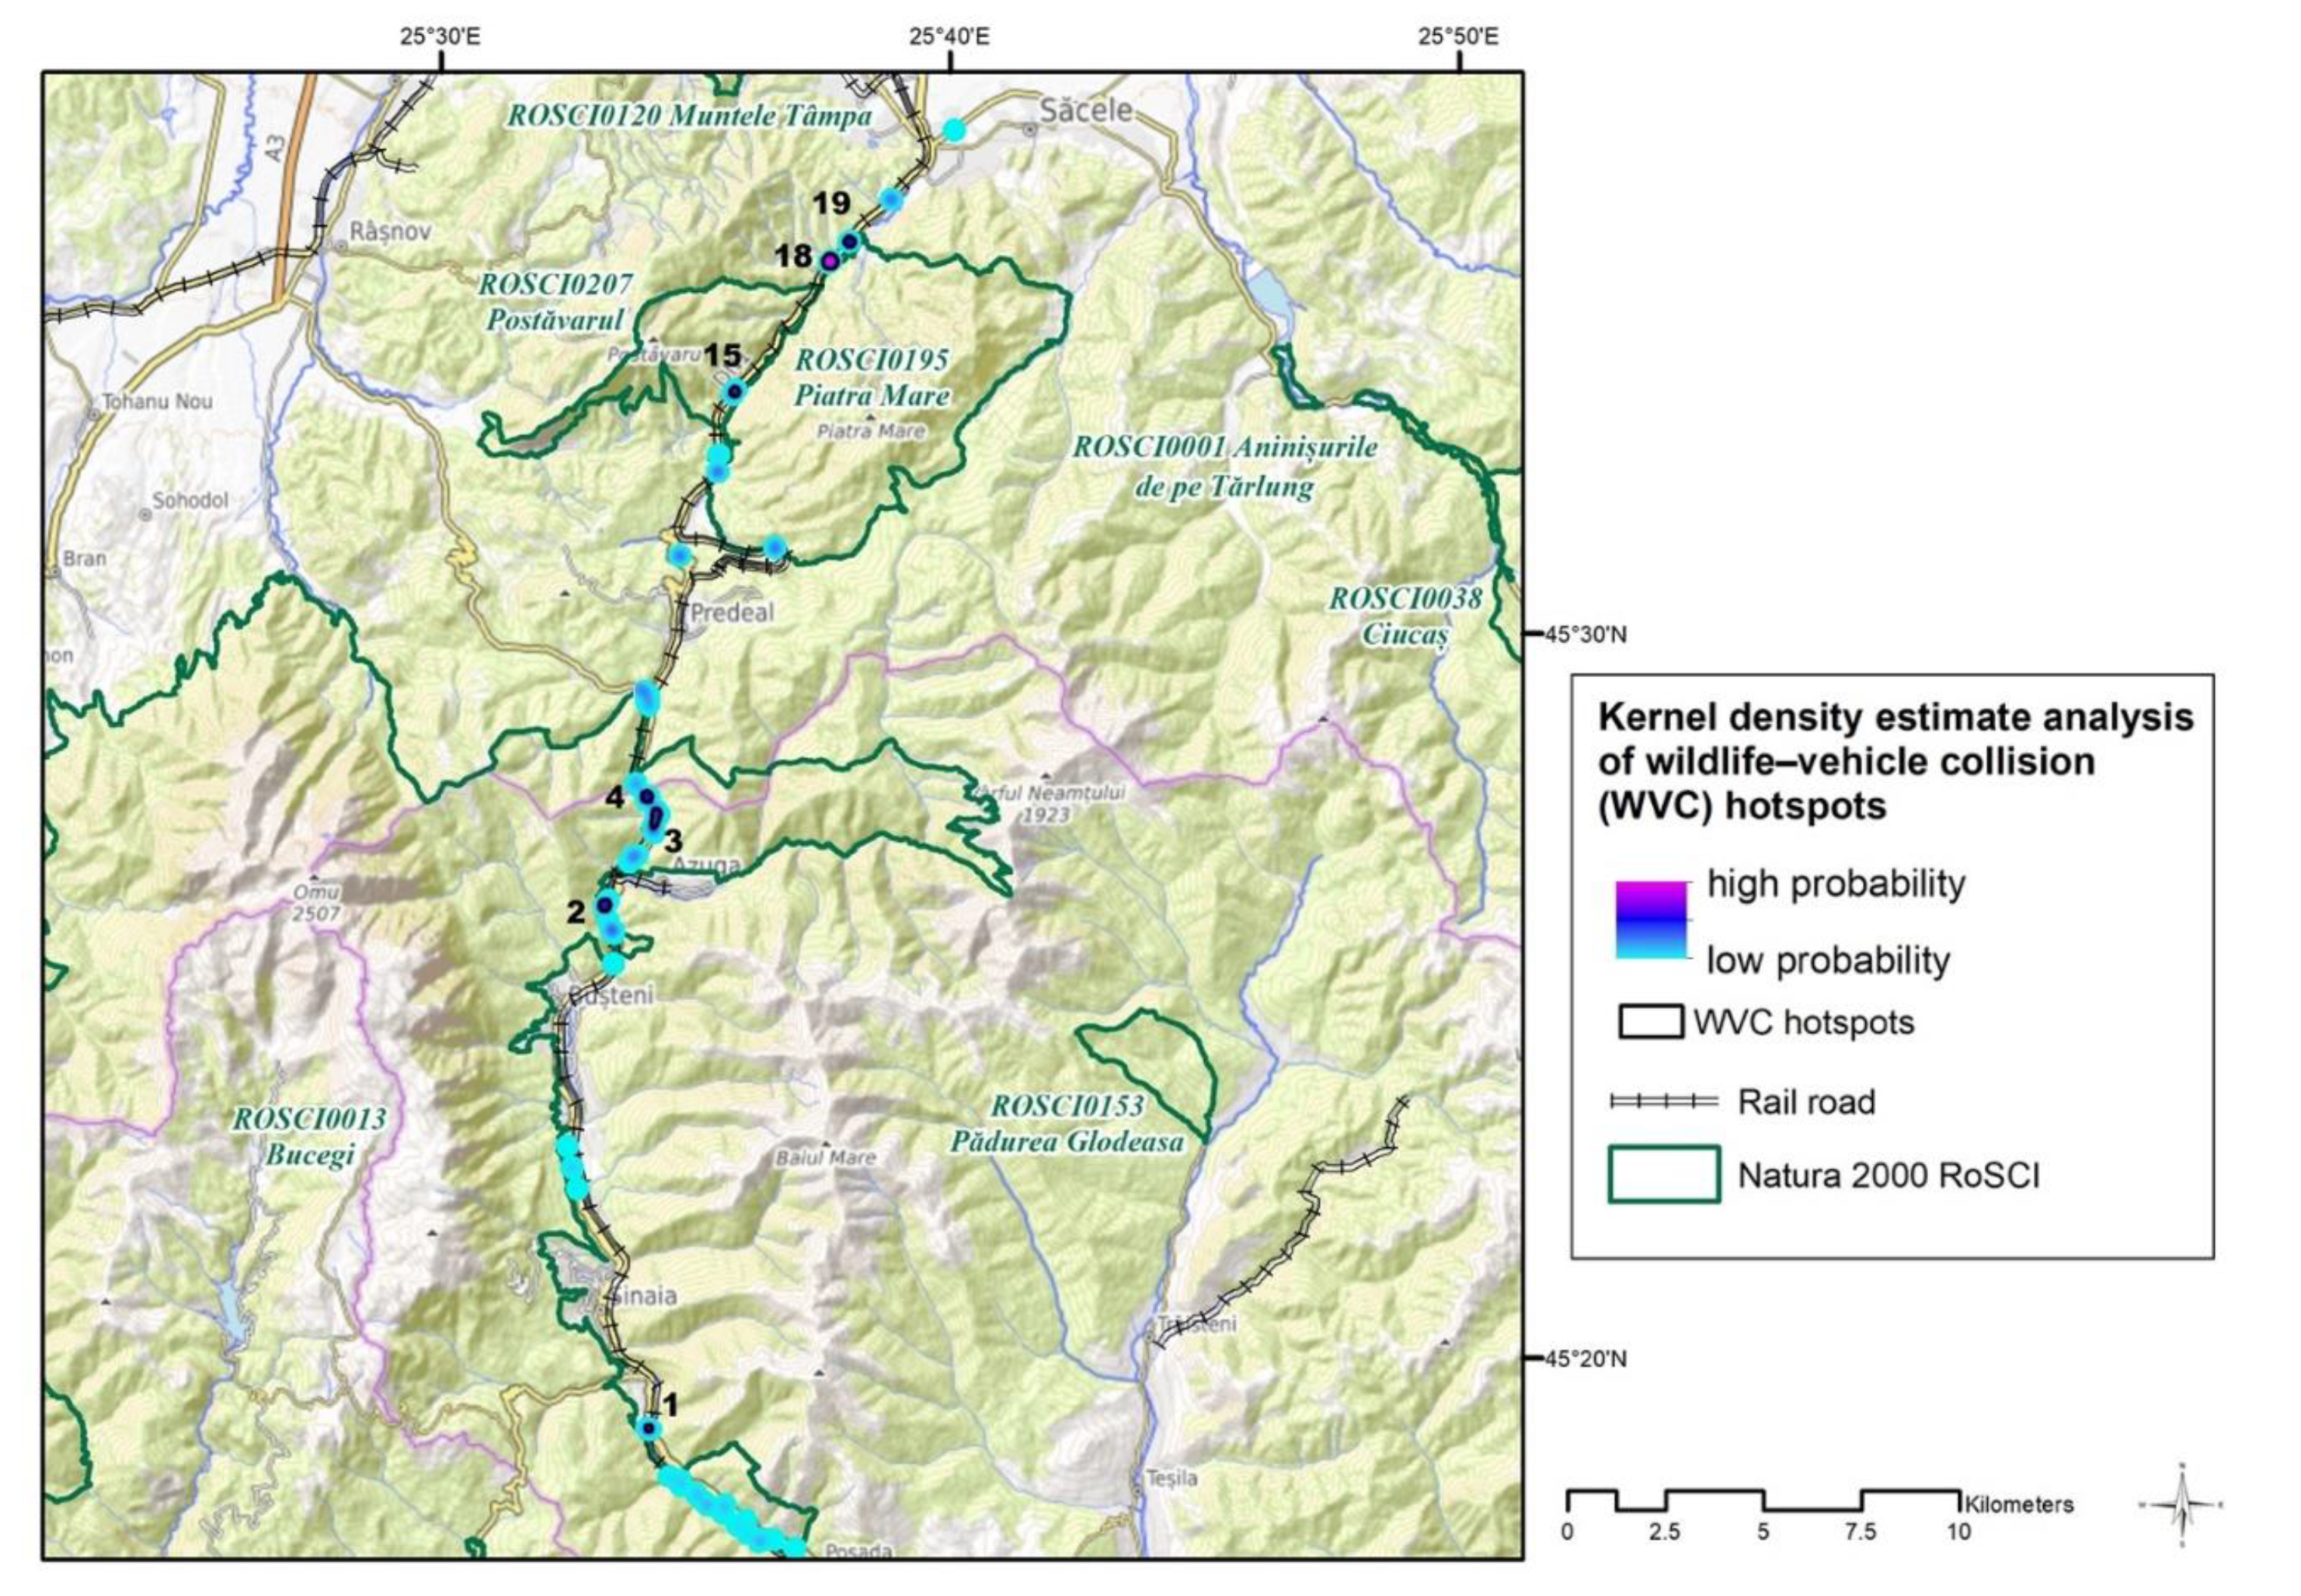
We located 25 WVC hotspots that involved multiple species, including large mammals, out of which seven registered as high risk (see WVC 1, 2, 3, 4, 15, 18, and 19 in Figure 2). In addition, the cumulative effect of roads, railways, and, in some areas, rivers, were registered. The distances between a railway and a road were minimal (0–50 m) in hotspots such as Timisul de Jos (WVC 15), Timisul de Sus (WVC 18, 19), Sinaia (WVC 1), and Azuga (WVC 2). WVC 3 and WVC 4 from Azuga registered greater distances between a road and railway but were still in proximity (40–140 m). At the landscape scale, Prahova Valley comprises few areas that are crucial for brown bear gene flow, as previously noted in landscape genetic analyses [23]. The WVC surface varies from 2.38 ha in WVC 1 to 12.03 ha in WVC 18 (Table 3), while, for the entire study area, the mean was approximately 6 ha. Along the DN1 road sector, the forest facilitates species movement and creates low visibility and poor conditions for fast driver reaction.
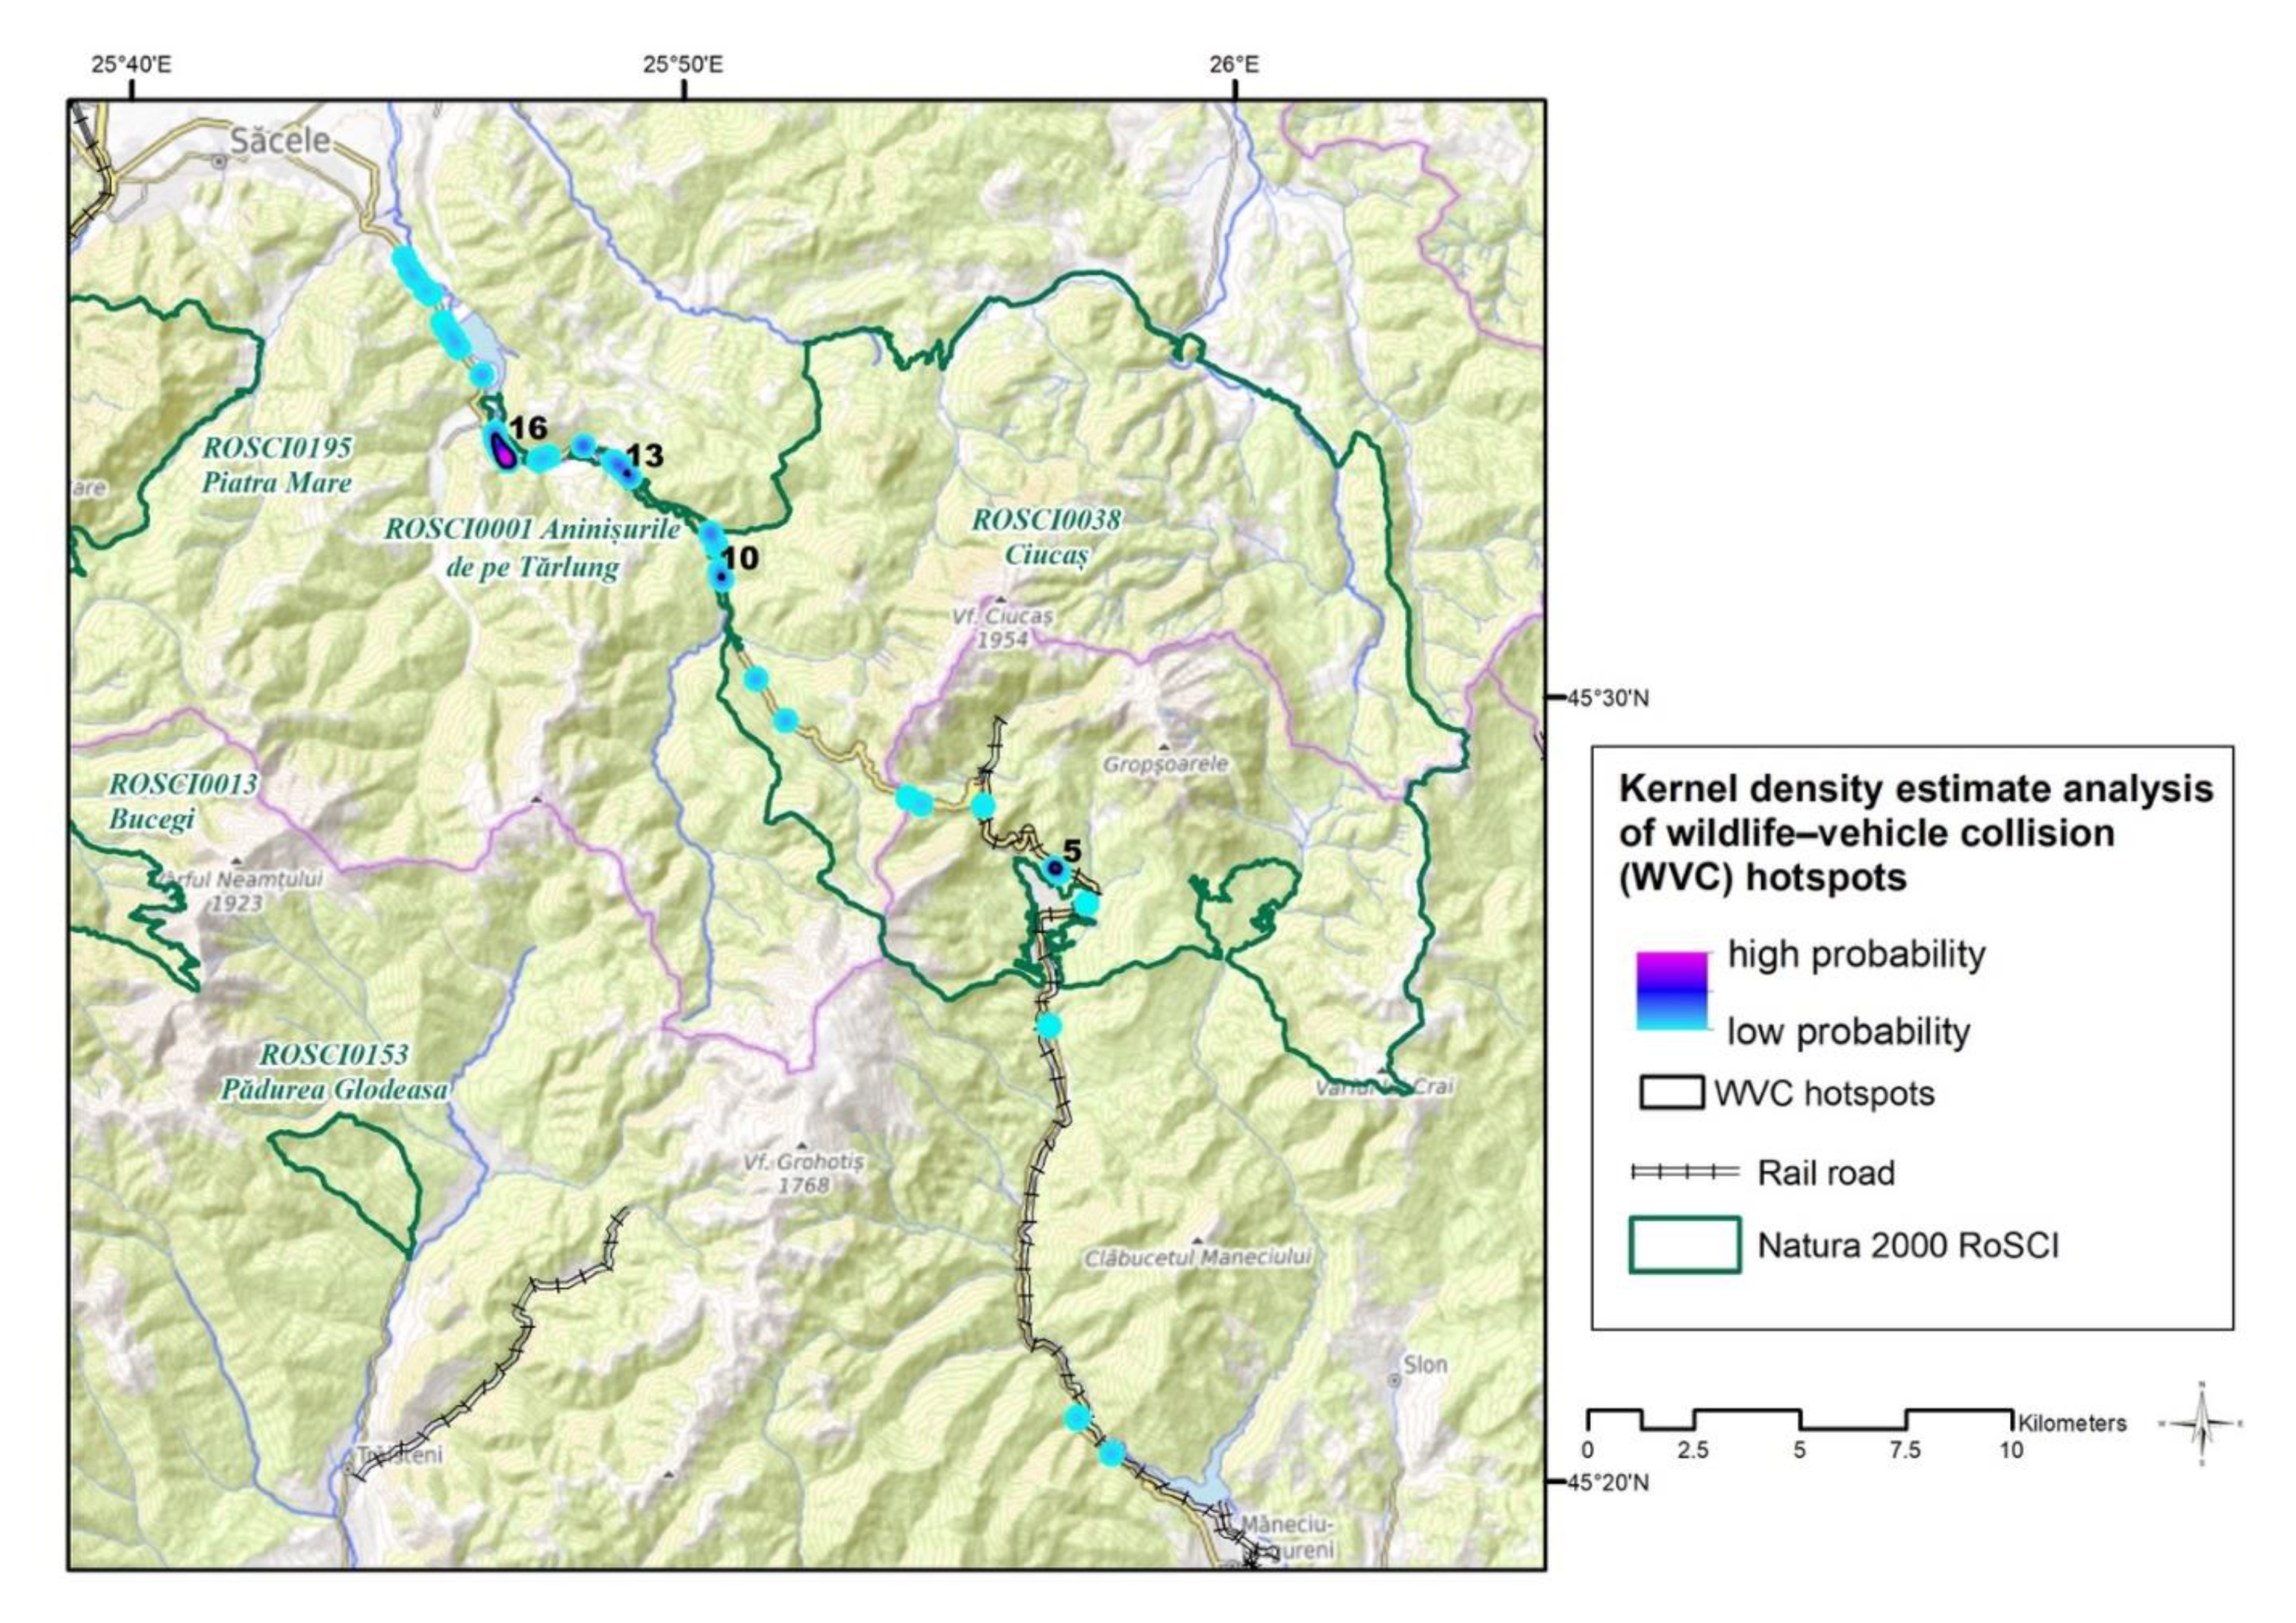
Fewer high-risk hotspots were identified in the study of the Sacele–Maneciu road (DN1A) (Figure 3), which is often used as an alternate route for the crowded Prahova Valley, where four high-risk hotspots (WVC 5, 10, 13, and 16) were identified. Their area varied from 0.2 ha (WVC 13) to 23.82 ha (WVC16).
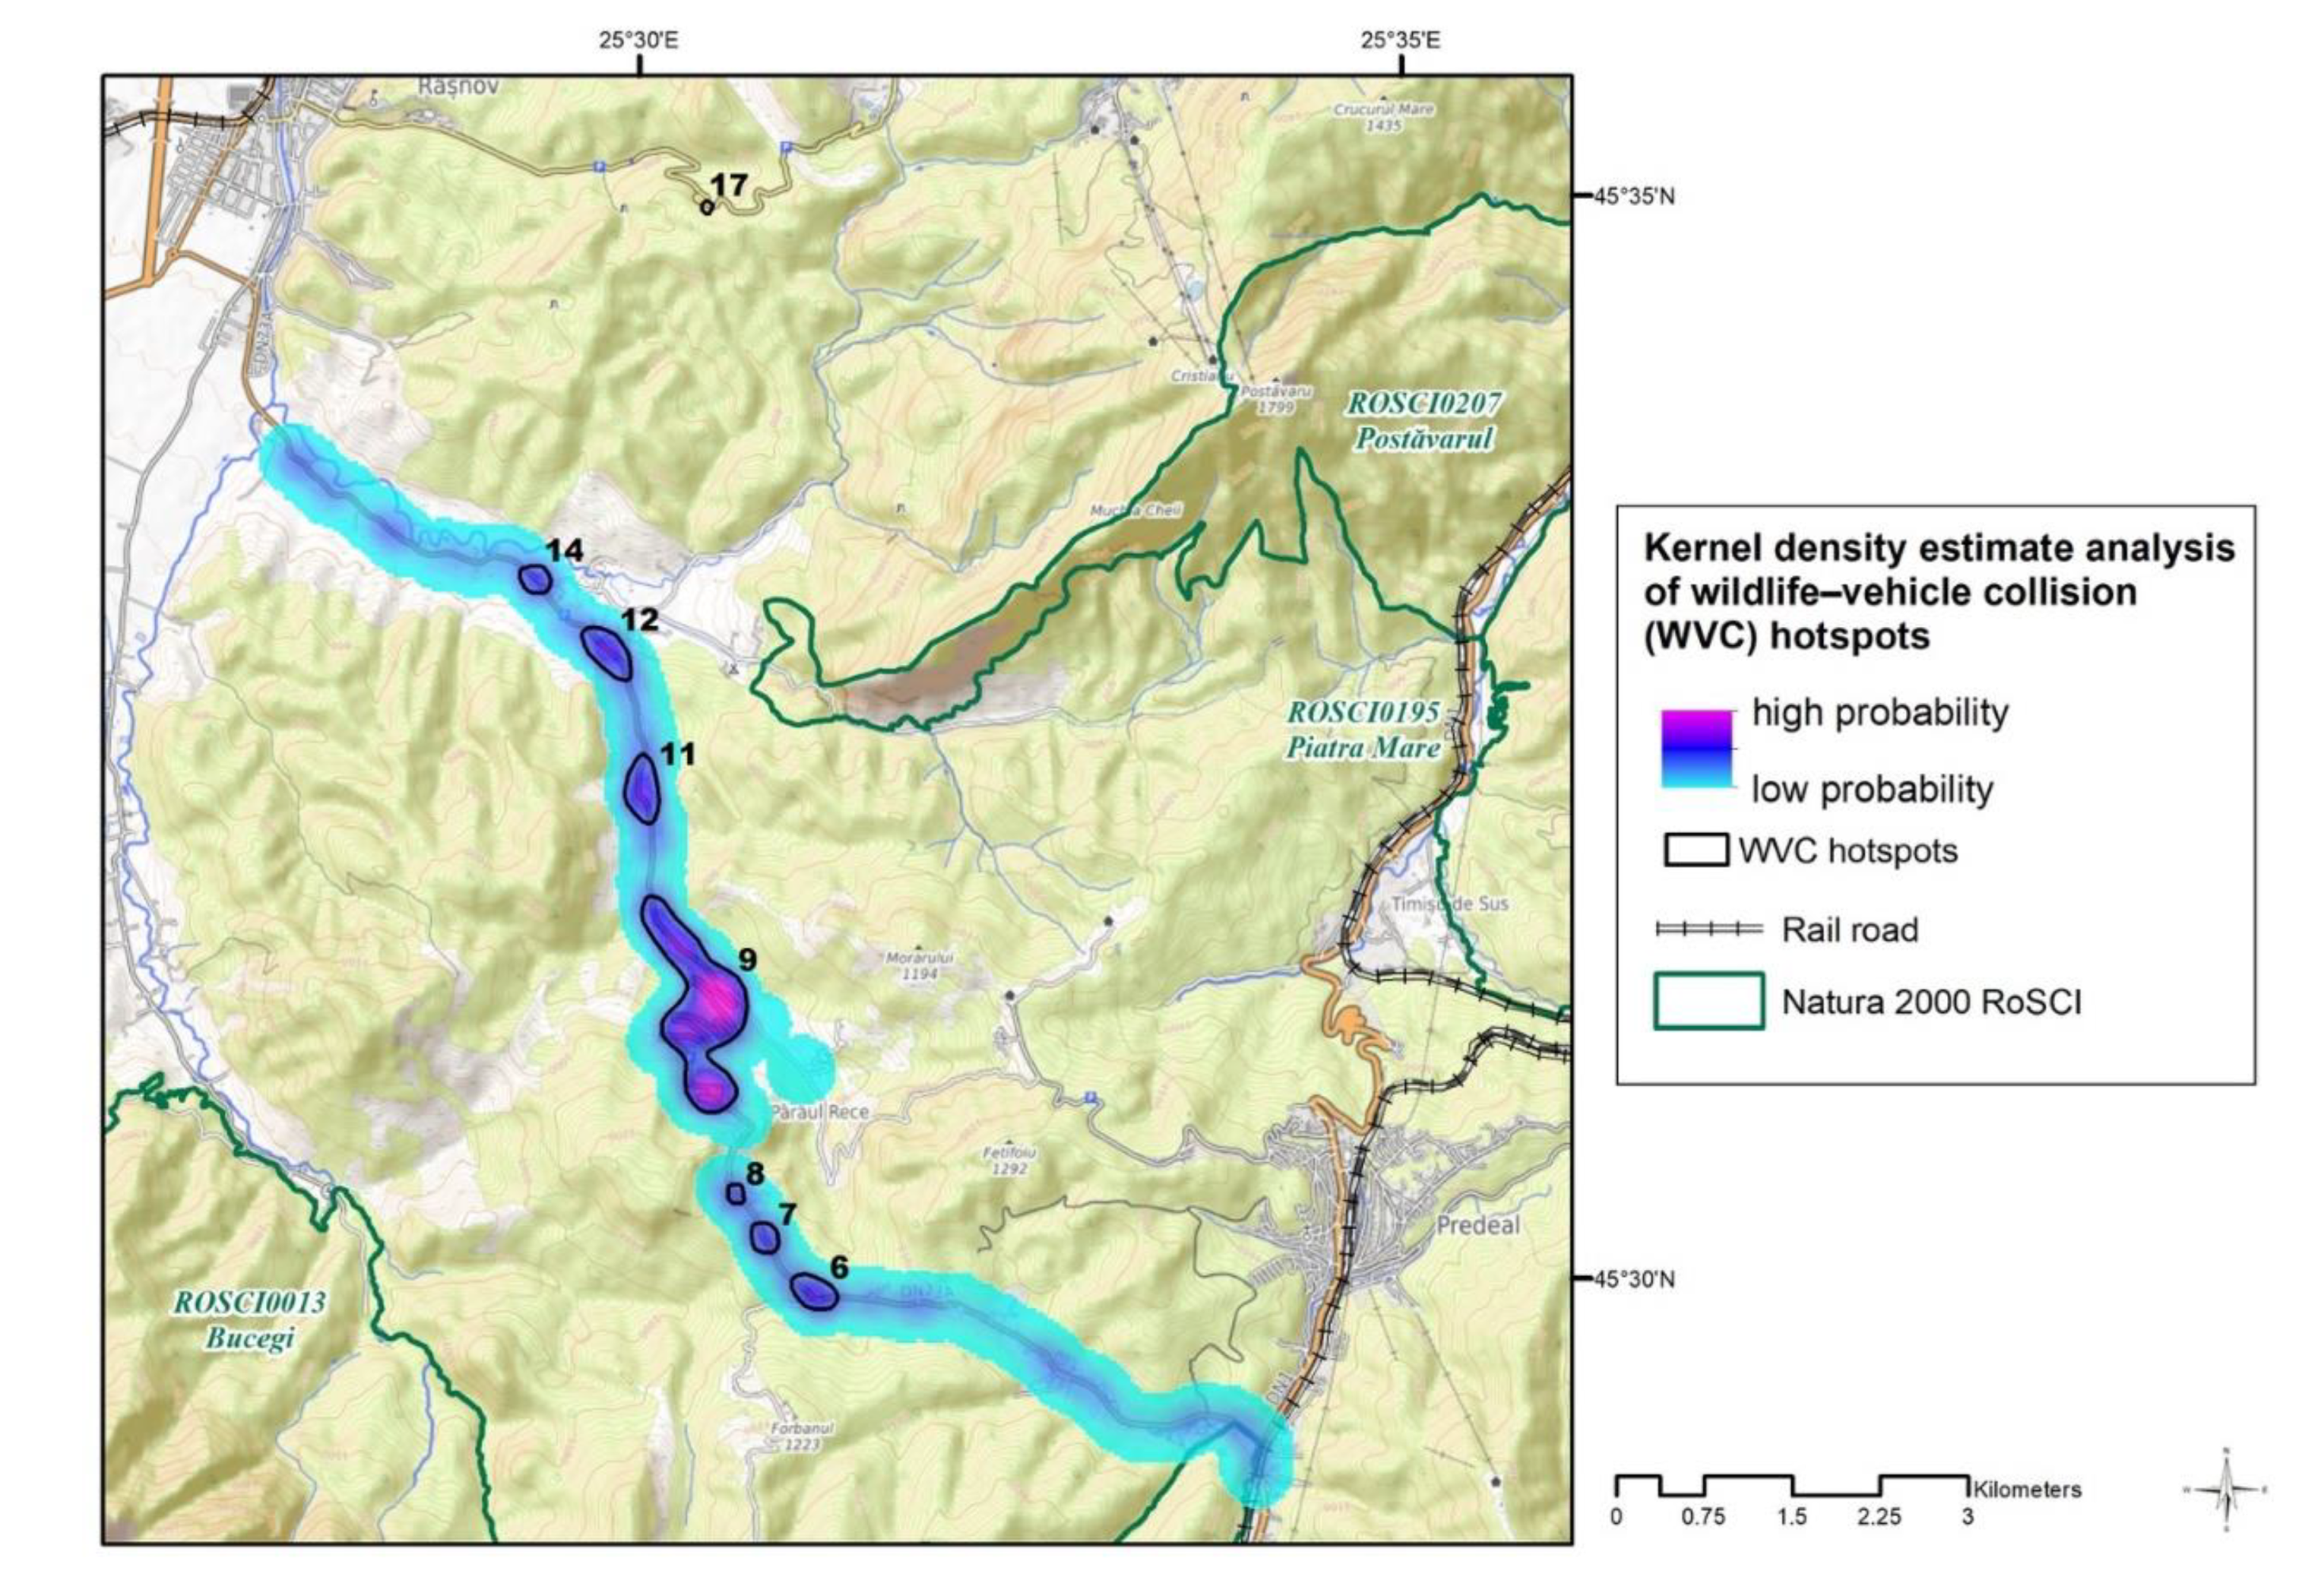
The KDE analysis of the Predeal–Rasnov road (DN73A) (Figure 4) identified seven high-risk hotspots (WVC 6–9, 11, 12, and 14), yet a highway is planned because of high vehicle traffic. Surfaces vary from 0.7 ha (WVC 17) to 74.28 ha (WVC 9). It is the most extensive surface of the entire study area (Table 3) and requires multiple mitigation solutions and a special regime put in place for future infrastructure development.
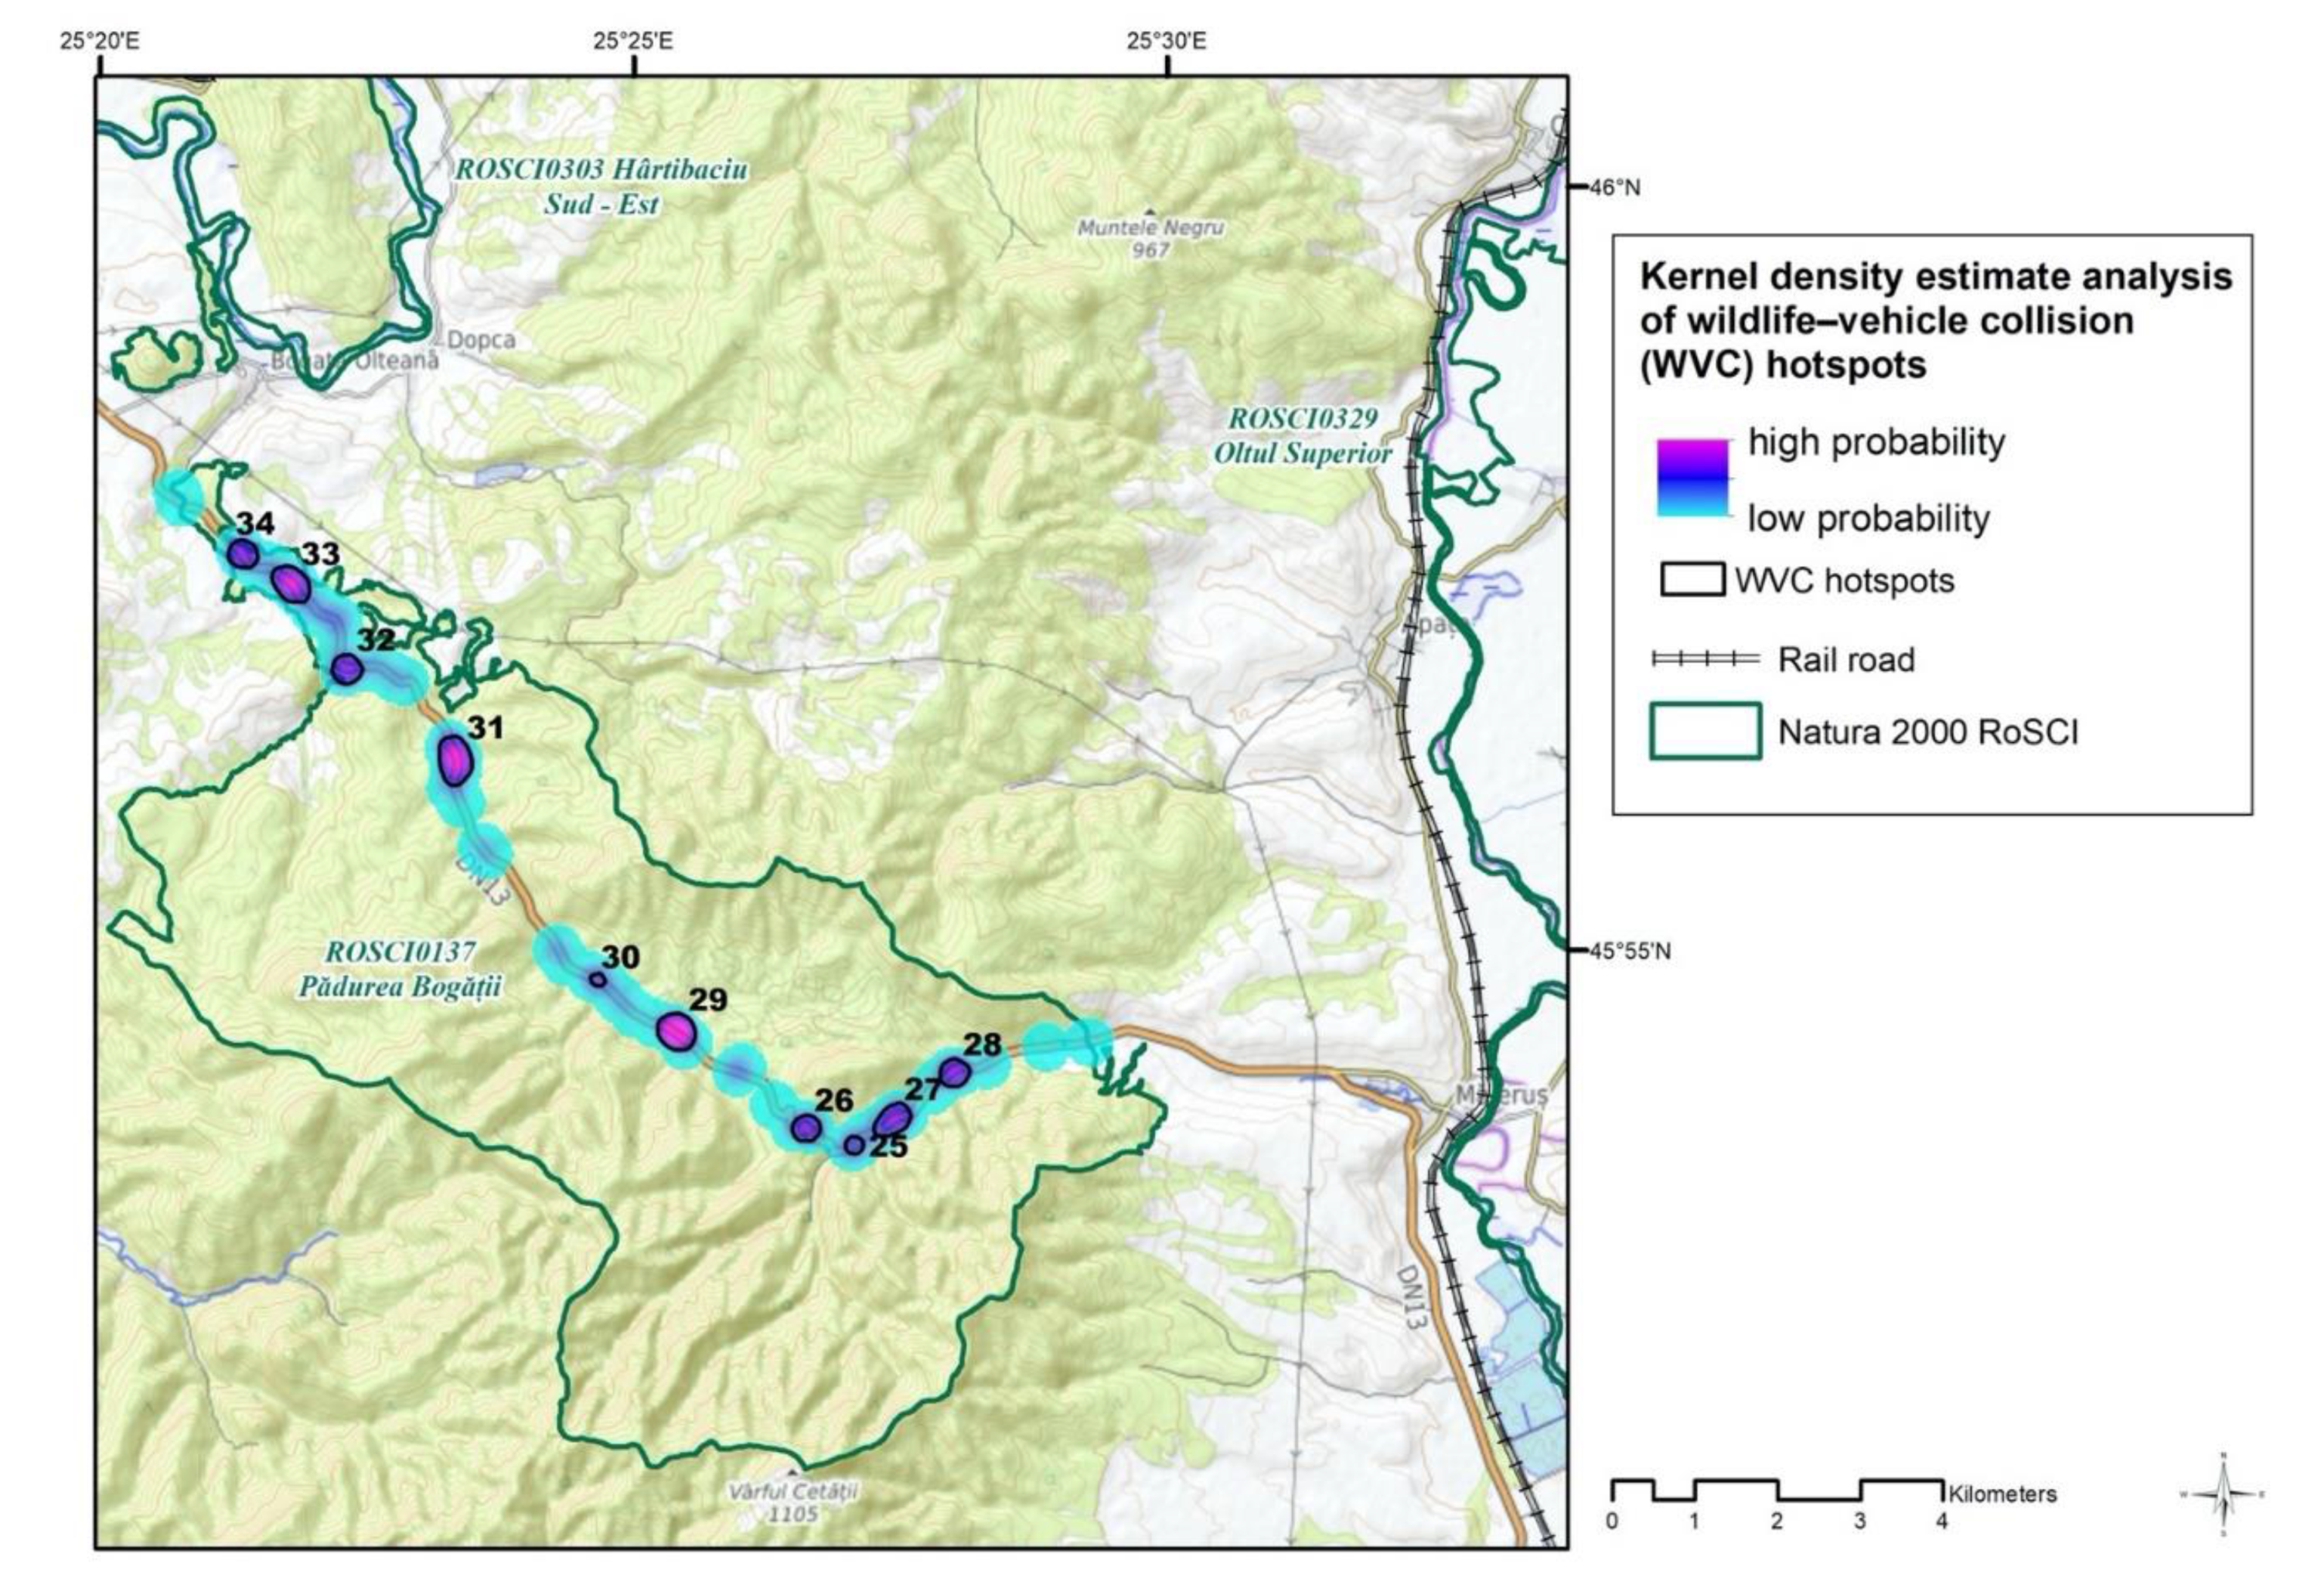
While the first three case studies were complex, mainly due to anthropogenic pressure, the Bogatii Valley is less fragmented and less affected. However, 10 hotspots for collision risks were identified: WVC 25–34 (Figure 5). Most are in broadleaf forests close to the road, while a few are on transitional woodland–shrub and pasture. However, a peculiarity is the presence of concrete embankments, which affect permeability and could create traps and bottlenecks, forcing species to cross the road under unsuitable conditions.
3.2. Road-Kills and Speed Limits
The amount of roadkill seems to be growing as the speed limit increases. The highest number was registered in sectors with a 90 km/h limit, while the lowest were in the 50 km/h limit category (DN1A). However, the large mammals’ numbers were higher on sectors with high speed limits on DN1A (results not shown).
3.3. Mitigation Measures and Digitalization of WVC
To prioritize corridors to mitigate WVCs, we overlaid the existing road infrastructure, the current linear infrastructure development plan, and the protected areas, and, based on expert opinion, we determined the local mitigation solution to be applied.
Our results indicated that local conditions influenced the type of mitigation measure, while the WVC surface determined their number and management practices. Moreover, existing WSWs were found to be insufficient over the entire study area. In Figure 6, we overlaid the current road infrastructure layer, WVC hotspots, and protected areas to provide a digital tool for ensuring traffic safety and reducing wildlife species losses. Moreover, many of the WVC hotspots are located in Natura 2000 sites, such as Piatra Mare ROSCI0195, Bucegi Mountains ROSCI0013, Ciucas ROSCI0038, Aninisurile de pe Tarlung ROSCI0001, and Padurea Bogatii ROSCI0137, while others (DN73A) bisect a crucial conservation area [28]. A combination of mitigation methods is required to address roadkill [43], especially in large surfaces such as WVC 9 on DN73A, WVC 18 on DN1, and WVC 27 on DN13 (Table 3). In all, eight hotspots along the Prahova Valley (DN1) and Rasnov–Predeal (DN73) roads require urgent infrastructure mitigation measures: WVC 1, WVC 2, WVC 3, WVC 4, WVC 9, WVC 15, WVC 18, and WVC 19.
Regarding proposed solutions to mitigate the impact of linear infrastructure, viaducts were suitable for eight WVC hotspots and a green bridge for one, while, for others, an AVC PS, WSW, or virtual fence (VF) was the best solution (Figure 7). For example, in Timisul de Jos (https://life.safe-crossing.eu (accessed on 10 March 2021), the first (VF) was recently installed spanning WVC 18 and 19. It comprises a series of small sensors that detects the light from oncoming cars and sounds an alert to deter an animal from crossing the road [44]. While wildlife fencing could be one of the most effective ways to keep large animals off the road [45], it may create barriers [25]; therefore, we decided not to consider fencing.
However, landscape configuration, WVC surface, vegetation coverage, and species requirements influence the mitigation type, and because many hotspots are in Natura 2000 sites, mitigation measures must have multiple long-term benefits for species conservation. Overall, based on the existing infrastructure, a VF could be the best mitigation measure, and this is supported by previous studies that showed its great potential for reducing roadkill [46].
4. Discussion
The characteristics of WVC locations vary significantly [47], and since they only cover a tiny part of the road infrastructure, they are ideal for targeted mitigation measures [17]. For instance, in our study of the seven hotspots in the Prahova Valley, the road, railway, and river all exert local barrier effects [48], and just installing a simple VF could reduce WVCs to zero [44]. A monitoring system to evaluate the effectiveness of road mitigation measures should be included in road planning practices [37], along with specific criteria included in the Natura 2000 sites management plans for Piatra Mare ROSCI0195 and the Bucegi Mountains ROSCI0013. Integrating mitigation measures at the design phase is far cheaper and more efficient than restoring connectivity and gene flow on existing linear infrastructure [23]. However, well-performed evaluations of the effectiveness of road mitigation measures are needed [37].
Regarding the Sacele-Maneciu study, fewer hotspots were identified, but they bisect two Natura 2000 sites: Ciucas ROSCI0038 and Aninisurile de pe Tarlung ROSCI0001, so they require extra effort to minimize their impact. However, nighttime, the time when the traffic volume is low, corresponds to the main activity period of most animals [43,49].
The Predeal–Rasnov study registered the highest traffic volume during weekends when most tourists travel to and from Bucharest and the Bran region. Moreover, extensive hotspots along the road suggest the need for a complex system of mitigation measures to preserve this area’s ecology [22,28].
The last case study, Valea Bogatii, is very complex, because most of the sector has forests on both sides and close to the road, reducing driver response time and creating low-light conditions. WVCs were more likely to occur where roads crossed valley bottoms near patches of suitable habitat and where vegetation was close to the road [47]. Our results were similar to those obtained in Italy on red deer and roe deer, and in Iran for multispecies, using similar approaches [21,38].
We suspect that the number of large mammals killed on the road is higher than officially reported, considering the traffic volume and that scavengers may have moved carcasses before the research was conducted, or that the carcasses were located far from the area searched, as shown by [50]. The number reported and the datasets collected from the field could also suffer from underestimation due to the lack of wildlife road or train accidents in the reporting system.
Traffic volume and predictable wildlife behavior to perceived risk could help efforts to reduce animal–vehicle collisions and the barrier effect of roads [51]. On the other hand, road mitigation measures can pay off in 2 years, 9–25 years if the WVC hotspot is mitigated, and 16–40 years for the entire road [52]. Even if there is a lack of accurate data regarding the number of incidents, the expense to prevent economic loss is justified: USD 8 billion in the US in 2008 [3]; and in Sweden (in 2015 prices), USD 1.2 million for wild boar and USD 119 million for roe deer accidents [53,54].
For many years, the system for reporting collisions and mortalities lacked a straightforward intervention procedure and institutional responsibility. However, in early 2020, the updated law 407/2006 (Art. 13 (7)) provided a framework to manage WVCs (species from Annex 1 and 2): if warning signs for wildlife crossing (WSWs) are in place, the driver is responsible for damages; if there is no WSW, the road administrator is responsible.
However, road agencies should consider installing mitigation measures on a trial basis to maximize insights gained about their influence on population dynamics [37], and in the near future, police, road administrators, local authorities, insurance companies, forest administrators, scientists, and drivers could collect additional data [55]. Digitization of WVC locations on a landscape scale encourages mitigation investment to focus on areas where it could be most effective [56] and should be considered in an Environmental Impact Assessment and included in any ecological corridor designation.
WVCs should be analyzed in a complex socioeconomic framework: in and around main cities [57], in areas where fragmentation caused by roads is high [58], and along roads where fatalities were the highest in the European Union in 2019 (https://ec.europa.eu/commission/presscorner/detail/en/ip_20_1003 (accessed on 11 January 2021). Moreover, through time, new high-speed infrastructure could decrease animal gene flow in some threatened areas if no proper mitigation measures are taken.
5. Conclusions
Our study is the first in Romania to report on wildlife collision hotspots involving multiple species and suggests practical local solutions for ensuring the safety of both drivers and animals, and directly benefitting landscape planning and sustainable landscape management.
The WVC hotspots identified in the four case studies require immediate action to stop animal fatalities. An emergent issue concerns the Prahova Valley, where the cumulative effect of traffic and existing infrastructure proximity to the railway pose a high threat to animal and human safety. Likewise, the planned linear infrastructure to cross the Prahova Valley and Rasnov–Predeal demands mitigation, as does DN1 around Azuga in the Bucegi Mountains ROSCI0013 and DN73A on Cold River. Knowing the WVC locations will enable road administrators to better cope with stringent time limits when developing road infrastructure. Because many WVC hotspots are in Natura 2000 sites and bisect crucial conservation areas, the designation of ecological corridors to facilitate species movement is urgently needed, according to the newly published IUCN Guidelines.
Author Contributions
M.P. and A.F. conceived of the presented work; A.F. ensured the funding; G.I., M.F. and R.J. gathered most of the samples; M.P. conducted the primary analysis; A.F. and M.F. analyzed and interpreted the data; A.F. wrote the manuscript draft and O.I., M.F., G.I. and R.J. developed tables; and M.P. developed the figures. At the same time, all the authors critically reviewed the manuscript and approved it. All authors have read and agreed to the published version of the manuscript.
Funding
This work was supported by a grant (Nucleu Programme—PN19070601) of the Romanian National Authority for Scientific Research and Innovation, part of a grant of the Romanian National Authority for Scientific Research and Innovation, CCCDI—UEFISCDI, project number BiodivERsA3-2015-147-BearConnect, within PNCDI III (part of the BiodivERsA project BearConnect) and LIFE17NAT/IT/464 SAFE-CROSSING.
Institutional Review Board Statement
Not applicable.
Informed Consent Statement
Not applicable.
Data Availability Statement
Data will be made available by the authors on a repository database.
Conflicts of Interest
The authors have declared that no competing interest exist. All views and opinions expressed herein remain the sole responsibility of the author and do not necessarily represent those of the INCDS Marin Dracea.
References
- Santos, R.A.L.; Mota-Ferreira, M.; Aguiar, L.M.S.; Ascensao, F. Predicting wildlife road-crossing probability from roadkill data using occupancy-detection models. Sci. Total Environ. 2018, 642, 629–637. [Google Scholar] [CrossRef]
- Nielsen, S.E.; Stenhouse, G.B.; Boyce, M.S. A habitat-based framework for grizzly bear conservation in Alberta. Biol. Conserv. 2006, 130, 217–229. [Google Scholar] [CrossRef]
- Huijser, M.P.; McGowen, P.; Fuller, J.; Hardy, A.; Kociolek, A.; Clevenger, A.P.; Smith, D.; Ament, R. Wildlife-Vehicle Collision Reduction Study: Report to Congress; Federal Highway Administration Office of Safety Research and Development: Bozeman, MO, USA, 2008.
- Neumann, W.; Ericsson, G.; Dettki, H.; Bunnefeld, N.; Keuler, N.S.; Helmers, D.P.; Radeloff, V.C. Difference in spatiotemporal patterns of wildlife road-crossings and wildlife-vehicle collisions. Biol. Conserv. 2012, 145, 70–78. [Google Scholar] [CrossRef]
- Litvaitis, J.A.; Tash, J.P. An approach toward understanding wildlife-vehicle collisions. Environ. Manag. 2008, 42, 688–697. [Google Scholar] [CrossRef] [PubMed]
- Bennett, V.J. Effects of Road Density and Pattern on the Conservation of Species and Biodiversity. Curr. Landsc. Ecol. Rep. 2017, 2, 1–11. [Google Scholar] [CrossRef]
- Northrup, J.M.; Pitt, J.; Muhly, T.B.; Stenhouse, G.B.; Musiani, M.; Boyce, M.S. Vehicle traffic shapes grizzly bear behaviour on a multiple-use landscape. J. Appl. Ecol. 2012, 49, 1159–1167. [Google Scholar] [CrossRef] [Green Version]
- Joyce, T.L.; Mahoney, S.P. Spatial and Temporal Distributions of Moose-Vehicle Collisions in Newfoundland. Wildl. Soc. Bull. 2001, 29, 281–291. [Google Scholar]
- Ramp, D.; Wilson, V.K.; Croft, D.B. Assessing the impacts of roads in peri-urban reserves: Road-based fatalities and road usage by wildlife in the Royal National Park, New South Wales, Australia. Biol. Conserv. 2006, 129, 348–359. [Google Scholar] [CrossRef]
- Found, R.; Boyce, M.S. Predicting deer-vehicle collisions in an urban area. J. Environ. Manag. 2011, 92, 2486–2493. [Google Scholar] [CrossRef]
- Seiler, A. Predicting locations of moose-vehicle collisions in Sweden. J. Appl. Ecol. 2005, 42, 371–382. [Google Scholar] [CrossRef]
- Lewis, J.S.; Rachlow, J.L.; Horne, J.S.; Garton, E.O.; Wakkinen, W.L.; Hayden, J.; Zager, P. Identifying habitat characteristics to predict highway crossing areas for black bears within a human-modified landscape. Landsc. Urban Plan. 2011, 101, 99–107. [Google Scholar] [CrossRef]
- Clevenger, A.P.; Wierzchowski, J.; Chruszcz, B.; Gunson, K. GIS-Generated, Expert-Based Models for Identifying Wildlife Habitat Linkages and Planning Mitigation Passages. Conserv. Biol. 2002, 16, 503–514. [Google Scholar] [CrossRef]
- Snow, N.P.; Williams, D.M.; Porter, W.F. A landscape-based approach for delineating hotspots of wildlife-vehicle collisions. Landsc. Ecol. 2014, 29, 817–829. [Google Scholar] [CrossRef] [Green Version]
- Chung, K.; Jang, K.; Madanat, S.; Washington, S. Proactive detection of high collision concentration locations on highways. Procedia Soc. Behav. Sci. 2011, 17, 634–645. [Google Scholar] [CrossRef] [Green Version]
- Bil, M.; Andrasik, R.; Janoska, Z. Identification of hazardous road locations of traffic accidents by means of kernel density estimation and cluster significance evaluation. Accid. Anal. Prev. 2013, 55, 265–273. [Google Scholar] [CrossRef] [PubMed]
- Bil, M.; Andrasik, R.; Dula, M.; Sedonik, J. On reliable identification of factors influencing wildlife-vehicle collisions along roads. J. Environ. Manag. 2019, 237, 297–304. [Google Scholar] [CrossRef] [PubMed]
- Ascensão, F.; Desbiez, A.L.J.; Medici, E.P.; Bager, A. Spatial patterns of road mortality of medium–large mammals in Mato Grosso do Sul, Brazil. Wildl. Res. 2017, 44. [Google Scholar] [CrossRef]
- Kučas, A.; Balčiauskas, L. Roadkill-Data-Based Identification and Ranking of Mammal Habitats. Land 2021, 10, 477. [Google Scholar] [CrossRef]
- Romin, L.A.; Bissonette, J.A. Vehicle Collisions: Status of State Monitoring Activities and Mitigation Efforts. Wildl. Soc. Bull. 1996, 24, 276–283. [Google Scholar]
- Trocmé, M.; Cahill, S.; Vries, J.D.; Farall, H.; Folkeson, L.; Fry, G.; Hicks, C.; Peymen, L. COST 341—Habitat Fragmentation Due to Transportation Infrastructure: The European Review; Office for Official Publications of the European Communities: Luxembourg, 2003; pp. 129–174. [Google Scholar]
- Hilty, J.; Worboys, G.; Keeley, A.; Woodley, S.; Lausche, B.; Locke, H.; Carr, M.; Pittock, J.; White, W. Guidelines for Protecting the Interconnections of Nature to Enhance Protected Areas, Conserve Biodiversity, and Increase Resilience to Climate Change; IUCN: Gland, Switzerland, 2020. [Google Scholar] [CrossRef]
- Fedorca, A.; Russo, I.M.; Ionescu, O.; Ionescu, G.; Popa, M.; Fedorca, M.; Curtu, A.L.; Sofletea, N.; Tabor, G.M.; Bruford, M.W. Inferring fine-scale spatial structure of the brown bear (Ursus arctos) population in the Carpathians prior to infrastructure development. Sci. Rep. 2019, 9, 9494. [Google Scholar] [CrossRef]
- van der Grift, E.A. Defragmentation in the Netherlands: A Success Story? GAIA-Ecol. Perspect. Sci. Soc. 2005, 14, 144–147. [Google Scholar] [CrossRef]
- Zeller, K.A.; Wattles, D.W.; DeStefano, S. Incorporating Road Crossing Data into Vehicle Collision Risk Models for Moose (Alces americanus) in Massachusetts, USA. Environ. Manag. 2018, 62, 518–528. [Google Scholar] [CrossRef] [PubMed]
- Zeller, K.A.; Wattles, D.W.; Destefano, S. Evaluating methods for identifying large mammal road crossing locations: Black bears as a case study. Landsc. Ecol. 2020, 35, 1799–1808. [Google Scholar] [CrossRef]
- Chapron, G.; Kaczensky, P.; Linnell, J.D.C.; Arx, M.v.; Huber, D.; Andrén, H.; López-Bao, J.V.; Adamec, M.; Álvares, F.; Anders, O.; et al. Recovery of large carnivores in Europe’s modern human-dominated landscapes. Science 2014, 346. [Google Scholar] [CrossRef] [PubMed] [Green Version]
- Fedorca, A.; Popa, M.; Jurj, R.; Ionescu, G.; Ionescu, O.; Fedorca, M. Assessing the regional landscape connectivity for multispecies to coordinate on-the-ground needs for mitigating linear infrastructure impact in Brasov—Prahova region. J. Nat. Conserv. 2020, 58. [Google Scholar] [CrossRef]
- Grilo, C.; Koroleva, E.; Andrášik, R.; Bíl, M.; González-Suárez, M. Roadkill risk and population vulnerability in European birds and mammals. Front. Ecol. Environ. 2020. [Google Scholar] [CrossRef]
- Whittington, J.; Forshner, A. An Analysis of Wildlife Snow Tracking, Winter Transect, and Highway Underpass Data in the Eastern Bow Valley; Alta Lake and Bridgeport State Parks: Canmore, AB, Canada, 2009; p. 25. [Google Scholar]
- Waller, J.S.; Servheen, C. Effects of transportation infrastructure on grizzly bears in Northwestern Montana. J. Wildl. Manag. 2005, 69, 985–1000. [Google Scholar] [CrossRef]
- Ruediger, B.; Claar, J.; Gniadek, S.; Holt, B.; Lewis, L.; Mighton, S.; Rinaldi, T.; Trick, J.; Vandehrey, A.; Wahl, F.; et al. Canada Lynx Conservation Assessment and Strategy Report: 1–135; Missoula, M.T., Ed.; USDA Forest Service; USDI Fish and Wildlife Service; USDI Bureau of Land Management; USDI National Park Service: Washington, DC, USA, 2000.
- Pelletier, A.; Obbard, M.E.; Mills, K.; Howe, E.J.; Burrows, F.G.; White, B.N.; Kyle, C.J. Delineating genetic groupings in continuously distributed species across largely homogeneous landscapes: A study of American black bears (Ursus americanus) in Ontario, Canada. Can. J. Zool. Rev. Can. Zool. 2012, 90, 999–1014. [Google Scholar] [CrossRef]
- Favilli, F.; Bíl, M.; Sedoník, J.; Andrášik, R.; Kasal, P.; Agreiter, A.; Streifeneder, T. Application of KDE+ software to identify collective risk hotspots of ungulate-vehicle collisions in South Tyrol, Northern Italy. Eur. J. Wildl. Res. 2018, 64. [Google Scholar] [CrossRef]
- Mohammadi, A.; Kaboli, M. Evaluating wildlife–vehicle collision hotspots using kernel-based estimation: A focus on the endangered Asiatic cheetah in central Iran. Hum. Wildl. Interact. 2016, 10, 103–109. [Google Scholar] [CrossRef]
- Fedorca, A.; Ionescu, G.; Simion, I.; Fedorca, M. Analysis of Traffic Situation in Intensely Circulated Areas of Prahova Valley; Revista de Silvicultura si Cinegetica: Brasov, Romania, 2019; p. 45. [Google Scholar]
- van der Grift, E.A.; van der Ree, R.; Fahrig, L.; Findlay, S.; Houlahan, J.; Jaeger, J.A.G.; Klar, N.; Madriñan, L.F.; Olson, L. Evaluating the effectiveness of road mitigation measures. Biodivers. Conserv. 2012, 22, 425–448. [Google Scholar] [CrossRef] [Green Version]
- Canova, L.; Balestrieri, A. Long-term monitoring by roadkill counts of mammal populations living in intensively cultivated landscapes. Biodivers. Conserv. 2018, 28, 97–113. [Google Scholar] [CrossRef]
- Anderson, T.K. Kernel density estimation and K-means clustering to profile road accident hotspots. Accid. Anal. Prev. 2009, 41, 359–364. [Google Scholar] [CrossRef] [PubMed]
- Silverman, B.W. Density Estimation for Statistics and Data Analysis. In Monographs on Statistics and Applied Probability; Chapman and Hall: London, UK, 1986. [Google Scholar]
- Bodansky, E.; Gribov, A.; Morako, P. Smoothing and Compression of Lines Obtained by Raster-to-Vector Conversion. In Graphics Recognition Algorithms and Applications. GREC 2001. Lecture Notes in Computer Science; Blostein, D., Kwon, Y.B., Eds.; Springer: Berlin/Heidelberg Germany, 2002; Volume 2390, pp. 256–265. [Google Scholar] [CrossRef]
- Clevenger, A.P.; Huijser, M.P. Wildlife Crossing Structure Handbook Design and Evaluation in North America; Federal Highway Administration Planning, Environment and Reality: Bozeman, MO, USA, 2011. [Google Scholar]
- Barrueto, M.; Ford, A.T.; Clevenger, A.P. Anthropogenic effects on activity patterns of wildlife at crossing structures. Ecosphere 2014, 5. [Google Scholar] [CrossRef]
- Fedorca, M.; Ionescu, G.; Voda, F.; Voda, G.; Fedorca, A. First Virtual Fence System Installed in Romania for Reducing Wildlife—Vehicle Collisions; Revista de Silvicultura si Cinegetica: Brasov, Romania, 2020; Volume 47, pp. 77–80. [Google Scholar]
- Huijser, M.P.; Begley, J.S. Procedures and Tools for Wildlife-Vehicle Collision Hotspot Analyses; Using Caltrans District 10 as an Example; California Department of Transportation: Bozeman, MO, USA, 2014.
- Fox, S.; Potts, J.M.; Pemberton, D.; Crosswell, D. Roadkill mitigation: Trialing virtual fence devices on the west coast of Tasmania. Aust. Mammal. 2019, 41. [Google Scholar] [CrossRef]
- Laliberte, J.; St-Laurent, M.H. In the wrong place at the wrong time: Moose and deer movement patterns influence wildlife-vehicle collision risk. Accid. Anal. Prev. 2020, 135, 105365. [Google Scholar] [CrossRef] [PubMed]
- Cowlishaw, G. Predicting the Pattern of Decline of African Primate Diversity: An Extinction Debt from Historical Deforestation. Conserv. Biol. 1999, 13, 1183–1193. [Google Scholar] [CrossRef]
- Kušta, T.; Keken, Z.; Ježek, M.; Holá, M.; Šmíd, P. The effect of traffic intensity and animal activity on probability of ungulate-vehicle collisions in the Czech Republic. Saf. Sci. 2017, 91, 105–113. [Google Scholar] [CrossRef]
- Ascensão, F.; Yogui, D.R.; Alves, M.H.; Alves, A.C.; Abra, F.; Desbiez, A.L.J. Preventing wildlife roadkill can offset mitigation investments in short-medium term. Biol. Conserv. 2021, 253. [Google Scholar] [CrossRef]
- Jacobson, S.L.; Bliss-Ketchum, L.L.; Rivera, C.E.d.; Smith, W.P. A behavior-based framework for assessing barrier effects to wildlife from vehicle traffic volume. Ecosphere 2016, 7, e01345. [Google Scholar] [CrossRef]
- Wilkins, D.C.; Kockelman, K.M.; Jiang, N. Animal-vehicle collisions in Texas: How to protect travelers and animals on roadways. Accid. Anal. Prev. 2019, 131, 157–170. [Google Scholar] [CrossRef] [PubMed]
- Svensson, T.H.G.; Gren, I.-M.; Andersson, H.; Jansson, G.; Annika, J. Costs of Traffic Accidents with Wild Boar Populations in Sweden; Working Paper Series 2014; Department of Economics, Swedish University of Agricultural Sciences: Uppsala, Sweden, 2014. [Google Scholar]
- Gren, I.-M.; Jägerbrand, A. Calculating the costs of animal-vehicle accidents involving ungulate in Sweden. Transp. Res. Part D Transp. Environ. 2019, 70, 112–122. [Google Scholar] [CrossRef]
- Morelle, K.; Lehaire, F.; Lejeune, P. Spatio-temporal patterns of wildlife-vehicle collisions in a region with a high-density road network. Nat. Conserv. 2013, 5, 53–73. [Google Scholar] [CrossRef] [Green Version]
- Newbold, T.; Hudson, L.N.; Hill, S.L.; Contu, S.; Lysenko, I.; Senior, R.A.; Borger, L.; Bennett, D.J.; Choimes, A.; Collen, B.; et al. Global effects of land use on local terrestrial biodiversity. Nature 2015, 520, 45–50. [Google Scholar] [CrossRef] [Green Version]
- Grigorescu, I.; Kucsicsa, G.; Popovici, E.-A.; Mitrică, B.; Mocanu, I.; Dumitraşcu, M. Modelling land use/cover change to assess future urban sprawl in Romania. Geocarto Int. 2019, 1–19. [Google Scholar] [CrossRef]
- Pătru-Stupariu, I.; Stupariu, M.-S.; Tudor, C.A.; Grădinaru, S.R.; Gavrilidis, A.; Kienast, F.; Hersperger, A.M. Landscape fragmentation in Romania’s Southern Carpathians: Testing a European assessment with local data. Landsc. Urban Plan. 2015, 143, 1–8. [Google Scholar] [CrossRef]
Figure 1.
Study area in the Southern Eastern Romanian Carpathians and the roads’ location (DN1—red; DN73A—green; DN1A—blue; DN13—yellow).
Figure 1.
Study area in the Southern Eastern Romanian Carpathians and the roads’ location (DN1—red; DN73A—green; DN1A—blue; DN13—yellow).

Figure 2.
Model-based estimation of collision risk for Prahova Valley (DN1). High probability is represented in purple, and the WVC hotspot is dark circled.
Figure 2.
Model-based estimation of collision risk for Prahova Valley (DN1). High probability is represented in purple, and the WVC hotspot is dark circled.

Figure 3.
Model-based estimation of collision risk for Sacele–Maneciu (DN1A). High probability is represented in purple, and the WVC hotspot is dark circled.
Figure 3.
Model-based estimation of collision risk for Sacele–Maneciu (DN1A). High probability is represented in purple, and the WVC hotspot is dark circled.

Figure 4.
Model-based estimation of collision risk for Predeal–Rasnov (DN73A). High probability is represented in purple, and the WVC hotspot is dark circled.
Figure 4.
Model-based estimation of collision risk for Predeal–Rasnov (DN73A). High probability is represented in purple, and the WVC hotspot is dark circled.

Figure 5.
Model-based estimation of collision risk for Bogatii Valley (DN13). High probability is represented in purple, and the WVC hotspot is dark circled.
Figure 5.
Model-based estimation of collision risk for Bogatii Valley (DN13). High probability is represented in purple, and the WVC hotspot is dark circled.

Figure 6.
WVC hotspot and the mitigation measures proposed on the existing infrastructure.

Figure 7.
WVC hotspot and the mitigation measures proposed to be included on the planned linear infrastructure.
Figure 7.
WVC hotspot and the mitigation measures proposed to be included on the planned linear infrastructure.


Table 1.
Geographic coordinates for the analyzed roads.
| Road ID | Road Name | L_km | Longitude_ Start | Latitude_ Start | Longitude_ Middle | Latitude_ Middle | Longitude_ End | Latitude_ End |
|---|---|---|---|---|---|---|---|---|
| DN73A | Predeal—Rasnov | 17.38 | 25.458306 | 45.566100 | 25.503381 | 45.520229 | 25.565210 | 45.486959 |
| DN1A | Sacele—Maneciu | 51.47 | 25.708819 | 45.622253 | 25.885344 | 45.485949 | 25.979315 | 45.326025 |
| DN1 | Prahova Valley | 50.99 | 25.708819 | 45.622253 | 25.561324 | 45.470219 | 25.619251 | 45.284737 |
| DN13 | Bogatii Valley | 18.50 | 25.332324 | 45.975736 | 25.404895 | 45.914955 | 25.495926 | 45.907309 |
Road ID = road name in the national classification system; L_km = length of the road in kilometers; Longitude_Start, Middle, End = longitude along the road length in WGS84; Latitude_Start, Middle, End = latitude along the road length in WGS84.
Table 2.
Speed limits and wildlife warning signs in the four case studies.
| Prahova Valley (DN1) | Predeal–Rasnov (DN73A) | Sacele–Maneciu (DN1A) | Bogatii Valley (DN13) | ||||||||
|---|---|---|---|---|---|---|---|---|---|---|---|
| SL | L | WSW | SL | L | WSW | SL | L | WSW | SL | L | WSW |
| 50 | 4.9 | 4 | 30 | 0.5 | 0 | 20 | 2.4 | 4 | 40 | 0.6 | 2 |
| 70 | 20.2 | 50 | 4.1 | 30 | 3.4 | 60 | 12.3 | ||||
| 80 | 9.9 | 70 | 0.9 | 40 | 15.6 | - | - | ||||
| 90 | 15.2 | 90 | 11.1 | 50 | 5.1 | - | - | ||||
| - | - | - | - | 90 | 24.4 | - | - | ||||
L—sector length (km), SL—speed limit (km/h), WWS—a wildlife warning sign.
Table 3.
Proposed mitigation measures for the existing and future infrastructure for each WVC hotspot.
Table 3.
Proposed mitigation measures for the existing and future infrastructure for each WVC hotspot.
| WVC | Road/Location Name | Mitigation Measures on Existing Infrastructure | Mitigation Measures on Linear Infrastructure | WVC Hotspot Surface (ha) | Medium Distance from WVC Center to Vegetation (m) | Average Slope in the WVC |
|---|---|---|---|---|---|---|
| 1 | DN1/Sinaia | WSW | WSW | 2.3803 | 744.8 | 17.8 |
| 2 | DN1/Azuga 1 | VF | Viaduct | 6.8984 | 932.1 | 27.2 |
| 3 | DN1/Azuga 2 | WSW | Viaduct | 8.7819 | 966.3 | 29.6 |
| 4 | DN1/Azuga 3 | VF | Green bridge | 6.2131 | 979 | 24.4 |
| 5 | DN1A/Cheia | WSW | WSW | 4.5036 | 966.5 | 16.1 |
| 6 | DN73A/Paraul Rece 1 | VF | Viaduct | 8.4956 | 1092.60 | 20.9 |
| 7 | DN73A/Paraul Rece 2 | VF | WSW | 4.8785 | 1108.30 | 31.9 |
| 8 | DN73A/Paraul Rece 3 | VF | WSW | 1.8759 | 1073.40 | 32.3 |
| 9 | DN73A/Paraul Rece 4 | VF, WSW, AVC | Viaduct | 74.2823 | 877 | 27.4 |
| 10 | DN1A/Babarunca | VF | AVC | 0.547 | 873.8 | 12.9 |
| 11 | DN73A/Paraul Rece 5 | AVC | Viaduct | 12.2627 | 742.8 | 11.2 |
| 12 | DN73A/Cheile Rasnoavei 1 | VF | Viaduct | 11.632 | 714.7 | 12.2 |
| 13 | DN1A/Sacele 1 | VF | WSW | 0.2871 | 817.7 | 6.8 |
| 14 | DN73A/Cheile Rasnoavei 2 | WSW | VF | 4.9574 | 695 | 5.2 |
| 15 | DN1/Timisul de Sus | VF | Green bridge | 4.5344 | 798.4 | 46.9 |
| 16 | DN1A/Sacele 2 | AVC | AVC | 23.8224 | 790.6 | 35.7 |
| 18 | DN1/Timisul de Jos 1 | VF, WSW | WSW | 0.7832 | 890.2 | 65 |
| 19 | DN1/Timisul de Jos 2 | VF | AVC | 12.036 | 721.9 | 29.5 |
| 25 | DN13/Valea Bogatii 1 | WSW | WSW | 5.6678 | 719.6 | 45.1 |
| 26 | DN13/Valea Bogatii 2 | WSW | WSW | 4.0412 | 532.7 | 35.2 |
| 27 | DN13/Valea Bogatii 3 | VF, WSW | Viaduct | 22.4453 | 499.1 | 13.1 |
| 28 | DN13/Valea Bogatii 4 | WSW | WSW | 1.8891 | 541.1 | 6.5 |
| 29 | DN13/Valea Bogatii 5 | WSW | WSW | 0.058 | 409 | 0.9 |
| 30 | DN13/Valea Bogatii 6 | WSW | WSW | 5.2627 | 411.1 | 3.8 |
| 31 | DN13/Valea Bogatii 7 | AVC | WSW | 3.5389 | 642.9 | 37.5 |
| 32 | DN13/Valea Bogatii 8 | VF | VF | 8.3874 | 677.4 | 25.1 |
| 33 | DN13/Valea Bogatii 9 | VF | Viaduct | 12.4276 | 639 | 43 |
| 34 | DN13/Valea Bogatii 10 | VF | VF | 9.223 | 622.2 | 51.7 |
Warning sign for wildlife crossing (WSW), virtual fence (VF), AVC Prevention System.
Publisher’s Note: MDPI stays neutral with regard to jurisdictional claims in published maps and institutional affiliations. |
© 2021 by the authors. Licensee MDPI, Basel, Switzerland. This article is an open access article distributed under the terms and conditions of the Creative Commons Attribution (CC BY) license (https://creativecommons.org/licenses/by/4.0/).
Share and Cite
MDPI and ACS Style
Fedorca, A.; Fedorca, M.; Ionescu, O.; Jurj, R.; Ionescu, G.; Popa, M. Sustainable Landscape Planning to Mitigate Wildlife–Vehicle Collisions. Land 2021, 10, 737. https://doi.org/10.3390/land10070737
AMA Style
Fedorca A, Fedorca M, Ionescu O, Jurj R, Ionescu G, Popa M. Sustainable Landscape Planning to Mitigate Wildlife–Vehicle Collisions. Land. 2021; 10(7):737. https://doi.org/10.3390/land10070737
Chicago/Turabian StyleFedorca, Ancuta, Mihai Fedorca, Ovidiu Ionescu, Ramon Jurj, Georgeta Ionescu, and Marius Popa. 2021. "Sustainable Landscape Planning to Mitigate Wildlife–Vehicle Collisions" Land 10, no. 7: 737. https://doi.org/10.3390/land10070737
Note that from the first issue of 2016, this journal uses article numbers instead of page numbers. See further details here.