
Dynamic Amazonia: The EU–Mercosur Trade Agreement and Deforestation


1
Department of Geography and the Environment, University of Texas at Austin, 305 E. 23rd St., A3100, Austin, TX 78712, USA
2
Amazon Institute of People and the Environment (IMAZON), Ed. Zion Business, Tv. Dom Romualdo de Seixas, 1698, Belém 66055-200, Brazil
3
Department of Agricultural Economics, Purdue University, 403 West State St., West Lafayette, IN 47907-5056, USA
*
Author to whom correspondence should be addressed.
Land 2021, 10(11), 1243; https://doi.org/10.3390/land10111243
Submission received: 20 July 2021
/
Revised: 4 November 2021
/
Accepted: 10 November 2021
/
Published: 13 November 2021
(This article belongs to the Special Issue Dynamic Amazonia: Lessons for a Changing World)
Abstract
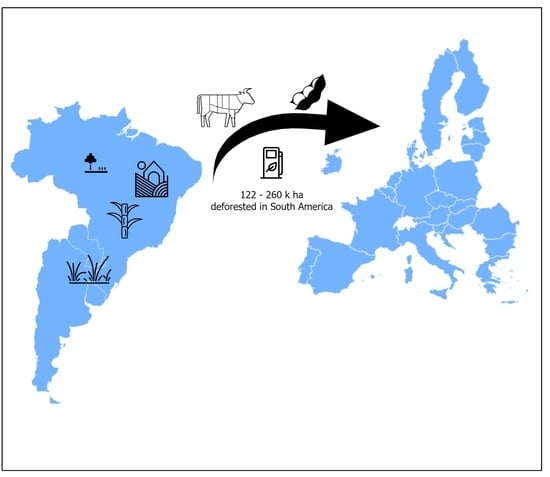
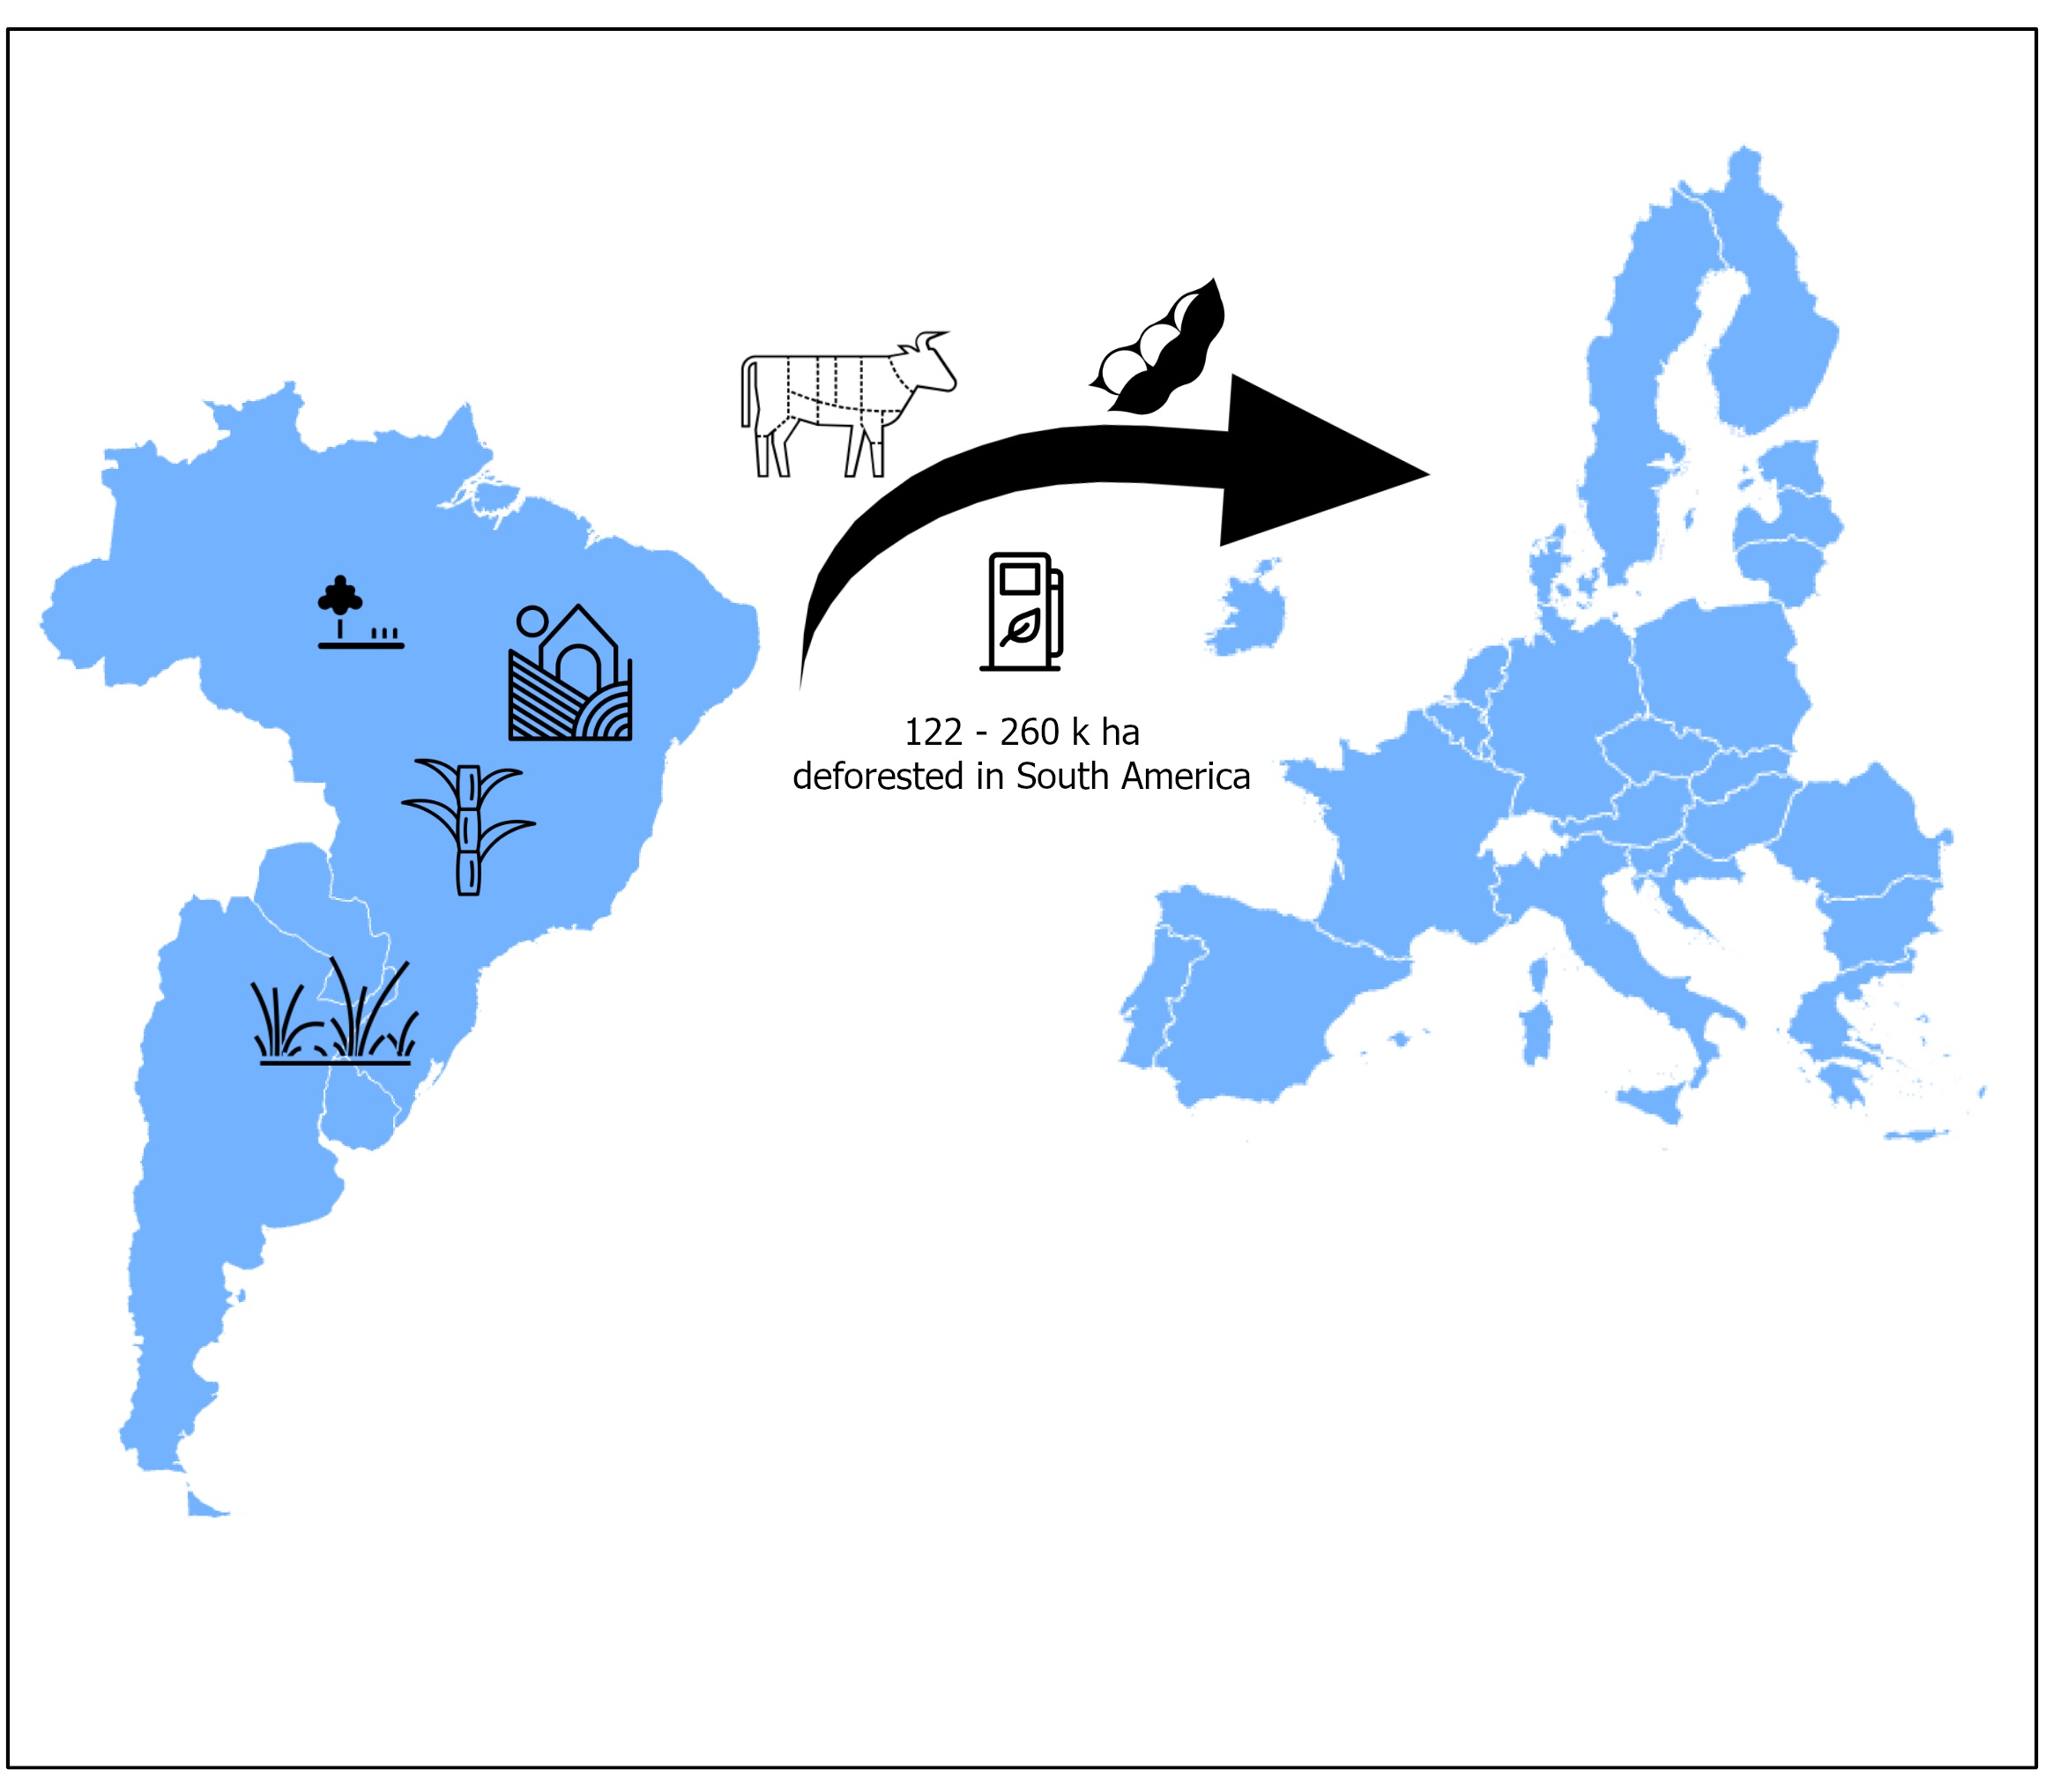
:The trade agreement between the European Union and the Mercosur countries will increase deforestation in the Mercosur countries and Brazil, in particular, if ratified by member countries. We use a computable general equilibrium model to analyze how trade, land use, and agricultural production will change as a result of the agreement. We then use a statistical model to spatially allocate the predicted deforestation within the Brazilian Amazon. The models estimate that the agreement will cause additional deforestation in Brazil ranging from 56 to 173 thousand ha to accommodate increases in cropland area, depending on the level of governance, use of double-cropping techniques, and trade elasticity parameters. Most additional deforestation in Amazonia would be clustered near current deforestation hotspot areas. Some hotspots threaten the integrity of Indigenous lands and conservation units. Although a low deforestation scenario with gains in welfare is theoretically possible when high governance and multiple-cropping systems are in place, political challenges remain and cast doubt on Brazil’s ability to rein on illegal deforestation.
1. Introduction
Brazil, with its vast reserves of farmland and advanced agricultural technology, has become an agricultural powerhouse and is now a leading exporter of many commodities, including soybeans, beef, and poultry, to name a few. The agribusiness sector as a whole accounts for almost 25% of the country’s GDP and is one of the few sectors that has not been impacted by the economic downturn that impinged on the country since 2014 [1]. Part of this robustness is due to the sector’s reliance on exports, which continues to thrive even during the COVID-19 pandemic [2].
Despite this prominent role in Brazil’s economy, expansion of the agribusiness sector into the Amazon has created concerns about the future and sustainability of the biome, particularly now that pastures and croplands have replaced nearly 20% of its original extent. Deforestation is associated with important socio-environmental issues, including greenhouse gases emissions, loss of biodiversity, disruption of biogeochemical and water cycles, land conflicts, and threats to Indigenous populations [3,4,5,6]. These concerns have been intensified by this year’s drought in Brazil, the worst in almost a century, thus affecting rain-fed agriculture, hydroelectricity generation, and supply of water for urban and industrial consumption in many parts of the country [7]. The current drought is a presage of what scientists expect to occur more often in the coming decades, wherein the Amazonian forest is predicted to transition to a drier, savanna-like vegetation beyond a “tipping-point” of recovery if deforestation and global warming trends continue unabated [8,9,10].
Amazonian forests pump moisture to the atmosphere which is then transported over South America, forming ‘atmospheric rivers’ and disruptions to this surface–atmosphere coupling through deforestation also disrupts the hydrological cycle and rainfall regime in the continent [10,11]. The resulting socio-economic consequences of repeated and extended droughts in South America will be multidimensional, and the magnitude of these losses are yet to be fully quantified but will likely be enormous [8]. By some estimates, Amazonia, particularly its southern portion, has already crossed the tipping-point safety margin threshold and any additional deforestation presents inconceivable risks and costs to society [12,13].
Adding to these environmental concerns is the growing threat to Indigenous communities posed by a lawless advancing frontier that is invading public lands, fueled in part by rhetorical encouragement from the current Brazilian federal government [14,15]. Deforestation within and around Indigenous lands and other protected areas has increased in recent years as part of the strategy of invaders to force lawmakers and the courts to reduce or completely degazette and transfer those lands to the private domain [16,17,18].
It is within this context of environmental catastrophe and social conflict that, in June 2019, the European Commission and the Mercosur countries approved a trade-agreement (EMTA) that, once ratified by participating countries, is expected to increase commerce of agricultural products between the two regions. The trade deal will eliminate 93 per cent of tariffs for Mercosur products to the EU, notably benefiting agricultural products, including beef, soy, and ethanol from sugarcane. Concerns have been raised about the risk of increased deforestation in the Mercosur region and in the Brazilian Amazon more specifically, which is be the focus of this article. Such worries are pertinent given that an analysis of 189 countries from 2001 to 2012 showed that deforestation increased significantly over the three years following the enactment of free trade agreements [19]. These are legitimate concerns due to Brazil’s prominence as the largest exporter of beef and soy in the world, and Amazonia, in particular, where over 40 million tons of soybeans were harvested in 2019 or 35% of the total production in Brazil [20]. Therefore, Amazonia is already intrinsically connected to global markets and is likely to be affected by changes in market conditions and free trade agreements [21].
The EMTA contains “Trade and Sustainable Development” general guidelines and principles (e.g., to follow international environmental standards and agreements, combat illegal logging) that are, in most part, voluntary and vague, which casts doubts on the ability of the parties to fulfill their sustainability promises. For instance, deforestation rates in Brazil, after reaching bottom low at around 5000 km2 yr−1 in the period between 2012 and 2015, have been on the rise again, climbing to 10,129 km2 yr−1 in 2019, a level not observed since 2008 [22]. Preliminary numbers for the year 2020 put deforestation above 11,000 km2 yr−1 [22]. The vast majority of those cleared areas become pasturelands for cattle raising or croplands [23].
The goal of the present article is to assess the effect of the proposed free trade agreement between the European Union (EU) and the Mercosur on Amazonian deforestation. The analysis uses a computable general equilibrium model (CGE), known as GTAP-BIO, coupled with a Bayesian regression model that spatially allocates the estimated additional deforestation brought by the agreement. Although the effects of such trade agreement are estimated for the whole world, we focus on the Brazilian Amazon due to its importance as an expanding agricultural frontier, its role in the carbon and hydrological cycles, as a repository of biodiversity, and it being home to more than 430,000 Indigenous peoples [24].
The article is organized as follows. After this introduction, we provide a background on the EMTA and explain our modeling approach comprised of the CGE model and the spatial allocation model. Next, we present the main results of both models, followed by a discussion of the main implications in terms of policy. We end the article by framing the results within the political context in Brazil and argue that any additional deforestation brought by the agreement is unwarranted.
2. Background
In a teleconnected world, increasing international demand for agricultural commodities has profound impacts on deforestation in exporting tropical countries. Soybean, forestry, and beef exports from Brazil have been linked to increasing deforestation risks, biodiversity loss, carbon emissions, and other environmental impacts in the country [25,26,27]. Although China is now Brazil’s largest importer of agricultural commodities, Europe remains an important trading partner. According to some estimates that track the supply-chain of agricultural products down to producing farms, deforestation embedded in commodities imported by the EU between 2005–2017 accounted for 16% of the total deforestation in tropical countries during the same period, of which almost 1 million ha were in Brazil (authors’ tabulation based on dataset from [28]). EU soybean and beef imports alone were responsible for the loss of 800 k ha of Cerrado (savannas) and forests in Brazil [28].
Although supply-chain tracking initiatives allow deforestation to be ex-post attributed to individual properties and commodities [25], the economic mechanisms through which free trade agreements affect land use are numerous, which makes (ex-ante) deforestation predictions difficult to estimate [19]. In addition to the direct impact of increased demand for agricultural goods, increases in relative prices of those goods in exporting countries may increase land rents, leading to deforestation because of farmland expansion. In addition, free trade often reduces costs of inputs, which can, in turn, increase productivity. In turn, higher yields may lead to more deforestation if demand for agricultural goods is elastic, a process known as the Jevon’s paradox or rebound effect [29]. Cheaper machinery and other capital investments also lower the cost of agricultural land conversion [30]. Free trade often increases consumers’ welfare [31,32,33] (i.e., difference between market prices and willingness to pay for products) within participating countries and this surplus can translate into higher local demand for agricultural products, leading to more deforestation.
All these potential effects of free trade on land use are difficult to predict because they depend on whether a country is commodity-importing or -exporting, on the level of protection prior to and after the agreement, and on the relative prices of factors of production (e.g. land, labor, capital), among other factors [34]. One must also consider the interconnectedness of trade between participating countries of a specific agreement as well as how those countries trade with the rest of the world and how they adjust to new market conditions. Predicting changes in supply of agricultural products and associated deforestation and other land changes is, therefore, not straightforward, particularly in the context of leakages and indirect land use change. For example, agriculture often encroaches on underutilized/low productivity pasturelands to satisfy new demand and displaces ranchers to tropical forests, which are deforested for cattle ranching [35,36].
Computable general equilibrium (CGE) models were created to tackle those market complexities and are, therefore, ideal tools to investigate the impact of such trade agreement on land use. In this article, we apply the well-known GTAP-BIO CGE model to assess the impact of the EMTA on land use in South America with focus in the Brazilian Amazon. CGE models are not spatially explicit in nature, in that they model the amount (i.e., total area) of deforestation that is likely to result from the EMTA. GTAP-BIO goes a step further than most CGE models and calculates land change within major agro-ecological zones but not at the scale of a pixel. The present article couples the GTAP-BIO land change estimates with a Bayesian probit model that spatially allocates where deforestation is most likely to occur in the Brazilian Amazon at a 900-m cell resolution, which allows us to examine potential hotspots of deforestation that should be of concern to policy makers and other stakeholders. We explain both models in the following section.
3. Materials and Methods
Our modeling framework is comprised of two parts. The first part uses a CGE model to calculate the amount of land change that will result from the EMTA for each country and agro-ecological zone (AEZ). The second part takes forest loss predicted by the model and spatially allocates that amount within the Brazilian Amazon. This allocation is based on deforestation probabilities that were estimated through a Bayesian spatial regression model. We explain below these two components of our modeling effort.
3.1. GTAP-BIO Model
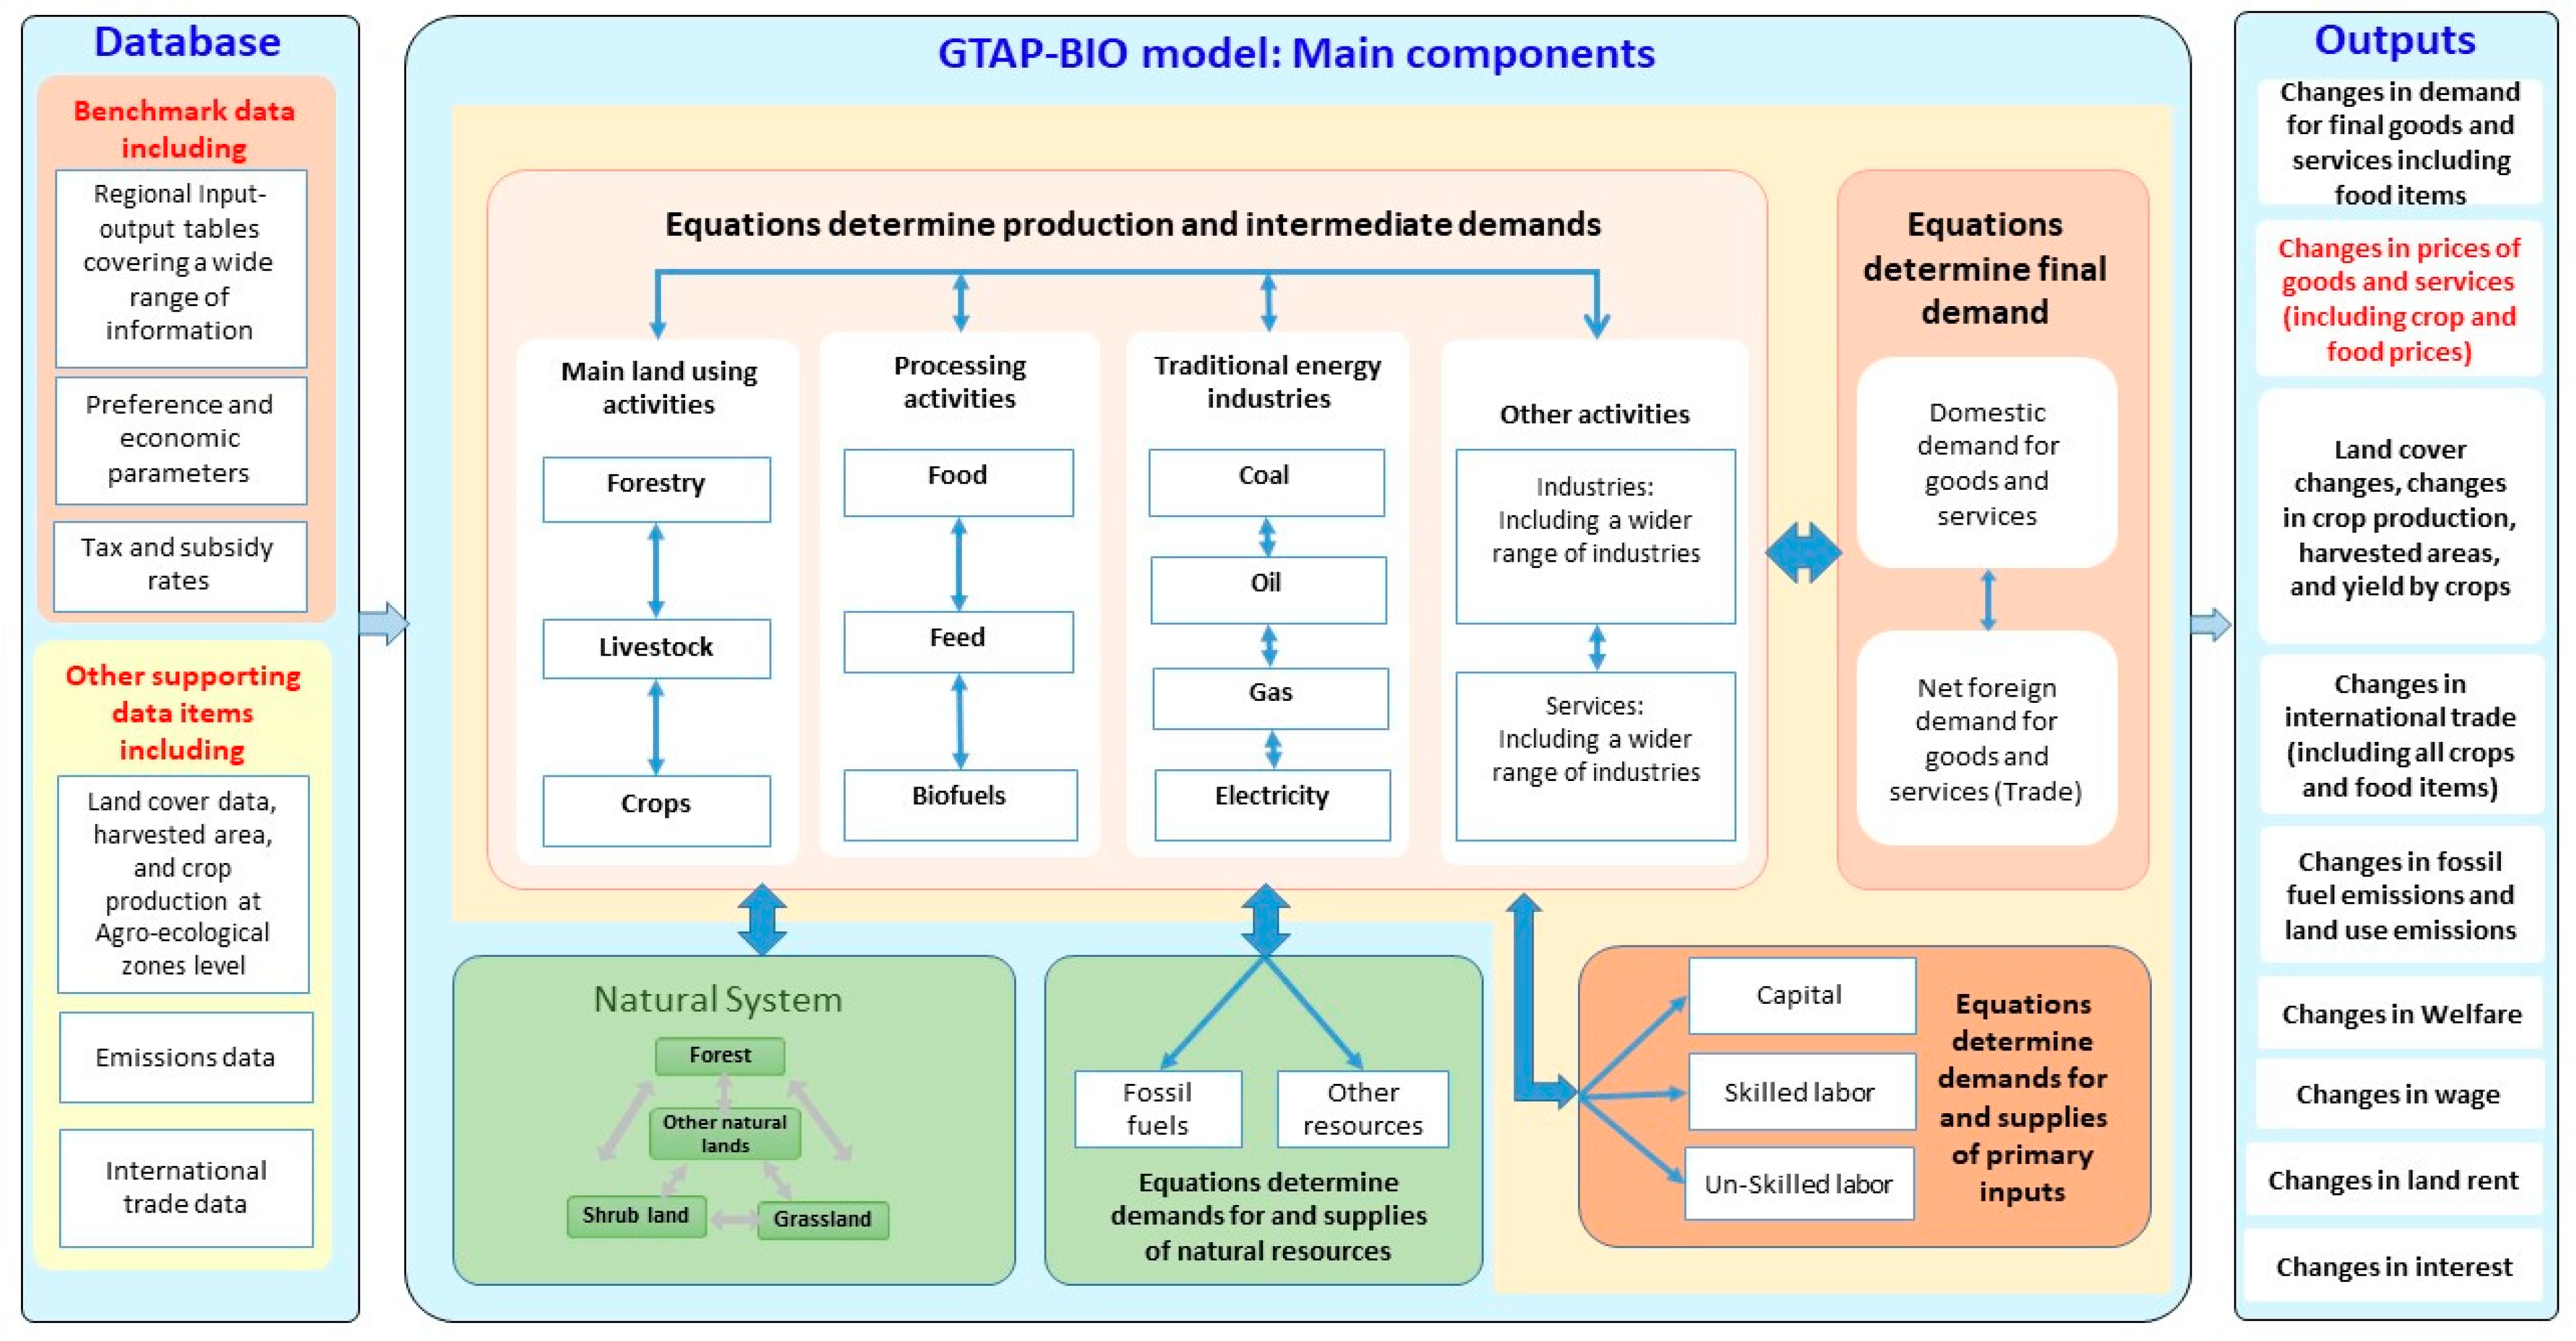
We used a more advanced version of GTAP, a well-known CGE model frequently used to examine trade, energy, or environmental issues [37], called GTAP-BIO. This latter model assess induced land use changes due to energy and trade policies [38,39,40]. Figure 1 summarizes its main components. The GTAP-BIO model represents the structure of the global economy and traces production, consumption, and trade of all types of goods and services (including, but not limited to, crops, livestock products, vegetable oils and meals, sugar, processed rice, and processed food items) at the global scale. It traces land uses (forestry, pastureland, cropland) and allocation of land across crops by country and agro-ecological zones (AEZ) at the global scale. The model reported by [40] allows for the possibility of multiple cropping and the potential to return idle land to crop production. It divides the world into six regions: the US, the EU, Brazil, other countries of South America (OCSA), China, and the rest of the world (other countries). The other countries in the South American region represents the main members of Mercosur (Argentina, Paraguay, Uruguay, and Venezuela) and the remaining countries in South America (Bolivia, Chile, Colombia, Ecuador, and Peru).
The model is able to attribute changes in land use from a shock in the economic system, which, in our case, is the reduction in trade barriers among Mercosur–EU countries. Therefore, one can infer the impact of the “policy change scenario” by comparing the output and land use from a current base case state. It models a ceteris paribus scenario or the impact of the trade agreement while holding all the other exogenous variables constant. The available land endowment (endogenous variable) of each region is allocated across uses by applying a constant elasticity of transformation function. Therefore, changes represent a new equilibrium versus the status quo. The model does not predict total deforestation from all other causes into the future but rather estimates the amount of land change attributed specifically to this policy change. GTAP-BIO is also static, in that it represents changes from one equilibrium to a new one. These changes can take only a few years or may take longer, depending on how quick companies, producers, and consumers adjust to new market conditions but the model cannot trace these dynamics.
The GTAP-BIO model can also simulate the effect of good governance through changes in the elasticity between agricultural production and deforestation. These elasticity parameters translate increases in agricultural production into deforestation. They were empirically determined by taking deforestation rates during two different periods in Brazil, one when deforestation increased sharply as a response to increases in agricultural production (i.e., “low governance” scenario of the years between 2000–2006), and another when deforestation rates did not increase as much despite increases in production (“good governance” scenario of 2016). This is relevant to the Brazilian case because environmental enforcement efforts have varied substantially between administrations over the past two decades. Studies have shown that environmental enforcement can reduce deforestation substantially; for more details of the model and parameterization, see [41] and its supporting documents available online.
The original GTAP-BIO model is capable of tracing the economic impacts of trade agreements and disputes that affect tariffs only. Given that the EU–Mercosur trade agreement (EMTA) involves both tariffs and tariff-rate quotas (TRQs), whereby higher tariffs are imposed only above a certain negotiated quota, we altered the model to accomplish this task following the approach originally proposed by [42] and implemented by [43]. TRQs are defined by three parameters in the model, the in- and out-of quota tariff rates, and the quota levels, all of which need to be also available in the baseline data for the sectors that are to be subjected to TRQ treatment.
3.1.1. Sensitivity Analysis
Due to the deterministic nature of GTAP-BIO, we examined two sets of scenarios and conducted a sensitivity analysis to examine the land use outcomes of the EMTA under a range of plausible conditions. The first set (row 1 in Table 1, including S11, S12, and S13) represents three scenarios that use the GTAP standard trade elasticities [44]. The second set (row 2 in Table 1, including S21, S22, and S23) uses larger trade elasticities (i.e., Armington elasticities) for those commodities and products that are subject to the EMTA. These larger elasticities allow importing countries to shift more easily from domestic to imported and among source countries, a reasonable parameterization for the present case because most agricultural products are standardized with little differentiation in terms of quality among exporters. In addition, these simulations represent a new steady-state equilibrium and assumes countries have time to adjust their supply chain. The examined scenarios consider the full implementation of the agreement by all Mercosur countries. Results would be different if, for example, Brazil ratifies the agreement but other countries in the Mercosur do not.
In each set, we examined three cases that represent different land governance scenarios. The first scenario of the first set (S11) uses land transformation elasticities that characterize an effective land governance policy in Brazil circa 2016. In this period, deforestation rates in Brazil were declining due to a set of strong land governance practices [45,46]. In addition, the rate of multiple cropping increased during this time and more idled land returned to crop production in Brazil. The S11 simulation represents this land governance environment. The second simulation of the first set (S12) repeats the first scenario but uses land transformation elasticities that represents Brazil between 2000 and 2006 when the rate of deforestation was high in the country. The last scenario of the first set (S13) repeats the second scenario but assumes single cropping in Brazil. Finally, the second set of cases (S21, S22, and S23) repeat their corresponding cases of the first set but use higher trade elasticities.
3.1.2. Implemented Tariffs and Quotas
The first step in our implementation was to verify the baseline tariffs and export taxes to make sure that they accurately represent the current existing tariffs, quotas, and taxes. We accomplished this task and observed some minor mismatches. The alter tax script [47] was used to update the base data to represent accurate tariffs and taxes. In the next step, to implement the EMTA, we changed those tariffs, taxes, and quotas to reflect the approved proposal. Below is a list of the relevant modifications as they relate to agricultural commodities:
- Elimination of the export tax on soybeans from the other South American countries (including Argentina) to the EU. EU import tariff regime remains at zero, the current value.
- Other countries of South America (OCSA) and Brazil eliminate import tariffs on EU’s soybeans.
- EU eliminates import tariffs on ethanol from Mercosur for up to 450,000 tones for chemical use and reduces the baseline tariff by one third for 200,000 tones for any use, including fuel use (Brazil and OCSA). Current tariff regime applies for volumes above these quotas.
- EU reduces specific import tariffs on pork and eliminates the import tariffs for poultry to exports from Mercosur. Further, for poultry, a quota is introduced, the out-of-quota tariff remains at baseline.
- The EU eliminates the in-quota tariff for sugar from Brazil up to the quota level, which does not change. The EU also eliminates the in-quota tariff for sugar from Paraguay and introduces a new quota. The out-of-quota tariffs remain at baseline.
- EU reduces in-quota tariffs for beef exported from Mercosur. The quota for frozen and fresh beef is divided equally among Mercosur members. Elimination of in-quota tariffs on high-quality beef is considered and their quota level, specifically in Mercosur, is maintained.
- Mercosur reduces in-quota tariffs to dairy products from the EU.
- Mercosur reduces in-quota tariffs to EU cars, parts, clothing, chemicals, machinery, pharmaceuticals, and textiles
Details of the current tariffs and quotas and the new ones negotiated under the new agreement are in Table S1 of the Supplementary Information document.
3.2. Spatial Allocation Model
To spatially allocate the additional deforestation calculated by the GTAP-BIO model, we first estimated the probability of a given area to be ever deforested by implementing a Bayesian spatial probit model developed by [48] and adapted to a raster environment by [49]. In this model, deforestation (y) in cell i belonging to a region j is represented as a binary outcome (1= deforested, 0 = otherwise):
where and . The vector contains the explanatory variables; β is the vector of parameters to be estimated; is the spatial effect on region j stemming from neighboring regions, k; w is a standardized spatial weights matrix; and is the spatial autocorrelation parameter, also to be estimated. The idiosyncratic error is assumed to be normally distributed, conditional on; and is also assumed to be normally distributed (for a formal description of the model, see Supporting Information document in [48,49]).
The dependent variable is the accumulated deforestation between 2001 and 2018, according to the mapping conducted by the project MapBiomas collection 4.1 [50]. Therefore, the model estimates the probability of a given cell of ever being deforested, regardless of whether we may observe forest regrowth in subsequent years. MapBiomas maps annual land cover and land use in Brazil using Landsat imagery at 30-m resolution. Although the MapBiomas dataset goes back to 1985, we decided to keep 2001 as the starting point of our analysis to allow for potential future comparative assessments with other datasets, such as Global Forest Watch and INPE’s PRODES, both of which map deforestation from 2001 onwards. In our analysis, we masked out water and non-forested vegetation cells identified by MapBiomas at any given year.
The vector x of explanatory variables includes the relevant proximate drivers of deforestation frequently cited in the literature, such as the distance to roads, the distance to previous deforestation, soil types, rainfall, protection status, among others (Table S2 in Supplementary Information).
All digital GIS files either were in or converted to raster format, projected to Albers conic equal area projection, and resampled to 900-m cell resolution with the nearest neighbor algorithm, yielding 4,943,201 cells for the Amazon, which constitute the number of observations in the regression. The nearest neighbor resampling algorithm resulted in a total deforested area that was closer to the original numbers than any other method available. This meso-scale cell resolution (900 m) was chosen as a good compromise between the various scales of data available. For example, the deforestation data are at 30 m resolution but the vector data (GIS lines and polygons) are between 1: thousand to 1: million scale. In addition, the spatial Bayesian probit model is computationally very intensive, requiring RAM memory in excess of 32 GB and three days of processing using fast multi-processors (4 cores at 3.4 GHZ).
The regional spatial autoregressive process was implemented following the methods described in [49] where contiguous cells are labeled and assigned to regions formed by 10x10 neighborhood cells, creating 52,966 regions in the Amazon.
The results presented in the next section are based on the average of 500 valid draws after the first 500 were omitted for convergence during the burn-in phase of the Markov chain Monte Carlo procedure used [48].
This spatial regression analysis yields a raster where each cell holds a probability of deforestation ranging from 0–1. To allocate the projected deforestation from the GTAP-BIO model along the existing forest landscape (post-2018), we ordered the remaining (post-2018) forested pixels from highest to lowest deforestation probability and selected the top pixels until the sum of the area of those pixels reached the total potential deforested area predicted by the GTAP model. Here, we only show the high deforestation scenario estimated by GTAP (S23) where 173 k ha of forests projected to be lost are assumed to all occur in Amazonia.
4. Results
We present the results for the GTAP-BIO model in Section 4.1, followed by the results of the spatial allocation model in Section 4.2. The main findings of the GTAP-BIO simulations are as follows. First, welfare (as measured by the model—see below) in participating countries of the EMTA will increase, and higher trade elasticities yield higher welfare gains. Brazil will benefit the most under a scenario of multi-cropping combined with strong environmental governance. Second, in terms of agricultural commodities, Brazil will increase its exports of ethanol to the EU, whereas the OCSA, particularly Argentina, will increase its exports of beef and soybeans. Brazil will not increase its exports of soybeans to the EU because it already benefits from near-zero tariffs. Third, deforestation will increase in the Mercosur countries to accommodate the expansion of crops and pasturelands, whereas in the EU, forest cover will increase slightly. Brazil will expand its sugarcane plantations the most, followed by smaller increases in soybean areas. The OCSA will increase its pasturelands the most, followed by soybeans. The spatial allocation model shows that most deforestation would be concentrated near current hotspots of deforestation that are already threatening conservation units and Indigenous lands in Amazonia. We detail these results below.
4.1. GTAP-BIO
4.1.1. Welfare Impacts
The GTAP-BIO model calculates monetary values of gains and losses induced by changes in markets for goods, services, and primary inputs, and summarizes those into a welfare value [37]. This welfare concept measures the change in income given a set of fixed prices that would have the same effect on consumption if prices changed because of the trade agreement (i.e., equivalent variation—EV). This aggregate value neither addresses aspects of fairness nor examines which sectors of the economy or groups will benefit the most from the agreement. Another major drawback of this measure is that it does not capture the full costs or benefits of policies due to its inability to account for non-market goods and externalities. Nonetheless, such welfare measurements can be informative for policy impact analysis because they allow for the comparison among competing policy alternatives or scenarios.
The EMTA affects the economies of the EU, Brazil, the OCSA, and all other countries around the world. Table 2 shows the welfare impacts, as defined above, by region. This table suggests that, across all examined scenarios, the EMTA generates welfare gains for the EU, Brazil, and the OCSA. The EU is the big winner with welfare gains over US 1.6 billion. Brazil and OCSA would also benefit according to the simulations. On the other hand, the US, China, and others lose welfare due to the EMTA. The sum gains for the EU, Brazil, and OCSA are larger than the sum of losses for the US, China, and other countries. Therefore, the global (total net) welfare would be higher.
Welfare impacts also vary across scenarios. In general, the cases with larger trade elasticities represent more gains for the EU, Brazil, and the OCSA. On the other hand, changes in the land governance conditions in Brazil barely affect welfare values in other participating countries but it has a positive impact in Brazil. The stronger the environmental governance, the more gains that Brazil receive. The use of multi-cropping has a significantly positive impact on welfare in all scenarios when compared with single cropping. Under a more robust land governance condition with double-cropping (scenarios S11 and S21), farmers in Brazil use more idle land and that generates more gains than expanding croplands and pasturelands through deforestation (S12 and S22 counterpart scenarios, respectively).
4.1.2. Trade Impacts
According to our simulation, the EMTA decreases soybeans exports from Brazil (and also from the USA) to the EU, which is replaced by soybean exports from the OCSA to the EU (Table 3). Overall, there could be an increase in EU imports between 2.6% and 5%, relative to the baseline. There is a clear substitution taking place when the export taxes from Argentina are eliminated. If the EMTA comes into effect, it is expected that the EU will switch towards this low-cost alternative. Brazil already benefits from soybean tariffs around zero and, therefore, the EMTA will not bring additional trade advantages for the Brazilian soybean sector. As expected, in the simulation, the larger increase and trade diversion towards OCSA occurs when we consider higher trade elasticities (scenarios S2X).
With respect to processed livestock, the implementation of a tariff rate quota prevents a substantial increase in EU imports from Mercosur. Table 4 shows the imports of processed beef and Table S3 in the SI document shows the results for processed pork and poultry. Overall, the EU imports increase marginally by 0.3% for beef and approximately 1% for pork and poultry. The tariff reduction does promote an increase in trade from the Mercosur countries, which comes at the expense of intra-EU trade. EU imports of beef from the EU are 70% on the base and, after simulations, they fall by less than a 1% point, if only the tariff reduction is considered. In terms of pork and poultry, the EU baseline records 87% of total EU imports, which could decrease by 3% points. It is important to note that the effect of the tariff reduction would have resulted in stronger exports from Mercosur, but this is capped by the quota.
For sugar (included in the beverage and sugar sector), the EMTA will increase the share of Mercosur exports to the EU moderately, particularly from Brazil (Table 5). Although the country could more than double its export to the EU under the high trade elasticity scenarios, the total volume would still be an order of magnitude smaller than the intra-EU trade, which would remain over 74% of the total EU imports of beverages and sugar.
4.1.3. Impacts on Production
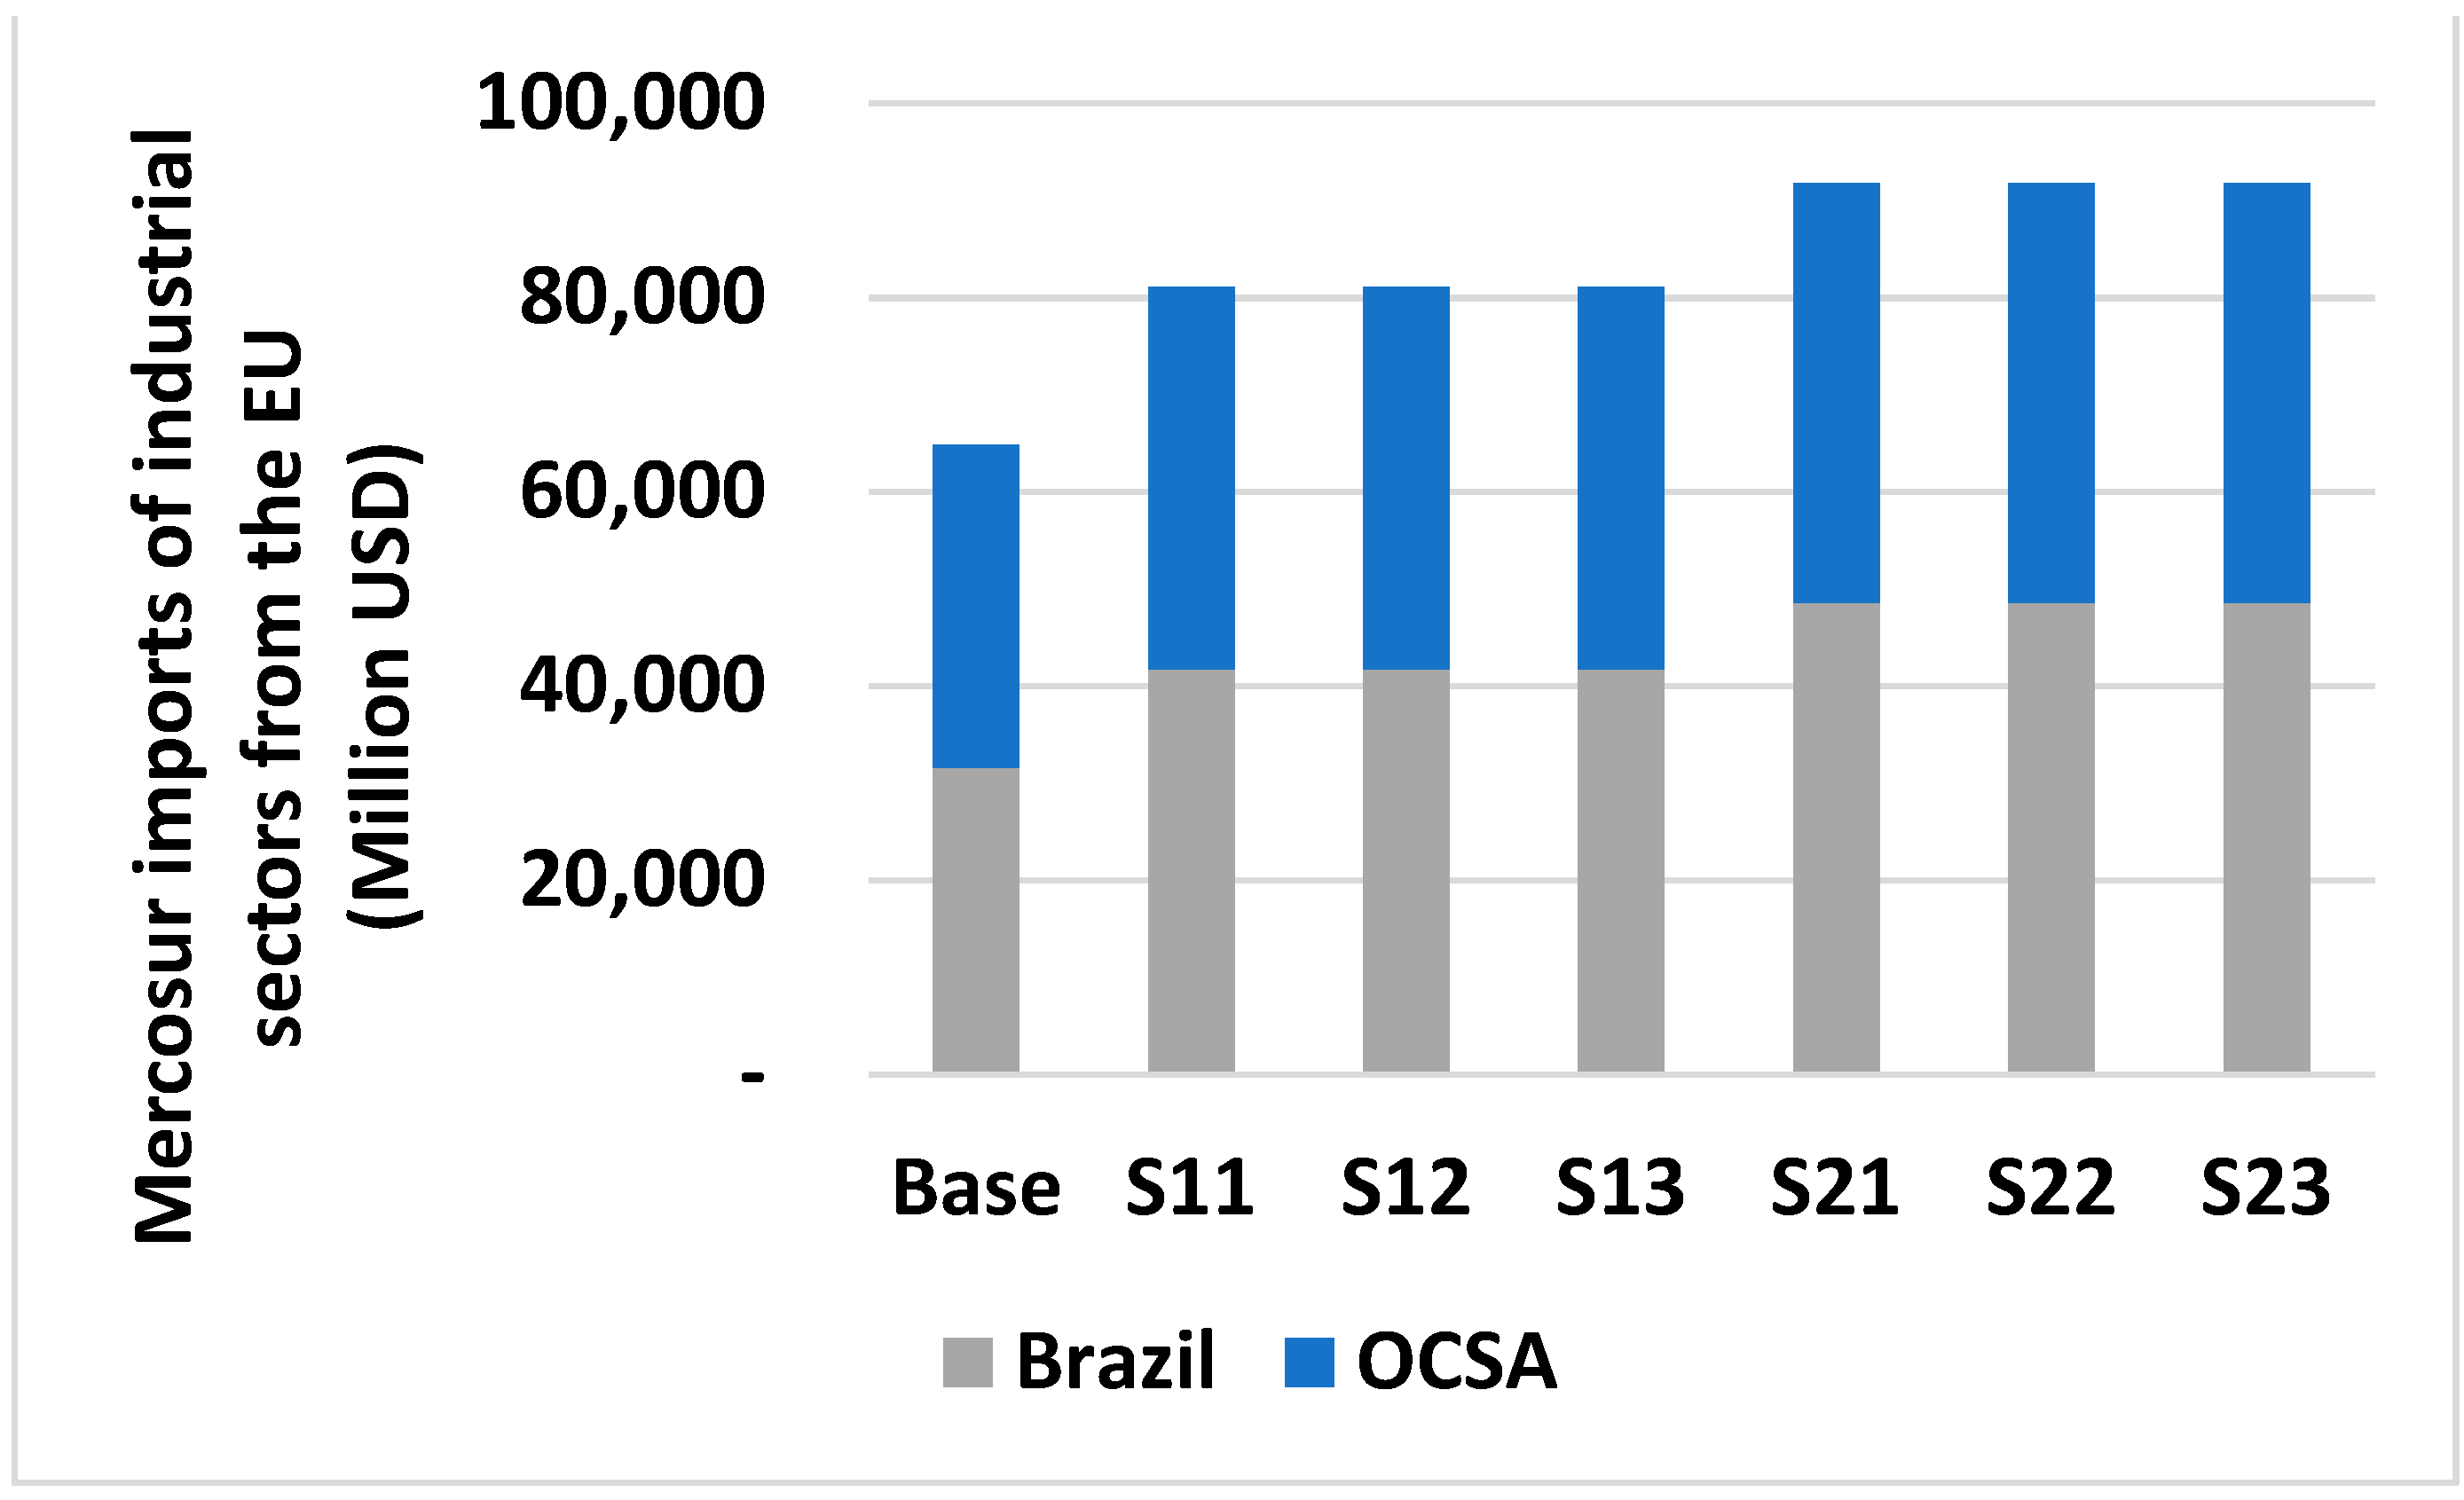
Table 6 shows the effects of the EMTA on the sectors directly affected. In response to the trade liberalization, processed livestock products, beverage, and sugar sectors from Mercosur would increase production that would then be exported to the EU. Conversely, the EU decreases its output of these products due to increased competition. Similarly, the reduction in Mercosur tariffs to EU dairy products and other EU industrial sectors allows the EU to make gains in the Mercosur market, increasing EU exports to Mercosur countries, consequently increasing EU output. This increased competition also causes the Mercosur bloc to reduce its output of dairy and other industrial sectors. For sugarcane ethanol, the EU’s reduction in tariff rate quotas causes Brazilian exports of ethanol to increase under all scenarios, from 6.45% (in S11) to as much as 10.47% (S23) (Table S6, Supplementary Information). Taking the volume exported from Brazil to the EU in 2016 as our baseline (89,820 k liters [51]), these percentages would translate into additional exports of 6000–10,000 k liters, which would still be below the quota. It follows that output should increase and does so for all scenarios, except S21, which is subject to low deforestation with multiple cropping and high trade elasticities scenarios. Under this scenario, exports are able to increase while output decreases because domestic sales also decrease. The model also shows an unexpected reduction in output in other Mercosur countries. The initial data, however, reveal that Brazilian ethanol exports to the EU represent 99.99% of total EU’s ethanol imports.
4.1.4. Land Use Impacts
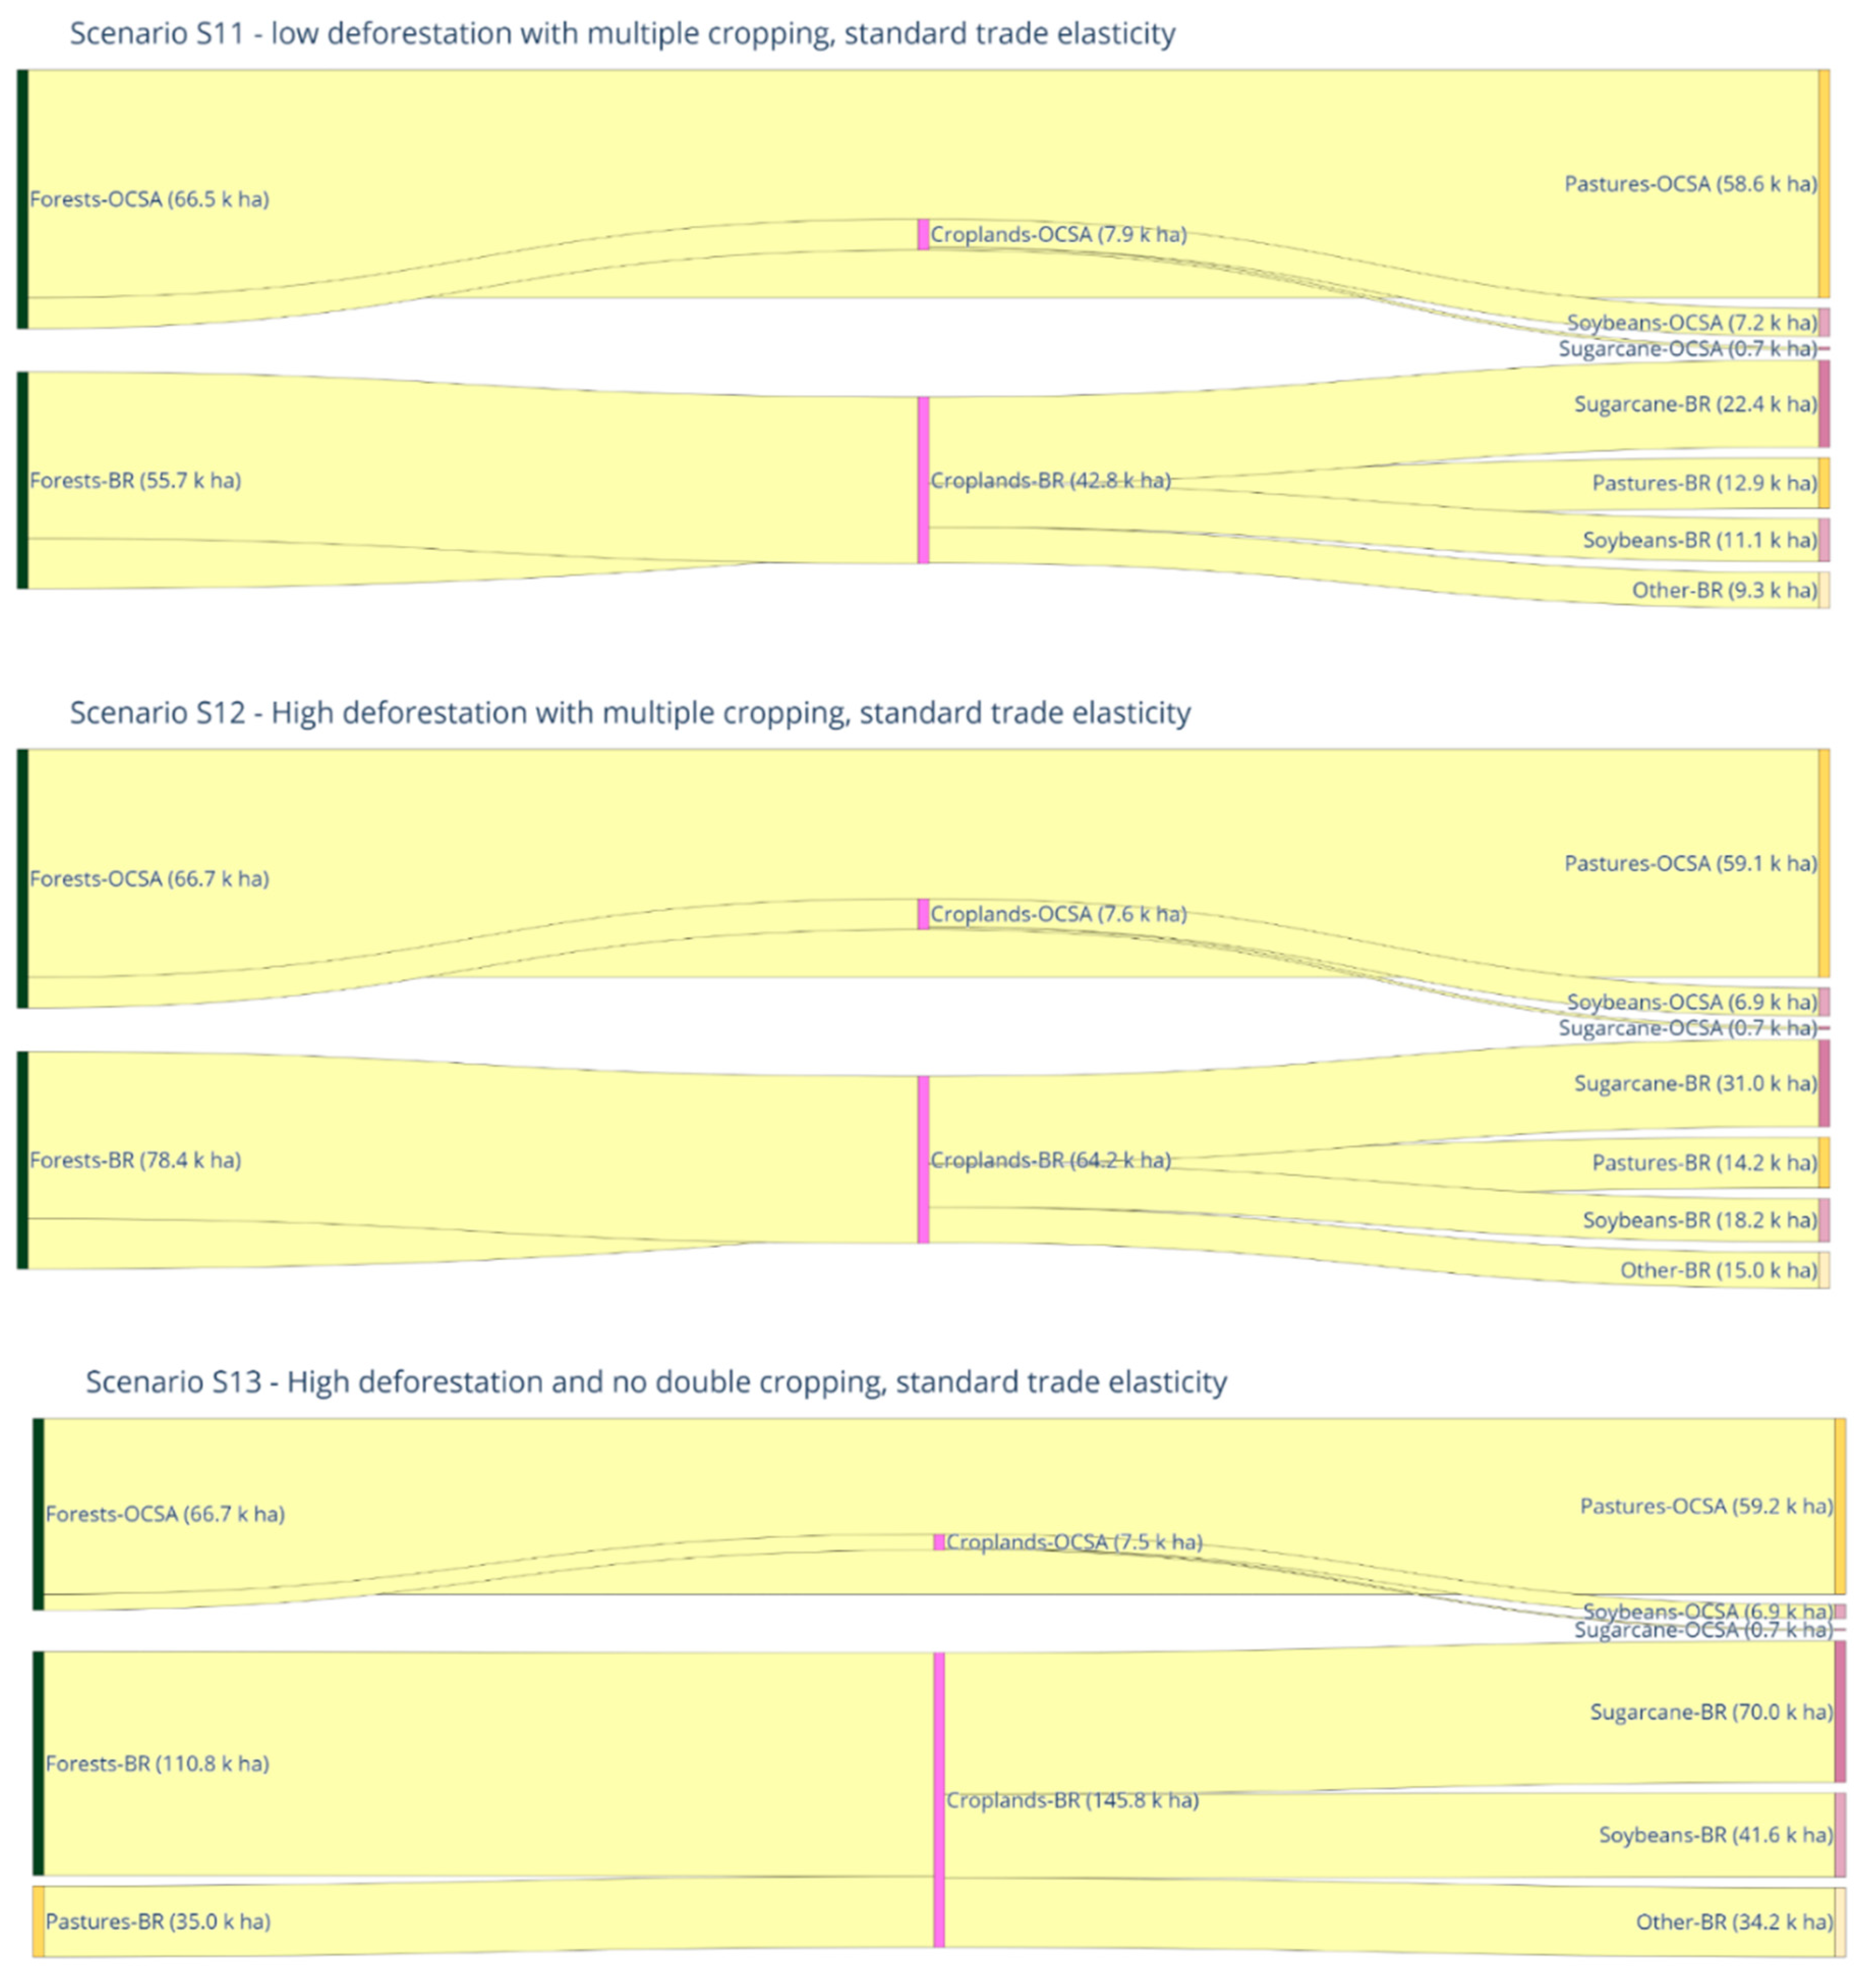
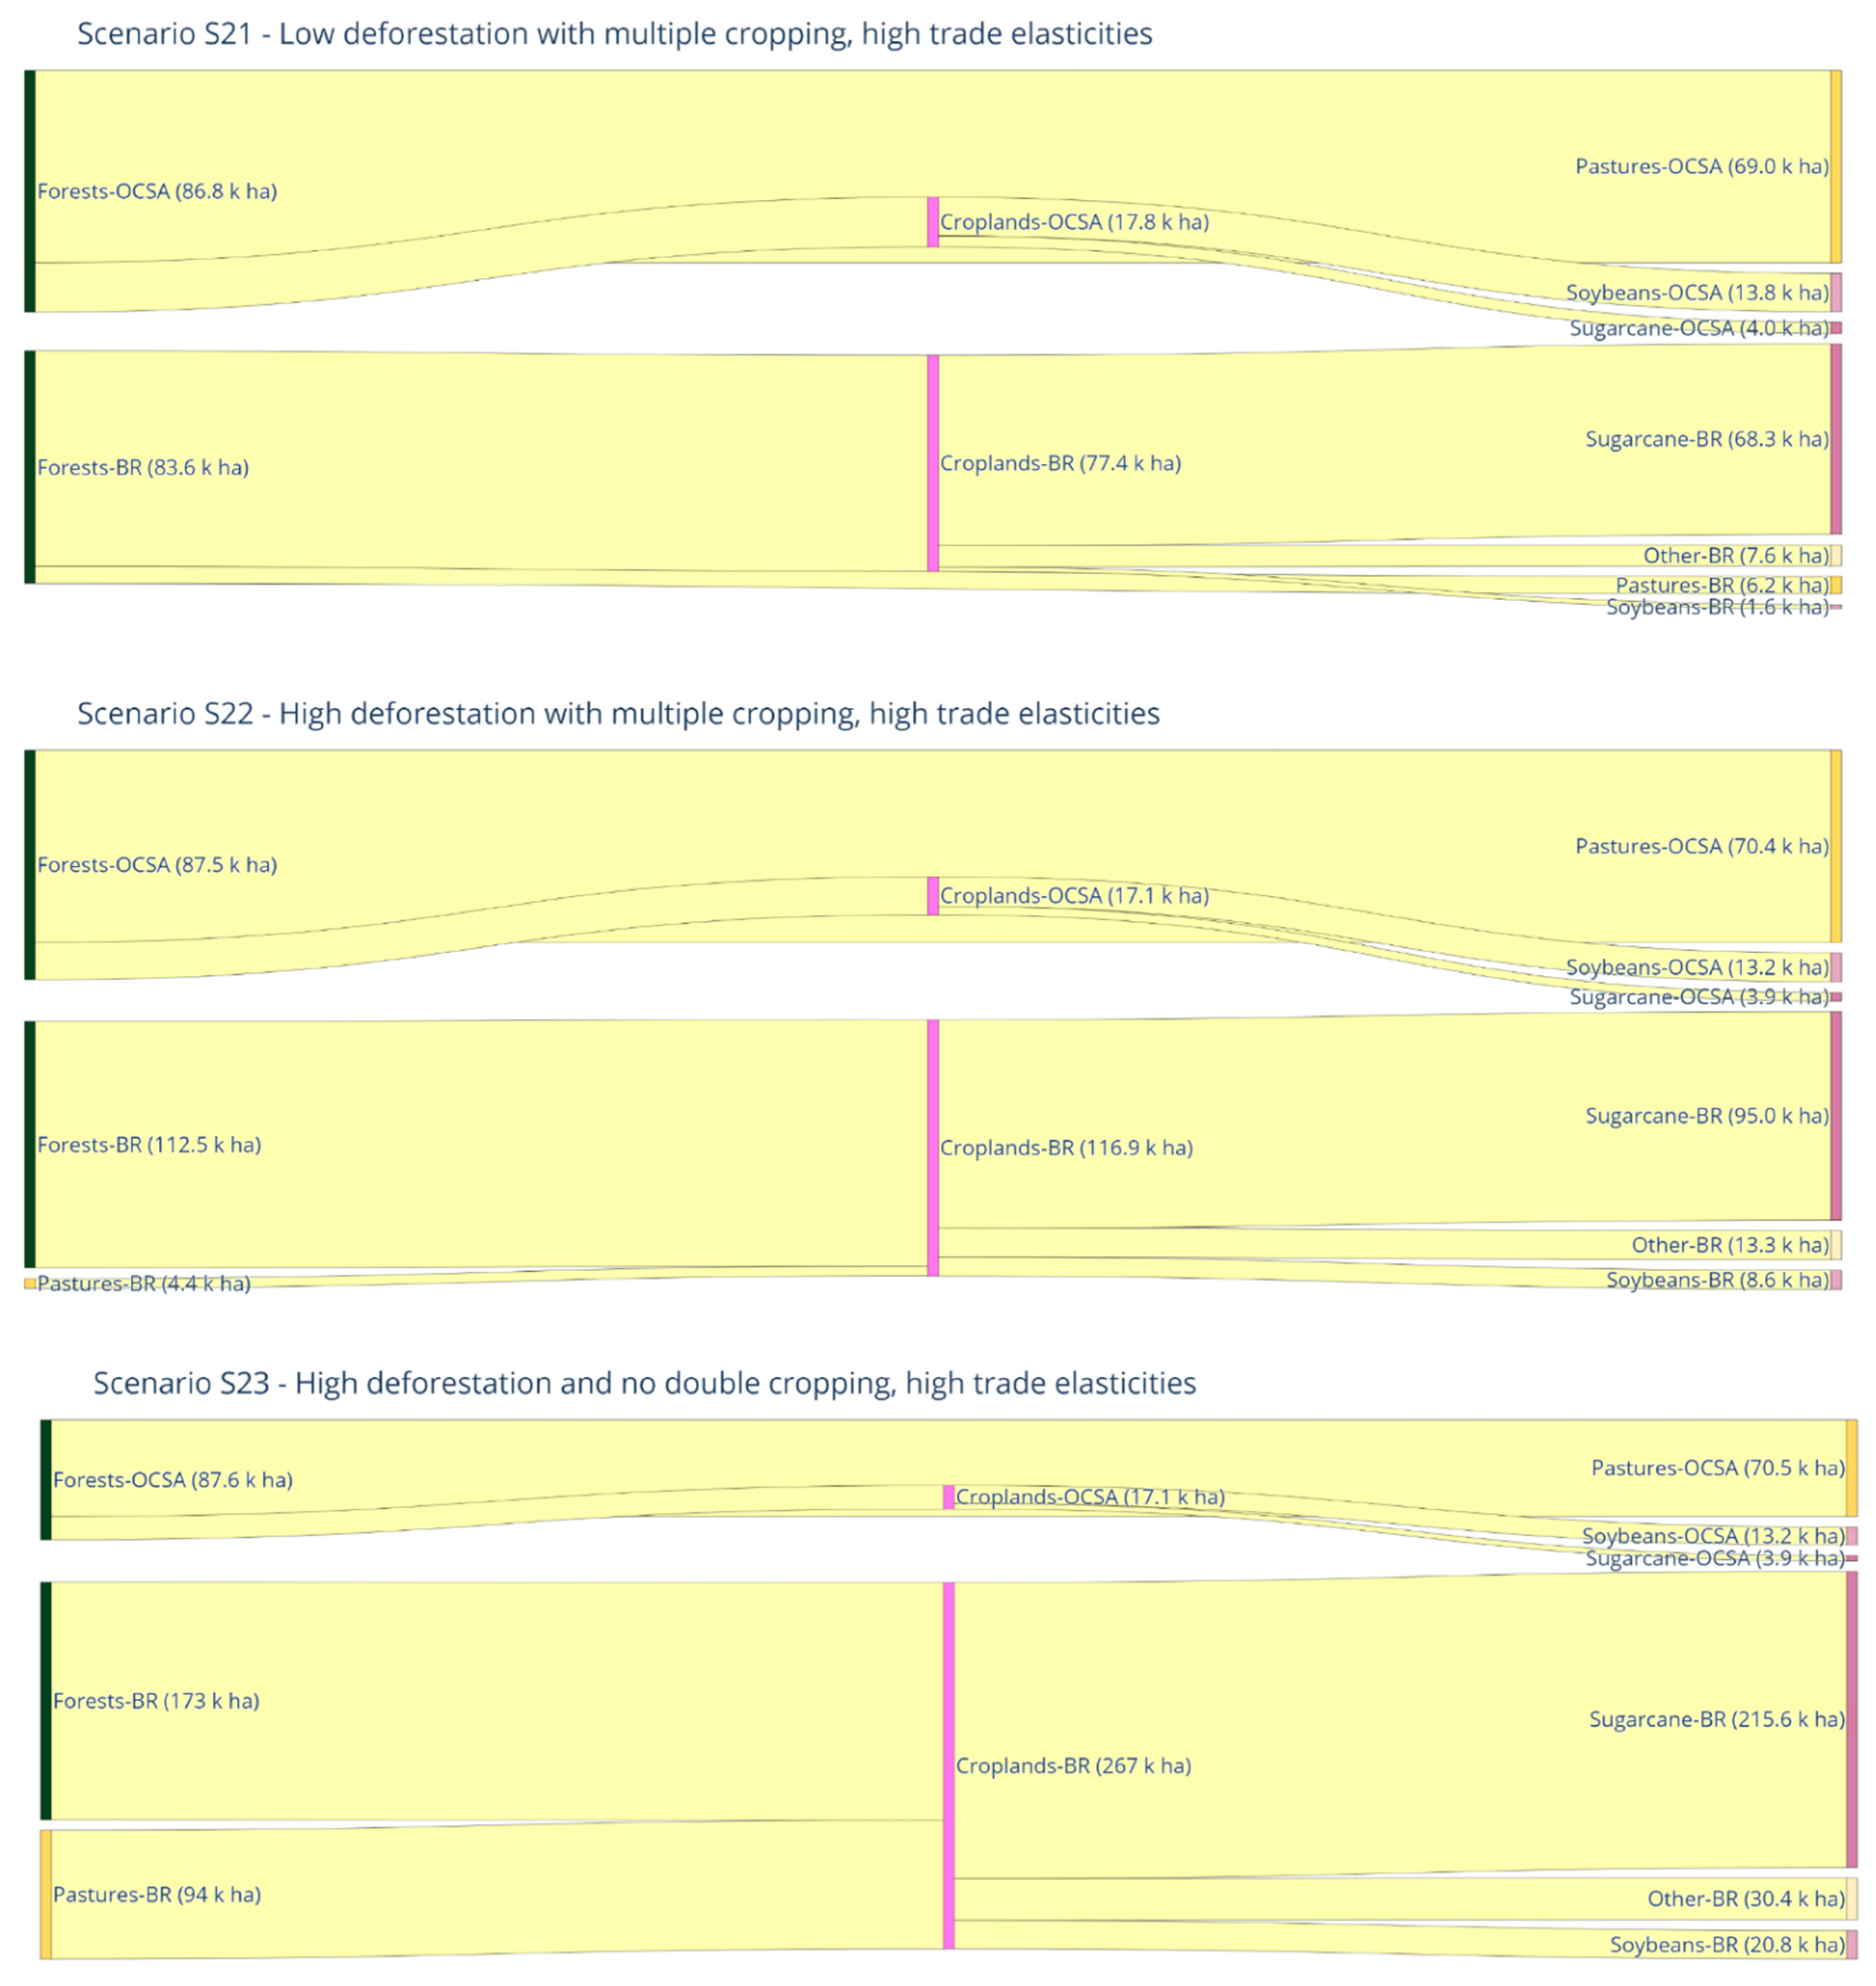
The EMTA will impact land use globally but its effects will be more pronounced in the participating countries, most notably in Brazil and in the OCSA with little impact in the EU and other countries. These impacts on land cover for all the regions are summarized in Tables S4 and S5 in the SI document. Figure 4 and Figure 5 below summarize those tables and show the land use change transitions predicted in Brazil and OCSA, according to scenarios S1X and S2X, respectively.
Globally, both cropland and pastureland increase in area in all but one scenario. Compared to the baseline, croplands increase from 43.8 k ha to 274.5 k ha, whereas pasturelands increase by up to 65.6 k under scenario S11. Only one scenario, S23— high trade elasticity with multiple cropping—results in a reduction in pasture area globally (Tables S4 and S5). In general, the higher the trade elasticity, the higher the projected expansion in harvested area as expected. In all scenarios, there is a net global reduction in forested area, from 43.8 k ha in S11 to 274.5 k ha in S23, and Brazil would observe the largest reductions of up to 173 k ha under S23. The OCSA would also have its forests reduced by an additional 87.6 k ha in scenario S23. On the other hand, Europe and other countries of the world would increase their forested areas in all scenarios and by as much as 5.6 k ha and 12 k ha, respectively, in S23. Therefore, the EU and the rest of the world would spare their forests at the expense of deforestation in Brazil and in OCSA.
For Brazil and OCSA, a few patterns of land use change emerge in all scenarios (Figure 4 and Figure 5). First, as noted above, under no analyzed scenario will forests be spared from deforestation in Brazil or OCSA. Second, the vast majority of the deforested areas in OCSA will transition to pastures, which will increase in area by as much as 70 k ha (S23). Soybeans and sugarcane come at a distance second as drivers of change in OCSA. In Brazil, the opposite is observed; deforested areas will transition to croplands by a large margin and within croplands, sugarcane is the most important driver of change with gains of up to 215.6 k ha under scenario S23. The new quota of 650 k tons of ethanol (or approximately 824,000 k litters) to be imported with reduced tariffs represents a 10-fold increase in comparison to the amount exported by Brazil to the EU in 2020 (57,000 k liters) [51] but, as shown above, the amount to be exported will be well below that quota. The total volume predicted to be exported (approximately 100,000 k liters) represents less than 1% of Brazil’s ethanol production during the same year, which explains the relatively limited impact on land change. Soybeans in Brazil will be the second driver of change with gains in area of up to 41.6 k ha, mostly to supply its internal market. Expansion of pasturelands for cattle raising will not be an important driver of deforestation in Brazil according to our models. Scenario S12 (high deforestation with multiple cropping) predicts the highest forest–pasture conversion at around 14.2 k ha. In three scenarios (S13, S22, S23), pasturelands will actually decrease in area in Brazil due to a net conversion to croplands. Scenario S23, for instance, predicts that up to 94 k ha of pasturelands will become croplands.
GTAP-BIO takes into account the indirect effects of non-ruminants on land change but the pathways through which that occurs is difficult to analyze with the modeling framework used. For example, higher production of non-ruminants increases demand for feed crops, thereby increasing croplands and possibly causing deforestation. On the other hand, cheaper pork and poultry also lead consumers to substitute these cheaper sources of protein for beef, which decreases the need for pasturelands, thereby reducing pressure on forests.
Under the more effective governance scenarios (S11 and S21), forest losses in Brazil are kept between 55.7–83.6 k ha, about half of the predicted deforestation under less effective governance scenarios. In the case of S23, less effective land governance in Brazil leads to more expansion in cropland (up to 267 k ha) and more production of feed crops. This encourages the livestock industry in Brazil to keep using its croplands and pastures, releasing some pastureland to cropland conversion, and more use of feed crops in its production process, at the expanse of forests.
Overall, predicted deforestation in Brazil and OCSA are constrained because of two main factors: Brazil already benefits from zero tariffs for its soybeans and the EMTA will not bring additional advantages for the country. Second, most tariff reductions are applied only to a certain amount set by quotas. If quotas are lifted by a future new agreement, particularly for beef, impacts on land change in Mercosur countries are likely to be larger.
4.2. Deforestation Spatial Allocation Model
The previous section showed that the EMFTA will lead to additional deforestation in the Mercosur countries and that most deforestation would be in Brazil. This section analyzes where deforestation is likely to occur in the Amazonia biome, which concentrates 60% of the total deforestation within Brazil.
4.2.1. Spatial Model Statistical Results
Our analysis shows that deforestation probabilities in the Amazon correlates with biophysical factors, infrastructure, and institutional variables. For example, the risk of deforestation is lower in areas with high rainfall, even when controlling for the other factors, a result consistent with previous work [52,53]. Forests on soils of the class “severe constraints to agriculture” were significantly less likely to be deforested than areas on other types of soils (Table S7, Supplementary Information).
Landholders were significantly more likely to deforest areas closer to roads (unpaved and paved) than on sites far from roads. Moreover, deforestation probability is much higher within settlement projects, a finding consistent with the literature [54,55,56]. It is relevant to note that most deforestation occurs outside such areas because large landholders own most of the occupied land. Nevertheless, government-sponsored land reform projects have proportionally higher rates of deforestation per unit of land deserves attention when considering mitigation options, particularly with respect to the cattle ranching supply chain as smallholders from settlements are important suppliers of calves to fatting operations [57].
All types of protected areas had lower probabilities of deforestation. Indigenous lands and state conservation units with an integral protection status were the most effective, followed by federal sustainable use and federal integral protection units. These results are again consistent with the literature that shows that protected areas are important deterrents of deforestation [58,59,60], despite recent illegal invasions and increase in deforestation inside protected areas.
Overall, the model performs relatively well. On a pixel-by-pixel basis, the model correctly predicts 96% of the forested cells and, more importantly, 46% of the deforested cells from 2001–2018 despite only 7% (350,947 out of 4,943,201 cells) were deforested during that period (Table S8, Supplementary Information). Other accuracy metrics, such as Hagen’s two-way fuzzy statistics [61], produce similar results (Table S9, Supplementary Information).
4.2.2. Spatial Allocation of Deforestation
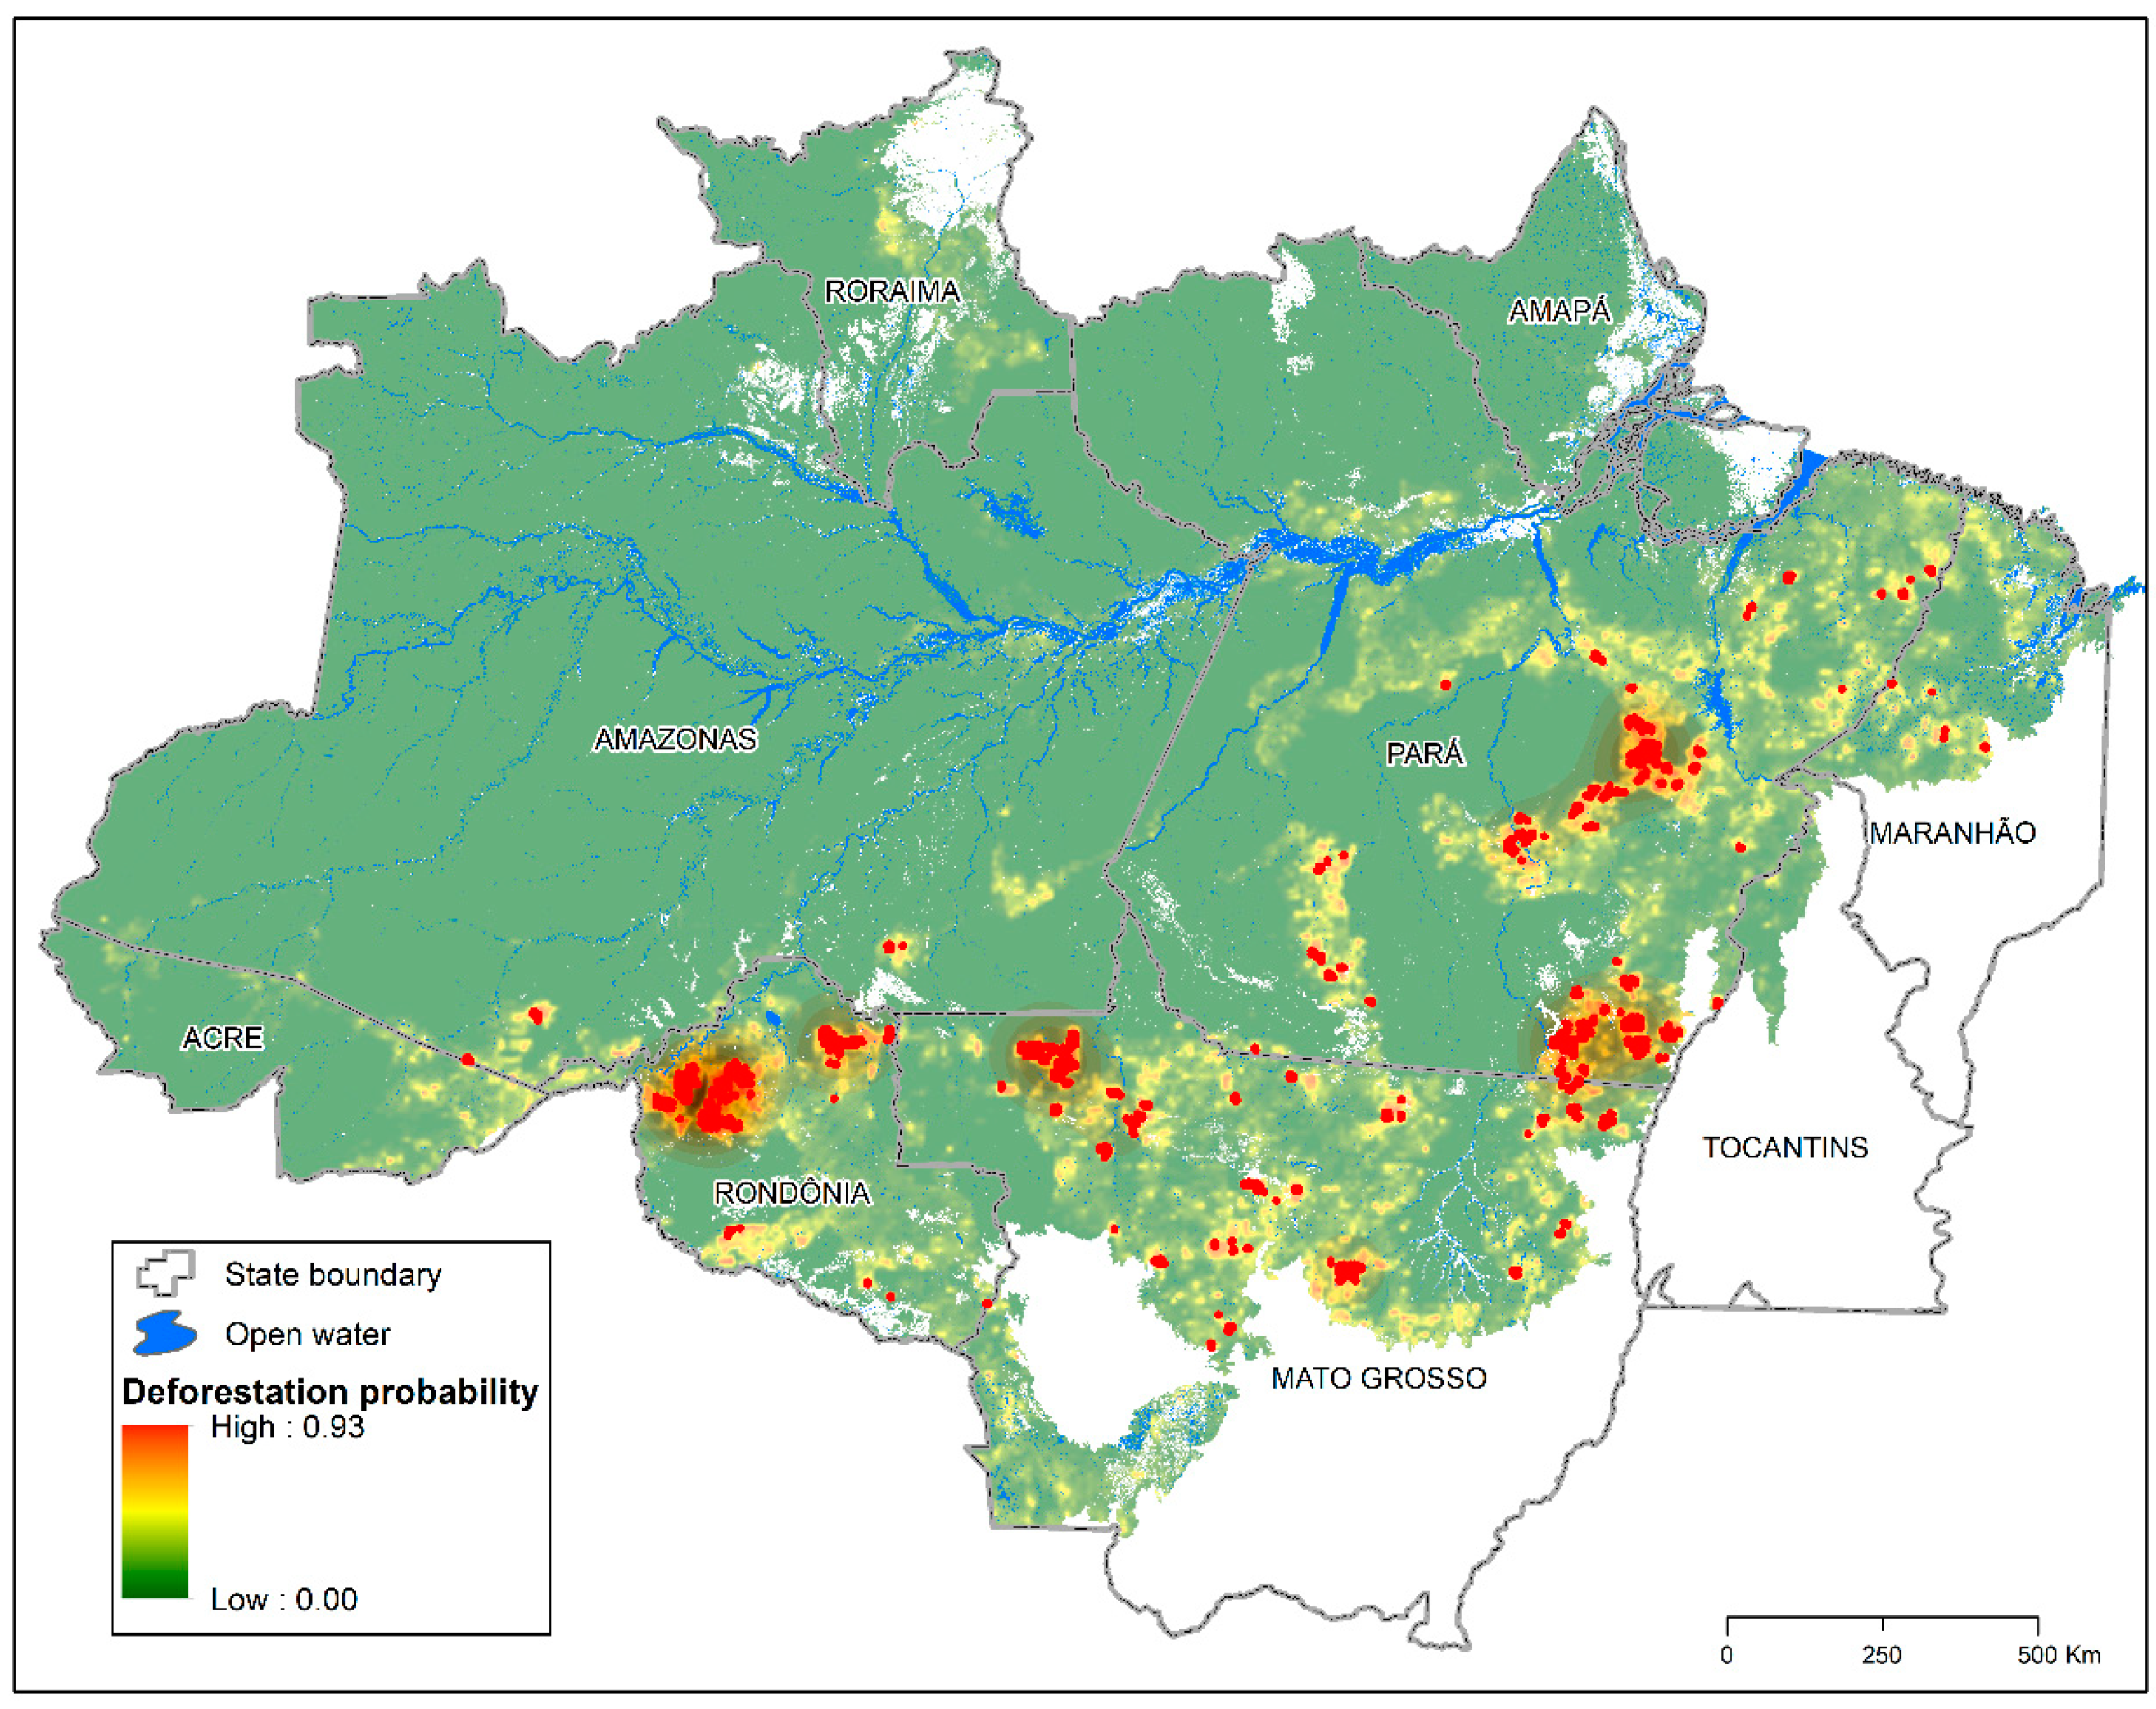
It is very unlikely that all deforestation will occur within a single biome and within Amazonia because, as shown in the previous section, sugarcane seems to be the most important driver of deforestation and, despite attempts by Brazil’s federal government to revoke the agro-ecological zoning currently in place (Decree 10084 of 2019), sugarcane plantations are still not allowed in Amazonia. Nonetheless, this suspension might be only temporary as the legality of the decree awaits a decision by the Brazilian courts. Therefore, we simulated a scenario where all 173 k ha of forest loss (scenario S23) is allocated within Amazonia in an attempt to highlight the regions under the highest threat of deforestation that would require more mitigation interventions and monitoring.
The risk of additional deforestation related to the EMTA would be distributed along several regions within the Brazilian Amazon (Figure 6). The red dots show where deforestation is more likely to occur: Pará (39.9%), Rondônia (32.6%), and Mato Grosso (25.2%). The remaining areas of predicted deforestation are in Amazonas and Maranhão. In Pará, well-known regions of high deforestation such as the South and Southeast regions, sites in Terra do Meio, and along BR-163 are predicted to continue being hotspots. Northern Mato Grosso is another hot spot for deforestation. In Rondônia, the region around the capital Porto Velho and in the tri-border area (Amazonas, Mato Grosso, and Rondônia) are also hotspots of deforestation. A few additional isolated points worth mentioning include the new deforestation frontier in southern Amazonas state east of Humaitá along the Transamazon road.
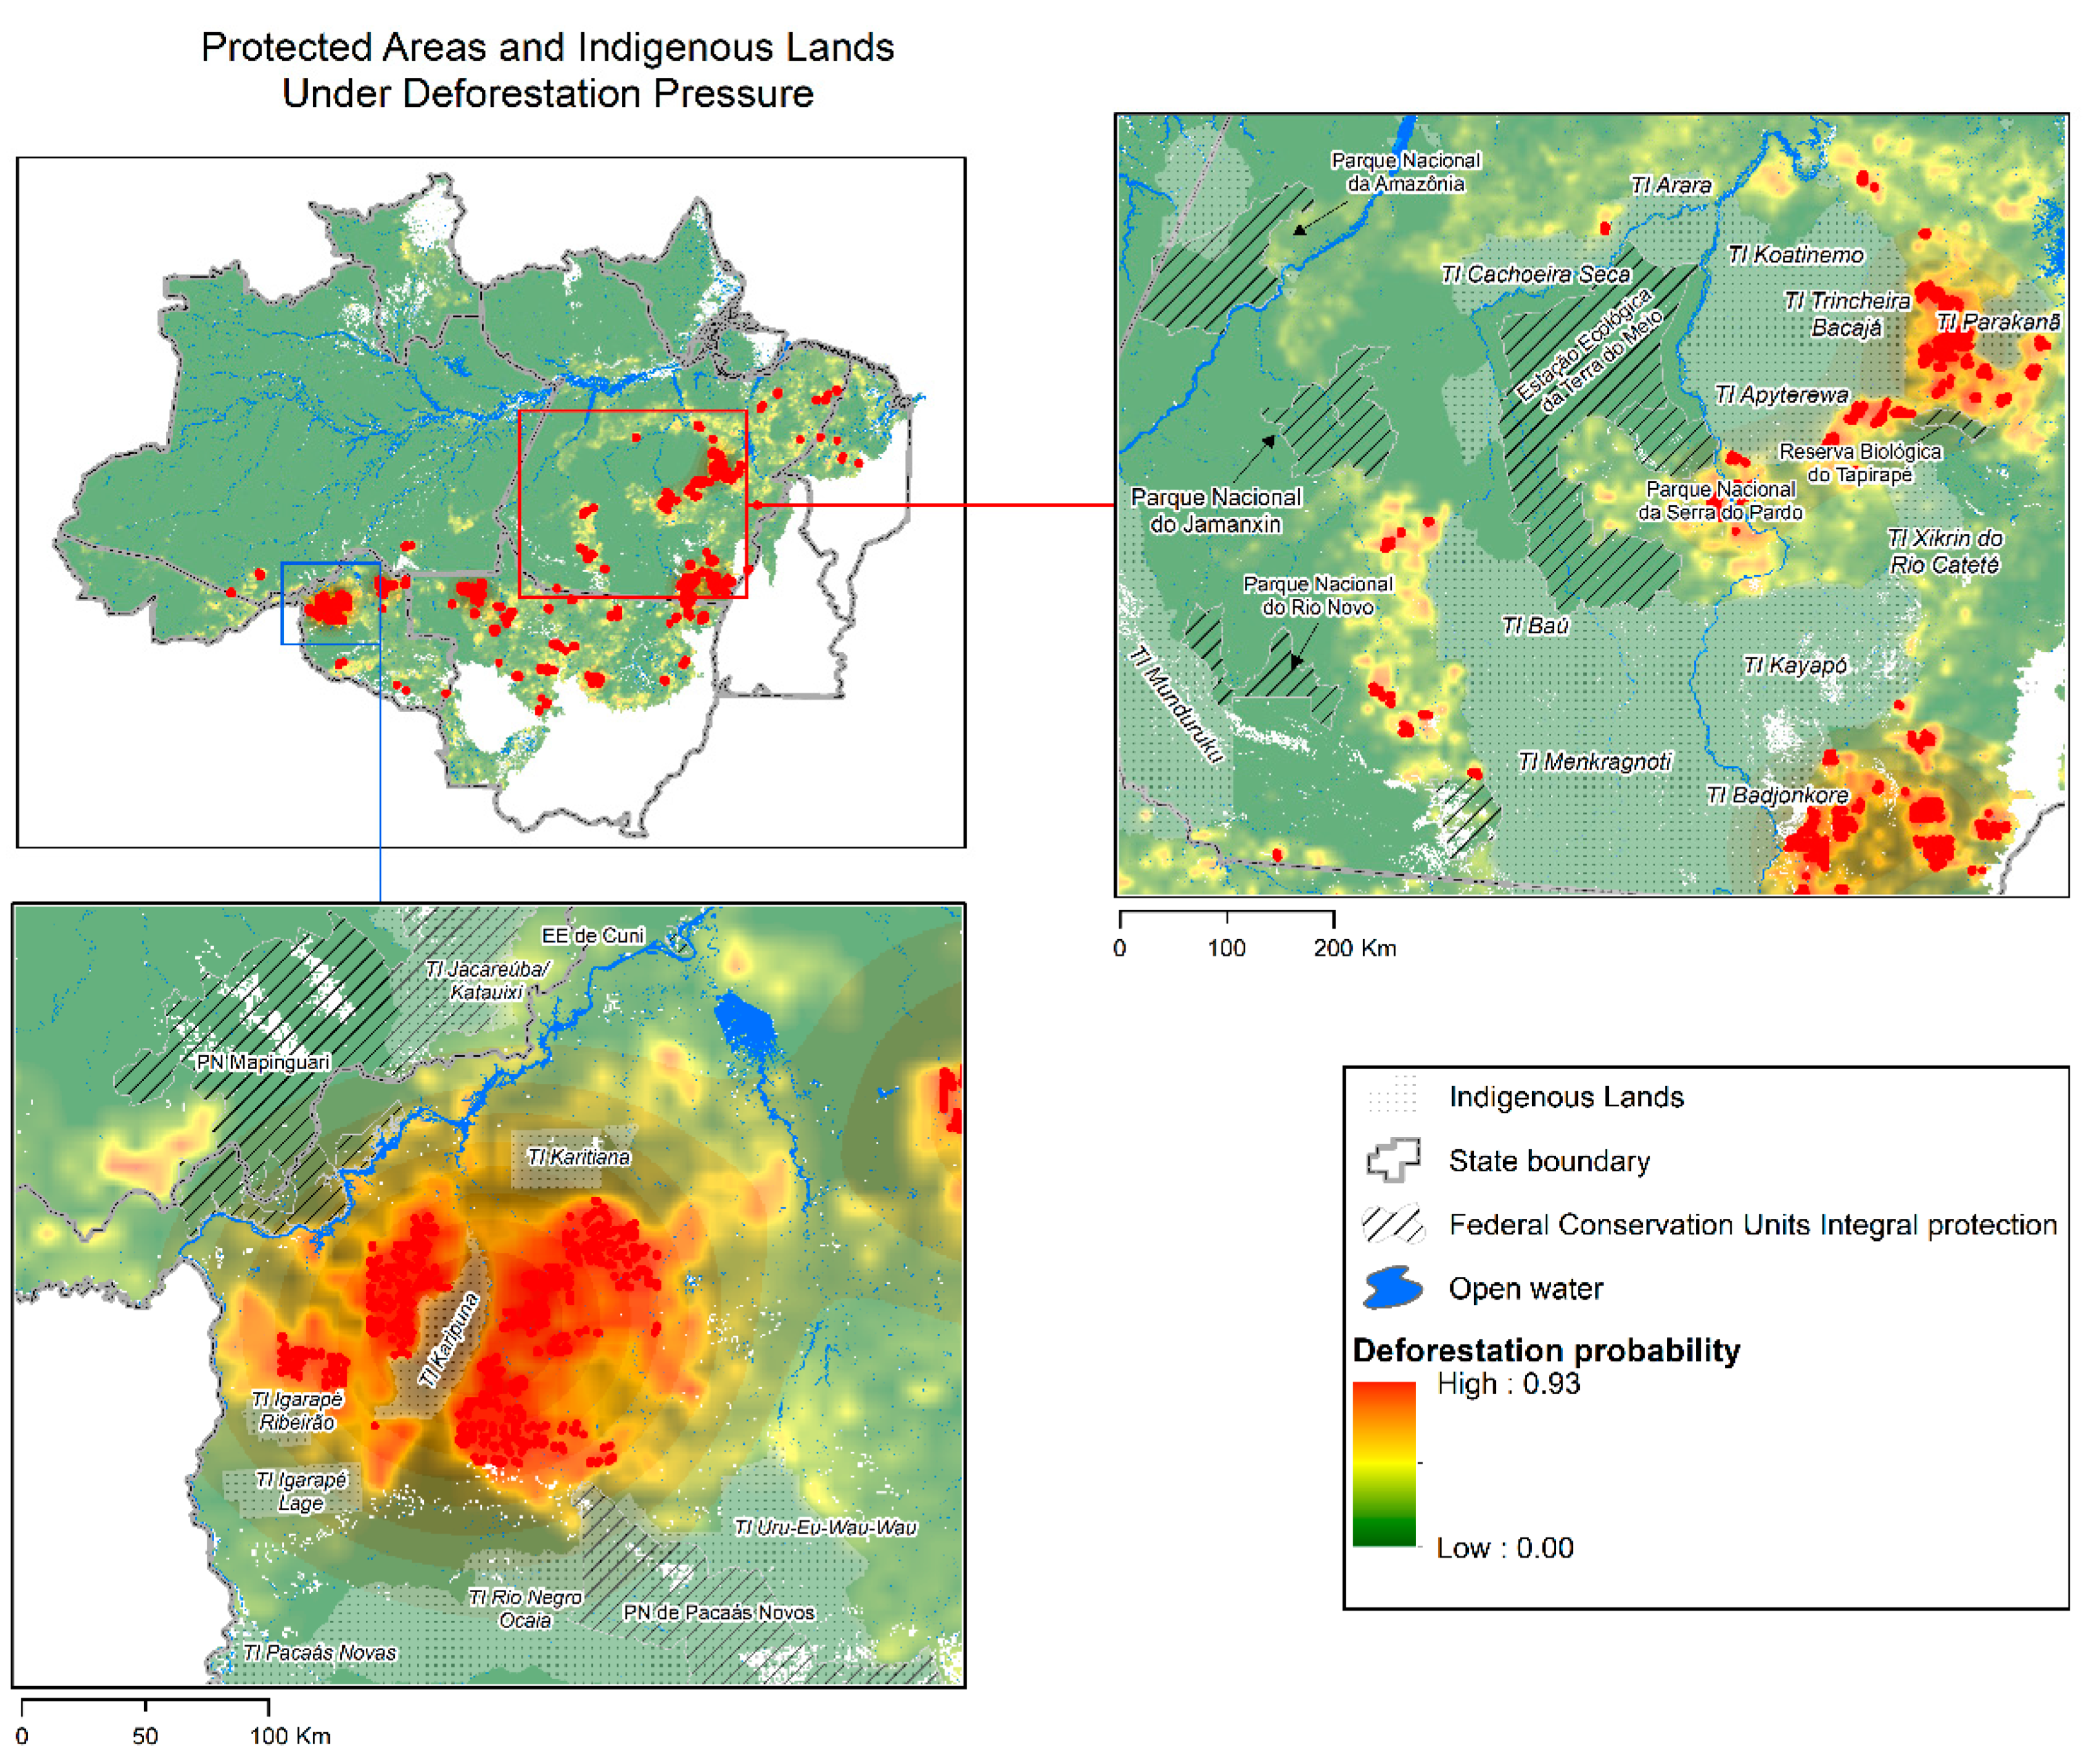
We found that the EMTA would add to the risk of deforestation near Indigenous lands and conservation units and, in a few cases, inside protected areas (Figure 7, see Table S10, Supplementary Information for a list of specific areas). In Rondonia, where several protected areas have been degazetted or downsized in the recent past [62], Indigenous lands, national parks, and forests are surrounded by hotspots of deforestation (Figure 7, lower left panel). In fact, monitoring systems are already detecting deforestation inside some of those areas [18]. A similar situation can be observed in the Terra do Meio region in Pará (Figure 7, upper right panel). Deforestation has been increasing rapidly in these areas, a likely consequence of reduced law enforcement operations and prospects for exploiting those areas for commercial purposes [63].
5. Discussion
Important policy and political considerations can be drawn from the results. We project the EMTA to increase deforestation in South America (260 k ha) and in Brazil in particular (173 k ha), but European countries would gain roughly 5.5 k ha in forest cover. Although these numbers seem small when compared to the 81 million ha already deforested in Brazil’s Legal Amazonia, the EMTA would be another example of the north–south divide where wealthier nations transition back to forests and become ‘greener’ at the expense of tropical developing countries [64].
The fact that the trade of agricultural products increases deforestation is not new to European policy makers. A report commissioned by the European Commission estimated that, in 2004, the EU27 countries consumed the equivalent to 10% of the global embodied deforestation consumption [65]. Deleterious consequences of commodities driven deforestation to biodiversity and to Indigenous peoples have intensified the political discussions around the EMTA negotiation and ratification [66,67]. These concerns are justified given recent upward deforestation trends in Brazil; proposed legislation that would open Indigenous lands for the exploitation of natural resources (Projeto de Lei 191/20), many of which are already under enormous pressure and being invaded [6]; and the manifested hostility of the current federal government toward environmental conservation policies [68,69]. For instance, Brazil’s government reduced field inspections, which enforced environmental laws by 35% in 2019, and again by 40% in 2020, exonerated the president of INPE (Brazil’s Space Agency) in 2019 after the institute released data showing increasing deforestation rates and continued to stimulate land occupation by changing land laws that favor illegal land grabbers [17]. As shown in Section 4.2.2, deforestation is encroaching into protected areas, including Indigenous lands. Consequently, cases of “possessory invasions, illegal exploitation of resources, and property damage” in Indigenous lands have increased by 134% from 2018 to 2019 (from 109 cases to 256) [70]. This increasing violence led the UN High Commissioner on Human Rights to issue a statement “about reports of rural violence and evictions of landless communities, as well as attacks on human rights defenders and journalists, with at least 10 killings of human rights defenders confirmed this year” [71]. In this context, it is politically indefensible for European (and South American) governments to support a trade agreement that, although not responsible for, may add fuel to these violations of human rights.
The EMTA contains a whole chapter on Trade and Sustainable Development (TSDC) that provides recommendations and rules to achieve sustainable commerce. EU directives also specify sustainability criteria for the use of biofuels as a renewable energy source, setting limits to the amount of biofuels produced from feedstock that cause land use change, such as the sugarcane-driven deforestation in Brazil predicted by our model. The EU is also drafting an anti-deforestation law to prevent beef, palm oil, and other products linked to deforestation from being sold in the EU [72]. However, opponents of the deal argue that these provisions are inadequate and a ratification of the EMTA is unjustifiable. According to them [66,67], the EMTA failed to include local and Indigenous communities who were not consulted in the drafting of the current proposal. Second, products need to be traceable and the supply chain should be transparent to civil society so that (third) binding legal measures can be enforced if violations are found [67]. Currently, the EMTA addresses non-compliance through a lengthy process of consultation but it lacks a clear set of sanctions and opportunities for civil society participation is limited at best. This collaboration between governmental institutions and civil society has shown to be effective in the past and has led to gradual improvement of environmental indicators after ratification of trade agreements [73]. Third, the anti-deforestation law omits grasslands and wetlands, but the Brazilian Cerrado and other South American biomes, such as the Chaco, will be impacted by the deal, particularly because sugarcane and pasturelands will increase their acreage in those places, respectively. Lastly, yet more importantly, a new financial windfall to the agricultural sector brought by the agreement will further incentivize illegal grabbing of public lands and continued invasion of Indigenous lands, a risk that is exacerbated by the current deterioration of environmental governance in Brazil [63,74].
Overall, our CGE model results are in agreement with other studies that employed similar methodologies. For instance, a study conducted by the London School of Economics that used a dynamic CGE projected welfare increases in most participating countries and modest output changes in the agricultural sector for the Mercosur countries, ranging from 1.1 to 3.7% by the year 2032, depending on the subsector (e.g. oils, seeds, meat, poultry) and scenario [75]. According to that study, welfare and wage gains and losses would vary among sectors, however. In the Mercosur region, employment would increase in the agricultural sector but would decrease in some industrial sectors dealing with machinery, motor vehicles, and transport equipment, for example, and the opposite would happen in the EU. A similar assessment specific to Switzerland also found small additional land change impacts in Mercosur countries resulting from the EMTA and directly driven by Swiss imports [76]. This relatively small projected impact on land change is likely due to the tariff rate quotas on imported agricultural products from Mercosur countries and because Brazilian soybean exporters already benefit from near-zero tariffs.
Although methods have been developed (e.g., [77]), it is notoriously difficult to assess the accuracy of CGE model predictions [78] because of the impossibility of observing ex-post outcomes driven solely by the trade agreement while maintaining everything else unchanged. As such, our models could be underestimating the impact of the trade agreement on land change. For instance, soybean expansion in Brazil is heavily driven by reinvestment of profits accrued in previous years and an extra billion reais in profits is associated with approximately 760k ha in additional soybean planted area [79]. Therefore, as the EMTA translates into higher profits for the agribusiness sector, more land change is likely to occur due to this reinvestment dynamics.
6. Conclusions
For much of the last three decades, Brazil and other countries of the Mercosur have inserted themselves into the global market economy and are now leading exporters of several agricultural commodities. With its strong political clout, particularly in Brazil, it stands to reason that the agribusiness sector is supporting a new trade agreement with the European Union that will benefit the sector. In this article, we offer an analysis of the impacts of such agreement on agricultural trade and on land use change in the countries involved. The results show that all scenarios analyzed will lead to more deforestation, albeit relatively modest when compared to the total area already deforested in Brazil.
Trade can be beneficial to both blocks in terms of economic welfare, with largest gains under a scenario of low deforestation with intensive cropping. This means that, in principle, there is the possibility of welfare gains with low deforestation outcomes. This scenario will only be realized if the Brazilian government implements policies that decouple agricultural production from deforestation and if the private sector eliminates deforestation from its supply chain [80].
If well designed, trade agreements could also force exporting countries of the Mercosur to match more stringent environmental and social standards of importing EU countries. Weak labor and environmental policies can be perceived as illegal subsidies to dirty industries, which could be subjected to retaliation [81]. For instance, the EU has just announced new plans to impose tariffs on carbon emissions imbued in imports in an effort to tackle climate change and level the playing field with domestic industries. Although this proposed new tariff will not be levied on agricultural products, it is a clear example on how environmental and trade policies can become intertwined. Another example is the recent Glasgow Leaders’ Declaration on Forests and Land Use. In the UN Climate Change Conference of the Parties (COP-26) meeting held in November 2021, 137 countries, including Brazil and China, committed to “working collectively to halt and reverse forest loss and land degradation by 2030,” including trading mechanisms [82]. This is relevant to the case of Brazil because China is its most important trading partner. A third of Brazil’s agricultural exports are now to China, valued at USD 36 billion in 2020, more than twice the amount exported to the EU (USD 16 billion) [83]. The EMTA, therefore, could force the whole agricultural production system in Brazil to be more sustainable, even in the absence of clear implementation mechanisms and binding commitments to the Declaration.
Although a hypothetical benign scenario exists, notable challenges remain. Increasing demand for agricultural products from China, combined with a lax approach to environmental regulation and enforcement in Brazil, and an outright reluctance from the current government to rein on illegal deforestation, is already leading to rates of deforestation not seen in almost a decade. Moreover, it is also concerning that new investments in road paving and other infrastructure projects could lead to new rounds of in-migration and deforestation in Amazonia [84]. In addition, the exclusion of local and Indigenous communities from the discussions of the EMTA is politically and ethically questionable. Finally, the recent scientific literature offers a bleak prognosis for the future of the Amazon forest as deforestation and climate change are pushing the biome dangerously close to a tipping point [8,12,13]. It seems unwarranted to add another driver of deforestation to an already long list of causes.
Supplementary Materials
The following are available online at https://www.mdpi.com/article/10.3390/land10111243/s1, Table S1: Details of current tariff regime and quotas for relevant agricultural products, Table S2: Descriptive statistics of variables used in the regression with source, Table S3: EU imports of pork and poultry by exporting region for all examined scenarios (in million USD), Table S4: Impacts of the EMTA on harvested area by region (in hectares), Table S5: Impacts of the EMTA on land cover by region (in hectares), Table S6: Percent change in EU imports of Ethanol from Brazil (per-centage change), Table S7: Bayesian spatial probit regression analysis results (n = 4,943,201), Table S8: Cross-tabulation of predicted vs. actual deforestation on a pixel-by-pixel basis, Table S9: Crosstabulation of predicted vs. actual deforestation Hagen’s two-way fuzzy similarity index, Table S10: Indigenous and conservation areas within 5 km from hotspots of deforestation.
Author Contributions
Conceptualization, E.A, P.B., F.T.; methodology, E.A., P.B., F.T., A.A.; formal analysis, E.A., F.T., A.A; writing—original draft preparation, E.A., P.B., F.T., A.A.; funding acquisition, P.B. All authors have read and agreed to the published version of the manuscript.
Funding
This research received external funding from the JMG Foundation, Liechtenstein. F.T. received additional funding from the National Biodiesel Board (grant # 40002214).
Data Availability Statement
Data available upon request to the authors.
Acknowledgments
We would like to thank significant support from the Fern team: Hannah Mowat, Nicole Polsterer, Perrine Fournier, and Lindsay Duffield helped P.B. in mapping the trade agreement processes and the positions and interests of European stakeholders. Lindsay also assisted on data collection, including the negotiated tariffs and quotas. We would also like to thank two anonymous reviewers for their thoughtful comments on previous versions of the manuscript.
Conflicts of Interest
The authors declare no conflict of interest.
References
- CEPEA; CNA. PIB do Agronegócio. Piracicaba, Brazil. 2021. Available online: https://www.cepea.esalq.usp.br/br/pib-do-agronegocio-brasileiro.aspx (accessed on 10 September 2021).
- IPEA. Nota de Conjuntura N. 52 Rio de Janeiro. 2021. Available online: https://www.ipea.gov.br/portal/images/stories/PDFs/conjuntura/210825_nota_18_pib_agora.pdf (accessed on 14 September 2021).
- Pan, Y.; Birdsey, R.A.; Fang, J.; Houghton, R.; Kauppi, P.E.; Kurz, W.A.; Phillips, O.L.; Shvidenko, A.; Lewis, S.L.; Canadell, J.G.; et al. A Large and Persistent Carbon Sink in the World’s Forests. Science 2011, 333, 988–993. [Google Scholar] [CrossRef] [PubMed] [Green Version]
- Foley, J.A.; DeFries, R.; Asner, G.P.; Barford, C.; Bonan, G.; Carpenter, S.R.; Chapin, F.S.; Coe, M.T.; Daily, G.C.; Gibbs, H.K.; et al. Global Consequences of Land Use. Science 2005, 309, 570–574. [Google Scholar] [CrossRef] [PubMed] [Green Version]
- Simmons, C.S.; Walker, R.; Perz, S.; Aldrich, S.; Caldas, M.; Pereira, R.; Leite, F.; Fernandes, L.C.; Arima, E. Doing it for Themselves: Direct Action Land Reform in the Brazilian Amazon. World Dev. 2010, 38, 429–444. [Google Scholar] [CrossRef]
- Rorato, A.C.; Picoli, M.C.; Verstegen, J.A.; Camara, G.; Silva Bezerra, F.G.; SEscada, M.I. Environmental Threats over Amazonian Indigenous Lands. Land 2021, 10, 267. [Google Scholar] [CrossRef]
- Patel, K. Brazil Battered by Drought: NASA Earth Observatory. 2021. Available online: https://earthobservatory.nasa.gov/images/148468/brazil-battered-by-drought (accessed on 14 September 2021).
- Walker, R.T. Collision Course: Development Pushes Amazonia toward Its Tipping Point. Environ. Sci. Policy Sustain. Dev. 2020, 63, 15–25. [Google Scholar] [CrossRef]
- Nobre, C.A.; Borma, L.D.S. Tipping points’ for the Amazon forest. Curr. Opin. Environ. Sustain. 2009, 1, 28–36. [Google Scholar] [CrossRef]
- Lovejoy, T.E.; Nobre, C. Amazon Tipping Point; American Association for the Advancement of Science: Washington, DC, USA, 2018. [Google Scholar]
- Arraut, J.M.; Nobre, C.; Barbosa, H.M.; Obregón, G.; Marengo, J. Aerial Rivers and Lakes: Looking at Large-Scale Moisture Transport and Its Relation to Amazonia and to Subtropical Rainfall in South America. J. Clim. 2012, 25, 543–556. [Google Scholar] [CrossRef]
- Lovejoy, T.E.; Nobre, C. Amazon Tipping Point: Last Chance for Action; American Association for the Advancement of Science: Washington, DC, USA, 2019. [Google Scholar]
- Gatti, L.V.; Basso, L.S.; Miller, J.B.; Gloor, M.; Domingues, L.G.; Cassol, H.L.G.; Tejada, G.; Aragão, L.E.O.C.; Nobre, C.; Peters, W.; et al. Amazonia as a carbon source linked to deforestation and climate change. Nature 2021, 595, 388–393. [Google Scholar] [CrossRef] [PubMed]
- Conceição, K.V.; Chaves, M.E.; Picoli, M.C.; Sánchez, A.H.; Soares, A.R.; Mataveli, G.A.; Silva, D.E.; Costa, J.S.; Camara, G. Government policies endanger the indigenous peoples of the Brazilian Amazon. Land Use Policy 2021, 108, 105663. [Google Scholar] [CrossRef]
- Abessa, D.; Famá, A.; Buruaem, L. The systematic dismantling of Brazilian environmental laws risks losses on all fronts. Nat. Ecol. Evol. 2019, 3, 510–511. [Google Scholar] [CrossRef]
- Laue, J.; Arima, E. What drives downsizing of protected areas? A case study of Amazon National Park. J. Lat. Am. Geogr. 2016, 15, 7–31. [Google Scholar]
- Brito, B.; Barreto, P.; Brandão, A., Jr.; Baima, S.; Gomes, P.H. Stimulus for land grabbing and deforestation in the Brazilian Amazon. Environ. Res. Lett. 2019, 14, 064018. [Google Scholar] [CrossRef]
- IMAZON. Ameaça e Pressão de Desmatamento em Áreas Protegidas. 2021. Available online: https://imazon.org.br/imprensa/terras-indigenas-yanomami-alto-rio-negro-e-munduruku-sao-as-mais-pressionadas-pelo-desmatamento-na-amazonia/Belém (accessed on 16 September 2021).
- Abman, R.; Lundberg, C. Does Free Trade Increase Deforestation? The Effects of Regional Trade Agreements. J. Assoc. Environ. Resour. Econ. 2020, 7, 35–72. [Google Scholar] [CrossRef]
- IBGE. Produção Agrícola Municipal, SIDRA; IBGE: Rio de Janeiro, Brazil. Available online: https://sidra.ibge.gov.br/acervo#/S/Q (accessed on 5 March 2021).
- Richards, P.; Taheripour, F.; Arima, E.; Tyner, W.E. Tariffs on American soybeans and their impact on land use change and greenhouse gas emissions in South America. Choices 2020, 35, 1–8. [Google Scholar]
- INPE. Monitoramento da Floresta Amazônica Brasileira Por Satélite—Projeto PRODES: INPE. 2021. Available online: http://www.obt.inpe.br/OBT/assuntos/programas/amazonia/prodes (accessed on 20 January 2021).
- Arima, E.Y.; Richards, P.; Walker, R.T. Biofuel expansion and the spatial economy: Implications for the Amazon Basin in the 21st century. In Bioenergy and Land Use Change: Impact on Natural Capital and Ecosystem Services; American Geophysical Union: Washington, DC, USA, 2017. [Google Scholar]
- Le Tourneau, F.-M. The sustainability challenges of indigenous territories in Brazil’s Amazonia. Curr. Opin. Environ. Sustain. 2015, 14, 213–220. [Google Scholar] [CrossRef]
- Pendrill, F.; Persson, U.M.; Godar, J.; Kastner, T.; Moran, D.; Schmidt, S.; Wood, R. Agricultural and forestry trade drives large share of tropical deforestation emissions. Glob. Environ. Chang. 2019, 56, 1–10. [Google Scholar] [CrossRef]
- Green, J.M.; Croft, S.A.; Durán, A.P.; Balmford, A.P.; Burgess, N.D.; Fick, S.; Gardner, T.; Godar, J.; Suavet, C.; Virah-Sawmy, M.; et al. Linking global drivers of agricultural trade to on-the-ground impacts on biodiversity. Proc. Natl. Acad. Sci. USA 2019, 116, 23202–23208. [Google Scholar] [CrossRef] [Green Version]
- Zu Ermgassen, E.K.; Godar, J.; Lathuillière, M.J.; Löfgren, P.; Gardner, T.; Vasconcelos, A.; Meyfroidt, P. The origin, supply chain, and deforestation risk of Brazil’s beef exports. Proc. Natl. Acad. Sci. USA 2020, 117, 31770–31779. [Google Scholar] [CrossRef]
- Pendrill, F.; Persson, U.M.; Thomas, W.L., Jr. Deforestation Risk Embodied in Production and Consumption of Agricultural and Forestry Commodities 2005–2017, 1st ed.; Zenodo: Genève, Switzerland, 2020; Available online: https://doi.org/10.5281/zenodo.4250532 (accessed on 21 September 2021).
- Alcott, B. Jevons’ paradox. Ecol. Econ. 2005, 54, 9–21. [Google Scholar] [CrossRef]
- Angelsen, A. Agricultural expansion and deforestation: Modelling the impact of population, market forces and property rights. J. Dev. Econ. 1999, 58, 185–218. [Google Scholar] [CrossRef]
- Anderson, J.E.; Van Wincoop, E. Borders, Trade and Welfare; National Bureau of Economic Research: Cambridge, MA, USA, 2001. [Google Scholar]
- Anderson, J.E.; Yotov, Y.V. Terms of Trade and Global Efficiency Effects of Free Trade Agreements, 1990–2002. J. Int. Econ. 2016, 99, 279–298. [Google Scholar] [CrossRef] [Green Version]
- Samuelson, P.A. Welfare economics and international trade. Am. Econ. Rev. 1938, 28, 261–266. [Google Scholar]
- Feenstra, R.C. Advanced International Trade: Theory and Evidence; Princeton University Press: Princeton, NJ, USA, 2015. [Google Scholar]
- Arima, E.; Richards, P.; Walker, R.; Caldas, M. Statistical confirmation of indirect land use change in the Brazilian Amazon. Environ. Res. Lett. 2011, 6, 024010. [Google Scholar] [CrossRef]
- Richards, P.; Walker, R.T.; Arima, E. Spatially complex land change: The Indirect effect of Brazil’s agricultural sector on land use in Amazonia. Glob. Environ. Chang. 2014, 29, 1–9. [Google Scholar] [CrossRef] [Green Version]
- Hertel, T.W. Global Trade Analysis: Modeling and Applications; Cambridge University Press: Cambridge, UK, 1997. [Google Scholar]
- Hertel, T.W.; Burke, M.B.; Lobell, D.B. The poverty implications of climate-induced crop yield changes by 2030. Glob. Environ. Chang. 2010, 20, 577–585. [Google Scholar] [CrossRef] [Green Version]
- Yao, G.; Hertel, T.W.; Taheripour, F. Economic drivers of telecoupling and terrestrial carbon fluxes in the global soybean complex. Glob. Environ. Chang. 2018, 50, 190–200. [Google Scholar] [CrossRef]
- Taheripour, F.; Tyner, W.E. Impacts of possible Chinese 25% tariff on US soybeans and other agricultural commodities. Choices 2018, 33, 1–7. [Google Scholar]
- Taheripour, F.; Hertel, T.W.; Ramankutty, N. Market-mediated responses confound policies to limit deforestation from oil palm expansion in Malaysia and Indonesia. Proc. Natl. Acad. Sci. USA 2019, 116, 19193–19199. [Google Scholar] [CrossRef] [Green Version]
- Harrison, W.J.; Horridge, M.; Pearson, K.R.; Wittwer, G. A Practical Method for Explicitly Modeling Quotas and Other Complementarities. Comput. Econ. 2004, 23, 325–341. [Google Scholar] [CrossRef]
- van der Mensbrugghe, D. The ABCs of TRQs. GTAP 2020, unpublished manuscript. [Google Scholar]
- Hertel, T.; van der Mensbrugghe, D. Chapter 14: Behavioral parameters. In Global Trade Analysis Project (GTAP); Purdue University: West Lafayette, Indiana, 2019. [Google Scholar]
- Arima, E.; Barreto, P.; Araújo, E.; Soares-Filho, B. Public policies can reduce tropical deforestation: Lessons and challenges from Brazil. Land Use Policy 2014, 41, 465–473. [Google Scholar] [CrossRef]
- Cisneros, E.; Zhou, S.L.; Borner, J. Naming and Shaming for Conservation: Evidence from the Brazilian Amazon. PLoS ONE 2015, 10, e0136402. [Google Scholar] [CrossRef] [PubMed] [Green Version]
- Malcolm, G. Adjusting tax rates in the GTAP data base. In Global Trade Analysis Project (GTAP); GTAP Technical Paper No. 12; Purdue University: West Lafayette, Indiana, 2000; Volume 6, p. 20. [Google Scholar]
- Smith, T.E.; LeSage, J.P. A Bayesian probit model with spatial dependencies. In Advances in Econometrics: Spatial and Spatiotemporal Econometrics; Lesage, J.P., Kelley, P., Eds.; Elsevier: Oxford, UK, 2004; pp. 127–160. [Google Scholar]
- Arima, E. A Spatial Probit Econometric Model of Land Change: The Case of Infrastructure Development in Western Amazonia, Peru. PLoS ONE 2016, 11, e0152058. [Google Scholar] [CrossRef] [PubMed] [Green Version]
- MapBiomas. Project Mapbiomas—Collection 4.1 of Brazilian Land Cover and Use Map Series. 4.1. Available online: https://mapbiomas.org/pages/downloads (accessed on 18 May 2020).
- Observatório da Cana. 2021. Available online: https://observatoriodacana.com.br/ (accessed on 20 September 2021).
- Schneider, R.; Arima, E.Y.; Verissimo, A.; Souza, C., Jr.; Barreto, P. Sustainable Amazon: Limitations and Opportunities for Rural Development; Bank, W., Ed.; World Bank: Washington, DC, USA, 2002. [Google Scholar]
- Chomitz, K.; Thomas, T.S. Determinants of Land Use in Amazônia: A Fine-Scale Spatial Analysis. Am. J. Agric. Econ. 2003, 85, 1016–1028. [Google Scholar] [CrossRef]
- Alencar, A.; Pereira, C.; Castro, I.; Cardoso, A.; Souza, L.; Costa, R.; Bentes, A.J.; Stella, O.; Azevedo, A.; Gomes, J.; et al. Desmatamento Nos Assentamentos da Amazônia: Histórico, Tendências e Oportunidades; IPAM: Brasília, Brazil, 2016. [Google Scholar]
- Brandão, A., Jr.; Souza, C., Jr. Desmatamento nos assentamentos de reforma agrária na Amazônia. Estado Amazon. 2006, 7, 4. [Google Scholar]
- Carrero, G.C.; Fearnside, P.M.; do Valle, D.R.; de Souza Alves, C. Deforestation Trajectories on a Development Frontier in the Brazilian Amazon: 35 Years of Settlement Colonization, Policy and Economic Shifts, and Land Accumulation. Environ. Manag. 2020, 66, 966–984. [Google Scholar] [CrossRef]
- Pereira, R.; Simmons, C.S.; Walker, R. Smallholders, Agrarian Reform, and Globalization in the Brazilian Amazon: Cattle versus the Environment. Land 2016, 5, 24. [Google Scholar] [CrossRef]
- Nelson, A.; Chomitz, K.M. Effectiveness of Strict vs. Multiple Use Protected Areas in Reducing Tropical Forest Fires: A Global Analysis Using Matching Methods. PLoS ONE 2011, 6, e22722. [Google Scholar] [CrossRef]
- Arima, E.Y.; Simmons, C.S.; Walker, R.; Cochrane, M.A. Fire in the Brazilian Amazon: A Spatially Explicit Model for Policy Impact Analysis. J. Reg. Sci. 2007, 47, 541–567. [Google Scholar] [CrossRef]
- Soares-Filho, B.; Moutinho, P.; Nepstad, D.; Anderson, A.; Rodrigues, H.; Garcia, R.; Dietzsch, L.; Merry, F.; Bowman, M.; Hissa, L.; et al. Role of Brazilian Amazon protected areas in climate change mitigation. Proc. Natl. Acad. Sci. USA 2010, 107, 10821–10826. [Google Scholar] [CrossRef] [Green Version]
- Hagen, A. Fuzzy set approach to assessing similarity of categorical maps. Int. J. Geogr. Inf. Sci. 2003, 17, 235–249. [Google Scholar] [CrossRef] [Green Version]
- Bernard, E.; Penna, L.; Araújo, E. Downgrading, Downsizing, Degazettement, and Reclassification of Protected Areas in Brazil. Conserv. Biol. 2014, 28, 939–950. [Google Scholar] [CrossRef] [PubMed]
- Diele-Viegas, L.M.; Rocha, C.F.D. Why releasing mining on Amazonian indigenous lands and the advance of agrobusiness is extremely harmful for the mitigation of world’s climate change? Comment on Pereira et al. (Environmental Science & Policy 100 (2019) 8–12). Environ. Sci. Policy 2020, 103, 30–31. [Google Scholar]
- Pfaff, A.; Walker, R. Regional interdependence and forest “transitions”: Substitute deforestation limits the relevance of local reversals. Land Use Policy 2010, 27, 119–129. [Google Scholar] [CrossRef]
- Cuypers, D.; Geerken, T.; Gorissen, L.; Lust, A.; Peters, G.; Karstensen, J.; Prieler, S.; Fischer, G.; Hizsnyik, E.; Van Velthuizen, H. The Impact of EU Consumption on Deforestation: Comprehensive Analysis of the Impact of EU Consumption on Deforestation; European Union Publications Office: Luxembourg, 2013. Available online: https://ec.europa.eu/environment/forests/pdf/1.%20Report%20analysis%20of%20impact.pdf (accessed on 15 October 2021).
- Kehoe, L.; Reis, T.; Virah-Sawmy, M.; Balmford, A.; Kuemmerle, T.; Knohl, A.; Antonelli, A.; Hochkirch, A.; Vira, B.; Massa, B.; et al. Make EU trade with Brazil sustainable. Science 2019, 364, 341–342. [Google Scholar] [CrossRef] [Green Version]
- Kehoe, L.; dos Reis, T.N.; Meyfroidt, P.; Bager, S.; Seppelt, R.; Kuemmerle, T.; Berenguer, E.; Clark, M.; Davis, K.F.; zu Ermgassen, E.K.; et al. Inclusion, Transparency, and Enforcement: How the EU-Mercosur Trade Agreement Fails the Sustainability Test. One Earth 2020, 3, 268–272. [Google Scholar] [CrossRef]
- Follador, M.; Soares-Filho, B.S.; Philippidis, G.; Davis, J.L.; de Oliveira, A.R.; Rajão, R. Brazil’s sugarcane embitters the EU-Mercosur trade talks. Sci. Rep. 2021, 11, 13768. [Google Scholar] [CrossRef]
- Siqueira-Gay, J.; Soares-Filho, B.; Sanchez, L.E.; Oviedo, A.; Sonter, L.J. Proposed Legislation to Mine Brazil’s Indigenous Lands Will Threaten Amazon Forests and Their Valuable Ecosystem Services. One Earth 2020, 3, 356–362. [Google Scholar] [CrossRef]
- Conselho Indígena Missionário (CIMA). Violence against Indigenous People. 2019. Available online: https://cimi.org.br/wp-content/uploads/2020/10/Executive-Summary-2019-cimi_ingles.pdf (accessed on 12 March 2021).
- Bachelet, M. Statement by Michelle Bachelet, UN High Comissioner for Human Rights. In Proceedings of the 45th Session on Human Rights Council, Geneva, Switzerland, 14 September–7 October 2020. [Google Scholar]
- Rankins, J. Leaked EU anti-deforestation law omits fragile grasslands and wetlands. The Guardian, 14 September 2021. [Google Scholar]
- Bastiaens, I.; Postnikov, E. Greening up: The effects of environmental standards in EU and US trade agreements. Environ. Politics 2017, 26, 847–869. [Google Scholar] [CrossRef]
- Ferrante, L.; Fearnside, P.M. Brazil threatens Indigenous lands. Science 2020, 368, 481–482. [Google Scholar] [CrossRef]
- LSU Consulting. SIA in Support of the Association Agreement Negotiations between the European Union and Mercosur; London School of Economics: London, UK, 2020. [Google Scholar]
- Francois, J.; Häberli, C.; Manchin, M.; Polanco, R.; Rojas-Romagosa, H.; Tomberger, P. Assessment of the Potential Environmental Impacts and Risks in Switzerland and the MERCOSUR States Resulting from a Free Trade Agreement (FTA) between the EFTA States and MERCOSUR. Available online: https://www.newsd.admin.ch/newsd/message/attachments/61957.pdf (accessed on 1 November 2020).
- Beckman, J.; Hertel, T.; Tyner, W. Validating energy-oriented CGE models. Energy Econ. 2011, 33, 799–806. [Google Scholar] [CrossRef] [Green Version]
- Kehoe, T.J.; Polo, C.; Sancho, F. An evaluation of the performance of an applied general equilibrium model of the Spanish economy. Econ. Theory 1995, 6, 115–141. [Google Scholar] [CrossRef] [Green Version]
- Richards, P.; Arima, E. Capital surpluses in the farming sector and agricultural expansion in Brazil. Environ. Res. Lett. 2018, 13, 075011. [Google Scholar] [CrossRef]
- Rajão, R.; Soares-Filho, B.; Nunes, F.; Börner, J.; Machado, L.; Assis, D.; Oliveira, A.; Pinto, L.; Ribeiro, V.; Rausch, L.; et al. The rotten apples of Brazil’s agribusiness. Science 2020, 369, 246–248. [Google Scholar] [CrossRef] [PubMed]
- Copeland, B.R.; Taylor, M.S. Trade, growth, and the environment. J. Econ. Lit. 2004, 42, 7–71. [Google Scholar] [CrossRef]
- United Nations. Glasgow Leaders’ Declaration on Forests and Land Use. Available online: https://ukcop26.org/glasgow-leaders-declaration-on-forests-and-land-use/ (accessed on 9 November 2021).
- IPEA. Comércio Exterior de Produtos do Agronegócio: Balanço de 2020 e Perspectivas Para 2021; IPEA: Rio de Janeiro, Brazil, 2021. [Google Scholar]
- Walker, R.T.; Simmons, C.; Arima, E.; Galvan-Miyoshi, Y.; Antunes, A.; Waylen, M.; Irigaray, M. Avoiding Amazonian Catastrophes: Prospects for Conservation in the 21st Century. One Earth 2019, 1, 202–215. [Google Scholar] [CrossRef] [Green Version]
Figure 1.
Main components of GTAP-BIO model.

Figure 2.
Mercosur imports of processed dairy from the EU (million USD).

Figure 3.
Mercosur imports of industrial sectors from the EU (million USD).

Figure 4.
Land use change transitions for Brazil (BR) and other countries of South America (OCSA) under low trade elasticities scenarios (S11, S12, and S13).
Figure 4.
Land use change transitions for Brazil (BR) and other countries of South America (OCSA) under low trade elasticities scenarios (S11, S12, and S13).

Figure 5.
Land use change transitions for Brazil (BR) and other countries of South America (RSA) under high trade elasticities scenarios (S21, S22, and S23).
Figure 5.
Land use change transitions for Brazil (BR) and other countries of South America (RSA) under high trade elasticities scenarios (S21, S22, and S23).

Figure 6.
Hotspots of predicted deforestation in the Brazilian Amazon biome. Note: Predicted deforestation raster cells were converted to points for better cartographic display.
Figure 6.
Hotspots of predicted deforestation in the Brazilian Amazon biome. Note: Predicted deforestation raster cells were converted to points for better cartographic display.

Figure 7.
Indigenous lands and conservation units near hotspots of predicted deforestation. Note: Predicted deforestation raster cells were converted to points for better cartographic display.
Figure 7.
Indigenous lands and conservation units near hotspots of predicted deforestation. Note: Predicted deforestation raster cells were converted to points for better cartographic display.


Table 1.
Examined scenarios.
| Description | Low Deforestation with Multiple Cropping | High Deforestation with Multiple Cropping | High Deforestation and No Double Cropping |
|---|---|---|---|
| Standard GTAP trade elasticity | S11 | S12 | S13 |
| Higher trade elasticities for targeted products | S21 | S22 | S23 |
Table 2.
Welfare impacts (EV) of the EU–Mercosur trade agreement (in million USD).
| Region | S11 | S12 | S13 | S21 | S22 | S23 |
|---|---|---|---|---|---|---|
| EU | 1643 | 1648 | 1648 | 1719 | 1727 | 1728 |
| Brazil | 583 | 572 | 570 | 608 | 589 | 587 |
| OCSA | 208 | 204 | 204 | 247 | 239 | 239 |
| US | −432 | −435 | −435 | −441 | −448 | −448 |
| China | −672 | −661 | −660 | −802 | −783 | −781 |
| Other | −990 | −986 | −985 | −1080 | −1071 | −1070 |
| Total | 341 | 342 | 342 | 251 | 254 | 254 |
Table 3.
EU imports of soybeans by exporting region for all examined scenarios (in million USD).
| Region | Base | S11 | S12 | S13 | S21 | S22 | S23 |
|---|---|---|---|---|---|---|---|
| US | 1961 | 1859 | 1859 | 1859 | 1578 | 1579 | 1579 |
| EU | 100 | 95 | 95 | 95 | 84 | 83 | 83 |
| Brazil | 189 | 179 | 179 | 179 | 150 | 150 | 150 |
| China | 5 | 5 | 5 | 5 | 4 | 4 | 4 |
| OCSA | 225 | 410 | 410 | 410 | 794 | 794 | 794 |
| Other | 26 | 24 | 24 | 24 | 20 | 20 | 20 |
| Total | 1961 | 1859 | 1859 | 1859 | 1578 | 1579 | 1579 |
Table 4.
EU imports of beef by exporting region for all examined scenarios (in million USD).
| Region | Base | S11 | S12 | S13 | S21 | S22 | S23 |
|---|---|---|---|---|---|---|---|
| US | 476 | 475 | 475 | 475 | 476 | 476 | 476 |
| EU | 14,425 | 14,360 | 14,360 | 14,360 | 14,355 | 14,356 | 14,356 |
| Brazil | 737 | 749 | 748 | 748 | 753 | 751 | 751 |
| China | 56 | 56 | 56 | 56 | 56 | 56 | 56 |
| OCSA | 1573 | 1682 | 1682 | 1682 | 1686 | 1686 | 1686 |
| Other | 3285 | 3282 | 3282 | 3282 | 3283 | 3283 | 3283 |
| Total | 20,551 | 20,604 | 20,604 | 20,604 | 20,608 | 20,608 | 20,608 |
Table 5.
EU imports of beverages and sugar from exporting regions for all examined scenarios (in million USD).
Table 5.
EU imports of beverages and sugar from exporting regions for all examined scenarios (in million USD).
| Region | Base | S11 | S12 | S13 | S21 | S22 | S23 |
|---|---|---|---|---|---|---|---|
| US | 2681 | 2658 | 2658 | 2658 | 2584 | 2584 | 2584 |
| EU | 50,122 | 49,629 | 49,629 | 49,629 | 48,057 | 48,057 | 48,057 |
| Brazil | 1264 | 1760 | 1760 | 1760 | 3578 | 3578 | 3578 |
| China | 218 | 216 | 216 | 216 | 210 | 210 | 210 |
| OCSA | 1167 | 1395 | 1395 | 1395 | 2804 | 2804 | 2804 |
| Other | 7698 | 7630 | 7629 | 7629 | 7416 | 7416 | 7416 |
| Total | 63,150 | 63,287 | 63,287 | 63,287 | 64,649 | 64,649 | 64,649 |
Table 6.
Percent changes in production of affected sectors by EMTA.
| Region | Commodity | S11 | S12 | S13 | S21 | S22 | S23 |
|---|---|---|---|---|---|---|---|
| EU | Soybeans | −0.761 | −0.766 | −0.767 | −5.718 | −5.747 | −5.750 |
| Brazil | 0.173 | 0.211 | 0.214 | −0.064 | 0.027 | 0.036 | |
| OCSA | 0.303 | 0.298 | 0.298 | 0.590 | 0.577 | 0.576 | |
| EU | Processed ruminant | −0.194 | −0.193 | −0.193 | −0.215 | −0.211 | −0.211 |
| Brazil | 0.174 | 0.161 | 0.159 | 0.200 | 0.166 | 0.162 | |
| OCSA | 0.217 | 0.219 | 0.219 | 0.156 | 0.159 | 0.160 | |
| EU | Processed non ruminant | −0.624 | −0.624 | −0.624 | −0.794 | −0.794 | −0.794 |
| Brazil | 1.282 | 1.281 | 1.281 | 1.715 | 1.712 | 1.712 | |
| OCSA | 4.359 | 4.360 | 4.360 | 5.455 | 5.457 | 5.457 | |
| EU | Beverage and sugar | −0.231 | −0.231 | −0.231 | −1.041 | −1.041 | −1.041 |
| Brazil | 1.612 | 1.619 | 1.620 | 5.215 | 5.251 | 5.255 | |
| OCSA | 0.741 | 0.741 | 0.741 | 3.908 | 3.907 | 3.907 | |
| EU | Sugarcane ethanol | −0.157 | −0.155 | −0.155 | −0.403 | −0.402 | −0.402 |
| Brazil | 0.190 | 0.201 | 0.202 | −0.004 | 0.015 | 0.018 | |
| OCSA | −0.128 | −0.126 | −0.125 | −0.850 | −0.845 | −0.844 | |
| EU | Processed dairy | 0.048 | 0.048 | 0.048 | 0.033 | 0.033 | 0.033 |
| Brazil | −0.187 | −0.191 | −0.191 | −0.194 | −0.202 | −0.203 | |
| OCSA | −0.453 | −0.452 | −0.452 | −0.499 | −0.496 | −0.496 | |
| EU | Affected industries and services | 0.042 | 0.042 | 0.042 | 0.060 | 0.060 | 0.060 |
| Brazil | −0.190 | −0.191 | −0.192 | −0.307 | −0.311 | −0.312 | |
| OCSA | −0.196 | −0.196 | −0.196 | −0.313 | −0.313 | −0.313 |
Publisher’s Note: MDPI stays neutral with regard to jurisdictional claims in published maps and institutional affiliations. |
© 2021 by the authors. Licensee MDPI, Basel, Switzerland. This article is an open access article distributed under the terms and conditions of the Creative Commons Attribution (CC BY) license (https://creativecommons.org/licenses/by/4.0/).
Share and Cite
MDPI and ACS Style
Arima, E.; Barreto, P.; Taheripour, F.; Aguiar, A. Dynamic Amazonia: The EU–Mercosur Trade Agreement and Deforestation. Land 2021, 10, 1243. https://doi.org/10.3390/land10111243
AMA Style
Arima E, Barreto P, Taheripour F, Aguiar A. Dynamic Amazonia: The EU–Mercosur Trade Agreement and Deforestation. Land. 2021; 10(11):1243. https://doi.org/10.3390/land10111243
Chicago/Turabian StyleArima, Eugenio, Paulo Barreto, Farzad Taheripour, and Angel Aguiar. 2021. "Dynamic Amazonia: The EU–Mercosur Trade Agreement and Deforestation" Land 10, no. 11: 1243. https://doi.org/10.3390/land10111243
Note that from the first issue of 2016, this journal uses article numbers instead of page numbers. See further details here.