Article

Four Years Continuous Monitoring Reveals Different Effects of Urban Constructed Wetlands on Bats

1
Department of Biology, University of North Carolina Greensboro, Greensboro, NC 27412, USA
2
Institute for the Environment, University of North Carolina Chapel Hill, Chapel Hill, NC 27517, USA
3
Department of Biological Sciences, University of Alberta, Edmonton, AB T6G 2E1, Canada
4
Greensboro Science Center, Greensboro, NC 27455, USA
*
Author to whom correspondence should be addressed.
Land 2021, 10(10), 1087; https://doi.org/10.3390/land10101087
Submission received: 14 September 2021 / Revised: 4 October 2021 / Accepted: 9 October 2021 / Published: 14 October 2021
(This article belongs to the Special Issue Wildlife Protection and Habitat Management: Practice and Perspectives)

Abstract

:
Proactive artificial wetland constructions have been implemented to mitigate the loss of wetlands and their ecosystem services. As wetlands are habitats for bats, short-term (one or two years) studies find that constructed wetlands can immediately increase local bat activity and diversity. However, it is not clear how constructed wetlands affect bats through time while the wetlands are aging. We collected four years of continuous bat acoustic monitoring data at two constructed wetlands in an urban park in Greensboro, NC, USA. We examined bat activity and community composition patterns at these wetlands and compared them with reference sites in the city. With four years of data, we found that the effects of constructed wetlands were both habitat- and species-specific. The wetland in forests significantly increased bat activity, while the wetland in the open grass altered bat community composition. Specifically, in terms of species, we found that over time, constructed wetlands no longer attracted more big brown, silver-haired, or evening bats than control sites while the wetlands aged, highlighting the need to study broadly how each bat species uses natural and artificial wetlands. We emphasize the importance of long-term monitoring and the periodical evaluation of wildlife conservation actions.

1. Introduction

Wetlands represent a continuum between both aquatic and terrestrial ecosystems [1]. Despite covering only 6–7% of the Earth’s surface, wetlands are one of the most biologically productive ecosystems [2,3,4]. These species-rich ecosystems provide invaluable services including protection from ecological disturbances such as hurricanes and floods, water filtration, food chain support, and carbon sequestration [3,5]. Ecosystem services provided by wetlands are also fundamental to local economies [6,7,8]. Natural wetlands usually form an interconnective channel network of water and land infrastructure, providing an important habitat for local wildlife [9,10].
Bats, the second most diverse mammal group, also provide invaluable ecosystem services [11]. Many bat species are insectivores and consume large amounts of nocturnal insects. Thus, bats constitute an important pest control service in forest and agricultural systems [12,13]. Bat predation also limits vector-borne diseases that spread via insects [14]. Due to a wide range of interactions between omnivorous bats and flora, bats serve as pollinators and seed dispersers and increase the yield of plants in their environments [11,15]. The influence of bats on ecosystems is large in geographical scope because of their mobility and migration behaviors [16]. Furthermore, bats are bio-indicators for habitat degradation, pollution, and climate change [17,18,19].
Worldwide, wetlands are important habitats for bats and support a wide range of species due to the high abundance of native insects to support foraging [20,21,22,23]. Wetlands are also a source of drinking water for bats [24,25,26]. In addition to the foraging opportunities, high-quality riparian vegetation in wetlands offers roosting structures [27,28]. However, due to climate change, pollution, and the ever-increasing need for land conversion, wetlands are predicted to continue to decline [29]. Pollution and fragmentation of natural wetlands negatively impact wetlands’ ability to support bats, which is particularly severe in urbanized areas [30,31,32,33]. Proactive artificial wetland construction has been implemented to mitigate the increasing losses of wetlands [10,22,34].
Constructed wetlands can be beneficial to wildlife by providing essential habitats for many taxa [10,35]. Constructed wetlands are known to create safe havens for bats, especially in areas that are heavily modified by humans [21,22,34,36]. Menzel et al. (2005) and Parker et al. (2018) demonstrated that the short-term benefits of constructed wetlands to bat communities were observed immediately after the construction or restoration of wetlands within a year or two [34,36]. Yet, there is limited knowledge about natural wetlands and their mechanisms to support wildlife, which in turn limits our understanding of the benefits constructed wetlands provide to wildlife [37,38,39]. The primary purposes of wetland construction in many cases may not be to protect wildlife and consequently may pose risks to specific wildlife or even form an ecological trap [39,40,41,42].
The ecological trap scenario occurs when animals prefer a low-quality habitat over other available higher quality habitats following rapid environmental changes induced by humans [43]. The hypothesis is that environmental changes pose as false cues of high-quality habitats and confuse animals during habitat selection, which eventually leads to lower fitness of individuals [44]. There is evidence that constructed wetlands serve as ecological traps for many species, especially those with limited mobility [40,45]. For example, urban wetlands are often constructed to mitigate stormwater runoff that contains contaminants such as heavy metals, pesticides, and other harmful materials. Frogs living in these constructed wetlands showed lower survival and lacked responses to predator cues [40,46]. Similarly, bats that forage for insects over polluted water are likely to accumulate pollutants over time, even though insects may be more abundant locally [31,47,48].
Pollutant accumulation in constructed wetlands has been well studied. Existing literature shows that pollutants accumulate fastest in the first one or two years after the wetland’s construction and that older wetlands contain comparable high levels of pollutants regardless of how artificial wetlands are constructed [49,50,51]. However, the monitoring and evaluation of biodiversity at constructed wetlands through time is lacking [37,39]. The existing literature tends to present conflicting findings depending on wetland type. For example, in constructed wetlands for wastewater treatment, scientists found decreasing plant diversity over time due to competition [52]. In contrast, mitigation bank wetlands and small restored wetlands on farms showed increasing native plant diversity as wetlands aged [53,54]. A study of amphibian communities in constructed ridge-top wetlands showed that the age of the wetland did not affect the community as a whole or any individual species [55]. However, in a series of constructed urban floodway wetlands, scientists found a higher diversity of macroinvertebrates in older wetlands [56]. To our knowledge, there has not been any multiple-year study on how constructed wetlands affect bats through time.
The objective of our study was to examine bat activity and community composition patterns at two constructed wetlands, through time, as the wetlands aged. We used four years of continuous acoustic monitoring data to investigate whether short-term benefits of constructed wetlands to bats would persist or whether the bat response would attenuate over time. Previous research compared these constructed wetlands with nearby control sites and documented an immediate increase in overall bat activity after wetland construction within a year [34]. Several species including big brown bats (Eptesicus fuscus), silver-haired bats (Lasionycteris noctivagans), evening bats (Nycticeius humeralis), and Mexican free-tailed bats (Tadarida brasiliensis) were attracted to the constructed wetlands and consequently increased overall bat diversity at the wetlands. We hypothesized that overall bat activity and certain species’ activity would continue to be higher at wetland sites than at the nearby control sites over time. Regarding the community, we hypothesized that bat diversity at the wetlands would be higher than the control sites and that bat community composition at the wetland would be different from the control sites through time. We also hypothesized that bat community composition would be similar across years but vary among seasons at each site. Furthermore, we compared the wetland bat community composition with long-term monitoring sites in a large city park in our study area to explore how the constructed wetlands could alter bat community composition. Previous studies have shown that larger urban parks would have higher bat diversity and more evenly distributed communities [57,58,59]. Our wetlands were constructed in a small urban park. The previous study at our wetlands already demonstrated increased bat diversity within a year of the construction [34]. Therefore, we hypothesized that constructed wetlands altered bat community composition and made bat communities in a small urban park similar to bat communities in a large urban park immediately after the construction. We also hypothesized that the community similarity would persist over time as the wetlands aged.

2. Materials and Methods

2.1. Study Sites

In March 2017, the University of North Carolina at Greensboro (UNCG) constructed two small wetlands (less than 1000 m2 each) on its campus in the Peabody Park (a small downtown park, 0.14 km2) near tributaries to North Buffalo Creek, part of the Cape Fear River water basin, in Greensboro (36°4′48″ N 79°49′10″), NC, USA. The wetlands were constructed at two locations representing two different habitats in the park: one in a wooded forest (named the UNCG woody wetland) and one in an open grass field (named the UNCG open wetland). The goals of constructed wetlands include improving runoff water quality, promoting local biodiversity, enhancing campus aesthetics, and providing educational opportunities. Parker et al. (2018) described the design and construction details of the wetlands [34].
To understand how constructed wetlands affect local biodiversity, a paired monitoring design was implemented. Near each constructed wetland, we identified a matching control site. The control sites have similar vegetation structures comparable to the corresponding wetland with one in the forest (named the UNCG woody control) and one in the grass field (named the UNCG open control). At all four sites, a series of non-invasive biodiversity monitoring equipment was installed prior to the wetland construction and continues through to the present. Bat acoustic monitoring was part of the long-term urban wildlife monitoring effort at these sites.
In addition to the wetland vs. control site pairs, we also included three sites from the Greensboro Science Center (GSC), which is located in a 2.2 km2 forested park complex approximately 7.5 km northwest of UNCG, representing a large urban greenspace. The three sites at GSC were selected at different heights to specifically monitor bat acoustic activities below, within, and above the park forest canopy for a complete acoustic profile of bats in the large urban park [60]. Monitoring at those sites started between April and July 2017 and continues through to the present.

2.2. Bat Monitoring and Acoustic Analysis

In total, we assayed seven sites in this study using bat acoustic monitoring. We used Song Meter SM4BAT-FS ultrasonic detectors with the SMM-U2 omnidirectional microphone (Wildlife Acoustics Inc., Maynard, MA, USA) at all sites. All detectors were set to record continuously from sunset to sunrise nightly throughout the year and powered by D cell batteries. The specific detector and microphone settings have been previously described [34,61]. All detectors were checked and maintained every two to four weeks throughout the year.
At all UNCG sites and the below canopy site at GSC (named the GSC ground level), the bat detector was strapped to a tree. The microphone and the connecting cable were run through PVC pipes that were strapped to the tree as well. The microphone was cantilevered away from the tree with a 1 m PVC pipe facing the open space. At these five sites, microphones were approximately 8 m above the ground. At the within canopy site at GSC (named the GSC canopy level), a similar microphone setup was used on a recreational tower with the detector and PVC pipes strapped to the tower pillar, resulting in the microphone facing the open space in the forest canopy approximately 11 m above the ground. The final site at GSC was on the rooftop of a building (named the GSC rooftop level). The microphone was projected above the forest canopy by a 15 m tall weighted station. The specific setup and photos of this site were presented by Li et al. (2020) [62].
We analyzed bat acoustic recordings from April 2017 to December 2020 at all sites except for the GSC rooftop level, which started monitoring in July 2017. For this site, we analyzed bat acoustic recordings from July 2017 to December 2020. We used Kaleidoscope (version 4.5, Wildlife Acoustics Inc., Maynard, MA, USA) to process acoustic recording files and assign species identification. Each recording file had to contain at least three complete bat echolocation calls within 0.5 s to be classified as a bat pass. Others were classified as noise. To assign species identification to a bat pass, we selected big brown bats (EPFU), eastern red bats (Lasiurus borealis, LABO), hoary bats (Lasiurus cinereus, LACI), silver-haired bats (LANO), evening bats (NYHU), tricolored bats (Perimyotis subflavus, PESU), and Mexican free-tailed bats (TABR) in the Kaleidoscope reference library as the only candidate species with the neutral auto-identification setting. This is because previous studies in the area only found these species [63,64]. After the automatic processing, we used the match ratio generated by Kaleidoscope for each bat pass to determine whether we accepted a species identification. We only considered a bat pass identified to species if the match ratio was greater than 0.60, which was a value necessary to be accurate in our study area after comparing Kaleidoscope automatic identification and manual identification by a bat acoustics expert [18,64]. The remaining bat passes were identified as “no ID”. Acoustic analysis yielded the total bat passes (including bat passes identified to a species and no ID) and species-specific bat passes for each recording night at each site. We also counted how many species were recorded each night at each site as nightly species richness.

2.3. Statistical Analysis

We used R (version 4.1.0, [65]) for all statistical analyses and data visualization. Since we recorded bats nightly throughout the year and night length varies through the year in Greensboro, we standardized bat passes by night length. We used R package “suncalc” [66] to extract night length in hours and divided bat passes by night length. For each recording night at a site, we had total bat passes per hour and species-specific bat passes per hour. We also assigned seasons to each recording night using meteorological seasons, as follows: spring (March–May), summer (June–August), fall (September–November), and winter (December–February of the following year). We presented our results in a chronological way with seasons as the blocking factor for statistical analyses because life-history events in different seasons could significantly alter bat acoustic activities and communities [67].
To test whether bat activity levels at the constructed wetlands were higher than at the control sites, we compared the dependent variables, total bat passes, and species-specific bat passes at each site pair. We compared the open pair separately from the woody pair because the physical environmental differences (due to vegetation and other obstacles) could significantly affect the probability to detect and record bats and thus the amount of bat passes recorded [62,68,69]. With the pair design, both the wetland and the control site had similar physical conditions for sound transmission and the same weather condition. We could assume the probability to detect and record a bat was similar for paired sites for a species. We did not make any cross-species comparisons for bat activity as the detection probability could be species-specific. We first checked the normality of dependent variables using the Kolmogorov–Smirnov test for large sample sizes [70] and found that all dependent variables were not normally distributed. Therefore, we used the nonparametric Wilcoxon rank-sum test to compare the medians between the wetlands and their matching control site. We conducted Wilcoxon tests by season. For the spring of 2017, we only included April and May data (wetlands constructed in late March). For the winter of 2020, we only included December data due to logistic reasons. To visualize whether the wetland or the control site had higher bat activities during each season, we extracted the Wilcoxon test results for each season and plotted a tile graph for each wetland vs. its control pair using R package “ggplot2” [71]. Each tile in the graph represented a specific season and showed which site had significantly higher bat activities indicated by the Wilcoxon test.
To understand how constructed wetlands affected the bat community, we first examined bat species richness at all seven sites. Previous research in our area suggested that weather conditions including temperature, wind, and precipitation could affect bat acoustic activities [62,64,72]. Thus, we extracted daily weather data (temperature in °C, wind in km/h, and precipitation in cm/h) from the source as described in Li et al. (2020) [62]. To incorporate weather data into analyses, we constructed generalized linear models with nightly species richness as the dependent variable and site as the independent variable. For the dependent variable, we used the Poisson distribution link for generalized linear models as this variable is a count of species recorded on each night [70]. We constructed generalized linear models for each season separately and used the UNCG open control site as the reference level. We used a backward approach for the covariates and included all three weather variables as regression covariates in an initial model and eliminated nonsignificant covariates. All weather covariate results are reported in Supplementary Material Table S1. For each final model, we plotted residuals to visually examine the model fit. We compared site pairs using Tukey HSD tests in the post hoc analysis. To visualize the generalized linear model results, we plotted box plots via “ggplot2” and used different colors to indicate sites that had significantly different levels of species richness within a season. It is important to note that differences in bat species richness among sites could be affected by the physical conditions near a site. Sites with more vegetation coverage could usually detect bats in a smaller range [62,64,72] and possibly fewer species, given that we did not have forest interior specialist species in our study area [63,64].
Next, we conducted Mantel’s tests to compare community composition between sites. Mantel’s test compares two matrices for correlation, based on multivariate relative distances [73]. We used the month as the sample unit to describe bat communities at each site by calculating mean species-specific bat activities in a month and compared sites in pairs in each year. We binned nightly data together for monthly comparison to reduce the uncertainty among nights caused by different detection probabilities across species. When comparing other sites with the GSC rooftop level for 2017, we only used data between July to December in 2017 from other sites as the Mantel’s test requires two matrices to be the same size, and the GSC rooftop level was set up in July 2017. It is important to note that the bat community was represented by the acoustic activity level instead of number of individual bats. We used the Bray–Curtis distance to calculate the dissimilarity matrix due to there being many zeros in our data. For all Mantel’s tests, we ran 9999 permutations per test and used Spearman’s methods to calculate correlations. To visualize relationships among sites based on the Mantel test, we generated a correlogram indicating if any site pair showed a significant correlation based on monthly mean bat activity matrices via “ggplot2”.
Lastly, we used nonmetric multidimensional scaling (NMDS) to describe how community composition changed over time at each site. Nonmetric multidimensional scaling is an ordination technique that graphically presents community relationships by projecting each community from a multidimensional space into a lower-dimensional plot [73]. In our NMDS analysis, we used the same method as with the Mantel test to describe bat communities at each site monthly. Each data point, representing a site at each month, was quantified in a seven-dimensional space, where each dimension represented a bat species. This analysis described whether one or a few species dominated the acoustic space at each site during each month and whether dominance patterns changed over time. The dominance was indicated by the relative amount of bat acoustic activity in comparison among species at a site and did not reflect the absolute amount of bat acoustic activity among sites. We conducted 500 runs with random starts to search for the best two-dimensional solution with the lowest stress using R package “Vegan” [74]. For each NMDS solution at each site, we extracted NMDS scores for each axis and plotted the graph by “ggplot2” and reported stress value for each graph. The interpretation of NMDS plots should focus on the spatial proximity patterns instead of the NMDS scores on each axis [73]. The physical conditions at each site could affect the probability to detect and record bats and thus affect the NMDS scores.

3. Results

From the spring of 2017 to the winter of 2020, we conducted bat acoustic monitoring through 16 seasons at seven sites. In total, we recorded 744,286 bat passes and identified 444,916 passes to species (Table 1, Supplementary Material Table S2). The UNCG open wetland and the UNCG open control had the highest numbers of bat passes across all sites. The UNCG woody control or the GSC ground level tended to have the lowest numbers of bat passes. Summer was the season with the highest number of bat passes, whereas winter had the lowest bat passes for all sites. Interestingly, at UNCG sites, the spring usually had more bat passes than during the fall. In contrast, at GSC sites, the fall had more bat passes than during the spring (Table 1).

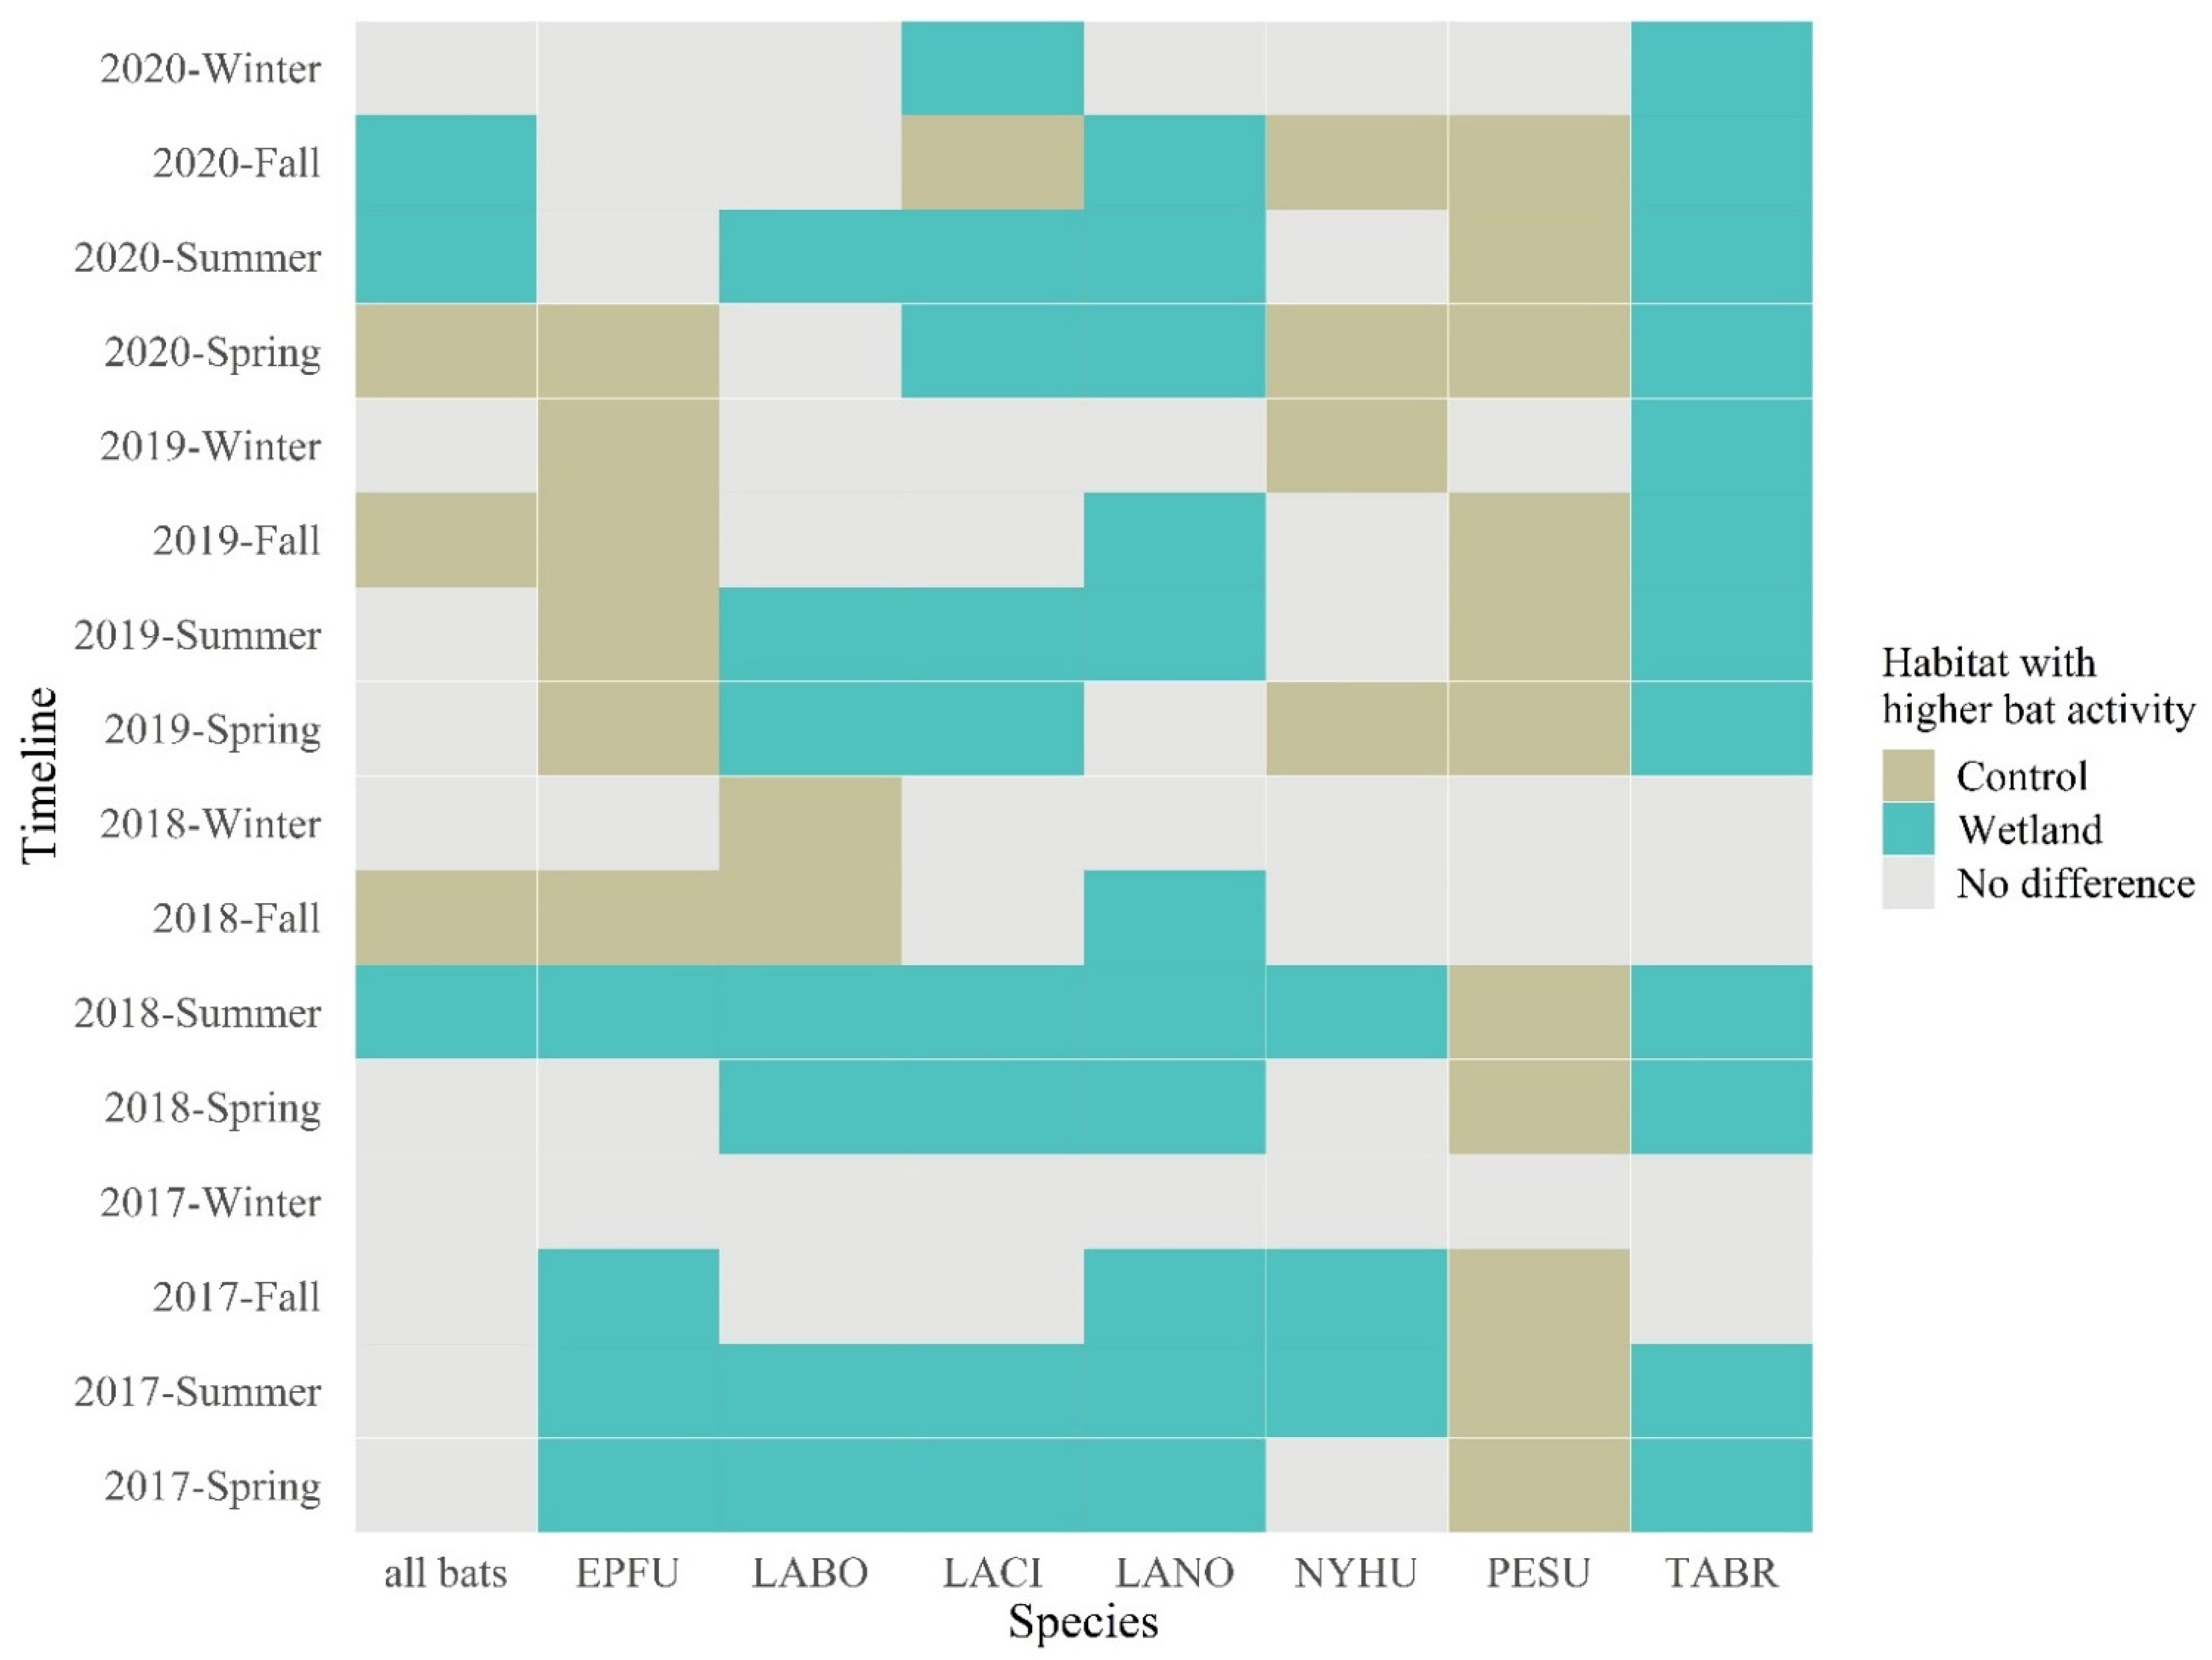
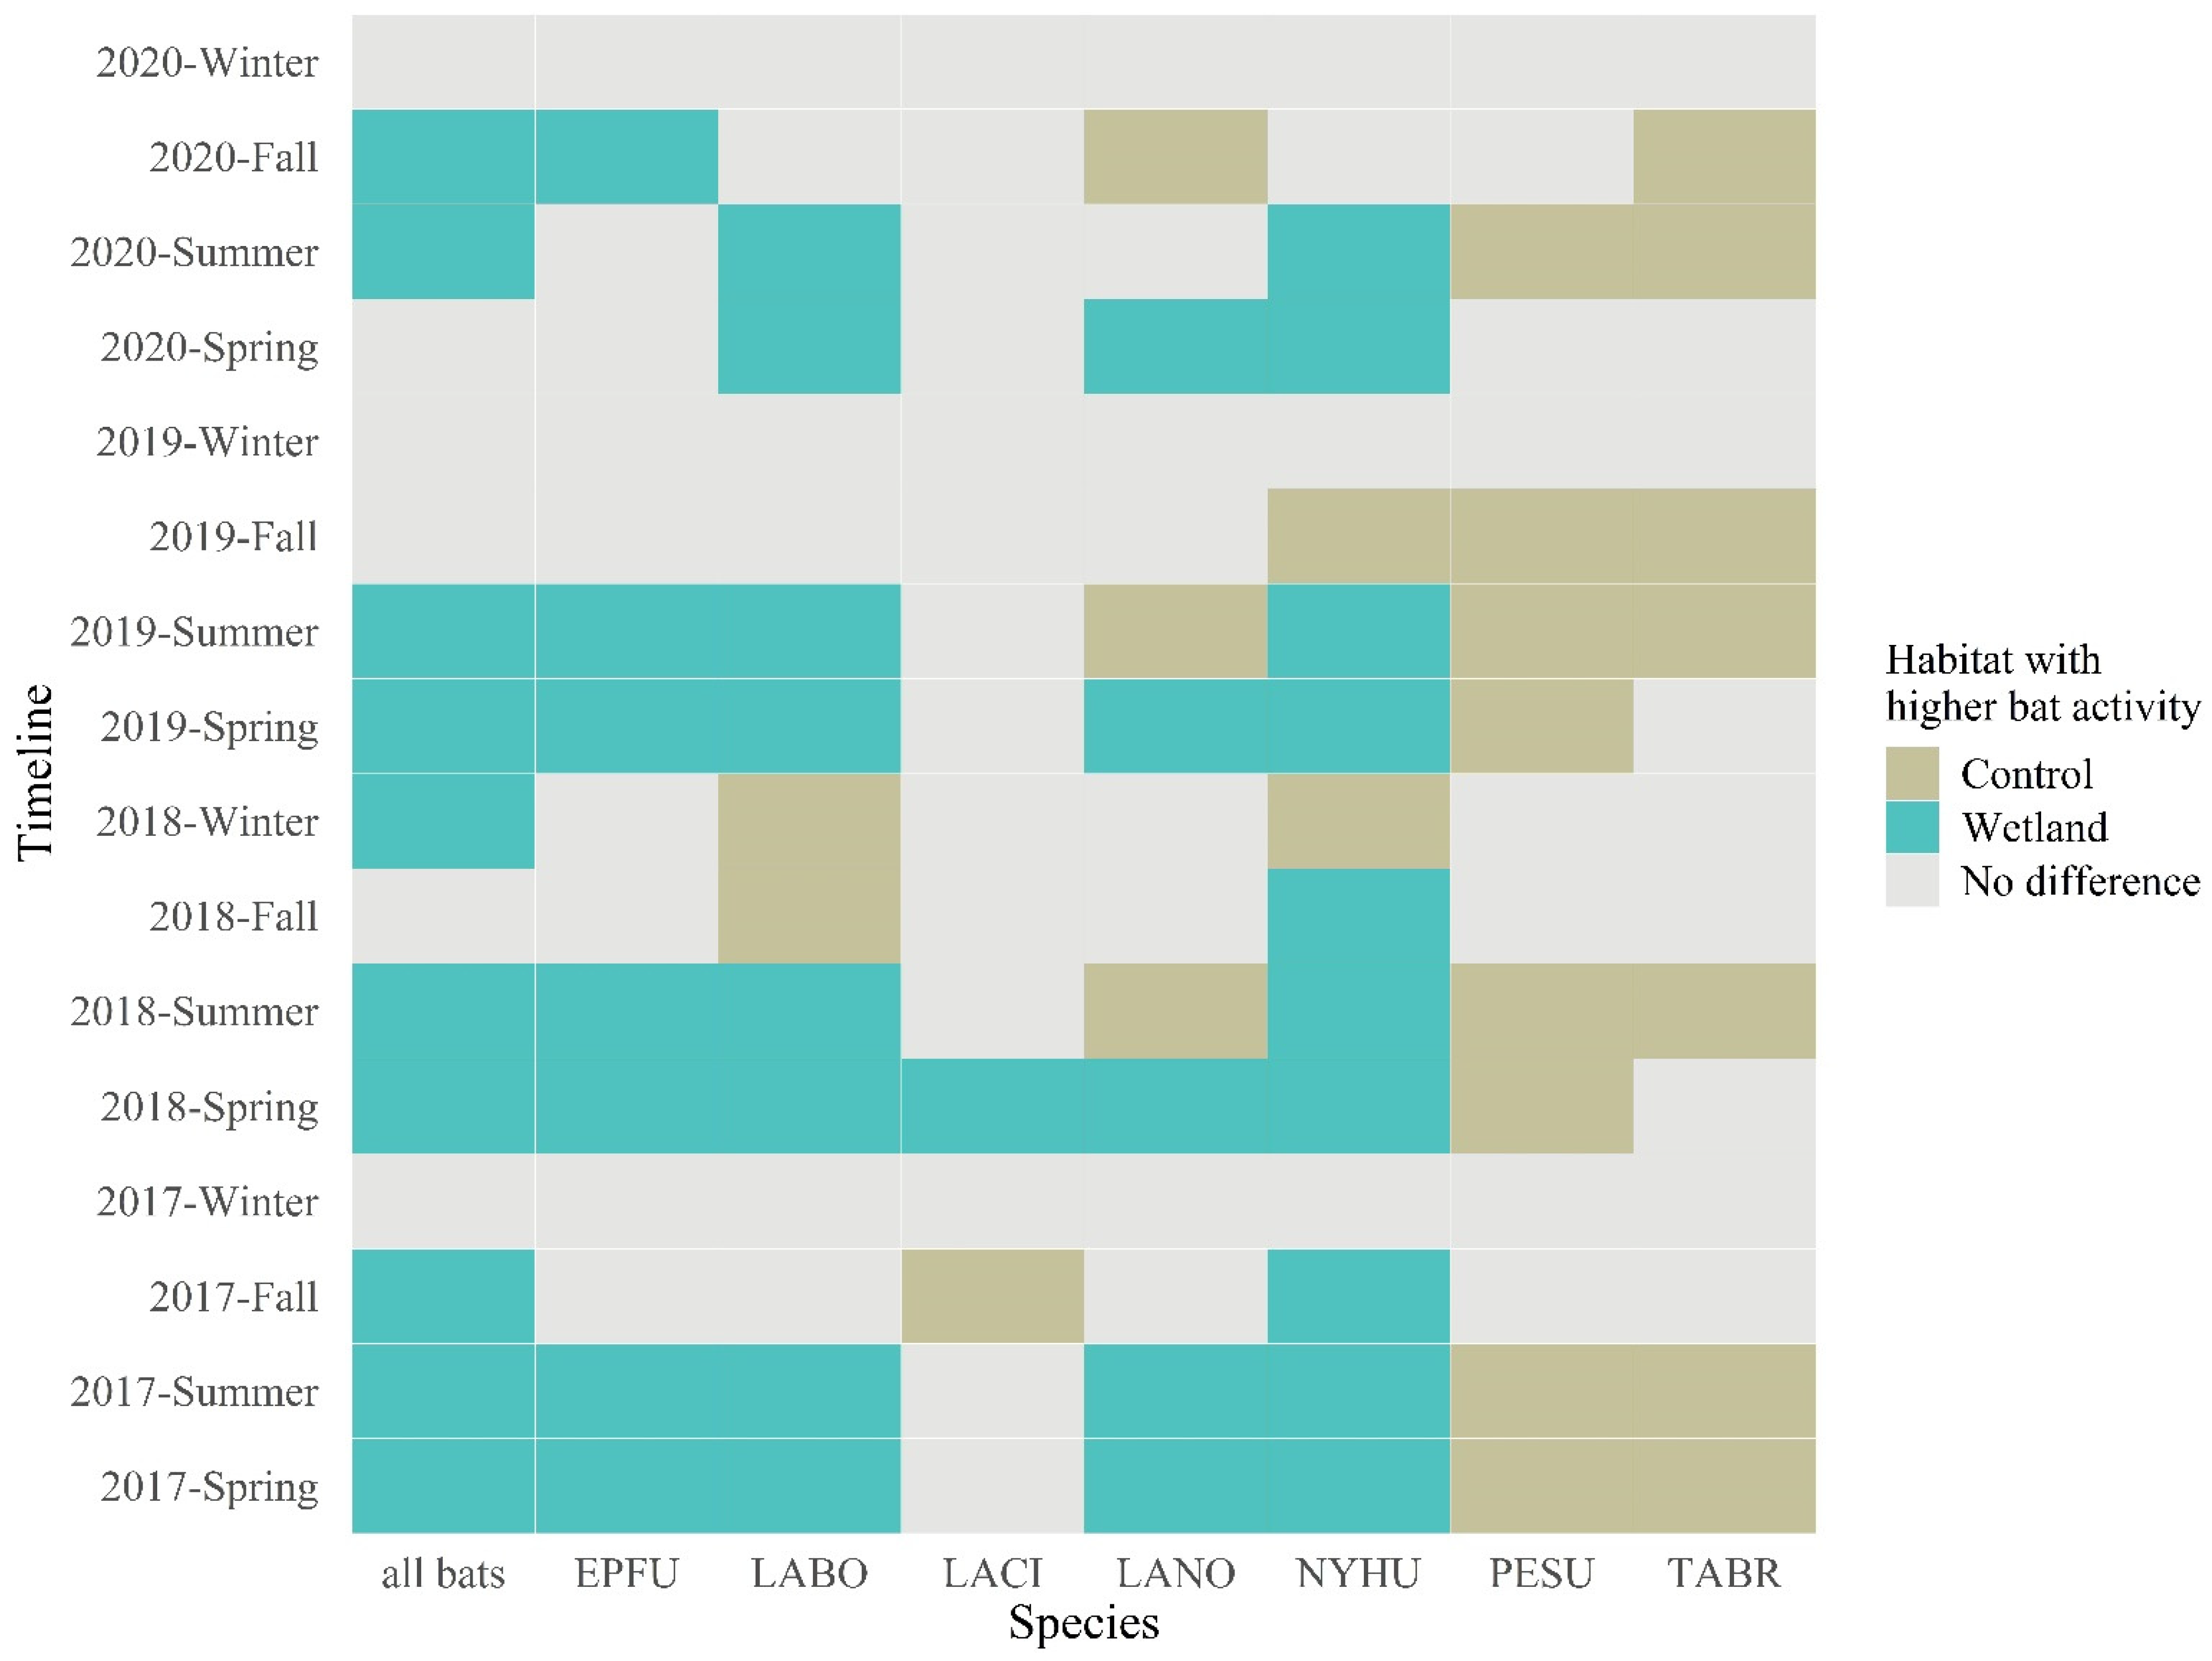
3.1. Wetland vs. Control Bat Activity Comparison by Wilcoxon Tests

For the wetland versus control comparison on bat activity, we found varying results by wetland type, season, and species. For total bat activity at the open sites, there was no difference between the wetland and the control sites in the first five seasons after construction (Figure 1). In the subsequent eleven seasons, there were six with statistical differences, three with higher total bat activity at the wetland and three at the control, without a consistent pattern (Figure 1, Supplementary Material Table S2). In contrast, at the woody sites, total bat activity was significantly higher at the wetland for ten seasons, including every summer and most springs (Figure 2, Supplementary Material Table S2). At both wetlands, the effect of constructed wetlands on total bat activity did not change through time. Similar to total bat activity, the effect of constructed wetlands on the eastern red bat and the tricolored bat was generally consistent over time at both open and woody wetlands. For the eastern red bat, bat activity was higher at both wetlands than the corresponding control sites for all summers and most springs (Figure 1 and Figure 2, Supplementary Material Table S2). For the tricolored bat, wetland construction generally resulted in lower activity at wetland sites as compared to the control sites across most seasons (Figure 1 and Figure 2, Supplementary Material Table S2).
For some species, the effect of constructed wetlands varied, depending on whether the wetland was in the open grass or the woods. Hoary bat activity was significantly higher at the open wetland than the open control for ten seasons and no difference was found for the remaining six seasons (Figure 1, Supplementary Material Table S2). However, in the woods, there was no difference between the wetland and the control for most of the seasons (Figure 2, Supplementary Material Table S2). The open wetland had significantly higher Mexican free-tailed bat activity than the open control in 12 seasons (Figure 1, Supplementary Material Table S2). However, there were seven seasons when the woody wetland had significantly lower Mexican free-tailed bat activity than the woody control (Figure 2, Supplementary Material Table S2).
We found that the effect of constructed wetlands on bat activity changed over time for the silver-haired bat, the big brown bat, and the evening bat at certain wetlands. Generally, both the open wetland and the woody wetland had higher bat activity compared to control sites during the first year for these species (Figure 1 and Figure 2, Supplementary Material Table S2). However, starting in the spring or summer of 2018, roughly a year to fifteen months after the wetland construction, the activity patterns changed. For the silver-haired bat, the open wetland continued having higher activity than the open control. However, the woody wetland and woody control alternately had higher activity among seasons (Figure 1 and Figure 2, Supplementary Material Table S2). For the big brown bat and the evening bat, the woody wetland continued to have higher activity than the woody control. However, the open wetland started having significantly lower bat activity than the control (Figure 1 and Figure 2, Supplementary Material Table S2).

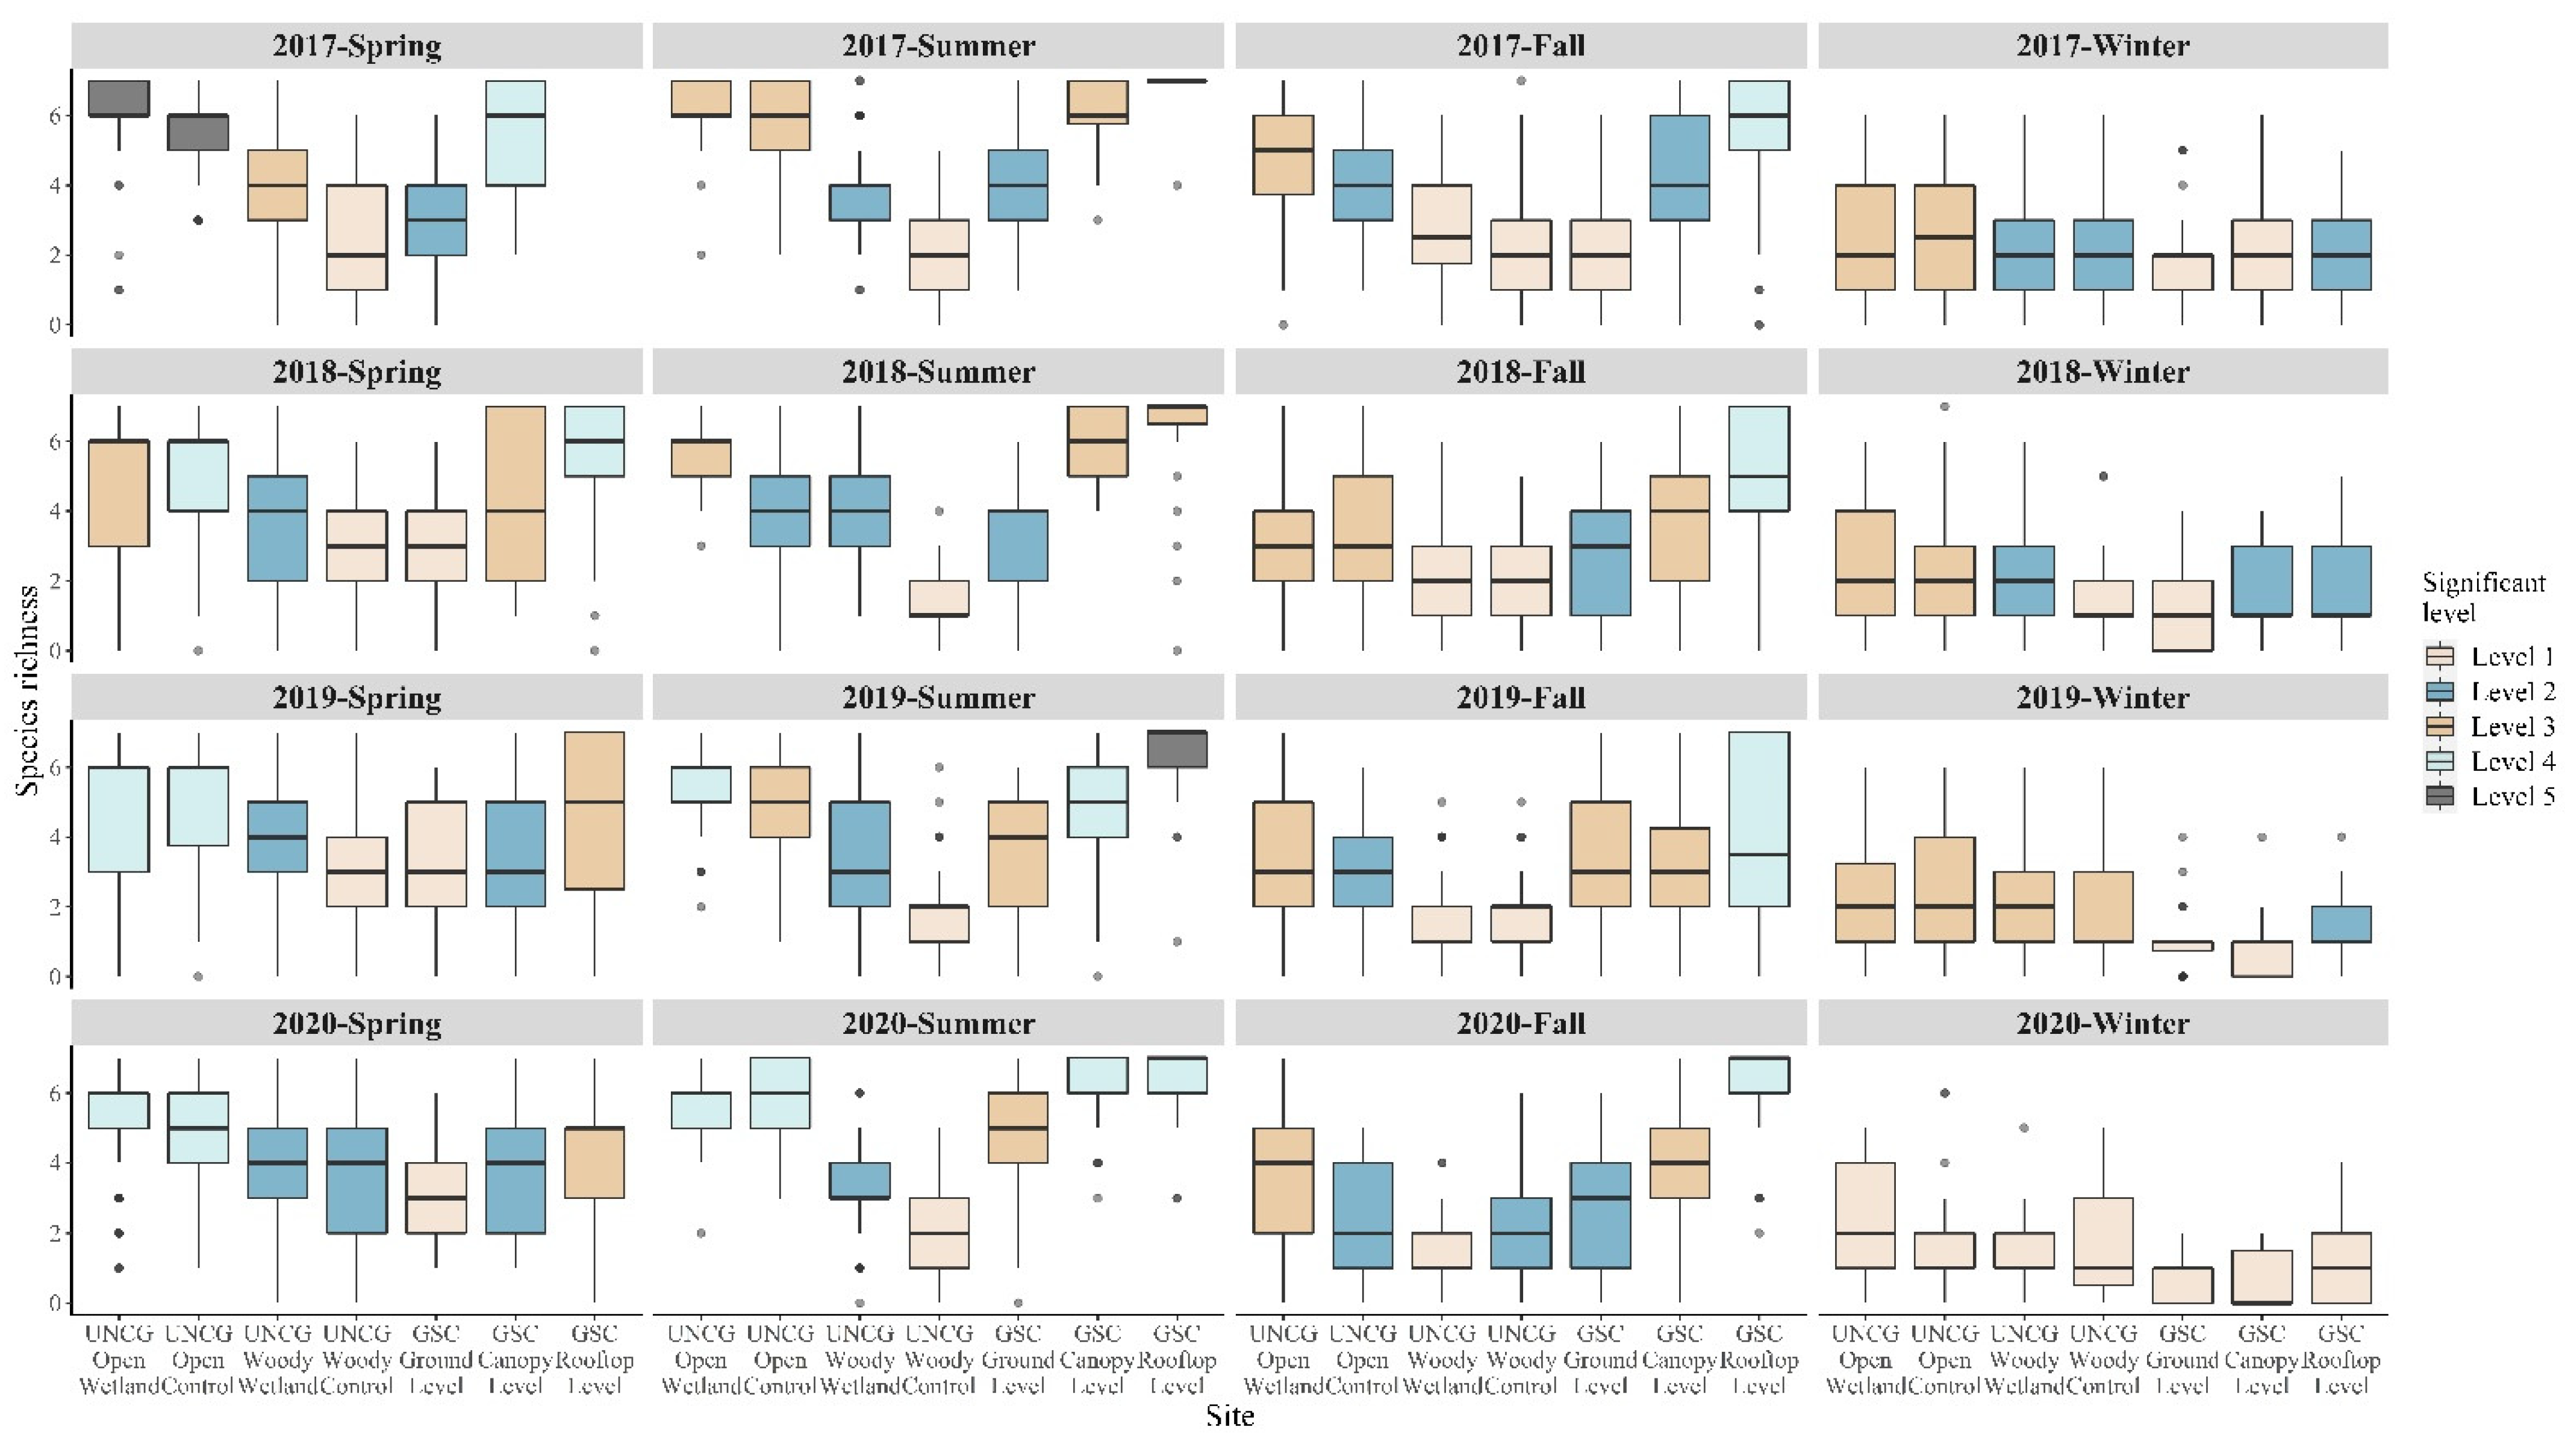
3.2. Species Richness Comparison by Generalized Linear Models

Both season and site affected whether the wetland had higher species richness than the control. In all summers and three springs (except spring 2020), the woody wetland had higher species richness than the woody control (Figure 3, Supplementary Material Table S1). However, for most falls and winters, there was no difference for this pair. In three falls (except fall 2018) and two summers (2018 and 2019), the open wetland had higher species richness than the open control (Figure 3, Supplementary Material Table S1). In two seasons, fall 2020 for the woody pair and spring 2018 for the open pair, the control site had higher species richness than the wetland. Generally, species richness was higher at the open pair than the woody pair. When comparing sites on the UNCG campus with three sites at GSC, the open wetland generally had the same level of species richness as the GSC rooftop site, both having the highest species count within a season. Species richness at the woody wetland was more often lower than the GSC canopy level or ground level. In eleven seasons, the woody control site had the lowest species richness (Figure 3).

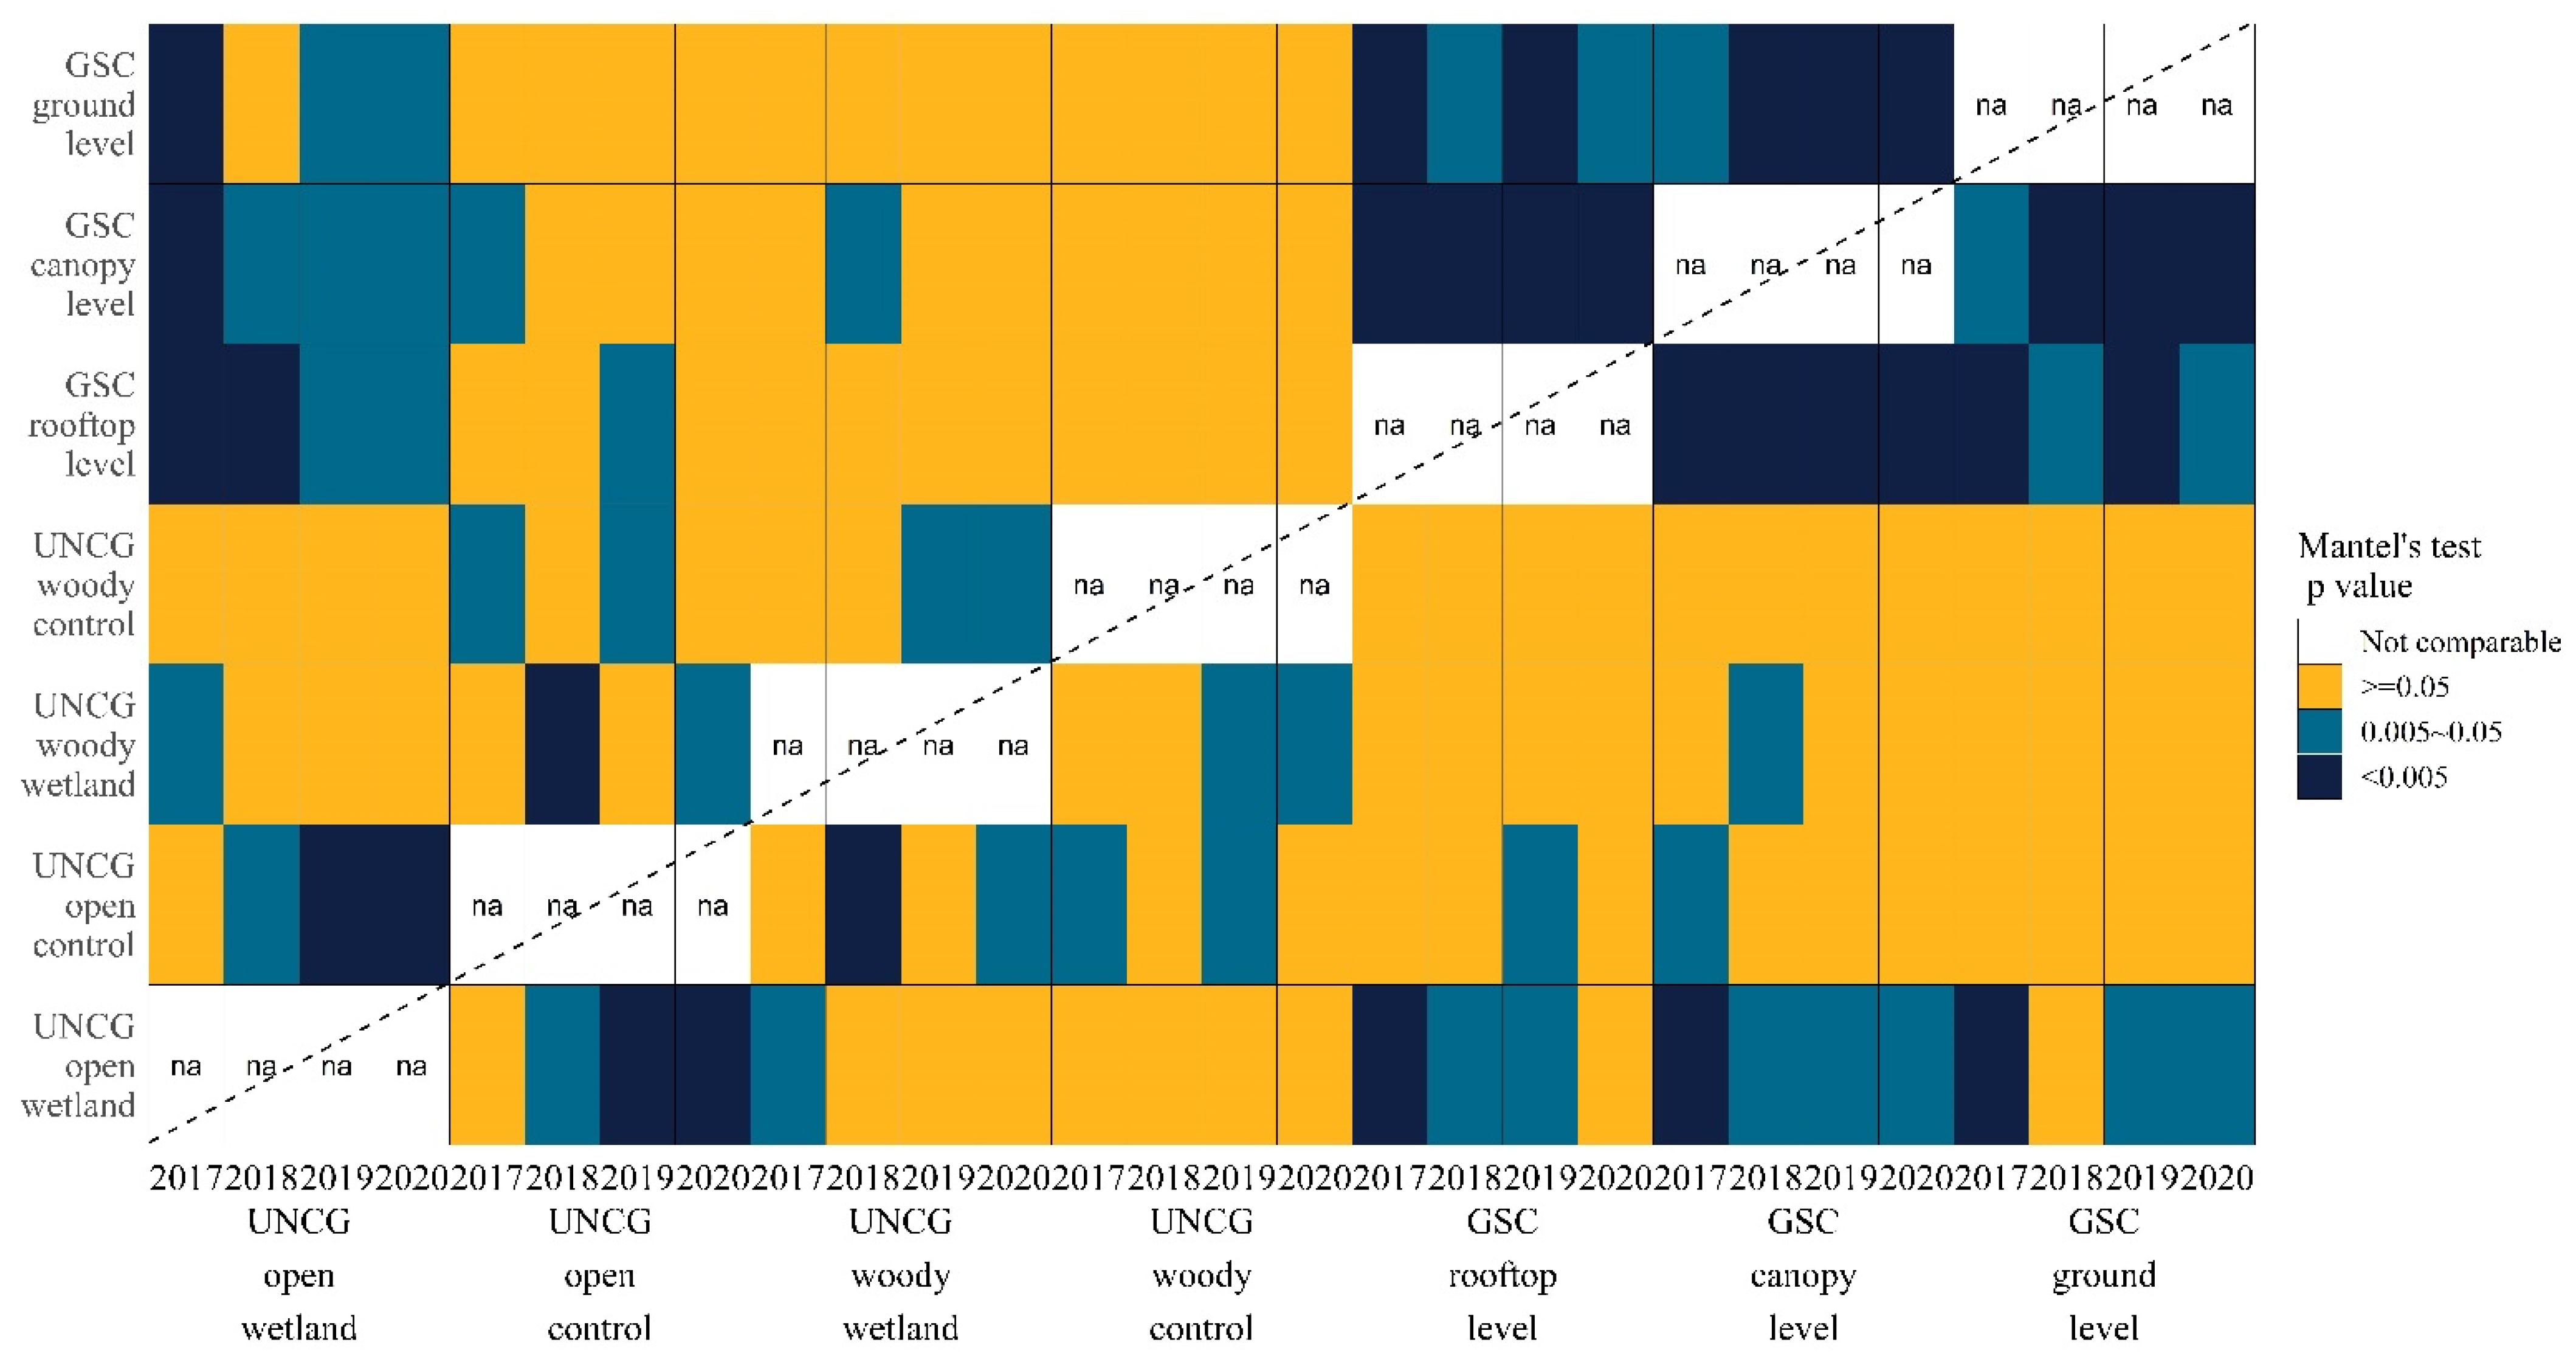
3.3. Community Composition Comparison by Mantel’s Tests

Both wetlands had different community compositions from control sites in 2017 immediately after the wetland construction (both p > 0.05, Figure 4, Supplementary Material Table S3). However, over time, the community composition difference between a wetland and its control site disappeared (Figure 4). Between the open wetland and the open control, only the first year was different. The woody wetland and the woody control were different in 2017 and 2018 but showed no difference in 2019 and 2020. In 2017, after the construction, the community composition matrices were correlated between the two wetlands (p < 0.05, Supplementary Material Table S3), suggesting similar compositions. Interestingly, when comparing the open wetland with three GSC sites, there were strong community matrices correlations (all p < 0.005, Figure 4), indicating the open wetland had a community composition similar to sites in a large urban park. As the open wetland aged, the composition matrices were still correlated. In contrast, the woody wetland community composition was never similar to sites at GSC except for 2018, when the woody wetland had a composition similar to the GSC canopy level. At the woody control site, the community composition was always different from any site at GSC. All three sites at GSC did not show any compositional difference among them (Figure 4).

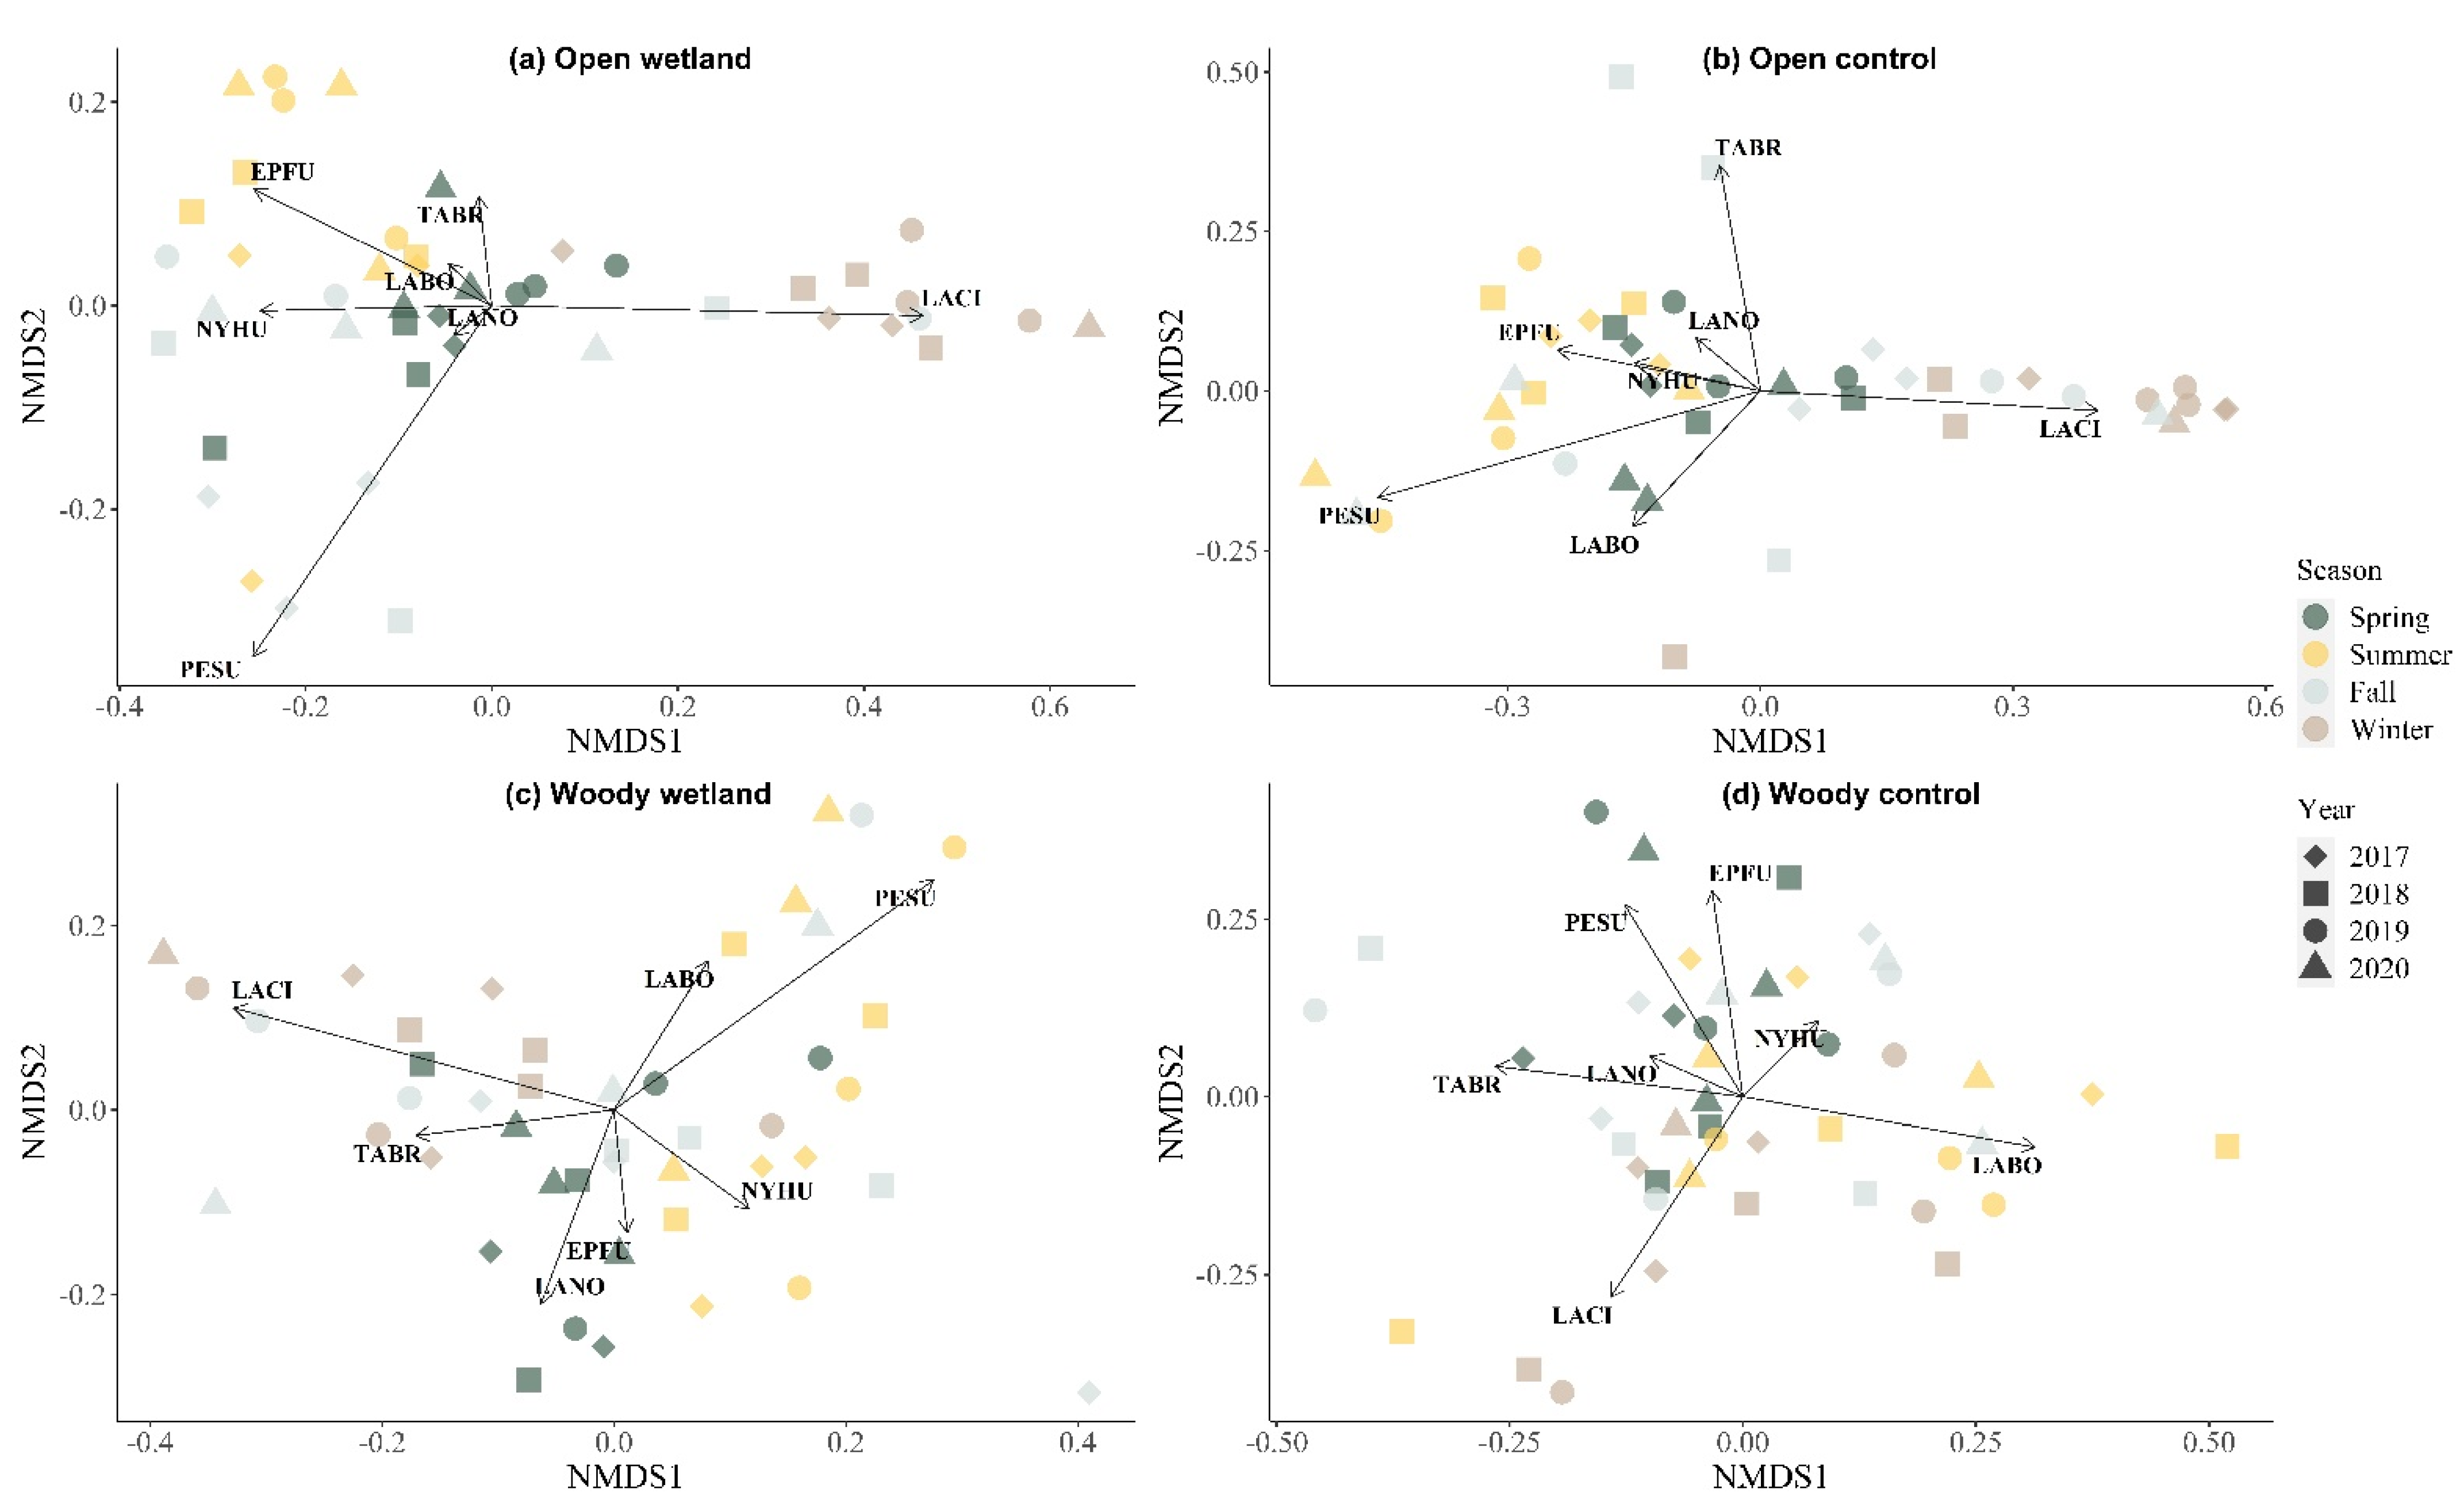
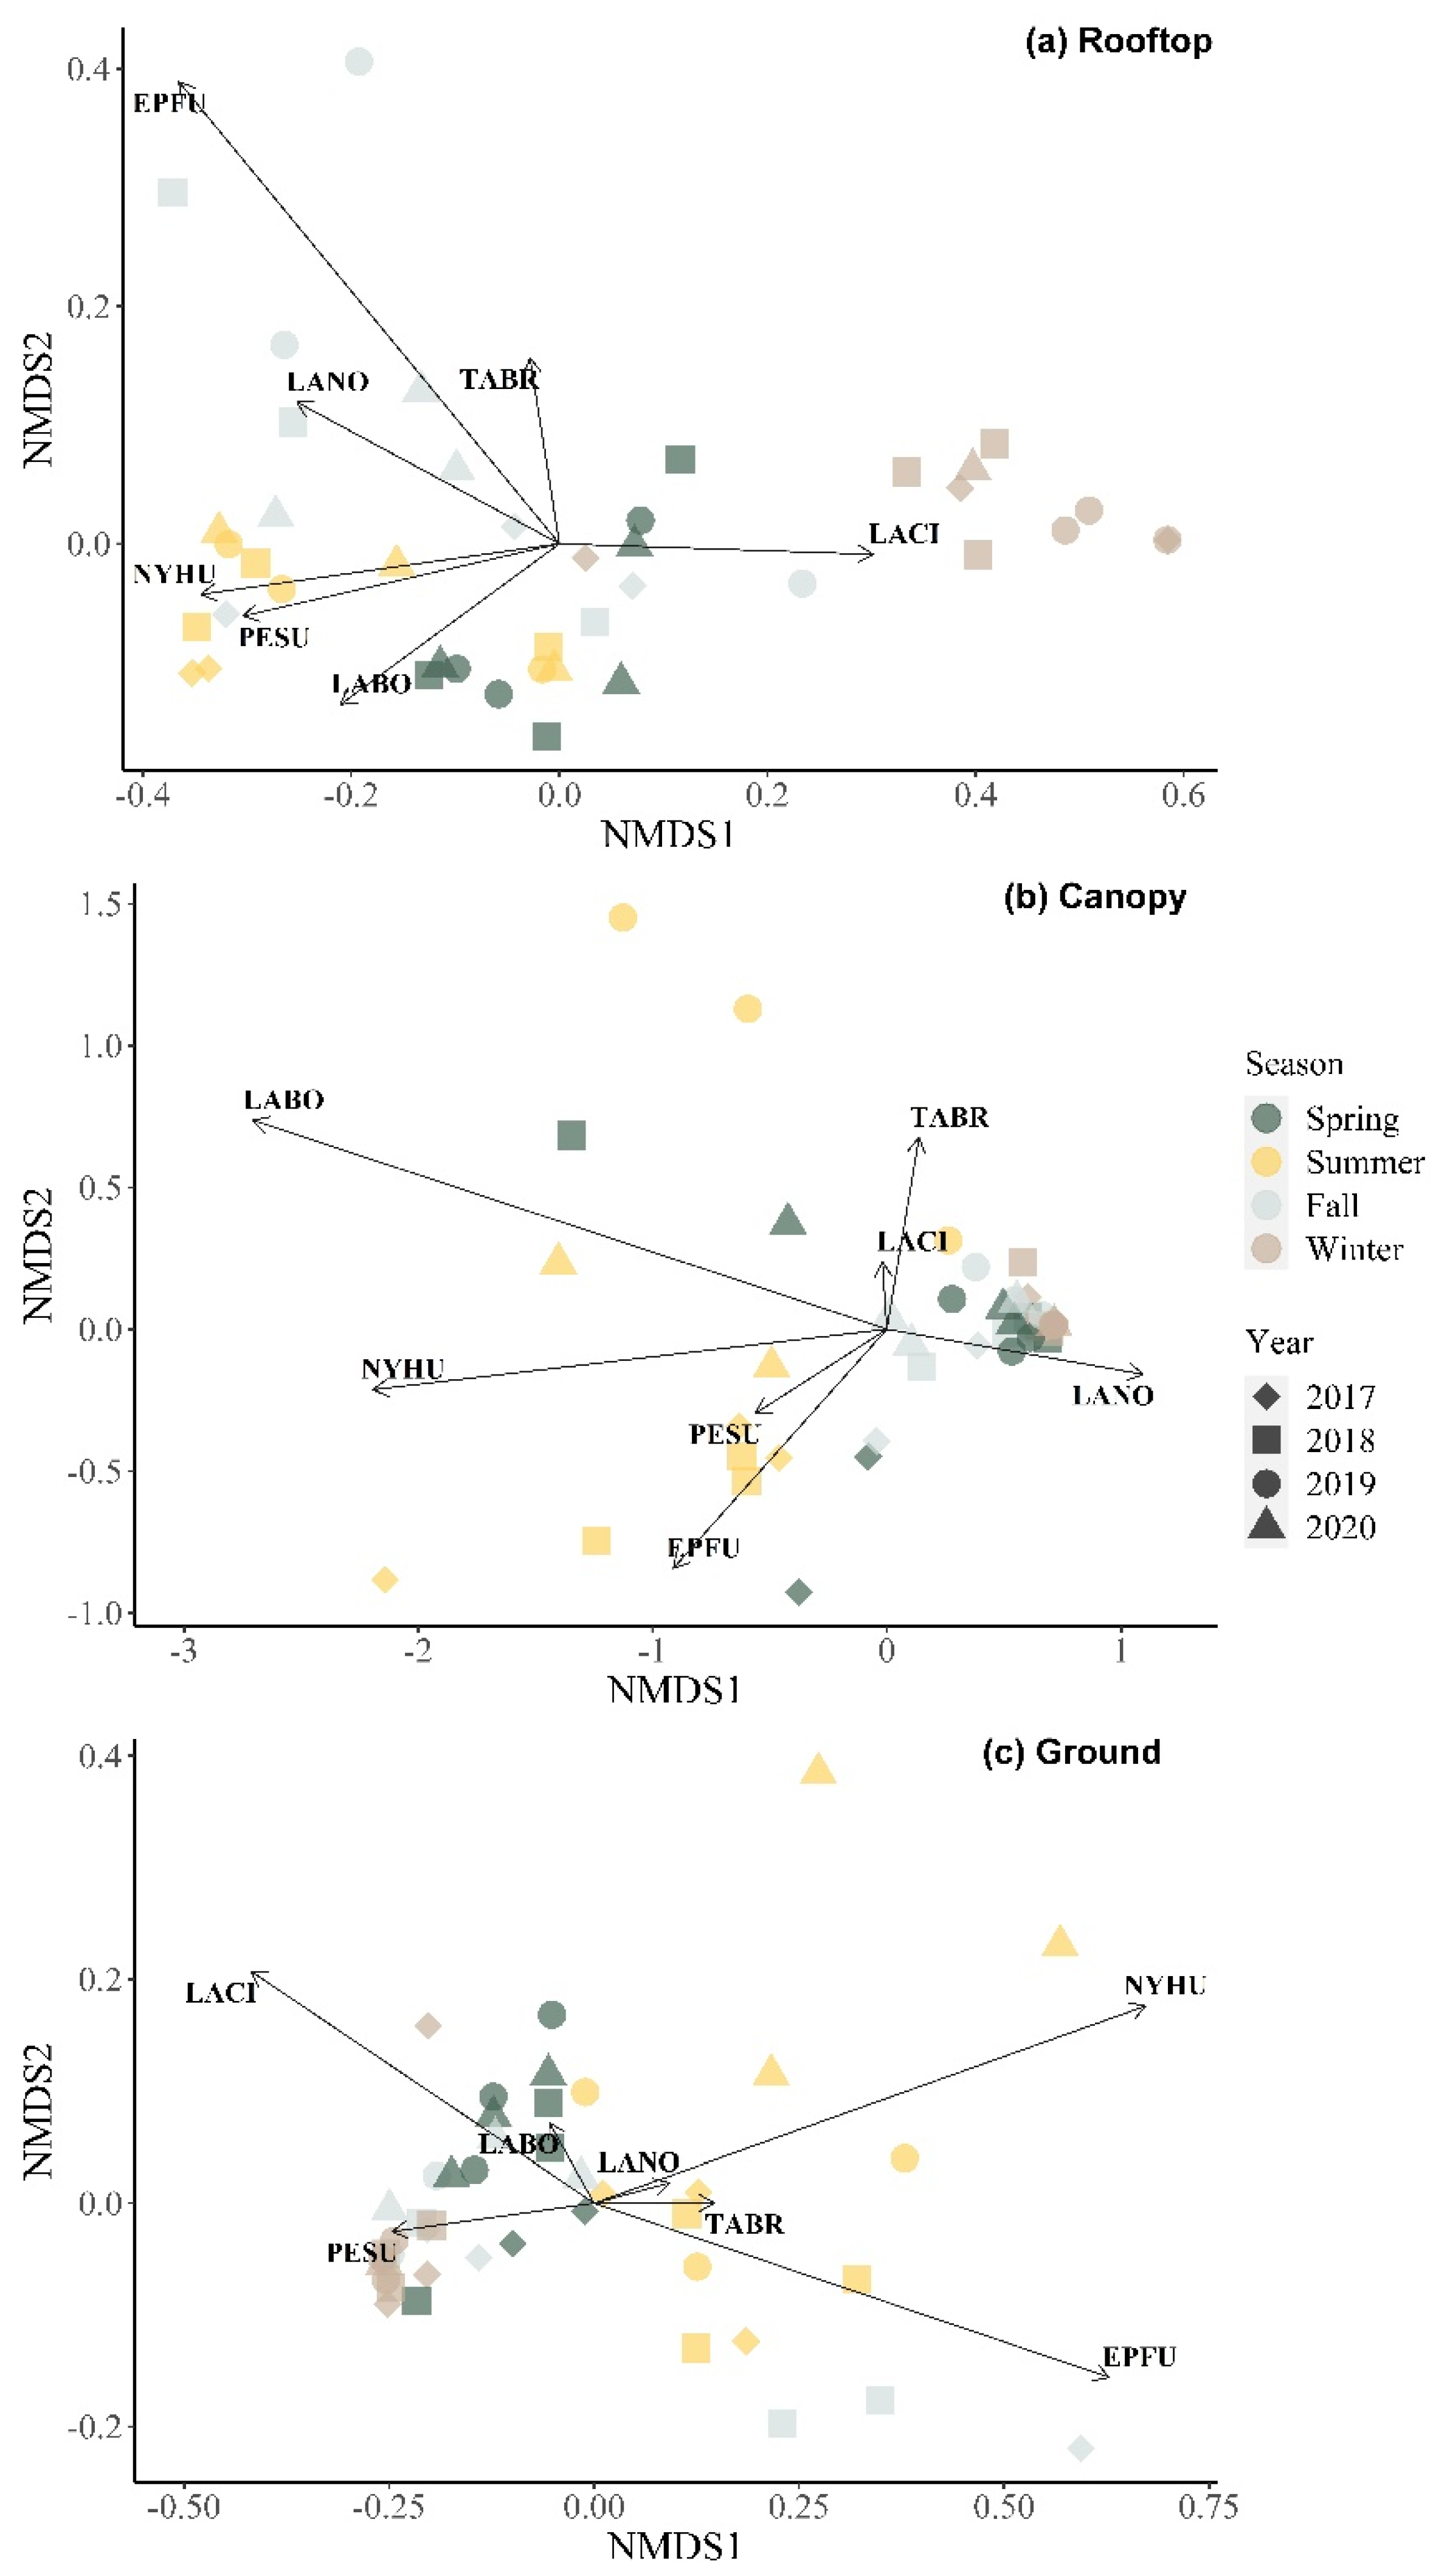
3.4. Community Composition Changes over Time by NMDS

Among the four sites on the UNCG campus, the open wetland showed the most obvious seasonal community composition variation (Figure 5a). In the winter, the community at the open wetland mostly associated with the hoary bat. Spring seemed to be the transition season with most species present. In the summer of 2017, the bat community at the open wetland had associations with the tricolored bat or the evening bat and the big brown bat. Later in 2019 or 2020, the dominant species in the summer shifted to the big brown bat, suggesting a changing summer community since the construction of the wetland. In the fall, the community associated with either the evening bat or the tricolored bat.
The community composition pattern at the open control sites was similar to the open wetland, with the hoary bat being the dominant species for the winter and the big brown bat for the summer (Figure 5b). However, there were a few summer and fall months in 2019 and 2020 when the tricolored bat became more prevalent at this site. In the fall, the community composition varied and did not form a clear grouping pattern. At the woody wetland, the winter and summer community compositions separated distinctively. However, neither spring nor fall had a clear pattern associating the site with certain species (Figure 5c). At the woody control site, the separation among seasons was weaker than the other three sites, suggesting no particular species used this site more often than others at any time of the year (Figure 5d). No clear separation by year was found at both woody wetland and woody control.
Among three sites at GSC, the rooftop level site had the clearest seasonal separation. Similar to the open wetland at UNCG, in the winter the community was dominated by the hoary bat (Figure 6a). However, different from the open wetland, the association with the evening or tricolored bat at this site was found in the summer instead of the fall. The big brown bat was the dominant species at the rooftop level site in the fall. Both the canopy and ground-level sites only had the summer separated from other seasons (Figure 6b,c). The ground level site at GSC was dominated by the big brown bat in the summer, except for the summer of 2020 when the evening bat was the most common species in the community (Figure 6c). In fact, at all three sites, the evening bat was prevalent in the summer of 2020, making the community different from other summer seasons.

4. Discussion

Four years of continuous monitoring at two constructed wetlands revealed different outcomes. How bats responded to constructed wetlands could change over time. We found that total bat activity was higher at the woody wetland than the control, whereas generally, total bat activity was not different for the wetland and its control in the open grass. Constructed wetlands in forests have not been as well studied as wetlands in the open. However, it is known that water sources within forests provide important drinking and foraging habitats for bats [24,75]. For the wetland in the open grass, our results are consistent with a previous study in the Southeastern US, which found no difference between wetlands and controls after the wetland restoration at a much broader scale [36]. However, two studies in South Africa and Germany showed that constructed wetlands in open areas had higher total bat activity than other land covers [21,22], suggesting there could be species-specific responses to constructed wetlands.
Among the seven species we studied, we found that only four species showed a consistent response between open and woody wetlands over time. Eastern red bat activity was higher at wetlands compared to controls, consistent with the short-term one-year response that we found at these sites [34]. We also found that tricolored bat activity was consistently lower at wetlands compared to controls, suggesting constructed wetlands might repel this species. Previous studies have demonstrated that the tricolored bat prefers relatively low-quality eutrophicated water at both local and regional scales, likely due to emerging aquatic insects associated with eutrophicated water [18,76]. Wetlands have the ability to filter water and improve water quality [3,5], and water quality at these wetlands may not have been suitable for tricolored bats to forage preferred insect preys. Interestingly, in a broad scale analysis in the same region, the tricolored bat was found positively correlated to woody wetlands [77], suggesting there should be more studies on how the tricolored bat responds to both vegetation and water. For the hoary bat and the Mexican free-tailed bat, only the open wetland showed an effect. This is likely because these species usually fly over the canopy in open space and are less suitable for maneuvering through forests [60,78,79]. This finding suggests that the location of small constructed urban wetlands is important for attracting bats.
For three species, we found that constructed wetlands had higher bat activity than controls immediately after construction but the difference disappeared over time. In the short term, within a year, the big brown bat, the silver-haired bat, and the evening bat all showed increases with construction wetlands [34]. However, starting in the second or third year, some wetlands had lower bat activity than controls for these species. This is a result that can only be found in multiple-year studies and has not been reported previously. Why would there be a discrepancy between short and long term? Our wetlands changed over time as planted aquatic vegetation became mature and might have altered the water surface area available for drinking. It is likely that water quality also changed, which could alter insect prey availability for bats at the wetlands. Studies of the relationship between aquatic vegetation structure and bat activity deserve future attention. We also propose future studies to examine constructed wetlands with different vegetation management schemes. Notwithstanding, it is still puzzling why only certain species of bats changed their preference. It is likely that different species of bats benefit from wetlands in unique and different ways and we need to better understand what aspects of wetlands each species is responding to and, more broadly, how each bat species uses wetlands. How natural wetlands support wildlife is not completely understood [37,38,39] and our results at constructed wetlands underscore this.
Recognizing that each bat species has specific needs and responses to wetlands, it is also important to consider the bat community and how interspecific interactions might affect the effects of constructed wetlands on bats. Our analysis on species richness showed that wetlands generally have more species than the control for most seasons, which was consistent with previous studies [22,34]. In a behavioral study conducted at these wetlands, we found increased territory defense calls when multiple species were present [61]. It is likely that constructed wetlands attracted more species and increased interspecific interactions. Consequently, increased interspecific interactions might shape bat communities over time [80,81].
Our community-level analyses also showed seasonal variations. The big brown bat was associated with most seasons except for the winter, when the hoary bat was the dominant species. All seven species have been documented to be residents in the Piedmont of North Carolina for the winter [34,72]. However, we found that the big brown bat and the silver-haired bat were the most active species in the winter in non-urban settings instead of the hoary bat [72]. We suspect that there might be local scale seasonal migrations, similar to a study on big brown bats in Colorado where urban big brown bats left the city during the winter season [82]. Community differences among seasons were always stronger at the wetlands than at the control sites, suggesting that wetlands might increase interspecific interactions and certain species used the wetlands more often than others. Over time, we observed the open wetland bat community losing evening bats and becoming more big brown bat-dominant. The construction of a wetland could be considered as a change in the environment. A previous study showed that the big brown bat was more adaptive to anthropogenic changes than evening bats [83], which might explain why evening bats stopped using the wetland site once the wetland was constructed.
Combining results that the open wetland became more big brown bat-dominant, and that big brown bat activity was higher at the control than the wetland, we suggest that the wetland attracted big brown bats to Peabody Park on the UNCG campus. This is supported by yearly comparisons of community composition between sites where we found that the composition was different between the wetland and their matching controls in the first year after wetland construction but not thereafter. We speculate that wetland construction initially attracted more bats to Peabody Park. Over time, these bats could have explored the entire park and found more preferable habitats within it. Peabody Park is a small urban park near the city center. Studies have shown that the size of urban green spaces and their relative location in the city could affect bat activity and community composition [58,59,60], likely because of vegetation, water, noise level, and other environmental characteristics [62,84,85]. Generally, larger parks tend to have higher bat activity and higher diversity. Interestingly, our community-level analyses found that the wetland in the open grass had a bat community composition similar to sites in GSC, a large urban park. This result further demonstrates the potential benefits of small constructed wetlands in urban areas.

5. Conclusions

Our analysis of four years of continuous bat monitoring data in constructed wetlands found that how bats responded to constructed wetlands was both habitat- and species-specific. A constructed wetland’s ability to attract bats depended on the wetland’s location. Constructed wetlands in forests could significantly increase bat activity, while constructed wetlands in the open grass played a bigger role in altering bat community composition. Interspecific interactions were likely increased by the constructed wetlands. Therefore, it is important to study how each species uses wetlands specifically regarding drinking and foraging activities in the future. We suggest that the location of a constructed wetland must be carefully planned based on what bat species the constructed wetland is intended to conserve to ensure its goal of conserving bats. Overall, constructed wetlands in a small urban park in our study were beneficial for bat diversity and community composition on a scale that is typically seen only in large urban parks. However, as time passes, constructed wetlands may no longer attract more bats due to other environmental changes. Therefore, we emphasize the importance of long-term monitoring and the periodical evaluation of wildlife conservation actions which may have unanticipated effects over time.

Supplementary Materials

The following are available online at https://www.mdpi.com/article/10.3390/land10101087/s1, Table S1: Generalized linear model for species richness analysis results (including weather covariates results for each model) and post hoc paired Tukey comparison results for bat species richness difference among sites within each season, Table S2: bat passes recorded and bat passes identified to species by site and by season, median total bat activity and species-specific bat activity and Wilcoxon test p value for paired wetland versus control sites, Table S3: Mantel’s test p values comparing bat communities among sites year by year.

Author Contributions

Conceptualization, H.L., R.P., Z.A., J.K., R.H.M., R.M., N.P., A.R.F., H.S., K.M., M.C.K.-R., M.D.S. and L.A.Z.; methodology, H.L., R.P., Z.A., J.K., R.H.M., R.M., N.P., A.R.F., H.S., K.M., M.C.K.-R., M.D.S. and L.A.Z.; software, H.L., R.P. and L.A.Z.; validation, H.L., R.P. and L.A.Z.; formal analysis, H.L.; investigation, R.P., K.M. and L.A.Z.; resources, M.D.S. and L.A.Z.; data curation, H.L., R.P., K.M. and L.A.Z.; writing—original draft preparation, H.L., R.P., Z.A., J.K., R.H.M., R.M., N.P., A.R.F., H.S. and L.A.Z.; writing—review and editing, H.L., R.P., Z.A., J.K., R.H.M., R.M., N.P., A.R.F., H.S., K.M., M.C.K.-R., M.D.S. and L.A.Z.; visualization, H.L.; supervision, H.L., R.P., M.D.S. and L.A.Z.; project administration, H.L., M.D.S. and L.A.Z.; funding acquisition, M.C.K.-R., M.D.S. and L.A.Z. All authors have read and agreed to the published version of the manuscript.

Funding

The bat monitoring on the University of North Carolina Greensboro campus was funded by grants from the Duke Energy Water Resources Fund, the University of North Carolina Greensboro Green Fund and the University of North Carolina Greensboro Provost Office. The bat monitoring at Greensboro Science Center was partially funded by the North Carolina Science Museums Grant Program. The funding bodies were not involved in the design of the research question, field data collection, analysis and interpretation of data, or writing the manuscript.

Institutional Review Board Statement

Not applicable.

Informed Consent Statement

Not applicable.

Data Availability Statement

The data presented in this study are openly available in FigShare at https://doi.org/10.6084/m9.figshare.16574999.v1 (accessed on 9 June 2021).

Acknowledgments

The bat monitoring at the University of North Carolina Greensboro campus was supported by the following: The City of Greensboro, UNCG Department of Chemistry, UNCG Department of Geography, Environment, and Sustainability, Peabody Park Preservation Committee, UNCG Office of Sustainability, UNCG Undergraduate Research, Scholarship, and Creativity Office, UNCG Facilities Design and Construction, UNCG Facilities Grounds and Garage, and the community of volunteers. The bat monitoring at the Greensboro Science Center was supported by its staff, interns, and patrons. This paper was written as part of a special scientific reading and writing course supported by the UNCG Department of Biology motivated by participation in the Council of Undergraduate Research (CUR) Transformation Project, for which we thank gratefully. Comments by journal editors and four anonymous reviewers greatly improved earlier versions of this manuscript.

Conflicts of Interest

The authors declare no conflict of interest.

References

  1. Brinson, M.M. A Hydrogeomorphic Clasification for Wetlands; U.S. Environmental Laboratory: Vicksburg, MS, USA; Engineer Research and Development Center: Vicksburg, MS, USA, 1993. Available online: https://hdl.handle.net/11681/6483 (accessed on 10 September 2021).
  2. Davidson, N.C. How much wetland has the world lost? Long-term and recent trends in global wetland area. Mar. Freshw. Res. 2014, 65, 934–941. [Google Scholar] [CrossRef]
  3. Gardner, R.C.; Finlayson, C. Global Wetland Outlook: State of the World’s Wetlands and Their Services to People; Social Science Research Network: Rochester, NY, USA, 2018; Available online: https://ssrn.com/abstract=3261606 (accessed on 10 September 2021).
  4. Finlayson, C.M.; Davidson, N.C.; Spiers, A.G.; Stevenson, N.J. Global wetland inventory—Current status and future priorities. Mar. Freshw. Res. 1999, 50, 717–727. [Google Scholar] [CrossRef]
  5. Verhoeven, J.T.A.; Setter, T.L. Agricultural use of wetlands: Opportunities and limitations. Ann. Bot. 2010, 105, 155–163. [Google Scholar] [CrossRef] [PubMed] [Green Version]
  6. Ingraham, M.W.; Foster, S.G. The value of ecosystem services provided by the U.S. National Wildlife Refuge System in the contiguous U.S. Ecol. Econ. 2008, 67, 608–618. [Google Scholar] [CrossRef]
  7. Woodward, R.T.; Wui, Y.-S. The economic value of wetland services: A meta-analysis. Ecol. Econ. 2001, 37, 257–270. [Google Scholar] [CrossRef]
  8. Mitsch, W.J.; Gosselink, J.G. The value of wetlands: Importance of scale and landscape setting. Ecol. Econ. 2000, 35, 25–33. [Google Scholar] [CrossRef]
  9. Russi, D.; Brink ten, P.; Farmer, A.; Badura, T.; Coates, D.; Forster, J.; Kumar, R.; Davidson, N. The Economics of Ecosystems and Biodiversity for Water and Wetlands. 2013. Available online: http://www.teebweb.org/wp-content/uploads/2013/04/TEEB_WaterWetlands_Report_2013.pdf (accessed on 10 September 2021).
  10. Zhang, C.; Wen, L.; Wang, Y.; Liu, C.; Zhou, Y.; Lei, G. Can Constructed Wetlands be Wildlife Refuges? A Review of Their Potential Biodiversity Conservation Value. Sustainability 2020, 12, 1442. [Google Scholar] [CrossRef] [Green Version]
  11. Kunz, T.H.; De Torrez, E.B.; Bauer, D.; Lobova, T.; Fleming, T.H. Ecosystem services provided by bats. Ann. N. Y. Acad. Sci. 2011, 1223, 1–38. [Google Scholar] [CrossRef]
  12. Boyles, J.G.; Cryan, P.M.; McCracken, G.F.; Kunz, T.H. Economic Importance of Bats in Agriculture. Science 2011, 332, 41–42. [Google Scholar] [CrossRef]
  13. Rodríguez-San Pedro, A.; Allendes, J.L.; Beltrán, C.A.; Chaperon, P.N.; Saldarriaga-Córdoba, M.M.; Silva, A.X.; Grez, A.A. Quantifying ecological and economic value of pest control services provided by bats in a vineyard landscape of central Chile. Agric. Ecosyst. Environ. 2020, 302, 107063. [Google Scholar] [CrossRef]
  14. de Jesús Crespo, R.; Méndez Lázaro, P.; Yee, S.H. Linking Wetland Ecosystem Services to Vector-borne Disease: Dengue Fever in the San Juan Bay Estuary, Puerto Rico. Wetlands 2019, 39, 1281–1293. [Google Scholar] [CrossRef]
  15. Tremlett, C.J.; Moore, M.; Chapman, M.A.; Zamora-Gutierrez, V.; Peh, K.S.-H. Pollination by bats enhances both quality and yield of a major cash crop in Mexico. J. Appl. Ecol. 2020, 57, 450–459. [Google Scholar] [CrossRef] [Green Version]
  16. Medellin, R.A.; Wiederholt, R.; Lopez-Hoffman, L. Conservation relevance of bat caves for biodiversity and ecosystem services. Biol. Conserv. 2017, 211, 45–50. [Google Scholar] [CrossRef]
  17. Jones, G.; Jacobs, D.; Kunz, T.; Willig, M.; Racey, P. Carpe noctem: The importance of bats as bioindicators. Endanger. Species Res. 2009, 8, 93–115. [Google Scholar] [CrossRef] [Green Version]
  18. Li, H.; Kalcounis-Rueppell, M. Separating the effects of water quality and urbanization on temperate insectivorous bats at the landscape scale. Ecol. Evol. 2018, 8, 667–678. [Google Scholar] [CrossRef]
  19. Russo, D.; Salinas-Ramos, V.B.; Cistrone, L.; Smeraldo, S.; Bosso, L.; Ancillotto, L. Do We Need to Use Bats as Bioindicators? Biology 2021, 10, 693. [Google Scholar] [CrossRef] [PubMed]
  20. Mickleburgh, S.P.; Hutson, A.M.; Racey, P.A. A review of the global conservation status of bats. Oryx 2002, 36, 18–34. [Google Scholar] [CrossRef] [Green Version]
  21. Stahlschmidt, P.; Pätzold, A.; Ressl, L.; Schulz, R.; Brühl, C.A. Constructed wetlands support bats in agricultural landscapes. Basic Appl. Ecol. 2012, 13, 196–203. [Google Scholar] [CrossRef]
  22. Sirami, C.; Jacobs, D.S.; Cumming, G.S. Artificial wetlands and surrounding habitats provide important foraging habitat for bats in agricultural landscapes in the Western Cape, South Africa. Biol. Conserv. 2013, 164, 30–38. [Google Scholar] [CrossRef]
  23. Fukui, D.; Murakami, M.; Nakano, S.; Aoi, T. Effect of emergent aquatic insects on bat foraging in a riparian forest. J. Anim. Ecol. 2006, 75, 1252–1258. [Google Scholar] [CrossRef] [PubMed]
  24. Salvarina, I. Bats and aquatic habitats: A review of habitat use and anthropogenic impacts. Mammal Rev. 2016, 46, 131–143. [Google Scholar] [CrossRef]
  25. Blakey, R.V.; Law, B.S.; Straka, T.M.; Kingsford, R.T.; Milne, D.J. Importance of wetlands to bats on a dry continent: A review and meta-analysis. Hystrix Ital. J. Mammal. 2018, 12, 41–52. [Google Scholar] [CrossRef]
  26. Seibold, S.; Buchner, J.; Bässler, C.; Muller, J. Ponds in acidic mountains are more important for bats in providing drinking water than insect prey. J. Zool. 2013, 290, 302–308. [Google Scholar] [CrossRef]
  27. Lintott, P.R.; Bunnefeld, N.; Park, K.J. Opportunities for improving the foraging potential of urban waterways for bats. Biol. Conserv. 2015, 191, 224–233. [Google Scholar] [CrossRef]
  28. Ober, H.K.; Hayes, J.P. Influence of Vegetation on Bat Use of Riparian Areas at Multiple Spatial Scales. J. Wildl. Manag. 2008, 72, 396–404. [Google Scholar] [CrossRef]
  29. Sofaer, H.R.; Skagen, S.K.; Barsugli, J.J.; Rashford, B.S.; Reese, G.C.; Hoeting, J.A.; Wood, A.W.; Noon, B.R. Projected Wetland Densities under Climate Change: Habitat Loss but Little Geographic Shift in Conservation Strategy. Ecol. Appl. 2016, 26, 1677–1692. [Google Scholar] [CrossRef]
  30. Straka, T.M.; Lentini, P.E.; Lumsden, L.F.; Wintle, B.A.; van der Ree, R. Urban bat communities are affected by wetland size, quality, and pollution levels. Ecol. Evol. 2016, 6, 4761–4774. [Google Scholar] [CrossRef] [Green Version]
  31. Naidoo, S.; Vosloo, D.; Schoeman, M.C. Foraging at Wastewater Treatment Works Increases the Potential for Metal Accumulation in an Urban Adapter, the Banana Bat (Neoromicia nana). Afr. Zool. 2013, 48, 39–55. [Google Scholar] [CrossRef]
  32. Mendes, E.S.; Pereira, M.J.R.; Marques, S.F.; Fonseca, C. A Mosaic of Opportunities? Spatio-Temporal Patterns of Bat Diversity and Activity in a Strongly Humanized Mediterranean Wetland. Eur. J. Wildl. Res. 2014, 60, 651–664. [Google Scholar] [CrossRef]
  33. Lookingbill, T.R.; Elmore, A.J.; Engelhardt, K.A.; Churchill, J.B.; Gates, J.E.; Johnson, J.B. Influence of wetland networks on bat activity in mixed-use landscapes. Biol. Conserv. 2010, 143, 974–983. [Google Scholar] [CrossRef]
  34. Parker, K.A.; Springall, B.T.; Garshong, R.A.; Malachi, A.N.; Dorn, L.E.; Costa-Terryll, A.; Mathis, R.A.; Lewis, A.N.; MacCheyne, C.L.; Davis, T.T.; et al. Rapid Increases in Bat Activity and Diversity after Wetland Construction in an Urban Ecosystem. Wetlands 2019, 39, 717–727. [Google Scholar] [CrossRef]
  35. Giosa, E.; Mammides, C.; Zotos, S. The importance of artificial wetlands for birds: A case study from Cyprus. PLoS ONE 2018, 13, e0197286. [Google Scholar] [CrossRef] [PubMed]
  36. Menzel, J.M.; Menzel, M.A.; Kilgo, J.C.; Ford, W.M.; Edwards, J.W. Bat response to Carolina bays and wetland restoration in the southeastern U.S. Coastal Plain. Wetlands 2005, 25, 542–550. [Google Scholar] [CrossRef]
  37. Whigham, D.F. Ecological issues related to wetland preservation, restoration, creation and assessment. Sci. Total Environ. 1999, 240, 31–40. [Google Scholar] [CrossRef]
  38. Gopal, B. Natural and Constructed Wetlands for Wastewater Treatment: Potentials and Problems. Water Sci. Technol. 1999, 40, 27–35. [Google Scholar] [CrossRef]
  39. Wiegleb, G.; Dahms, H.-U.; Byeon, W.; Choi, G. To What Extent Can Constructed Wetlands Enhance Biodiversity? Int. J. Environ. Sci. Technol. 2017, 8, 561–569. [Google Scholar] [CrossRef] [Green Version]
  40. Sievers, M.; Parris, K.M.; Swearer, S.E.; Hale, R. Stormwater wetlands can function as ecological traps for urban frogs. Ecol. Appl. 2018, 28, 1106–1115. [Google Scholar] [CrossRef] [PubMed] [Green Version]
  41. Haberl, R.; Perfler, R.; Mayer, H. Constructed Wetlands in Europe. Water Water Sci. Technol. 1995, 32, 305–315. [Google Scholar] [CrossRef]
  42. Sievers, M.; Hale, R.; Parris, K.M.; Swearer, S.E. Impacts of Human-Induced Environmental Change in Wetlands on Aquatic Animals. Biol. Rev. Camb. Philos. Soc. 2018, 93, 529–554. [Google Scholar] [CrossRef] [Green Version]
  43. Robertson, B.A.; Hutto, R.L. A Framework for Understanding Ecological Traps and an Evaluation of Existing Evidence. Ecology 2006, 87, 1075–1085. [Google Scholar] [CrossRef] [Green Version]
  44. Hale, R.; Swearer, S.E. Ecological traps: Current evidence and future directions. Proc. Biol. Sci. 2016, 283, 20152647. [Google Scholar] [CrossRef] [PubMed] [Green Version]
  45. Severns, P.M. Habitat restoration facilitates an ecological trap for a locally rare, wetland-restricted butterfly. Insect Conserv. Divers. 2011, 4, 184–191. [Google Scholar] [CrossRef]
  46. Sievers, M.; Hale, R.; Swearer, S.E.; Parris, K.M. Contaminant mixtures interact to impair predator-avoidance behaviours and survival in a larval amphibian. Ecotoxicol. Environ. Saf. 2018, 161, 482–488. [Google Scholar] [CrossRef]
  47. Clarke-Wood, B.K.; Jenkins, K.M.; Law, B.S.; Blakey, R.V. The ecological response of insectivorous bats to coastal lagoon degradation. Biol. Conserv. 2016, 202, 10–19. [Google Scholar] [CrossRef]
  48. Laverty, T.M.; Berger, J. Do bats seek clean water? A perspective on biodiversity from the Namib Desert. Biol. Conserv. 2020, 248, 108686. [Google Scholar] [CrossRef]
  49. Sharley, D.J.; Sharp, S.M.; Marshall, S.; Jeppe, K.; Pettigrove, V.J. Linking urban land use to pollutants in constructed wetlands: Implications for stormwater and urban planning. Landsc. Urban Plan. 2017, 162, 80–91. [Google Scholar] [CrossRef]
  50. Paing, J.; Guilbert, A.; Gagnon, V.; Chazarenc, F. Effect of climate, wastewater composition, loading rates, system age and design on performances of French vertical flow constructed wetlands: A survey based on 169 full scale systems. Ecol. Eng. 2015, 80, 46–52. [Google Scholar] [CrossRef]
  51. Hijosa-Valsero, M.; Sidrach-Cardona, R.; Becares, E. Comparison of interannual removal variation of various constructed wetland types. Sci. Total Environ. 2012, 430, 174–183. [Google Scholar] [CrossRef]
  52. Saggaï, M.M.; Ainouche, A.; Nelson, M.; Cattin, F.; El Amrani, A. Long-term investigation of constructed wetland wastewater treatment and reuse: Selection of adapted plant species for metaremediation. J. Environ. Manag. 2017, 201, 120–128. [Google Scholar] [CrossRef] [PubMed]
  53. Reinartz, J.A.; Warne, E.L. Development of vegetation in small created wetlands in southeastern Wisconsin. Wetlands 1993, 13, 153–164. [Google Scholar] [CrossRef]
  54. Spieles, D.J.; Coneybeer, M.; Horn, J. Community Structure and Quality after 10 Years in Two Central Ohio Mitigation Bank Wetlands. Environ. Manag. 2006, 38, 837–852. [Google Scholar] [CrossRef] [PubMed]
  55. Denton, R.D.; Richter, S.C. Amphibian communities in natural and constructed ridge top wetlands with implications for wetland construction. J. Wildl. Manag. 2013, 77, 886–896. [Google Scholar] [CrossRef]
  56. Schad, A.N.; Kennedy, J.H.; Dick, G.O.; Dodd, L. Aquatic macroinvertebrate richness and diversity associated with native submerged aquatic vegetation plantings increases in longer-managed and wetland-channeled effluent constructed urban wetlands. Wetl. Ecol. Manag. 2020, 28, 461–477. [Google Scholar] [CrossRef]
  57. Silva De Araújo, M.L.V.; Bernard, E. Green remnants are hotspots for bat activity in a large Brazilian urban area. Urban Ecosyst. 2016, 19, 287–296. [Google Scholar] [CrossRef]
  58. Tena, E.; Fandos, G.; De Paz, Ó.; De La Peña, R.; Tellería, J.L. Size does matter: Passive sampling in urban parks of a regional bat assemblage. Urban Ecosyst. 2020, 23, 227–234. [Google Scholar] [CrossRef]
  59. Krauel, J.J.; Lebuhn, G. Patterns of Bat Distribution and Foraging Activity in a Highly Urbanized Temperate Environment. PLoS ONE 2016, 11, e0168927. [Google Scholar] [CrossRef]
  60. Kalcounis, M.C.; Hobson, K.A.; Brigham, R.M.; Hecker, K.R. Bat Activity in the Boreal Forest: Importance of Stand Type and Vertical Strata. J. Mammal. 1999, 80, 673–682. [Google Scholar] [CrossRef] [Green Version]
  61. Springall, B.T.; Li, H.; Kalcounis-Rueppell, M.C. The In-Flight Social Calls of Insectivorous Bats: Species Specific Behaviors and Contexts of Social Call Production. Front. Ecol. Evol. 2019, 7, 441. [Google Scholar] [CrossRef] [Green Version]
  62. Li, H.; Crihfield, C.; Feng, Y.; Gaje, G.; Guzman, E.; Heckman, T.; Mellis, A.; Moore, L.; Romo Bechara, N.; Sanchez, S.; et al. The Weekend Effect on Urban Bat Activity Suggests Fine Scale Human-Induced Bat Movements. Animals 2020, 10, 1636. [Google Scholar] [CrossRef]
  63. Loeb, S.C.; Post, C.J.; Hall, S.T. Relationship between urbanization and bat community structure in national parks of the southeastern U.S. Urban Ecosyst. 2009, 12, 197–214. [Google Scholar] [CrossRef]
  64. Schimpp, S.A.; Li, H.; Kalcounis-Rueppell, M.C. Determining species specific nightly bat activity in sites with varying urban intensity. Urban Ecosyst. 2018, 21, 541–550. [Google Scholar] [CrossRef]
  65. R Development Core Team. R: A Language and Environment for Statistical Computing; R Foundation for Statistical Computing: Vienna, Austria, 2018; ISBN 3-900051-07-0. Available online: https://www.r-project.org/ (accessed on 10 September 2021).
  66. Thieurmel, B.; Elmarhraoui, A. Suncalc: Compute Sun Position, Sunlight Phases, Moon Position and Lunar Phase. 2019. Available online: https://cran.r-project.org/web/packages/suncalc/index.html (accessed on 10 September 2021).
  67. Reichert, B.E.; Bayless, M.; Cheng, T.L.; Coleman, J.T.H.; Francis, C.M.; Frick, W.F.; Gotthold, B.S.; Irvine, K.M.; Lausen, C.; Li, H.; et al. NABat: A top-down, bottom-up solution to collaborative continental-scale monitoring. Ambio 2021, 50, 901–913. [Google Scholar] [CrossRef]
  68. Loeb, S.C.; Hines, B.A.; Armstrong, M.P.; Zarnoch, S.J. Effects of Omnidirectional Microphone Placement and Survey Period on Bat Echolocation Call Quality and Detection Probabilities. Acta Chiropterol. 2020, 21, 453–464. [Google Scholar] [CrossRef]
  69. Findlay, S.V.; Barclay, R.M.R. Acoustic Surveys for Bats are Improved by Taking Habitat Type into Account. Wildl. Soc. Bull. 2020, 44, 86–93. [Google Scholar] [CrossRef]
  70. Quinn, G.P.; Keough, M.J. Experimental Design and Data Analysis for Biologists; Cambridge University Press U.S.: New York, NY, USA, 2002; ISBN 0-521-00976-6. [Google Scholar]
  71. Wickham, H.; Chang, W. Ggplot2: An Implementation of the Grammar of Graphics. R Package Version 0.7. Available online: http://CRAN.+R-project.+org/package=+ggplot2+2008 (accessed on 10 September 2021).
  72. Parker, K.A., Jr.; Li, H.; Kalcounis-Rueppell, M.C. Species-Specific Environmental Conditions for Winter Bat Acoustic Activity in North Carolina, United States. J. Mammal. 2020, 101, 1502–1512. [Google Scholar] [CrossRef]
  73. McCune, B.; Grace, J.B.; Urban, D.L. Analysis of Ecological Communities; MJM Software Design: Gleneden Beach, OR, USA, 2002; ISBN 978-0-9721290-0-8. [Google Scholar]
  74. Oksanen, J.; Blanchet, F.G.; Friendly, M.; Kindt, R.; Legendre, P.; McGlinn, D.; Minchin, P.R.; O’Hara, R.B.; Simpson, G.L.; Solymos, P.; et al. Vegan: Community Ecology (R Package). 2018. Available online: https://cran.r-project.org/web/packages/vegan/index.html (accessed on 10 September 2021).
  75. Vindigni, M.A.; Morris, A.D.; Miller, D.A.; Kalcounis-Rueppell, M.C. Use of modified water sources by bats in a managed pine landscape. For. Ecol. Manag. 2009, 258, 2056–2061. [Google Scholar] [CrossRef]
  76. Kalcounis-Rueppell, M.C.; Payne, V.H.; Huff, S.R.; Boyko, A.L. Effects of wastewater treatment plant effluent on bat foraging ecology in an urban stream system. Biol. Conserv. 2007, 138, 120–130. [Google Scholar] [CrossRef]
  77. Li, H.; Parker, K.A.; Kalcounis-Rueppell, M.C. The luxury effect beyond cities: Bats respond to socioeconomic variation across landscapes. BMC Ecol. 2019, 19, 46. [Google Scholar] [CrossRef] [PubMed] [Green Version]
  78. Li, H.; Wilkins, K.T. Patch or mosaic: Bat activity responds to fine-scale urban heterogeneity in a medium-sized city in the United States. Urban Ecosyst. 2014, 17, 1013–1031. [Google Scholar] [CrossRef]
  79. Li, H.; Wilkins, K.T. Selection of Building Roosts by Mexican Free-Tailed Bats (Tadarida brasiliensis) in an Urban Area. Acta Chiropterol. 2015, 17, 321–330. [Google Scholar] [CrossRef]
  80. Lewanzik, D.; Sundaramurthy, A.K.; Goerlitz, H.R.; Derryberry, E. Insectivorous bats integrate social information about species identity, conspecific activity and prey abundance to estimate cost–benefit ratio of interactions. J. Anim. Ecol. 2019, 88, 1462–1473. [Google Scholar] [CrossRef]
  81. Culina, A.; Garroway, C.J. Bats use social information within and across species. J. Anim. Ecol. 2019, 88, 1444–1446. [Google Scholar] [CrossRef] [PubMed]
  82. Neubaum, D.J.; O’Shea, T.J.; Wilson, K.R. Autumn Migration and Selection of Rock Crevices as Hibernacula by Big Brown Bats in Colorado. J. Mammal. 2006, 87, 470–479. [Google Scholar] [CrossRef]
  83. Duchamp, J.E.; Sparks, D.W.; Whitaker, J.O. Foraging-habitat selection by bats at an urban–rural interface: Comparison between a successful and a less successful species. Can. J. Zool. 2004, 82, 1157–1164. [Google Scholar] [CrossRef] [Green Version]
  84. Lehrer, E.W.; Gallo, T.; Fidino, M.; Kilgour, R.J.; Wolff, P.J.; Magle, S.B. Urban bat occupancy is highly influenced by noise and the location of water: Considerations for nature-based urban planning. Landsc. Urban Plan. 2021, 210, 104063. [Google Scholar] [CrossRef]
  85. Moretto, L.; Francis, C.M. What factors limit bat abundance and diversity in temperate, North American urban environments? J. Urban Ecol. 2017, 3, jux016. [Google Scholar] [CrossRef] [Green Version]
Figure 1. Tile plot showing in different seasons whether the open wetland or the open control had higher total and species-specific bat activity in the Peabody Park in Greensboro, NC, USA. Statistical significance was determined by Wilcoxon tests. Species abbreviations in all figures: EPFU, Eptesicus fuscus; LABO, Lasiurus borealis; LACI, L. cinereus; LANO, Lasionycteris noctivagans; NYHU, Nycticeius humeralis; PESU, Perimyotis subflavus; TABR, Tadarida brasiliensis.
Land 10 01087 g001
Figure 2. Tile plot showing in different seasons whether the woody wetland or the woody control had higher total and species-specific bat activity in the Peabody Park in Greensboro, NC, USA. Statistical significance was determined by Wilcoxon tests.
Land 10 01087 g002
Figure 3. Boxplot (25–75% quantiles) for nightly species richness against sites within each season in Greensboro, NC, USA. Post hoc Tukey HSD tests were used to determine species richness difference between sites, indicated by different colors. When two sites are shown in different colors/significant levels, they have different species richness.
Land 10 01087 g003
Figure 4. Correlogram showing community composition comparison among study sites in Greensboro, NC, USA. Mantel’s tests were used to compare sites. A p value smaller than 0.05 (shown in light and dark blue) indicated two sites were significantly correlated and had no compositional difference whereas a p value larger than 0.05 (shown in yellow) indicated two communities being different.
Land 10 01087 g004
Figure 5. NMSD plots showing monthly bat community composition varied among seasons and across years at four sites in the Peabody Park in Greensboro, NC, USA. Each panel for a site: (a) open wetland (stress 0.099); (b) open control (stress 0.101); (c) woody wetland (stress 0.1554); (d) woody control (stress 0.163).
Land 10 01087 g005
Figure 6. NMSD plots showing monthly bat community composition varied among seasons and across years at three sites at the Greensboro Science Center in Greensboro, NC, USA. Each panel for a site: (a) rooftop level (stress 0.042); (b) canopy level (stress 0.144); (c) ground level (stress 0.048).
Land 10 01087 g006
Table 1. Total bat passes recorded at each study site in each season in Greensboro, NC, USA.
UNCG
Open Wetland
UNCG
Open Control
UNCG Woody WetlandUNCG Woody ControlGSC
Rooftop Level
GSC
Canopy Level
GSC
Ground Level
2017 Spring22,48123,37988243559N/A1394262
2017 Summer36,42836,28455651131879277251148
2017 Fall7917593821522054551425141635
2017 Winter4794244515261561309281280
2018 Spring19,95219,5789588396447651909497
2018 Summer35,35819,219587939811,35049721482
2018 Fall262188981481189875541104909
2018 Winter27281460844546131205115
2019 Spring18,48133,98010,09852172783852824
2019 Summer32,17730,544390687313,1724789738
2019 Fall36625744558143611,86910451183
2019 Winter21541806812887225153117
2020 Spring20,71228,81912,16010,97912351177498
2020 Summer35,59826,8512512122710,07285862274
2020 Fall67753020185843590663122756
2020 Winter41727181832421959
Publisher’s Note: MDPI stays neutral with regard to jurisdictional claims in published maps and institutional affiliations.

