Article

Monitoring of Land Use–Land Cover Change and Potential Causal Factors of Climate Change in Jhelum District, Punjab, Pakistan, through GIS and Multi-Temporal Satellite Data

1
Department of Botany, University of Gujrat, Hafiz Hayat Campus, Gujrat 50700, Punjab, Pakistan
2
State Key Laboratory of Information Engineering in Surveying, Mapping and Remote Sensing, Wuhan University, Wuhan 430079, China
3
Department of Geography, University of Gujrat, Hafiz Hayat Campus, Gujrat 50700, Punjab, Pakistan
4
Department of Botany, Govt. Hashmat Ali Islamia Associate College Rawalpindi, Rawalpindi 46300, Punjab, Pakistan
5
Department of Botany, University of Okara, Okara 56300, Punjab, Pakistan
6
Aerospace Information Research Institute, Chinese Academy of Sciences, Beijing 100101, China
7
University of Chinese Academy of Sciences (UCAS), Beijing 101408, China
8
School of Earth Sciences and Engineering, Hohai University, Nanjing 210098, China
9
Zhongke Langfang Institute of Spatial Information Applications, Langfang 065001, China
10
Department of Pharmacy, Quaid-i-Azam University, Islamabad 45320, Pakistan
11
Barani Agricultural Research Institute, Chakwal 48650, Punjab, Pakistan
12
Department of Biochemistry, Shah Abdul Latif University, Khairpur 66020, Sindh, Pakistan
13
Department of Environmental Science, Comsats University Islamabad, Vehari Campus, Vehari 61100, Punjab, Pakistan
14
Department of Plant Breeding and Genetics, University of Agriculture, Faisalabad 38000, Punjab, Pakistan
*
Author to whom correspondence should be addressed.
These authors contributed equally to this work.
Land 2021, 10(10), 1026; https://doi.org/10.3390/land10101026
Submission received: 12 August 2021 / Revised: 21 September 2021 / Accepted: 26 September 2021 / Published: 30 September 2021

Abstract

:
Land use–land cover (LULC) alteration is primarily associated with land degradation, especially in recent decades, and has resulted in various harmful changes in the landscape. The normalized difference vegetation index (NDVI) has the prospective capacity to classify the vegetative characteristics of many ecological areas and has proven itself useful as a remote sensing (RS) tool in recording vegetative phenological aspects. Likewise, the normalized difference built-up index (NDBI) is used for quoting built-up areas. The current research objectives include identification of LULC, NDVI, and NDBI changes in Jhelum District, Punjab, Pakistan, during the last 30 years (1990–2020). This study targeted five major LULC classes: water channels, built-up area, barren land, forest, and cultivated land. Satellite imagery classification tools were used to identify LULC changes in Jhelum District, northern Punjab, Pakistan. The perception data about the environmental variations as conveyed by the 500 participants (mainly farmers) were also recorded and analyzed. The results depict that the majority of farmers (54%) believe in the appearance of more drastic changes such as less rainfall, drought, and decreased water availability for irrigation during 2020 compared to 30 years prior. Overall accuracy assessment of imagery classification was 83.2% and 88.8% for 1990, 88.1% and 85.7% for 2000, 86.5% and 86.7% for 2010, and 85.6% and 87.3% for 2020. The NDVI for Jhelum District was the highest in 1990 at +0.86 and the lowest in 2020 at +0.32; similarly, NDBI values were the highest in 2020 at +0.72 and the lowest in 1990 at −0.36. LULC change showed a clear association with temperature, NDBI, and NDVI in the study area. At the same time, variations in the land area of barren soil, vegetation, and built-up from 1990 to 2020 were quite prominent, possibly resulting in temperature increases, reduction in water for irrigation, and changing rainfall patterns. Farmers were found to be quite responsive to such climatic variations, diverting to framing possible mitigation approaches, but they need government assistance. The findings of this study, especially the causes and impacts of rapid LULC variations in the study area, need immediate attention from related government departments and policy makers.

1. Introduction

According to the Fourth Assessment Report of the IPCC, with the end of the current century, the average phase temperature will increase up to 1.1–6.4 °C worldwide [1]. Climate is the main factor for food production, crop growth, and the rural livelihoods of billions of rural communities from different regions of the world [2,3,4,5]. In recent decades, global climate change has greatly affected vegetation [6,7]. Pakistan is an agrarian country, and its economy depends on agriculture; it is susceptible to climate fluctuations [8,9]. Land cover degradation is a decrease in the capacity of the land to yield profits in land use (LU) related to quantified control of the land area [10]. Land cover (LC) describes the general characteristics of the land surface, including forest, barren land, water, mountain summits, hill slopes, cropping, and the urban setup [11]. Land cover has the most delicate relation with land use [12,13]. Mapping land use–land cover (LULC) has been completed efficiently with satellite images at many spatial, spectral, and temporal resolutions [1,14,15], while in arid and semi-arid ecology, the application of multi-temporal satellite images has been reduced to develop and assess LULC fluctuations [16,17]. Alterations in LULC could be examined because they affect land ecology permanently, particularly in built-up areas of micro-climate heating [18]. The normalized difference vegetation index (NDVI) estimates the green vegetation density [19] and, in recent decades, has broadly been used for explaining the spatio-temporal features of LULC, with quantitative vegetation cover [20,21].
There are different activities that can alter LULC, which have been extensively studied due to it being the most important part of these types of studies. Various researchers have established an overview of the effects on LULC in different parts of the world, associated with agricultural expansion [22,23], urban expansion [24], and engineering projects such as access and energy [25,26].
The NDVI standards range from “−1.0 to 1.0”; minimum NDVI values are used for whole surface resources, and maximum NDVI standards are used for green flora [27]. Negative NDVI values represent areas with very low or null vegetation cover, such as water bodies and urban areas, whereas positive values concern pixels with vegetation from very low to high cover [28]. When near to “0”, NDVI standards are represented by bare soil [29]. The NDVI is extensively applied in remote sensing (RS) investigations because it provides suitable evidence for adding and exploring flora [27,28,30]. The NDVI is applied to determine the combined performance of climatic variation and the vegetation distribution at vast spatial and temporal scales [31] as the biomass of plant diversity is interrelated with precipitation, temperature, and evapotranspiration [32,33,34]. Geographic information systems (GISs) and remote sensing (RS) are essential tools [35] applied for the investigation of urban dimensions and density with LULC mapping and ecological impacts of urban programming within certain periods [36]. Remote sensing provides on-time availability of LULC and vegetation cover data at specific periods in an economical manner [37,38,39]. GISs manage and analyze spatial data accurately and are an important and basic need of this area of study [40].
RS data are a helpful tool in the mapping of LULC [41,42]. For LULC mapping, the temporal Landsat sensor data of the Landsat-7 Enhanced Thematic Mapper (ETM), Landsat-5 Thematic Mapper (TM) with ETM+ [43], and Landsat-8 Operational Land Imager (OLI) have been extensively used to discover the variation in the NDVI, NDBI, and LULC [33]. Assessing variation evaluates the earlier and present situation visually as well as quantitatively and thus supports indenting the fluctuations linked to LULC characteristics depicting different satellite datasets [44]. Proper classifications require previous data from particular regions for collecting recorded data from working areas. Field-recorded data have been used to explain applications for selected classification algorithms [45].
Several such types of attempts to assess and manage LULC changes and degradation using RS data were explored by various researchers from countries around the world [46], such as northwest Ethiopia [4], West Africa [7], Ethiopia [11], Malaysia [12], Zimbabwe [17], Bangladesh [21], Southern Africa [30], Iran [37], Nepal [39], China [40], northern Ethiopia [42], Brazil [47], Iraq [48], and Turkey [49]. Pakistan is regarded as one of the agricultural countries in the world which are directly influenced by climatic fluctuations, which ultimately affect the economy of lowland farmers. From Pakistan, various studies in southern Punjab [1], Islamabad [2], Faisalabad and Multan [27], Vehari [28], Sindh [35], Azad Jammu and Kashmir [50], Multan [51], Lodhran [52], and Khyber Pakhtunkhwa [53] have been conducted for the assessment and management of LULC changes using RS data. In the conducted research, over a longer time period, LULC change assessment was recorded in Jhelum District using RS and GIS tools. Following are the main objectives of the current study:
  • To identify temporal LULC changes during the last 30 years and farmers’ perception regarding climate change and LULC variations;
  • To analyze and map NDVI, NDBI, and LULC changes by using satellite data;
  • To compare the various characteristics of LULC, NDBI, and NDVI during the past 30 years.

2. Materials and Methods
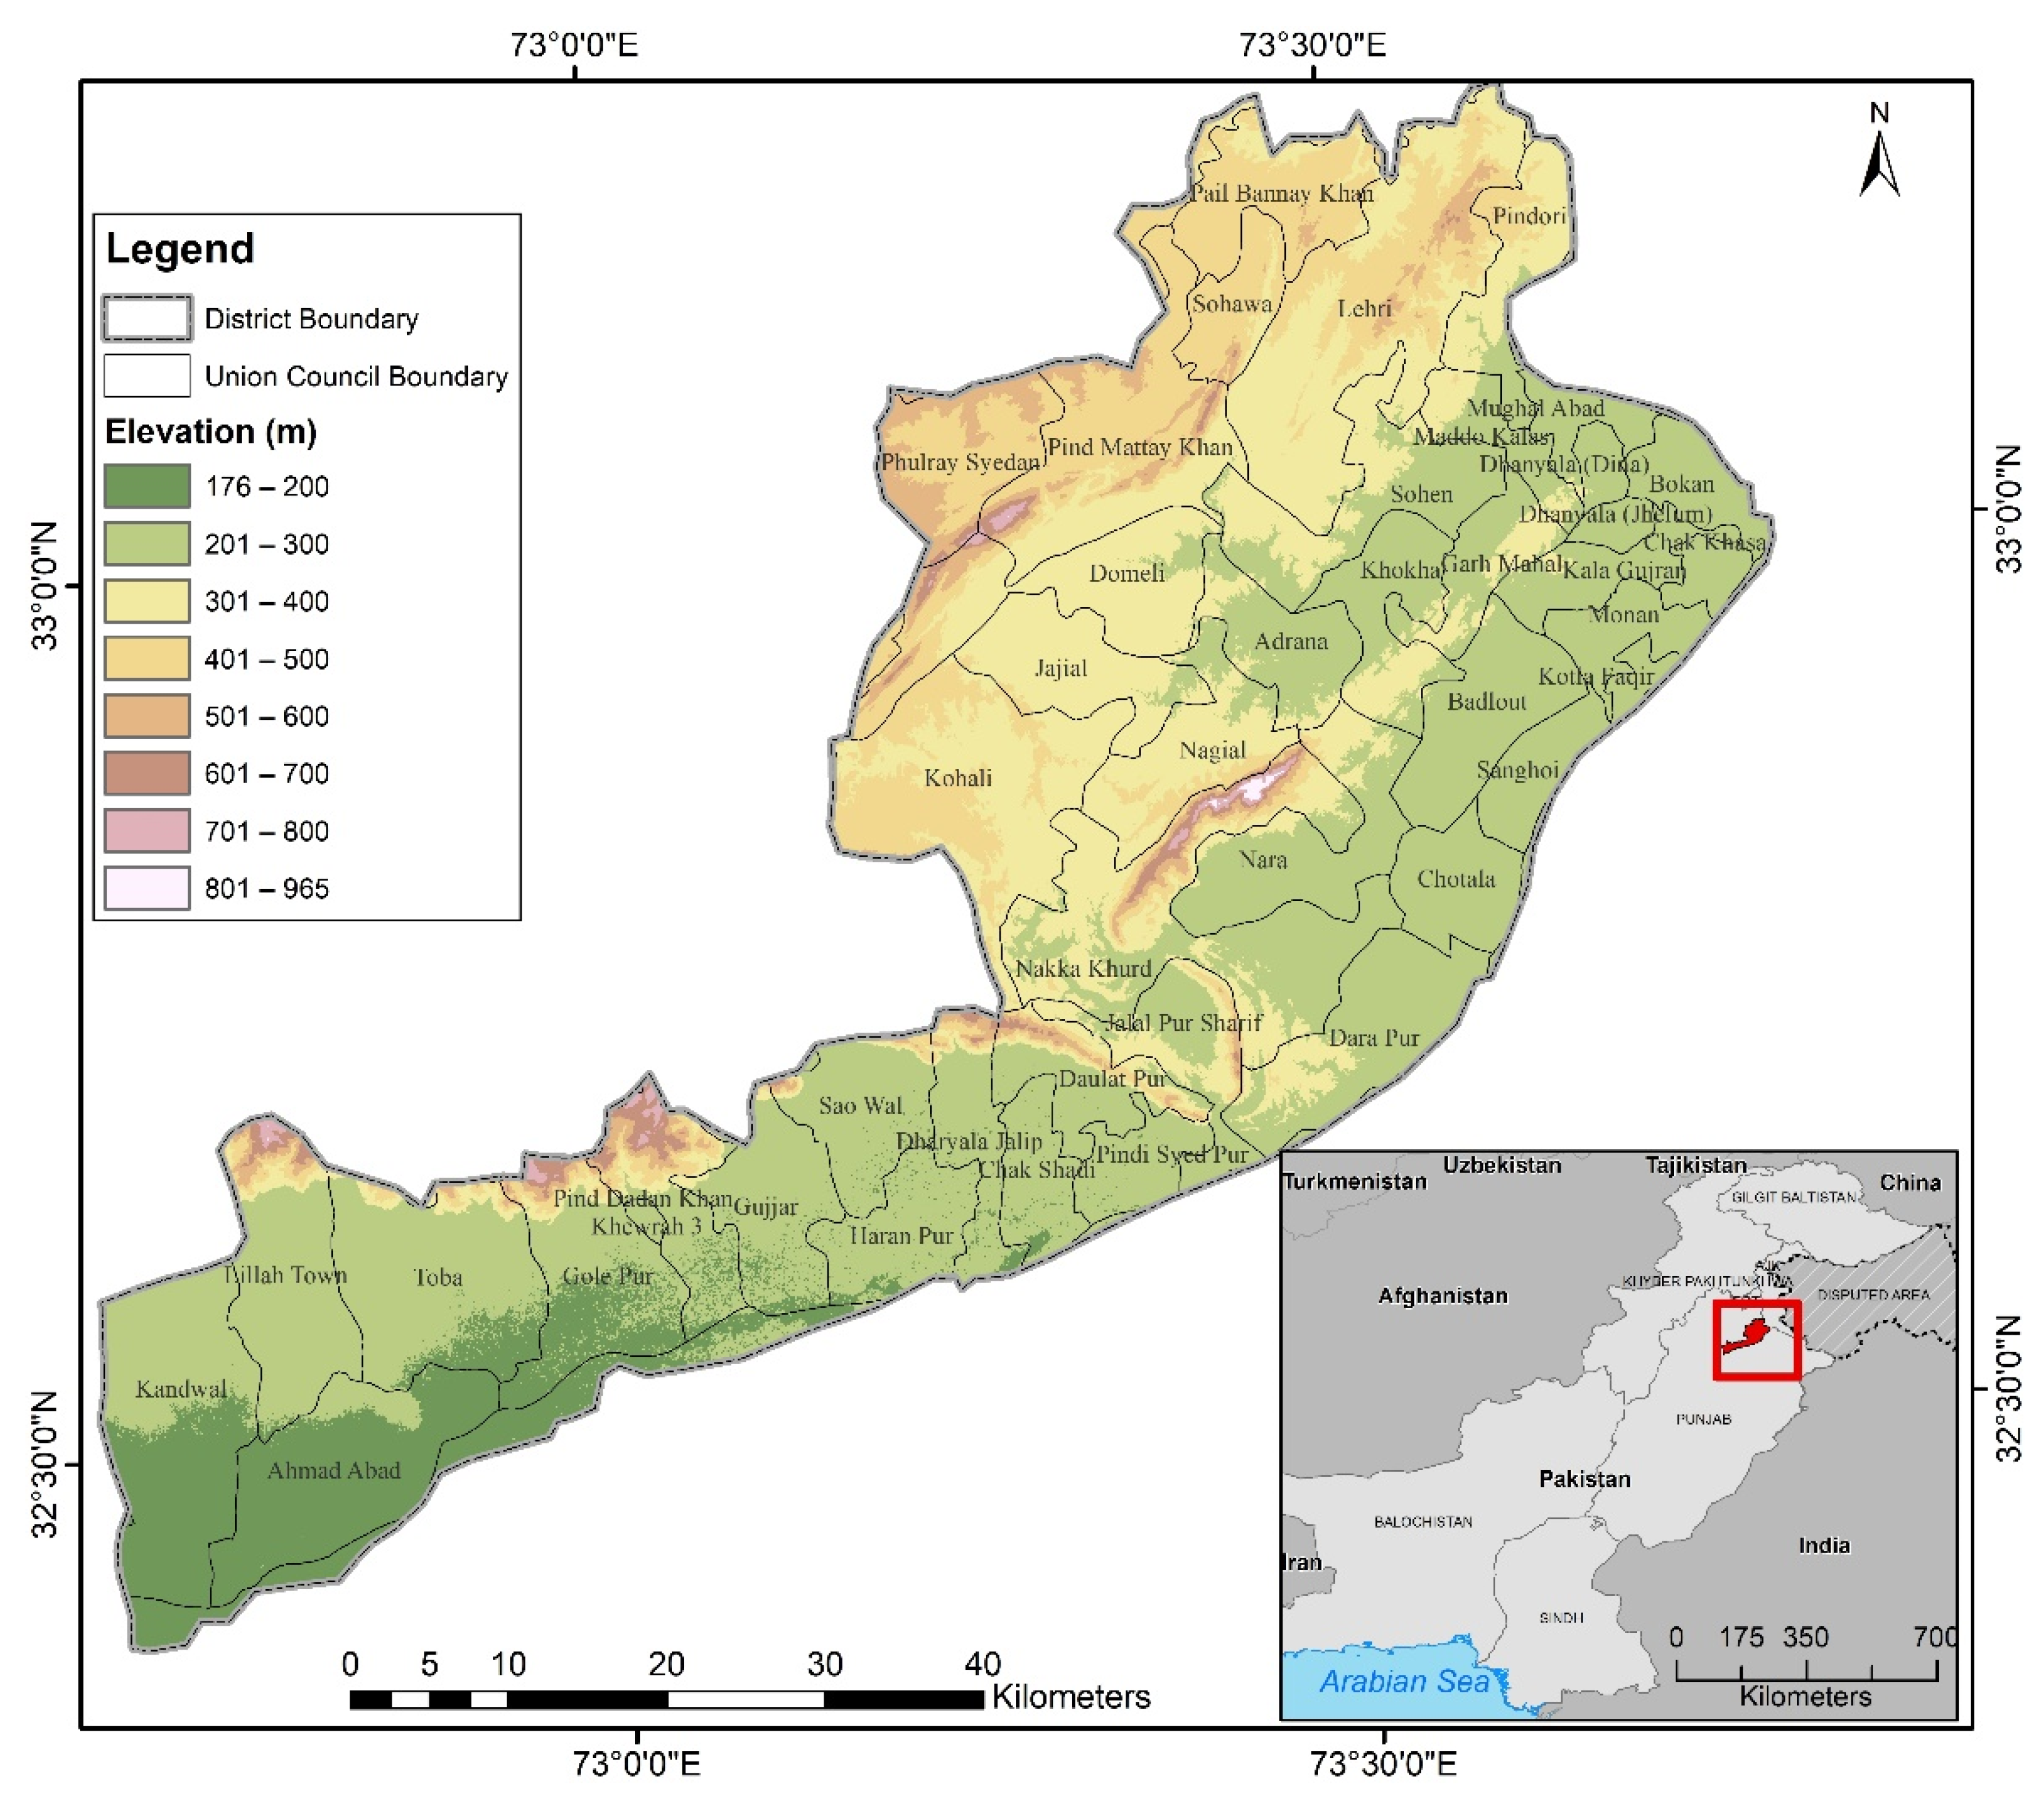
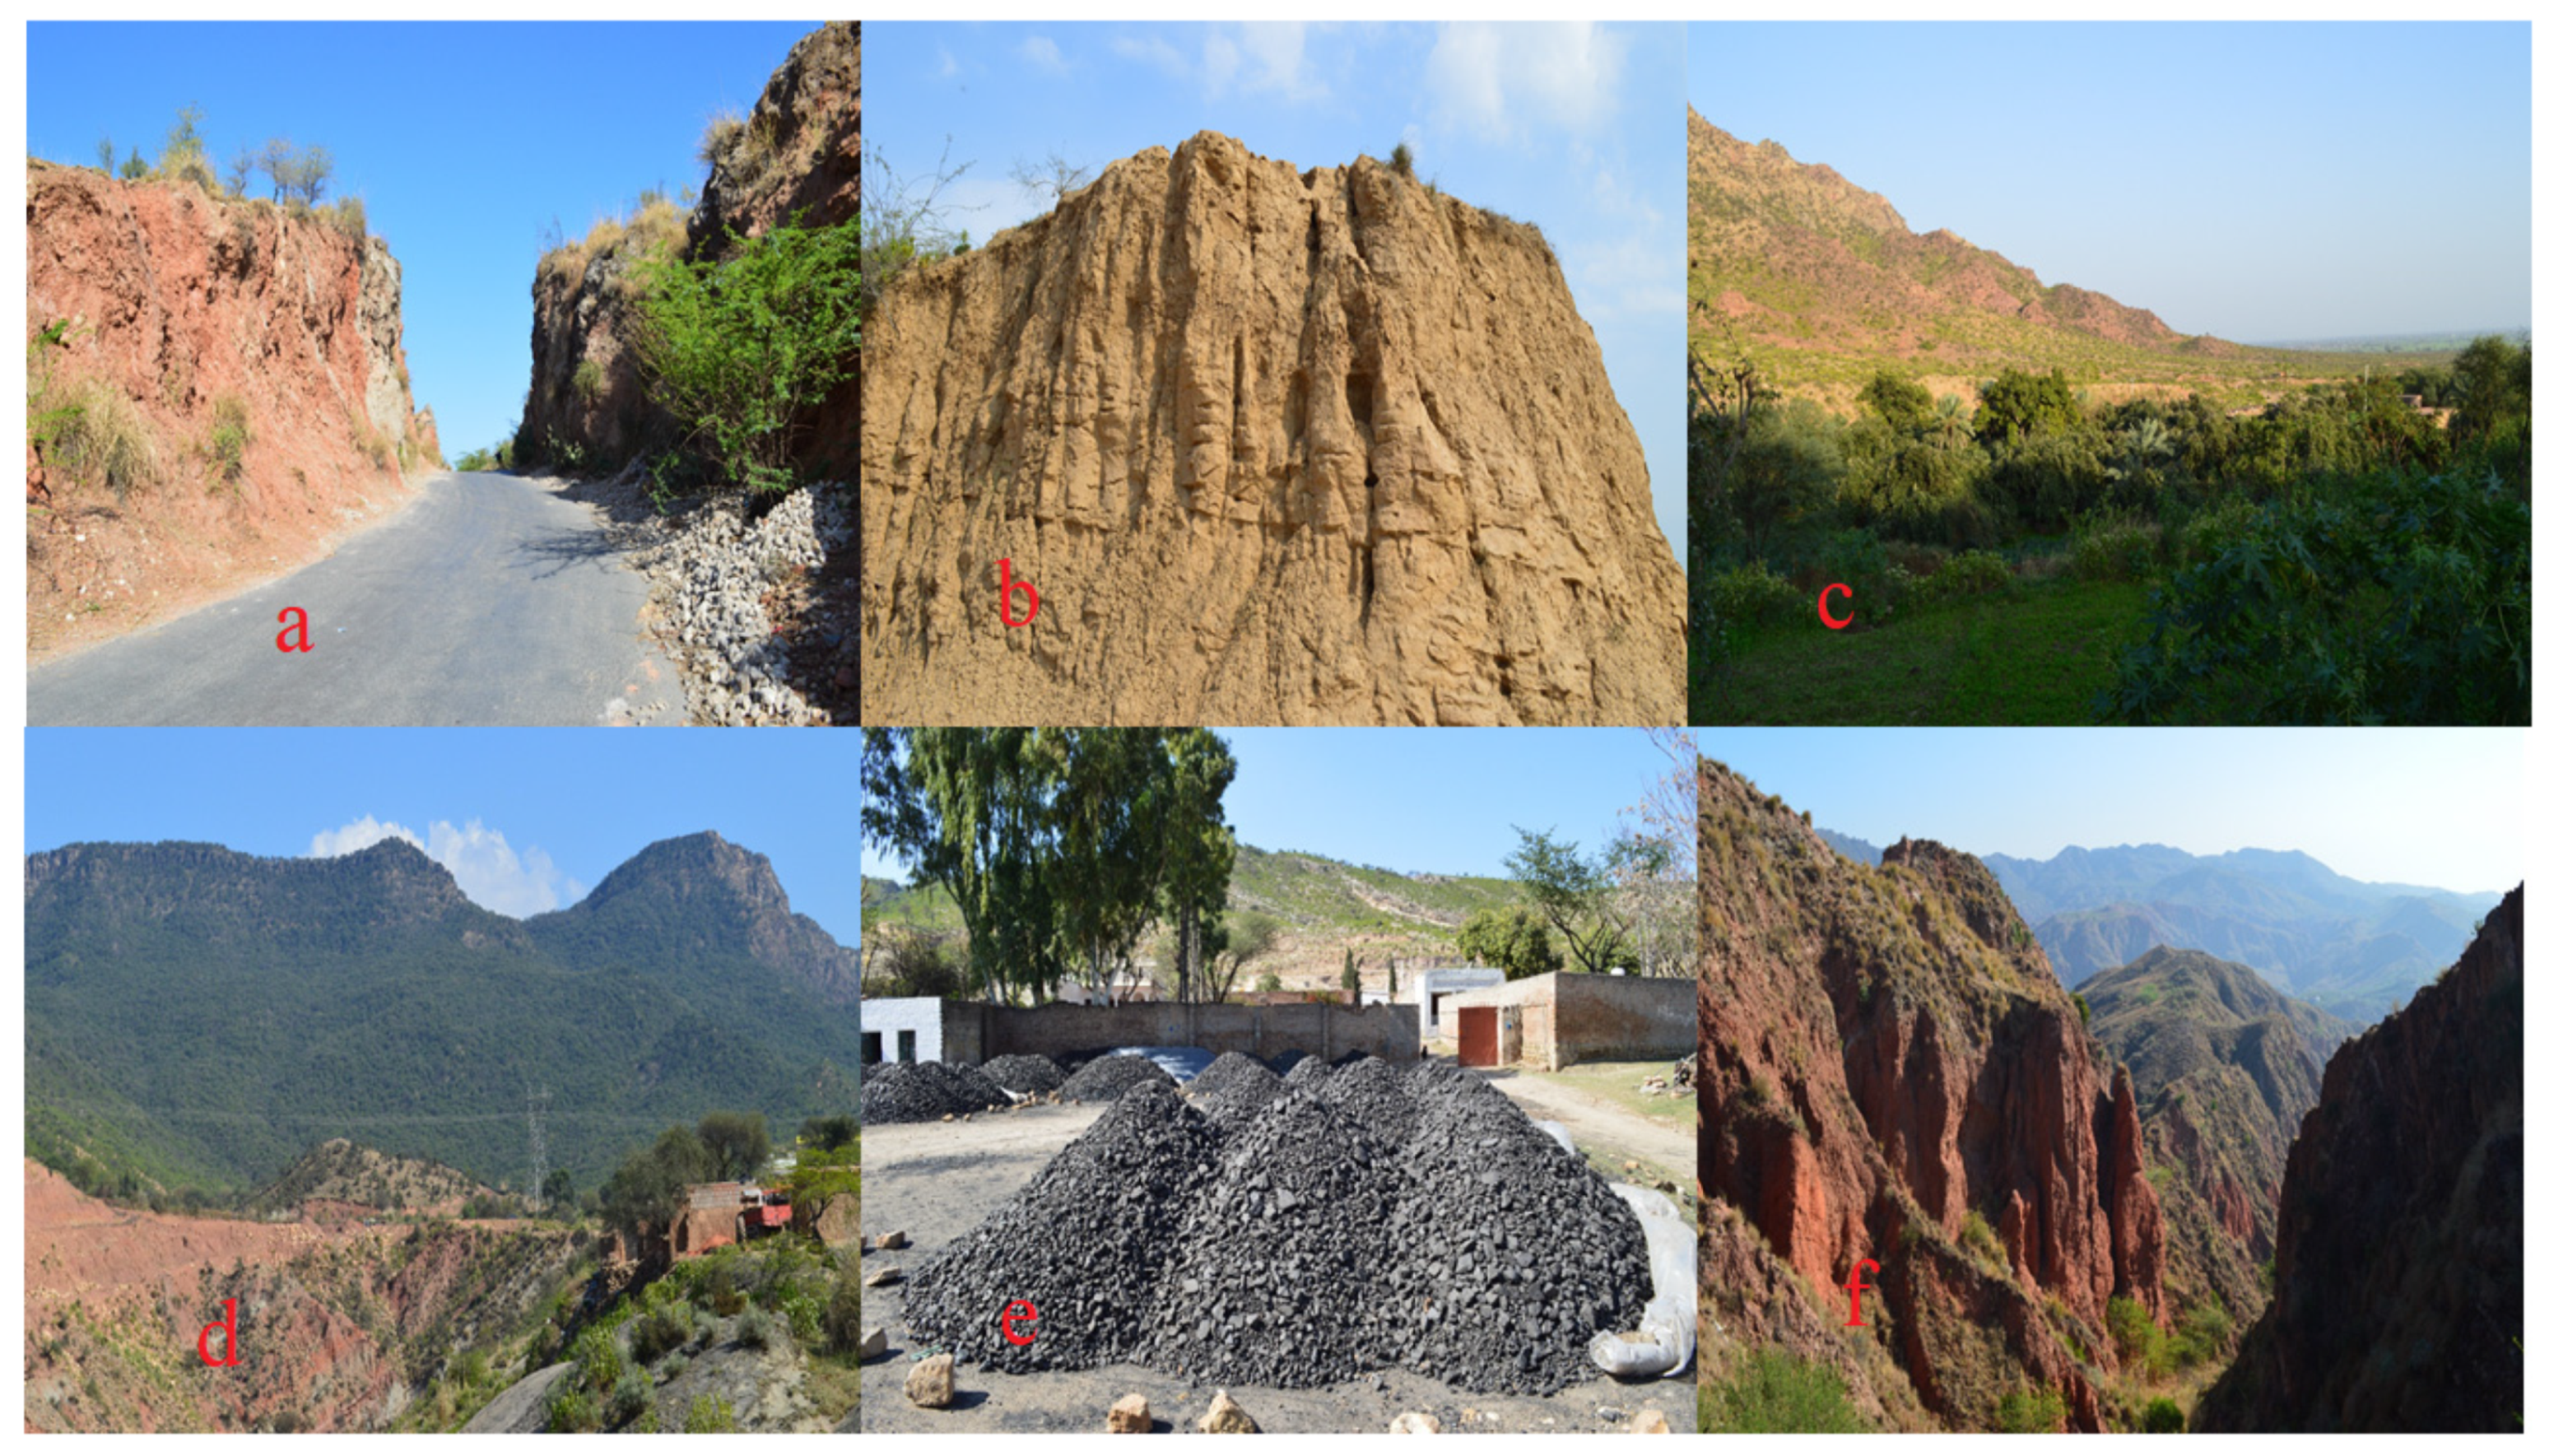
2.1. Study Area

Jhelum District is located to the north of the Jhelum River and bounded by Rawalpindi District in the north, Sargodha and Gujrat Districts in the south, Azad Kashmir in the east, and Chakwal District in the west [54] (Figure 1). The total human population of the district is 1.223 million [54]. The climate is a semi-arid, warm subtropical type and recognized as having warm summer and severe winter seasons. Jhelum is a semi-mountainous region; the mean annual rainfall is 880 mm, while the average annual temperature is 23.6 °C [55]. The Jhelum River flows through 247,102 acres of lengthy plain area and 41,207 acres of mountainous zones. The district has the world’s second largest salt mine (Khewra salt mine), which covers an area of 2.268 million acres [54]. People of the area have diverse modes of lifestyles, beliefs, and traditions [56]. Some typical landscapes are shown in Figure 2.

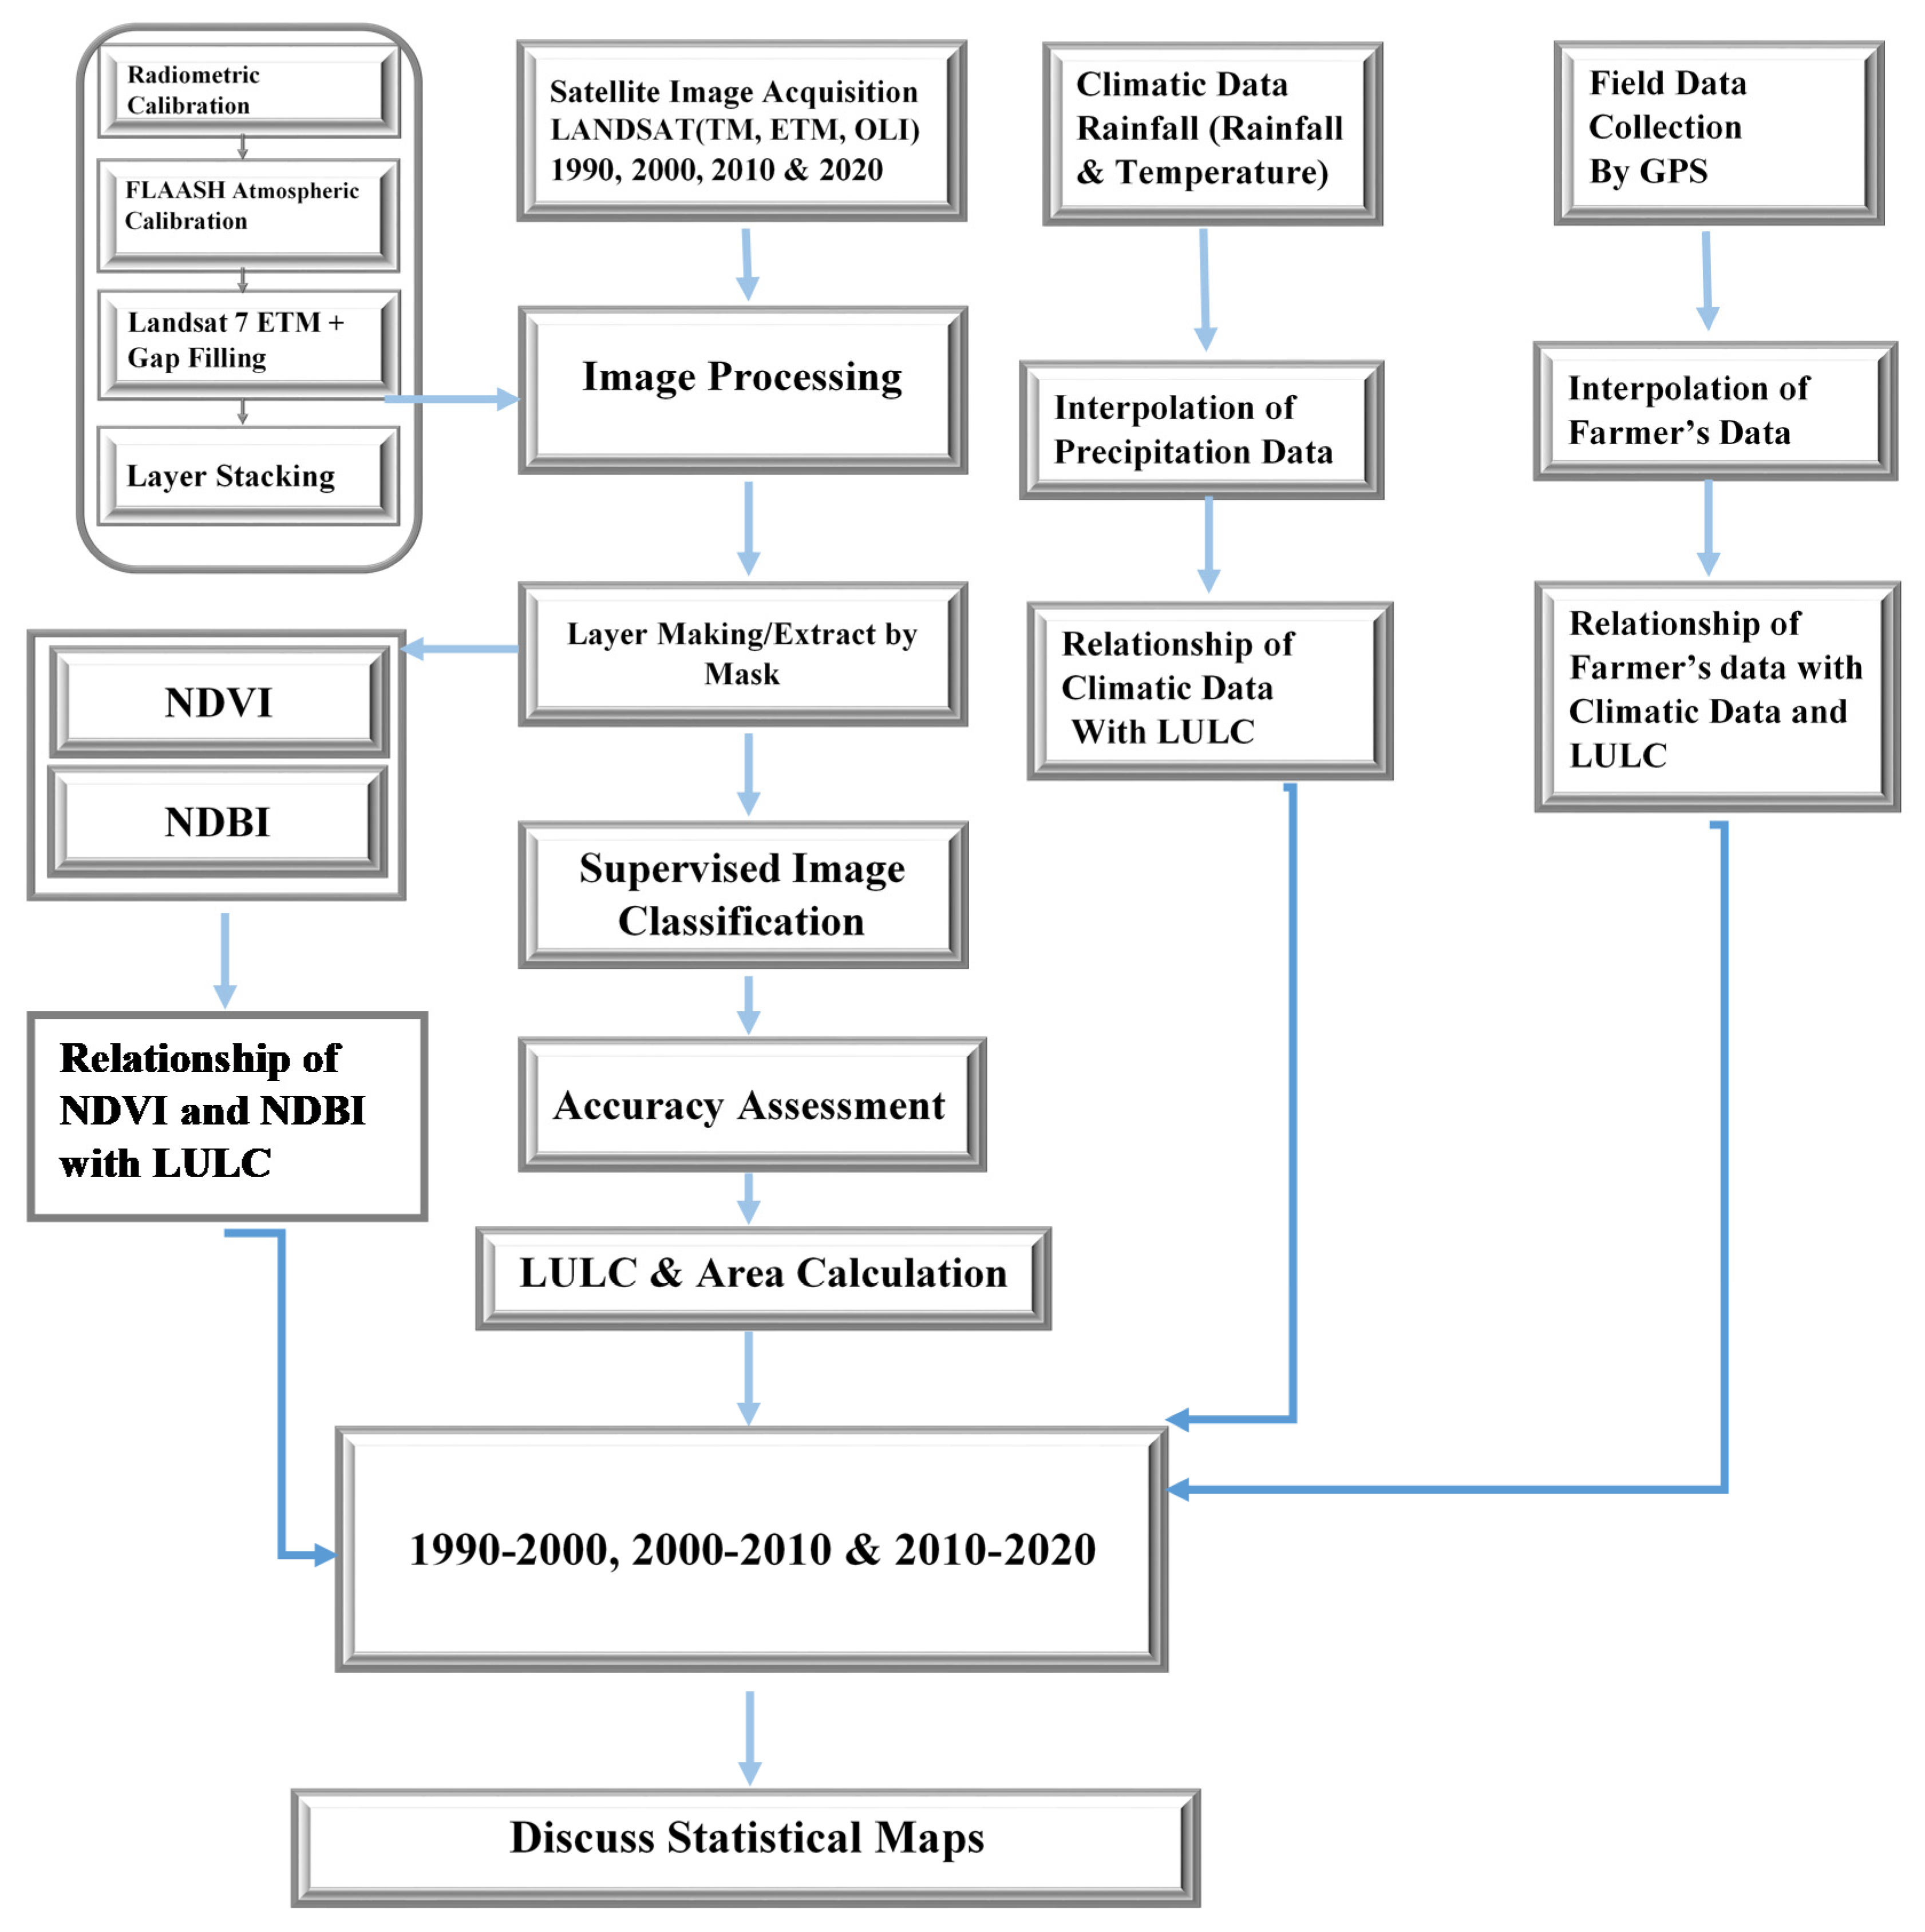
2.2. Methods and Materials

2.2.1. Satellite Data

For LULC, NDVI, and NDBI variation assessment in the study area over a temporal gradient of 30 years (1990, 2000, 2010, 2020), Landsat 8 (OLI), Landsat 7 (ETM+), and Landsat 4, 5 (TM) satellite remote sensing imagery data were used and downloaded from the website (http/www.earthexplorer.usgs.gov (accessed on 6 August 2020)) of the United States Geological Survey (USGS). The details of the downloaded satellite images are presented in Table 1.

2.2.2. Survey Data

In this study, responses of 500 farmers in Jhelum District were recorded by using the snowball sampling method to document perceptions linked to LULC and climate changes. A total of 25 union councils in the study area were targeted, encompassing five villages per union council. The data linked to different climatic variables were recorded during August 2020 to July 2021. Study contributors were selected concentrating on middle-aged and elderly people (range: 30–80 years old), particularly farmers from 75 considered villages of Jhelum District. The investigated variables were composed of climate change records (including rainfall duration, rainfall intensity, and temperature variations) and LULC variations during the past 30 years.
GPS was used to record the sample locations for the considered LULC categories. A mobile-associated tool (Open Data Kit) was used for gathering the digital and geo-referenced field records.

2.2.3. Climatic Data

Climate data (precipitation and temperature) of Jhelum District for the last 30 years (1990 to 2020) were acquired from the Pakistan Metrological Department (PMD). The analysis of variance (ANOVA) test was applied in SPSS version 17 to seek the significant differences among the group means of collected climatic data. Furthermore, the collected climatic data of the study locations were geo-referenced, interpolated, and mapped by using ArcGIS software.

2.3. Image Classification

The Landsat images are composed of several bands, where there are 11 bands in the Landsat 8 images. These bands were composited to obtain single-color imagery and to subset the research area, and extraction by the mask tool was conducted in ArcGIS 10.1 software [57]. Digital LULC grouping through the supervised classification technique was used, and field data were employed as ground truth data. LULC maps for the mentioned temporal intervals were developed using supervised classification by centering the research area of focus in the field assessment together with the exercise and authentication portions. Finally, LULC imagery was re-classified in ArcGIS 10.1 to quantify the variations over the indicated study years. ERDAS imagine 15 and ArcGIS 10.1 proved practical tools for assessing the LULC using satellite images. The detailed research framework is presented in Figure 3.

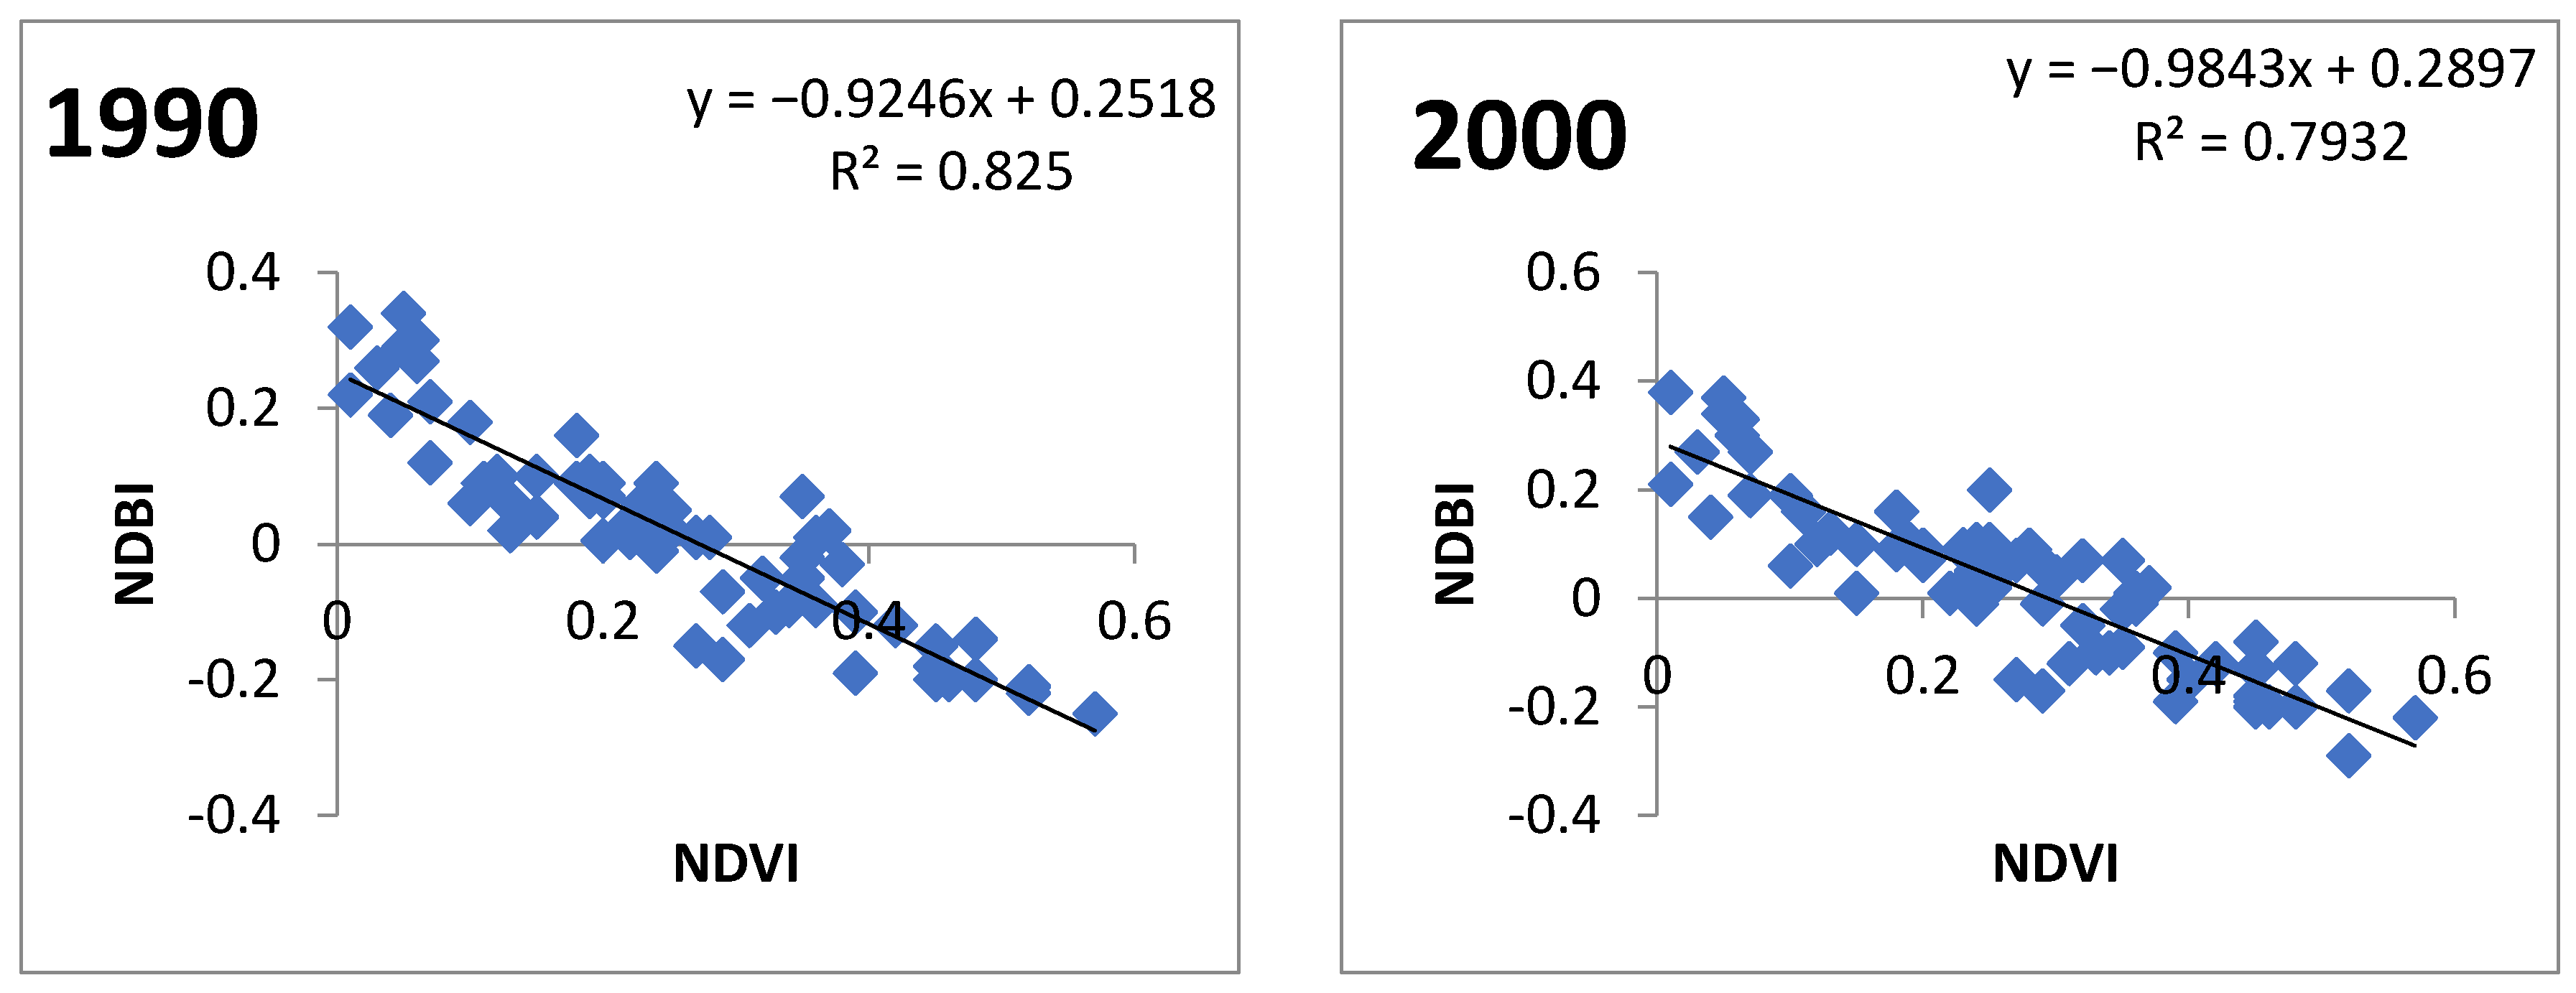
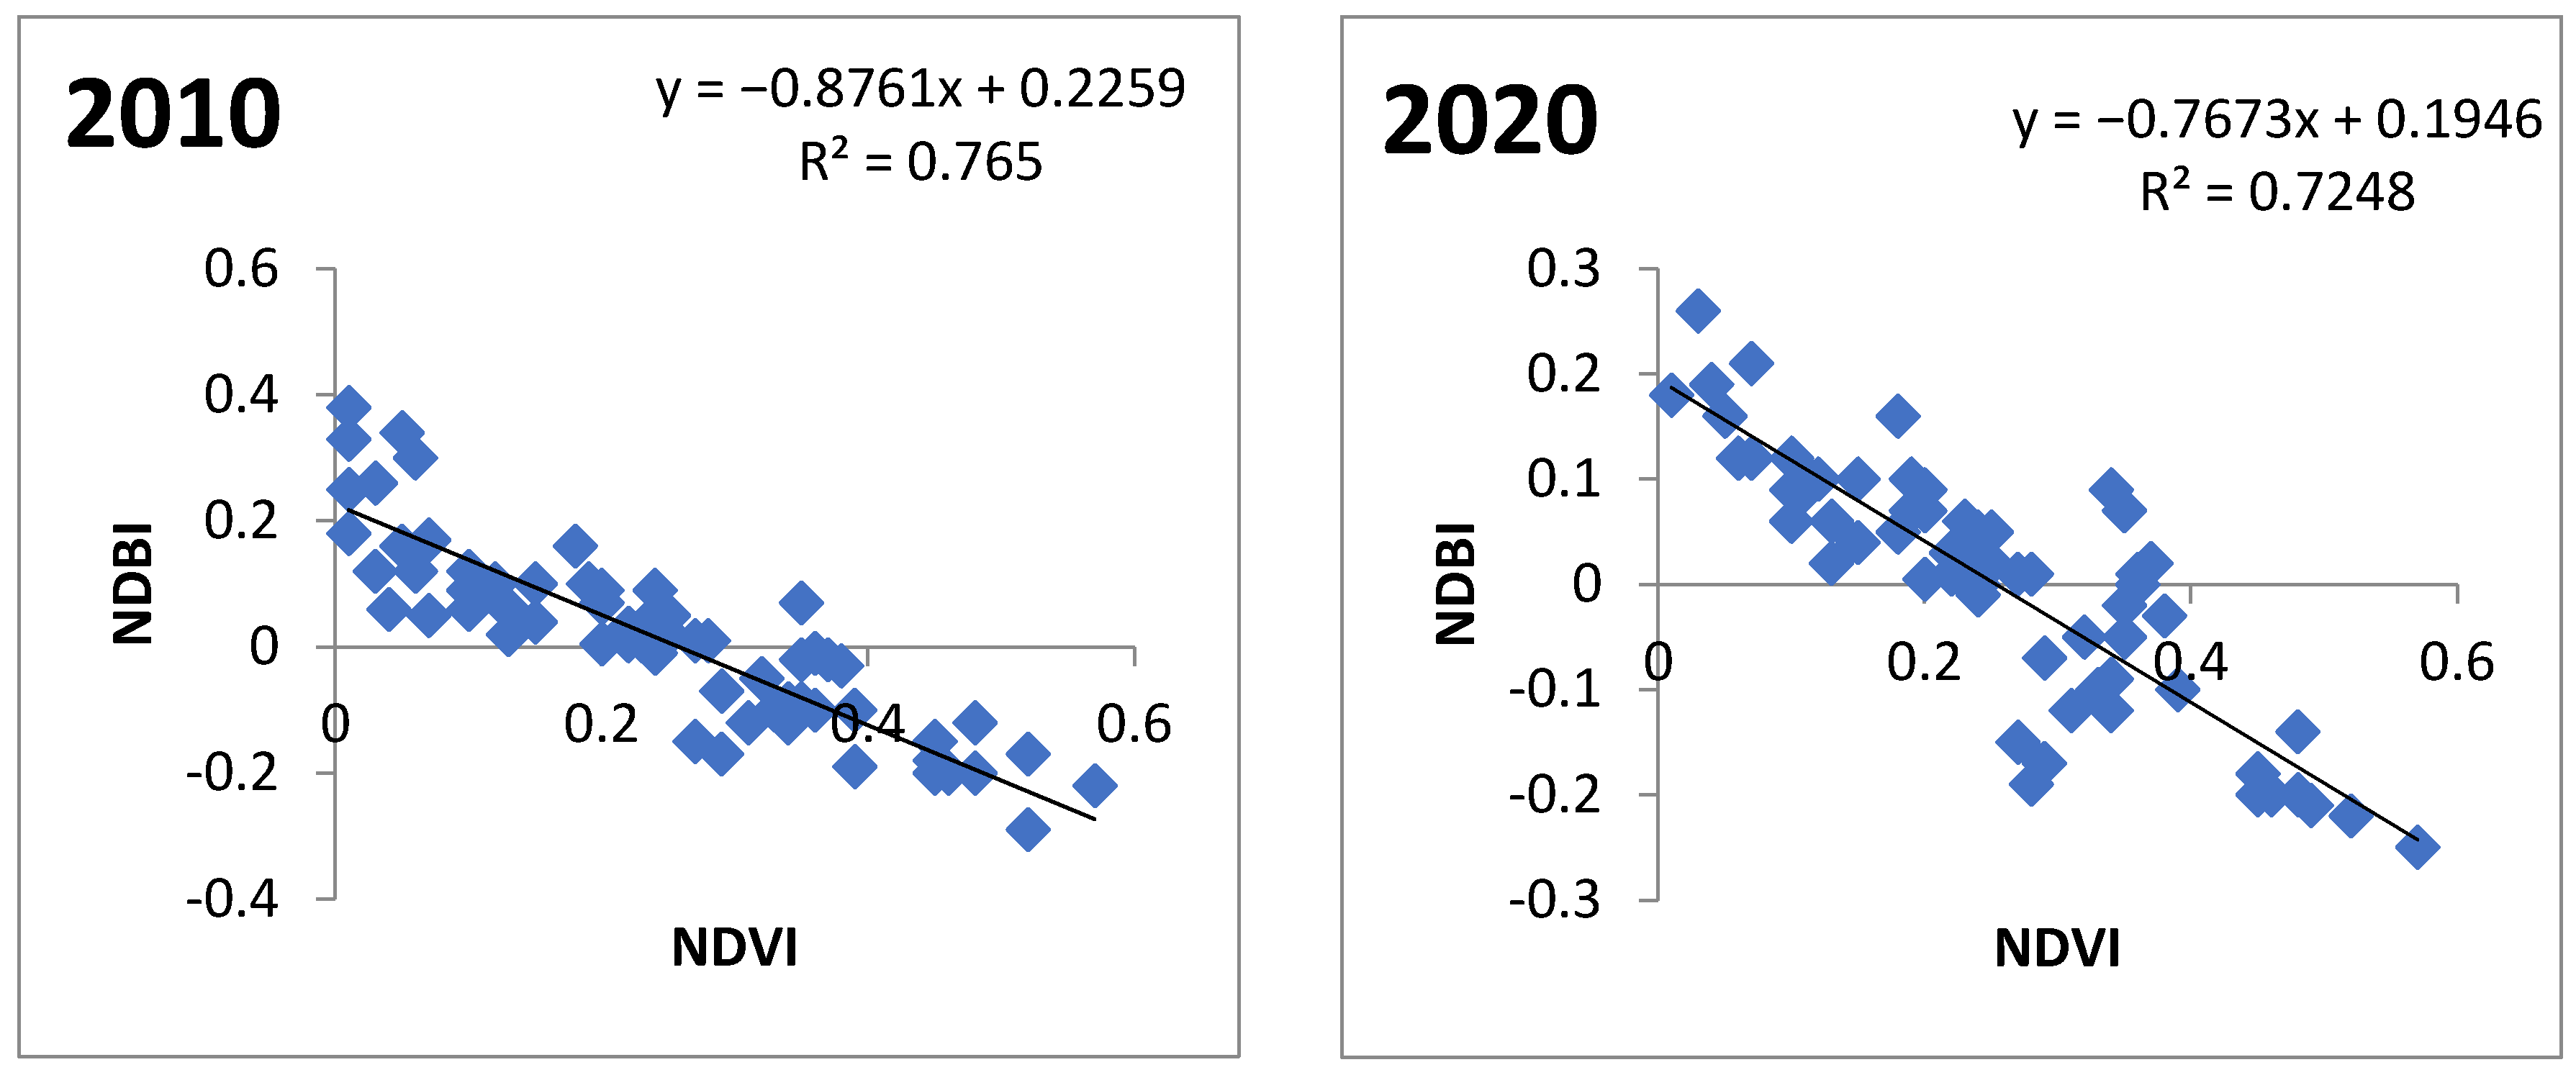
2.4. Assessment of NDVI and NDBI

The variations in the land cover encompassing vegetation for the considered study years (1990, 2000, 2010, 2020) were assessed by calculating and analyzing the NDVI. This remote sensing index to seek vegetation health is calculated as follows [58]:
NDVI = NIR RED   NIR + RED  
where NIR represents near-infrared radiation band (TM band 4; OLI and ETM band 5), and RED represents the red radiation band (TM band 3; OLI and ETM band 4).
Likewise, the NDBI was used for built-up determination in the study area. The NDBI was obtained by using Arc GIS 10.1 software, and the following formula, as communicated by [59]:
NDBI = MIR NIR MIR + MIR
where MIR represents the central infra-red band (TM band 5; OLI and ETM band 6), and NIR depicts the near-infrared band (ETM and TM band 4; OLI band 5). Therefore, the NDVI was used to assess change in the vegetation cover, and the NDBI was used to find variations in the built-up area by using satellite imagery and show expressive standards between −1 and 1.

2.5. Accuracy Estimation

Accuracy can be considered to determine the effectiveness of several image processing methods in the alignment of imagery [59,60]. The error matrix is the greater grouping and has conjoint meaning to existing accuracy outcomes [61]. Numerous statistical procedures of accuracy assessment can find out of the error matrix including the percentage for producers’ accuracy or workers’ accuracy as a total accuracy that reveals the error prepared by coincidence [62].
Overall   accuracy = No .   of   sample   classes   grouped   accurately No .   of   reference   sample   classes    
There should be a maximum standard of assurance for any suitable study outcome in the conclusion of the accuracy assessment. The KHAT standards below determine how a good RS group supports, or how far it is accurate in, the reference facts [35]. The mathematical equation of KHAT is
K = observed   accuracy   chances   of   assessment 1 chances   of   agreement  

3. Results and Discussion

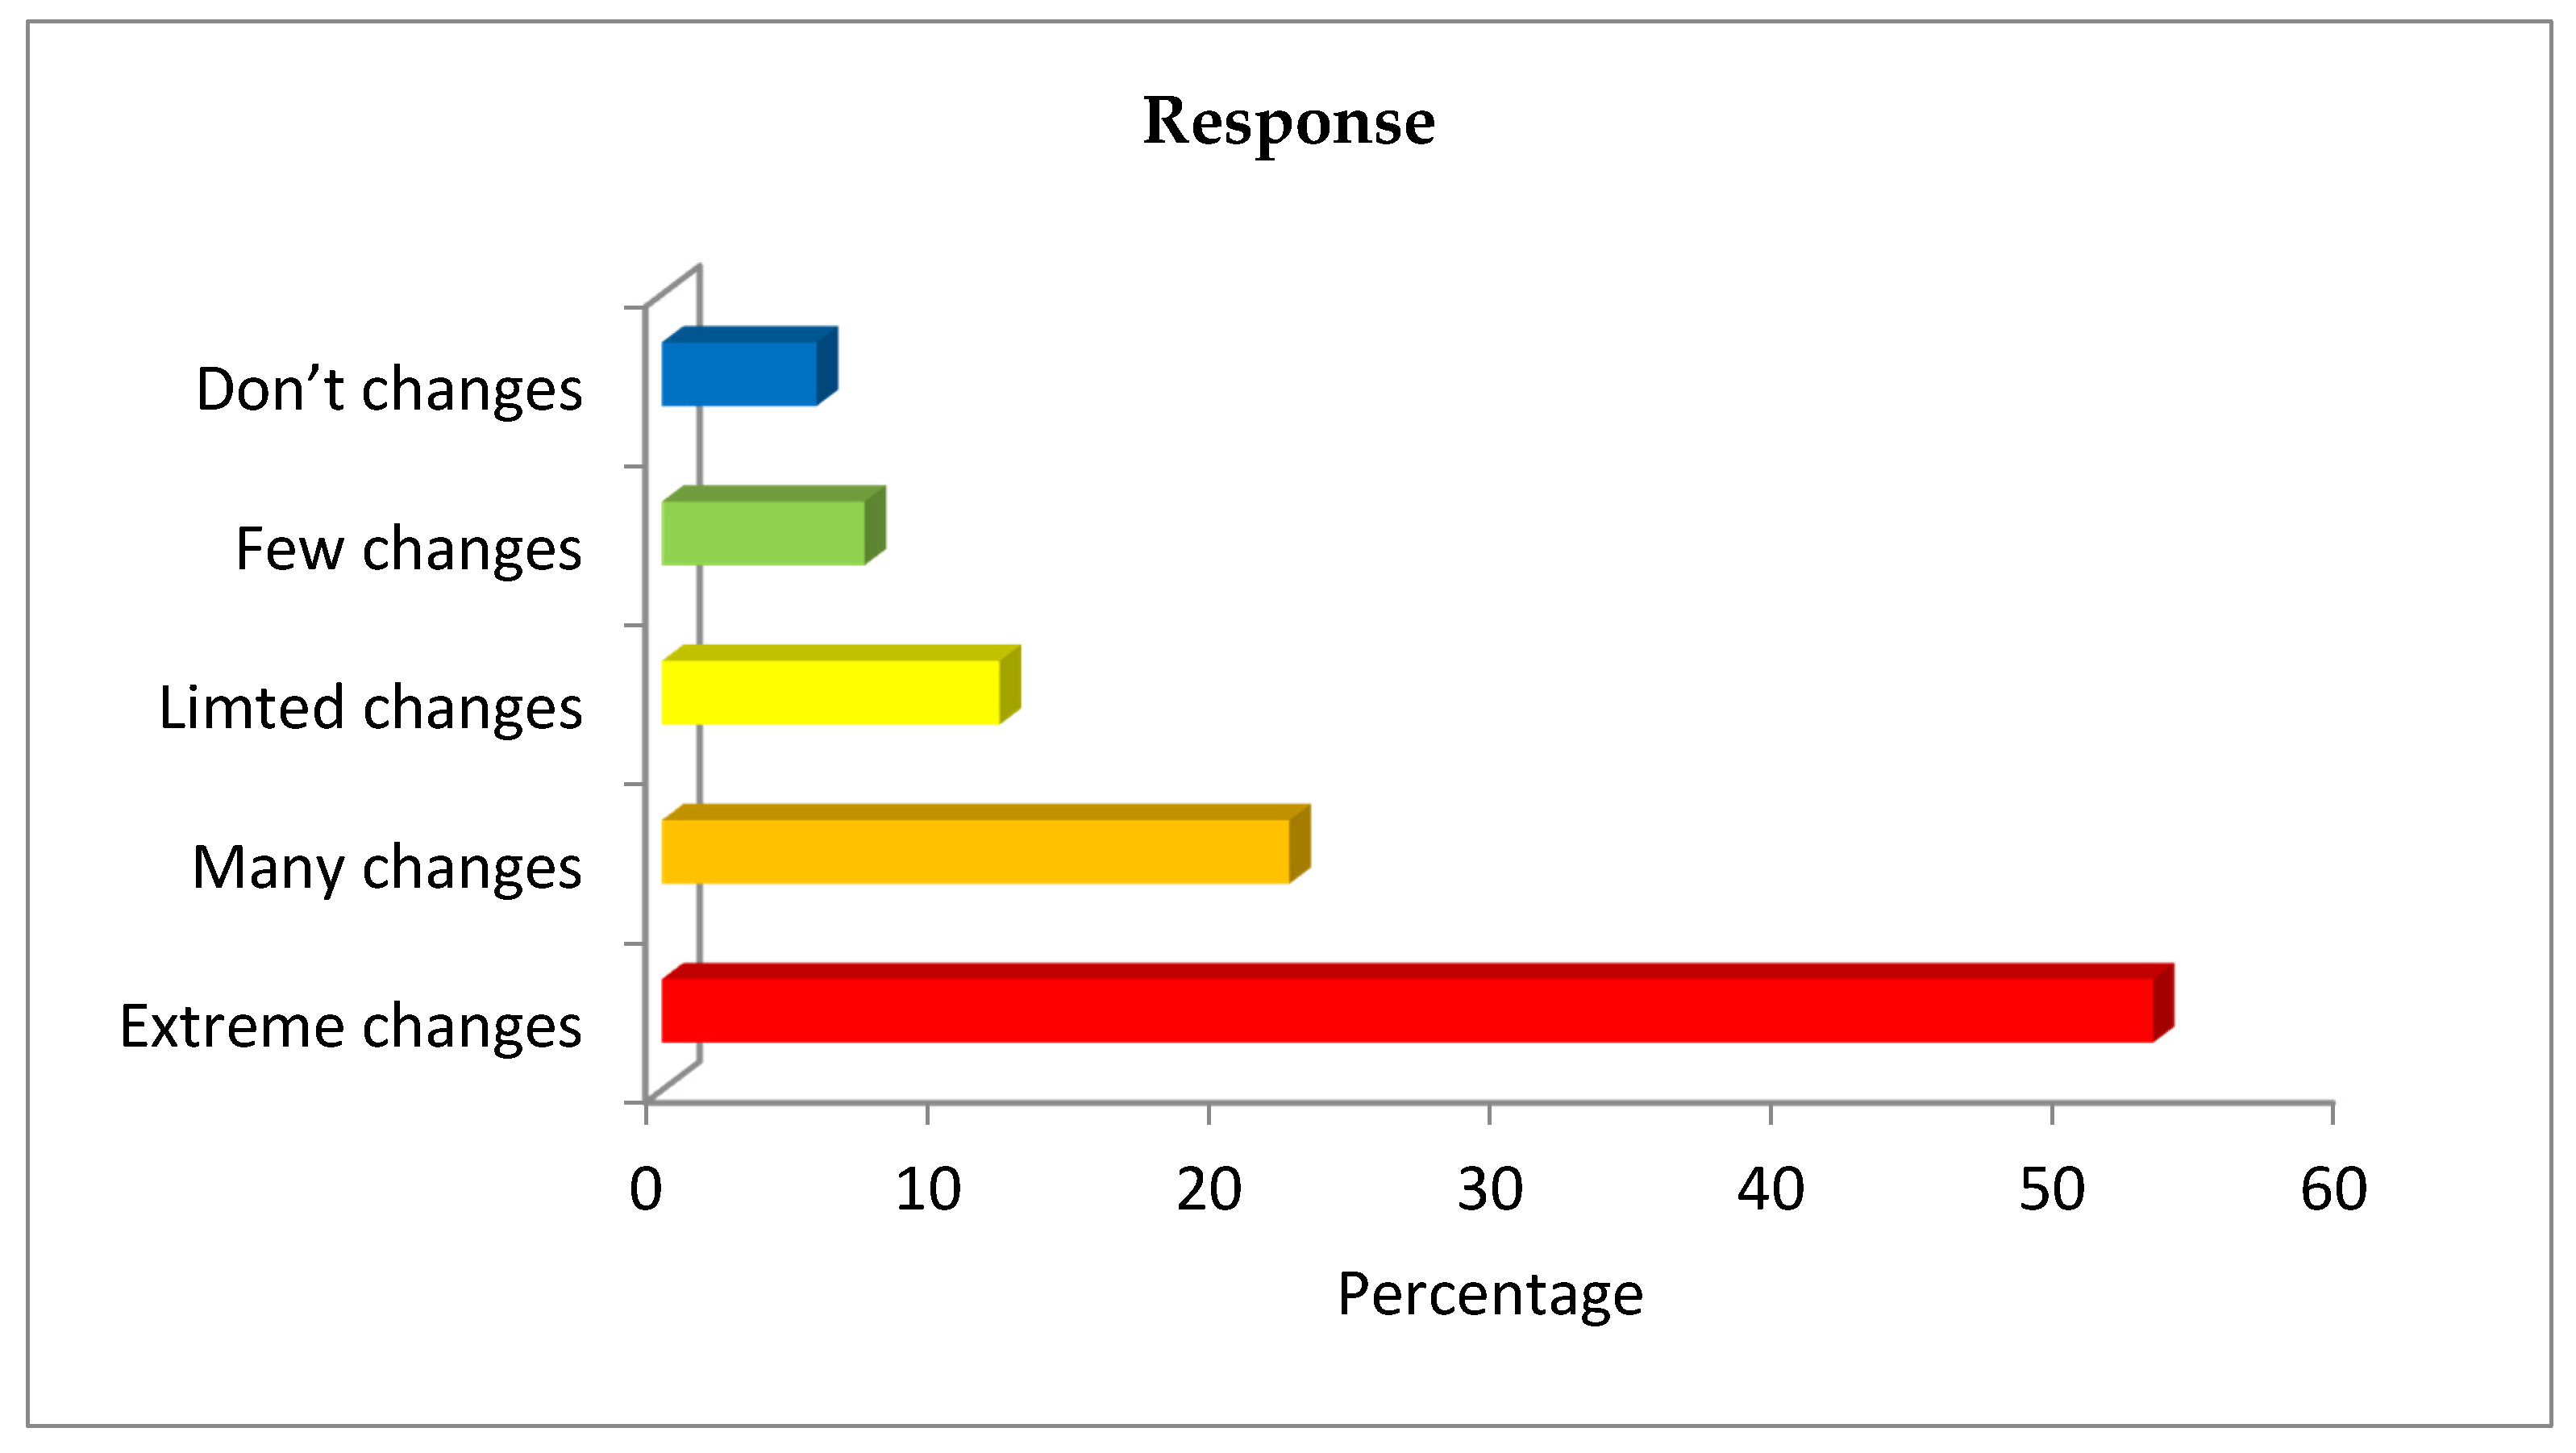
3.1. Farmers’ Perceptions about Temperature and LULC

Farmers were interviewed to obtain their perceptions about climate change, LULC, and their impact on climatic variability, adaptation, and experience stages. Almost all of the farmers (94.5%) stated that climactic change effects were noted and witnessed in Jhelum District (Figure 4).
A total of 54% of the farmers perceived that significant variations have occurred in the rainfall volume, beginning of the planting period, spreading of the harvesting time, and irregular drought circumstances which occasionally happen in the growth phase. The same decreases in rainfall and increasing drought conditions have been reported in other areas of Pakistan [63,64]. About 25% of the farmers supposed that their livings face many fluctuations due to the rise in the temperature in the study area. Only 5.5% perceived no change in climate in the last 30 years. Concerning the temperature variation, 94.5% of the farmers stated that they had practiced different crop varieties in recent years, and only 5.5% carried out something different (see Table 2). However, most of the respondents understood that rainfall has been decreasing in terms of volume and the number of rainy days, while the intensity of rainfall has been increasing, which has brought devastation in the form of floods with the passage of time.
About 63.5% of the farmers observed that water availability has reduced in recent years, while only 32% of the cropped area is irrigated, and 68% is rain-fed land. However, 72% of the irrigation area would boost fertilizer utilization: 28% of the irrigation types recognized the purpose of changing cropping patterns without using fertilizers. Regarding applications to detect climatic pressures perceived by agriculture (irrigation and rainfall), different investigations led on the agriculture type (rainfall duration, number of occurrences of rainfall and its intensity) for the farmers’ actual and scheduled practices found that 36.5% of the informants only observed increases in rainfall, whereas 63.5% observed reductions in rainfall (Table 3). Agricultural practices were documented between two groups of informers, including their association with temperature and rainfall, the ratio of fertilizer usage, and scheduled capitalization on detected occasions.

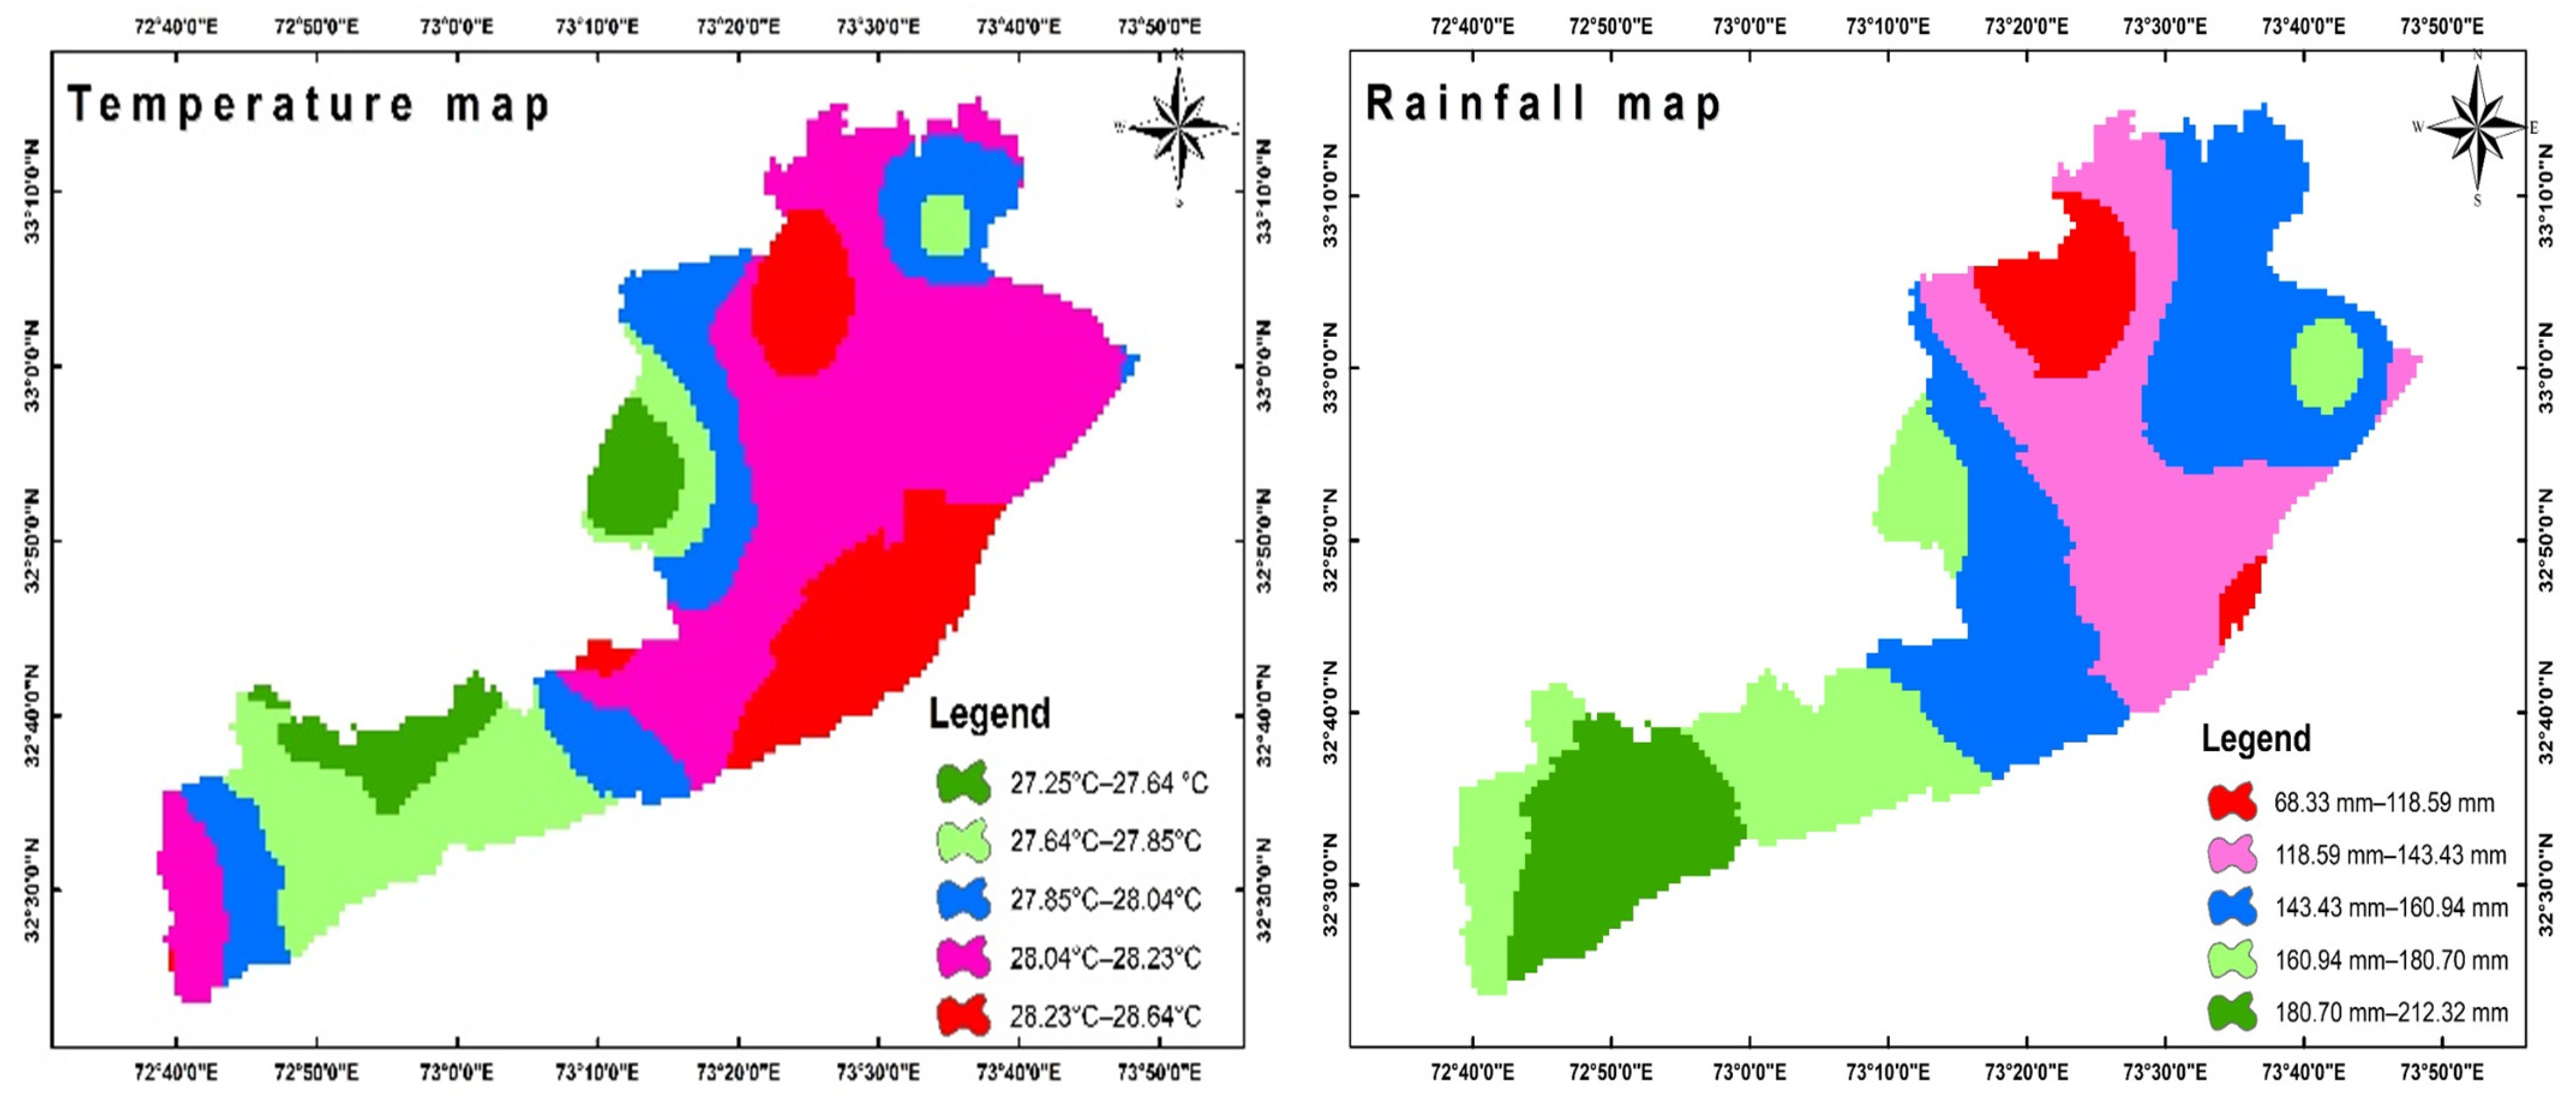
3.2. Climate Factors of the Research Area

Climate variation showed the most substantial influence on the adaptation of LULC categories in numerous regions of the land [41,65,66]. Similarly, alternation in climatic impacts on the biosphere of the land has a close link with hydrological and energy chains, explaining the effect on the vegetation index (VI) where it increases to its highest quantity [67]. In recent years, universal variation in weather has had many influences on vegetation [7,68].
Climate change has a disproportionate influence on the adaptations of LULC types in different parts of the biosphere. Among different climatic aspects, rainfall and temperature were more associated with LULC. Meanwhile, the recorded data of temperature throughout the field investigations along the coordinates were entered into the ArcGIS 10.1 software and afterward interpreted applying inverse distance weighting (IDW), from which the spatial map of temperature was achieved. These maps indicate the temperature change all over the study area, which indicates the cooler and hotter areas in Jhelum District.
Figure 5 represents the average temperature and rainfall maps for Jhelum District. At the same time, the thematic map (presenting the spatio-temporal variation in temperature) and the central area were acquired. The increase in temperature was recorded up to 28.84 °C, and the decrease in temperature was documented as 27.25 °C. Furthermore, it is assumed that the survey points nearby Jhelum District show maximum temperatures. From these particular points, it is confirmed that the lowest temperature was recorded in the water channels (Jhelum River) and forest parts, and, on the other hand, the average temperature was noted in the barren area and plane part. The highest temperature was noted in the built-up parts. The average rainfall and lowest rainfall in our study area are presented in Figure 5. The highest rainfall increased to 212 mm, while the lowest rainfall value documented was 68.33 mm. The rainfall map remarkably indicates that the maximum rainfall was recorded in Tehsil Pind Dadan Khan. It can be observed that maximum rainfall was recorded in areas such as vegetation area and forest land.

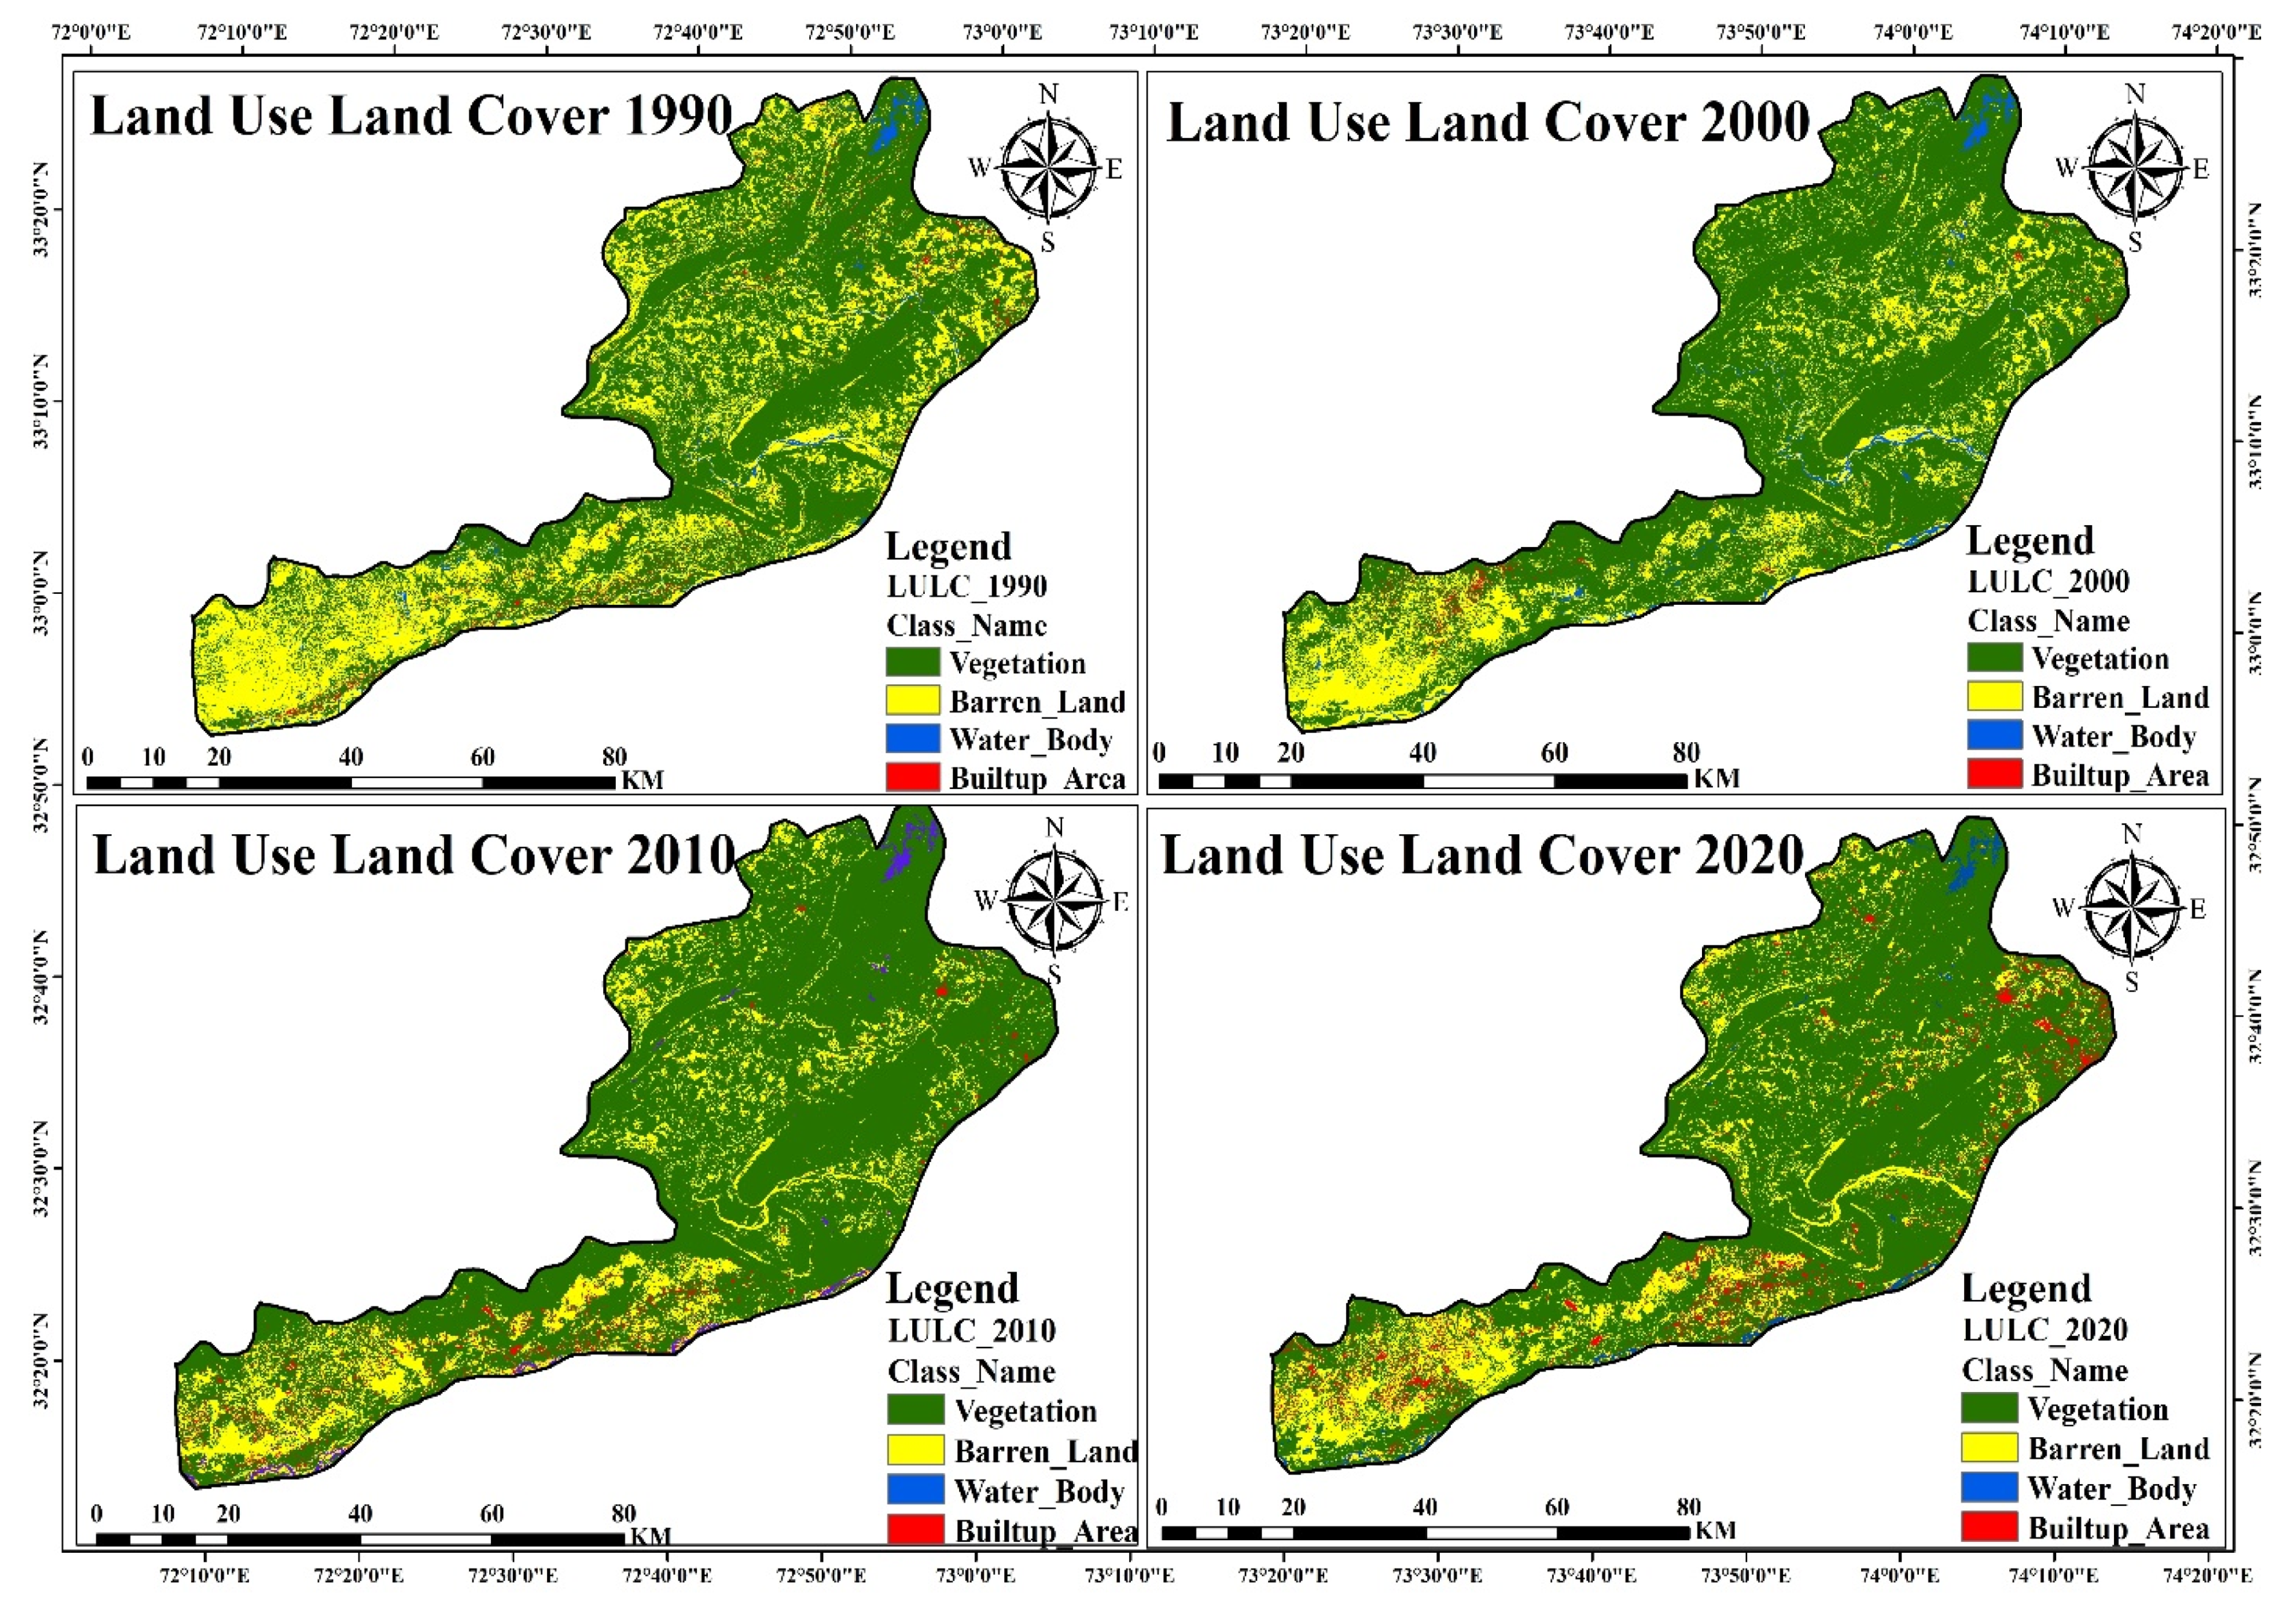
3.3. LULC Change Detection

LULC types with the highest and lowest variations in LULC were assessed at all levels to find out the maximum relative variation over the last 30 years in Jhelum District. The supervised classification analysis indicated that the research district was protected with different land topographies (forest, cultivated area, water, built-up land, and barren land)—the classification arrangement of LULC was carried out by applying surveys with GIS information from Jhelum. Training sites for supervised classification were selected based on different GPS-based samples taken from the field for each land use–land cover class. Then, those GPS locations were plotted on images, and signatures were saved to perform supervised classification using the iso-cluster algorithm. From 1990, cultivated area was 49.54%, followed by water (9.61%); covered area by built-up area was 1.95%; and barren land covered about 31.79%. However, in 2020, forest and cultivated area were 3.36% and 63.39%, followed by water (4.09%); covered area by built-up area was 3.50%; and barren land covered about 25.65%, as presented in Figure 6.
Built-up area in the year 1990 covered 1.95% overall, while in the year 2020, built-up area expanded up to 3.5%, compared to the year 1990. However, there was a massive expansion of built-up areas with significant proliferation from 1990 to 2020 (Table 4). Barren area in 1990 covered 31.79%, while in 2020, barren land reduced (25.65%) compared to 1990. It was estimated that bare land changed to housing colonies, commercial parts, and roads. Water channels covered one of the smallest areas among all the categories for Jhelum (9.61%, 8.51%, 6.30%, and 4.09% in 1990, 2000, 2010, and 2020, respectively).
In the current attempt, LULC categories with the lowest and highest variations in LULC were nominated by minimum and maximum standards to categorize the comprehensive relative change during the past 30 years in Jhelum. There are several smaller colonies that have settled along the central highway and nearby Jhelum District. The total number of these colonies is more than 50 in Jhelum District. The estimated area of the mentioned colonies ranges from 4 to 6 acres. The spread of housing colonies along main roads is an indication of urban expansion in the studied district. Change discovery aims to recognize which LULC expanded or reduced over the past 30 years, and which land uses changed into another LULC category. The results of [69] showed that in recent years, there has been an increase in built-up areas, whereas the ratio of increase for the occupied area was slightly smaller, which is estimated to directly produce a fast rise in the expansion of urban areas in future years, resulting in a reduction in the vegetative area.

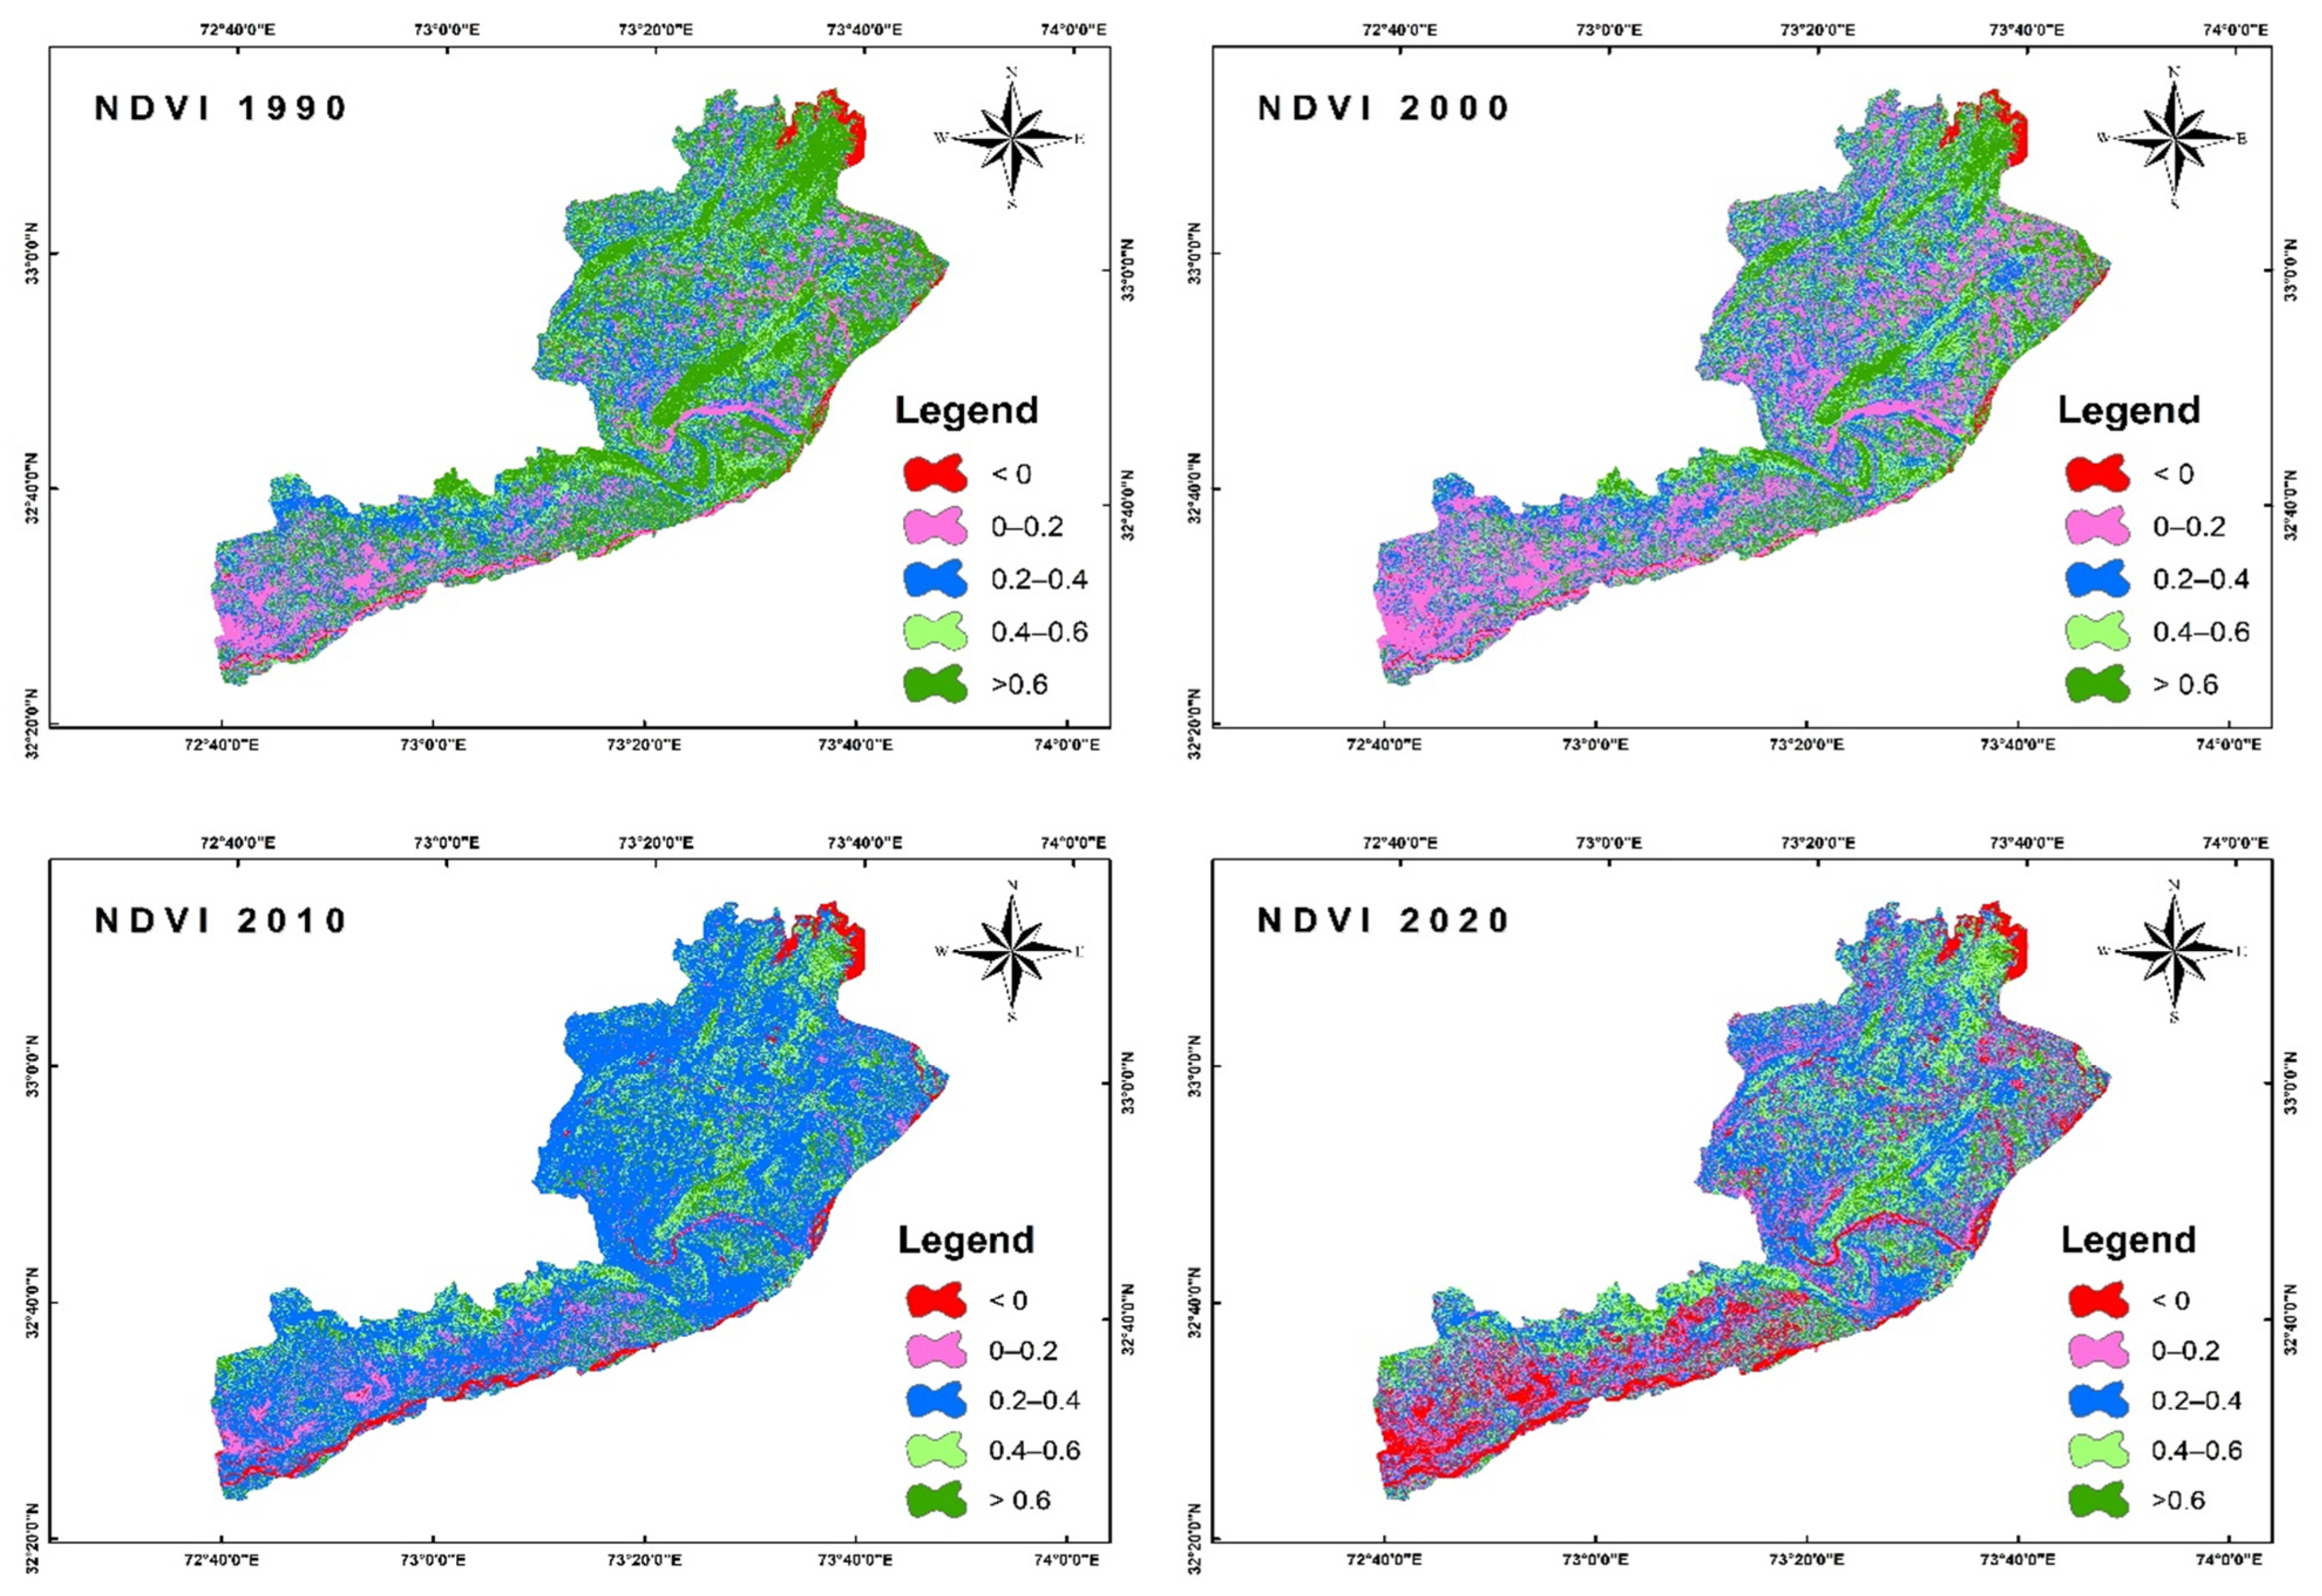
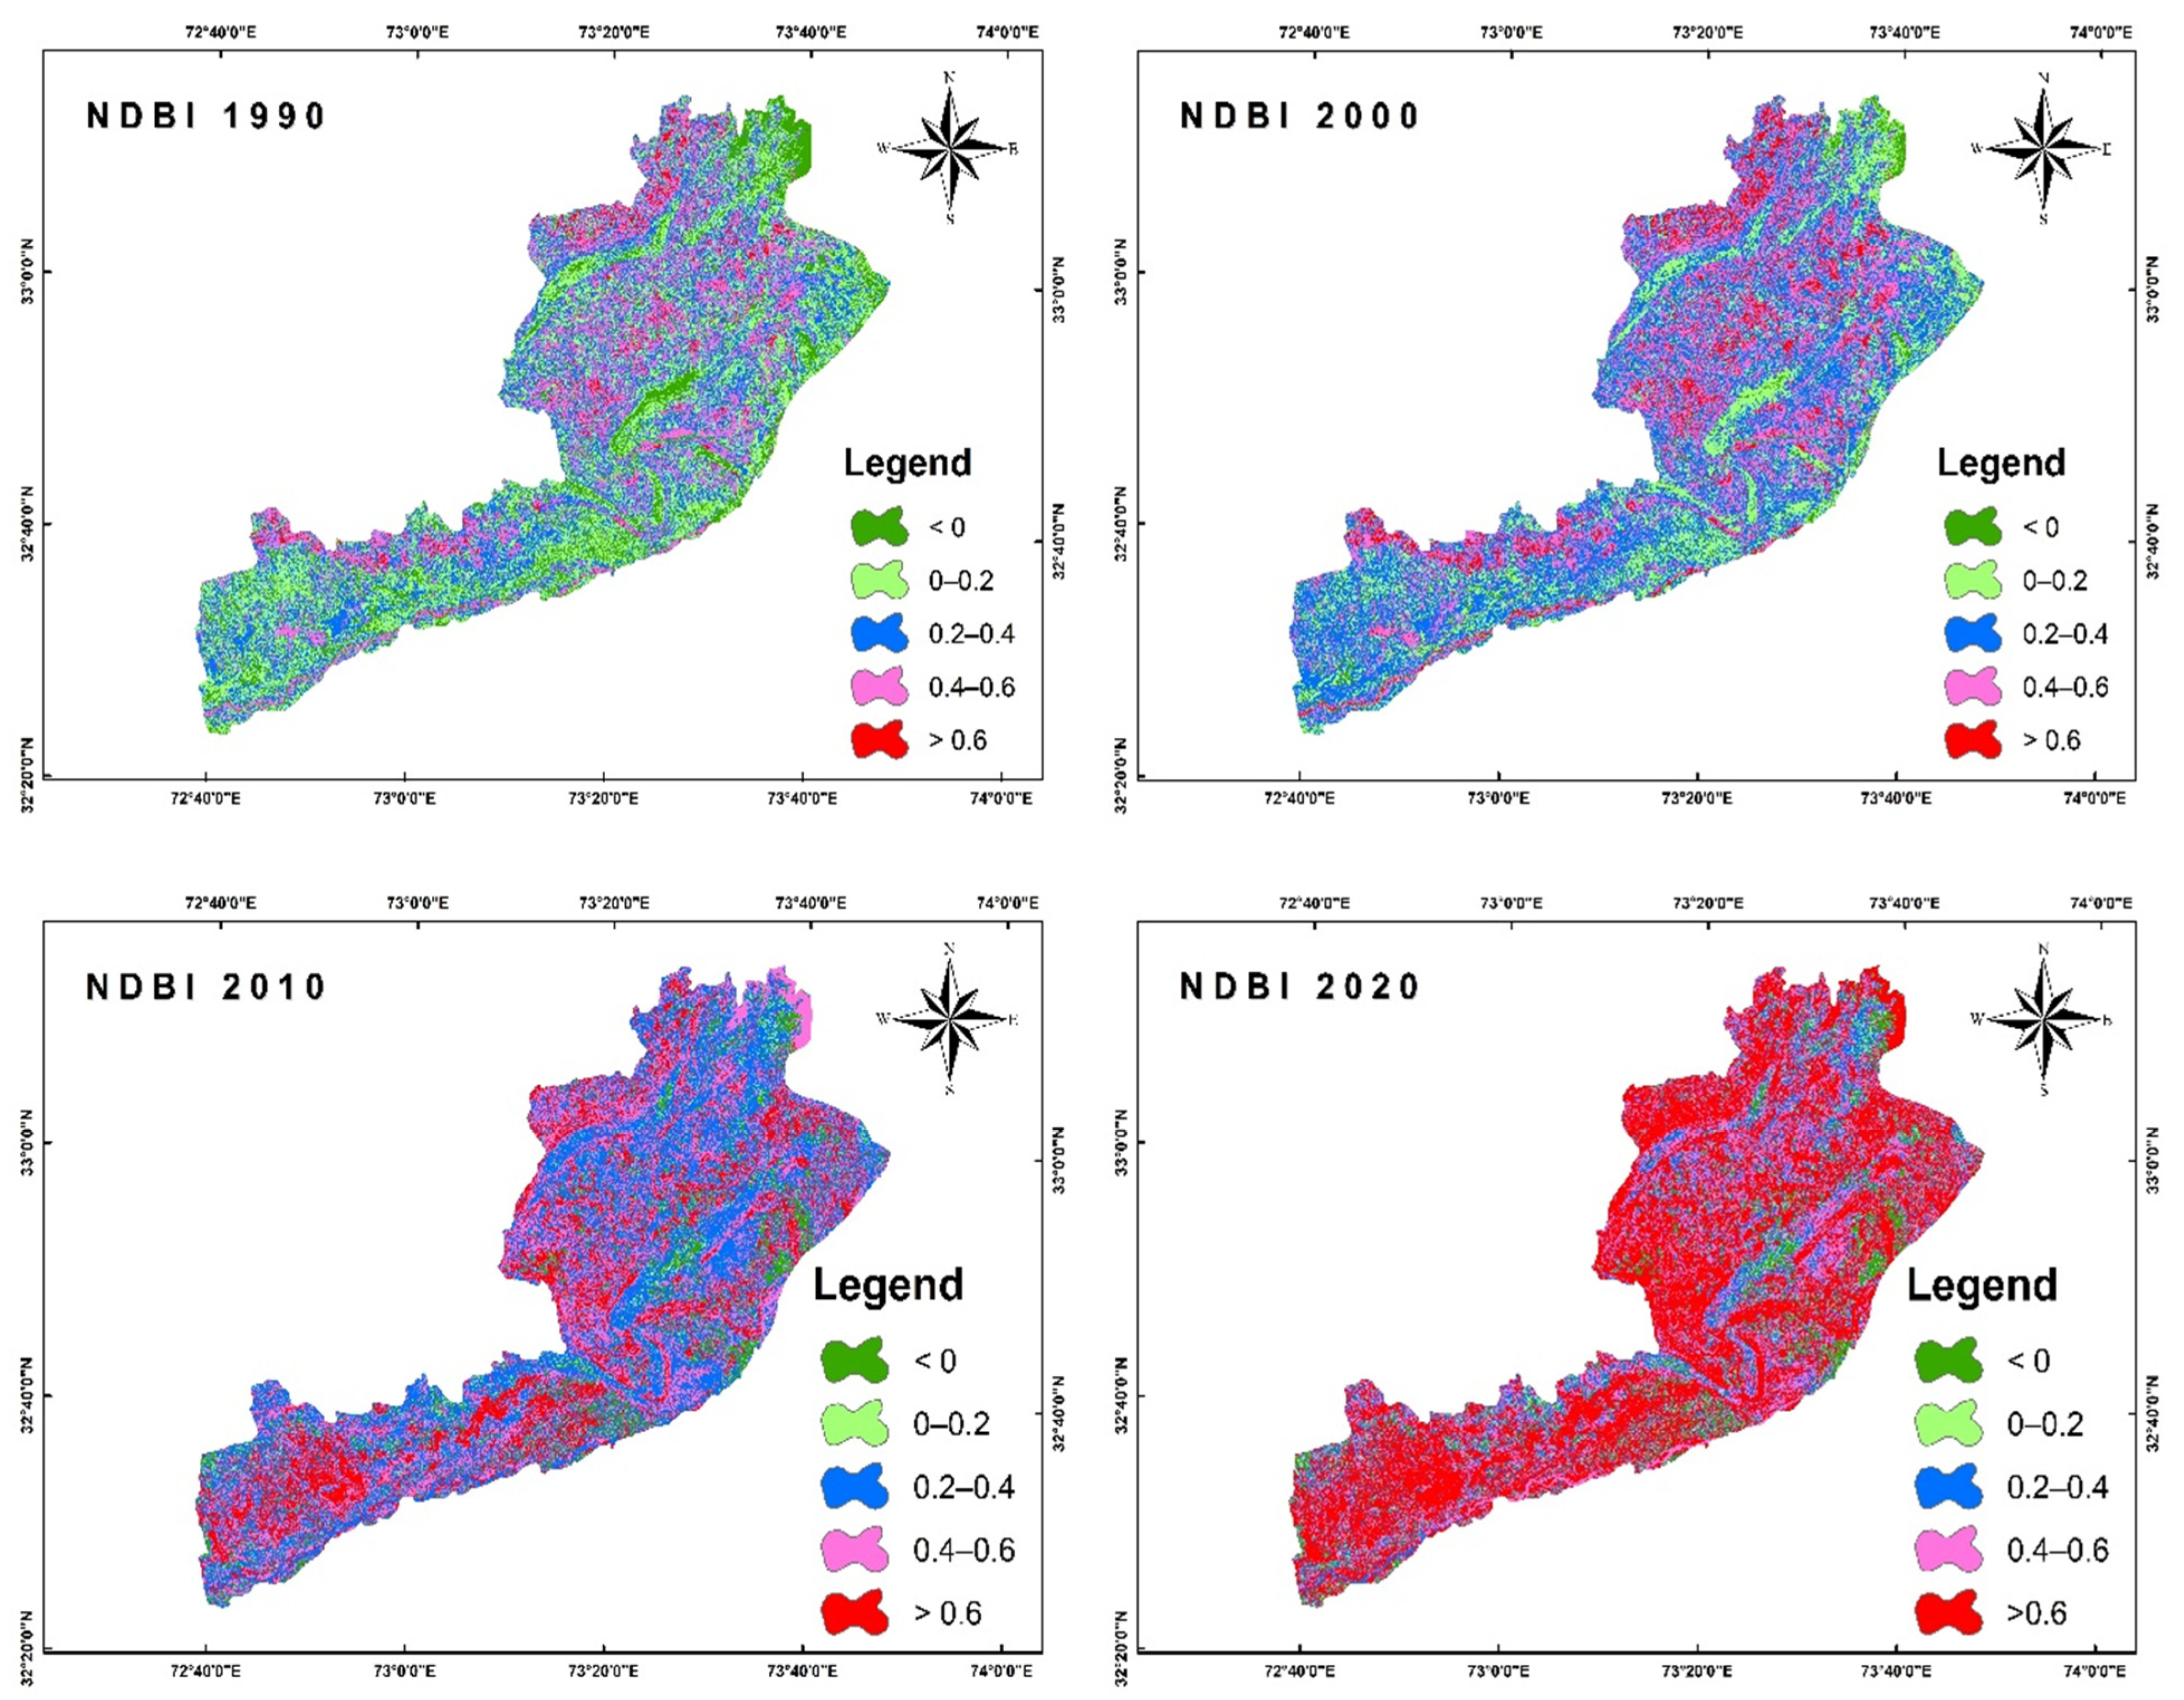
3.4. The NDVI and NDBI

The standards of the NDVI are an indication of the volume of chlorophyll content existing in vegetation, where the highest NDVI values depict healthy and thick vegetation, whilst the lowest NDVI values represent thin vegetation. From the study of Jhelum District, NDVI standards in 1990 varied from maximum value of +0.86 to −0.12, whereas during 2000, the same varied from +0.75 to −0.17, and in 2010, the NDVI value showed the minimum value, which was −0.28, while the maximum was +0.62, whilst in 2020, the NDVI displayed the minimum value, of −0.32, and the maximum was +0.56 (Table 4). As averages, NDVI values were detected as 0.37, 0.29, 0.17, and 0.12 for 1990, 2000, 2010, and 2020, respectively. The NDVI of Jhelum District was at its maximum in 1990 at +0.86, and during 2020, it was −0.32, which determines the NDVI classes representing the spatial arrangement of vegetative and green zones found on the map, which displays the creative and best vegetative areas for cultivation as forest and vegetative land (Figure 7).
Figure 8 indicates the extracted NDBI classes demonstrating the spatial arrangement of built-up and water land for 1990, 2000, 2010, and 2020. Average NDBI values were observed to be 0.04, 0.15, 0.19, and 0.27 for 1990, 2000, 2010, and 2020, respectively. Likewise, NDBI standards for Jhelum District were greater in 2020 at +0.72 and lowest in 1990 at −0.36. In Figure 8, the maps show that the red zones were found to be the minimum vegetative land areas, such as water channels, built-up area, and bare land. The NDBI was linked to the temperature, where the values for the NDVI were greater in regions with maximum temperature areas.
Linear regression analysis was applied to create a link between the NDBI and NDVI. First, regression analysis (R2) was conducted to determine how variations in the LU intensity within the LULC unit differ over space and pass the intra-LU change of the NDBI. However, a negative association between the NDVI and NDBI can be presented, with a correlation coefficient of R2 = 0.82 for 1990, 0.79 for 2000, 0.76 for 2010, and 0.72 for 2020 shown in all imagery between the vegetation index (NDVI) and NDBI-derived built-up portions, as shown in Figure 9. Furthermore, the regression analysis indicated that in the given areas where the NDBI values were the highest, the NDVI values were the lowest.
The NDVI is generally applied in all vegetation indices established, and its progress is due to random dissimilarity, as stated by [70]. However, due to specific driving factors such as the local temperature, it is recognized that the link to the NDBI powerfully affects the land surface temperature (LST), followed by main roads and LULC [45]. All the calculated NDVI and NDBI values of the considered study area and duration are presented in Table 5.

3.5. Accuracy Assessment

Table 6 shows the producer and consumer accuracy outcomes with KHAT (k) values in 1990, 2000, 2010, and 2020 in Jhelum District. The maximum producer and consumer accuracies from the cultivated area remained 88% and 92%, respectively. Additionally, the maximum producer and user accuracies of built-up land were 89.5% and 88.8%, respectively. The average producer and user accuracies were 83.2% and 88.8% for 1990, 88.1% and 85.7% for 2000, 86.5% and 86.7% for 2010, and 85.6% and 87.3% for 2020, respectively, in Jhelum District. The overall accuracy for grouping is 0.93% for 1990, 0.87% for 2000, 0.91% for 2010, and 0.88% for 2020 (Table 6).
The KHAT (K) coefficients for 1990, 2000, 2010, and 2020 are 0.86, 0.82, 0.89, and 0.85, respectively, in the research area. The accuracy classification was stated as both the consumers’ accuracy and producers’ accuracy [67,71]. According to [72], the producers’ accuracy is described as the quantity of land types properly categorized in the classification of the imagery, whereas the consumers’ accuracy is the possibility that a type in the classification of imagery is precise when applied on the land.

4. Conclusions

The current research was conducted in Jhelum District, Punjab (Pakistan), to determine the impact of climatic variations and LULC changes. The livelihood of the farmers in the study area is entirely dependent on agriculture and linked with normal temperatures and rainfall. However, fluctuations in the normal temperature resulted in a shortage of rains, an increase in drought events, and a decrease in water availability for irrigation, hence directly affecting the agrarian community and farming inventions. The increasing temperature and reduced water availability for irrigation due to less rainfall are considered as serious concerns in the study area. Growers are conscious about the climatic fluctuations and familiarize themselves with approaches to manage the impacts but need government support. The outcomes show that the vegetation section contributes an extra grounded constructive link with the NDVI for all the levels, as open area and built-up land negatively associated with LULC and the NDVI during the last 30 years. On average, NDBI and NDVI standards were recorded between 0.37 and 0.12, and 0.04 and 0.27, from 1990 to 2020, respectively, whereas average producer and user accuracies were 83.2% and 88.8% for 1990, 88.1% and 85.7% for 2000, 86.5% and 86.7% for 2010, and 85.6% and 87.3% for 2020. Accordingly, the “Kappa coefficients” for 1990, 2000, 2010, and 2020 were 0.86, 0.82, 0.89, and 0.85, respectively, in the study area. “Barren land” in 1990 occupied the class with 31.79%, but in 2020, it decreased (25.65%) compared to 1990. The outcome indicates that the bare land transformed into housing areas and roads. Water covered 9.61% in 1990, but it remarkably reduced (5.52%) in 2020 compared to 1990 in Jhelum District.
It is concluded that LULC changes are significant for a comprehensive series of uses, comprising temperature, soil destruction, and land planning events. There were main variations in barren land, water channels, and vegetative areas across the studied temporal gradient due to the increasing human influence in acquiring arable lands. The research outcome shows the main observational base for regular inspections of variations in land supervision and will prove helpful for policy makers to improve strategies to manage land capitals efficiently.

Author Contributions

Conceptualization: M.M., A.T., M.M.A. and A.M.K.; methodology: M.M., S.H., F.M., A.T., A.M.K., G.R. and M.M.A.; data curation: M.M., M.F., A.Z., M.A., S.A., A.T., M.W., K.F. and M.F.; validation: A.T., A.M.K. and F.M.; formal analysis: A.T., M.M., S.S. and S.H.; investigation: M.M. and A.M.K.; project administration: A.T., M.M.A., A.M.K. and L.Z.; resources: M.M., A.T., F.A. and L.Z.; software: A.T., M.M., A.Z., M.A., S.A., M.W. and K.F.; visualization: A.T., L.Z., M.F. and G.R.; writing—original draft preparation: A.T., M.M. and A.M.K.; writing—review and editing: A.T., M.M.A. and G.R.; supervision: M.M.A., A.M.K., A.T. and F.A. All authors have read and agreed to the published version of the manuscript.

Funding

This study was supported by the National Natural Science Foundation of China (grant number 41907192) and the Civil aerospace pre-research project (D040102).

Institutional Review Board Statement

Not applicable.

Informed Consent Statement

Not applicable.

Data Availability Statement

The data presented in this study are available on request from the first or corresponding authors.

Acknowledgments

This is part of the PhD research work of the first author. We are thankful to all the study participants who generously shared their perceptions about the climatic variations and their impacts in the study area.

Conflicts of Interest

The authors declare that they have no conflict of interest.

References

  1. Hussain, S. Land Use/Land Cover Classification by Using Satellite NDVI Tool for Sustainable Water and Climate Change in Southern Punjab. COMSATS Univ. Islamabad 2018. [Google Scholar] [CrossRef]
  2. Hassan, Z.; Shabbir, R.; Ahmad, S.S.; Malik, A.H.; Aziz, N.; Butt, A.; Erum, S. Dynamics of land use and land cover change (LULCC) using geospatial techniques: A case study of Islamabad Pakistan. SpringerPlus 2016, 5, 1–11. [Google Scholar] [CrossRef] [Green Version]
  3. Giri, C.; Zhu, Z.; Reed, B. A comparative analysis of the Global Land Cover 2000 and MODIS land cover data sets. Remote Sens. Environ. 2005, 94, 123–132. [Google Scholar] [CrossRef]
  4. Tewabe, D.; Fentahun, T. Assessing land use and land cover change detection using remote sensing in the Lake Tana Basin, Northwest Ethiopia. Cogent. Environ. Sci. 2020, 6, 1778998. [Google Scholar] [CrossRef]
  5. Foody, G.M. Status of land cover classification accuracy assessment. Remote Sens. Environ. 2002, 80, 185–201. [Google Scholar] [CrossRef]
  6. Mannan, A.; Liu, J.; Zhongke, F.; Khan, T.U.; Saeed, S.; Mukete, B.; Shen, C.Y. Application of land-use/land cover changes in monitoring and projecting forest biomass carbon loss in Pakistan. Glob. Ecol. Conserv. 2019, 17, e00535. [Google Scholar] [CrossRef]
  7. Zoungrana, B.J.; Conrad, C.; Thiel, M.; Amekudzi, L.K.; Da, E.D. MODIS NDVI trends and fractional land cover change for improved assessments of vegetation degradation in Burkina Faso, West Africa. J. Arid. Environ. 2018, 153, 66–75. [Google Scholar] [CrossRef]
  8. Abid, M.; Schilling, J.; Scheffran, J.; Zulfiqar, F. Climate change vulnerability, adaptation and risk perceptions at farm level in Punjab, Pakistan. Sci. Total Environ. 2016, 547, 447–460. [Google Scholar] [CrossRef] [PubMed]
  9. Hussain, M.; Liu, G.; Yousaf, B.; Ahmed, R.; Uzma, F.; Ali, M.U.; Ullah, H.; Butt, A.R. Regional and sectorial assessment on climate-change in Pakistan: Social norms and indigenous perceptions on climate-change adaptation and mitigation in relation to global context. J. Clean. Prod. 2018, 200, 791–808. [Google Scholar] [CrossRef]
  10. Hammad, H.M.; Abbas, F.; Saeed, S.; Fahad, S.; Cerdà, A.; Farhad, W.; Bakhat, H.F. Offsetting land degradation through nitrogen and water management during maize cultivation under arid conditions. Land Degrad. Dev. 2018, 29, 1366–1375. [Google Scholar] [CrossRef]
  11. Abate, N.; Kibret, K. Detecting and quantifying land use/land cover dynamics in Wadla Delanta Massif, northcentral highlands of Ethiopia. Ethio. J. Environ. Stud. Manag. 2016, 9, 450–469. [Google Scholar] [CrossRef]
  12. Udin, W.S.; Zahuri, Z.N. Land use and land cover detection by different classification systems using remotely sensed data of Kuala Tiga, Tanah Merah Kelantan, Malaysia. J. Trop. Resour. Sustain. Sci. 2017, 5, 145–151. [Google Scholar]
  13. Zaidi, S.M.; Akbari, A.; Abu, S.A.; Kong, N.S.; Gisen, A.; Isabella, J. Landsat-5 time series analysis for land use/land cover change detection using NDVI and semi-supervised classification techniques. Pol. J. Environ. Stud. 2017, 26, 2833–2840. [Google Scholar] [CrossRef]
  14. Solaimani, K.; Arekhi, M.; Tamartash, R.; Miryaghobzadeh, M. Land use/cover change detection based on remote sensing data (a case study; Neka Basin). Agric. Biol. J. N. Am. 2010, 1, 1148–1157. [Google Scholar] [CrossRef]
  15. Aredehey, G.; Mezgebu, A.; Girma, A. Land-use land-cover classification analysis of Giba catchment using hyper temporal MODIS NDVI satellite images. Int. J. Remote Sens. 2018, 39, 810–821. [Google Scholar] [CrossRef]
  16. Mohamed, S.A.; El-Raey, M.E. Land cover classification and change detection analysis of Qaroun and Wadi El-Rayyan lakes using multi-temporal remotely sensed imagery. Environ. Monit. Assess. 2019, 191, 1–9. [Google Scholar] [CrossRef]
  17. Maviza, A.; Ahmed, F. Analysis of past and future multi-temporal land use and land cover changes in the semi-arid Upper-Mzingwane sub-catchment in the Matabeleland south province of Zimbabwe. Int. J. Remote Sens. 2020, 41, 5206–5227. [Google Scholar] [CrossRef]
  18. Butt, A.; Shabbir, R.; Ahmad, S.S.; Aziz, N. Land use change mapping and analysis using remote sensing and GIS: A case study of Simly watershed, Islamabad, Pakistan. Egypt J. Remote Sens. Space Sci. 2015, 18, 251–259. [Google Scholar] [CrossRef] [Green Version]
  19. Liang, S.Z.; Ma, W.D.; Sui, X.Y.; Yao, H.M.; Li, H.Z.; Liu, T.; Wang, M. Extracting the spatiotemporal pattern of cropping systems from NDVI time series using a combination of the spline and HANTS Algorithms: A case study for Shandong Province. Can. J. Remote Sens. 2017, 43, 1–15. [Google Scholar] [CrossRef]
  20. Reddy, A.S.; Reddy, M.J. NDVI based assessment of land use land cover dynamics in a rainfed watershed using remote sensing and GIS. Int. J. Sci. Eng. Res. 2013, 4, 87–93. [Google Scholar]
  21. Rahman, M.T.U.; Tabassum, F.; Rasheduzzaman, M.; Saba, H.; Sarkar, L.; Ferdous, J.; Uddin, S.Z.; Islam, Z. Temporal dynamics of land use/ land cover change and its prediction using CAANN model for southwestern coastal Bangladesh. Environ. Monit. Assess. 2017, 189, 565. [Google Scholar] [CrossRef] [PubMed]
  22. Macedo, M.N.; DeFries, R.S.; Morton, D.C.; Stickler, C.M.; Galford, G.L.; Shimabukuro, Y.E. Decoupling of deforestation and soy production in the southern Amazon during the late 2000s. Proc. Natl. Acad. Sci. USA 2012, 109, 1341–1346. [Google Scholar] [CrossRef] [PubMed] [Green Version]
  23. Hietala-Koivu, R.; Lankoski, J.; Tarmi, S. Loss of biodiversity and its social cost in an agricultural landscape. Agric. Ecosyst. Environ. 2004, 103, 75–83. [Google Scholar] [CrossRef]
  24. Xu, X.; Xie, Y.; Qi, K.; Luo, Z.; Wang, X. Detecting the response of bird communities and biodiversity to habitat loss and fragmentation due to urbanization. Sci. Total Environ. 2018, 624, 1561–1576. [Google Scholar] [CrossRef] [PubMed]
  25. Velastegui-Montoya, A.; Lima, A.D.; Adami, M. Multitemporal Analysis of Deforestation in Response to the Construction of the Tucuruí Dam. ISPRS Int. J. Geo-Inform. 2020, 9, 583. [Google Scholar] [CrossRef]
  26. Llerena-Montoya, S.; Velastegui-Montoya, A.; Zhirzhan-Azanza, B.; Herrera-Matamoros, V.; Adami, M.; de Lima, A.; Moscoso-Silva, F.; Encalada, L. Multitemporal Analysis of Land Use and Land Cover within an Oil Block in the Ecuadorian Amazon. ISPRS Int. J. Geo-Inform. 2021, 10, 191. [Google Scholar] [CrossRef]
  27. Ahmad, F. A review of remote sensing data change detection: Comparison of Faisalabad and Multan Districts, Punjab Province, Pakistan. J. Geogr. Reg. Plan. 2012, 5, 236–251. [Google Scholar] [CrossRef]
  28. Ahmad, F. Pixel purity index algorithm and dimensional visualization for ETM+ image analysis: A case of district Vehari. Glob. J. Hum. Soc. Sci. Arts Hum. 2012, 12, 76–82. [Google Scholar]
  29. Lambin, E.F.; Geist, H.J.; Lepers, E. Dynamics of land-use and landcover change in tropical regions. Annu. Rev. Environ. Resour. 2003, 28, 205–241. [Google Scholar] [CrossRef] [Green Version]
  30. Harris, A.; Carrb, A.S.; Dashc, J. Remote sensing of vegetation cover dynamics and resilience across Southern Africa. Int. J. Appl. Earth Obs. Geoinf. 2014, 28, 131–139. [Google Scholar] [CrossRef]
  31. Lunetta, R.S.; Knight, J.F.; Ediriwickrema, J.; Lyon, J.G.; Worthy, L.D. Land-cover change detection using multi-temporal MODIS NDVI data. Remote Sens. Environ. 2006, 105, 142–154. [Google Scholar] [CrossRef]
  32. Zoran, M.; Anderson, E. The use of multi-temporal and multispectral satellite data for change detection analysis of the Romanian black sea coastal zone. J. Optoelectron. Adv. Mater. 2006, 8, 252–256. [Google Scholar]
  33. Omran, E.S.E. Detection of land-use and surface temperature change at different resolutions. J. Geogr. Inf. Syst. 2012, 4, 189–203. [Google Scholar] [CrossRef] [Green Version]
  34. Usman, M.; Liedl, R.; Shahid, M.A.; Abbas, A. Land use/land cover classification and its change detection using multi-temporal MODIS NDVI data. J. Geogr. Sci. 2015, 25, 1479–1506. [Google Scholar] [CrossRef]
  35. Uddin, K.; Gurung, D.R.; Giriraj, A.; Shrestha, B. Application of remote sensing and GIS for flood hazard management: A case study from Sindh Province, Pakistan. Am. J. Geog. Inform. Syst. 2013, 2, 1–5. [Google Scholar]
  36. Kumar, K.; Kumar, V.; Kumar, D. Land use and land cover change detection Ingagas river valley watershed using remote sensing and GIS. Int. J. Res. Eng. Appl. Sci. 2016, 6, 31–37. [Google Scholar]
  37. Tariq, A.; Shu, H. CA-Markov chain analysis of seasonal land surface temperature and land use landcover change using optical multi-temporal satellite data of Faisalabad, Pakistan. Remote Sens. 2020, 12, 3402. [Google Scholar] [CrossRef]
  38. Tariq, A.; Riaz, I.; Ahmad, Z. Land surface temperature relation with normalized satellite indices for the estimation of spatio-temporal trends in temperature among various land use land cover classes of an arid Potohar region using Landsat data. Environ. Earth Sci. 2020, 79, 1–15. [Google Scholar] [CrossRef]
  39. Wang, S.W.; Gebru, B.M.; Lamchin, M.; Kayastha, R.B.; Lee, W.K. Land Use and Land Cover Change Detection and Prediction in the Kathmandu District of Nepal Using Remote Sensing and GIS. Sustainability 2020, 12, 3925. [Google Scholar] [CrossRef]
  40. Fan, F.; Weng, Q.; Wang, Y. Land use and land cover change in Guangzhou, China, from 1998 to 2003, based on Landsat TM/ETM + imagery. Sensors 2007, 7, 1323–1342. [Google Scholar] [CrossRef] [Green Version]
  41. Li, H.; Zhang, S.; Sun, Y.; Gao, J. Land cover classification with multisource data using evidential reasoning approach. Chin. Geogr. Sci. 2011, 21, 312–321. [Google Scholar] [CrossRef]
  42. Ayele, G.T.; Tebeje, A.K.; Demissie, S.S.; Belete, M.A.; Jemberrie, M.A.; Teshome, W.M.; Teshale, E.Z. Time series land cover mapping and change detection analysis using geographic information system and remote sensing, Northern Ethiopia. Air Soil Water Res. 2018, 11. [Google Scholar] [CrossRef] [Green Version]
  43. Amiri, R.; Weng, Q.; Alimohammadi, A.; Alavipanah, S.K. Spatial–temporal dynamics of land surface temperature in relation to fractional vegetation cover and land use/cover in the Tabriz urban area, Iran. Rem. Sens. Environ. 2009, 113, 2606–2617. [Google Scholar] [CrossRef]
  44. Arora, G.; Wolter, P.T. Tracking land cover change along the western edge of the US Corn Belt from 1984 through 2016 using satellite sensor data: Observed trends and contributing factors. J. Land Use Sci. 2018, 13, 1–22. [Google Scholar] [CrossRef]
  45. Pal, S.; Ziaul, S. Detection of land use and land cover change and land surface temperature in English Bazar urban centre. Egypt J. Remote Sens. Space Sci. 2017, 20, 125–145. [Google Scholar] [CrossRef] [Green Version]
  46. Choudhury, D.; Das, K.; Das, A. Assessment of land use land cover changes and its impact on variations of land surface temperature in Asansol-Durgapur Development Region. Egypt. J. Remote Sens. Space Sci. 2019, 22, 203–218. [Google Scholar] [CrossRef]
  47. Lu, D.; Li, G.; Moran, E. Spatiotemporal analysis of land use and land cover change in the Brazilian Amazon. Int. J. Remote Sens. 2013, 34, 5953–5978. [Google Scholar] [CrossRef] [Green Version]
  48. Rahman, G.; Rahman, A.-u.; Ullah, S.; Dawood, M.; Moazzam, M.F.U.; Lee, B.G. Spatio-temporal characteristics of meteorological drought in Khyber Pakhtunkhwa, Pakistan. PLoS ONE 2021, 16, 1–16. [Google Scholar] [CrossRef]
  49. Nowacki, G.J.; Abrams, M.D. Is climate an important driver of post-European vegetation change in the Eastern United States? Glob. Chang. Biol. 2015, 21, 314–334. [Google Scholar] [CrossRef]
  50. Majeed, M.; Bhatti, K.H.; Pieroni, A.; Sõukand, R.; Bussmann, R.W.; Khan, A.M.; Amjad, M.S. Gathered Wild Food Plants among Diverse Religious Groups in Jhelum District, Punjab, Pakistan. Foods 2021, 10, 594. [Google Scholar] [CrossRef]
  51. Ibrahim, F.; Gaylan, R. Urban land use land cover changes and their effect on land surface temperature: Case study using Dohuk City in the Kurdistan Region of Iraq. Climate 2017, 5, 13. [Google Scholar] [CrossRef] [Green Version]
  52. Akar, Ö.Z.; Güngör, O.Ğ. Integrating multiple texture methods and NDVI to the Random Forest classification algorithm to detect tea and hazelnut plantation areas in northeast Turkey. Int. J. Remote Sens. 2015, 36, 442–464. [Google Scholar] [CrossRef]
  53. Hussain, S.; Mubeen, M.; Akram, W.; Ahmad, A.; Habib-ur-Rahman, M.; Ghaffar, A.; Amin, A.; Awais, M.; Farid, H.U.; Farooq, A.; et al. Study of land cover/land use changes using RS and GIS: A case study of Multan district, Pakistan. Environ. Monit. Assess. 2020, 192, 2. [Google Scholar] [CrossRef] [PubMed]
  54. Majeed, M.; Bhatti, K.; Amjad, M. Impact of climatic variations on the flowering phenlogy of plant species in Jhelum district, Punjab, Pakistan. Appl. Ecol. Environ. Res. 2021, 19, 3343–3376. [Google Scholar]
  55. Majeed, M.; Bhatti, K.H.; Amjad, M.S.; Abbasi, A.M.; Bussmann, R.W.; Nawaz, F.; Rashid, A.; Mehmood, A.; Mahmood, M.; Khan, W.M.; et al. Ethno-veterinary uses of Poaceae in Punjab, Pakistan. PLoS ONE 2020, 15, 0241705. [Google Scholar] [CrossRef]
  56. Tariq, A.; Shu, H.; Li, Q.; Altan, O.; Khan, M.R.; Baqa, M.F.; Lu, L. Quantitative Analysis of Forest Fires in Southeastern Australia Using SAR Data. Remote Sens. 2021, 13, 2386. [Google Scholar] [CrossRef]
  57. Huyen, N.T.; Tu, L.H.; Liem, N.D.; Tram, V.N.Q.; Minh, D.N.; Loi, N.K. Assessing impacts of land use and climate change on soil and water resources in the Srepok Watershed, Central Highland of Vietnam. Policy Brief Ser. 2016, 2016, 1–4. [Google Scholar] [CrossRef]
  58. Tariq, A.; Shu, H.; Siddiqui, S.; Munir, I.; Sharifi, A.; Li, Q.; Lu, L. Spatio-temporal analysis of forest fire events in the Margalla Hills, Islamabad, Pakistan using socio-economic and environmental variable data with machine learning methods. J. For. Res. 2021, 13, 12. [Google Scholar] [CrossRef]
  59. Lin, C.; Wu, C.C.; Tsogt, K.; Ouyang, Y.C.; Chang, C.I. Effects of atmospheric correction and pansharpening on LULC classification accuracy using WorldView-2 imagery. Inf. Process Agric. 2015, 2, 25–36. [Google Scholar] [CrossRef] [Green Version]
  60. Zhang, Z.; Liu, S.; Wei, J.; Xu, J.; Guo, W.; Bao, W.; Jiang, Z. Mass change of glaciers in Muztag Ata–Kongur Tagh, Eastern Pamir, China from 1971/76 to 2013/14 as derived from remote sensing data. PLoS ONE 2016, 11, e0147327. [Google Scholar] [CrossRef]
  61. Rahman, G.; Dawood, M. Spatial and temporal variation of rainfall and drought in Khyber Pakhtunkhwa Province of Pakistan during 1971–2015. Arab. J. Geosci. 2018, 11, 1–13. [Google Scholar] [CrossRef]
  62. Prestele, R.; Alexander, P.; Rounsevell, M.D.; Arneth, A.; Calvin, K.; Doelman, J.; Verburg, P.H. Hotspots of uncertainty in land-use and land-cover change projections: A global-scale model comparison. Glob. Chang. Biol. 2016, 22, 3967–3983. [Google Scholar] [CrossRef] [Green Version]
  63. Gao, L.; Xiaofei, W.; Brian, A.J.; Qingjiu, T.; Yu, W.; Jochem, V.; Xihan, M.; Xingfa, G. Remote sensing algorithms for estimation of fractional vegetation cover using pure vegetation index values: A review. ISPRS J. Photogram Remote Sens. 2020, 159, 364–377. [Google Scholar] [CrossRef]
  64. Shah, S.H.I.A.; Yan, J.; Ullah, I.; Aslam, B.; Tariq, A.; Zhang, L.; Mumtaz, F. Classification of Aquifer Vulnerability by Using the DRASTIC Index and Geo-Electrical Techniques. Water 2021, 13, 2144. [Google Scholar] [CrossRef]
  65. Rodriguez-Galiano, V.F.; Ghimire, B.; Rogan, J.; Chica-Olmo, M.; Rigol-Sanchez, J.P. An assessment of the effectiveness of a random forest classifier for land-cover classification. ISPRS J. Photogram. Remote Sens. 2012, 67, 93–104. [Google Scholar] [CrossRef]
  66. Hussain, S.; Mubeen, M.; Ahmad, A.; Akram, W.; Hammad, H.M.; Ali, M.; Masood, N.; Amin, A.; Farid, H.U.; Sultana, S.R.; et al. Using GIS tools to detect the land use/land cover changes during forty years in Lodhran District of Pakistan. Environ. Sci. Pollut. Res. 2020, 27, 39676–39692. [Google Scholar] [CrossRef]
  67. Mumtaz, F.; Arshad, A.; Mirchi, A.; Tariq, A.; Dilawar, A.; Hussain, S.; Shi, S.; Noor, R.; Noor, R.; Daccache, A.; et al. Impacts of reduced deposition of atmospheric nitrogen on coastal marine eco-system during substantial shift in human activities in the twenty-first century. Geomat. Nat. Hazards Risk 2021, 12, 2023–2047. [Google Scholar] [CrossRef]
  68. Hu, P.; Sharifi, A.; Tahir, M.N.; Tariq, A.; Zhang, L.; Mumtaz, F.; Shah, S.H.I.A. Evaluation of Vegetation Indices and Phenological Metrics Using Time-Series MODIS Data for Monitoring Vegetation Change in Punjab, Pakistan. Water 2021, 13, 2550. [Google Scholar] [CrossRef]
  69. Ahmad, A.; Ahmad, S.R.; Gilani, H.; Tariq, A.; Zhao, N.; Aslam, R.W.; Mumtaz, F. A Synthesis of Spatial Forest Assessment Studies Using Remote Sensing Data and Techniques in Pakistan. Forests 2021, 12, 1211. [Google Scholar] [CrossRef]
  70. Ghaderizadeh, S.; Abbasi-Moghadam, D.; Sharifi, A.; Zhao, N.; Tariq, A. Hyperspectral image classification using a hybrid 3D-2D convolutional neural networks. IEEE J. Sel. Top. Appl. Earth Obs. Remote Sens. 2021, 14, 7570–7588. [Google Scholar] [CrossRef]
  71. Hamza, S.; Khan, I.; Lu, L.; Liu, H.; Burke, F.; Nawaz-ul-Huda, S.; Baqa, M.F.; Tariq, A. The Relationship between Neighborhood Characteristics and Homicide in Karachi, Pakistan. Sustainability 2021, 13, 5520. [Google Scholar] [CrossRef]
  72. Tariq, A.; Shu, H.; Siddiqui, S.; Imran, M.; Farhan, M. Monitoring Land Use And Land Cover Changes Using Geospatial Techniques, A Case Study Of Fateh Jang, Attock, Pakistan. Geogr. Environ. Sustain. 2021, 14, 41–52. [Google Scholar] [CrossRef]
Figure 1. Map of the study area.
Land 10 01026 g001
Figure 2. View of different land cover types in Jhelum District showing diverse LULC: (a) road in the mountains representing a new built-up area in 2020; (b) barren land (sandy dune cutting), another important LULC category in the area; (c) vegetation cover; (d) anthropogenic activities affecting LULC variations; (e) deforestation affecting vegetation cover; (f) natural disturbance causing LULC variations.
Land 10 01026 g002
Figure 3. Flow chart for the methodology.
Land 10 01026 g003
Figure 4. Farmers’ opinion of the degree of variations in climate variables in recent years.
Land 10 01026 g004
Figure 5. Maps of climate features (rainfall is in millimeters, and temperature is in degrees Celsius) in the research area.
Land 10 01026 g005
Figure 6. Land use–land cover maps of the district.
Land 10 01026 g006
Figure 7. Normalized difference vegetation index maps of Jhelum.
Land 10 01026 g007
Figure 8. Normalized difference built-up index maps of the research area.
Land 10 01026 g008
Figure 9. Regression analyses concerning NDBI and NDVI in the study district.
Land 10 01026 g009aLand 10 01026 g009b
Table 1. Arrangement of Landsat satellite imagery.
Sr. #Acquirement DateData TypeResolutionSensorsPath/Rows
1.17/3/1990Landsat imagery30 mTM150/037
150/038
2.25/3/2000Landsat imagery30 mTM150/037
150/038
3.12/3/2010Landsat imagery30 mETM+150/037
150/038
4.9/3/2020Landsat imagery30 mOLI150/037
150/038
Table 2. Farmers’ feedback about climatic and LULC variations.
Sr. #Climatic VariablesFeedbackPercentage
1LULC variationsYes82
No18
2TemperatureIncrease94.5
Reduction5.5
No change0
3Irrigation waterIncrease25.3
Reduction63.5
No change12.2
Table 3. Farmers’ observations about rainfall.
Sr. #Climatic VariablesFeedback Percentage
1Rainfall periodHigh37.2
Low57.6
No variation16.2
2Number of events of rainfallHigh14.3
Low80
No variation 6.7
3Rainfall densityHigh 22.5
Low72.5
No variation5
Table 4. Summary of LULC changes from 1990 to 2020.
LULU19902000201020201990–2020
Ha%Ha%Ha%Ha%Ha%
Forest25,710.897.1121,313.155.9016,190.644.4812,182.643.36−13,528.25−3.74
Cultivated area179,025.5749.54192,955.9353.39215,529.759.64229,096.7663.3950,071.1913.86
River34,742.139.6130,742.138.5122,777.126.3014,785.124.09−19,957.01−5.52
Barren land114,885.0931.79108,358.7729.9896,244.7326.6392,692.2625.65−22,192.83−6.14
Built-up area7030.511.958024.212.2210,6522.9512,637.413.505606.91.55
361,394.19100361,394.19100361,394.19100361,394.19100
Table 5. Summary of maximum and minimum values of NDVI and NDBI.
Years NDVI NDBI
MaximumMinimumAverageMaximumMininimAverage
19900.86−0.120.370.45−0.360.045
20000.75−0.170.290.54−0.250.145
20100.62 −0.280.170.58−0.20.19
20200.56−0.320.120.72−0.180.27
Table 6. Kappa (K) and accuracy of producers and consumers.
LULC Classes Season and ClassOverall AccuracyK
Producers’ Accuracy (%) Consumers’ Accuracy (%)
1234Avg. 1234Avg.
199090.285.283.786.781.283.283.288.189.792.590.788.80.930.86
200088.18891.385.188.188.186.786.28588.182.585.70.870.82
201085.684.487.490.884.386.588.986.78882.487.586.70.910.89
202083.280.186.588.789.585.6929285.38089.187.30.880.85
Where: 1 = forest area; 2 = cultivated area; 3 = river; 4 = barren land; 5 = built-up area.
Publisher’s Note: MDPI stays neutral with regard to jurisdictional claims in published maps and institutional affiliations.

