Article

Understanding Public Perception of and Participation in Non-Revenue Water Management in Malaysia to Support Urban Water Policy

1
Geography Section, School of Humanities, Universiti Sains Malaysia, Penang 11800, Malaysia
2
Department of Agricultural Extension & Information System, Sher-e-Bangla Agricultural University, Dhaka 1207, Bangladesh
*
Author to whom correspondence should be addressed.
Water 2017, 9(1), 26; https://doi.org/10.3390/w9010026
Submission received: 2 November 2016 / Revised: 16 December 2016 / Accepted: 24 December 2016 / Published: 5 January 2017
(This article belongs to the Collection Water Policy Collection)

Abstract

:
In contextualising the serious water loss, inefficient resource utilization, and ineffective water utility management in Malaysia, the objective of this study is to understand the public’s perception of non-revenue water (NRW) management in order to provide policy inputs, and to determine ways to improve public participation in NRW reduction. Findings reveal that there is currently only meagre public participation in NRW management in Malaysia, with a majority of the respondents demonstrating a lack of knowledge and awareness on NRW; over-dependence on water utility and government agencies in reducing NRW rates; and failure to submit a report when a leaking pipe is noticed. Educating the public on the importance of reducing NRW and promoting public interests and concerns around water tariffs, is essential to improve NRW reductions in Malaysia. Community-led strategies to better engage the public in addressing NRW-related issues have to be enhanced. To this end, concrete policy implications derived from the findings of the study are outlined.

1. Introduction

Non-Revenue Water (NRW) is the difference between the volume of water supplied in the water distribution system and the volume of water billed to the water consumer [1]. NRW can be categorised as the water losses caused by real loss and apparent loss, and the unbilled authorised consumption (Table A1). A high rate of NRW indicates poor water management because it can cause excessive water loss and financial loss, which leads to increased expenditure to supply more water to meet a country’s water demand [2]. Real loss is defined as the physical water loss from the water supply network, including all types of leaks, bursts, and overflows in service reservoirs, mains, and service connection pipes up to the point of customer metering [3]. Apparent loss consists of unauthorized consumption and meter inaccuracy, for example illegal water connection, meter under registration and data handling errors, whereas unbilled authorised consumption includes the water used by the water utilities for operation purpose (e.g., flushing and cleaning), water used for fire-fighting, and water provided free to certain consumer groups [1].
In many developing countries, high rates of Non-Revenue Water (NRW) remain a serious problem, although the importance of reducing NRW is well-known to the water sector [4]. The World Bank estimated the average NRW rate in developing countries as 35 per cent, accounting for losses of approximately 26 billion m3 of water [4]. A report by the Asian Development Bank (ADB) stated that the annual volume of NRW in Asian cities is about 29 billion m3 or on average 30 per cent of the total water produced by Asian water service providers. This causes nearly nine billion US dollars (USD) of revenue loss per year [5]. Typical problems that occur in developing countries and often exacerbate the progress of NRW reduction include: a lack of funding, inadequate involvement of the public, lack of motivation of water service providers, political interference, issues of corruption, and a lack of private sector interest [6].
In the past decades, various technical solutions have been highlighted as being effective in reducing NRW rates, such as pipe replacement [3], meter replacement [7], and pressure management [8]. However, water problems cannot be solved effectively without sufficient public participation [9]. Indeed, one of the reasons why NRW rates cannot be effectively reduced in some cities is due to a lack of public participation in NRW reduction activities that are often induced by poor public awareness of NRW issues [6]. For instance, leakage control is an effective loss reduction strategy that depends on how quickly the water service providers become aware of the incidents of pipe leakage and burst pipes [10]; and the success of the apparent loss reduction strategy also depends on how quickly the water service providers can disconnect the illegal pipe connection or replace a faulty meter [2]. A public which is aware of the importance of NRW reduction and water conservation can play a role, as informed and active citizens who report burst pipes, pipe leakage, meter malfunctions at home, suspected illegal water use, etc. to the responsible authorities. These actions can help to effectively shorten the time needed by the water service providers to be aware of a NRW-related incident and subsequently repair the leak, disconnect an illegally-connected pipe, or replace a faulty meter. Importantly, raising public awareness on the importance of NRW reduction will ease the resistance of the public to pay a reasonable water bill which is fair to the public and water service providers [6].
There are examples in the literature that show that public participation can contribute to better outcomes for NWR reduction programmes. In Phnom Penh, Cambodia, for instance, the public is encouraged to report illegal pipe connections, with rewards offered by the authority to those that do report and penalties given to those who have been found to install illegal pipe connections [11]. Through this policy, the water service providers successfully reduced their NRW rate from 72 per cent in 1993 to only 6.19 per cent in 2008 [12]. Likewise, in East Concession Zone of Metro Manila, Philippines, the NRW rate had been reduced by 45 per cent to only 16.9 per cent in 2009. There, the water service providers introduced a community water management programme by engaging several local people as informal street leaders, who assist the water service providers to curb NRW issues, by providing information on aspects such as burst pipes, leaking pipes and water shortages [13]. Moreover, Singapore’s NRW rate is among the lowest in the world [14], at approximately 4.7 per cent in 2012 [15]. An NRW reduction guidebook published by Singapore’s water service provider highlighted that good water consumer and water utility relationships is an essential element to managing NRW effectively [16]. In brief, public participation in NRW management can make the NRW reduction strategies more effective. However, improving public participation in NRW management is all too commonly left unaddressed in many developing countries, including Malaysia.
With an average annual rainfall of more than 3000 mm and more than 556 m3 of annual renewable surface water [17], Malaysia is a country rich in water resources. However, the country still faces seasonal water supply problems, and high NRW rates are one of the major causes of such problems [18]. The government and water service providers have been dealing with the NRW issue for decades, but have so far shown little success. Referring to the Eighth [19], Ninth [20] and Tenth Malaysia Plans [21], the Malaysian government spent around 600 million USD from 1996 to 2010, on reducing the country’s NRW rate. In 2013, the country’s NRW rate was still high at 36.6 per cent, with NRW rates ranging from 18 per cent to 62 per cent among all the country’s states, with five out of 13 states recording NRW rates higher than 50 per cent [22]. Such high rates of NRW jeopardize Malaysia’s water security in the long-term, potentially leading to negative effects on the country’s social (unfair water service bill), environmental (loss of water resources), and economic well-being (revenue losses of water sector) [23].
A study pointed out that Malaysia’s NRW problem is not just a technical issue, but also an issue which highlights poor management and governance [24]. Previous investments in the country’s NRW reduction programmes listed in the previous Malaysian Plan [19,20,21], were mostly focused on reducing NRW rates through engineering solutions, such as a pipeline replacement programme, a meter replacement programme, the establishment of District Metered Areas, etc. In addition, one of the key barriers facing Malaysia’s water sector in achieving better water management is public participation [25], which is always given too little consideration when planning water policy. There have been few success stories from Malaysia’s water utilities agencies regarding the engagement of the public as a solution to the NRW issue. At present, little research has been done to study public participation in NRW management in the Malaysian context; and public awareness of the NRW issue and around NRW reduction remains particularly underexplored. In the context of chronic water losses, inefficient resource utilization, and ineffective utility management, this study has been undertaken to understand the public perception of NRW management with a view to generate policy inputs for supporting urban water policy. To achieve this objective, this study primarily addresses three questions: (i) Is the public aware of the NRW issue? (ii) How does the public perceive NRW reduction? (iii) Do members of the public take action to solve NRW-related water issues? Straightforward policy information and ways to improve public participation in NRW reduction are delineated.

2. Materials and Methods

2.1. Study Location

Penang State and Perlis State were chosen as the study locations. Both are among the smallest states in Malaysia and located at the northern part of Peninsula Malaysia. Both states were chosen because of the significant differences in their NRW rates. Using water statistic published by the Malaysian Water Association (MWA) [22,26,27,28,29,30,31], Penang’s NRW rates were the lowest in the country in the past five years (2008–2013), averaging 18 per cent. Possessing one of the highest population densities in the country, Penang had the most domestic water connection densities in 2013 [22]. As shown in Table 1, Penang’s water consumption was among the country’s highest, averaging 809 million/litre/day (MLD), and its domestic water consumption was the country’s highest, at 296 litre/capita/day (l/c/d) [22]. The region’s water services, including NRW reduction, is a provided by Penang Water Supply Corporation (PWSC), which is a privatised water service provider owned by the Penang State Government. In Penang, the total volume of NRW in 2013 was 179 MLD, whereby 81.7 per cent (147 MLD) of Penang’s NRW was caused by real loss. The rest of the 18.3 per cent was caused by apparent loss (17.8 per cent) and unbilled authorised consumption (less than 1 per cent) (see Table A1 for defining water losses).
In contrast, Perlis’s NRW reduction is the responsibility of a state government agency, which was under the Water Supply Section of the Perlis State Public Work Department (PWD). According to MWA (2008–2014), Perlis’s NRW rates were the country’s highest, averaging 52.8 per cent in the past five years (2008–2013), and the state recorded the highest NRW rates in the country from 2011 to 2013. In 2013, the volume of NRW in Perlis State was 132 MLD, and real loss was estimated to account for 75.8 per cent of the volume of NRW; whereas the rest of the 24.2 per cent was estimated to be caused by apparent loss. Due to incomplete data, the volume of unbilled authorized consumption was not calculated by the PWD, but the volume of unbilled authorized consumption was estimated at below 1 per cent of the total NRW by the PWD. Perlis’s domestic connection density was slightly lower than the national average [22], and its water consumption was the second lowest in Malaysia, which was only 80 MLD in 2013. However, surprisingly, Perlis’s domestic water consumption per capita per day was among the highest in the country at 242 l/c/d in 2013 [22]. Hence, Penang and Perlis were chosen so that the study could compare the differences in the public’s perception of NRW reduction.

2.2. Data Collection

A structured questionnaire was used to collect data for exploring public perception of the NRW issue and its reduction. The capital cities of Penang State (George Town) and Perlis State (Kangar) were chosen as the study locations for data collection. A pilot study was conducted before the actual sample collection to ensure the questions were clear and understandable to the general public. In the pilot study, 60 members of the general public were consulted by asking them to fill in a questionnaire. In addition, the questionnaire was also verified by water experts from university and water-related non-governmental organisations. Improvements were then made after comments were obtained from these experts. Data collection was done by door-to-door visit, and the respondents were selected through random sampling. At first, the selected cities were divided into different sub-districts by referring information from the states’ government website (http://ptg.penang.gov.my/ and http://www.perlis.gov.my/). The exact sampling locations were then selected from these sub-districts. Several residential areas were then classified based on housing types: bungalows and semi-detached houses, condominiums and terrace houses, and flats and other low cost housing units finally selected as the sampling location. Both cities contain different ethnic groups, i.e., Malay, Chinese, Indians, and others. This survey applied stratified random sampling for ethnicity at the selected study locations. Households were randomly selected from the sampling location and a representative (respondent) from selected household was asked to fill in the questionnaire. The actual survey was conducted from September 2013 to February 2014. 423 valid questionnaires were obtained from George Town and 402 from Kangar. Descriptive statistical analysis and chi-square test were used to analyse the study.

3. Results

The demographic information of the respondents is documented first, then, in consecutive order, the public’s knowledge, awareness, perception and concerns, and action towards NRW management are presented.

3.1. Demographic Analysis

A total of 825 respondents were interviewed: 423 from Penang State and 402 from Perlis (Table 2). Based on the reports by the Malaysian Department of Statistic, 63.2% of the populations in George Town were Chinese, followed by Malay (21.0%) and Indian and others (15.8%). In Kangar, the city was populated by Malay (62.2%), Chinese (30.5%), and the rest of population was 7.3% (Indian and non-Malaysian). A chi-square goodness-of-fit test was then performed; there were no significant differences in the proportion of the respondents’ race in George Town as compare with the actual population’s race (chi-square test for goodness-of-fit: df = 2, p = 0.071, x2 = 5.284). As well as the distribution of the questionnaire of the respondents in Kangar, the chi-square goodness-of-fit test shows no significant differences with the actual population’s in the city (chi-square test for goodness-of-fit: df = 2, p = 0.225, x2 = 2.734). As shown in Table 2, in George Town, 51.3 per cent of the respondents were male, and the majority of the respondents were in the age group of 21–40 year olds. Most of their monthly incomes were in the category of 350–1164 USD. In addition, most of the respondents in George Town and Kangar had at least tertiary educational, with 57.7% and 52.7%, respectively. In Kangar, most of the respondent’s monthly incomes were in the categories of USD below 699 (51.3%), and genders were represented approximately equally, and the majority of the respondents’ aged between 21 and 40 years old.

3.2. Public Knowledge of NRW

First, respondents were asked whether they knew what “Non-Revenue Water” is? To this question, only 9% and 14.2% of the respondents from George Town and Kangar, respectively, gave a positive answer (Figure 1. The chi-square analysis (df = 2, p = 0.000, x2 = 18.267) indicates that significantly more respondents from George Town claimed that they do not know what NRW is than respondents from Kangar.

3.3. Public Awareness of NRW Issue

Respondents were asked to identify major water issues in the country (Table 3). The survey instrument provided multiple choices, which were determined through the pilot study. Respondents were asked to choose current major water issues in the country. More than 50% of the respondents in both cities identified river pollution as one of the major water issues in Malaysia. In George Town, there were more respondents (53.2%) who selected human wastewater as compared with only 44.3% in Kangar. Whereas 51.2% of the respondents in Perlis reported that bad water quality is one of the major water issues. Less than half of the respondents from Perlis chose pipe leakage or burst pipes as one of the major water issues, even though high NRW rates are a serious water issue in Perlis. However, significantly more respondents in Perlis as compared to Penang claimed that burst pipes and pipe leakage issues are one of the major water issues in the country (chi-square test for association: df = 1, p = 0.000, x2 = 14.505). Other than flooding, the results from the chi-square test show that respondents from both cities held different perception on all the other water issues in the country.
In some questions in the questionnaire, “water loss” was used instead of “non-revenue water”, as results from the pilot study indicated that more people understood the word “water loss”. However, the basic definition was written in each question that had these two words to improve respondents’ understanding of the meaning. Figure 2 shows respondents’ perception regarding the seriousness of water loss issues in Malaysia. The two cities’ respondents’ perceptions regarding the seriousness of water loss issues in Malaysia was found to be significantly different (chi-square test for association: df = 4, p = 0.000, x2 = 27.074). Significantly more respondents in George Town believed that water loss issues were either very serious or serious in Malaysia, whereas nearly 50% of Kangar’s respondents believed that water loss issues in the country were only moderately serious or not so serious. Furthermore, 25.1% (George Town) and 17.2% (Kangar) of the respondents from both cities said they had no idea about the seriousness of water loss issues in the country.

3.4. Public Perception of the NRW Reduction

Respondents were asked to choose only one strategy as the preferred solution for future water supply issues (Figure 3). The chi-square test for association shows that the respondents from these two cities exhibited very different preferences regarding the most appropriate solution for solving water supply issues (chi-square test for association: df = 4, p = 0.000, x2 = 22.892). Many of the respondents (47.5%) in George Town preferred to solve their water supply issues by managing water demand (e.g., save water, reduce water loss and install water saving devices). In contrast, many of the respondents in Kangar (42.3%) preferred to develop more water resources to solve their water supply issue. Recycling and reuse was only chosen by 13.9 per cent (George Town) and 11.9% (Kangar) of the public from both cities. Finally, the least number of respondents (5.7% for George Town and 5.5% for Kangar) chose seawater desalination as the most appropriate solution (Figure 3).

3.5. Public Perception of the Self-Responsibility in NRW Reduction

A question was posed to understand the public sense of responsibility regarding water loss issues. Figure 4 indicates significantly more respondents from George Town (78%) agreed that they should be responsible for solving the water loss issue, compared to 67.4% of respondents from Kangar (chi-square test for association: df = 1, p = 0.001, x2 = 11.182). Another question asked respondents to rank stakeholders’ responsibility in reducing water loss. The majority of the respondents chose that the state’s water service provider, federal government, state government, local government, and politician have high responsibility for reducing water loss in the country (Table 4). In contrast, the majority of the respondents perceived that non-governmental organisations (NGOs), private sector companies, and the public either have a moderate or low responsibility for NRW reduction. Not many of the respondents thought that the public should have high responsibility in reducing water loss.

3.6. Public Concern and Action towards NRW Reduction

Respondents were asked to communicate their perceptions when they actually encounter water problems related to NRW. Results revealed that when the public does see NRW-related issues, they feel that these issues matter. Indeed, most respondents from both cities either felt that a pipe leaking or burst at the roadside, was either a very serious problem or a somewhat serious problem (Table 5), while less than five per cent of them felt that this was not a problem at all. For the incidents of illegal pipe connection, more than half of the respondents in both cities felt that it was a very serious problem. For the incidence of meter inaccuracy in respondent’s home, more than half of the respondents in both cities felt that this incident was either a somewhat serious problem or a very serious problem. However, notably part of the respondents in George Town (31.7%) and Kangar (28.9%) did not think this issue was a serious problem. There are no significant differences in the perception of these three problems between the respondents from both cities.
Of all the respondents from both cities, more than 90% admitted that they had experience of spotting pipe leakage or pipe burst by the roadside (Figure 5). More than 60% of them responded that they saw these incidents “often” or “sometimes”. Looking at the likeliness that responds would report pipe burst or pipe leakage issues to the water service providers (Figure 6), significantly more respondents in Kangar stated that they were either very likely or likely to report these incidents compared to respondents in George Town (chi-square test for association: df = 3, p = 0.000, x2 = 55.467). In George Town, more than half of the respondents were unlikely or very unlikely to report burst or leaking pipes to the authorities.
Nevertheless, respondents from both states were unlikely to save the water service provider’s phone number into their cell phone, with only 13% and 25.4% of respondents from George Town and Kanga, respectively, responding that they did save the water service provider’s contact number on their cell phone (Figure 7). Figure 8 shows that only 26.6% of respondents from Kangar who had seen pipe burst or leakage on the roadside reported that they had called the water service provider, while, in George Town, this figure was much lower at only 17.5%.

4. Discussion

In Malaysia, raising water tariffs is a politically sensitive issue. In Penang, domestic water tariff costs only 0.35 Malaysian Ringgit which is equal to 0.08 US cents for the first 40,000 L; in Perlis, the domestic water tariff costs 0.59 Malaysian which is equal to 0.14 US cent for the first 40,000 L of water [32]. With such low water tariffs, the public has no incentive to conserve water and the water service providers have no money to carry out more water-related and NRW reduction projects [25]. Importantly, at present the structure of water tariffs in Malaysia’s water sector is not based on full cost recovery, i.e., the revenue collected by the water service industry can barely cover total operating expenditures [24]. In order to achieve long-term water sustainability, the current water tariff structure of Malaysia’s water sector needs to be revised. Moreover, water conservation has not been practiced by Malaysians, as domestic water consumption in most states is higher than 220 L per capita per day [22]. This figure is still relatively high in comparison with the other cities in Southeast Asia: for example, Singaporeans only consume 160 L per capita per day. Under these circumstances, understanding public perception and awareness towards water conservation, including NRW reduction is very important, as this can help to better engage the public in water governance and management [33]—including engaging more people to conserve water and pay a higher water tariff.
Studies report that Malaysian people are well aware of river pollution [34,35] and drinking water contamination [36], and this is because the negative impacts of such issues to human’s health are well-recognised. For the NRW issue, the negative impacts of NRW issues on the public are mostly delayed or indirect, leading to poor public awareness of this issue. For example, the leakage of underground pipe can cause revenue loss for a water service provider, but it is less likely to cause immediate water supply interruption to a city that has generally sufficient water resources.
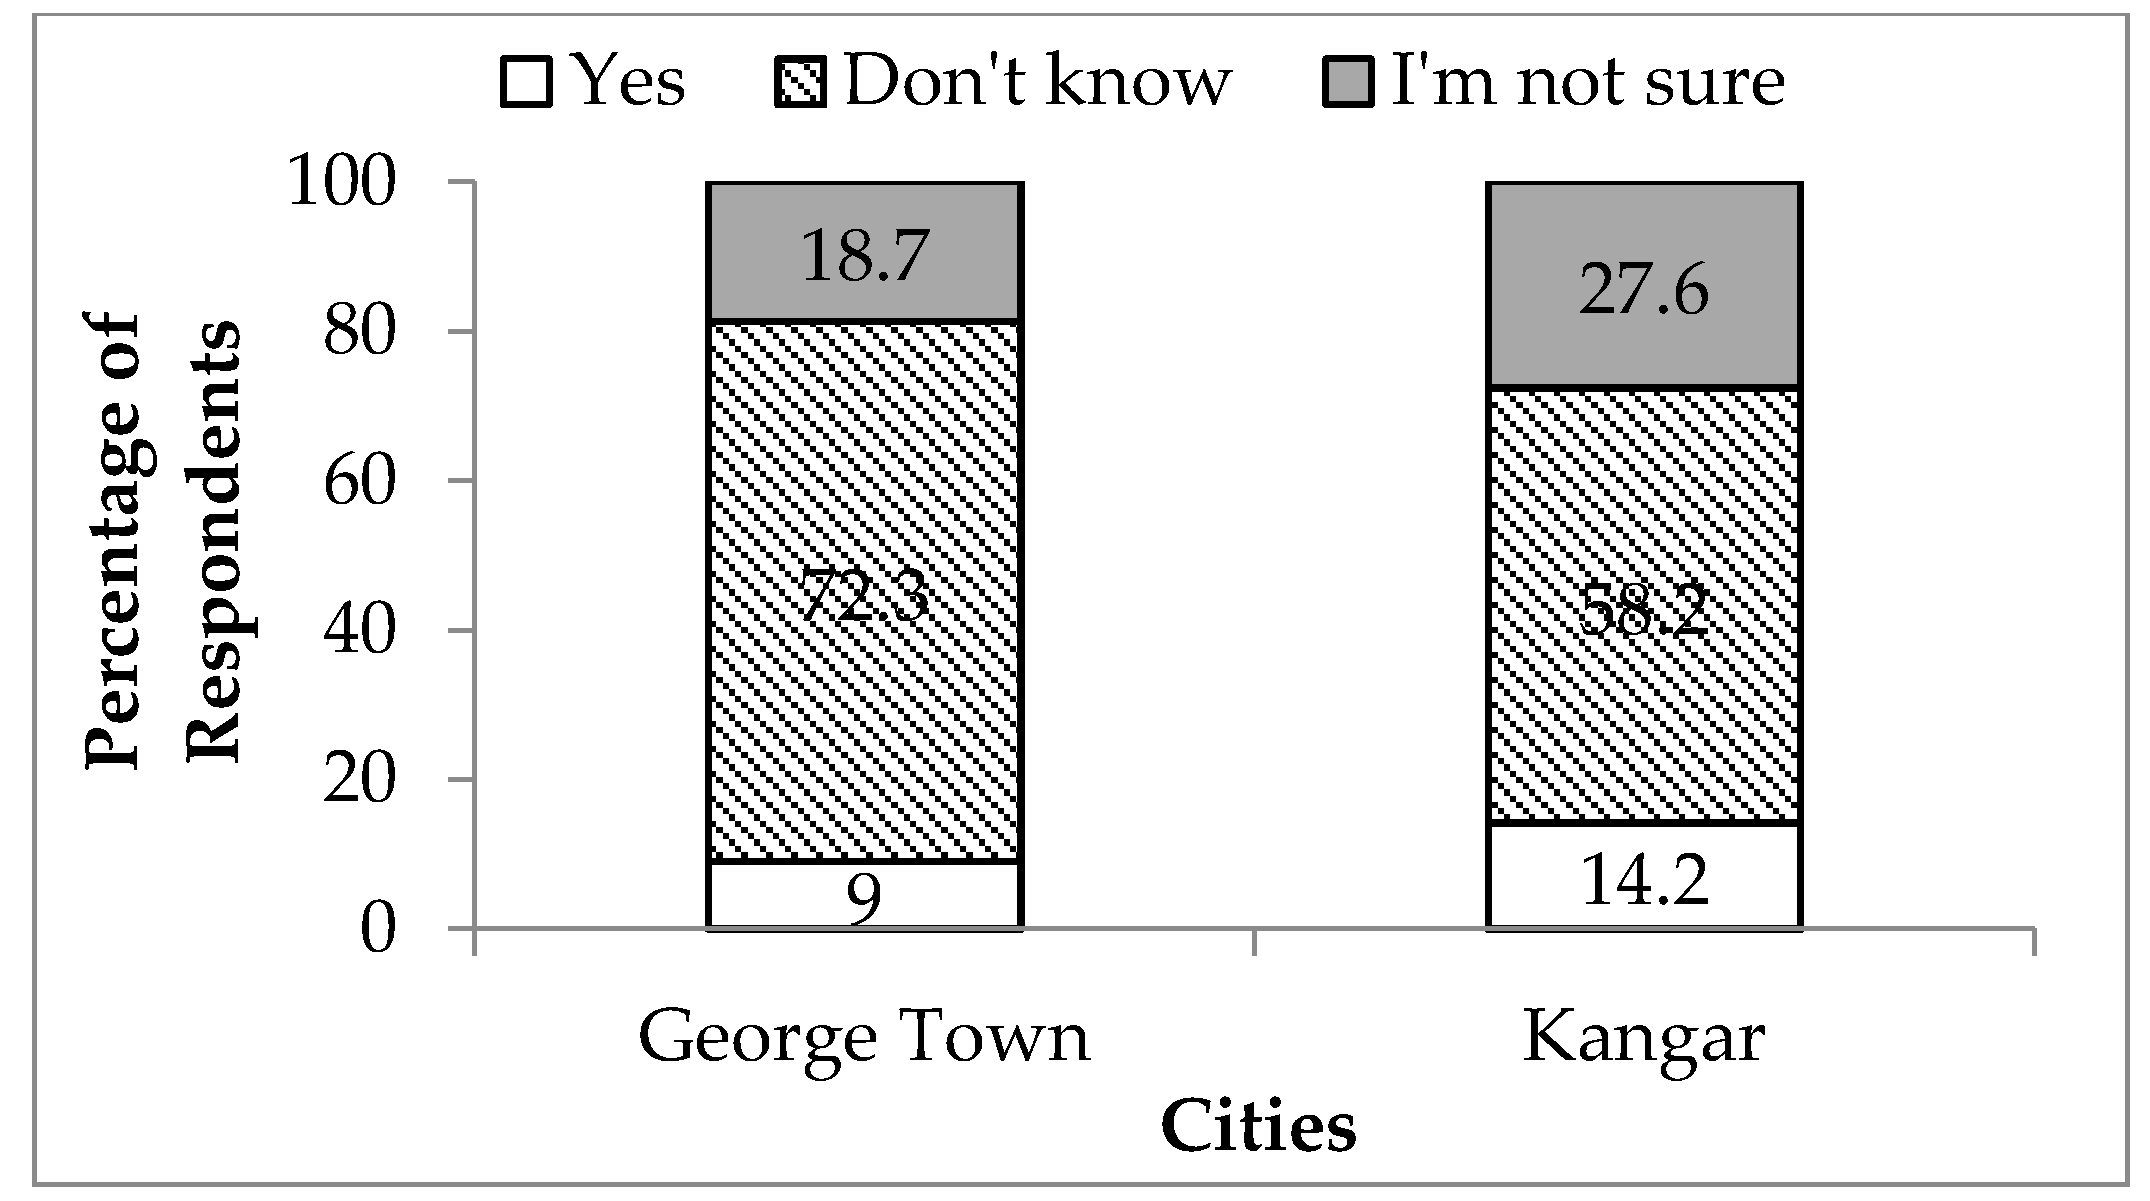
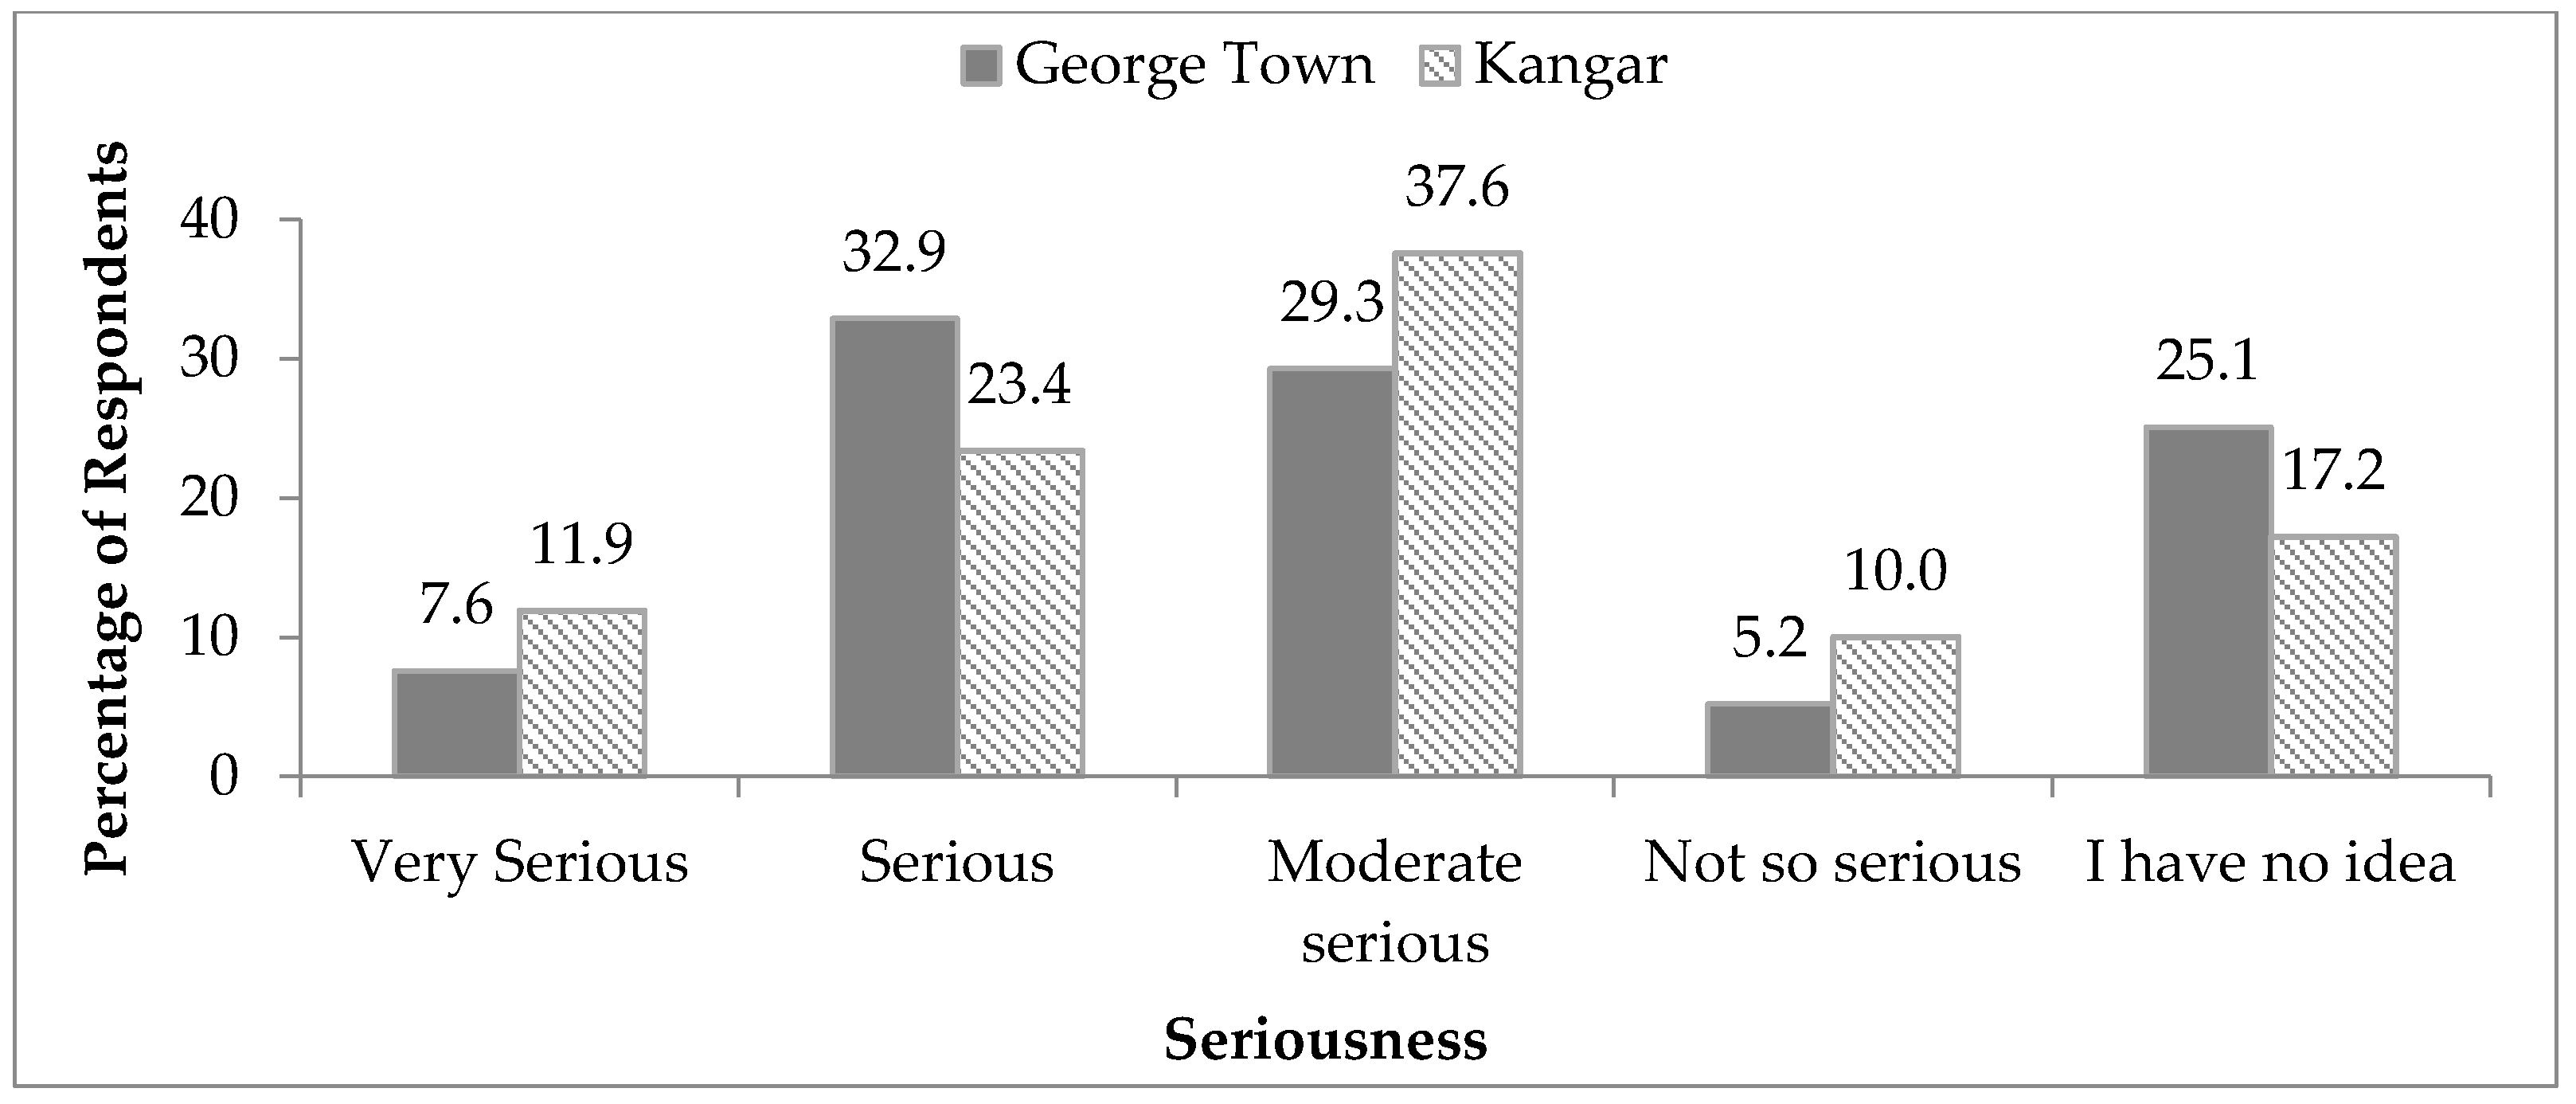
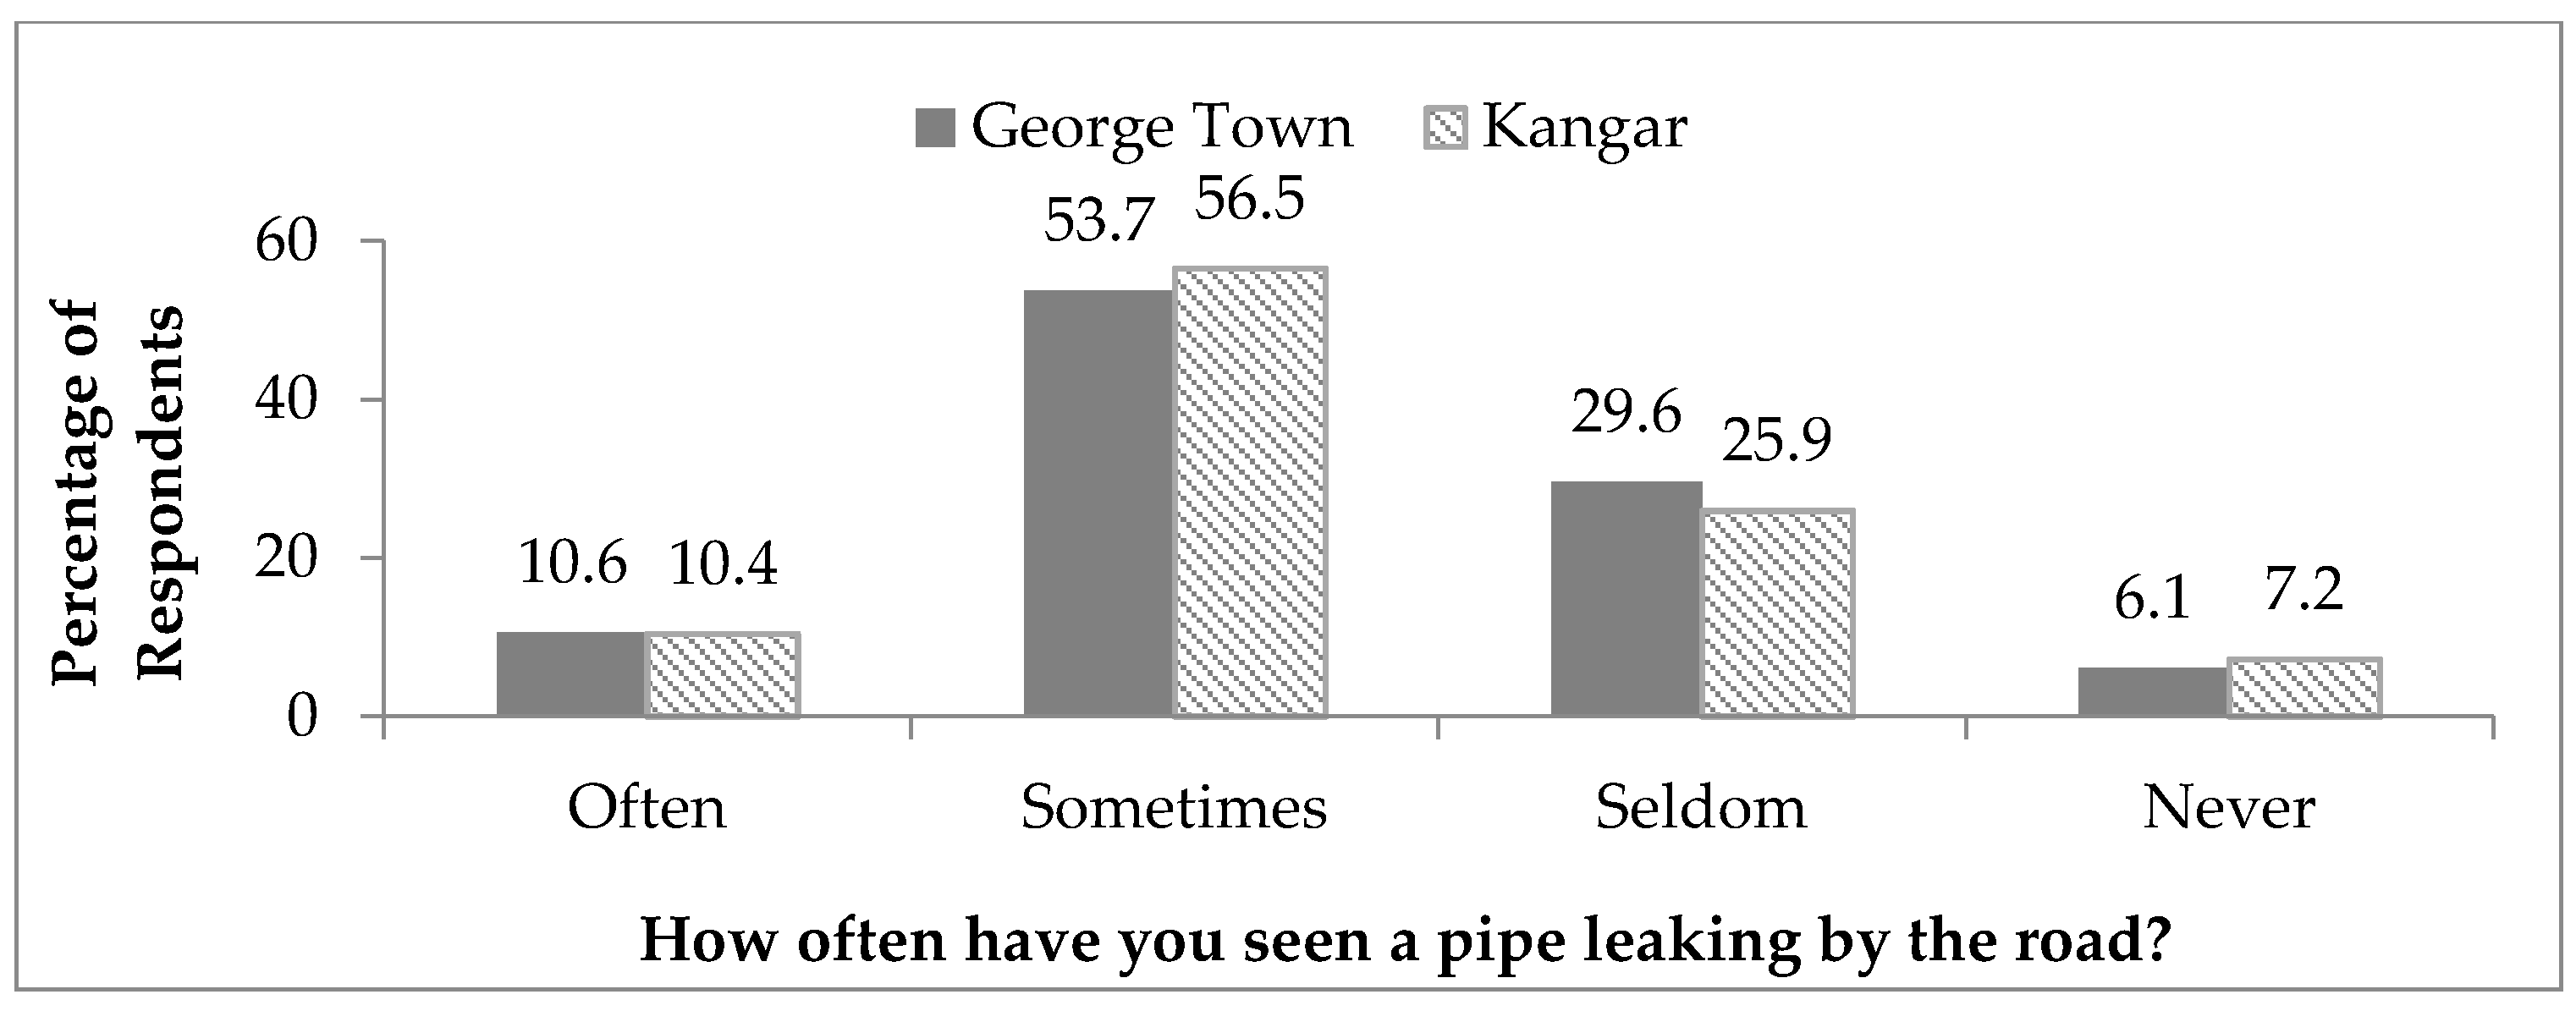
The comparison between the public perception of NRW issues in a city with high NRW rates (Kangar) and a city with low NRW rates (George Town), demonstrates that the respondents in both cities do not have good awareness of the NRW situation in the country. The majority of the respondents in both cities did not think that leaking pipes are one of Malaysia’s major water issues, and the majority of the respondents did not rate water loss issue as either serious or very serious in Malaysia. It is possible that most respondents have never experienced a serious water supply issue caused by high NRW, or they did not know high NRW rates could cause water supply interruptions. The number of cases of water supply interruptions reported to Penang and Perlis’s water service providers in 2012 and 2013 were among the lowest in the country [22]. Besides, a lack of awareness of the public concerning NRW issues could be partially attributed to the fact that they do not understand the term NRW. NRW is a technical word widely used in the water-related sectors, but its technical nature alienates the public. The public knowledge and awareness of NRW and water conservation issues needs to be improved to ensure better NRW management.
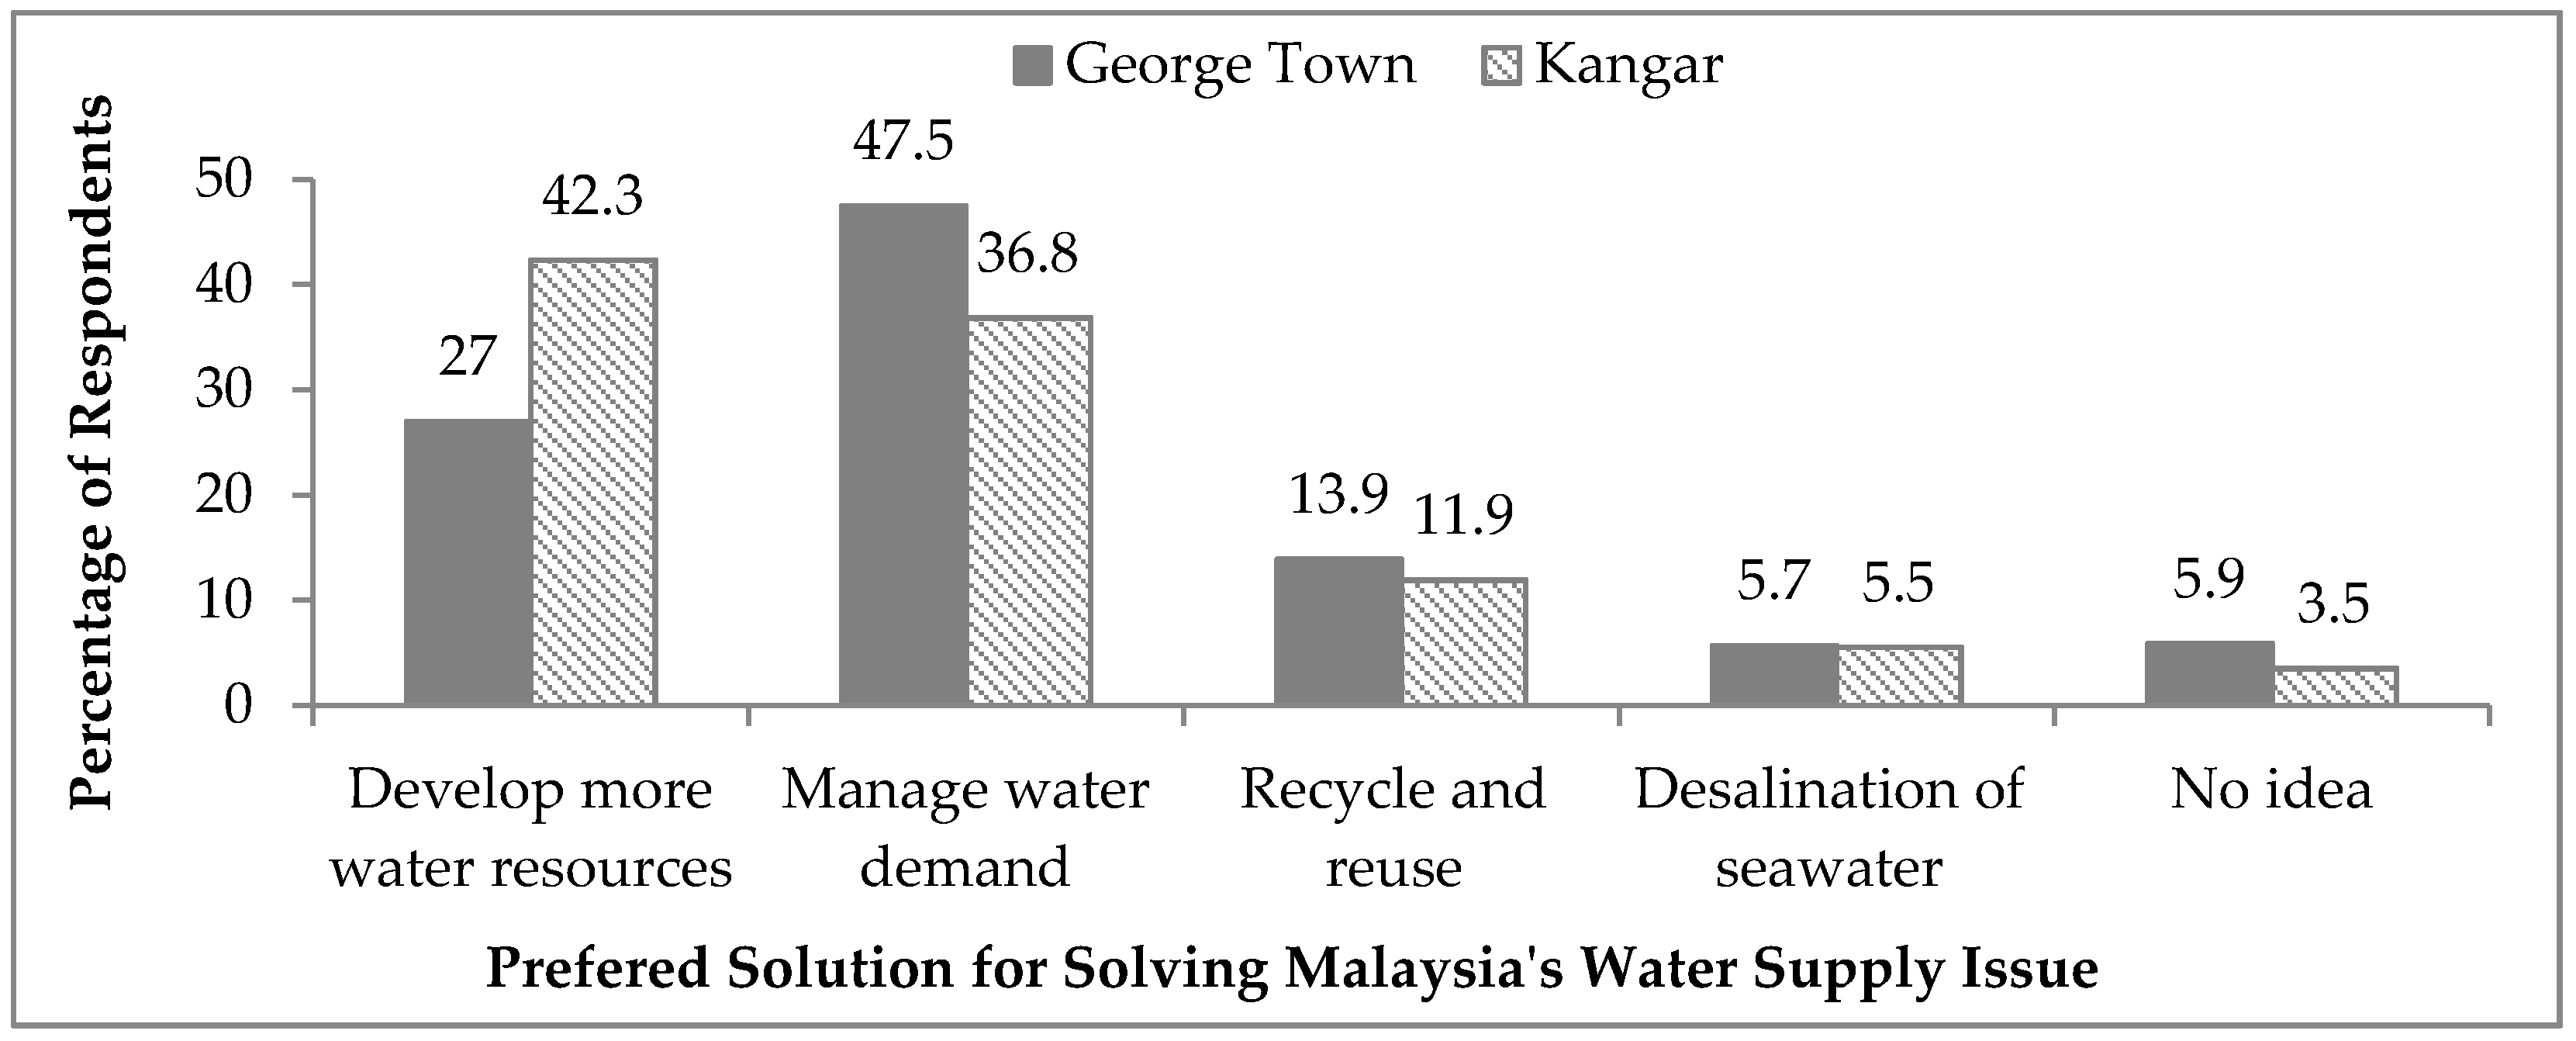
In regards to the public perception of NRW reduction, a higher percentage of respondents in Kangar still strongly believe in developing more water resources (e.g., building dams or water treatment plants) to solve their water supply issues. However, building dams or water treatment plants is expensive, and may have negative impacts on the environment, wildlife and local communities [25]. In contrast, more respondents in George Town preferred to solve the water supply issue by managing water demand, which emphasises reducing water wastage and water loss. The public need to be educated about the appropriate solutions for solving their water supply problems to view “water demand management” as the most appropriate strategy—rather than choosing the out-dated approach of “developing more water resources”—as water demand management strategies have been found to be workable in Malaysia [37].
Furthermore, respondents in both cities have high expectations of the state’s water utility and government’s agencies to play a bigger role in solving water loss issues. Even though the majority of the respondents in both cities thought that they should be responsible in solving water loss, they did not believe that the public holds a high responsibility in water loss management. This could be because the respondents believed that the public has limited capacity to solve water loss issues and that the government or water service providers should be the ones responsible. For example, the public may think that they can only make a call to the water service provider if a leaking pipe is spotted on the roadside, and that the public does not have the capacity to repair the leaking pipe, as only the water service provider is able to do the repair work.
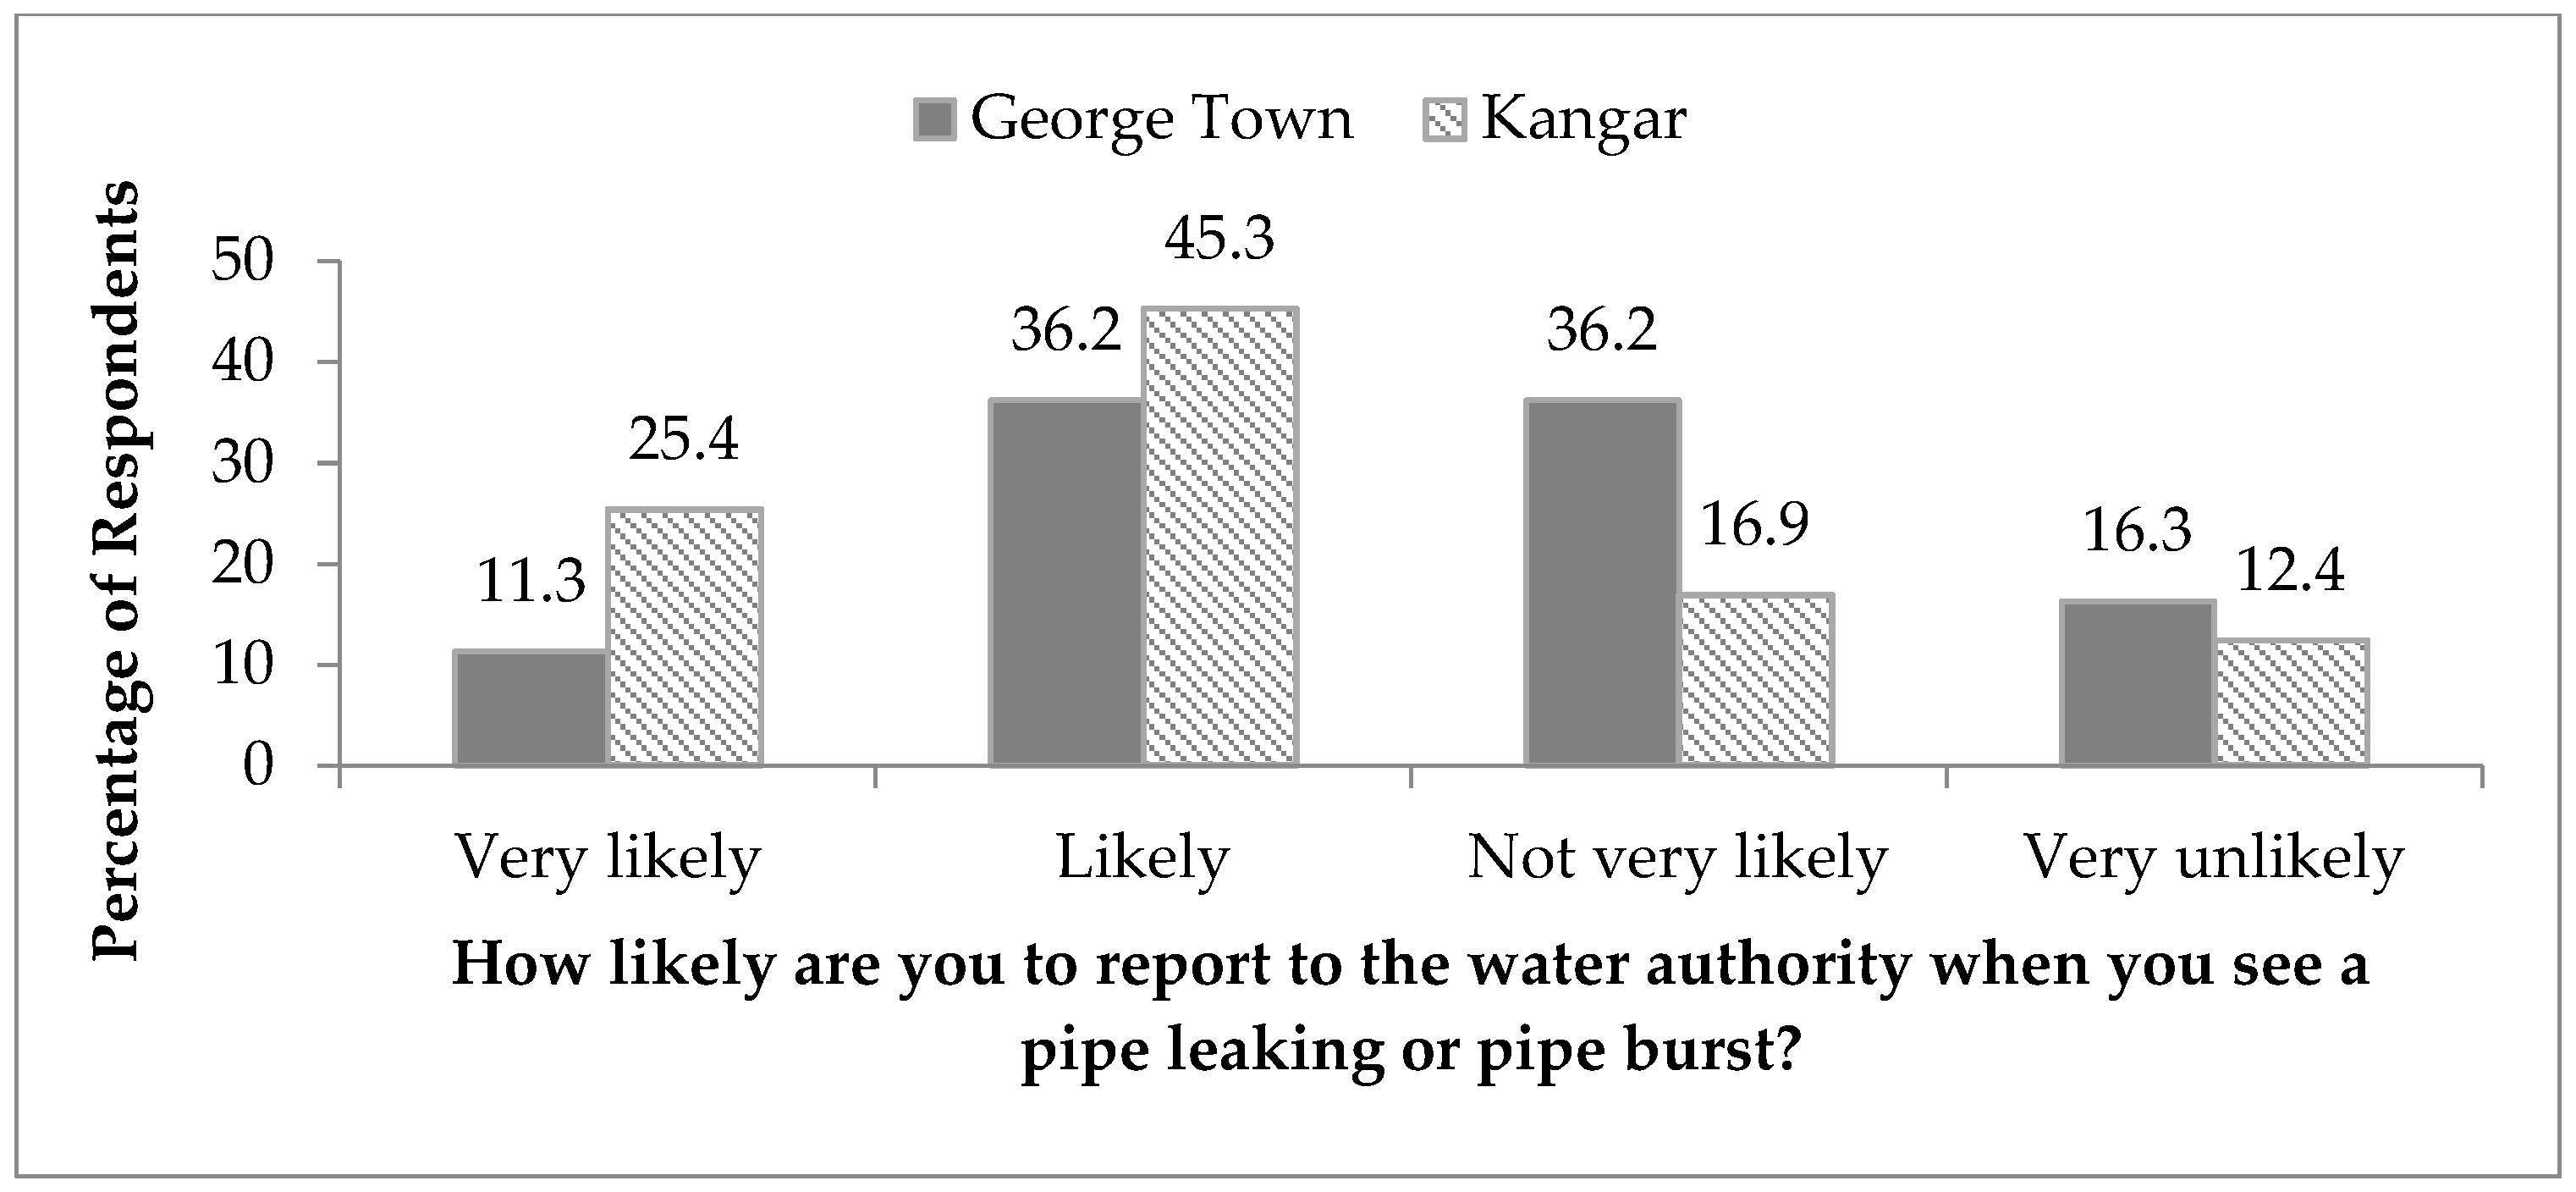
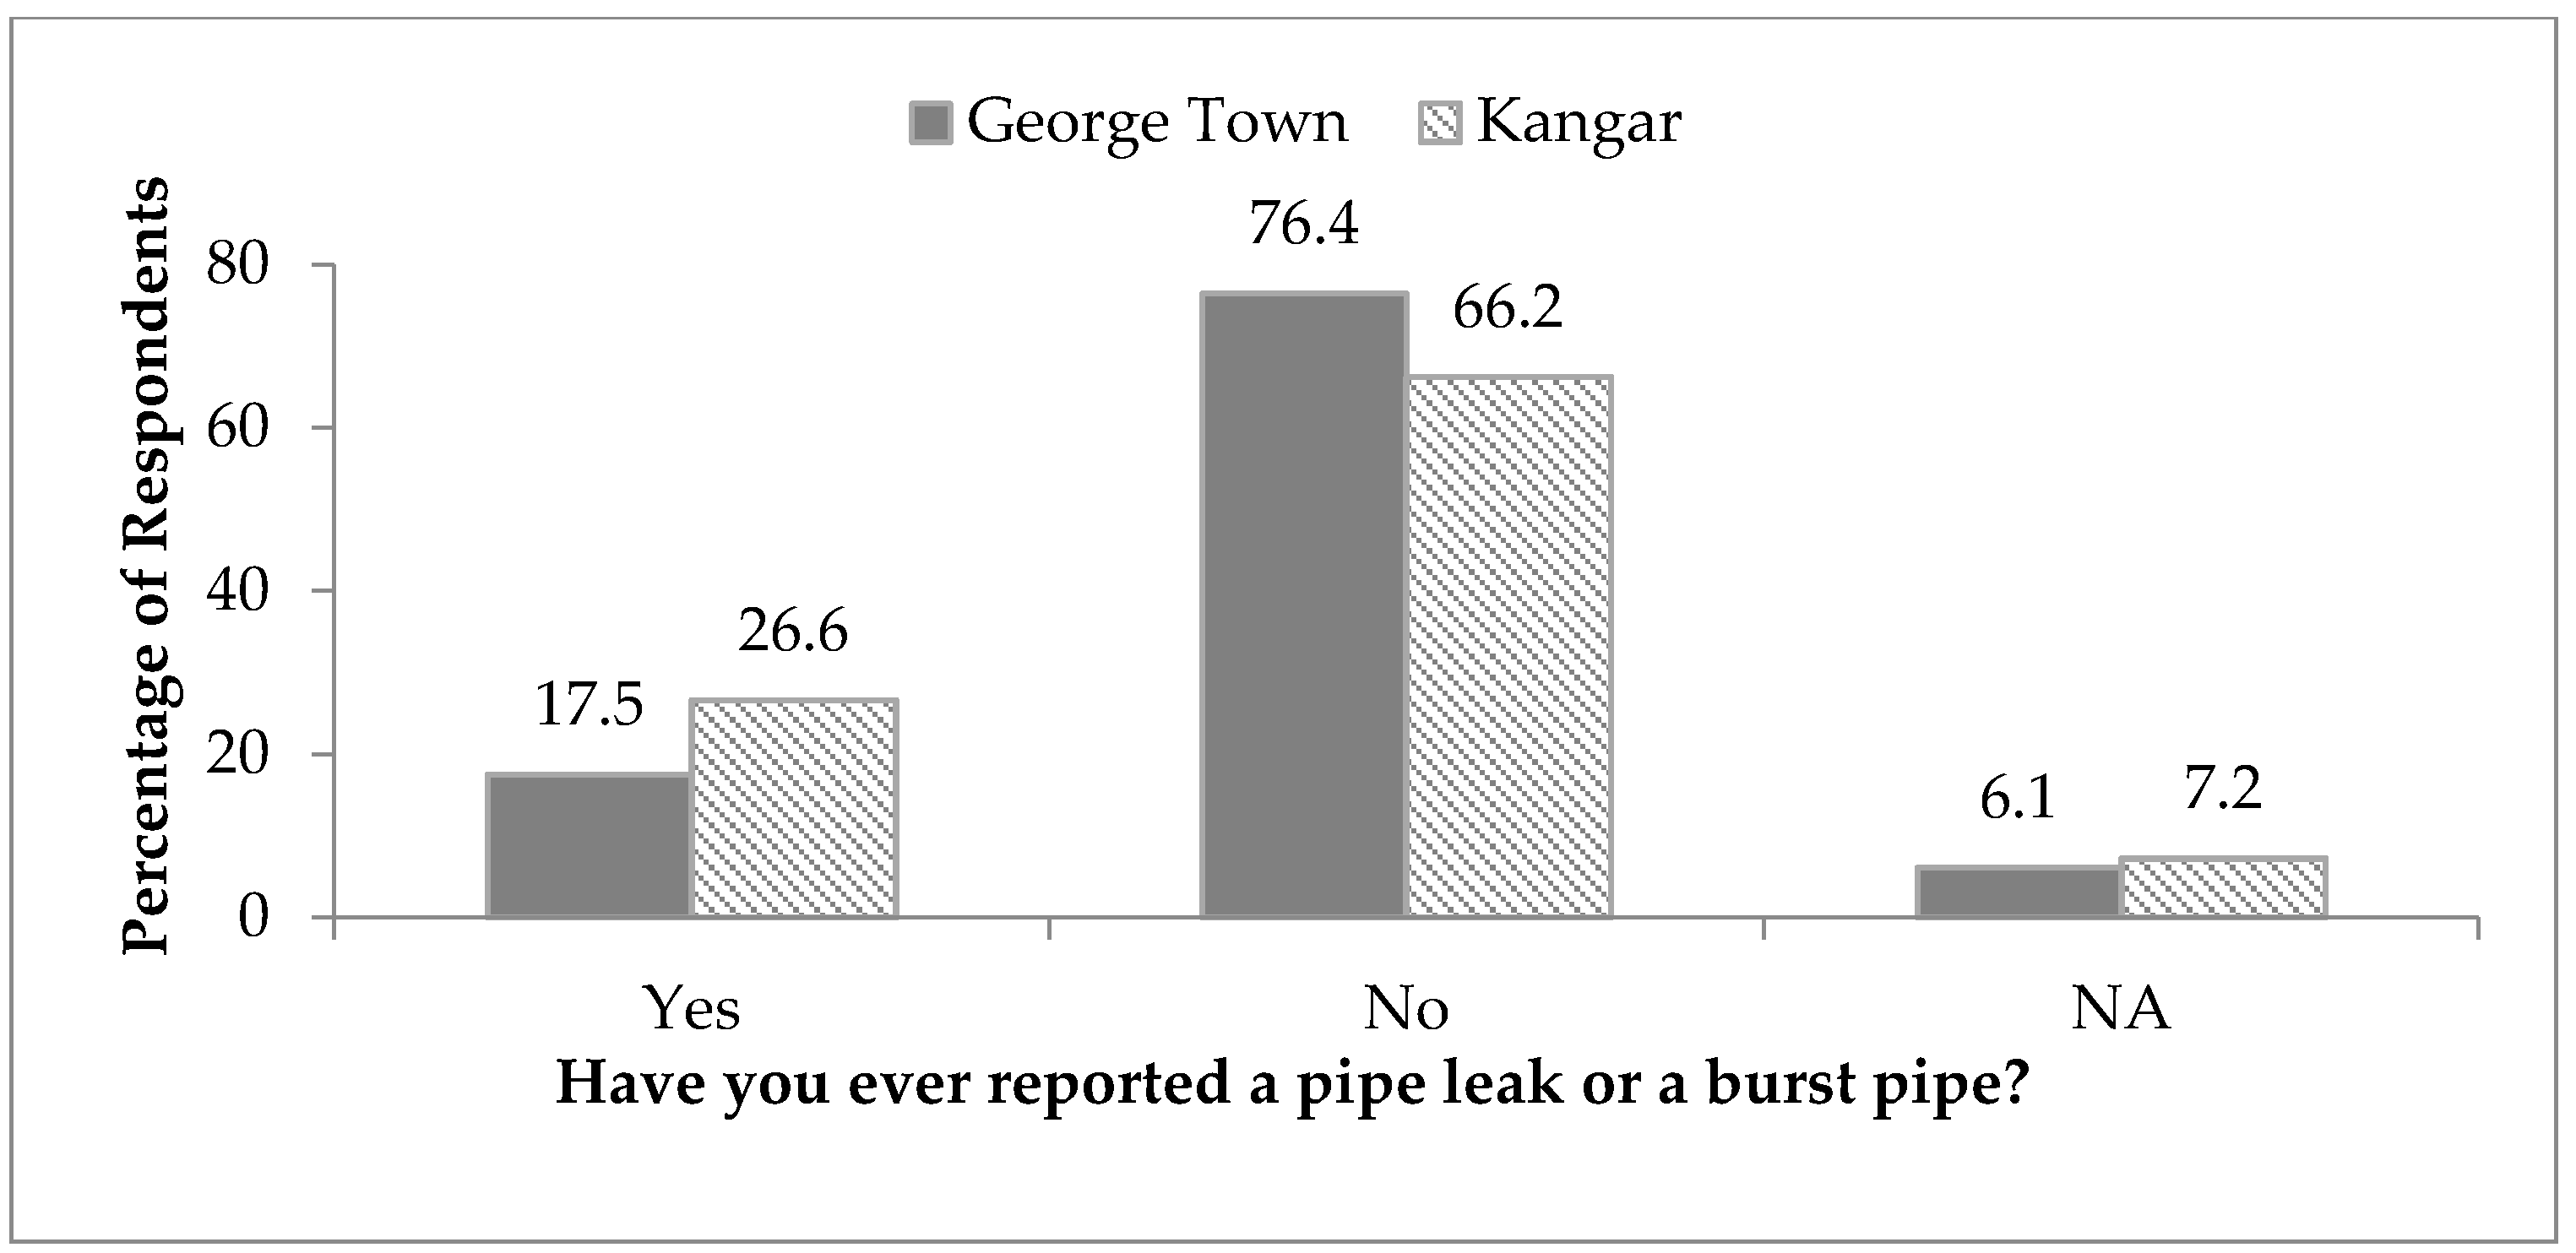
The degree to which a person is concerned about NRW-related issues could also determine the action that will be taken by a person, if the issue is noticed by the person. Overall, the results from this study show that respondents in both cities were concerned about pipe leakage, meter inaccuracy, and illegal water use. However, the majority of the respondents in both cities never reported to the water service provider when they encountered a leaking pipe. It was found that respondents in George Town were generally less likely to report observed leakages to the water service provider. This could be attributed to the process for making such a report. Some respondents gave feedback in the questionnaire on the reasons why they did not report, these included: “I do not know the phone number of water service provider”, “I do not know who I should call”, “I was busy”, and the “process of making such report is troublesome”.
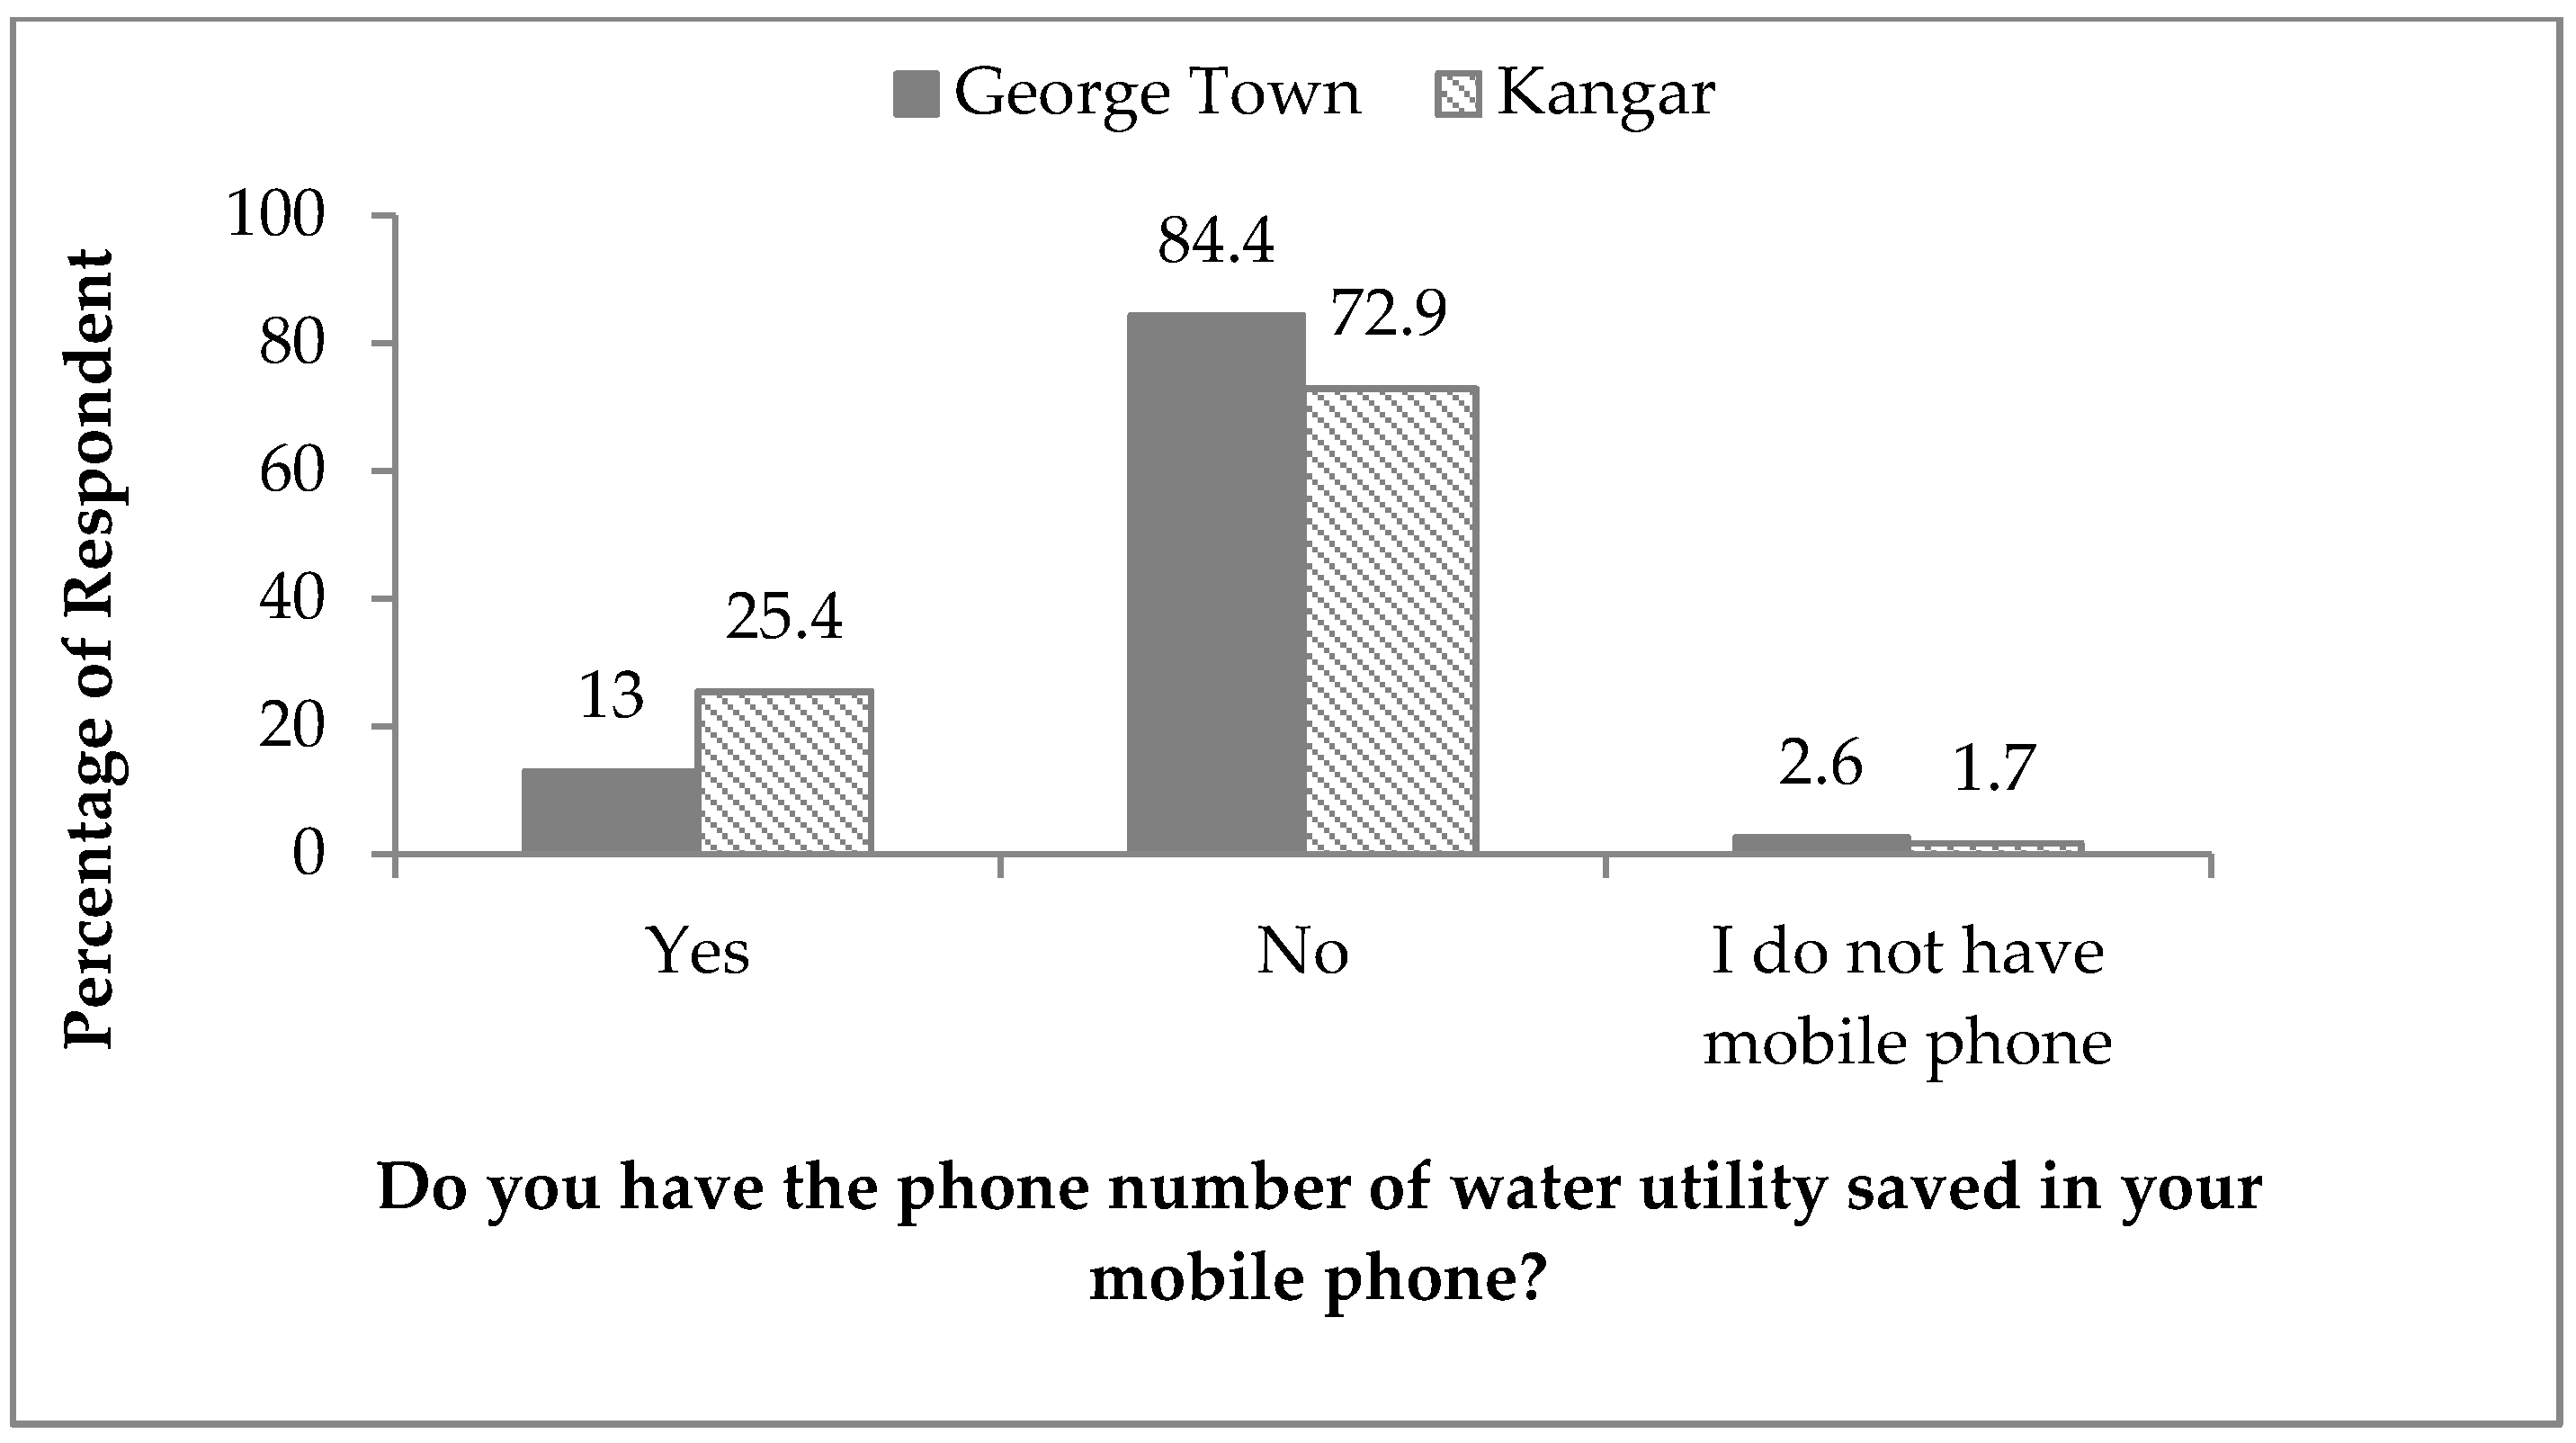
The result of this study also shows that most respondents in both cities did not save the water service provider phone numbers into their mobile phones. It is suggested that Penang’s water service provider should develop an information and communication technology (ICT) to better engage the public in NRW reduction activities. At this moment, Perlis’s water supply service is still in the process of privatization, advanced NRW reduction activities that use high-end technology cannot be implemented due to a lack of funds. As such, the state’s water service provider can create a NRW reduction strategy involving the public as the major actor in leak management. Community-led NRW reduction strategies that encourage local people’s participation can actually be carried out with lower budget.

5. Policy Implication

The outcomes of this study have practical implications for policymakers and urban water utility managers to improve NRW management in Malaysia and beyond. A number of policy implications were identified with rationale and practical reference for supporting urban water policy formulation and improving public participation in NRW management.
• Improve public perception of water tariff and ensure full cost recovery for better water demand and NRW management
The public is more likely to pay for water services if they are aware of the health and economic benefits derived from improved water supplies [38]. Additionally, a transparent and fair tariff-setting framework will increase the willingness of water consumers to accept future tariff hikes [24]. Water consumers have to be informed what they are paying for, i.e., understanding that there are a lot of costs incurred to provide better water services, including reducing NRW rate, maintaining the water infrastructure, and other operational costs. More initiatives need to promote the public’s interest in relation to water tariffs, as well as to improve public awareness on water demand and NRW management.
• Integrate NRW-related knowledge and information into the content of water and environmental education activities
In Malaysia, educating the public on water conservation is normally done by water service providers, government agencies, or NGOs via awareness raising campaigns, community-outreach or educational programmes. However, the importance of reducing NRW rates is rarely mentioned in the content of such activities. The negative impacts of high NRW rates, the role of the public and the benefit of reducing NRW rates should be mentioned in the awareness raising activities.
• Develop information and communication technology (ICT) strategy to engage public in NRW reduction activities
ICT is useful for improving stakeholder participation in water management by providing a platform to link both water service providers and water consumers [39,40]. For example, Singapore’s water service provider has introduced a mobile app through which the public can make water service complaints. Malaysia’s water utilities should develop ICT-based tools to make the process of reporting NRW-related issues more community-friendly, efficient, effective, and easy for the public to better engage in reporting NRW-related water service complaints. More choices should be provided to the public to make water service complaints; for example, making reports via short message services, emails, web-chat, and mobile apps.
• Establish social networks for water management to engage public in NRW reduction activities
Establishing social networks for water management that consist of local communities could be an alternative strategy for the water service providers to engage local people in NRW management. For example, if Perlis’s water service provider does not have funding to develop an ICT strategy to support an NRW reduction activity, a community-based leak detection team that consists of local people, the village committee, and NGOs could be formed and coordinated by the water service provider to communicate problems on the ground and broadcast news related to water supply—including identifying illegal pipe connections and reporting pipe leakages.

6. Conclusions

The objective of this study has been to understand the public’s perception of NRW management in order to provide policy inputs and to determine ways to improve public participation in NRW reduction. Findings highlight that there is meagre public participation in NRW management in Malaysia. The main findings of this study are: (i) the majority of the respondents do not have good understanding of what NRW is and they are still lacking in awareness of the seriousness of NRW issue in the country; (ii) respondents expect water service provider and government’s agencies to play a bigger role in reducing NRW rates; (iii) there are significant numbers of respondents from Perlis State who prefer to solve their water supply problems by developing more water resources instead of managing water demand; and (iv) the majority of the respondents do not report to water service providers when they find leaking or bursting pipes on the road, and most of them do not save the water service provider’s phone number into their mobile phones. Based on these findings, public involvement in NRW management in Malaysia still has plenty of room for improvement. In this regard, the aforementioned policy implications have useful opportunities for supporting urban water strategy and policy formulation and implementation.
Reducing NRW requires contributions from all relevant water stakeholders. Ranging from organising an awareness raising campaign to planning a NRW reduction policy, all the issues and challenges need to be well managed to ensure that a water service provider will be able to reduce its NRW rates effectively. The findings in this study indicate that effectively engaging the public in NRW reduction in Malaysia remains at an early stage, as most of the respondents still do not have a good awareness and knowledge of NRW; and the water service provider’s NRW reduction strategies have not successfully engaged the public in NRW reduction activities. In Malaysia, there have not been success stories to draw on of effective engagement of the public in water management, and water governance in Malaysia is still largely based on a top-down approach. Water management, including NRW management in the country, needs a paradigm shift away from this traditional top-down approach towards a bottom-up approach, which emphasizes the involvements of multiple-stakeholders. This will go a long way towards enhancing Malaysia’s water security and moving the country forward towards achieving sustainable water resource management. Finally, considering different approaches are applied to engage people in urban and rural areas in NRW management, more research on the awareness and perceptions of rural populations on NRW issues are needed. Finally, as Malaysia is a multicultural society, more studies are needed to understand how different ethnic groups perceive NRW reduction, and what underpins their perceptions.

Acknowledgments

The authors acknowledge Water Watch Penang and the funding in the research grant titled “Effects of Floods on Human Society and the Role of Social Capital in Recovery in Malaysia”, Fundamental Research Grant (FRGS) from Ministry of Education Malaysia, Account Number 203/PHUMANITI/6711393 which funded the research, production of the data and finally the publication of this paper.

Author Contributions

Chee Hui Lai and Ngai Weng Chan contributed to the conception and design of the study. Chee Hui Lai led the collection and analysis of data and drafting the manuscript. Ranjan Roy interpreted the results, edited and reviewed the article.

Conflicts of Interest

The authors declare no conflict of interest.

Appendix A. Defining Water Losses: The IWA Standard Terminology

Table A1. International Water Association (IWA) Standard International Water Balance and Terminology. Adapted from [1].
System Input VolumeAuthorized Consumption m3/yearBilled Authorized Consumption m3/yearBilled Metered Consumption (including water exported)Revenue Water m3/year
Billed Unmetered Consumption
Unbilled Authorized Consumption m3/yearUnbilled Metered ConsumptionNon-Revenue Water (NRW) m3/year
Unbilled Unmetered Consumption
Water Losses m3/yearApparent Losses m3/yearUnauthorized Consumption (illegal water use)
Metered Inaccuracies
Real Losses m3/yearLeakage on Transmission and/or Distribution Mains
Leakage and Overflow at Utility’s Storage Tanks
Leakage on Service Connections up to the point of Customer Metering

References

  1. Lambert, A.; Hirner, W. Losses from Water Supply System: Standard Terminology and Recommended Performance Measures; The Blue Page: The IWA Information Sources on Drinking Water Issues; IWA Publishing: London, UK, 2000. [Google Scholar]
  2. Farley, M.; Wyeth, G.; Zainuddin, G.; Istandar, A.; Singh, S. The Manager’s Non-Revenue Water Handbook: A Guide to Understanding Water Losses; Ranhill Utilities & United States Agency for International Development (USAIN): Bangkok, Thailand, 2008. [Google Scholar]
  3. Fanner, P. Assessing real water loss: A practical approach. In Water21; IWA Publishing: London, UK, 2004; pp. 49–50. [Google Scholar]
  4. Kingdom, B.; Liemberger, R.; Marin, P. The Challenge of Reducing Non-Revenue Water (NRW) in Developing Countries—How the Private Sector Can Help: A Look at Performance-Based Service Contracting; World Bank Group, Water Supply & Sanitation Sector Board, Public-Private Infrastructure Advisory Facility: Washington, DC, USA, 2006. [Google Scholar]
  5. Frauendorfer, R.; Liemberger, R. The Issues and Challenges of Reducing Non-Revenue Water; Asian Development Bank: Mandaluyong City, Philippines, 2010. [Google Scholar]
  6. González, F.; García, M.A.; Guardiola, J. Why is non-revenue water so high in so many cities? Int. J. Water Resour. Dev. 2011, 27, 345–360. [Google Scholar] [CrossRef]
  7. Rizzio, A.; Pearson, D.; Stephenson, M.; Harper, N. Apparent water loss control: A practical approach. In Water21; IWA Publishing: London, UK, 2004; pp. 44–45. [Google Scholar]
  8. Thornon, J. Managing leakage by managing pressure: A practical approach. In Water21; IWA Publishing: London, UK, 2003; pp. 43–44. [Google Scholar]
  9. Chan, N.; Roy, R.; Chaffin, B. Water governance in bangladesh: An evaluation of institutional and political context. Water 2016, 8, 403. [Google Scholar] [CrossRef]
  10. Puust, R.; Kapelan, Z.; Savic, D.A.; Koppel, T. A review of methods for leakage management in pipe networks. Urban Water J. 2010, 7, 25–45. [Google Scholar] [CrossRef]
  11. Biswas, A.K.; Tortajada, C. Water Supply of Phnom Penh: A Most Remarkable Transformation; Institute of Water Policy, Lee Kuan Yew of Public Policy: Singapore, 2009. [Google Scholar]
  12. Biswas, A.K.; Tortajada, C. Water supply of phnom penh: An example of good governance. Int. J. Water Resour. Dev. 2010, 26, 157–172. [Google Scholar] [CrossRef]
  13. Asian Development Bank (ADB). Every Drop Counts: Learning from Good Practice in Eigth Asian Cities; Asian Development Bank and Lee Kuan Yew School of Public Policy: Mandaluyong City, Philippines, 2010. [Google Scholar]
  14. Tortajada, C. Water management in singapore. Int. J. Water Resour. Dev. 2006, 22, 227–240. [Google Scholar] [CrossRef]
  15. Ministry of Environment and Water Resources (MEWR). Key Environment Statistic: Water Resource Management. Available online: http://app.mewr.gov.sg/web/Contents/contents.aspx?ContId=682 (accessed on 18 March 2015).
  16. Public Utilities Board (PUB). Low Unaccounted for Water: Ensuring Low Unaccounted-for-Water, Pub Singapore’s Experience; Public Utlities Board: Singapore, 2011. [Google Scholar]
  17. Abdullah, Z.; Mohamed, A. Water—A situation appraisal and possible actions at the community level. In Seminar on Local Communities and the Environment II; Environment Protection Society Malaysia: Petaling Jaya, Malaysia, 1998. [Google Scholar]
  18. Chan, N.W. Managing Water Resources in the 21st Century Involving All Stakeholders towards Sustainable Water Resources Management in Malaysia; Centre for Graduate Studies UKM: Bangi, Malaysia, 2004. [Google Scholar]
  19. Economic Planning Unit, Prime Minister Department (EPU). Eight Malaysia Plan; Government of Malaysia: Kuala Lumpur, Malaysia, 2001.
  20. Economic Planning Unit, Prime Minister Department (EPU). Ninth Malaysia Plan; Government of Malaysia: Kuala Lumpur, Malaysia, 2006.
  21. Economic Planning Unit, Prime Minister Department (EPU). Tenth Malaysia Plan; Government of Malaysia: Kuala Lumpur, Malaysia, 2010.
  22. Malaysian Water Association (MWA). Malaysia Water Industry Guide 2014; Malaysian Water Association: Kuala Lumpur, Malaysia, 2014. [Google Scholar]
  23. Kanakoudis, V.; Tsitsifli, S. Urban water services public infrastructure projects: Turning the high level of the nrw into an attractive financing opportunity using the pbsc tool. Desalination Water Treat. 2012, 39, 323–335. [Google Scholar] [CrossRef]
  24. Teo, Y.H. Water services industry reforms in Malaysia. Int. J. Water Resour. Dev. 2014, 30, 37–46. [Google Scholar] [CrossRef]
  25. Chan, N.W. Issues and challenges in water governance in Malaysia. Iran. J. Environ. Health Sci. Eng. 2009, 6, 143–152. [Google Scholar]
  26. Malaysian Water Association (MWA). Malaysia Water Industry Guide 2008; Malaysian Water Association: Kuala Lumpur, Malaysia, 2008. [Google Scholar]
  27. Malaysian Water Association (MWA). Malaysia Water Industry Guide 2009; Malaysian Water Association: Kuala Lumpur, Malaysia, 2009. [Google Scholar]
  28. Malaysian Water Association (MWA). Malaysia Water Industry Guide 2010; Malaysian Water Association: Kuala Lumpur, Malaysia, 2010. [Google Scholar]
  29. Malaysian Water Association (MWA). Malaysia Water Industry Guide 2011; Malaysian Water Association: Kuala Lumpur, Malaysia, 2011. [Google Scholar]
  30. Malaysian Water Association (MWA). Malaysia Water Industry Guide 2012; Malaysian Water Association: Kuala Lumpur, Malaysia, 2012. [Google Scholar]
  31. Malaysian Water Association (MWA). Malaysia Water Industry Guide 2013; Malaysian Water Association: Kuala Lumpur, Malaysia, 2013. [Google Scholar]
  32. National Water Service Commission (NWSC). Water Rates. Available online: http://www.span.gov.my/pdf/WaterRate.pdf (accessed on 6 December 2016).
  33. Cookey, P.E.; Darnswasdi, R.; Ratanachai, C. Local people’s perceptions of lake basin water governance performance in thailand. Ocean Coast. Manag. 2016, 120, 11–28. [Google Scholar] [CrossRef]
  34. Haron, S.A.; Paim, L.; Yahaya, N. Towards sustainable consumption: An examination of environmental knowledge among Malaysians. Int. J. Consum. Stud. 2005, 29, 426–432. [Google Scholar] [CrossRef]
  35. Ang, K.H.; Marsuki, M.Z. Public perception towards environmental awareness. Case study: Malacca river. Int. J. Acad. Res. Environ. Geogr. 2014, 1, 53–61. [Google Scholar]
  36. Afroz, R.; Banna, H.; Masud, M.M.; Akhtar, R.; Yahaya, S.R. Household’s perception of water pollution and its economic impact on human health in Malaysia. Desalination Water Treat. 2016, 57, 115–123. [Google Scholar] [CrossRef]
  37. Sharma, D.S.K.; Mathew, D.; Chan, N.W.; Wong, C.F. Employment of water demand management measures for effective water resources management in Malaysia. In Proceedings of the World Conference on Environmental Management, Bangi, Malaysia, 13–14 September 2004; Jahi, J.M., Ariffin, K., Surif, S., Idrus, S., Eds.; Universiti Kebangsaan Malaysia and Environmental Management Society Malaysia: Bangi, Malaysia, 2004; pp. 235–249. [Google Scholar]
  38. Mugabi, J.; Kayaga, S. Attitudinal and socio-demographic effects on willingness to pay for water services and actual payment behaviour. Urban Water J. 2010, 7, 287–300. [Google Scholar] [CrossRef] [Green Version]
  39. Laspidou, C.S. Ict and stakeholder participation for improved urban water managemetn in the cities of the future. Water Util. J. 2014, 8, 79–85. [Google Scholar]
  40. Soto-Garcia, M.; Del-Amor-Saavedra, P.; Martin-Gorriz, B.; Martínez-Alvarez, V. The role of information and communication technologies in the modernisation of water user associations’ management. Comput. Electron. Agric. 2013, 98, 121–130. [Google Scholar] [CrossRef]
Figure 1. Public knowledge on NRW (Do you know what Non-Revenue Water is?).
Water 09 00026 g001
Figure 2. Public perception of the seriousness of water loss issue in Malaysia.
Water 09 00026 g002
Figure 3. Public preference of the solution in solving Malaysia’s water supply issue.
Water 09 00026 g003
Figure 4. Self-responsibility towards water loss issue.
Water 09 00026 g004
Figure 5. Experience of seeing pipe leaking or pipe burst by the road.
Water 09 00026 g005
Figure 6. Behaviour towards pipe leaking or pipe burst issue.
Water 09 00026 g006
Figure 7. Percentage of respondents that saved phone number of water utilities in their mobile phone.
Water 09 00026 g007
Figure 8. Action towards pipe leaking or pipe burst issue.
Water 09 00026 g008
Table 1. Water Statistic and NRW-related Performance Indicators of Penang State and Perlis State.
Water Statistic in 2013PenangPerlis
Supply Coverage99.9%99.5%
Total water treatment plant105
Total Water Produced988 MLD211 MLD
Billed Authorized Consumption809 MLD80 MLD
NRW Rate (Volume of NRW)18.2% (179 MLD)62.4% (132 MLD)
Real Loss14.9%47.4%
Apparent Loss3.2%15%
Unbilled Authorized Consumption0.1%0%
NRW Department/Unit in the Water UtilityYesNo
Number of 24-h customer call centre10
Total Pipe Length4236 km1858 km
Total Connection546,74966,938
Network Density4.04 km of pipe/km22.26 km of pipe/km2
Domestic Consumption296 l/c/d242 l/c/d
Notes: Source: MWA [22], Penang Water Supply Corporation, and Perlis State Public Work Department.
Table 2. Demographic profiles of the respondents.
ItemPenangPerlis
FrequencyPercentageFrequencyPercentage
Gender
Male21751.320250.2
Female20648.720049.8
Age (years)
18–20327.65814.2
21–3014133.314135.1
31–4012830.38922.4
41–505312.54912.2
>506916.36516.2
Ethnicity
Malay9622.723859.2
Chinese24658.212731.6
Indian4911.6379.2
Others327.600
Monthly Income (US Dollar) a
No income9121.511428.4
<3505412.88019.9
350–69914333.812731.6
700–11649522.56616.4
≥1165409.5153.7
Education level
Primary4310.1389.5
Secondary13632.215237.8
Tertiary24457.721252.7
Notes: N = 825; a 1 USD = 4.29 Malaysian Ringgit (according to the exchange rate of Central Bank of Malaysia published on 31 December 2015. Website: http://www.bnm.gov.my/).
Table 3. Perception of the major water issues in Malaysia (Respond “yes, it is one of the major water issues in the country” to the mentioned water issues).
Water IssuesGeorge Town (n = 423)Kangar (n = 402)x2dfp Value
River pollution219 (51.8%)238 (59.2%)4.31010.038 *
Human waste water225 (53.2%)178 (44.3%)6.20110.010 *
Bad water quality160 (37.8%)206 (51.2%)14.49810.000 *
Pipe leaking/burst210 (28.4%)166 (41.3%)14.63710.000 *
Flood144 (34.0%)140 (34.8%)0.02710.870
Water disruption75 (17.7%)147 (36.6%)36.23310.000 *
No idea33 (7.8%)7 (1.7%)15.12110.000 *
Note: * Chi-square test for association is significant at the p value <0.05.
Table 4. Public perception of the stakeholder’s responsibility in reducing water loss.
StakeholderCityPercentage of Respondentx2dfp Value
Low ResponsibilityModerate ResponsibilityHigh Responsibility
State’s Water UtilityGeorge Town0.99.989.10.53620.765
Kangar18.590.5
Federal GovernmentGeorge Town3.818.2787.06420.029 *
Kangar5.224.969.9
State GovernmentGeorge Town1.714.783.72.07620.354
Kangar2.217.979.9
Local GovernmentGeorge Town2.615.681.80.40120.818
Kangar3.016.980.1
NGOsGeorge Town24.844.930.38.41320.015 *
Kangar16.748.834.6
Private SectorGeorge Town21.544.234.33.09820.212
Kangar17.449.533.1
PoliticianGeorge Town9.729.3611.92820.381
Kangar12.729.158.2
PublicGeorge Town15.14737.83.01820.221
Kangar19.442.837.8
Note: * Chi-square test for association is significant at the p value <0.05.
Table 5. Public concern of the water loss issue.
Is below Incidents a Serious Problem for You?CityNot a ProblemNot Too Serious ProblemA Somewhat Serious ProblemA Very Serious Problemx2dfp Value
Pipe leaking or burst at the roadGeorge Town1.7%17%40.6%40.7%7.27430.064
Kangar3.5%13.9%47%35.6%
Meter inaccuracy at your homeGeorge Town9%22.7%33.1%35.2%3.38830.336
Kangar9%19.9%39%32.1%
Illegal pipe connectionGeorge Town4.5%13%24.1%58.4%5.30130.151
Kangar1.7%12.4%25.6%60.2%

