
Delineation of Groundwater Potential Area using an AHP, Remote Sensing, and GIS Techniques in the Ifni Basin, Western Anti-Atlas, Morocco

 ,
,  , , ,
, , ,  ,
,
Abstract
:1. Introduction
- (1)
- One approach to mapping potential groundwater areas is data-driven and involves the use of probabilistic statistical techniques. The accuracy of the resulting forecast is influenced by both the quality and quantity of the data used [10]. Several model types have been employed in compiling these maps, including the Dempster–Shafer theory [11,12,13], frequency ratio [14,15,16], logistic regression [17,18], statistical index [12], certainty factor [19], and entropy index [20].
- (2)
- The analytic hierarchy process (AHP) is a decision-making technique that incorporates subjective opinions and evaluates multiple factors to complement decision-making. To delineate GWPA using this model, four key steps are taken: standardization of prospecting factors, generation of a pairwise comparison matrix, checking the consistency of the matrix, and weighting the evaluation factors in a GIS environment [4,10,21,22].
- (3)
- Machine learning techniques (MLT) have shown improved accuracy in many situations due to their ability to process non-linear data with varying scales and from different sources [23,24,25,26]. MLT techniques include several models, such as the aquifer sustainability factor [27], classification and regression tree [28], random forest [28,29], boosted regression tree [30], maximum entropy [31], artificial neural network model [32], and generalized additive model [33].
2. Material and Methods
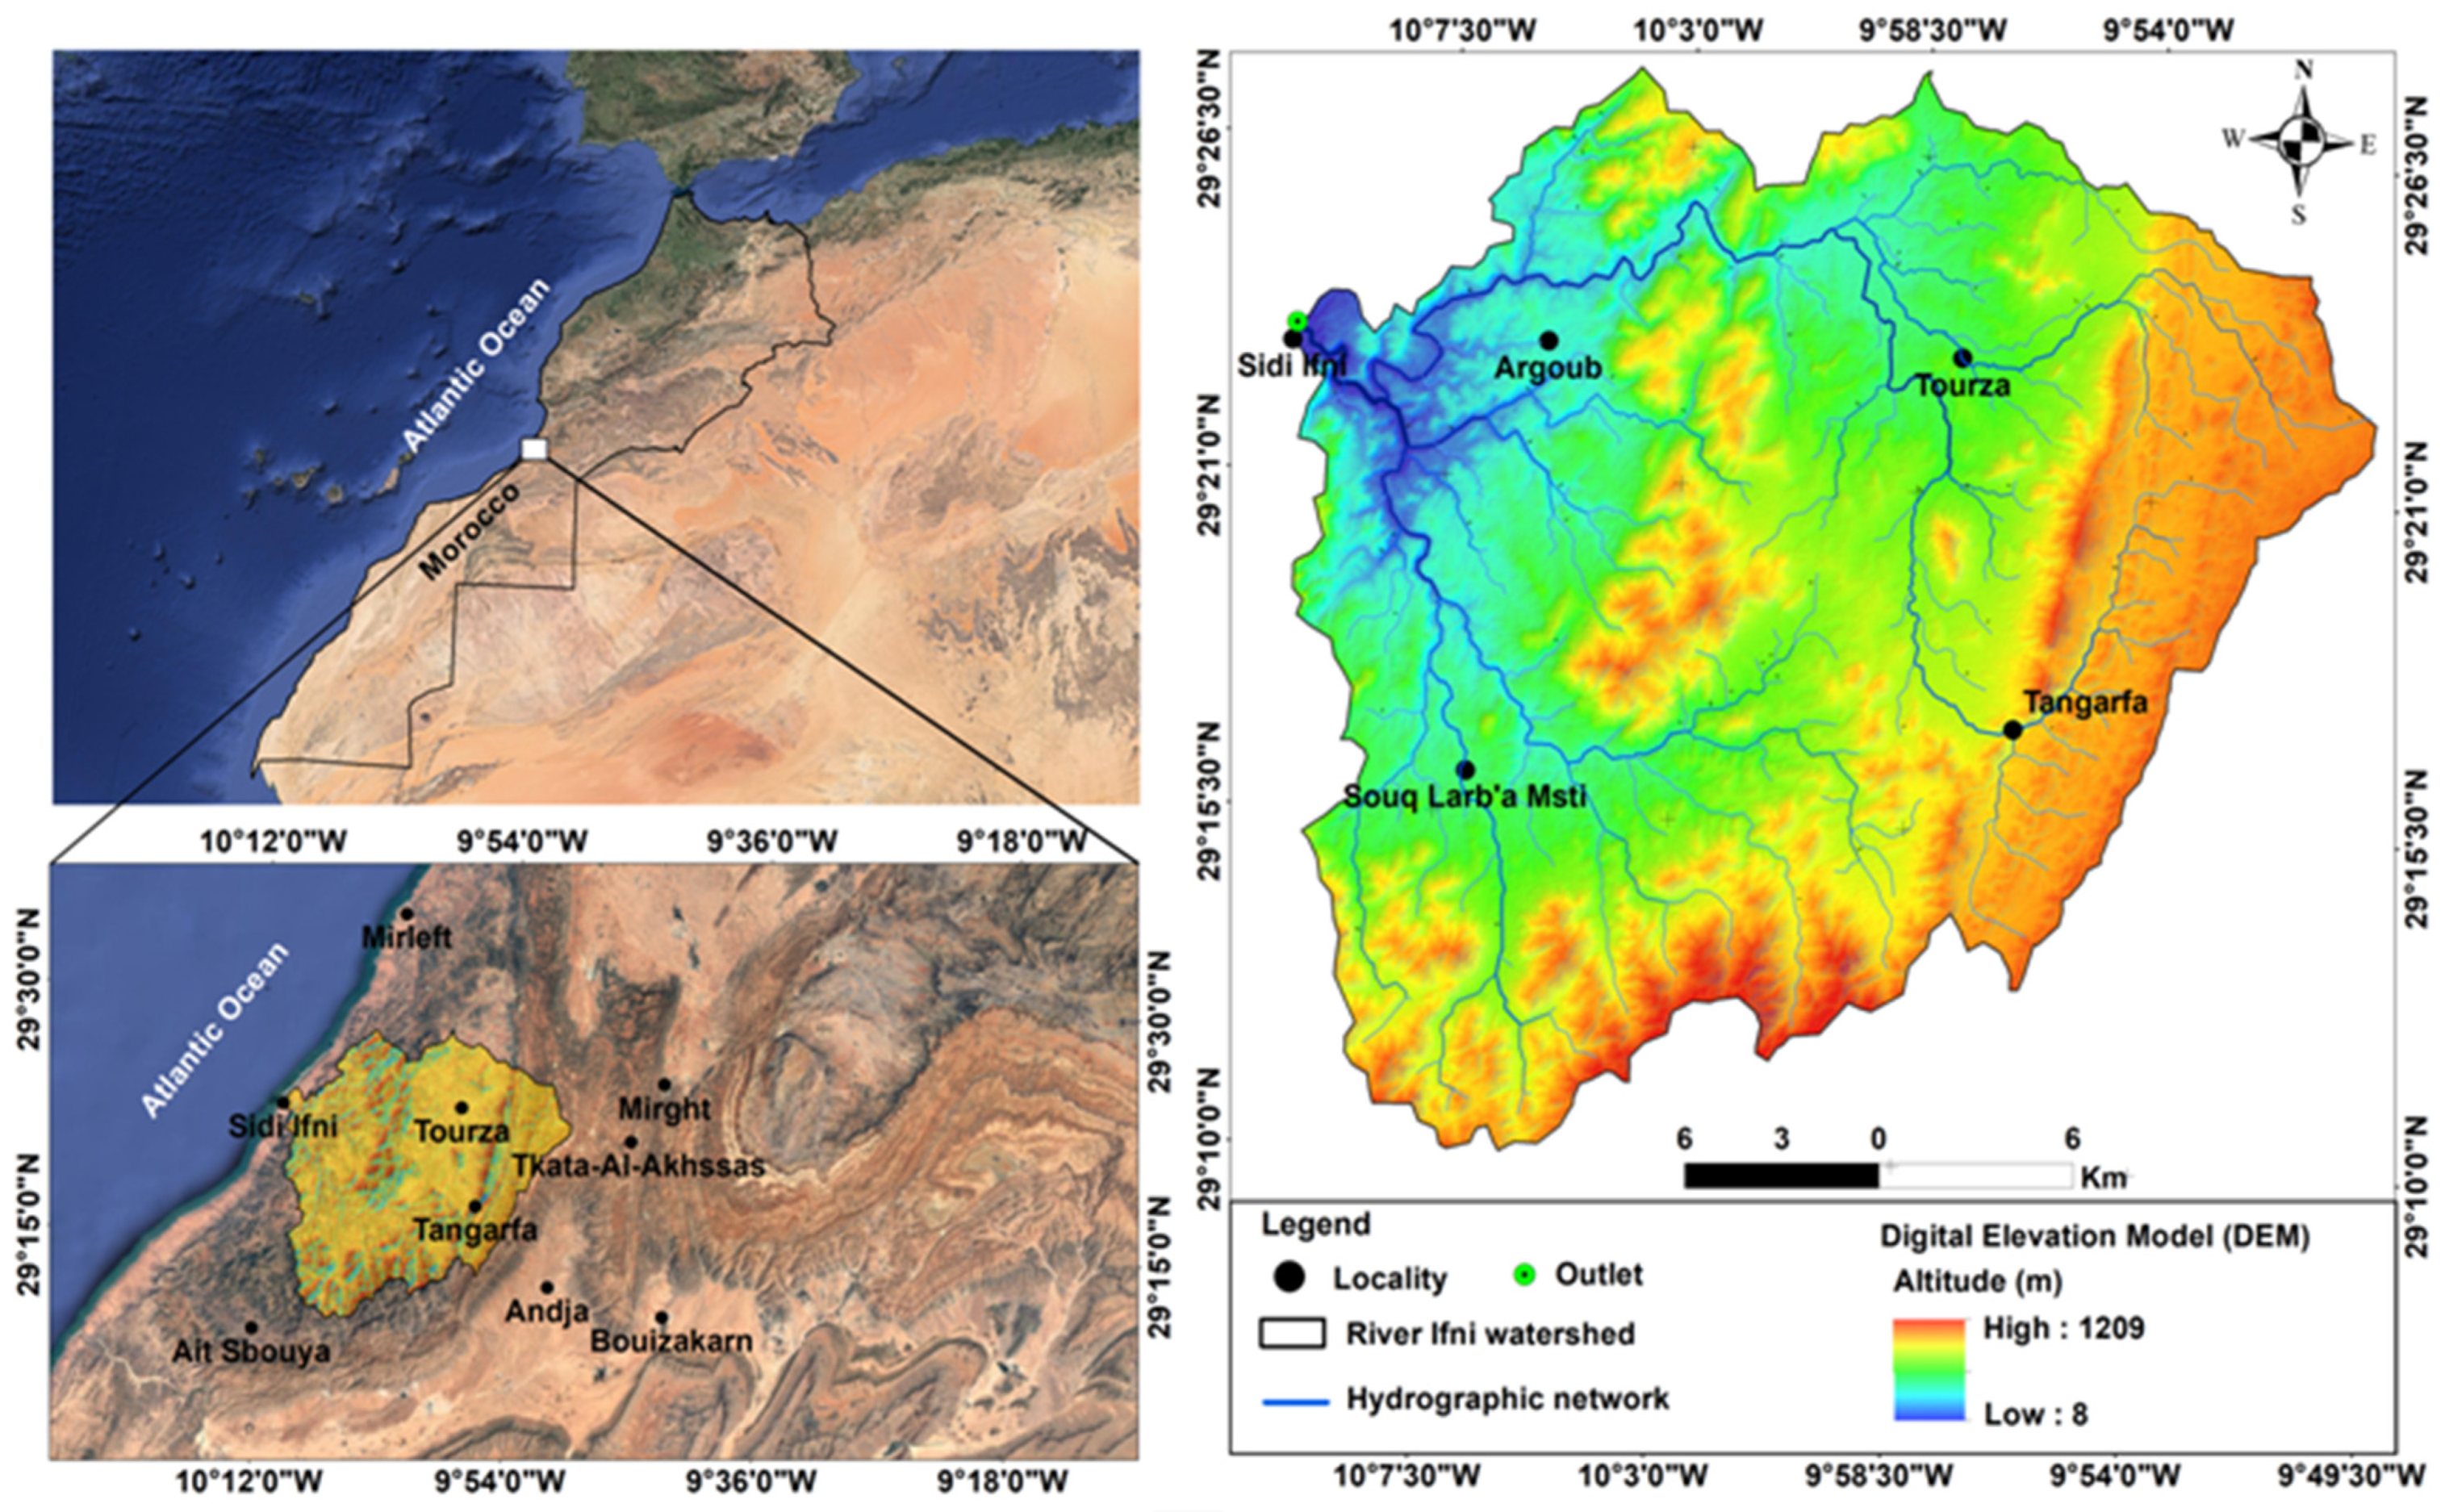
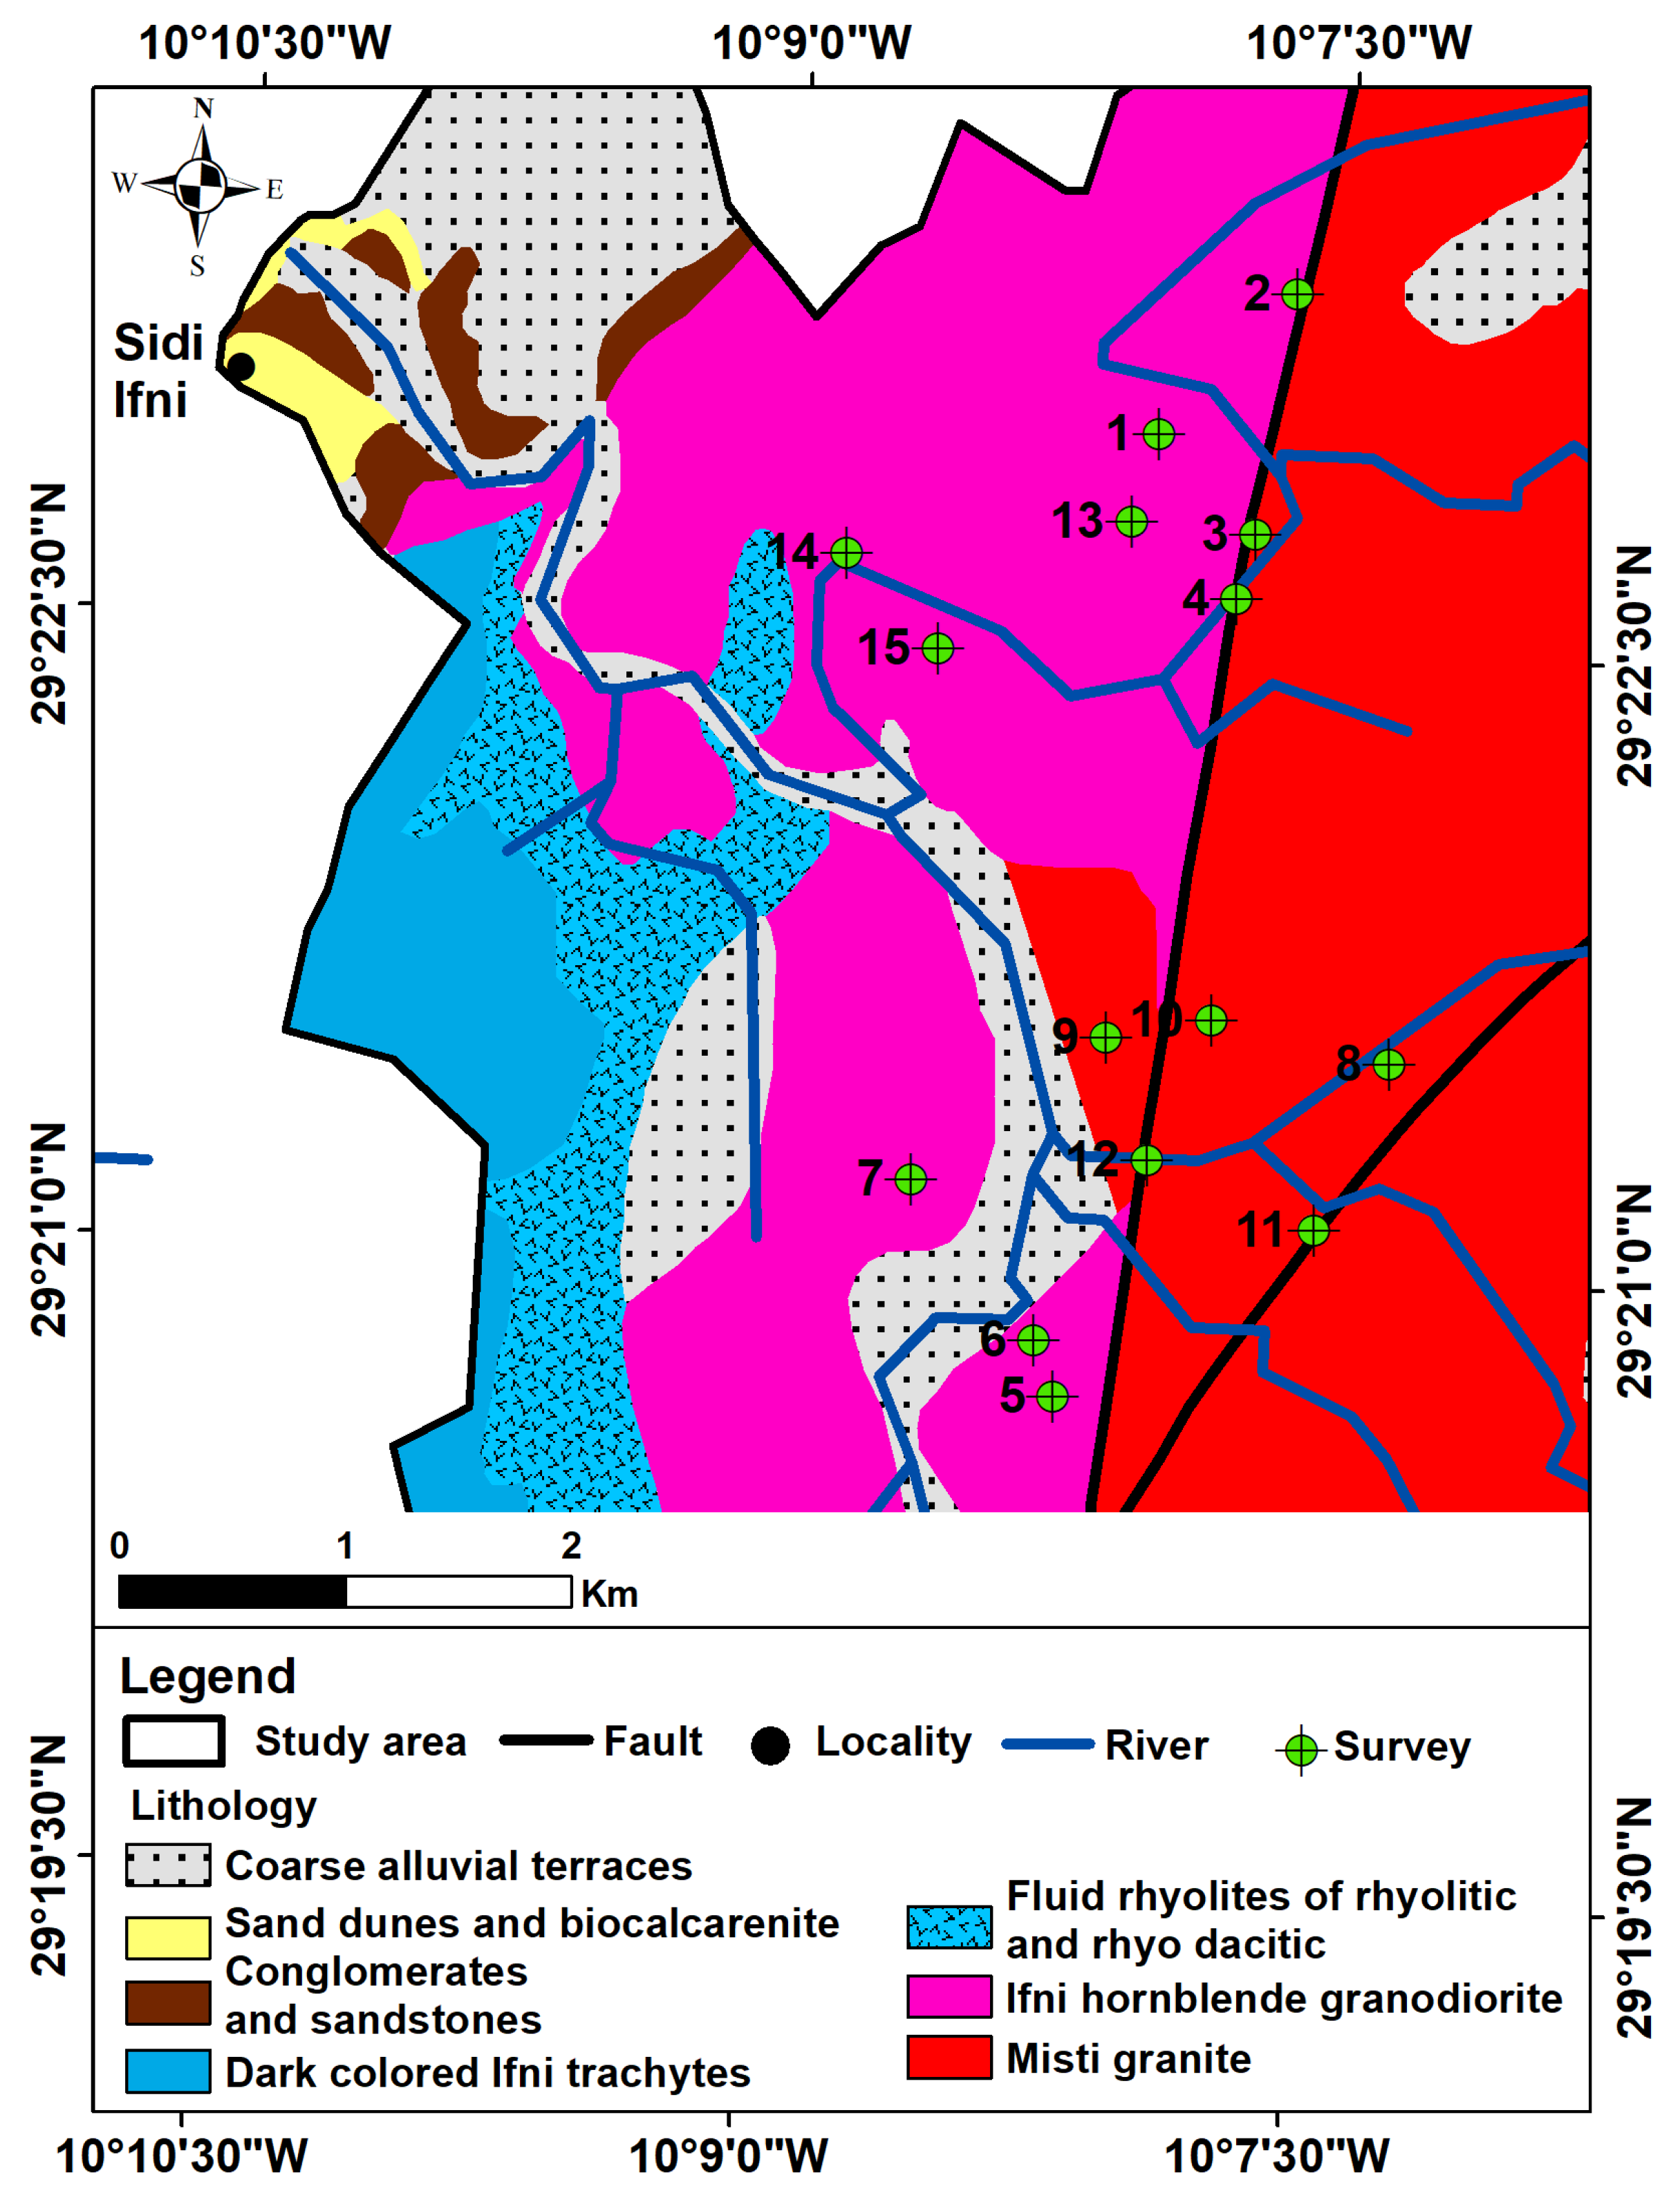
2.1. Study Area
2.2. Methodology
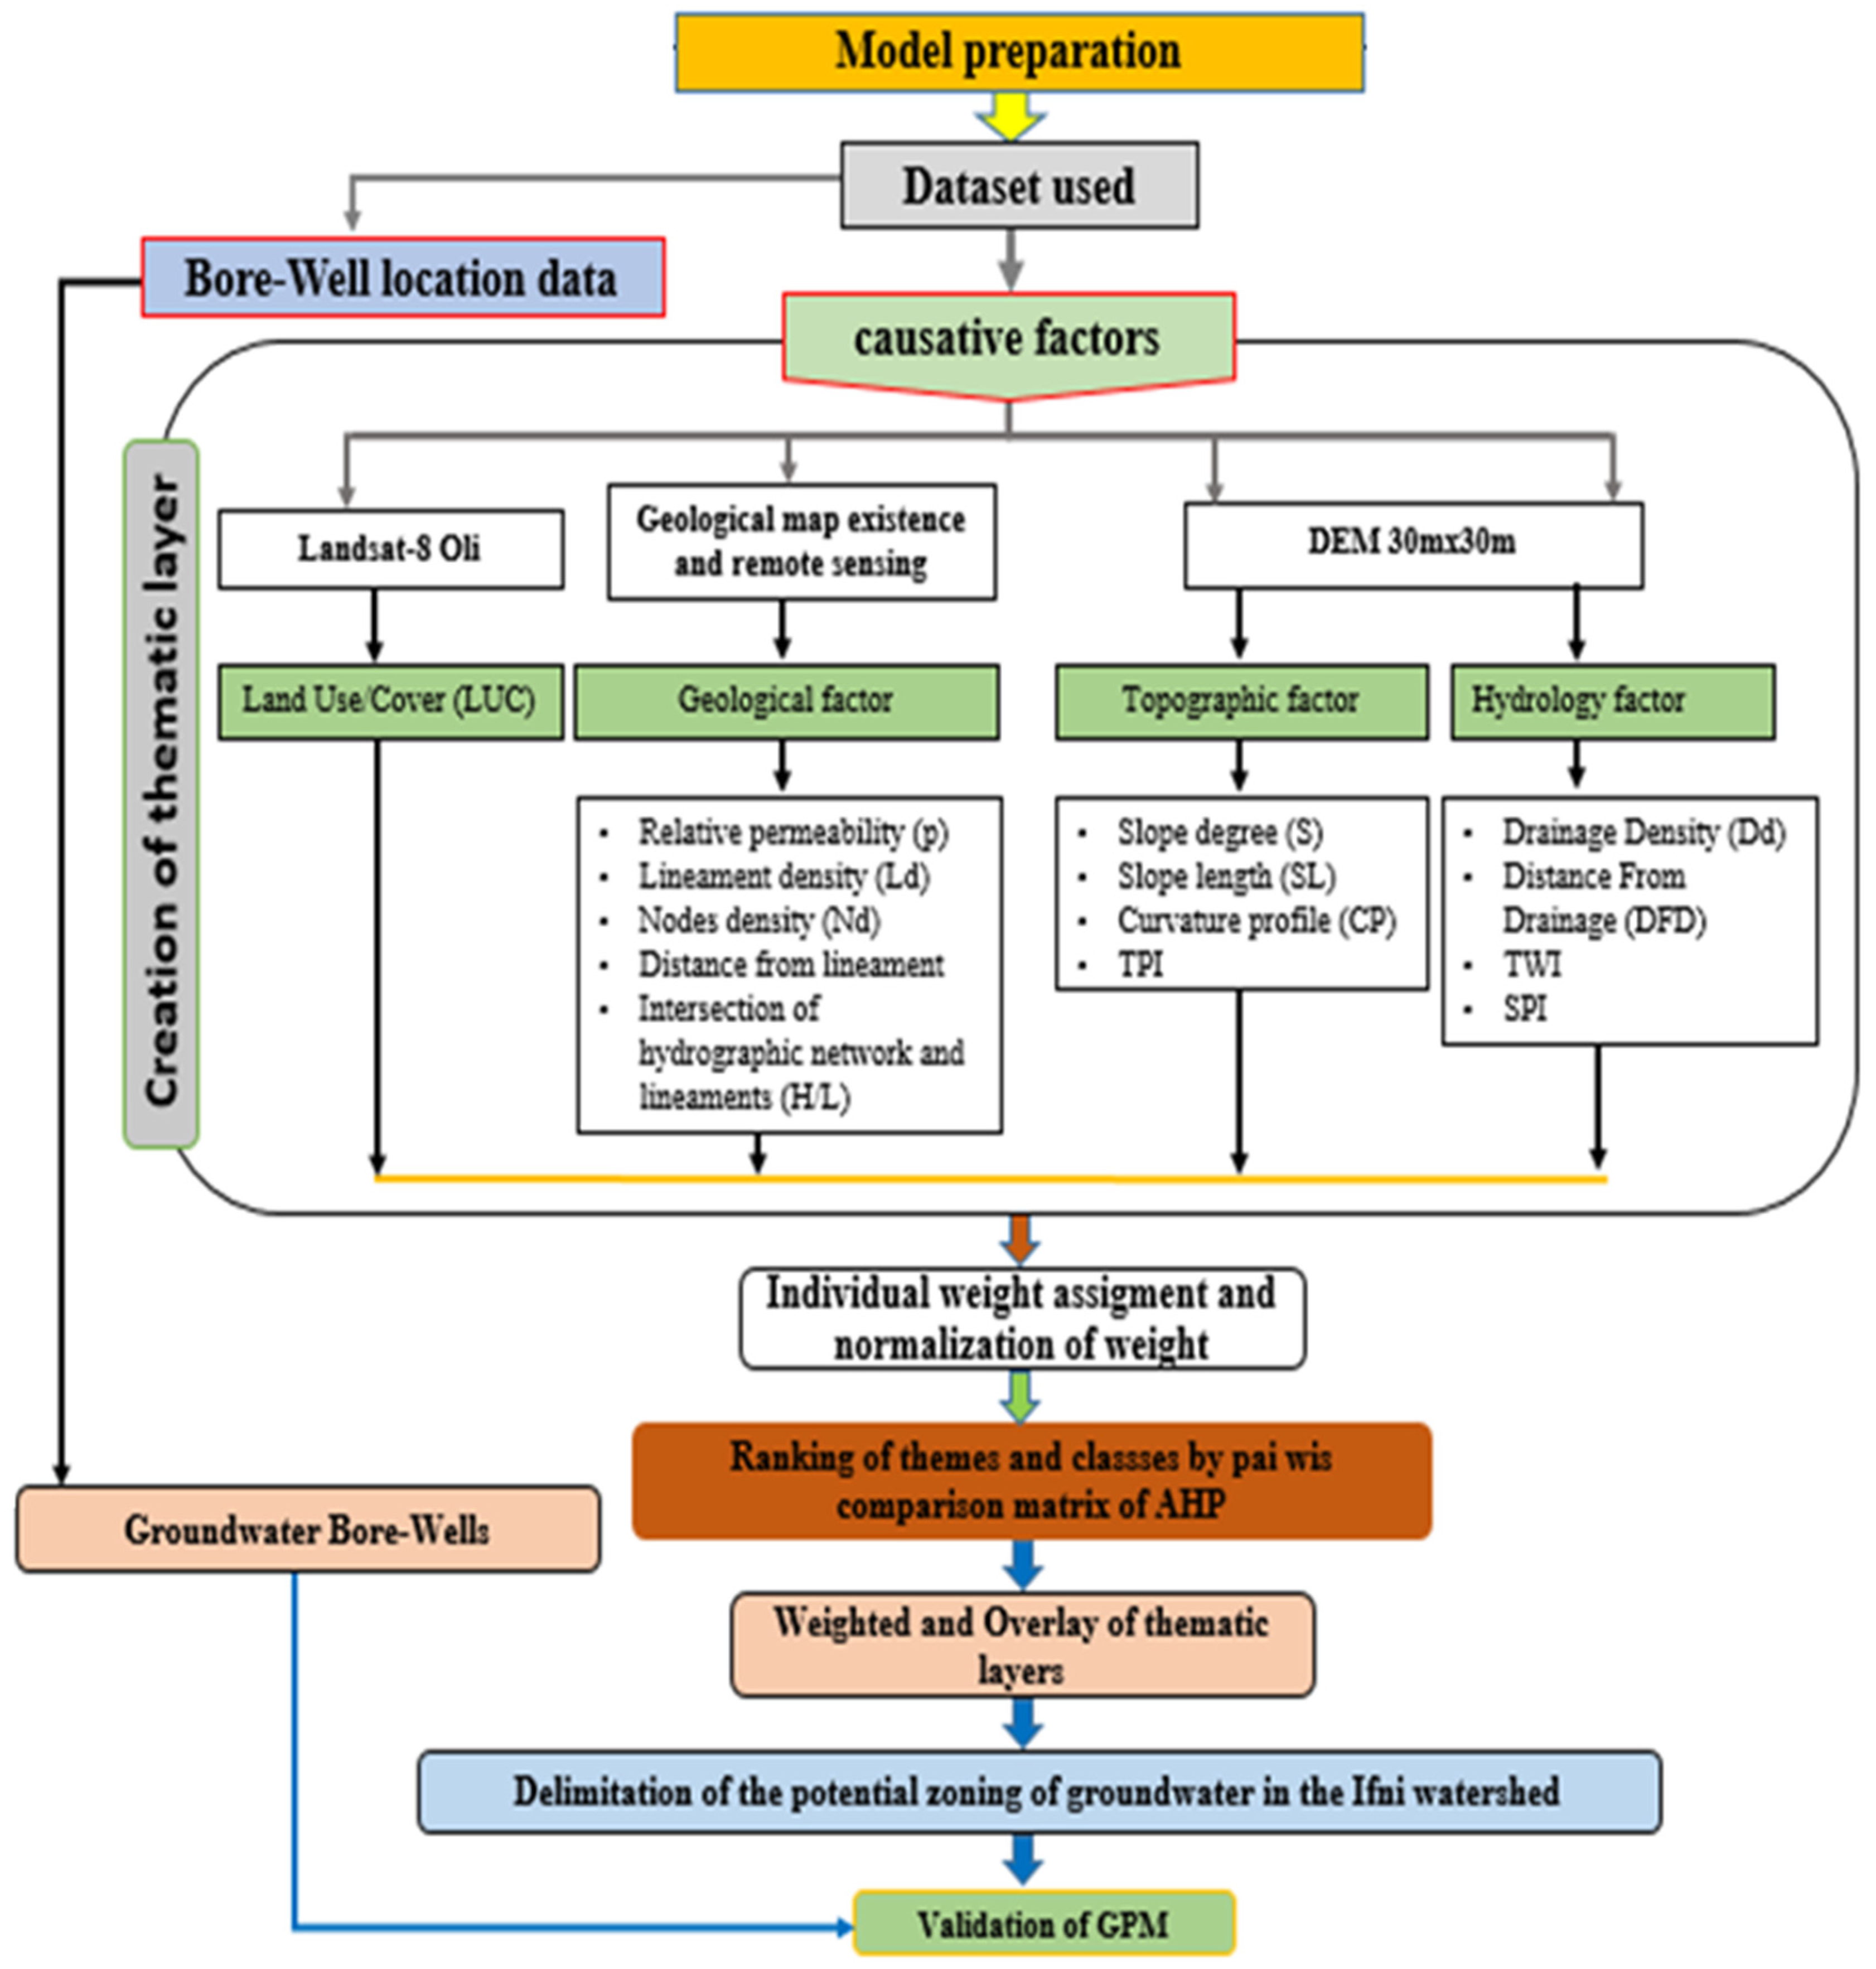
2.2.1. Development of Decision Factor Maps
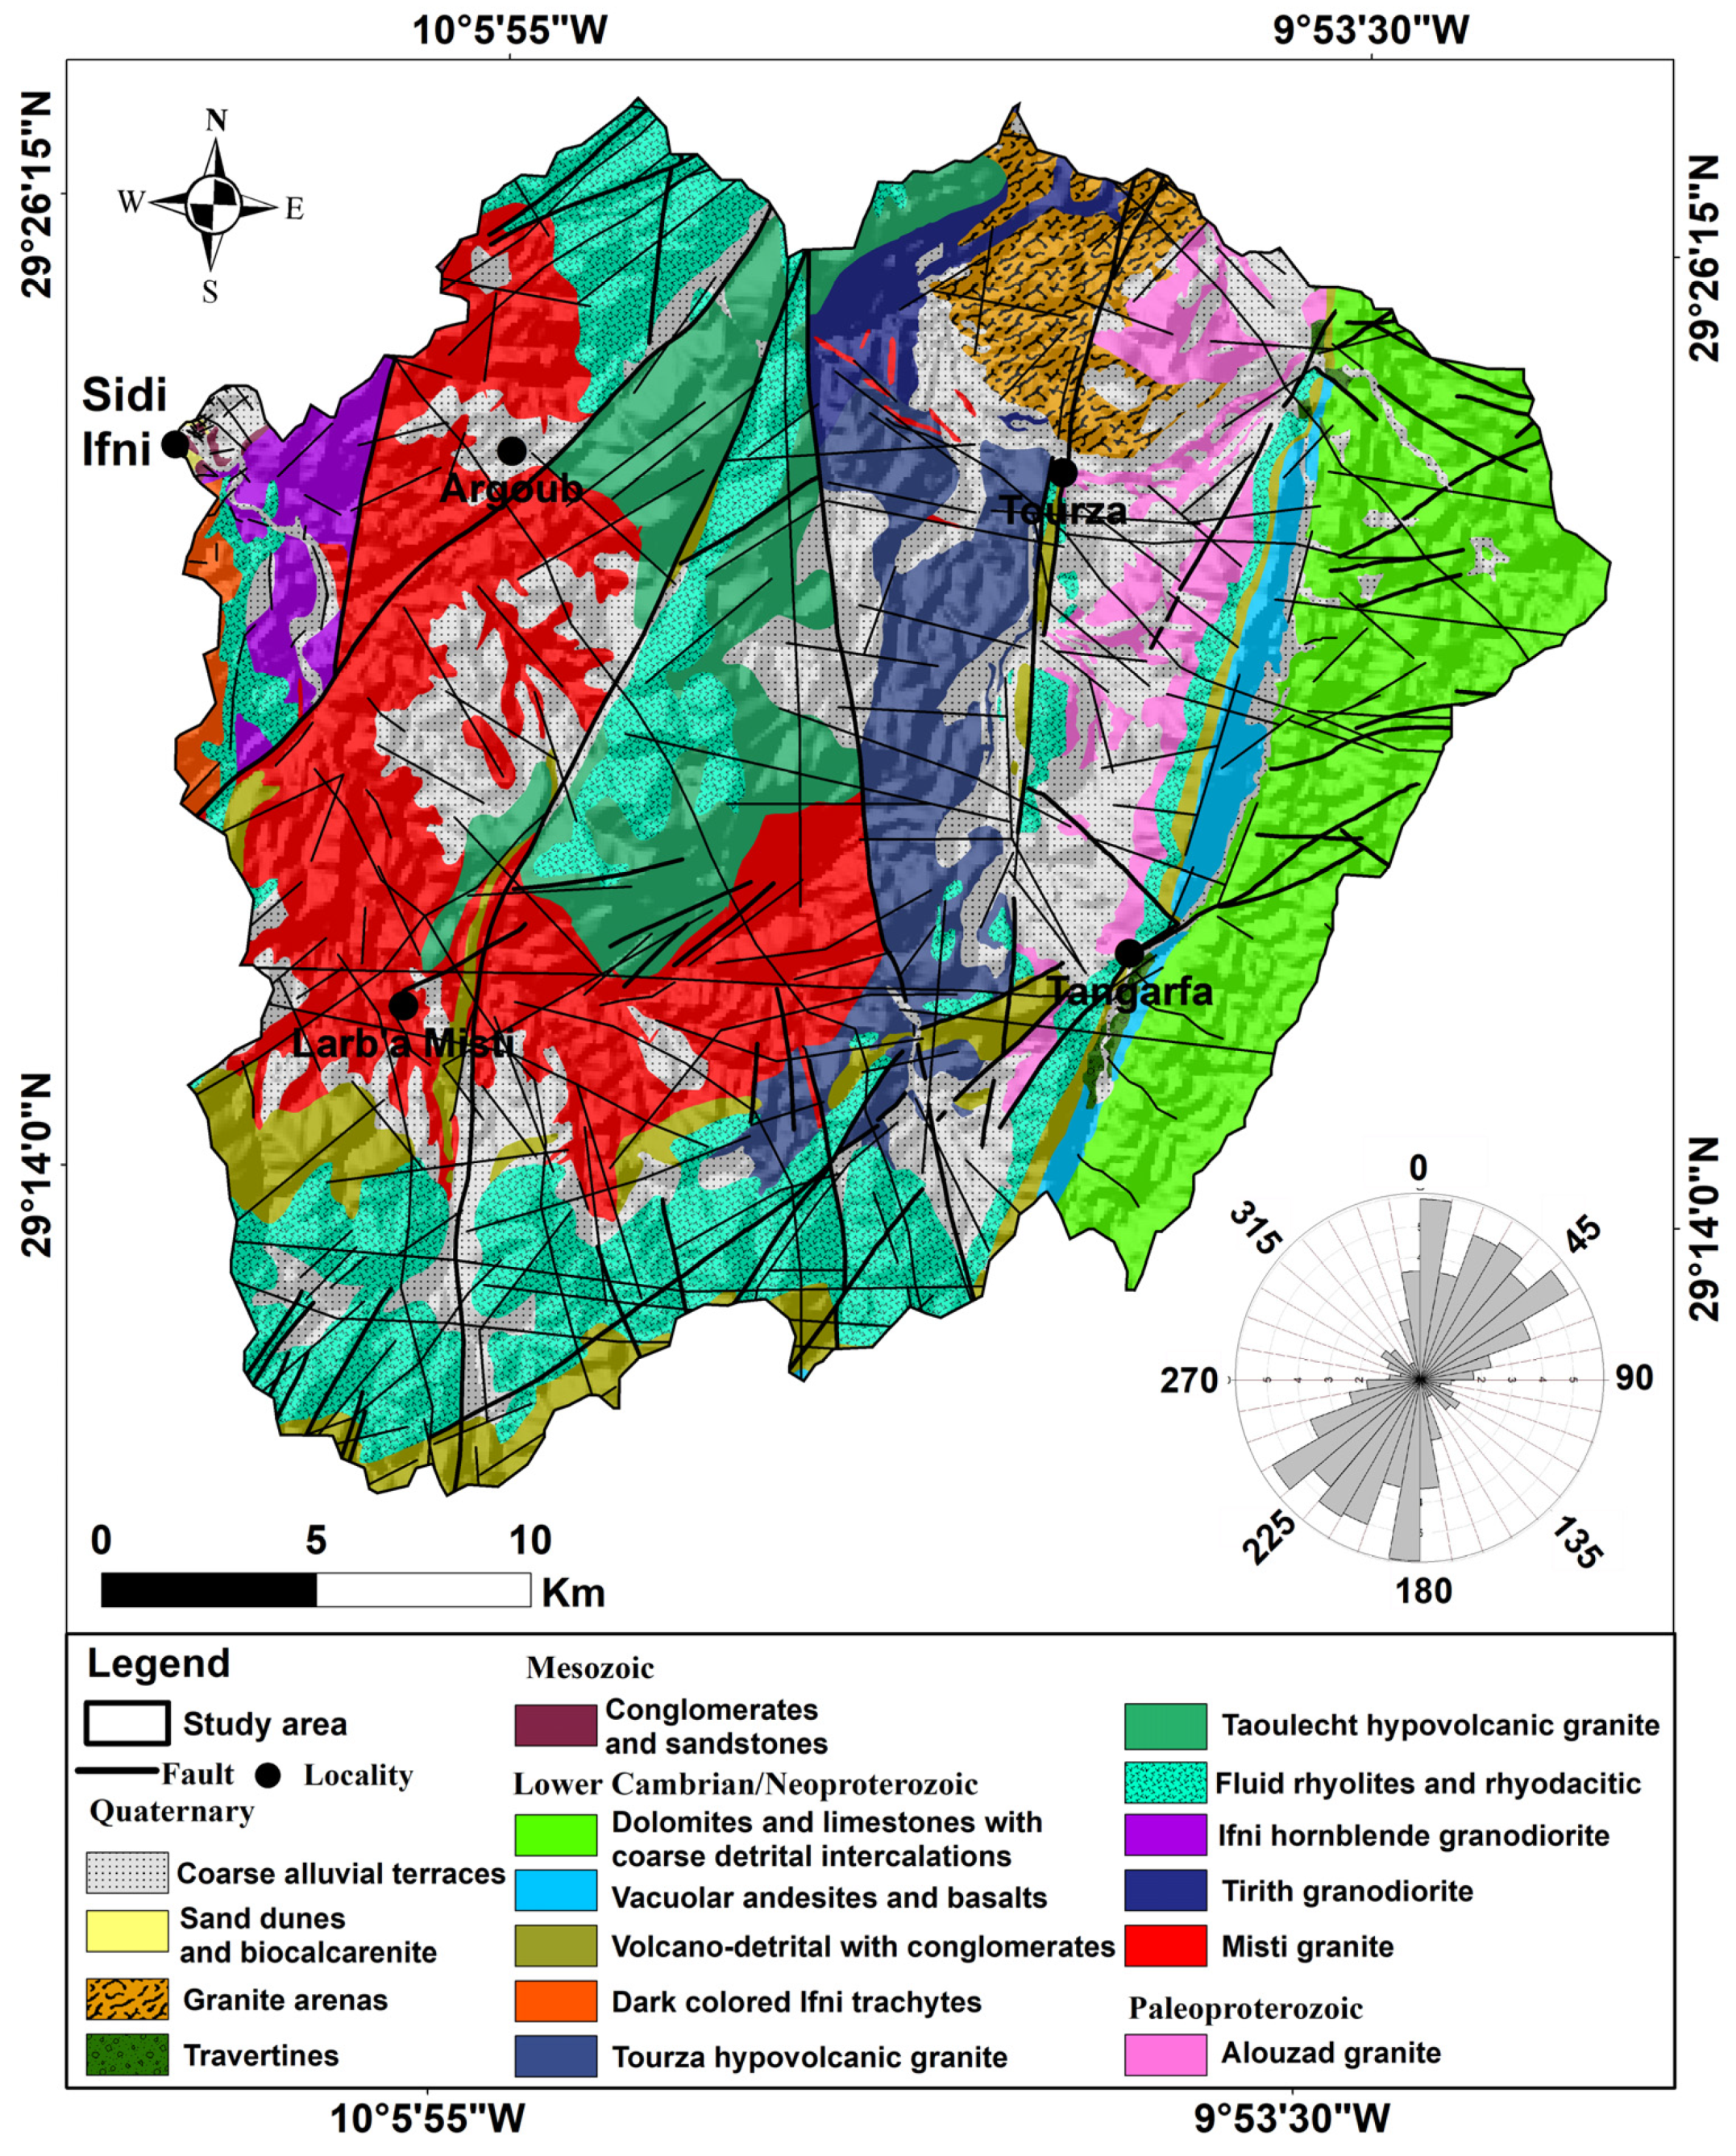
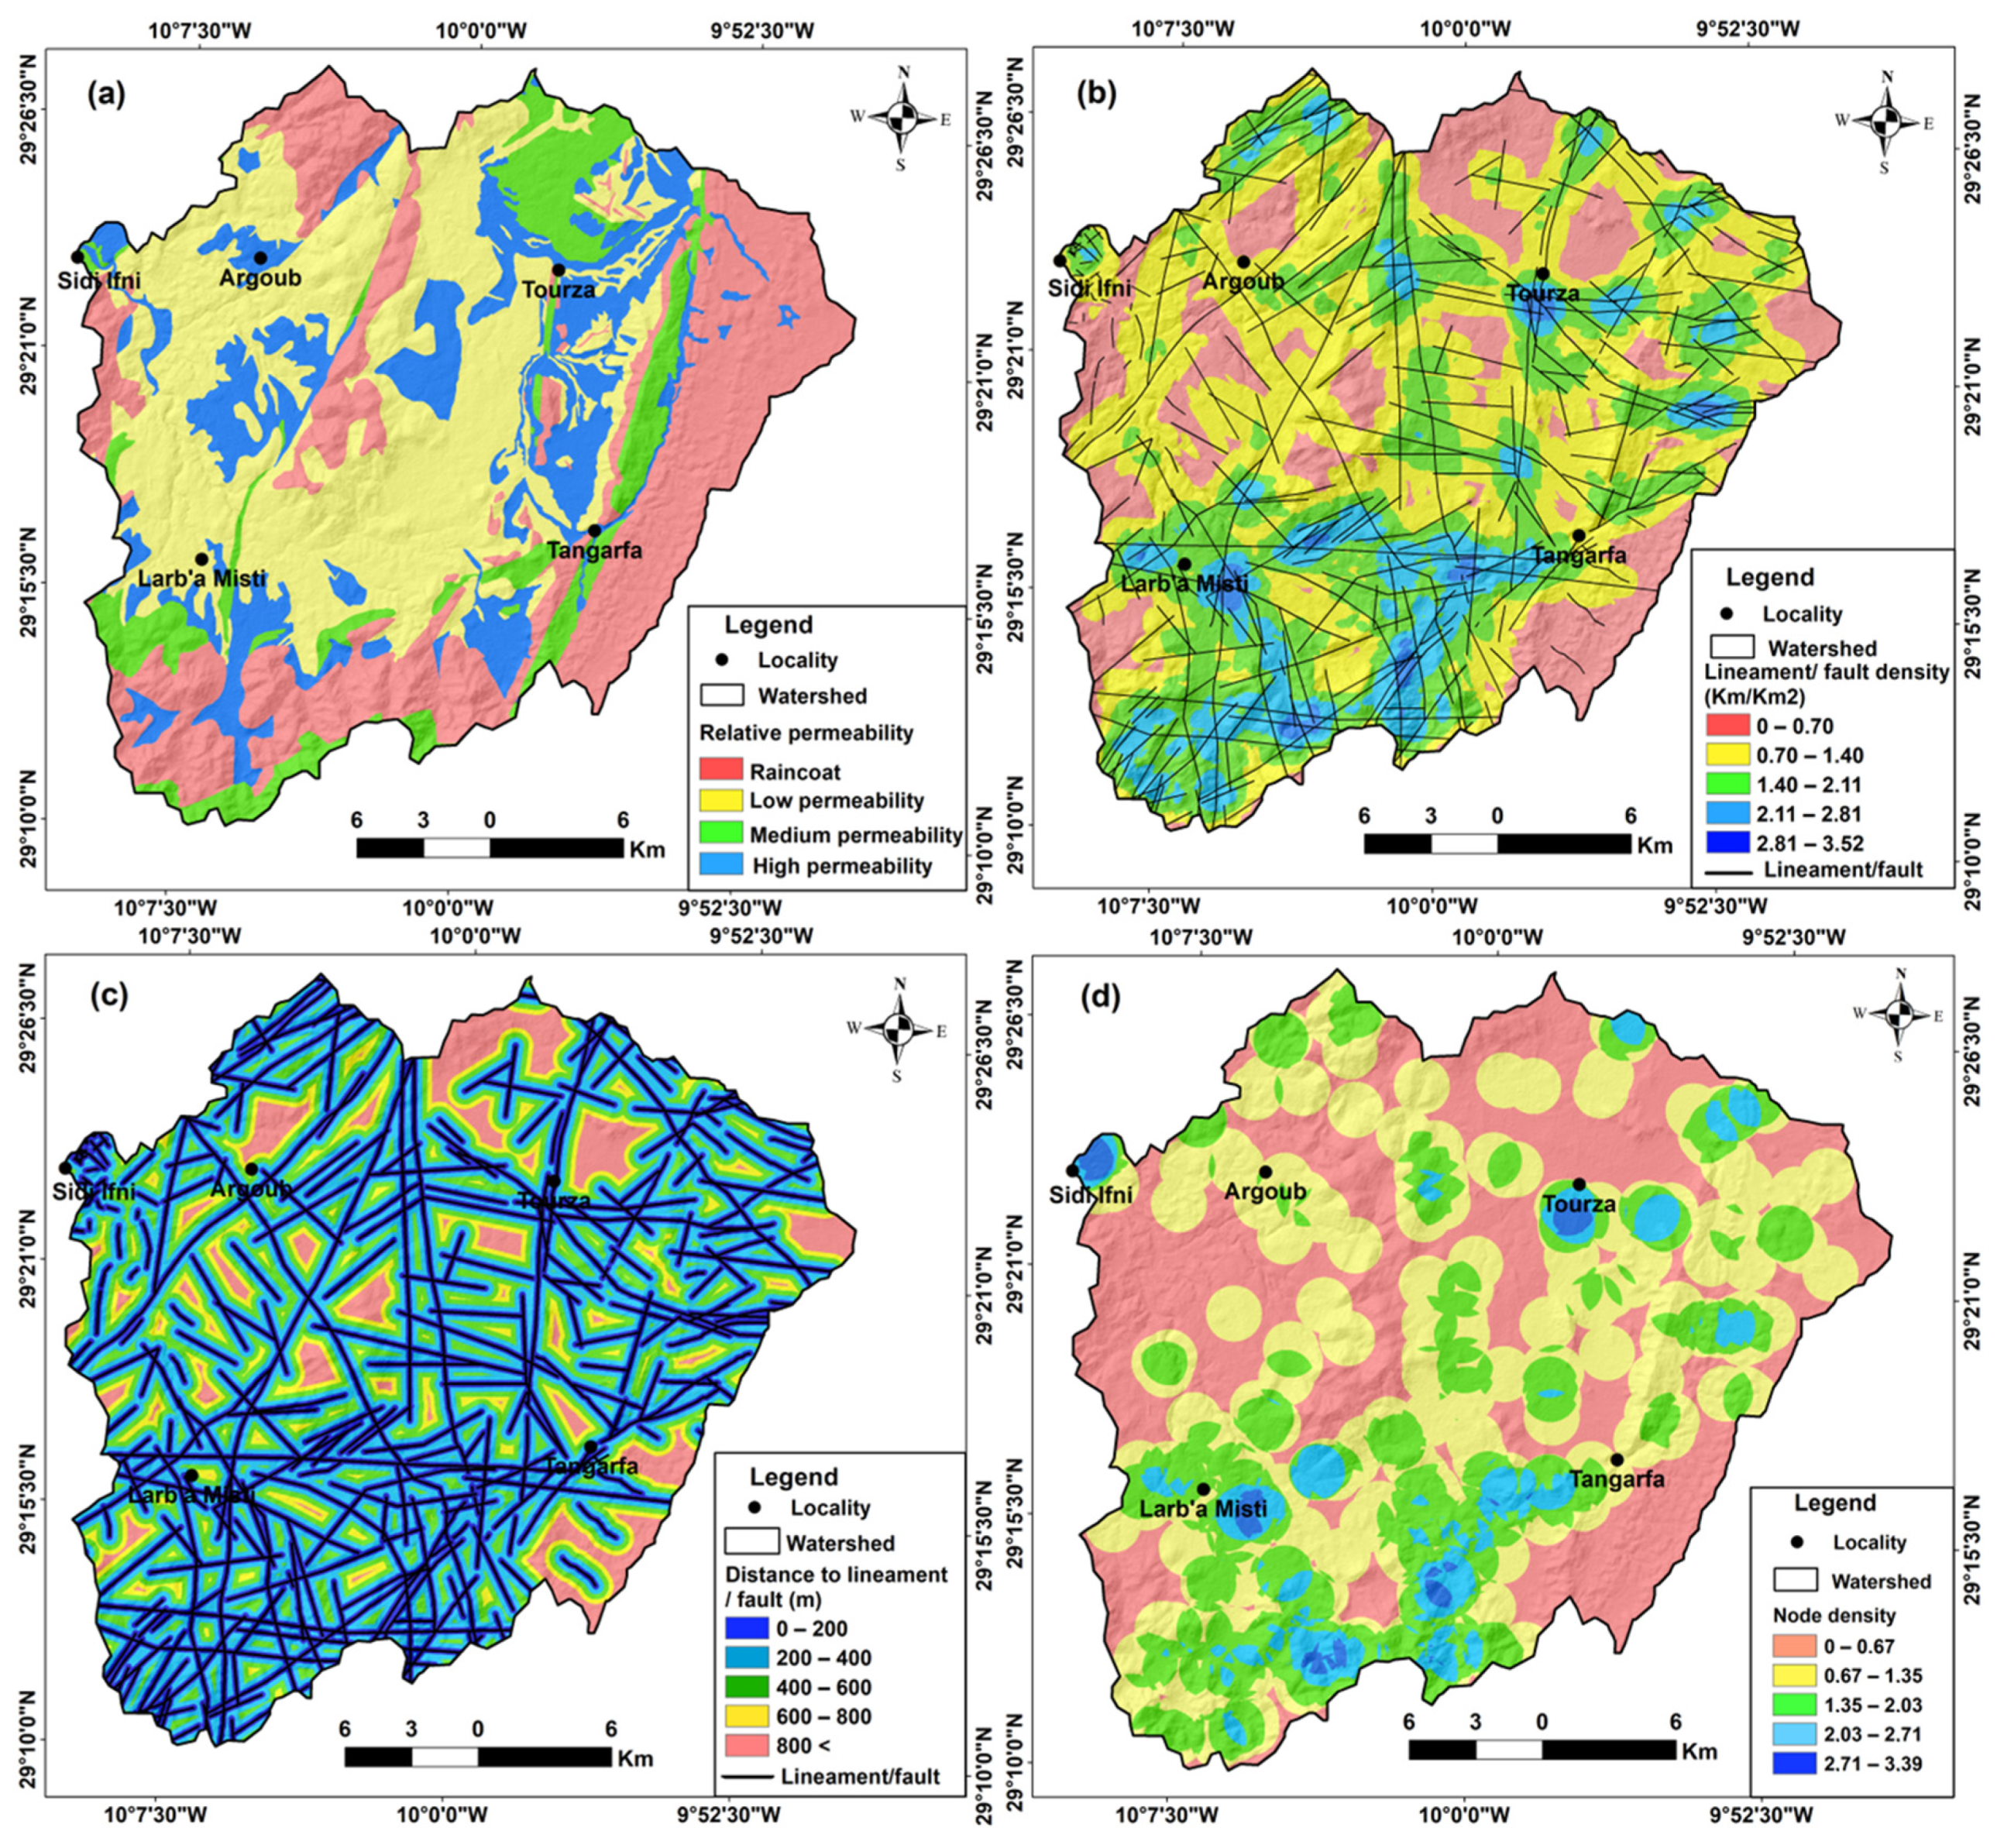
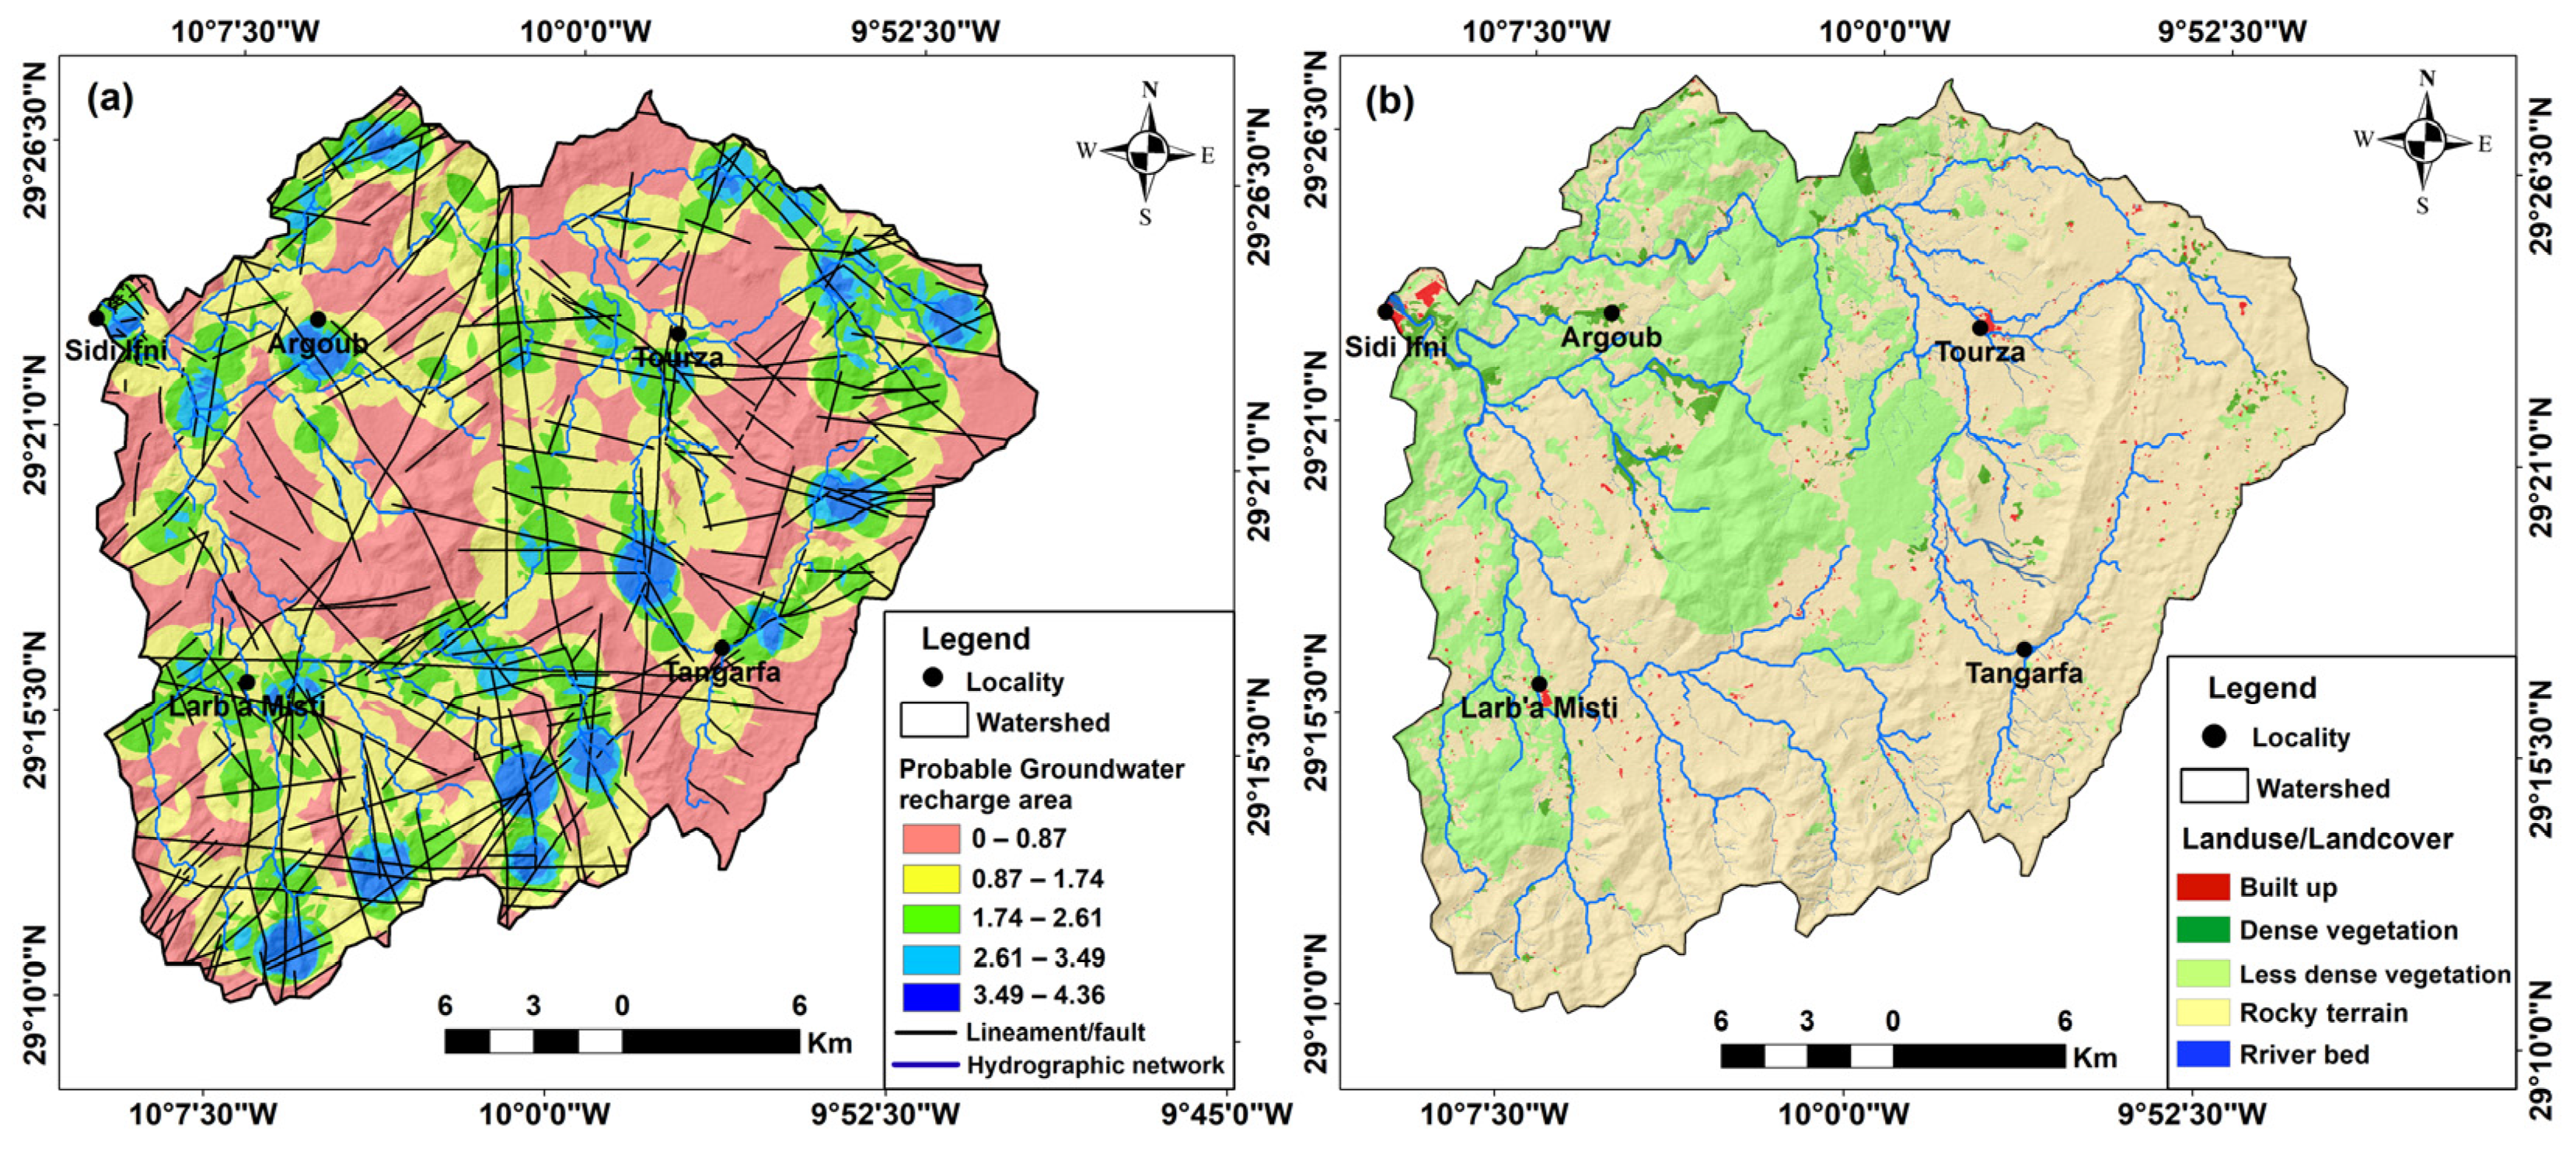
Geology Factors and Land Use
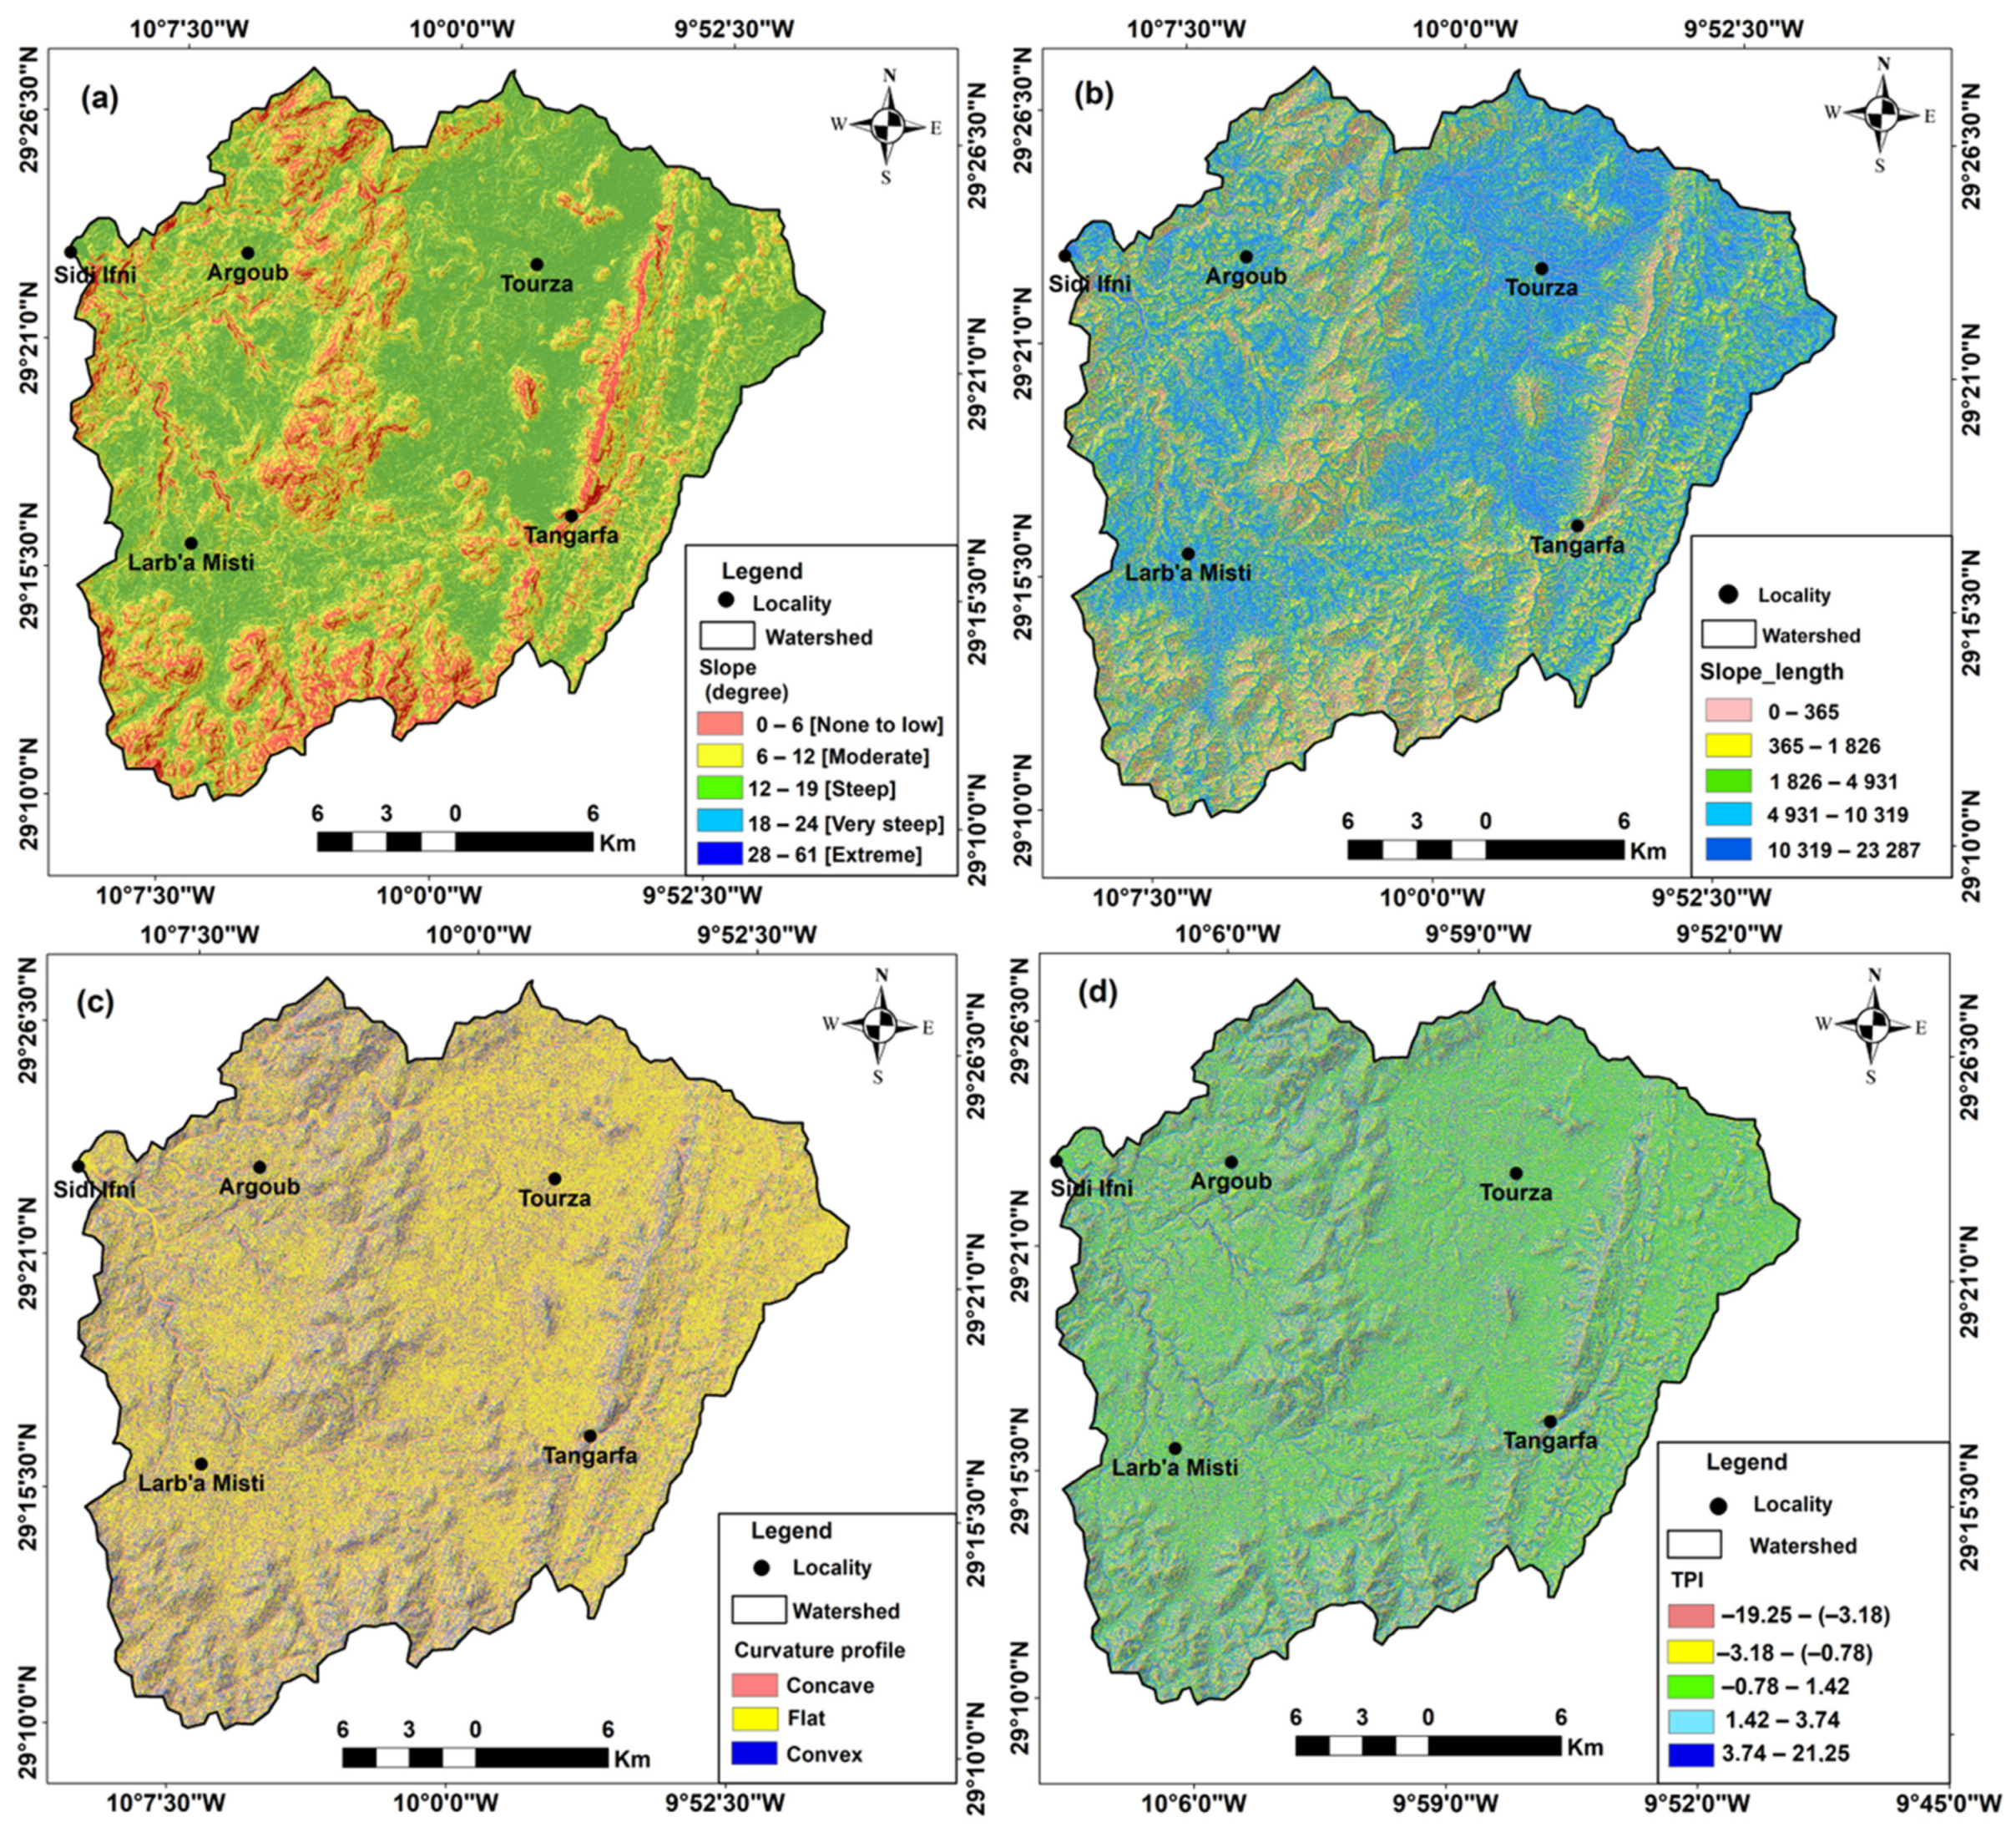
Topographic Factors
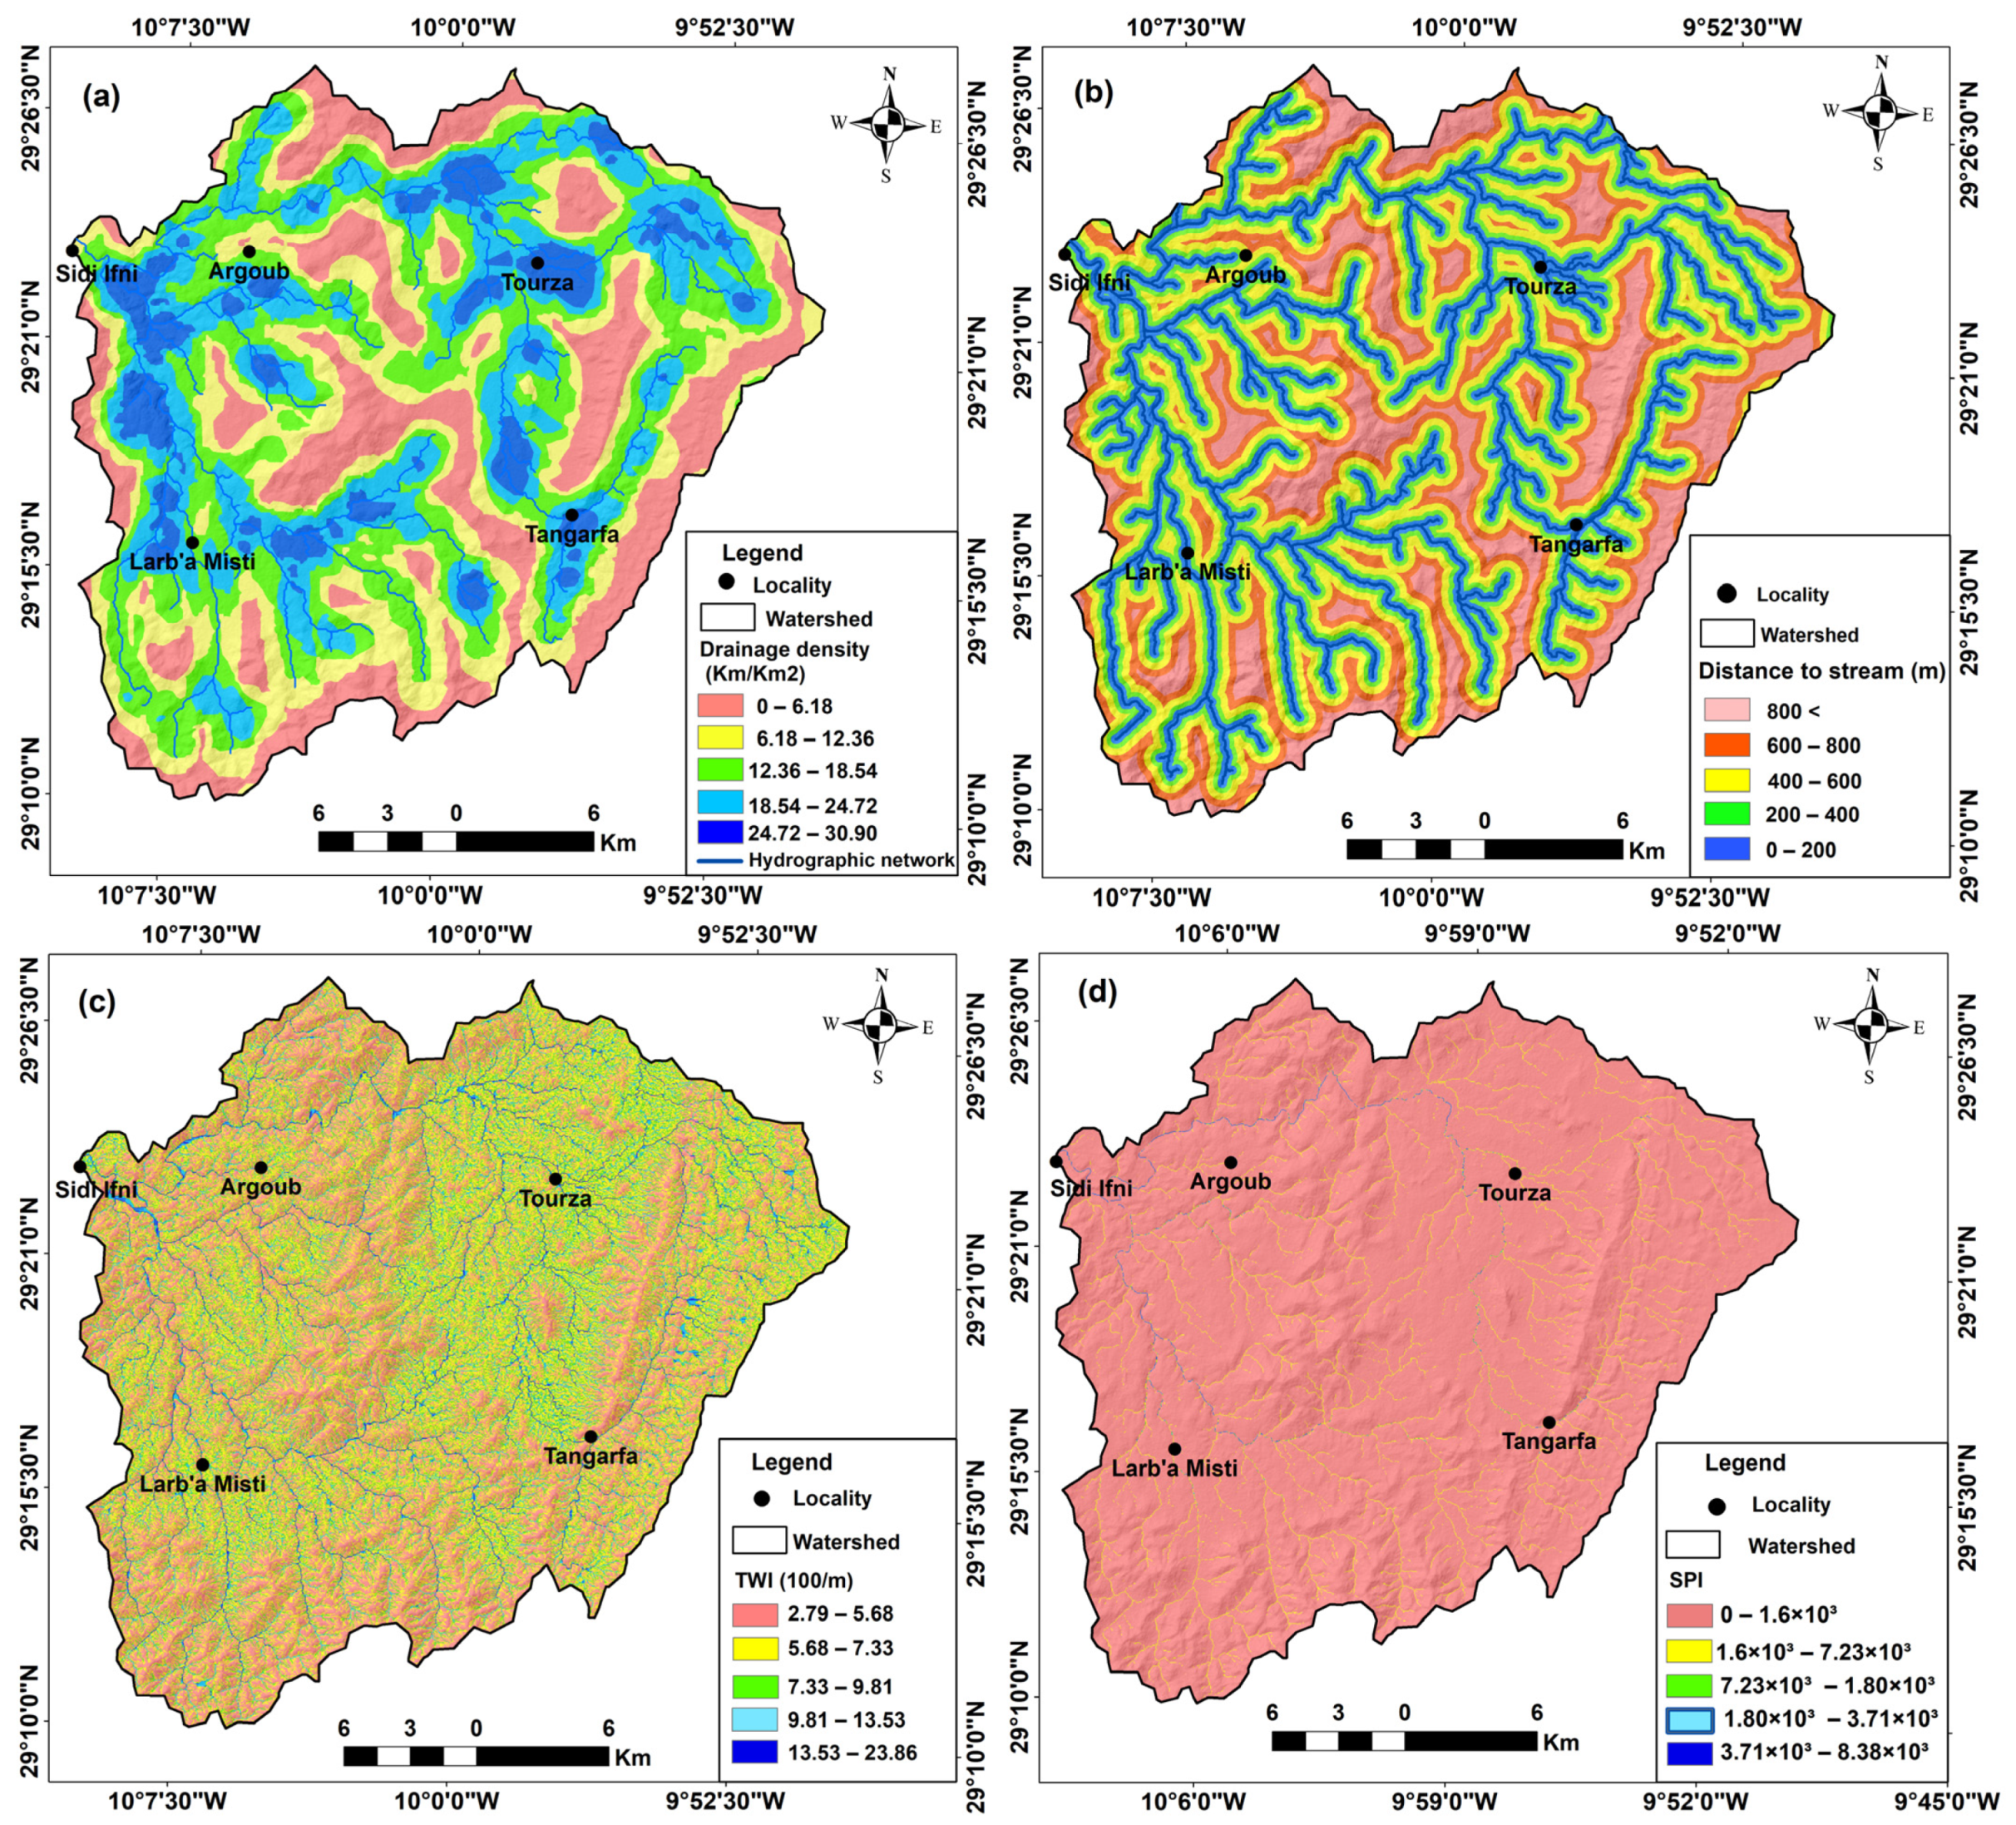
Hydrological Factors
2.2.2. Analytic Hierarchy Process Model
Standardization of Thematic Layers
Weighting of Deciding Factors
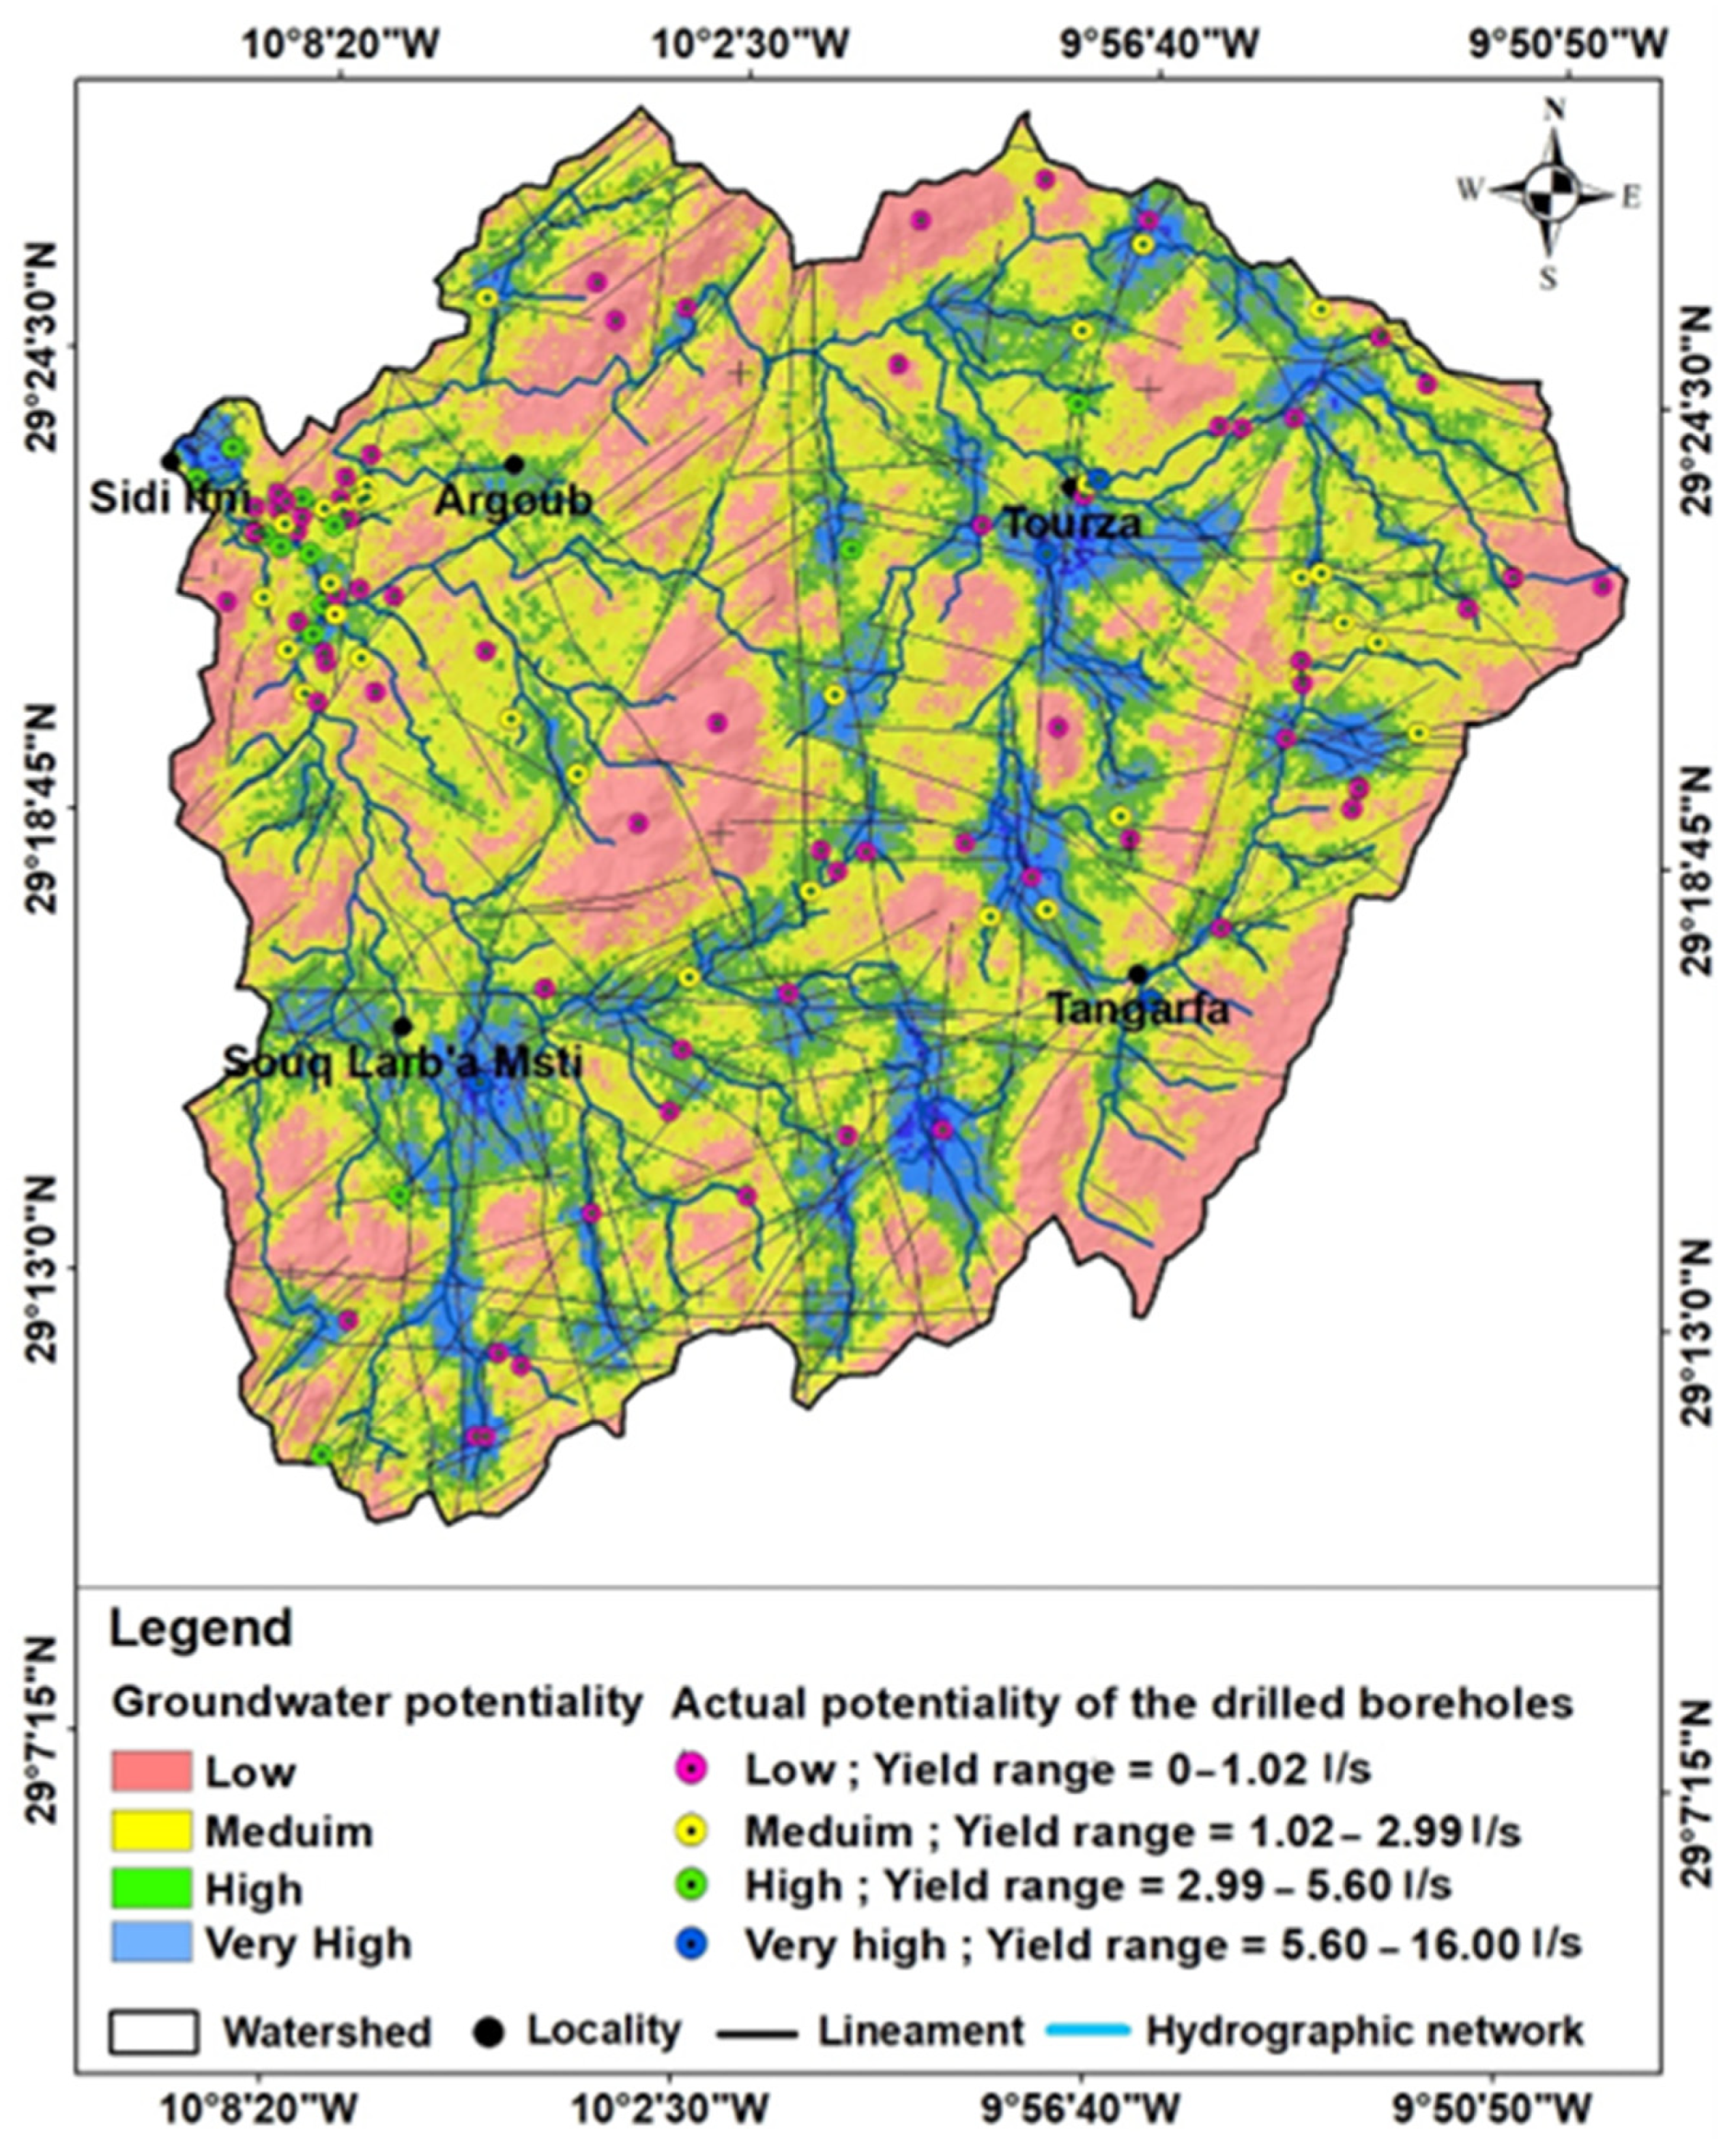
Delineation of Groundwater Potential Areas (GWPA)
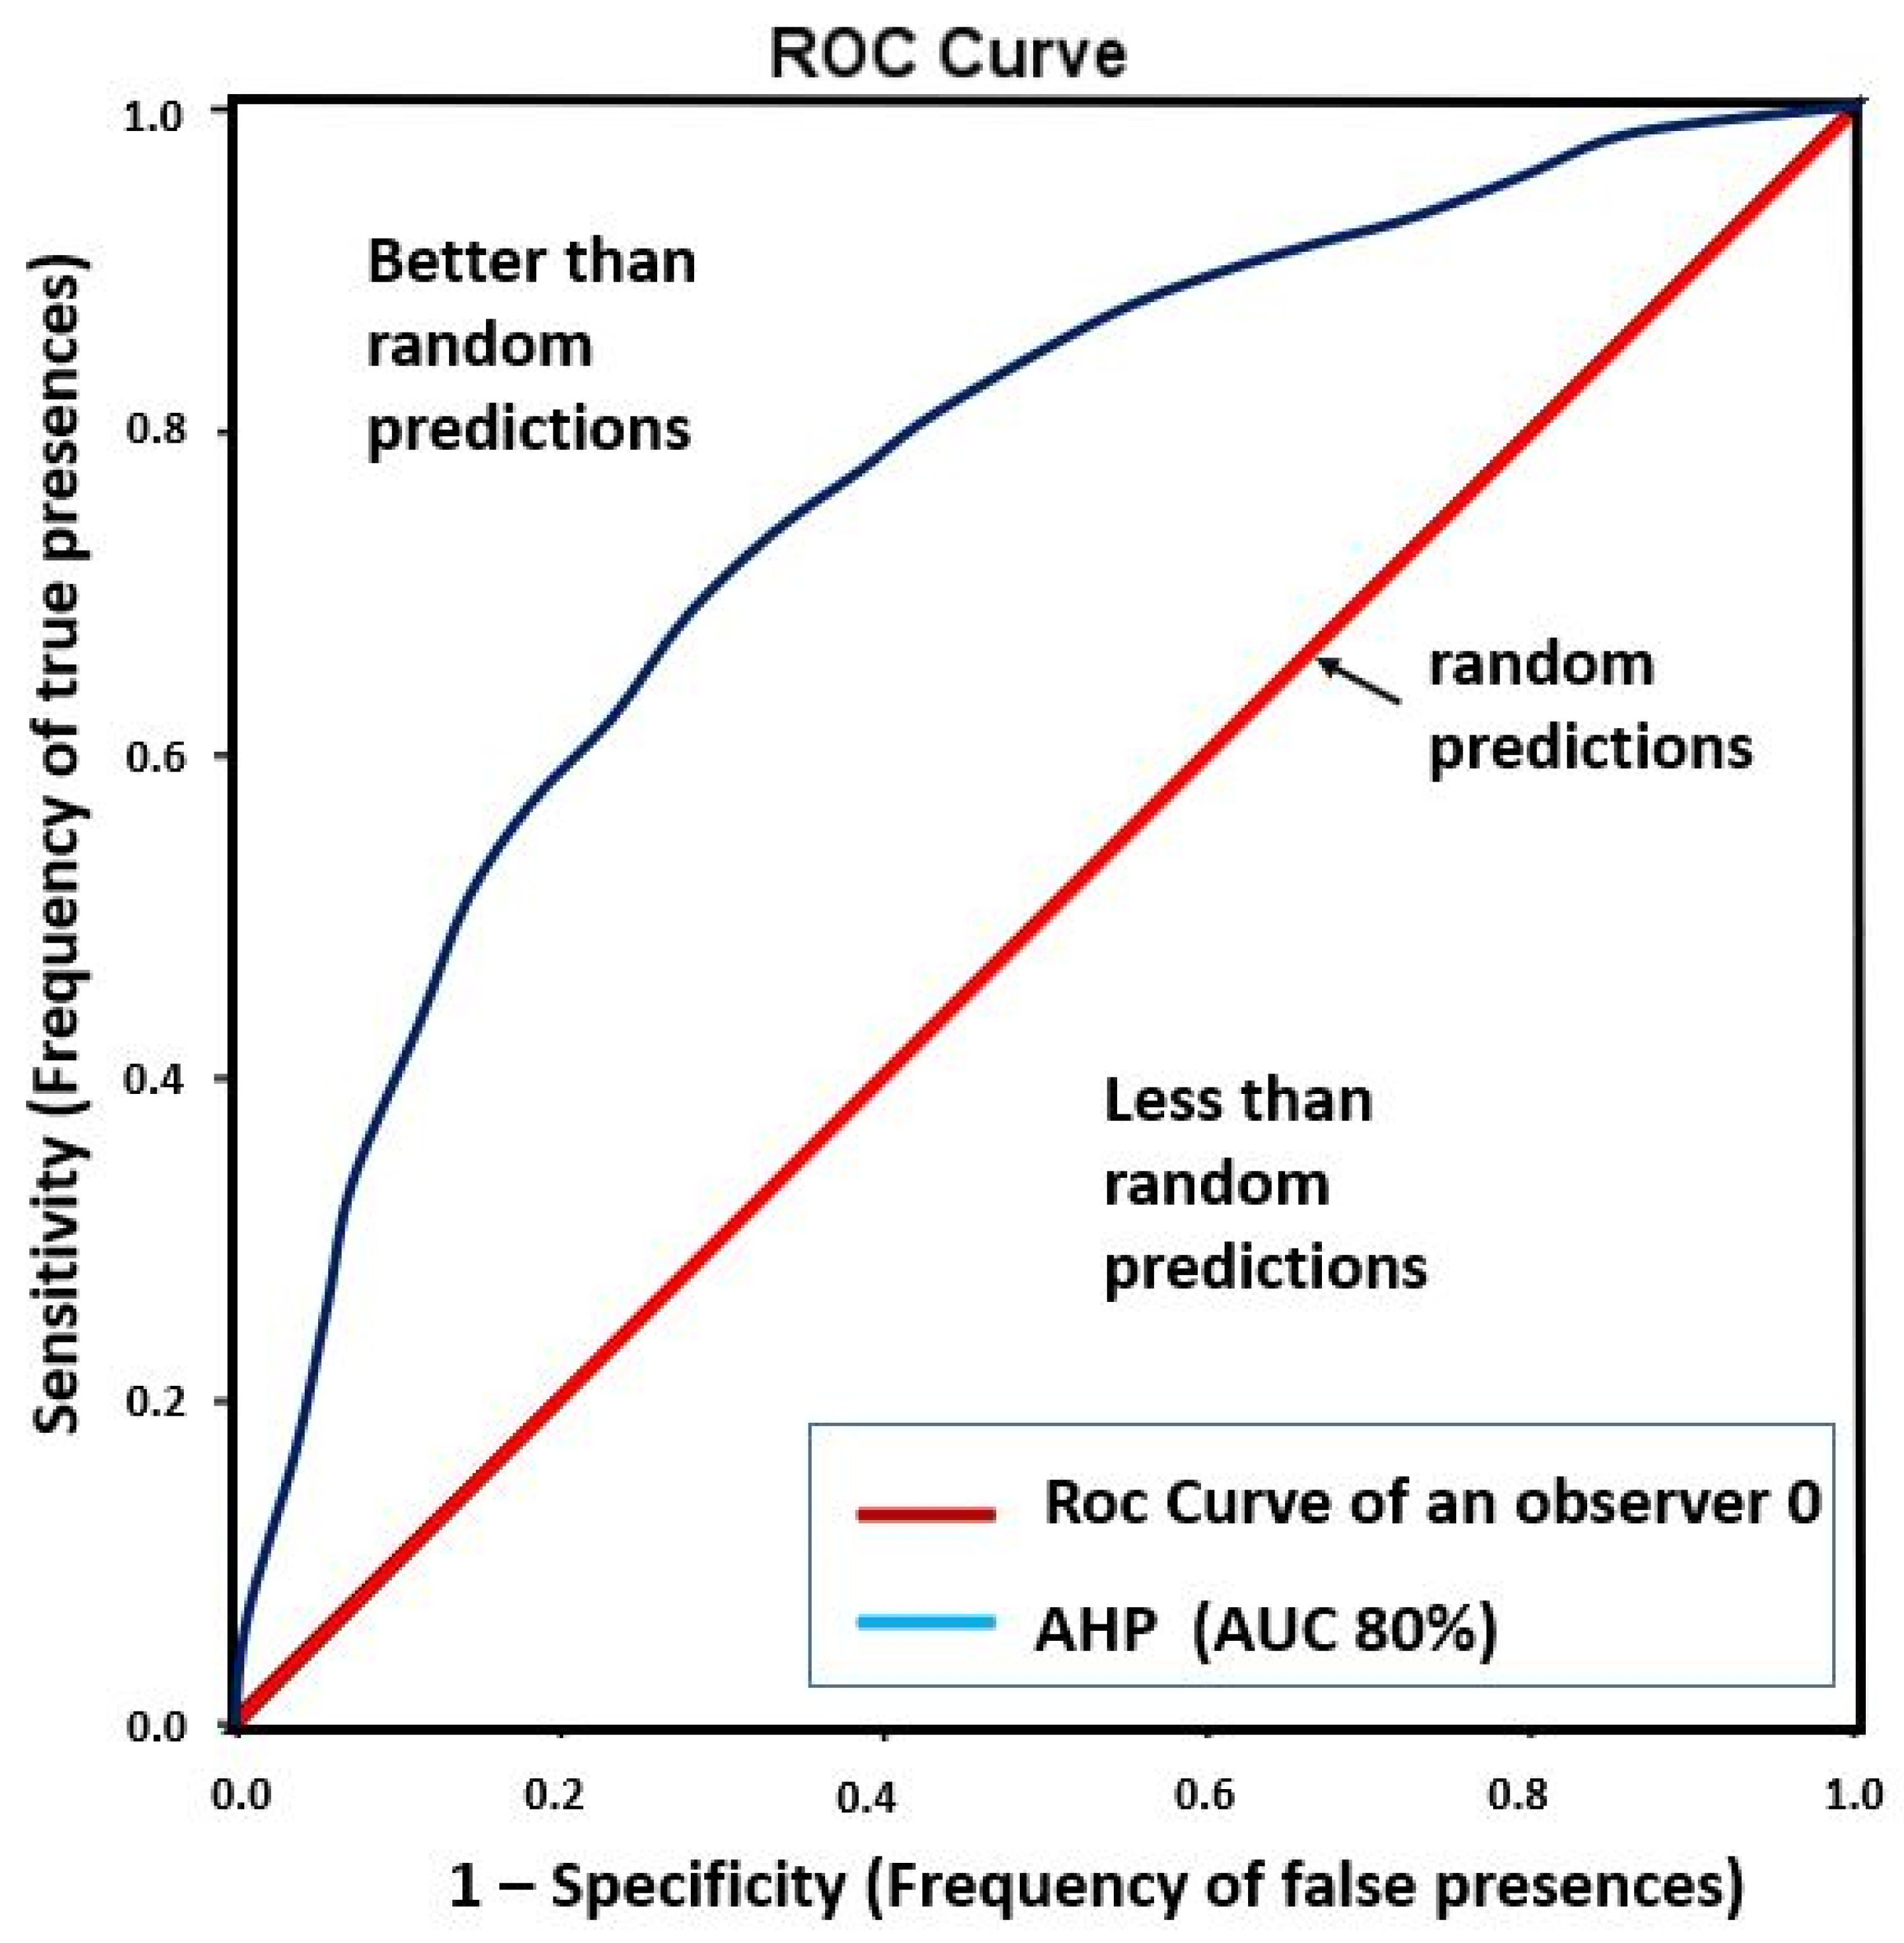
2.2.3. Validation of the GWPA
3. Results
4. Discussion
5. Conclusions
Author Contributions
Funding
Data Availability Statement
Conflicts of Interest
References
- Kostyuchenko, Y.; Artemenko, I.; Abioui, M.; Benssaou, M. Global and regional climatic modeling. In Encyclopedia of Mathematical Geosciences; Daya Sagar, B., Cheng, Q., McKinley, J., Agterberg, F., Eds.; Springer: Cham, Switzerland, 2022; pp. 1–5. [Google Scholar] [CrossRef]
- Taweesin, K.; Seeboonruang, U.; Saraphirom, P. The influence of climate variability effects on groundwater time series in the lower central plains of Thailand. Water 2018, 10, 290. [Google Scholar] [CrossRef] [Green Version]
- Bahir, M.; Ouhamdouch, S.; Carreira, P.M. La ressource en eau au Maroc face aux changements climatiques; cas de la nappe Plio-Quaternaire du bassin synclinal d’Essaouira. Comun. Geol. 2016, 103, 35–44. [Google Scholar]
- Echogdali, F.Z.; Boutaleb, S.; Abioui, M.; Aadraoui, M.; Bendarma, A.; Kpan, R.B.; Ikirri, M.; El Mekkaoui, M.; Essoussi, S.; El Ayady, H.; et al. Spatial Mapping of Groundwater Potentiality Applying Geometric Average and Fractal Models: A Sustainable Approach. Water 2023, 15, 336. [Google Scholar] [CrossRef]
- Benjmel, K.; Amraoui, F.; Aydda, A.; Tahiri, A.; Yousif, M.; Pradhan, B.; Abdelrahman, K.; Fnais, M.S.; Abioui, M. A Multidisciplinary approach for groundwater potential mapping in a fractured semi-arid terrain (Kerdous Inlier, Western Anti-Atlas, Morocco). Water 2022, 14, 1553. [Google Scholar] [CrossRef]
- Mortaji, A.; Gasquet, D.; Ikenne, M.; Beraaouz, E.H.; Barbey, P.; Lahmam, M.; El Aouli, E.H. Les granitoïdes tardi-panafricains de l’Anti-Atlas sud-occidental (Maroc): Evolution d’un type magnésien à un type ferrifère. Exemple de la boutonnière d’Ifni. Estud. Geol. 2007, 63, 7–25. [Google Scholar] [CrossRef] [Green Version]
- Charton, R.; Bertotti, G.; Arantegui, A.; Bulot, L. The Sidi Ifni transect across the rifted margin of Morocco (Central Atlantic): Vertical movements constrained by low-temperature thermochronology. J. Afr. Earth Sci. 2018, 141, 22–32. [Google Scholar] [CrossRef] [Green Version]
- Ikirri, M.; Faik, F.; Boutaleb, S.; Echogdali, F.Z.; Abioui, M.; Al–Ansari, N. Application of HEC–RAS/WMS and FHI models for the extreme hydrological events under climate change in the Ifni River arid watershed from Morocco. In Climate and Land Use Impacts on Natural and Artificial Systems: Mitigation and Adaptation; Nistor, M.M., Ed.; Elsevier: Amsterdam, The Netherlands, 2021; pp. 251–270. [Google Scholar] [CrossRef]
- Echogdali, F.Z.; Kpan, R.B.; Ouchchen, M.; Id-Belqas, M.; Dadi, B.; Ikirri, M.; Abioui, M.; Boutaleb, S. Spatial prediction of flood frequency analysis in a semi-arid zone: A case study from the Seyad Basin (Guelmim Region, Morocco). In Geospatial Technology for Landscape and Environmental Management: Sustainable Assessment and Planning; Rai, P.K., Mishra, V.N., Singh, P., Praveen, K.R., Eds.; Springer: Singapore, 2022; pp. 49–71. [Google Scholar] [CrossRef]
- Echogdali, F.Z.; Boutaleb, S.; Bendarma, A.; Saidi, M.E.; Aadraoui, M.; Abioui, M.; Ouchchen, M.; Abdelrahman, K.; Fnais, M.S.; Sajinkumar, K.S. Application of analytical hierarchy process and geophysical method for groundwater potential mapping in the Tata basin, Morocco. Water 2022, 14, 2393. [Google Scholar] [CrossRef]
- Rahmati, O.; Melesse, A.M. Application of Dempster-Shafer theory, spatial analysis and remote sensing for groundwater potentiality and nitrate pollution analysis in the semi-arid region of Khuzestan, Iran. Sci. Total Environ. 2016, 568, 1110–1123. [Google Scholar] [CrossRef]
- Haghizadeh, A.; Moghaddam, D.D.; Pourghasemi, H.R. GIS-based bivariate statistical techniques for groundwater potential analysis (an example of Iran). J. Earth Syst. 2017, 126, 109. [Google Scholar] [CrossRef] [Green Version]
- Ghorbani Nejad, S.; Falah, F.; Daneshfar, M.; Haghizadeh, A.; Rahmati, O. Delineation of groundwater potential zones using remote sensing and GIS-based data-driven models. Geocarto Int. 2017, 32, 167–187. [Google Scholar] [CrossRef]
- Regmi, A.D.; Devkota, K.C.; Yoshida, K.; Pradhan, B.; Pourghasemi, H.R.; Kumamoto, T.; Akgun, A. Application of frequency ratio, statistical index, and weights-of-evidence models and their comparison in landslide susceptibility mapping in Central Nepal Himalaya. Arab. J. Geosci. 2014, 7, 725–742. [Google Scholar] [CrossRef]
- Oh, H.J.; Kim, Y.S.; Choi, J.K.; Park, E.; Lee, S. GIS mapping of regional probabilistic groundwater potential in the area of Pohang City, Korea. J. Hydrol. 2011, 399, 158–172. [Google Scholar] [CrossRef]
- Moghaddam, D.D.; Rezaei, M.; Pourghasemi, H.R.; Pourtaghie, Z.S.; Pradhan, B. Groundwater spring potential mapping using bivariate statistical model and GIS in the Taleghan watershed, Iran. Arab. J. Geosci. 2015, 8, 913–929. [Google Scholar] [CrossRef]
- Ozdemir, A. GIS-based groundwater spring potential mapping in the Sultan Mountains (Konya, Turkey) using frequency ratio, weights of evidence and logistic regression methods and their comparison. J. Hydrol. 2011, 411, 290–308. [Google Scholar] [CrossRef]
- Chen, W.; Peng, J.; Hong, H.; Shahabi, H.; Pradhan, B.; Liu, J.; Zhu, A.X.; Pei, X.; Duan, Z. Landslide susceptibility modelling using GIS-based machine learning techniques for Chongren County, Jiangxi Province, China. Sci. Total Environ. 2018, 626, 1121–1135. [Google Scholar] [CrossRef]
- Razandi, Y.; Pourghasemi, H.R.; Neisani, N.S.; Rahmati, O. Application of analytical hierarchy process, frequency ratio, and certainty factor models for groundwater potential mapping using GIS. Earth Sci. Inform. 2015, 8, 867–883. [Google Scholar] [CrossRef]
- Al-Abadi, A.M.; Shahid, S. A comparison between index of entropy and catastrophe theory methods for mapping groundwater potential in an arid region. Environ. Monit. Assess. 2015, 187, 576. [Google Scholar] [CrossRef] [Green Version]
- Das, S. Comparison among influencing factor, frequency ratio, and analytical hierarchy process techniques for groundwater potential zonation in Vaitarna basin, Maharashtra, India. Groundw. Sustain. Dev. 2019, 8, 617–629. [Google Scholar] [CrossRef]
- Mukherjee, I.; Singh, U.K. Delineation of groundwater potential zones in a drought-prone semi-arid region of east India using GIS and analytical hierarchical process techniques. CATENA 2020, 194, 104681. [Google Scholar] [CrossRef]
- Al-Fugara, A.K.; Pourghasemi, H.R.; Al-Shabeeb, A.R.; Habib, M.; Al-Adamat, R.; Al-Amoush, H.; Collins, A.L. A comparison of machine learning models for the mapping of groundwater spring potential. Environ. Earth Sci. 2020, 79, 206. [Google Scholar] [CrossRef]
- Zhang, J.; Liu, K.; Wang, M. Downscaling groundwater storage data in China to a 1-km resolution using machine learning methods. Remote Sens. 2021, 13, 523. [Google Scholar] [CrossRef]
- Jaafarzadeh, M.S.; Tahmasebipour, N.; Haghizadeh, A.; Pourghasemi, H.R.; Rouhani, H. Groundwater recharge potential zonation using an ensemble of machine learning and bivariate statistical models. Sci. Rep. 2021, 11, 5587. [Google Scholar] [CrossRef]
- Springer, A.; Lopez, T.; Owor, M.; Frappart, F.; Stieglitz, T. The role of space-based observations for groundwater resource monitoring over Africa. Surv. Geophys. 2023, 44, 123–172. [Google Scholar] [CrossRef]
- Smith, L.B.; Slone, L.K. A developmental approach to machine learning? Front. Psychol. 2017, 8, 2124. [Google Scholar] [CrossRef] [PubMed]
- Naghibi, S.A.; Pourghasemi, H.R.; Dixon, B. GIS-based groundwater potential mapping using boosted regression tree, classification and regression tree, and random forest machine learning models in Iran. Environ. Monit. Assess. 2016, 188, 44. [Google Scholar] [CrossRef] [PubMed]
- Garosi, Y.; Sheklabadi, M.; Conoscenti, C.; Pourghasemi, H.R.; Van Oost, K. Assessing the performance of GIS-based machine learning models with different accuracy measures for determining susceptibility to gully erosion. Sci. Total Environ. 2019, 664, 1117–1132. [Google Scholar] [CrossRef]
- Zabihi, M.; Pourghasemi, H.R.; Motevalli, A.; Zakeri, M.A. Gully erosion modeling using GIS-based data mining techniques in Northern Iran: A comparison between boosted regression tree and multivariate adaptive regression spline. In Natural Hazards GIS-Based Spatial Modeling Using Data Mining Techniques; Pourghasemi, H., Rossi, M., Eds.; Springer: Cham, Switzerland, 2019; pp. 1–26. [Google Scholar] [CrossRef]
- Rahmati, O.; Pourghasemi, H.R.; Melesse, A.M. Application of GIS-based data driven random forest and maximum entropy models for groundwater potential mapping: A case study at Mehran Region, Iran. CATENA 2016, 137, 360–372. [Google Scholar] [CrossRef]
- Pal, J.; Chakrabarty, D. Assessment of artificial neural network models based on the simulation of groundwater contaminant transport. Hydrogeol. J. 2020, 28, 2039–2055. [Google Scholar] [CrossRef]
- Naghibi, S.A.; Ahmadi, K.; Daneshi, A. Application of support vector machine, random forest, and genetic algorithm optimized random forest models in groundwater potential mapping. Water Resour. Manag. 2017, 31, 2761–2775. [Google Scholar] [CrossRef]
- Boutaleb, S.; Boualoul, M.; Bouchaou, L.; Oudra, M. Application of remote-sensing and surface geophysics for groundwater prospecting in a hard rock terrain, Morocco. In Applied Groundwater Studies in Africa, IAH Book Series; Adelana, S.M.A., MacDonald, A.M., Eds.; CRC Press: Boca Raton, FL, USA; Balkema: Leiden, The Netherlands, 2008; pp. 215–227. [Google Scholar] [CrossRef]
- Jeannette, D.; Benziane, F.; Yazidi, A. Lithostratigraphie et datation du Protérozoïque de la boutonnière d’Ifni (Anti-Atlas, Maroc). Precambrian Res. 1981, 14, 363–378. [Google Scholar] [CrossRef]
- Benziane, F.; Yazidi, A. Géologie de la boutonnière d’Ifni (Anti-Atlas occidental, Maroc). Notes Mém. Serv. Géol. Maroc. 1982, 312, 1–114. [Google Scholar]
- Yazidi, A. Les Formations Sédimentaires et Volcaniques de la Boutonnière d’Ifni, Maroc. Ph.D. Thesis, Université Scientifique et Médicale de Grenoble, Grenoble, France, 1976. [Google Scholar]
- Thomas, R.J.; Fekkak, A.; Ennih, N.; Errami, E.; Loughlin, S.C.; Gresse, P.G.; Chevallier, L.P.; Liégeois, J.P. A new lithostratigraphic framework for the Anti-Atlas Orogen, Morocco. J. Afr. Earth Sci. 2004, 39, 217–226. [Google Scholar] [CrossRef] [Green Version]
- Álvaro, J.J.; Benziane, F.; Thomas, R.; Walsh, G.J.; Yazidi, A. Neoproterozoic-Cambrian stratigraphic framework of the Anti-Atlas and Ouzellagh promontory (High Atlas), Morocco. J. Afr. Earth Sci. 2014, 98, 19–33. [Google Scholar] [CrossRef]
- Benssaou, M.; M’Barki, L.; Ezaidi, A.; Abioui, M. Geodynamic significance of studying Lower Cambrian Sequence units in the western Anti-Atlas. Int. J. Mater. Sci. Appl. 2017, 6, 142–147. [Google Scholar] [CrossRef] [Green Version]
- Benssaou, M.; Hamoumi, N. Le graben de l’Anti-Atlas occidental (Maroc): Contrôle tectonique de la paléogéographie et des séquences au Cambrien inférieur. C. R. Geosci. 2003, 335, 297–305. [Google Scholar] [CrossRef]
- Soulaimani, A.; Bouabdelli, M.; Piqué, A. L’extension continentale au Néo-Protérozoïque supérieur-Cambrien inférieur dans l’Anti-Atlas (Maroc). Bull. Soc. Géol. Fr. 2003, 174, 83–92. [Google Scholar] [CrossRef]
- Soulaimani, A.; Michard, A.; Ouanaimi, H.; Baidder, L.; Raddi, Y.; Saddiqi, O.; Rjimati, E.C. Late Ediacaran-Cambrian structures and their reactivation during the Variscan and Alpine cycles in the Anti-Atlas (Morocco). J. Afr. Earth Sci. 2014, 98, 94–112. [Google Scholar] [CrossRef]
- Aude, J.L. Projet d’Accumulation Souterraine d’eau en Massif Granitique (Oued Ifni-Maroc): Application de l’Analyse Structurale. Ph.D. Thesis, Université Scientifique et Médicale de Grenoble, Grenoble, France, 1983. [Google Scholar]
- Benziane, F.; Yazidi, A.; Schulte, B.; Boger, S.; Stockhammer, S.; Lehmann, A.; Saadane, A.; Yazid, M. Notice explicative de la carte géologique du Maroc au 1/50000, Feuille Sidi Ifni. Notes Mém. Serv. Géol. Maroc 2016, 542. [Google Scholar]
- Schulte, B.; Benziane, F.; Yazidi, A.; Boger, S.; Stockhammer, S.; Lehmann, A.; Saadane, A.; Yazidi, M. Notes explicative de la carte géologique du Maroc au 1/50000, Feuille Arbaa Sahel. Notes Mém. Serv. Géol. Maroc 2016, 541. [Google Scholar]
- Yazidi, A.; Benziane, F.; Schulte, B.; Boger, S.; Stockhammer, S.; Lehmann, A.; Saadane, A.; Yazid, M. Notes explicative de la carte géologique du Maroc au 1/50000, Feuille Assaka. Notes Mém. Serv. Géol. Maroc 2016, 544. [Google Scholar]
- Andualem, T.G.; Demeke, G.G. Groundwater potential assessment using GIS and remote sensing: A case study of Guna tana landscape, upper Blue Nile Basin, Ethiopia. J. Hydrol. Reg. Stud. 2019, 24, 100610. [Google Scholar] [CrossRef]
- Dar, T.; Rai, N.; Bhat, A. Delineation of potential groundwater recharge zones using analytical hierarchy process (AHP). Geol. Ecol. Landsc. 2021, 5, 292–307. [Google Scholar] [CrossRef] [Green Version]
- Al–Djazouli, M.O.; Elmorabiti, K.; Rahimi, A.; Amellah, O.; Fadil, O.A.M. Delineating of groundwater potential zones based on remote sensing, GIS and analytical hierarchical process: A case of Waddai, eastern Chad. GeoJ. 2021, 86, 1881–1894. [Google Scholar] [CrossRef]
- Makonyo, M.; Msabi, M.M. Identification of groundwater potential recharge zones using GIS-based multi-criteria decision analysis: A case study of semi-arid midlands Manyara fractured aquifer, North–Eastern Tanzania. Remote Sens. Appl. Soc. Environ. 2021, 23, 100544. [Google Scholar] [CrossRef]
- Echogdali, F.Z.; Boutaleb, S.; Kpan, R.B.; Ouchchen, M.; Bendarma, A.; El Ayady, H.; Abdelrahman, K.; Fnais, M.S.; Sajinkumar, K.S.; Abioui, M. Application of fuzzy logic and fractal modeling approach for groundwater potential mapping in semi-arid Akka basin, Southeast Morocco. Sustainability 2022, 14, 10205. [Google Scholar] [CrossRef]
- Abijith, D.; Saravanan, S.; Singh, L.; Jennifer, J.J.; Saranya, T.; Parthasarathy, K.S.S. GIS-based multi-criteria analysis for identification of potential groundwater recharge zones–A case study from Ponnaniyaru watershed, Tamil Nadu, India. HydroResearch 2020, 3, 1–14. [Google Scholar] [CrossRef]
- Çelik, R. Evaluation of groundwater potential by GIS-based multicriteria decision making as a spatial prediction tool: Case study in the Tigris River Batman-Hasankeyf Sub-Basin, Turkey. Water 2019, 11, 2630. [Google Scholar] [CrossRef] [Green Version]
- Lentswe, G.B.; Molwalefhe, L. Delineation of potential groundwater recharge zones using analytic hierarchy process-guided GIS in the semi-arid Motloutse watershed, eastern Botswana. J. Hydrol. Reg. Stud. 2020, 28, 100674. [Google Scholar] [CrossRef]
- AL-Shammari, M.M.A.; AL-Shamma’a, A.M.; Al Maliki, A.; Hussain, H.M.; Mundher, Y.Z.; Armanuos, A.M. Integrated water harvesting and aquifer recharge evaluation methodology based on remote sensing and geographical information system: Case study in Iraq. Nat. Resour. Res. 2021, 30, 2119–2143. [Google Scholar] [CrossRef]
- Chowdhury, A.; Jha, M.K.; Chowdary, V.M. Delineation of groundwater recharge zones and identification of artificial recharge sites in West Medinipur district, West Bengal, using RS, GIS and MCDM techniques. Environ. Earth Sci. 2010, 59, 1209–1222. [Google Scholar] [CrossRef]
- Al–Abadi, A.M.; Al–Temmeme, A.A.; Al–Ghanimy, M.A. A GIS-based combining of frequency ratio and index of entropy approaches for mapping groundwater availability zones at Badra-Al Al-Gharbi-Teeb areas, Iraq. Sustain. Water Resour. Manag. 2016, 2, 265–283. [Google Scholar] [CrossRef] [Green Version]
- Moore, I.D.; Burch, G.J. Sediment transport capacity of sheet and rill flow: Application of unit stream power theory. Water Resour. Res. 1986, 22, 1350–1360. [Google Scholar] [CrossRef]
- Qadir, J.; Bhat, M.S.; Alam, A.; Rashid, I. Mapping groundwater potential zones using remote sensing and GIS approach in Jammu Himalaya, Jammu and Kashmir. GeoJournal 2019, 85, 487–504. [Google Scholar] [CrossRef]
- Abrams, W.; Ghoneim, E.; Shew, R.; LaMaskin, T.; Al-Bloushi, K.; Hussein, S.; AbuBakr, M.; Al-Mulla, E.; Al-Awar, M.; El-Baz, F. Delineation of groundwater potential (GWP) in the northern United Arab Emirates and Oman using geospatial technologies in conjunction with Simple Additive Weight (SAW), Analytical Hierarchy Process (AHP), and Probabilistic Frequency Ratio (PFR) techniques. J. Arid Environ. 2018, 157, 77–96. [Google Scholar] [CrossRef]
- Rajasekhar, M.; Raju, G.S.; Sreenivasulu, Y.; Raju, R.S. Delineation of groundwater potential zones in semi-arid region of Jilledubanderu river basin, Anantapur District, Andhra Pradesh, India using fuzzy logic, AHP and integrated fuzzy-AHP approaches. HydroResearch 2019, 2, 97–108. [Google Scholar] [CrossRef]
- Saaty, T.L. The Analytic Hierarchy Process: Planning, Priority Setting, Resource Allocation, 12th ed.; McGraw-Hill International Book Co.: New York, NY, USA, 1980. [Google Scholar]
- Saaty, T.L. Making and validating complex decisions with the AHP/ANP. J. Syst. Sci. Syst. Eng. 2005, 14, 1–36. [Google Scholar] [CrossRef]
- Saaty, T.L. Decision making with the analytic hierarchy process. Int. J. Serv. Sci. 2008, 1, 83–98. [Google Scholar] [CrossRef] [Green Version]
- Mu, E.; Pereyra-Rojas, M. Understanding the analytic hierarchy process. In Practical Decision Making; Springer: Cham, Switzerland, 2017; pp. 7–22. [Google Scholar] [CrossRef]
- Lee, S.; Kim, Y.S.; Oh, H.J. Application of a weights-of-evidence method and GIS to regional groundwater productivity potential mapping. J. Environ. Manage. 2012, 96, 91–105. [Google Scholar] [CrossRef]
- Kaliraj, S.; Chandrasekar, N.; Magesh, N.S. Identification of potential groundwater recharge zones in Vaigai upper basin, Tamil Nadu, using GIS-based analytical hierarchical process (AHP) technique. Arab. J. Geosci. 2013, 7, 1385–1401. [Google Scholar] [CrossRef]
- Saaty, T.L. Decision Making for Leaders: The Analytic Hierarchy Process for Decisions in a Complex World; RWS Publications: Pittsburgh, PA, USA, 1990. [Google Scholar]
- Sinha, A.; Nikhil, S.; Ajin, R.S.; Danumah, J.H.; Saha, S.; Costache, R.; Rajaneesh, A.; Sajinkumar, K.S.; Amrutha, K.; Johny, A.; et al. Wildfire Risk Zone Mapping in Contrasting Climatic Conditions: An Approach Employing AHP and F-AHP Models. Fire 2023, 6, 44. [Google Scholar] [CrossRef]
- Abioui, M.; Ikirri, M.; Boutaleb, S.; Faik, F.; Wanaim, A.; Id-Belqas, M.; Echogdali, F.Z. GIS for Watershed Characterization and Modeling: Example of the Taguenit River (Lakhssas, Morocco). In Water, Land, and Forest Susceptibility and Sustainability: Geospatial Approaches and Modeling; Chatterjee, U., Pradhan, B., Kumar, S., Saha, S., Zakwan, M., Eds.; Elsevier: Amsterdam, The Netherlands, 2023; pp. 61–85. [Google Scholar] [CrossRef]
- Khan, M.R.; Alam, M.J.; Tabassum, N.; Khan, N.A. A Systematic review of the Delphi–AHP method in analyzing challenges to public-sector project procurement and the supply chain: A developing country’s perspective. Sustainability 2022, 14, 14215. [Google Scholar] [CrossRef]
- Mandal, P.; Saha, J.; Bhattacharya, S.; Paul, S. Delineation of groundwater potential zones using the integration of geospatial and MIF techniques: A case study on Rarh region of West Bengal, India. Environ. Chall. 2021, 5, 100396. [Google Scholar] [CrossRef]
- Maliva, R.; Missimer, T. Aridity and drought. In Arid Lands Water Evaluation and Management; Springer: Berlin/Heidelberg, Germany, 2012; Volume 1, pp. 21–39. [Google Scholar] [CrossRef]
- Nampak, H.; Pradhan, B.; Abd Manap, M. Application of GIS based data driven evidential belief function model to predict groundwater potential zonation. J. Hydrol. 2014, 513, 283–300. [Google Scholar] [CrossRef]
- Al-Abadi, A.M. Modeling of groundwater productivity in northeastern Wasit Governorate, Iraq using frequency ratio and Shannon’s entropy models. Appl. Water Sci. 2015, 7, 699–716. [Google Scholar] [CrossRef] [Green Version]
- Akula, A.; Singh, A.; Ghosh, R.; Kumar, S.; Sardana, H.K. Target recognition in infrared imagery using convolutional neural network. In Proceedings of the International Conference on Computer Vision and Image Processing, Roorkee, India, 9–12 September 2017; pp. 25–34. [Google Scholar] [CrossRef]
- Mohammadzadeh, A.; Zoej, M.J.V.; Tavakoli, A. Automatic main road extraction from high resolution satellite imageries by means of particle swarm optimization applied to a fuzzy-based mean calculation approach. J. Indian Soc. Remote Sens. 2009, 37, 173–184. [Google Scholar] [CrossRef]


| Factor (Units) | Class | Rating | Factor (Units) | Class | Rating | Factor (Units) | Class | Rating |
|---|---|---|---|---|---|---|---|---|
| ND | 2.71–3.39 | 10 | TPI | −19.25–(−3.87) | 10 | PGRA | 3.49–4.36 | 10 |
| 2.03–2.71 | 8 | −3.87–(−0.95) | 8 | 2.61–3.49 | 8 | |||
| 1.35–2.03 | 6 | −0.95–1.48 | 6 | 1.74–2.61 | 6 | |||
| 0.67–1.35 | 4 | 1.48–4.65 | 4 | 0.87–1.74 | 4 | |||
| 0–0.67 | 2 | 4.65–21.25 | 2 | 0–0.87 | 2 | |||
| LD | 2.81–3.52 | 10 | SPI | 3.71 × 10⁶–8.38 × 10⁶ | 10 | S | 0–6 | 10 |
| 2.11–2.81 | 8 | 1.80 × 10⁵–3.71 × 10⁶ | 8 | 6–12 | 8 | |||
| 1.40–2.11 | 6 | 7.23 × 10⁵–1.80 × 10⁵ | 6 | 12–19 | 6 | |||
| 0.70–1.40 | 4 | 1.6 × 10⁴–7.23 × 10⁵ | 4 | 19–28 | 4 | |||
| 0–0.70 | 2 | 0–1.6 × 10⁴ | 2 | 28–61 | 2 | |||
| SL | 10,319–23,287 | 10 | DL/F | 0–200 | 10 | TWI | 13.53–23.86 | 10 |
| 4931–10,319 | 8 | 200–400 | 8 | 9.81–13.53 | 8 | |||
| 1826–4931 | 6 | 400–600 | 6 | 7.33–9.81 | 6 | |||
| 365–1826 | 4 | 600–800 | 4 | 5.68–7.33 | 4 | |||
| 0–368 | 2 | 800–1000 | 2 | 2.79–5.68 | 2 | |||
| RP | High permeability | 10 | LU/LC | River bed | 10 | DS | 0–200 | 10 |
| Medium permeability | 8 | Dense vegetation | 8 | 200–400 | 8 | |||
| Lower permeability | 4 | Less-dense vegetation | 6 | 400–600 | 6 | |||
| Raincoat | 2 | Rocky terrain | 4 | 600–800 | 4 | |||
| DD | 24.72–30.90 | 10 | Built-up | 2 | 800–1000 | 2 | ||
| 18.54–24.72 | 8 | CP | Convex | 10 | ||||
| 12.36–18.54 | 6 | Flat | 6 | |||||
| 6.18–12.36 | 4 | Concave | 2 | |||||
| 0–6.18 | 2 |
| Factors | LD | ND | PGRA | DL/F | DD | RP | DS | S | CP | LU/LC | SPI | TPI | TWI | SL |
|---|---|---|---|---|---|---|---|---|---|---|---|---|---|---|
| LD | 1 | 2 | 2 | 2 | 3 | 4 | 3 | 3 | 2 | 4 | 4 | 5 | 6 | 6 |
| ND | 1/2 | 1 | 2 | 2 | 3 | 4 | 2 | 3 | 3 | 5 | 6 | 6 | 6 | 6 |
| PGRA | 1/2 | 1/2 | 1 | 3 | 2 | 3 | 3 | 6 | 5 | 6 | 6 | 6 | 6 | 6 |
| DL/Fault | 1/2 | 1/2 | 1/3 | 1 | 2 | 2 | 2 | 4 | 2 | 3 | 4 | 5 | 4 | 4 |
| DD | 1/3 | 1/3 | 1/2 | 1/2 | 1 | 3 | 2 | 2 | 6 | 4 | 2 | 4 | 5 | 3 |
| RP | 1/4 | 1/4 | 1/3 | 1/2 | 1/3 | 1 | 3 | 2 | 2 | 6 | 2 | 4 | 5 | 3 |
| DS | 1/3 | 1/2 | 1/3 | 1/2 | 1/2 | 1/3 | 1 | 4 | 5 | 4 | 3 | 3 | 3 | 6 |
| S | 1/3 | 1/3 | 1/6 | 1/4 | 1/2 | 1/6 | 1/4 | 1 | 3 | 3 | 4 | 2 | 3 | 2 |
| CP | 1/2 | 1/3 | 1/5 | 1/2 | 1/6 | 1/6 | 1/5 | 1/3 | 1 | 5 | 3 | 2 | 4 | 2 |
| LU/LC | 1/4 | 1/5 | 1/5 | 1/3 | 1/4 | 1/5 | 1/4 | 1/3 | 1/5 | 1 | 6 | 6 | 6 | 6 |
| SPI | 1/4 | 1/6 | 1/6 | 1/4 | 1/2 | 1/6 | 1/3 | 1/4 | 1/3 | 1/6 | 1 | 3 | 4 | 4 |
| TPI | 1/5 | 1/6 | 1/6 | 1/5 | 1/4 | 1/4 | 1/3 | 1/2 | 1/2 | 1/6 | 1/3 | 1 | 2 | 3 |
| TWI | 1/6 | 1/6 | 1/6 | 1/4 | 1/5 | 1/6 | 1/3 | 1/3 | 1/4 | 1/6 | 1/4 | 1/2 | 1 | 3 |
| SL | 1/6 | 1/6 | 1/6 | 1/4 | 1/3 | 1/6 | 1/6 | 1/2 | 1/2 | 1/6 | 1/4 | 1/3 | 1/3 | 1 |
| Factors | LD | ND | PGRA | DL/F | DD | RP | DS | S | CP | LU/LC | SPI | TPI | TWI | SL | Weight |
|---|---|---|---|---|---|---|---|---|---|---|---|---|---|---|---|
| LD | 0.189 | 0.302 | 0.258 | 0.173 | 0.213 | 0.214 | 0.167 | 0.110 | 0.064 | 0.096 | 0.095 | 0.104 | 0.108 | 0.109 | 0.157 |
| ND | 0.094 | 0.151 | 0.258 | 0.173 | 0.213 | 0.214 | 0.111 | 0.110 | 0.097 | 0.12 | 0.143 | 0.125 | 0.108 | 0.109 | 0.145 |
| PGRA | 0.094 | 0.075 | 0.129 | 0.260 | 0.142 | 0.161 | 0.167 | 0.220 | 0.162 | 0.144 | 0.143 | 0.125 | 0.108 | 0.109 | 0.146 |
| DL/Fault | 0.0946 | 0.0755 | 0.0431 | 0.0867 | 0.1425 | 0.1074 | 0.111 | 0.146 | 0.064 | 0.072 | 0.095 | 0.1045 | 0.072 | 0.072 | 0.092 |
| DD | 0.0630 | 0.050 | 0.064 | 0.0433 | 0.0712 | 0.1611 | 0.111 | 0.073 | 0.194 | 0.096 | 0.0478 | 0.083 | 0.090 | 0.054 | 0.086 |
| RP | 0.0473 | 0.0377 | 0.043 | 0.0433 | 0.0237 | 0.0537 | 0.167 | 0.073 | 0.064 | 0.144 | 0.047 | 0.083 | 0.090 | 0.054 | 0.069 |
| DS | 0.0630 | 0.0755 | 0.0431 | 0.0433 | 0.035 | 0.0179 | 0.055 | 0.146 | 0.162 | 0.096 | 0.071 | 0.062 | 0.054 | 0.109 | 0.074 |
| S | 0.0630 | 0.0503 | 0.0215 | 0.0216 | 0.035 | 0.008 | 0.013 | 0.036 | 0.097 | 0.072 | 0.095 | 0.041 | 0.054 | 0.036 | 0.046 |
| CP | 0.0946 | 0.0503 | 0.0258 | 0.0433 | 0.0118 | 0.0089 | 0.0111 | 0.01223 | 0.0324 | 0.12 | 0.0717 | 0.0418 | 0.0722 | 0.0363 | 0.0452 |
| LU/LC | 0.0473 | 0.0302 | 0.0258 | 0.0289 | 0.0178 | 0.0107 | 0.0139 | 0.0122 | 0.0064 | 0.024 | 0.1434 | 0.1254 | 0.1084 | 0.1090 | 0.0504 |
| SPI | 0.0473 | 0.0251 | 0.0215 | 0.0216 | 0.0356 | 0.0089 | 0.0186 | 0.0091 | 0.01082 | 0.004 | 0.0239 | 0.0627 | 0.0722 | 0.0727 | 0.031 |
| TPI | 0.0378 | 0.0252 | 0.0215 | 0.0173 | 0.0178 | 0.0134 | 0.0186 | 0.0183 | 0.0162 | 0.004 | 0.0079 | 0.0209 | 0.0361 | 0.0545 | 0.0221 |
| TWI | 0.031 | 0.025 | 0.021 | 0.021 | 0.014 | 0.008 | 0.018 | 0.012 | 0.008 | 0.004 | 0.005 | 0.010 | 0.018 | 0.054 | 0.018 |
| SL | 0.031 | 0.025 | 0.021 | 0.021 | 0.023 | 0.008 | 0.009 | 0.018 | 0.016 | 0.004 | 0.005 | 0.006 | 0.006 | 0.0181 | 0.015 |
| λmax = 15.64 | RI = 1.52 | N = 14 | CR = 0.082 < 0.1 | ||||||||||||
| n | 1 | 2 | 3 | 4 | 5 | 6 | 7 | 8 | 9 | 10 | 11 |
|---|---|---|---|---|---|---|---|---|---|---|---|
| RI | 0 | 0 | 0.58 | 0.9 | 1.12 | 1.24 | 1.32 | 1.41 | 1.45 | 1.49 | 1.52 |
| Borehole | X | Y | Total Depth | Lithological | % of the Cumul | Yield of | Permeability |
|---|---|---|---|---|---|---|---|
| Formation | Length Fractured Formation | Borehole (L/s) | |||||
| S1 | 40,767 | 274,334 | 80 | Gd | 12% | 0.05 | - |
| S2 | 41,381 | 274,956 | 32 | Gr | 60% | 3.5 | 5.3 × 10⁻⁸ |
| S3 | 41,192 | 273,889 | 32 | Gr | 66% | 0.5 | 1.18 × 10⁻⁷ |
| S4 | 41,107 | 273,605 | 42 | Gr | 36% | 1.8 | 1.04 × 10⁻⁶ |
| S5 | 40,292 | 270,074 | 80 | Gd | 26% | 0.08 | - |
| S6 | 40,209 | 270,323 | 60 | Gd | 16% | 0.02 | 1.27 × 10⁻⁶ |
| S7 | 39,667 | 271,138 | 50 | Gd | 20% | - | - |
| S8 | 41,829 | 271,506 | 80 | G | 32% | 0.55 | 1.07 × 10⁻⁷ |
| S9 | 40,528 | 271,663 | 50 | Gd | 14% | 0.6 | 4.3 × 10⁻⁷ |
| S10 | 40,998 | 27,1739 | 80 | Gd | 25% | 0.45 | 0.95 × 10⁻⁷ |
| S11 | 41,356 | 270,658 | 80 | G | 55% | 1.4 | - |
| S12 | 40,710 | 271,121 | 50 | G | 14% | 0.06 | - |
| S13 | 40,643 | 273,948 | 80 | Gd | 25% | 0.3 | 0.9 × 10⁻⁷ |
| S14 | 39,380 | 273,811 | 60 | Gd | 12% | 0.02 | - |
| S15 | 39,784 | 273,385 | 80 | Gd | 0% | - | - |
Disclaimer/Publisher’s Note: The statements, opinions and data contained in all publications are solely those of the individual author(s) and contributor(s) and not of MDPI and/or the editor(s). MDPI and/or the editor(s) disclaim responsibility for any injury to people or property resulting from any ideas, methods, instructions or products referred to in the content. |
© 2023 by the authors. Licensee MDPI, Basel, Switzerland. This article is an open access article distributed under the terms and conditions of the Creative Commons Attribution (CC BY) license (https://creativecommons.org/licenses/by/4.0/).
Share and Cite
Ikirri, M.; Boutaleb, S.; Ibraheem, I.M.; Abioui, M.; Echogdali, F.Z.; Abdelrahman, K.; Id-Belqas, M.; Abu-Alam, T.; El Ayady, H.; Essoussi, S.; et al. Delineation of Groundwater Potential Area using an AHP, Remote Sensing, and GIS Techniques in the Ifni Basin, Western Anti-Atlas, Morocco. Water 2023, 15, 1436. https://doi.org/10.3390/w15071436
Ikirri M, Boutaleb S, Ibraheem IM, Abioui M, Echogdali FZ, Abdelrahman K, Id-Belqas M, Abu-Alam T, El Ayady H, Essoussi S, et al. Delineation of Groundwater Potential Area using an AHP, Remote Sensing, and GIS Techniques in the Ifni Basin, Western Anti-Atlas, Morocco. Water. 2023; 15(7):1436. https://doi.org/10.3390/w15071436
Chicago/Turabian StyleIkirri, Mustapha, Said Boutaleb, Ismael M. Ibraheem, Mohamed Abioui, Fatima Zahra Echogdali, Kamal Abdelrahman, Mouna Id-Belqas, Tamer Abu-Alam, Hasna El Ayady, Sara Essoussi, and et al. 2023. "Delineation of Groundwater Potential Area using an AHP, Remote Sensing, and GIS Techniques in the Ifni Basin, Western Anti-Atlas, Morocco" Water 15, no. 7: 1436. https://doi.org/10.3390/w15071436