
Evaluation of SPI and Rainfall Departure Based on Multi-Satellite Precipitation Products for Meteorological Drought Monitoring in Tamil Nadu
 , , , ,
Abstract
:1. Introduction
2. Materials
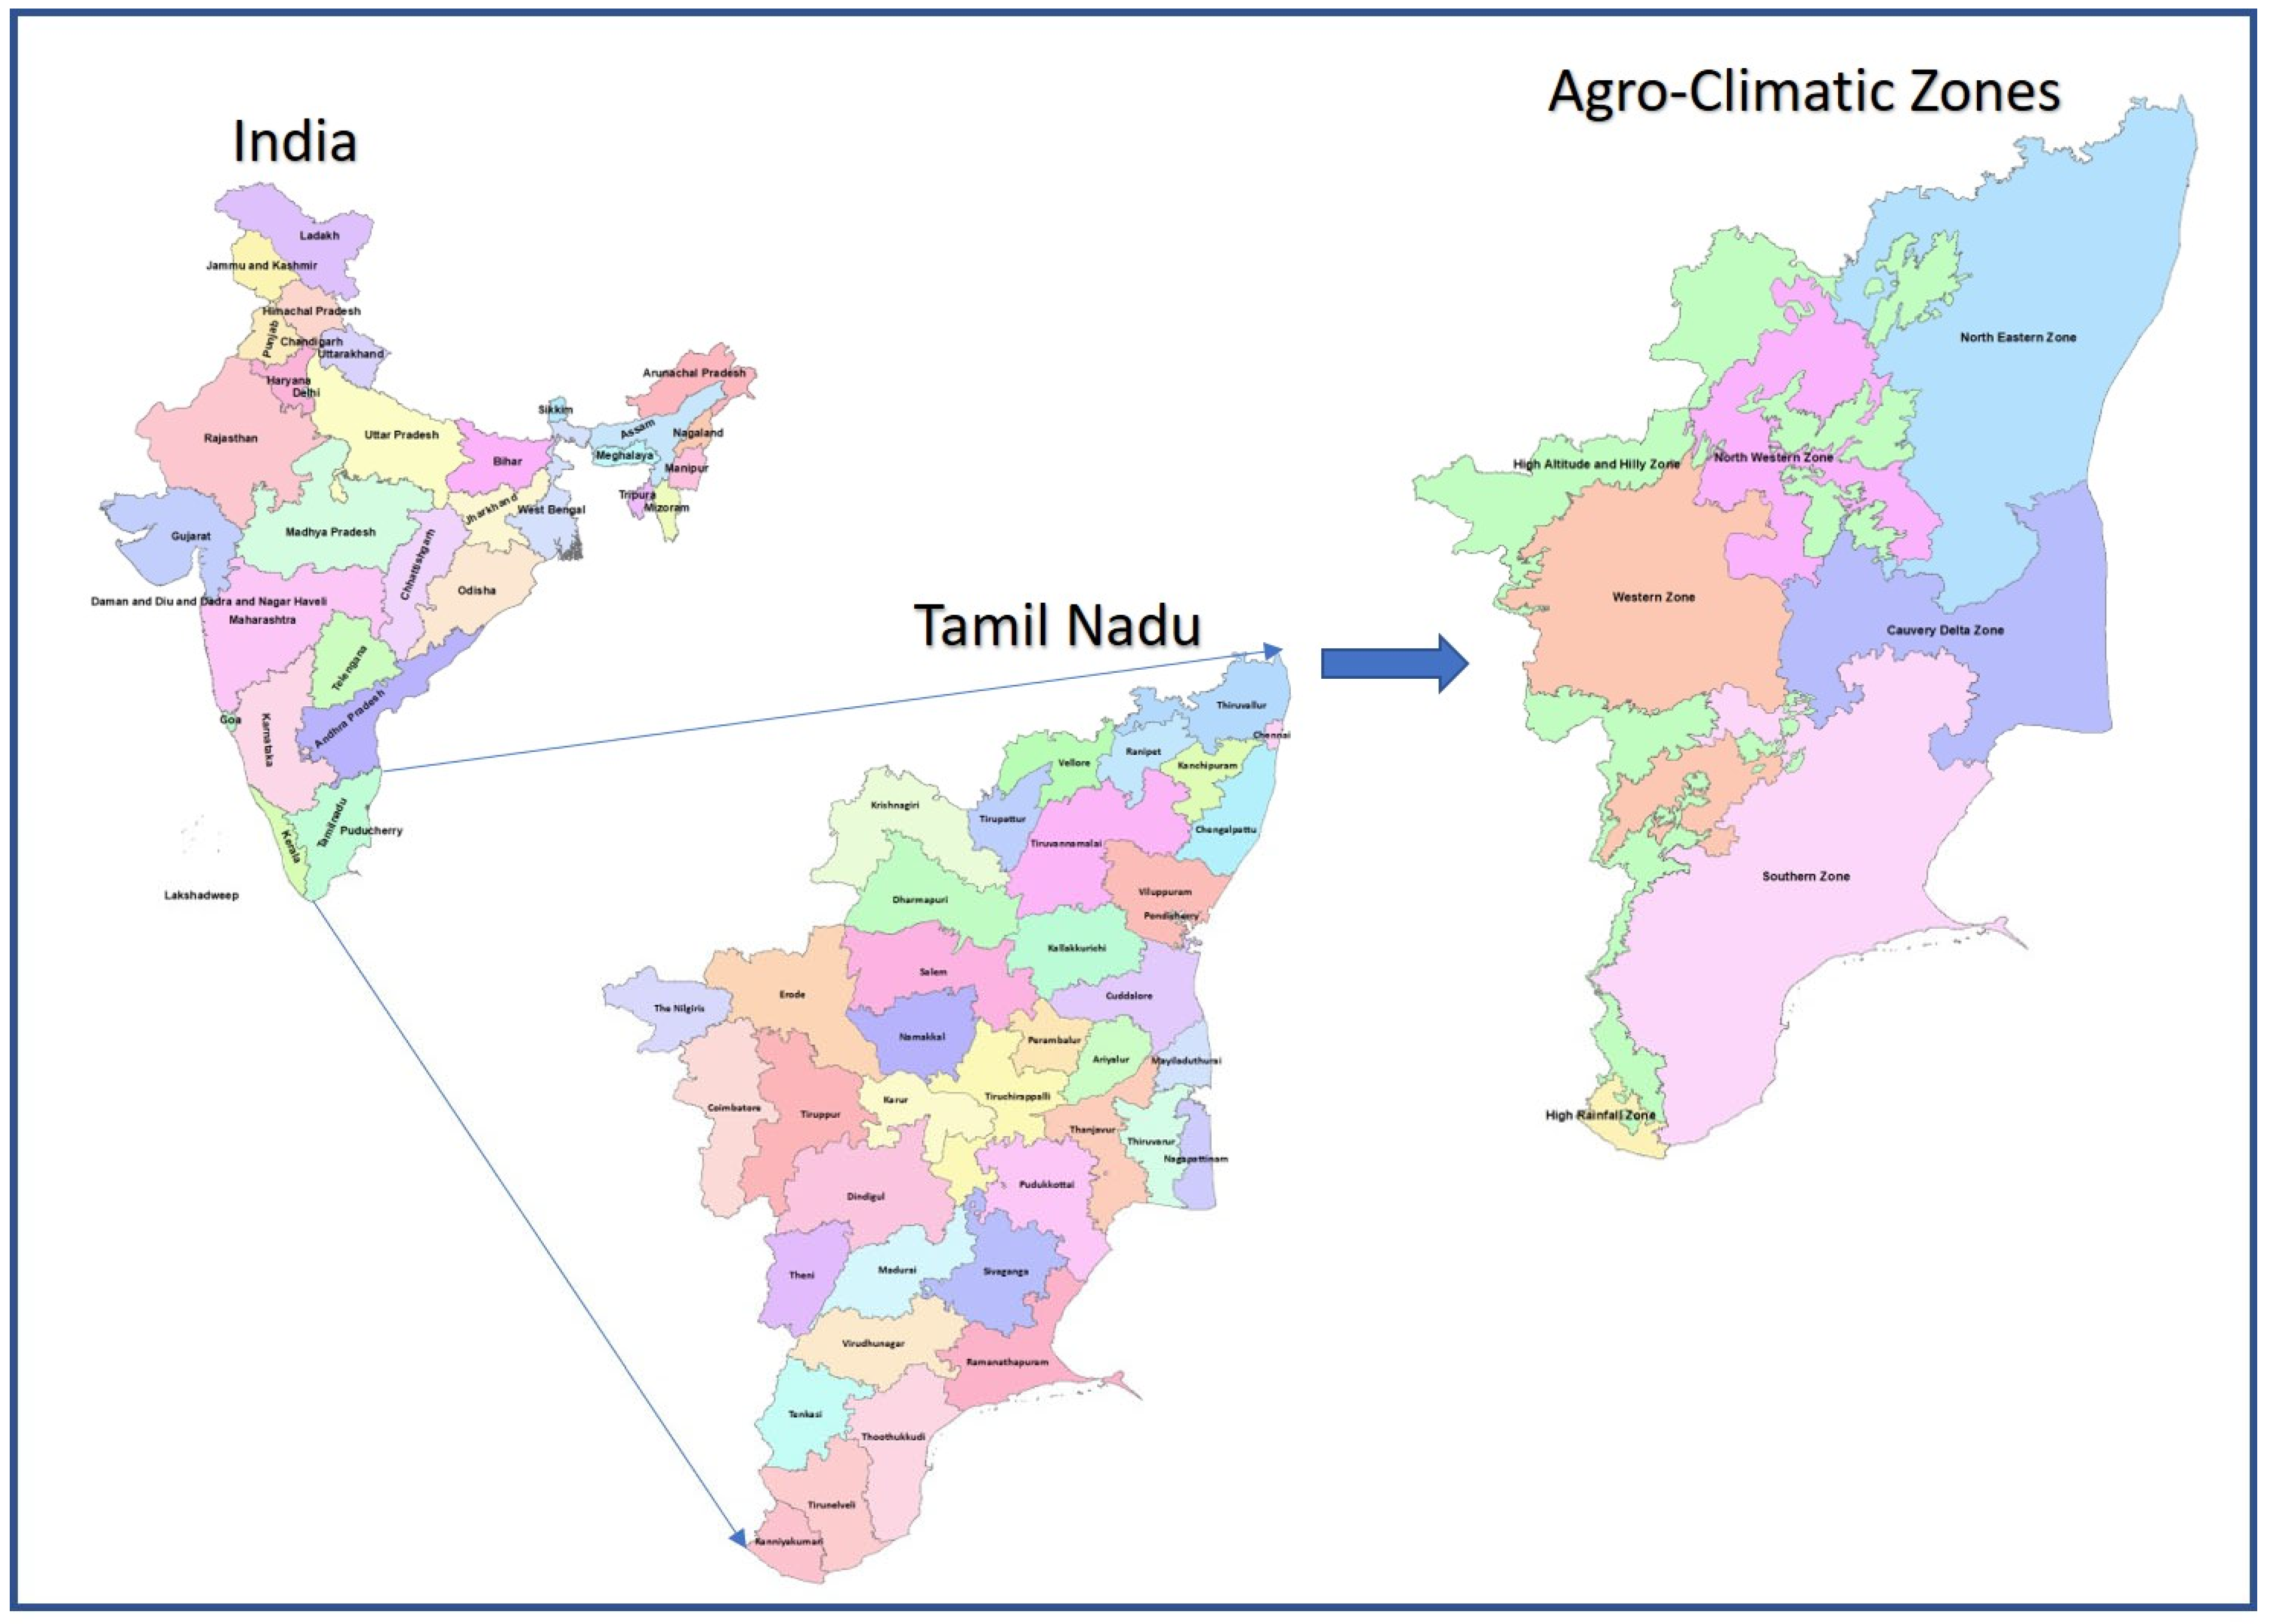
2.1. Study Area
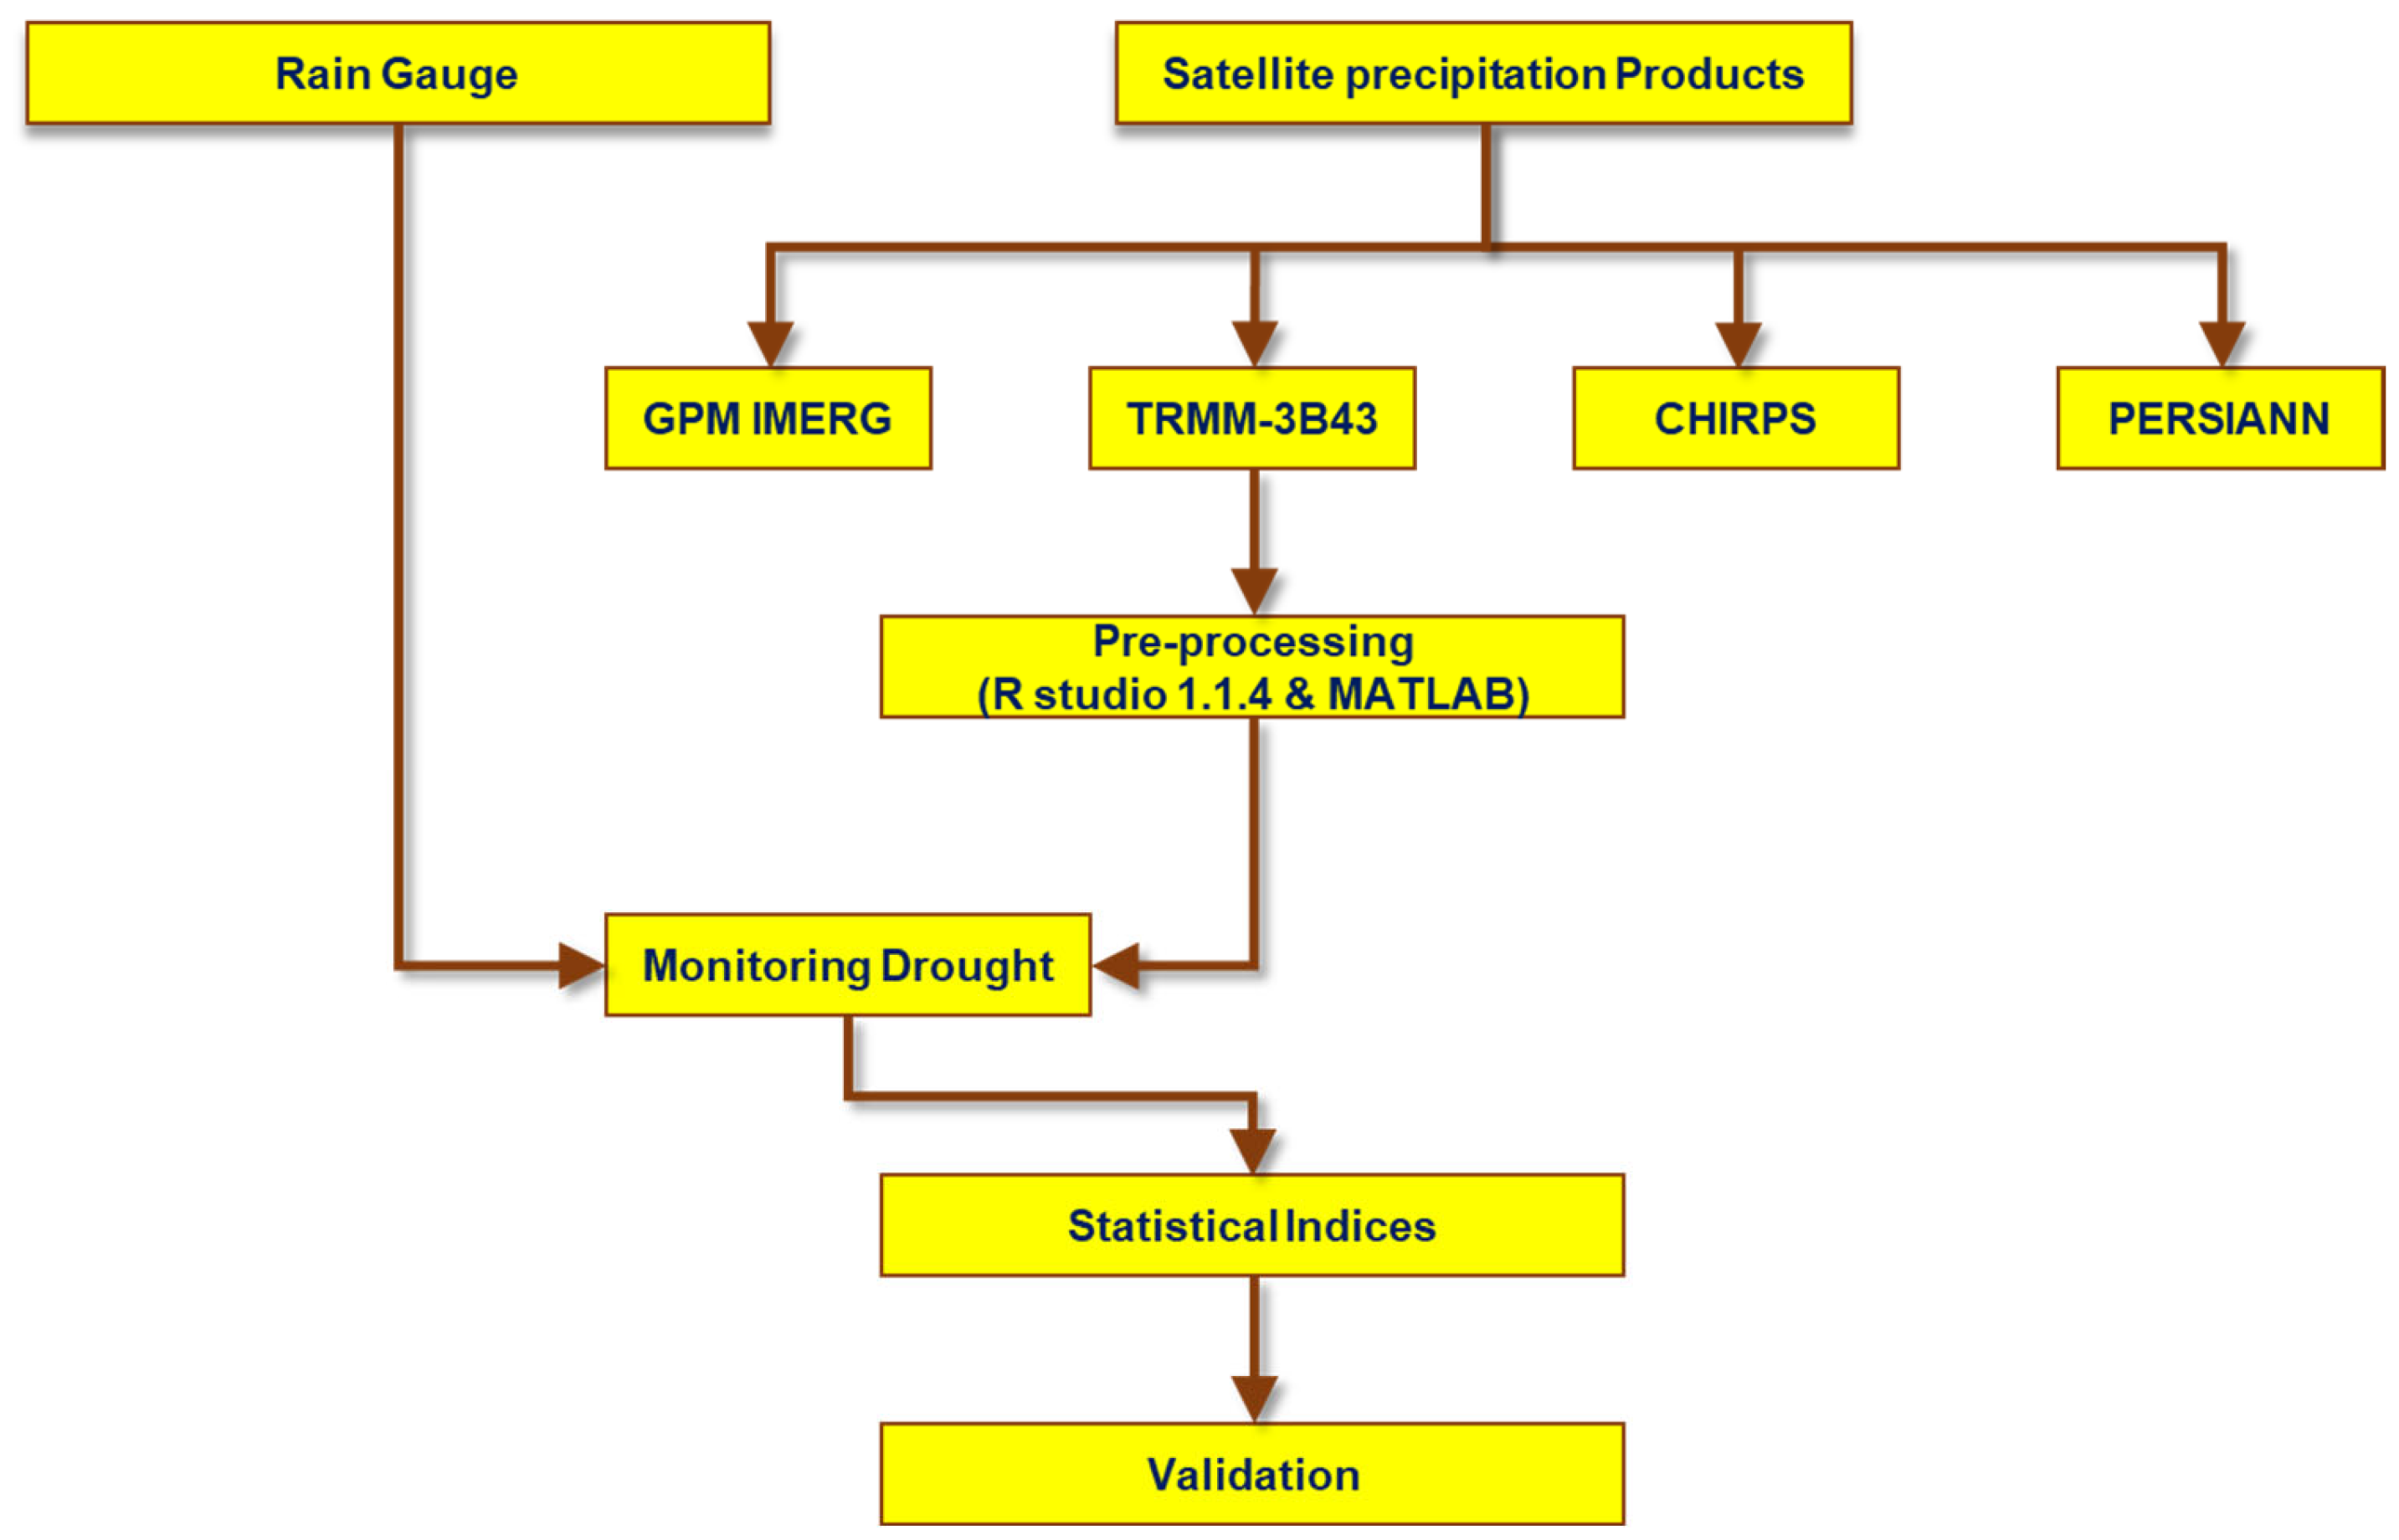
2.2. Data Collection
2.3. Satellite-Based Precipitation Products
2.3.1. Global Precipitation Measurement (GPM) Integrated Multi-Satellite Retrievals for GPM (GPM IMERG)
2.3.2. Tropical Rainfall Measurement Mission (TRMM)
2.3.3. Climate Hazards Group Infrared Precipitation and Stations (CHIRPS)
2.3.4. Precipitation Estimation from Remotely Sensed Information using Artificial Neural Networks (PERSIANN)
2.4. In-Situ Rain Gauge Data
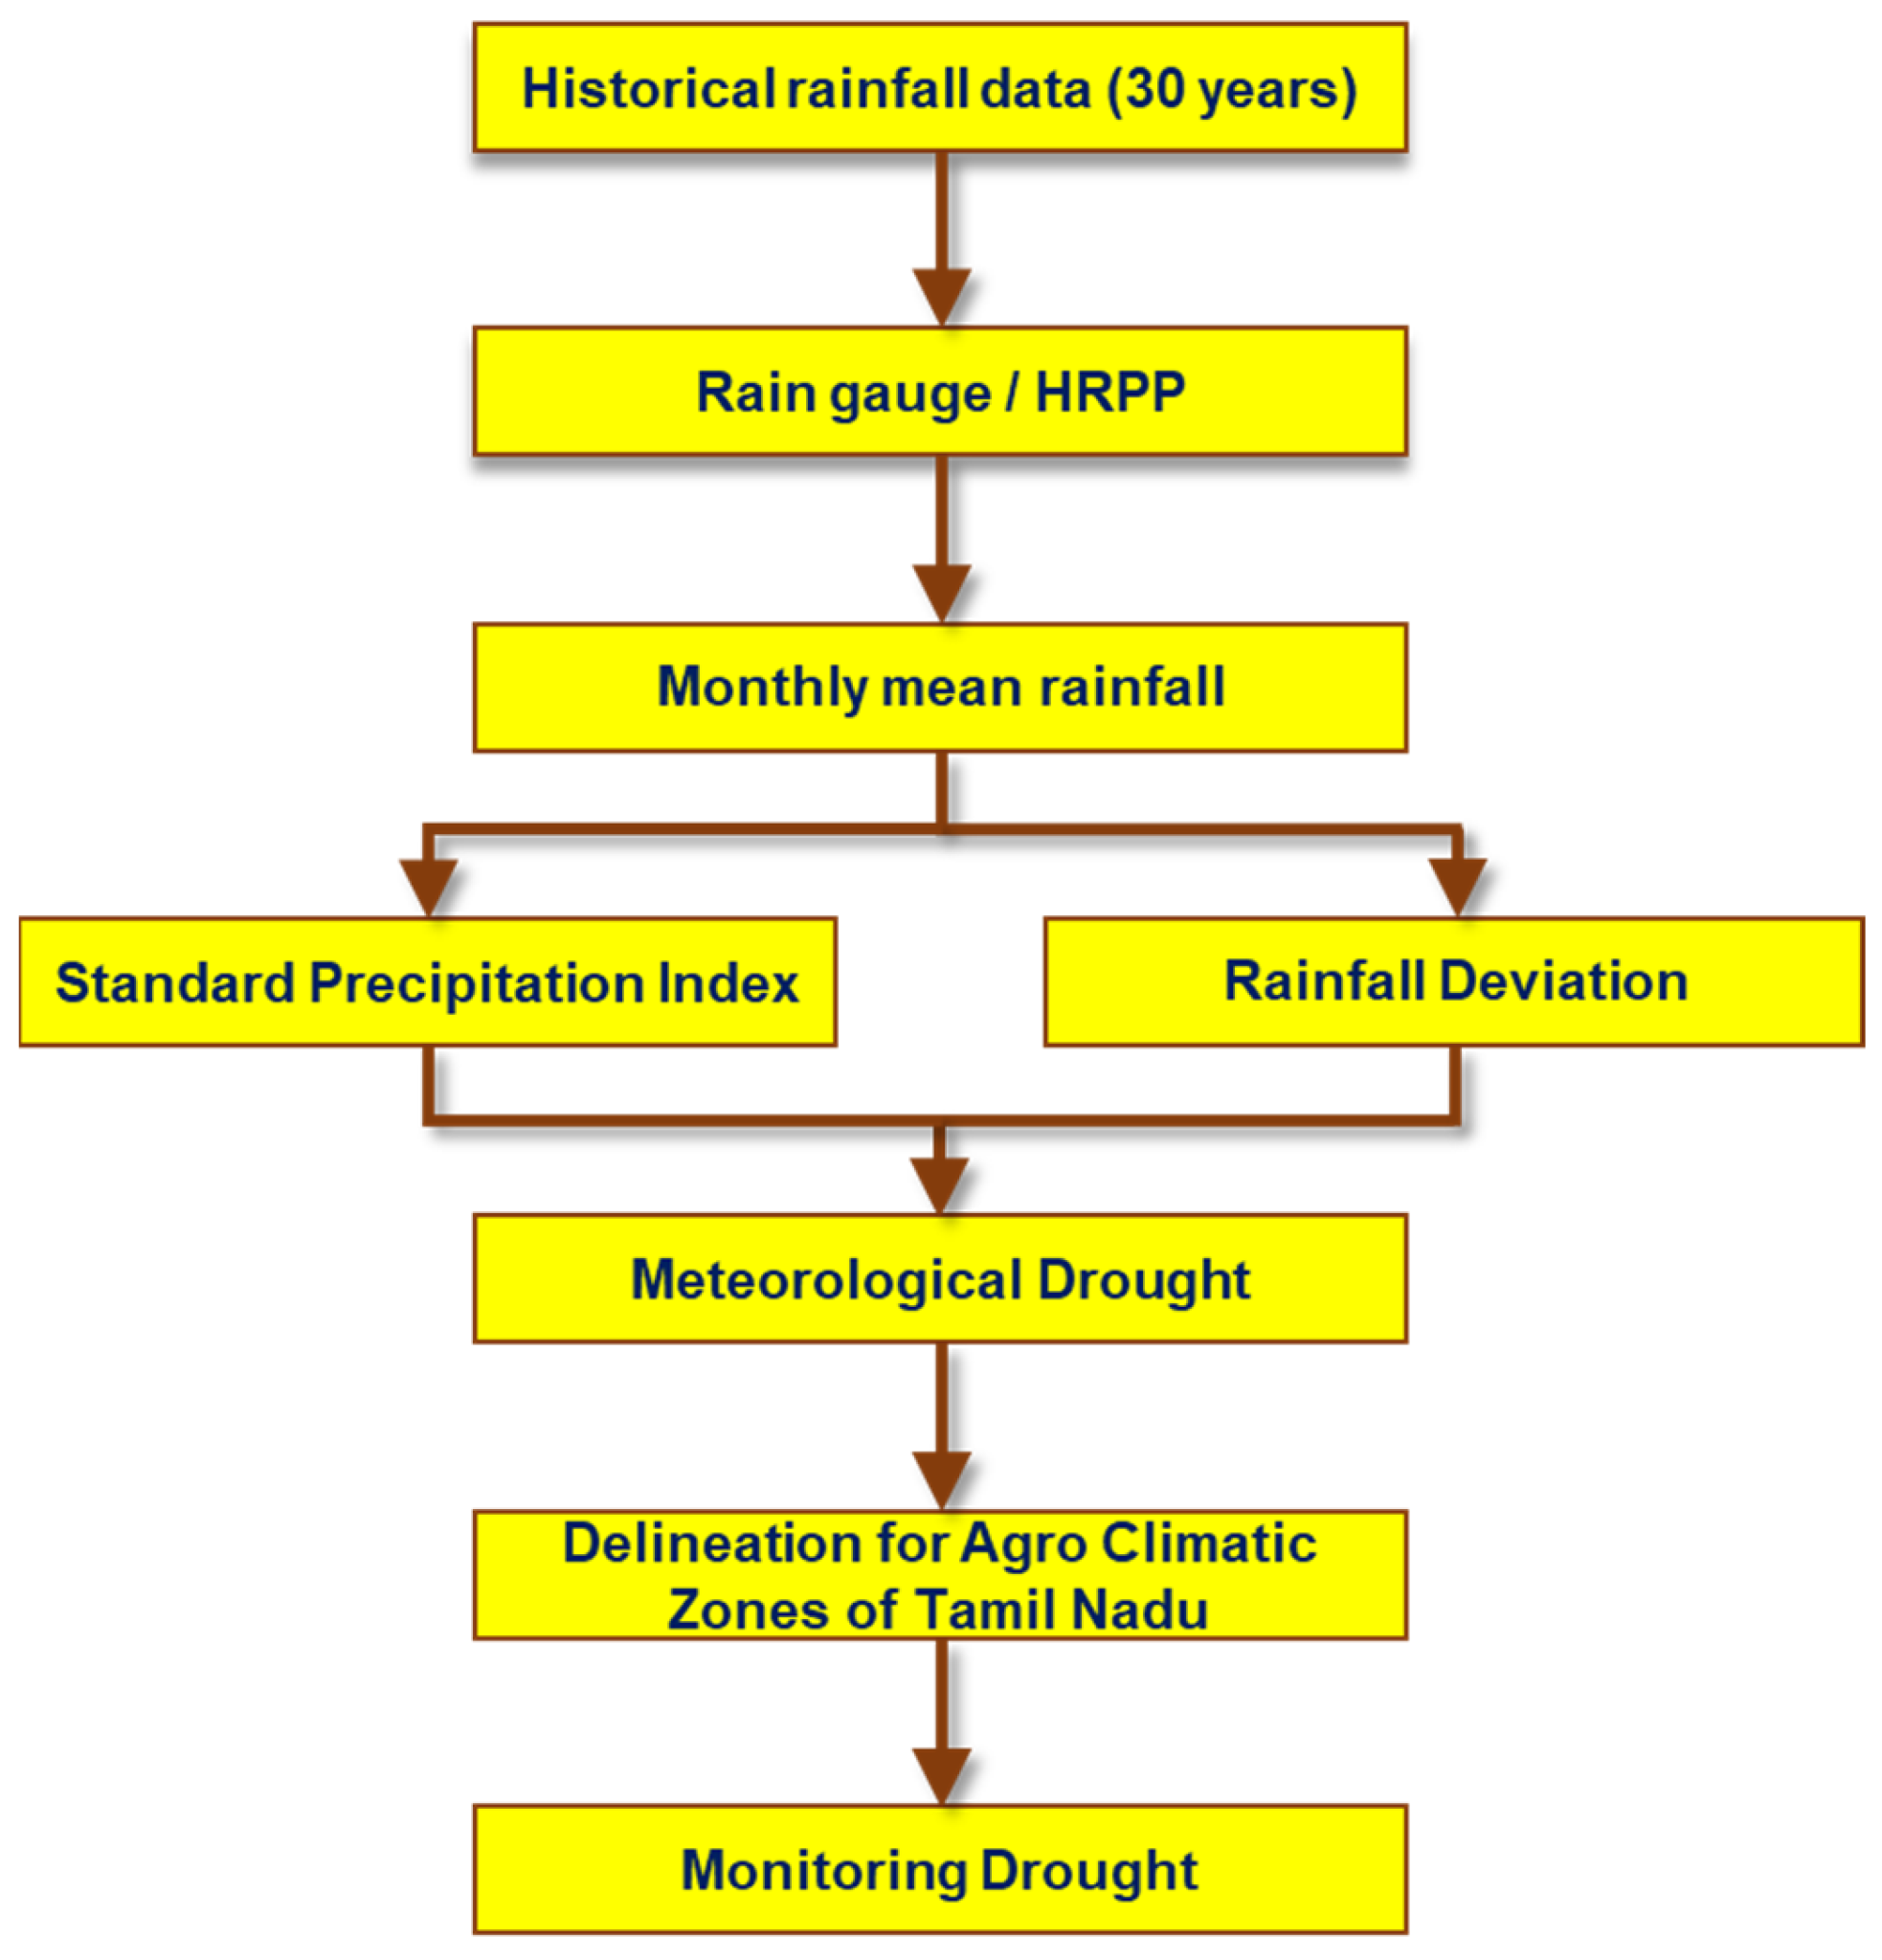
3. Methodology
3.1. Evaluation of High-Resolution Precipitation Products
3.2. Performance Metrics
3.3. Calculation of Standardized Precipitation Index (SPI)
3.4. Calculation of Rainfall Deviation
4. Results
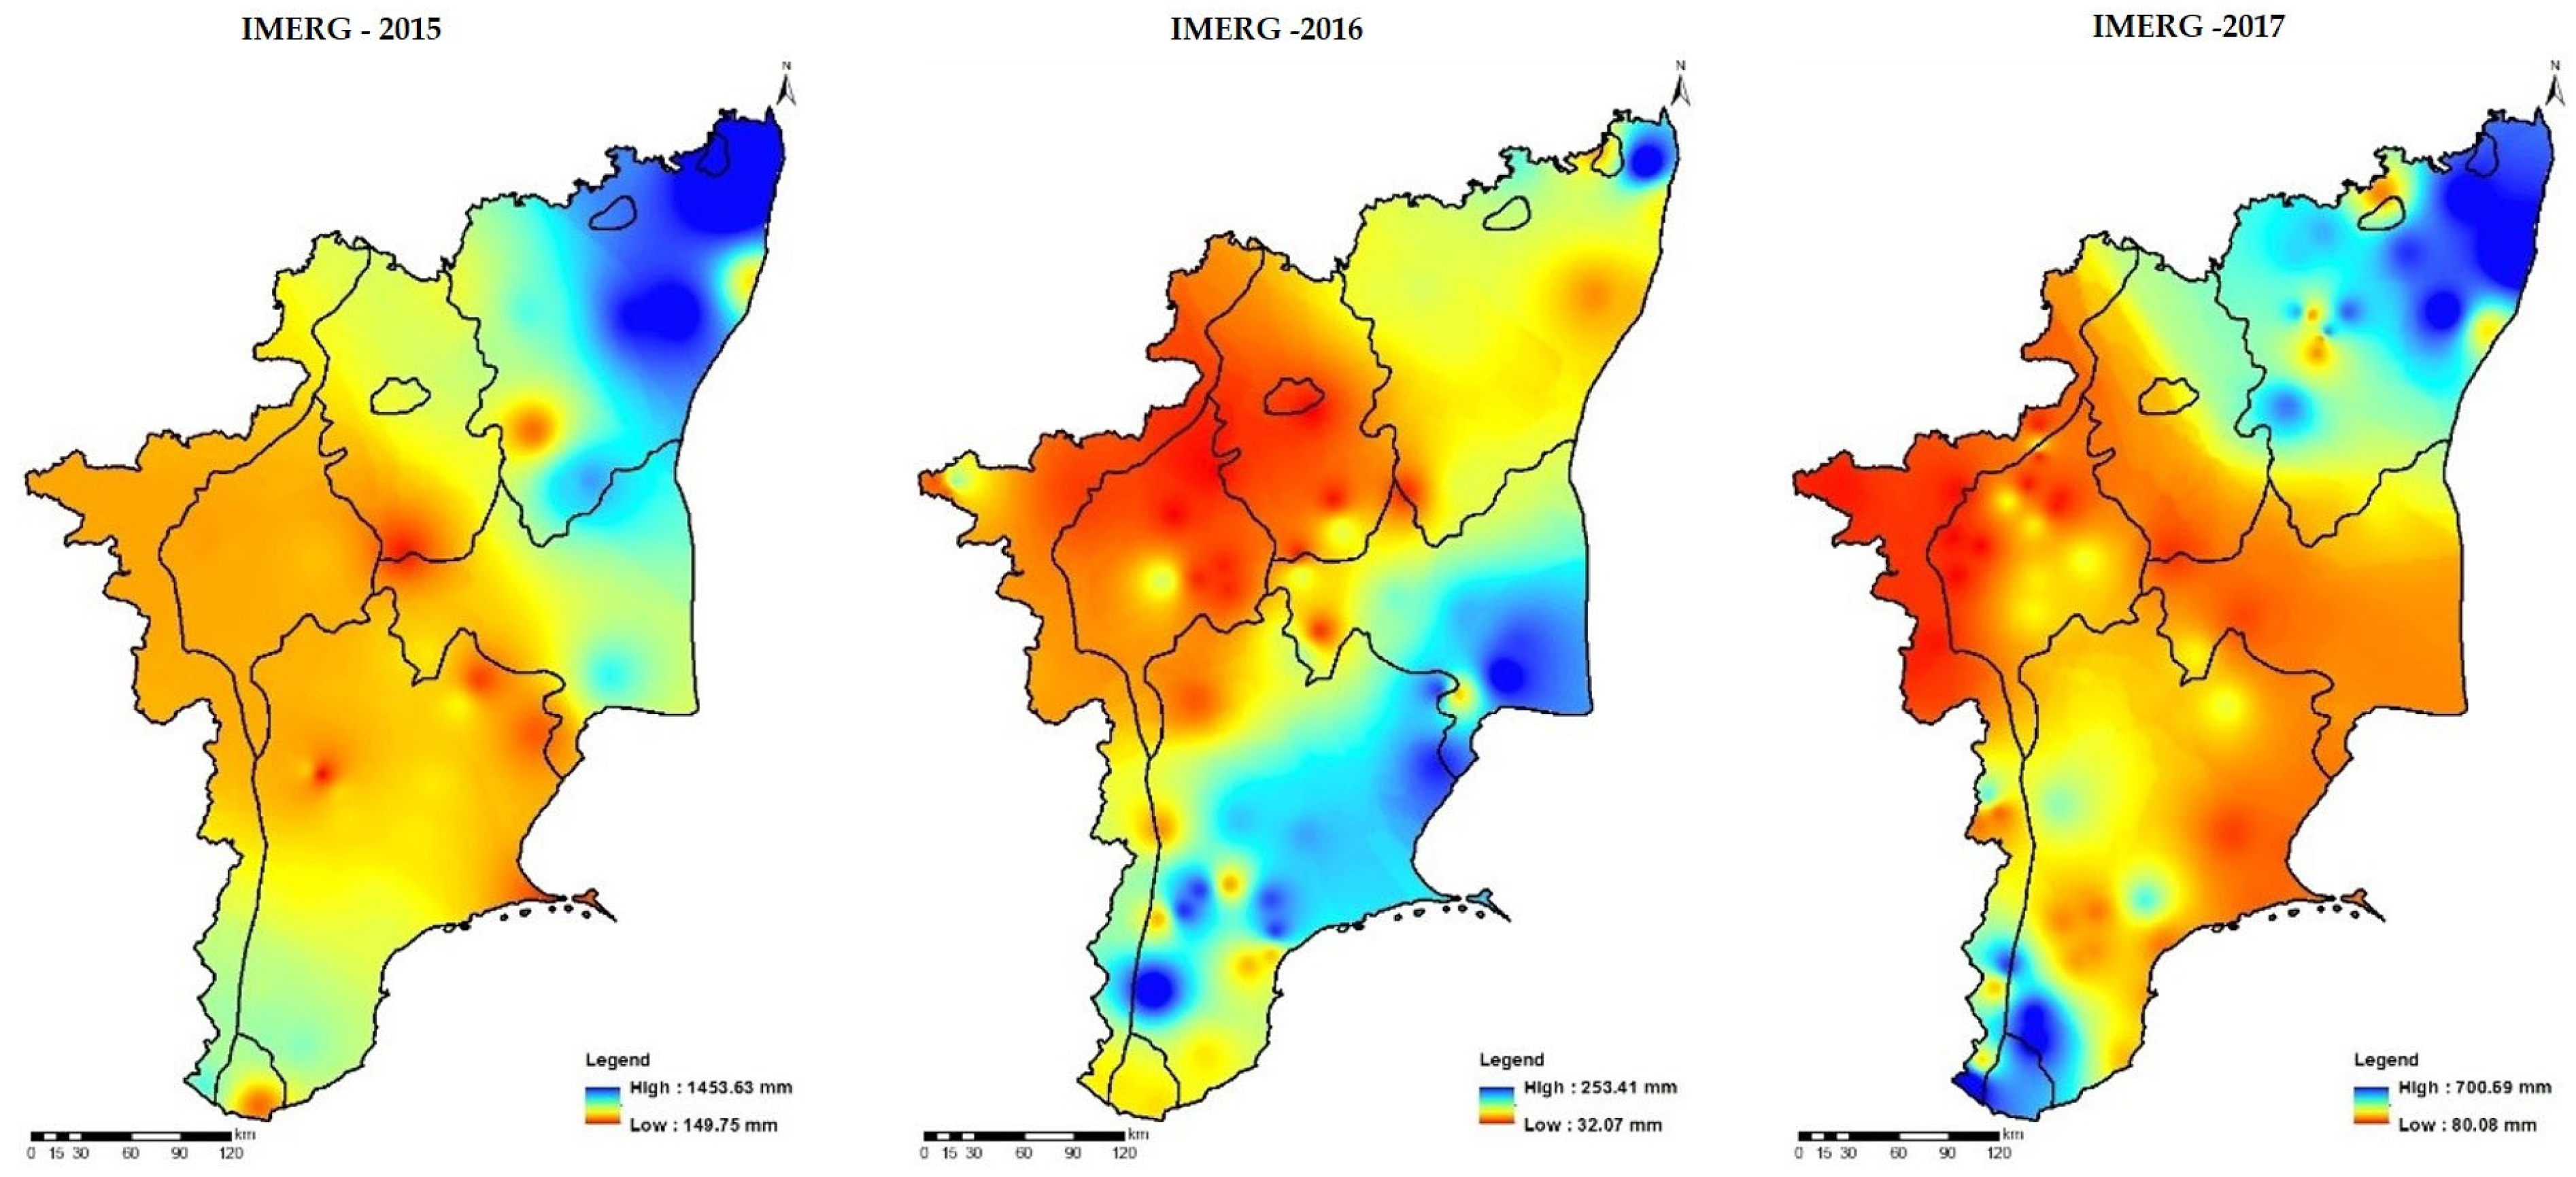
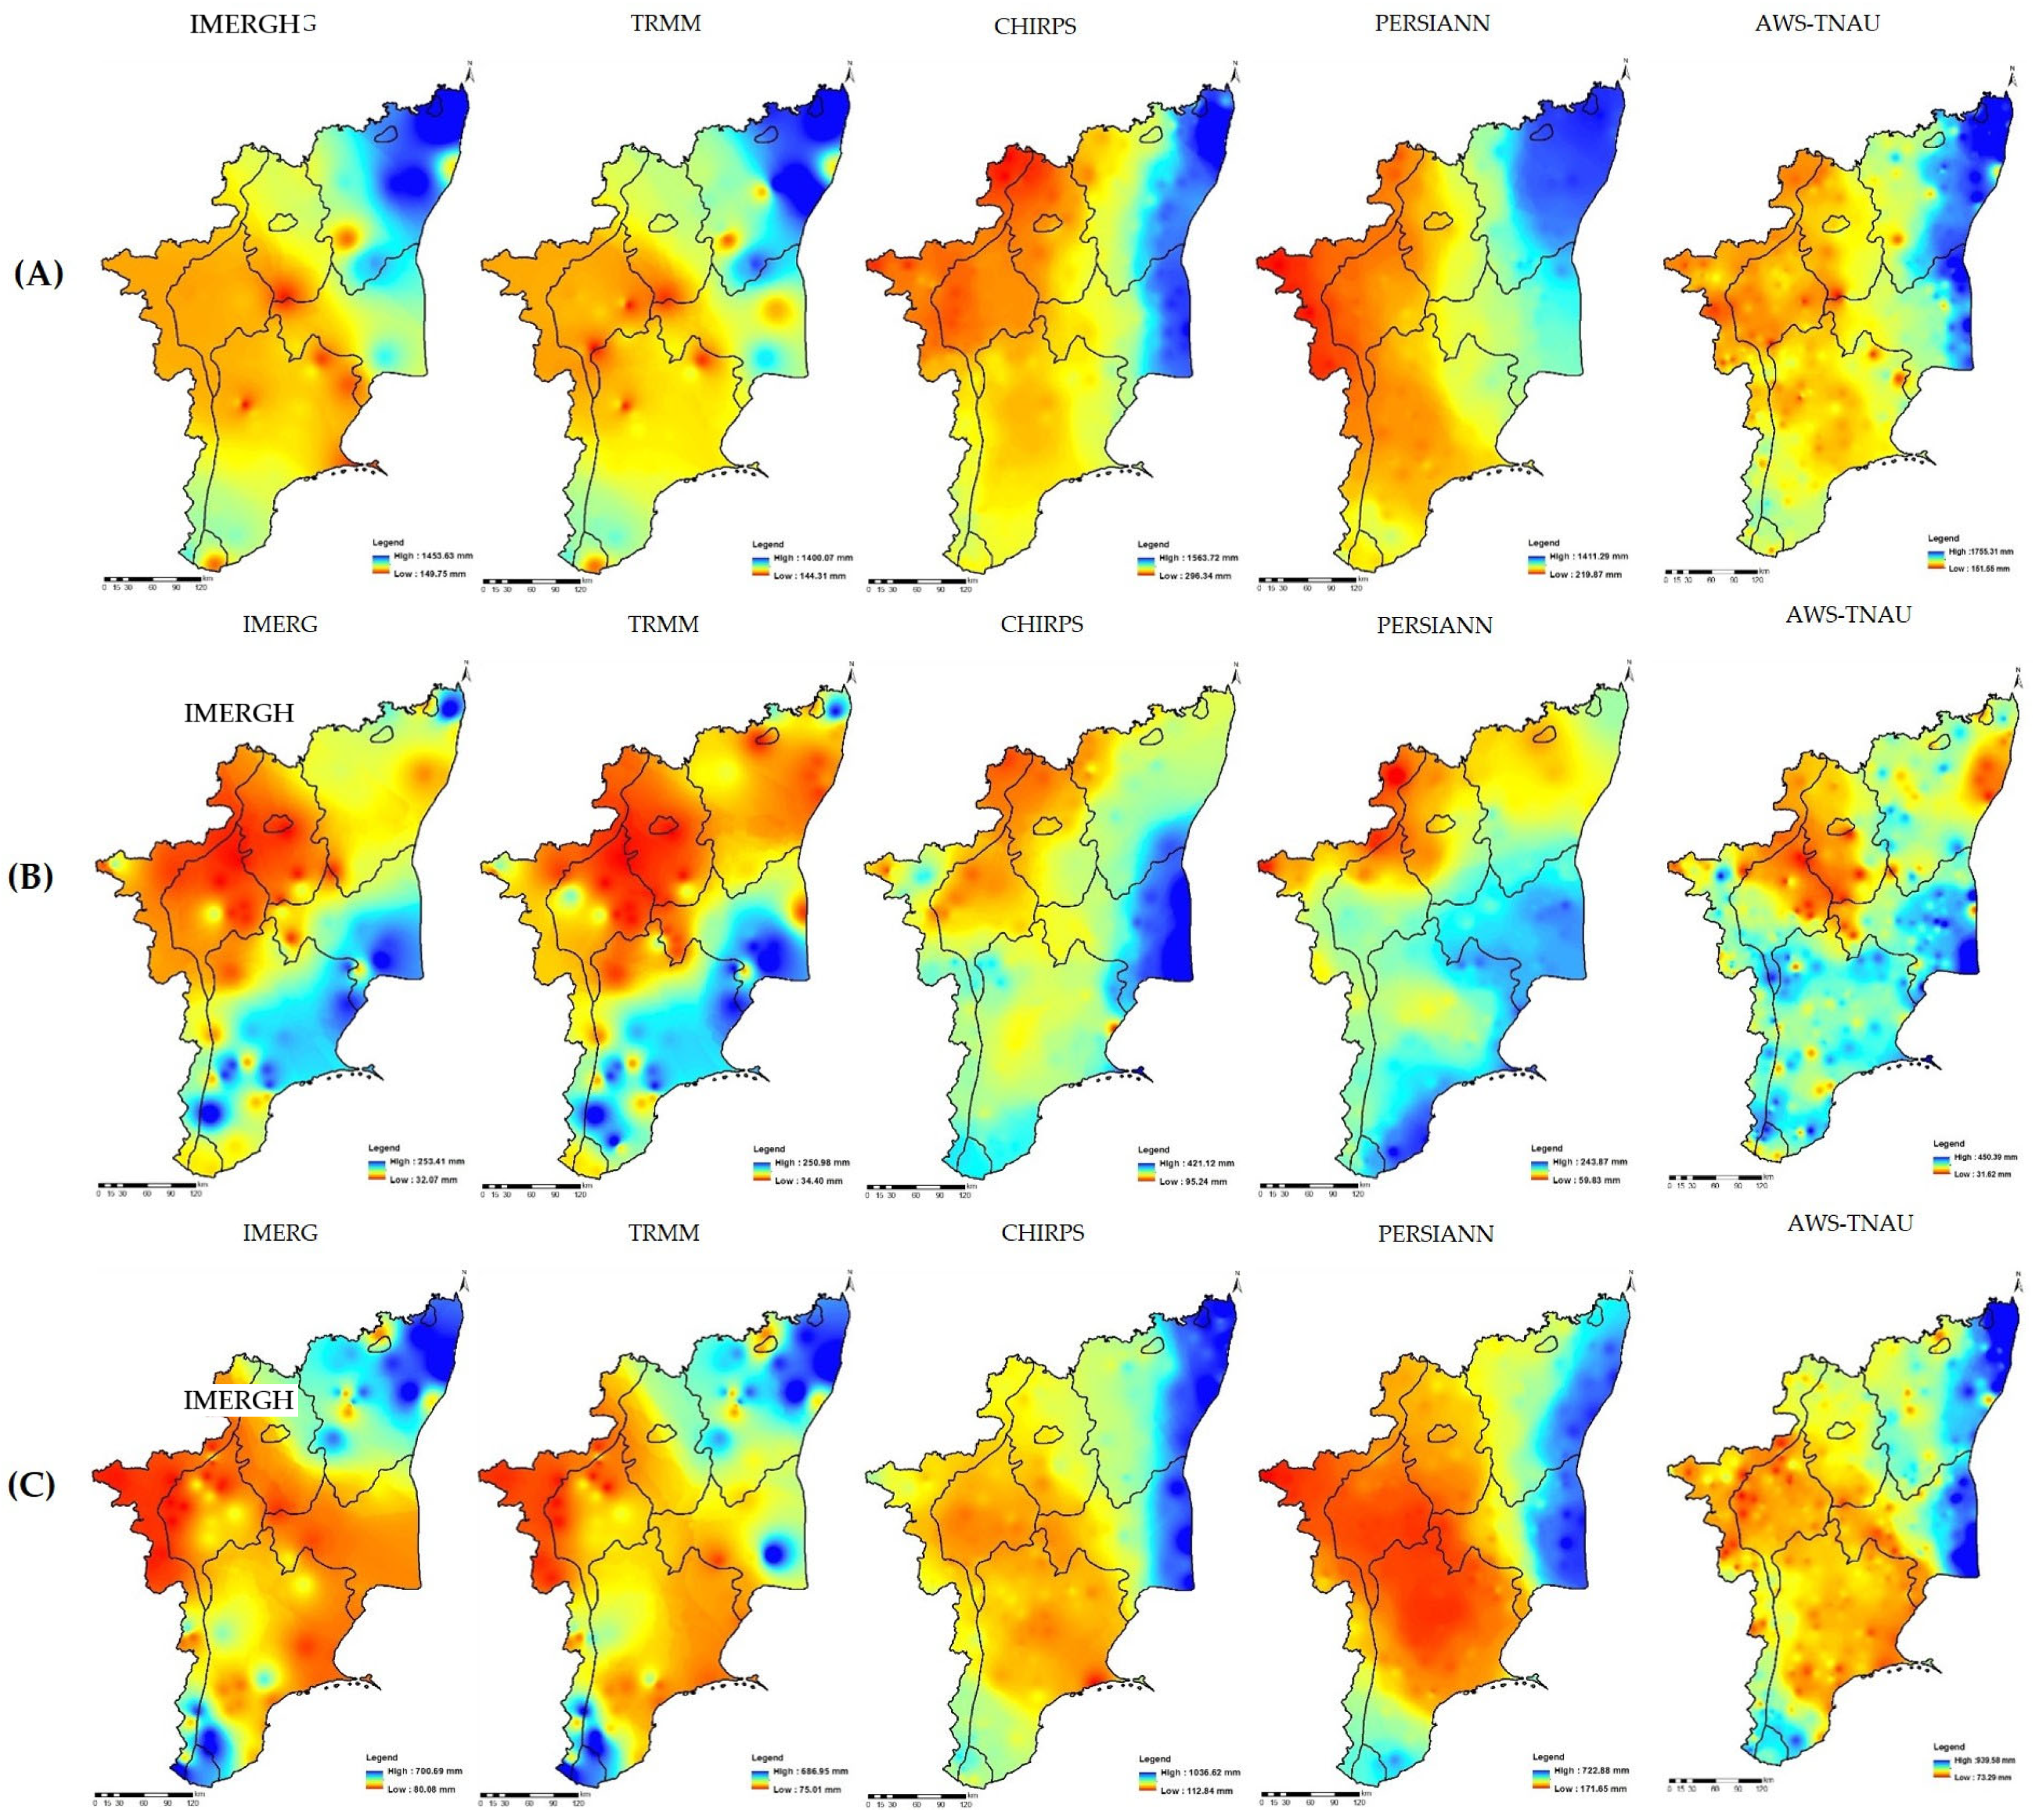
4.1. Spatial Distribution of Precipitation Products and AWS Data
4.2. Seasonal Precipitation Evaluation of Four High Resolution Precipitation Products
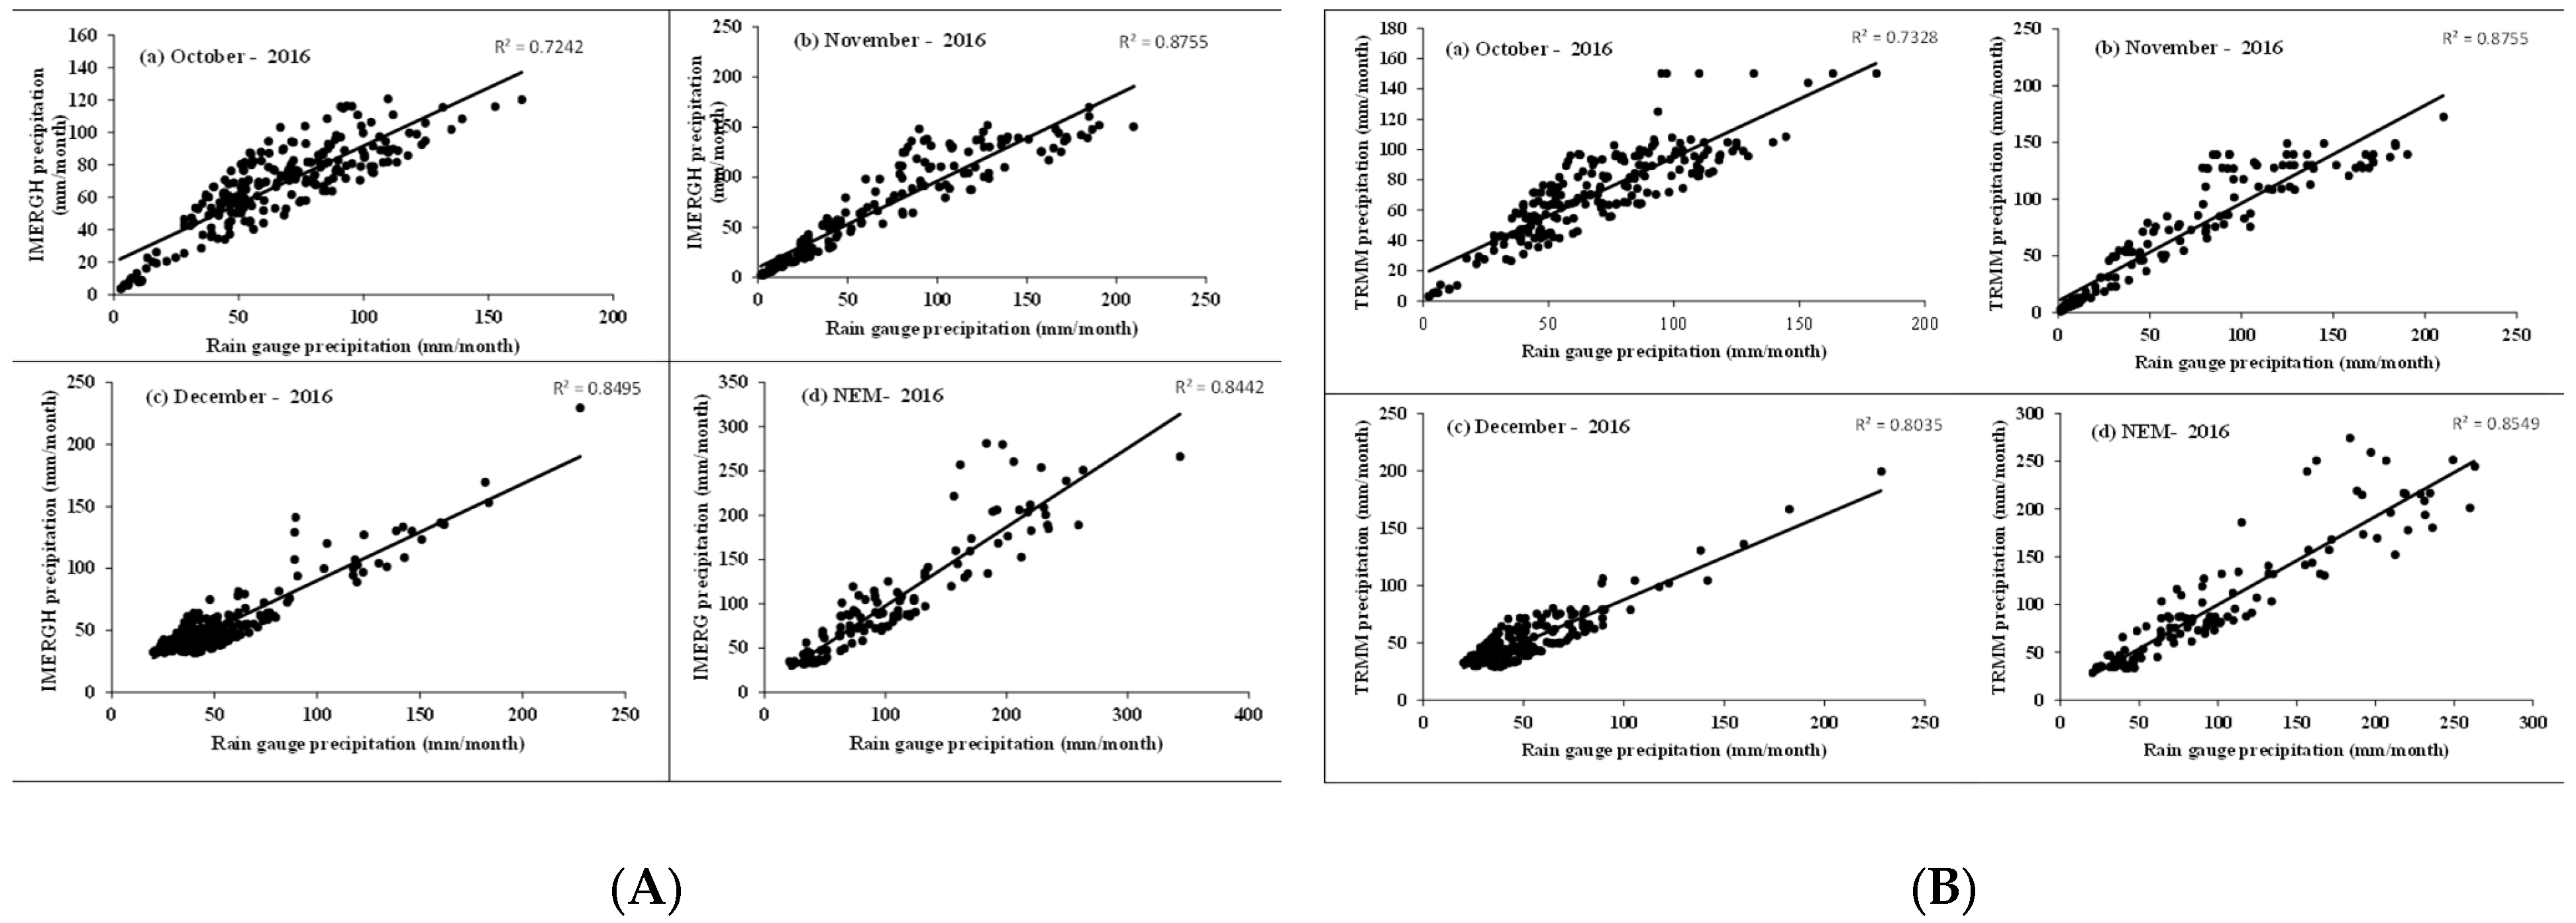
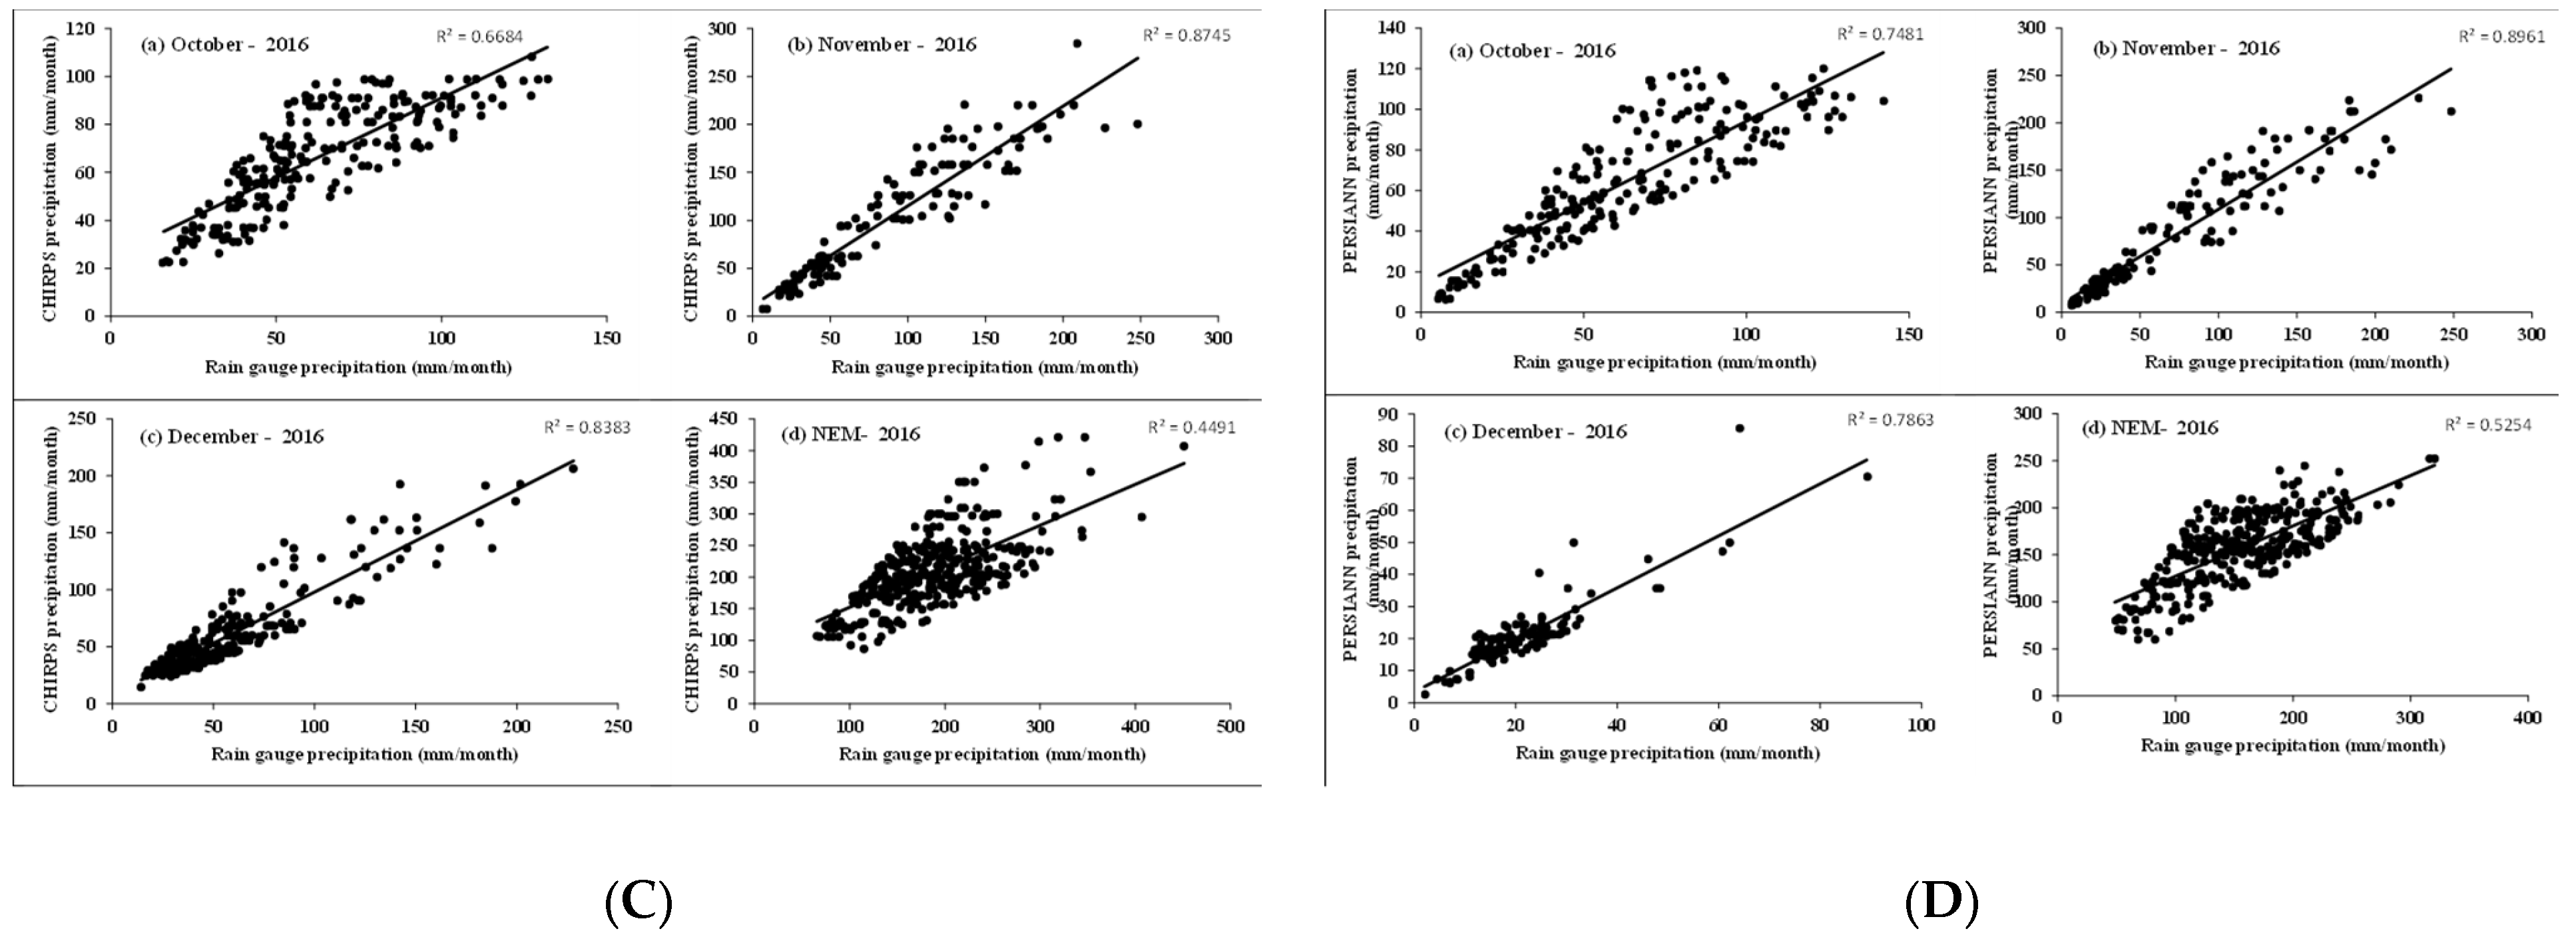
4.3. Accuracy Assessment of High-Resolution Satellite Precipitation Products at the Regional Scale
4.4. Drought Assessment Based on the Standardized Precipitation Index
4.5. Assessment of Meteorological Drought Based on Rainfall Departure
5. Discussion
6. Conclusions
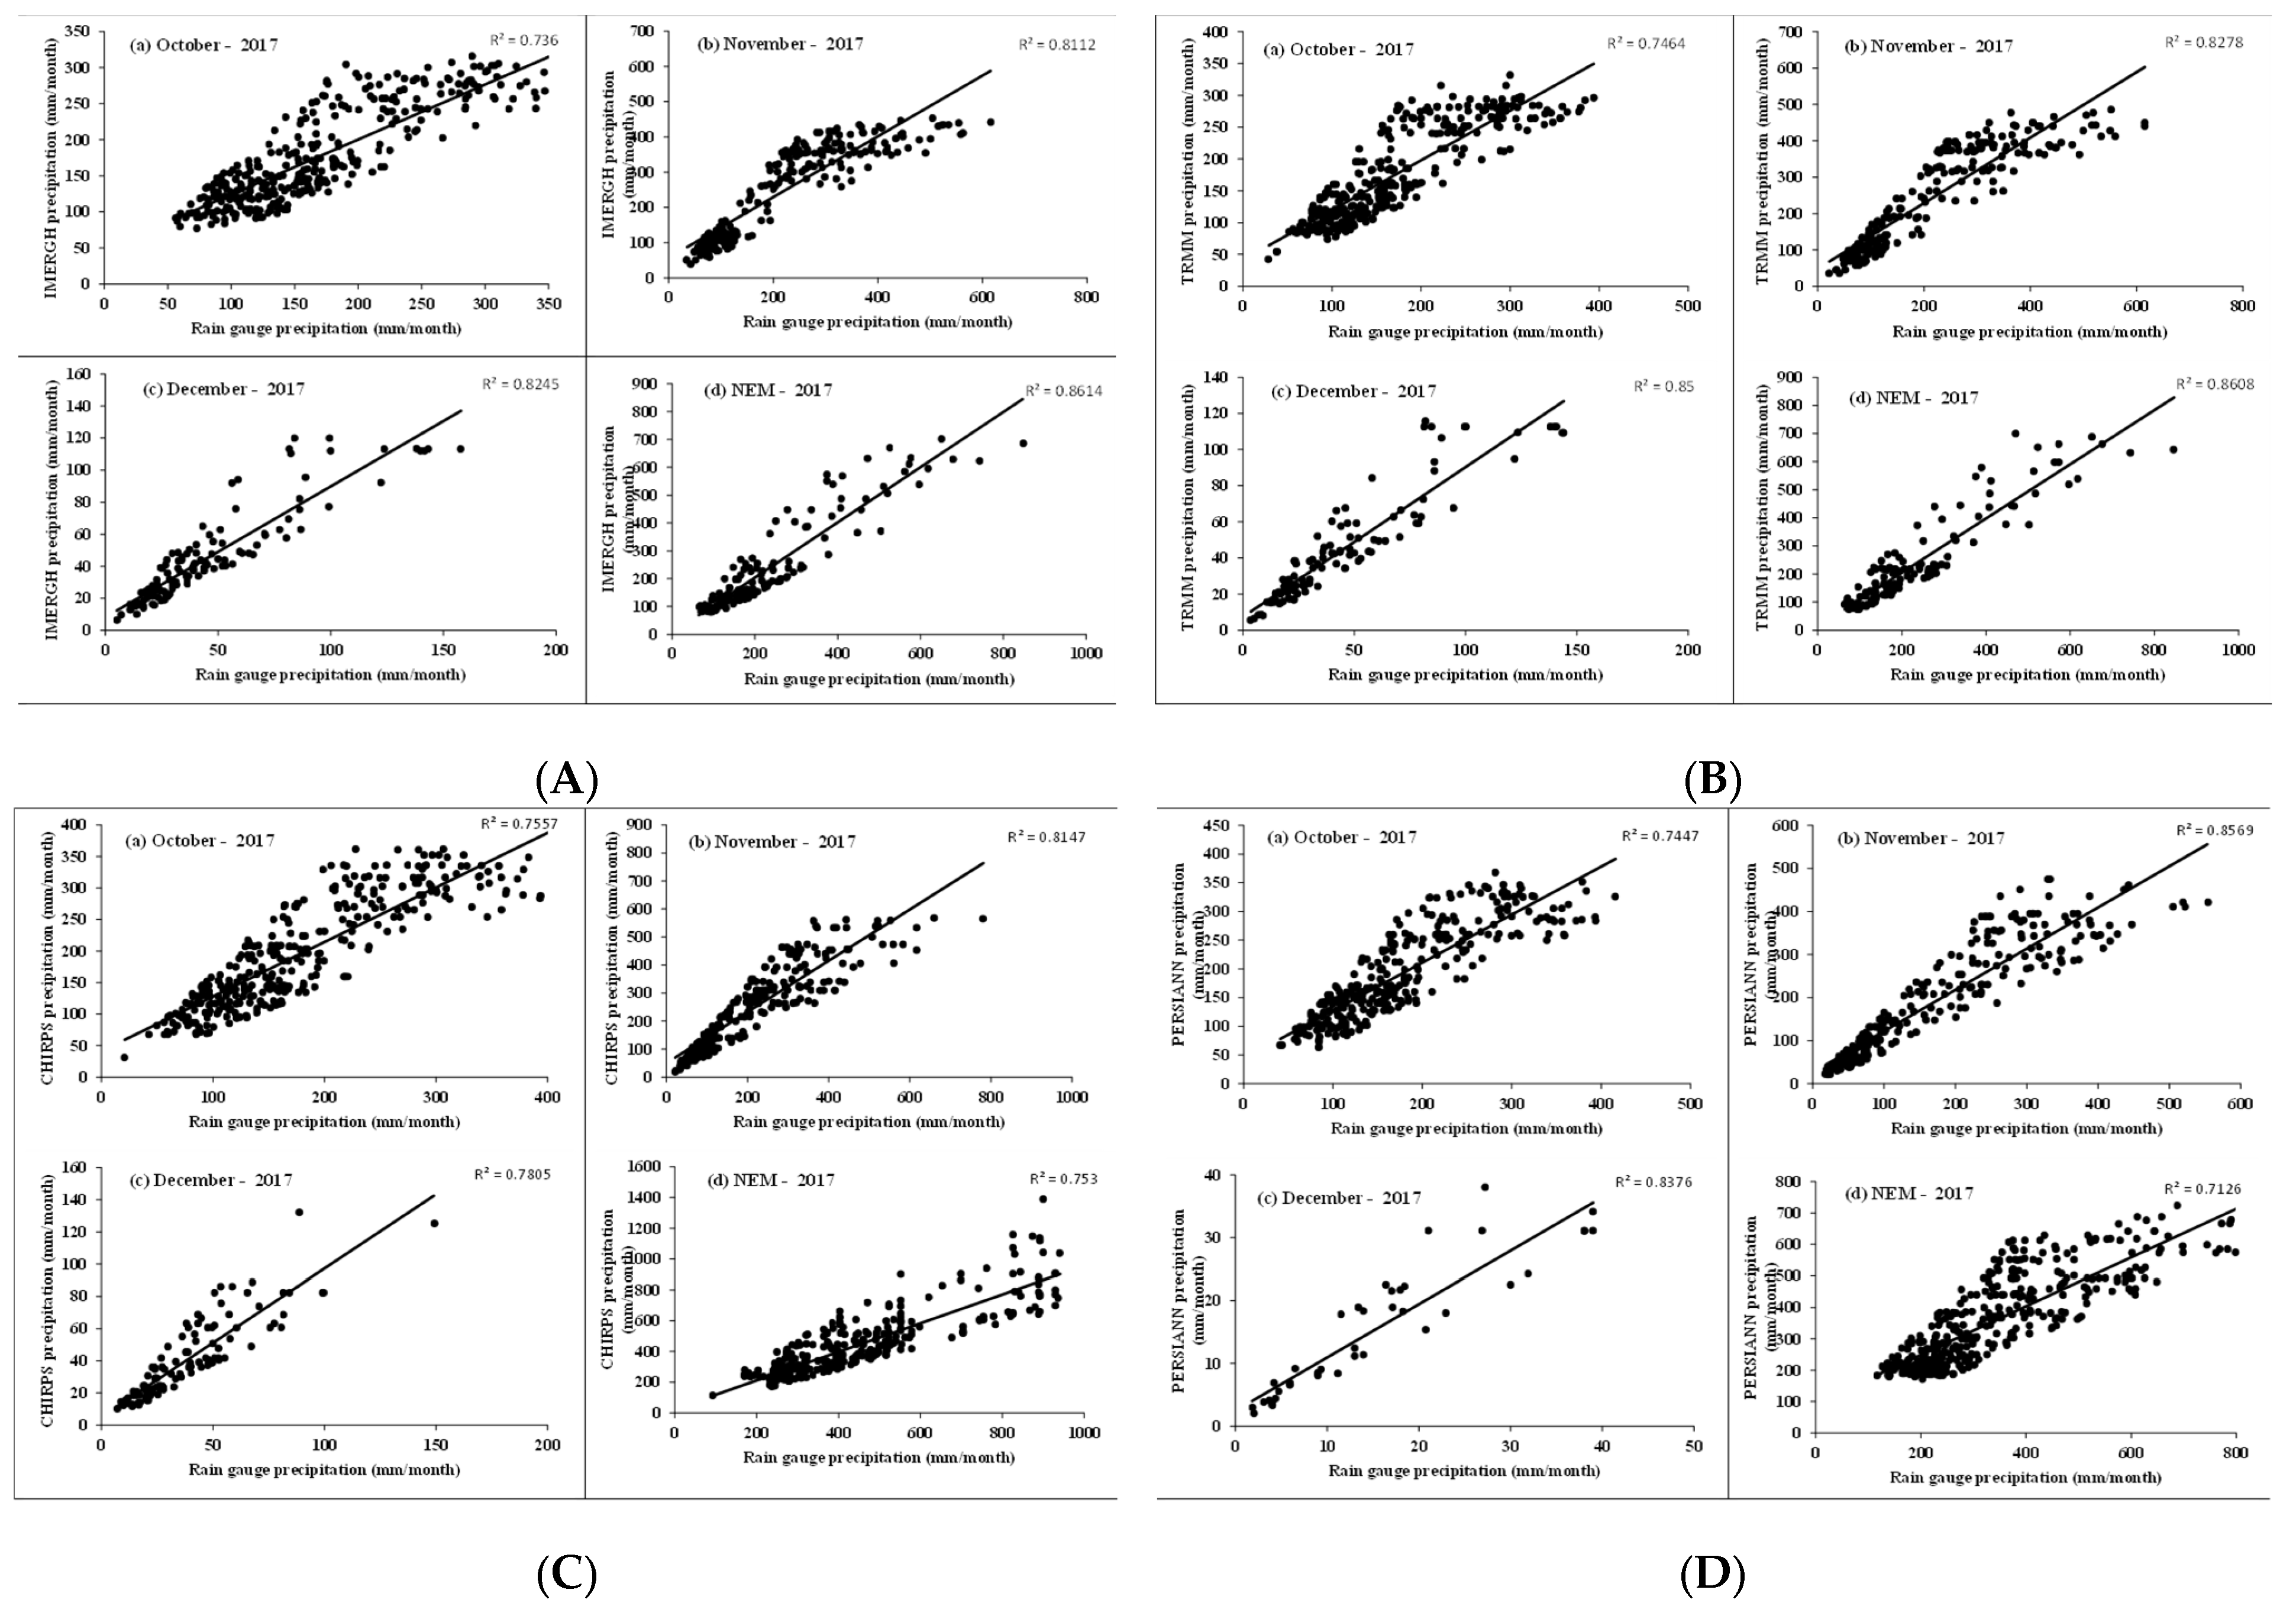
- High-resolution precipitation products, IMERGH and TRMM, were on par with the minimum range predictions compared to AWS data. In contrast, the other two products (i.e.,) PERSIANN and CHIRPS overestimated the rainfall. On the other hand, the CHIRPS product was found to estimate on par with AWS data in the maximum range, while the other three products were underestimated. Therefore, IMERGH and TRMM precipitation products could be used during low rainfall conditions and CHIRPS in high rainfall conditions.
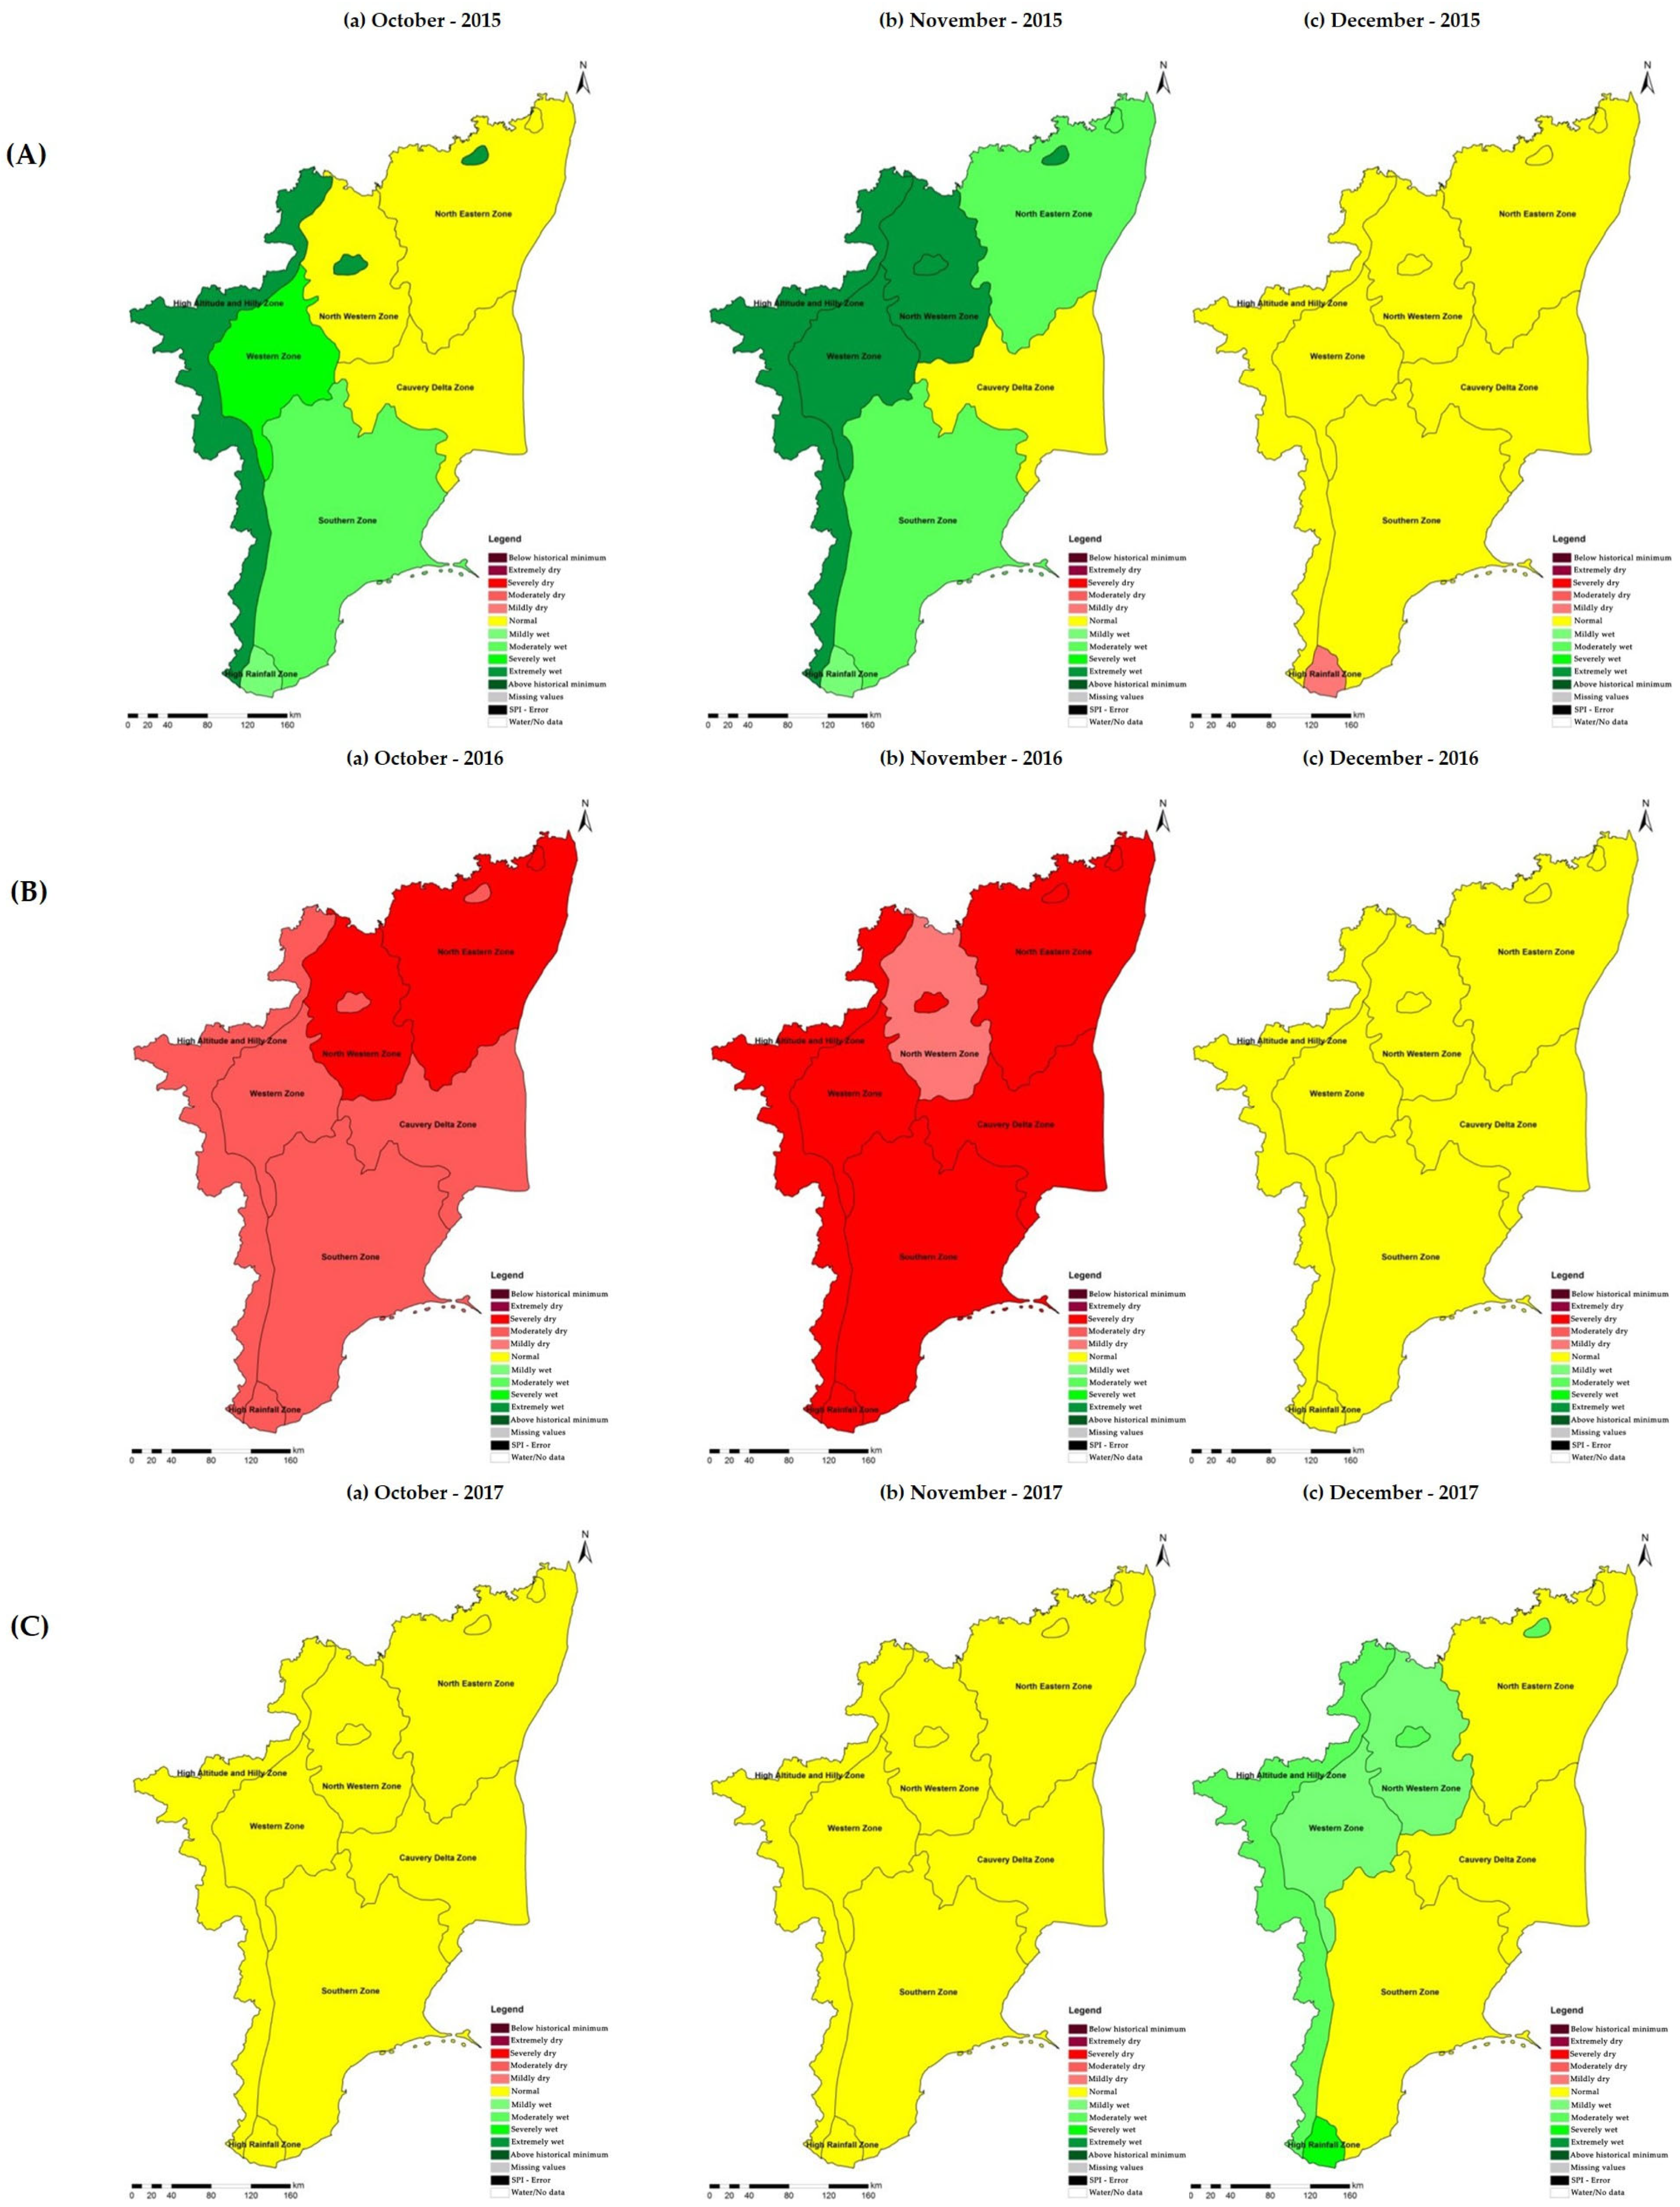
- The rainfall deviation during the northeast monsoon for the years 2016 and 2017 was mostly classified under deficient and large deficient categories showing moderate to severe drought conditions, with twelve, three, and fifteen districts under moderate drought, and twenty, twenty-nine, and five districts under severe drought condition during October, November, and December 2016. During 2017, seventeen to twenty districts were under moderate drought conditions, and eight were under severe drought conditions.
- It is concluded that 2016 and 2017 were drought years in the northeast monsoon, and 2015 was a non-drought year in Tamil Nadu, India.
7. Future Scope
Author Contributions
Funding
Acknowledgments
Conflicts of Interest
References
- Landrum, L.; Holland, M.M. Extremes become routine in an emerging new Arctic. Nat. Clim. Change 2020, 10, 1108–1115. [Google Scholar] [CrossRef]
- Musolino, D.A.; Massarutto, A.; de Carli, A. Does drought always cause economic losses in agriculture? An empirical investigation on the distributive effects of drought events in some areas of Southern Europe. Sci. Total Environ. 2018, 633, 1560–1570. [Google Scholar] [CrossRef] [PubMed]
- Wang, H.; Yang, X.; Chen, Q.; Su, J.-Q.; Mulla, S.I.; Rashid, A.; Hu, A.; Yu, C.-P. Response of prokaryotic communities to extreme precipitation events in an urban coastal lagoon: A case study of Yundang lagoon, China. Sci. Total Environ. 2020, 706, 135937. [Google Scholar] [CrossRef] [PubMed]
- Zhong, R.; Chen, X.; Lai, C.; Wang, Z.; Lian, Y.; Yu, H.; Wu, X. Drought monitoring utility of satellite-based precipitation products across mainland China. J. Hydrol. 2019, 568, 343–359. [Google Scholar] [CrossRef]
- Dahri, Z.H.; Ludwig, F.; Moors, E.; Ahmad, S.; Ahmad, B.; Ahmad, S.; Riaz, M.; Kabat, P. Climate change and hydrological regime of the high-altitude Indus basin under extreme climate scenarios. Sci. Total Environ. 2021, 768, 144467. [Google Scholar] [CrossRef]
- Dai, A. Increasing drought under global warming in observations and models. Nat. Clim. Change 2013, 3, 52–58. [Google Scholar] [CrossRef]
- Kulkarni, A.; Gadgil, S.; Patwardhan, S. Monsoon variability, the 2015 Marathwada drought and rainfed agriculture. Curr. Sci. 2016, 111, 1182–1193. [Google Scholar] [CrossRef]
- Khosravi, H.; Haydari, E.; Shekoohizadegan, S.; Zareie, S. Assessment the effect of drought on vegetation in desert area using landsat data. Egypt. J. Remote Sens. Space Sci. 2017, 20, S3–S12. [Google Scholar] [CrossRef] [Green Version]
- Jayasree, V.; Venkatesh, B. Analysis of rainfall in assessing the drought in semi-arid region of Karnataka State, India. Water Resour. Manag. 2015, 29, 5613–5630. [Google Scholar] [CrossRef]
- Government of Tamil Nadu (GoT). Tamil Nadu Government Gazette. Published 18 January 2017. 2017. Available online: http://www.stationeryprinting.tn.gov.in/extraordinary/extraord_list2017.php (accessed on 17 December 2017).
- Prakash, S.; Mitra, A.K.; Pai, D.; AghaKouchak, A. From TRMM to GPM: How well can heavy rainfall be detected from space? Adv. Water Resour. 2016, 88, 1–7. [Google Scholar] [CrossRef]
- Sun, Q.; Miao, C.; Duan, Q.; Ashouri, H.; Sorooshian, S.; Hsu, K.L. A review of global precipitation data sets: Data sources, estimation, and intercomparisons. Rev. Geophys. 2018, 56, 79–107. [Google Scholar] [CrossRef] [Green Version]
- Fang, J.; Yang, W.; Luan, Y.; Du, J.; Lin, A.; Zhao, L. Evaluation of the TRMM 3B42 and GPM IMERG products for extreme precipitation analysis over China. Atmos. Res. 2019, 223, 24–38. [Google Scholar] [CrossRef]
- Shen, H.; Tabios, G., III. Modeling of Precipitation-Based Drought Characteristics over California; Centers for Water and Wildland Resources: Davis, CA, USA, 1996.
- Tian, Y.; Xu, Y.-P.; Wang, G. Agricultural drought prediction using climate indices based on Support Vector Regression in Xiangjiang River basin. Sci. Total Environ. 2018, 622, 710–720. [Google Scholar] [CrossRef]
- Sapiano, M.; Arkin, P. An intercomparison and validation of high-resolution satellite precipitation estimates with 3-hourly gauge data. J. Hydrometeorol. 2009, 10, 149–166. [Google Scholar] [CrossRef]
- Tobin, K.J.; Bennett, M.E. Adjusting satellite precipitation data to facilitate hydrologic modeling. J. Hydrometeorol. 2010, 11, 966–978. [Google Scholar] [CrossRef]
- Yin, J.; Guo, S.; Gu, L.; Zeng, Z.; Liu, D.; Chen, J.; Shen, Y.; Xu, C.-Y. Blending multi-satellite, atmospheric reanalysis and gauge precipitation products to facilitate hydrological modelling. J. Hydrol. 2021, 593, 125878. [Google Scholar] [CrossRef]
- Yong, B.; Hong, Y.; Ren, L.L.; Gourley, J.J.; Huffman, G.J.; Chen, X.; Wang, W.; Khan, S.I. Assessment of evolving TRMM-based multisatellite real-time precipitation estimation methods and their impacts on hydrologic prediction in a high latitude basin. J. Geophys. Res. Atmos. 2012, 117, D9. [Google Scholar] [CrossRef] [Green Version]
- Li, L.; Ngongondo, C.S.; Xu, C.-Y.; Gong, L. Comparison of the global TRMM and WFD precipitation datasets in driving a large-scale hydrological model in southern Africa. Hydrol. Res. 2013, 44, 770–788. [Google Scholar] [CrossRef]
- Liang, Z.; Chen, S.; Yang, Y.; Zhao, R.; Shi, Z.; Rossel, R.A.V. National digital soil map of organic matter in topsoil and its associated uncertainty in 1980’s China. Geoderma 2019, 335, 47–56. [Google Scholar] [CrossRef]
- Zhou, Y.; Biswas, A.; Ma, Z.; Lu, Y.; Chen, Q.; Shi, Z. Revealing the scale-specific controls of soil organic matter at large scale in Northeast and North China Plain. Geoderma 2016, 271, 71–79. [Google Scholar] [CrossRef]
- Belabid, N.; Zhao, F.; Brocca, L.; Huang, Y.; Tan, Y. Near-real-time flood forecasting based on satellite precipitation products. Remote Sens. 2019, 11, 252. [Google Scholar] [CrossRef] [Green Version]
- Quintero, F.; Krajewski, W.F.; Mantilla, R.; Small, S.; Seo, B.-C. A spatial–dynamical framework for evaluation of satellite rainfall products for flood prediction. J. Hydrometeorol. 2016, 17, 2137–2154. [Google Scholar] [CrossRef]
- Huffman, G.J.; Bolvin, D.T.; Braithwaite, D.; Hsu, K.; Joyce, R.; Xie, P.; Yoo, S.-H. NASA Global Precipitation Measurement (GPM) Integrated Multi-Satellite Retrievals for GPM (IMERG); Algorithm Theoretical Basis Document (ATBD) Version 4; National Aeronautics and Space Administration: Washington, DC, USA, 2015.
- Funk, C.C.; Peterson, P.J.; Landsfeld, M.F.; Pedreros, D.H.; Verdin, J.P.; Rowland, J.D.; Romero, B.E.; Husak, G.J.; Michaelsen, J.C.; Verdin, A.P. A quasi-global precipitation time series for drought monitoring. US Geol. Surv. Data Ser. 2014, 832, 1–12. [Google Scholar]
- Funk, C.; Peterson, P.; Landsfeld, M.; Pedreros, D.; Verdin, J.; Shukla, S.; Husak, G.; Rowland, J.; Harrison, L.; Hoell, A. The climate hazards infrared precipitation with stations—A new environmental record for monitoring extremes. Sci. Data 2015, 2, 1–21. [Google Scholar] [CrossRef] [Green Version]
- Huffman, G.J.; Bolvin, D.T.; Nelkin, E.J.; Wolff, D.B.; Adler, R.F.; Gu, G.; Hong, Y.; Bowman, K.P.; Stocker, E.F. The TRMM multisatellite precipitation analysis (TMPA): Quasi-global, multiyear, combined-sensor precipitation estimates at fine scales. J. Hydrometeorol. 2007, 8, 38–55. [Google Scholar] [CrossRef]
- Joyce, R.J.; Janowiak, J.E.; Arkin, P.A.; Xie, P. CMORPH: A method that produces global precipitation estimates from passive microwave and infrared data at high spatial and temporal resolution. J. Hydrometeorol. 2004, 5, 487–503. [Google Scholar] [CrossRef]
- Miller, S.; Arkin, P.; Joyce, R. A combined microwave/infrared rain rate algorithm. Int. J. Remote Sens. 2001, 22, 3285–3307. [Google Scholar] [CrossRef]
- Hsu, K.-L.; Gao, X.; Sorooshian, S.; Gupta, H.V. Precipitation estimation from remotely sensed information using artificial neural networks. J. Appl. Meteorol. 1997, 36, 1176–1190. [Google Scholar] [CrossRef]
- Sharifi, E.; Steinacker, R.; Saghafian, B. Assessment of GPM-IMERG and other precipitation products against gauge data under different topographic and climatic conditions in Iran: Preliminary results. Remote Sens. 2016, 8, 135. [Google Scholar] [CrossRef] [Green Version]
- Brasil Neto, R.M.; Santos, C.A.G.; Silva, J.F.C.B.d.C.; da Silva, R.M.; Dos Santos, C.A.C.; Mishra, M. Evaluation of the TRMM product for monitoring drought over Paraíba State, northeastern Brazil: A trend analysis. Sci. Rep. 2021, 11, 1–18. [Google Scholar] [CrossRef]
- Yu, C.; Hu, D.; Liu, M.; Wang, S.; Di, Y. Spatio-temporal accuracy evaluation of three high-resolution satellite precipitation products in China area. Atmos. Res. 2020, 241, 104952. [Google Scholar] [CrossRef]
- Sharma, S.; Chen, Y.; Zhou, X.; Yang, K.; Li, X.; Niu, X.; Hu, X.; Khadka, N. Evaluation of GPM-Era satellite precipitation products on the southern slopes of the Central Himalayas against rain gauge data. Remote Sens. 2020, 12, 1836. [Google Scholar] [CrossRef]
- Guo, R.; Liu, Y. Evaluation of satellite precipitation products with rain gauge data at different scales: Implications for hydrological applications. Water 2016, 8, 281. [Google Scholar] [CrossRef]
- Gao, Y.; Liu, M. Evaluation of high-resolution satellite precipitation products using rain gauge observations over the Tibetan Plateau. Hydrol. Earth Syst. Sci. 2013, 17, 837–849. [Google Scholar] [CrossRef] [Green Version]
- Liu, C.-Y.; Aryastana, P.; Liu, G.-R.; Huang, W.-R. Assessment of satellite precipitation product estimates over Bali Island. Atmos. Res. 2020, 244, 105032. [Google Scholar] [CrossRef]
- Derin, Y.; Anagnostou, E.; Berne, A.; Borga, M.; Boudevillain, B.; Buytaert, W.; Chang, C.-H.; Delrieu, G.; Hong, Y.; Hsu, Y.C. Multiregional satellite precipitation products evaluation over complex terrain. J. Hydrometeorol. 2016, 17, 1817–1836. [Google Scholar] [CrossRef]
- Bai, L.; Shi, C.; Li, L.; Yang, Y.; Wu, J. Accuracy of CHIRPS satellite-rainfall products over mainland China. Remote Sens. 2018, 10, 362. [Google Scholar] [CrossRef] [Green Version]
- Zhu, Q.; Luo, Y.; Zhou, D.; Xu, Y.-P.; Wang, G.; Gao, H. Drought monitoring utility using satellite-based precipitation products over the Xiang River Basin in China. Remote Sens. 2019, 11, 1483. [Google Scholar] [CrossRef] [Green Version]
- Prakash, S.; Gairola, R. Validation of TRMM-3B42 precipitation product over the tropical Indian Ocean using rain gauge data from the RAMA buoy array. Theor. Appl. Climatol. 2014, 115, 451–460. [Google Scholar] [CrossRef]
- AghaKouchak, A. A baseline probabilistic drought forecasting framework using standardized soil moisture index: Application to the 2012 United States drought. Hydrol. Earth Syst. Sci. 2014, 18, 2485–2492. [Google Scholar] [CrossRef] [Green Version]
- Vicente-Serrano, S.M.; Beguería, S.; López-Moreno, J.I. A multiscalar drought index sensitive to global warming: The standardized precipitation evapotranspiration index. J. Clim. 2010, 23, 1696–1718. [Google Scholar] [CrossRef] [Green Version]
- Tadesse, T.; Brown, J.F.; Hayes, M.J. A new approach for predicting drought-related vegetation stress: Integrating satellite, climate, and biophysical data over the US central plains. ISPRS J. Photogramm. Remote Sens. 2005, 59, 244–253. [Google Scholar] [CrossRef]
- McKee, T.B.; Doesken, N.J.; Kleist, J. The relationship of drought frequency and duration to time scales. In Proceedings of the 8th Conference on Applied Climatology, Anaheim, CA, USA, 17–22 January 1993; pp. 179–183. [Google Scholar]
- Hayes, M.; Svoboda, M.; Wall, N.; Widhalm, M. The Lincoln declaration on drought indices: Universal meteorological drought index recommended. Bull. Am. Meteorol. Soc. 2011, 92, 485–488. [Google Scholar] [CrossRef] [Green Version]
- Damberg, L.; AghaKouchak, A. Global trends and patterns of drought from space. Theor. Appl. Climatol. 2014, 117, 441–448. [Google Scholar] [CrossRef]
- Alizadeh, M.R.; Nikoo, M.R. A fusion-based methodology for meteorological drought estimation using remote sensing data. Remote Sens. Environ. 2018, 211, 229–247. [Google Scholar] [CrossRef]
- Chen, S.; Li, Q.; Zhong, W.; Wang, R.; Chen, D.; Pan, S. Improved monitoring and assessment of meteorological drought based on multi-source fused precipitation data. Int. J. Environ. Res. Public Health 2022, 19, 1542. [Google Scholar] [CrossRef]
- Lemma, E.; Upadhyaya, S.; Ramsankaran, R. Meteorological drought monitoring across the main river basins of Ethiopia using satellite rainfall product. Environ. Syst. Res. 2022, 11, 1–15. [Google Scholar] [CrossRef]
- Palagiri, H.; Pal, M. Agricultural Drought Monitoring using Satellite based Surface Soil Moisture Data. In Proceedings of the EGU General Assembly 2023, Vienna, Austria, 24–28 April 2023. EGU23-621. [Google Scholar] [CrossRef]
- Galkate, R.; Jain, S.; Jaiswal, R.; Pandey, R.; Lohani, A.; Yadav, S.; Yadava, R.N. Application of GIS and Remote Sensing Tools in Assessment of Drought Using Satellite and Ground-Based Data. In Application of Remote Sensing and GIS in Natural Resources and Built Infrastructure Management; Springer: Berlin/Heidelberg, Germany, 2023; pp. 105–121. [Google Scholar]
- Hakam, O.; Baali, A.; Azennoud, K.; Lyazidi, A.; Bourchachen, M. Assessments of Drought Effects on Plant Production Using Satellite Remote Sensing Technology, GIS and Observed Climate Data in Northwest Morocco, Case of the Lower Sebou Basin. Int. J. Plant Prod. 2023, 1–16. [Google Scholar] [CrossRef]
- Lakshmi, S.V.; Ramalakshmi, M.; Rakshith, R.K.; Christobel, M.J.; Kumar, P.P.; Priyadharshini, B.; Kumar, P.R. An integration of geospatial technology and standard precipitation index (SPI) for drought vulnerability assessment for a part of Namakkal district, South India. Mater. Today: Proc. 2020, 33, 1206–1211. [Google Scholar]
- Kumar, K.A.; Reddy, G.O.; Masilamani, P.; Turkar, S.Y.; Sandeep, P. Integrated drought monitoring index: A tool to monitor agricultural drought by using time-series datasets of space-based earth observation satellites. Adv. Space Res. 2021, 67, 298–315. [Google Scholar] [CrossRef]
- Kumaraperumal, R.; Pazhanivelan, S.; Ragunath, K.P.; Kannan, B.; Prajesh, P.J.; Mugilan, G.R. Agricultural drought monitoring in Tamil Nadu in India using Satellite-based multi vegetation indices. J. Appl. Nat. Sci. 2021, 13, 414–423. [Google Scholar] [CrossRef]
- Thilagaraj, P.; Masilamani, P.; Venkatesh, R.; Killivalavan, J. Google Earth Engine Based Agricultural Drought Monitoring in Kodavanar Watershed, Part of Amaravathi Basin, Tamil Nadu, India. Int. Arch. Photogramm. Remote Sens. Spat. Inf. Sci. 2021, 43, 43–49. [Google Scholar] [CrossRef]
- Hou, A.Y.; Kakar, R.K.; Neeck, S.; Azarbarzin, A.A.; Kummerow, C.D.; Kojima, M.; Oki, R.; Nakamura, K.; Iguchi, T. The global precipitation measurement mission. Bull. Am. Meteorol. Soc. 2014, 95, 701–722. [Google Scholar] [CrossRef]
- Huffman, G.J.; Adler, R.F.; Bolvin, D.T.; Nelkin, E.J. The TRMM multi-satellite precipitation analysis (TMPA). In Satellite Rainfall Applications for Surface Hydrology; Springer: Berlin/Heidelberg, Germany, 2010; pp. 3–22. [Google Scholar]
- Huffman, G.J.; Adler, R.F.; Rudolf, B.; Schneider, U.; Keehn, P.R. Global precipitation estimates based on a technique for combining satellite-based estimates, rain gauge analysis, and NWP model precipitation information. J. Clim. 1995, 8, 1284–1295. [Google Scholar] [CrossRef]
- Huffman, G.J.; Adler, R.F.; Arkin, P.; Chang, A.; Ferraro, R.; Gruber, A.; Janowiak, J.; McNab, A.; Rudolf, B.; Schneider, U. The global precipitation climatology project (GPCP) combined precipitation dataset. Bull. Am. Meteorol. Soc. 1997, 78, 5–20. [Google Scholar] [CrossRef]
- Seiler, R.; Hayes, M.; Bressan, L. Using the standardized precipitation index for flood risk monitoring. Int. J. Climatol. A J. R. Meteorol. Soc. 2002, 22, 1365–1376. [Google Scholar] [CrossRef]
- Lovett, G.; Burns, D.; Driscoll, C.; Jenkins, J.; Mitchell, M.; Rustad, L.; Shanley, J.; Likens, G.; Haeuber, R. Who needs environmental monitoring? Front. Ecol. Environ. 2007, 5, 253–260. [Google Scholar] [CrossRef]
- Katsanos, D.; Retalis, A.; Michaelides, S. Validation of a high-resolution precipitation database (CHIRPS) over Cyprus for a 30-year period. Atmos. Res. 2016, 169, 459–464. [Google Scholar] [CrossRef]
- Sorooshian, S.; Hsu, K.-L.; Gao, X.; Gupta, H.V.; Imam, B.; Braithwaite, D. Evaluation of PERSIANN system satellite-based estimates of tropical rainfall. Bull. Am. Meteorol. Soc. 2000, 81, 2035–2046. [Google Scholar] [CrossRef]
- Yang, T.; Zhang, W.; Zhou, T.; Wu, W.; Liu, T.; Sun, C. Plant phenomics & precision agriculture simulation of winter wheat growth by the assimilation of unmanned aerial vehicle imagery into the WOFOST model. PLoS ONE 2021, 16, e0246874. [Google Scholar]
- Araujo, J.; Born, D.G. Calculating percentage agreement correctly but writing its formula incorrectly. Behav. Anal. 1985, 8, 207. [Google Scholar] [CrossRef] [PubMed] [Green Version]
- IMD. Climate Diagnostic Bulletin of India, India Meteorological Department. June, July, August 1971; Rep. No. 88, 89 and 90; Nat. Climate Centre, IMD: Pune, India, 1971. [Google Scholar]
- Bordi, I.; Frigio, S.; Parenti, P.; Speranza, A.; Sutera, A. The analysis of the Standardized Precipitation Index in the Mediterranean area: Large-scale patterns. Ann. Geophys. 2001, 44. [Google Scholar] [CrossRef]
- Karinki, R.K.; Sahoo, S.N. Use of meteorological data for identification of drought. ISH J. Hydraul. Eng. 2021, 27, 427–433. [Google Scholar] [CrossRef]
- Prakash, S.; Mitra, A.K.; AghaKouchak, A.; Liu, Z.; Norouzi, H.; Pai, D. A preliminary assessment of GPM-based multi-satellite precipitation estimates over a monsoon dominated region. J. Hydrol. 2018, 556, 865–876. [Google Scholar] [CrossRef] [Green Version]
- Kumar, T.V.L.; Barbosa, H.A.; Thakur, M.K.; Paredes-Trejo, F. Validation of satellite (TMPA and IMERG) rainfall products with the IMD gridded data sets over monsoon core region of India. In Satellite Information Classification and Interpretation; IntechOpen: London, UK, 2019. [Google Scholar]
- Ghozat, A.; Sharafati, A.; Hosseini, S.A. Long-term spatiotemporal evaluation of CHIRPS satellite precipitation product over different climatic regions of Iran. Theor. Appl. Climatol. 2021, 143, 211–225. [Google Scholar] [CrossRef]
- Suliman, A.H.A.; Awchi, T.A.; Al-Mola, M.; Shahid, S. Evaluation of remotely sensed precipitation sources for drought assessment in Semi-Arid Iraq. Atmos. Res. 2020, 242, 105007. [Google Scholar] [CrossRef]
- Awchi, T.; Suliman, A. Spatiotemporal assessment of meteorological drought using satellite-based precipitation data over Iraq. In Proceedings of the IOP Conference Series: Earth and Environmental Science, Surakarta, Indonesia, 24–25 August 2021; p. 012052. [Google Scholar]
- Gao, F.; Zhang, Y.; Ren, X.; Yao, Y.; Hao, Z.; Cai, W. Evaluation of CHIRPS and its application for drought monitoring over the Haihe River Basin, China. Nat. Hazards 2018, 92, 155–172. [Google Scholar] [CrossRef]
- Shalishe, A.; Bhowmick, A.; Elias, K. Meteorological Drought Monitoring Based on Satellite CHIRPS Product over Gamo Zone, Southern Ethiopia. Adv. Meteorol. 2022, 2022, 9323263. [Google Scholar] [CrossRef]
- Pedreros, D.H.; Rojas, A.; Funk, C.; Peterson, P.; Landsfeld, M.F.; Husak, G.J. The Use of CHIRPS to Analyze Historical Rainfall in Colombia. In Proceedings of the AGU Fall Meeting Abstracts, San Francisco, CA, USA, 15–19 December 2014; GC33C-0534. American Geophysical Union: San Francisco, CA, USA, 2014. [Google Scholar]
- Hessels, T.M. Comparison and Validation of Several Open Access Remotely Sensed Rainfall Products for the Nile Basin. Master’s Thesis, TU Delft Library, Delft, The Netherlands, 2015. [Google Scholar]
- Ainembabazi, S. Comparison of Standardized Precipitation Index (SPI) and Vegetation Health Index (VHI) in Drought Monitoring in Isingiro District. Ph.D. Thesis, Makerere University, Kampala, Uganda, 2022. [Google Scholar]
- Alahacoon, N.; Edirisinghe, M.; Ranagalage, M. Satellite-based meteorological and agricultural drought monitoring for agricultural sustainability in Sri Lanka. Sustainability 2021, 13, 3427. [Google Scholar] [CrossRef]
- Zargar, A.; Sadiq, R.; Naser, B.; Khan, F.I. A review of drought indices. Environ. Rev. 2011, 19, 333–349. [Google Scholar] [CrossRef] [Green Version]
- Pandit, D.V. Assessment of Meteorological Drought for Semi-Arid Region of Maharashtra. Int. J. Agric. Environ. Biotechnol. 2018, 11, 689–695. [Google Scholar] [CrossRef]


| Data Set | Developing Agency | Coverage | Period | Spatial Resolution | Temporal Resolution |
|---|---|---|---|---|---|
| CHIRPS Version 2.0 | United States Geological Survey (USGS) and the Climate Hazards Group at the University of California | Quasi-global coverage of 50° S–50° N, 180° E–180° W | 1981–present | 0.25° (~27 km) | Daily |
| TRMM 3B42 V. 7 | National Aeronautics and Space Administration (NASA) and Japan Aerospace Exploration Agency | Global 50° N–S | 1998–present | 0.25° (~27 km) | Daily |
| PERSIANN | Center for Hydrometeorology and Remote Sensing (CHRS) at the University of California, Irvine | Global 60° N–S | 2000–present | 0.25° (~27 km) | Daily |
| GPM 3IMERGF Version 05 | National Aeronautics and Space Administration (NASA) and Japan Aerospace Exploration Agency | Quasi global coverage | 2014–present | 0.01° (~10 km) | Daily |
| Metric | Equation | Interpretation | Reference |
|---|---|---|---|
| Pearson Correlation Coefficient | The value ranges between −1 to 1, in which one indicates the perfect score. | [50] | |
| Root Mean Square Error (RMSE) | A lower RMSE value means greater central tendencies and small extreme errors. The zero RMSE value is the perfect score. | [50] | |
| Normalized Root-Mean-Square Error (NRMSE) | NRMSE = 100 × (RMSE/Oi) | Lower NRMSE values indicate less residual variance for a model. | [67] |
| Agreement (%) | Agreement (%) = 100 × (1 − (RMSE/Oi)) | Closer values to 100% indicate strong agreement, and values closer to 0% indicate the least agreement. | [68] |
| SPI Value | Category | Probability (%) |
|---|---|---|
| >2.00 | Extremely wet | 2.3 |
| 1.50–1.99 | Severely wet | 4.4 |
| 1.00–1.49 | Moderately wet | 9.2 |
| −0.99 to 0.99 | Near normal | 68.2 |
| −1.00 to −1.49 | Moderately dry | 9.2 |
| −1.50 to −1.99 | Severe dry | 4.4 |
| <−2.0 | Extremely dry | 2.3 |
| Percentage Rainfall Deviation | Rainfall Deviation Category | Intensity of Drought |
|---|---|---|
| 60 and more | Large Excess | No drought |
| 20 to 59 | Excess | No drought |
| +19 to −19 | Normal | Mild drought |
| −59 to −20 | Deficient | Moderate drought |
| −99 to −60 | Large Deficient | Severe drought |
| −100 | No Rain | Extreme drought |
| Northeast Monsoon 2015 | ||||
|---|---|---|---|---|
| Index | IMERGH | TRMM | CHIRPS | PERSIANN |
| CC | 0.853 | 0.835 | 0.781 | 0.77 |
| RMSE | 58.49 | 96.57 | 127.24 | 134.73 |
| NRMSE | 10.24 | 17.46 | 18.05 | 18.88 |
| Agreement | 89.76 | 82.54 | 81.95 | 81.12 |
| Northeast Monsoon 2016 | ||||
| Index | IMERGH | TRMM | CHIRPS | PERSIANN |
| CC | 0.844 | 0.854 | 0.449 | 0.525 |
| RMSE | 19.11 | 17.47 | 43.13 | 29.83 |
| NRMSE | 19.01 | 17.75 | 20.53 | 19.42 |
| Agreement | 80.99 | 82.25 | 79.47 | 80.58 |
| Northeast Monsoon 2017 | ||||
| Index | IMERGH | TRMM | CHIRPS | PERSIANN |
| CC | 0.861 | 0.86 | 0.753 | 0.712 |
| RMSE | 45.09 | 44.52 | 81.29 | 69.51 |
| NRMSE | 19.05 | 19.32 | 18.63 | 19.07 |
| Agreement | 80.95 | 80.68 | 81.37 | 80.93 |
| Northeast Monsoon 2015 | Northeast Monsoon 2016 | Northeast Monsoon 2017 | ||||||||||
|---|---|---|---|---|---|---|---|---|---|---|---|---|
| Cauvery Delta Zone (CDZ) | ||||||||||||
| Index | IMERGH | TRMM | CHIRPS | PERSIANN | IMERGH | TRMM | CHIRPS | PERSIANN | IMERGH | TRMM | CHIRPS | PERSIANN |
| CC | 0.99 | 0.71 | 0.92 | 0.69 | 0.87 | 0.86 | 0.83 | 0.25 | 0.82 | 0.82 | 0.95 | 0.71 |
| RMSE | 36.85 | 78.59 | 77.05 | 93.33 | 18.04 | 17.19 | 28.05 | 33.38 | 49.18 | 46.02 | 55.04 | 85.04 |
| NRMSE | 23.26 | 16.62 | 25.19 | 10.57 | 17.68 | 14.00 | 10.49 | 18.15 | 19.73 | 21.04 | 10.44 | 18.80 |
| Agreement | 76.74 | 83.38 | 74.81 | 89.43 | 82.32 | 86.00 | 89.51 | 81.85 | 80.27 | 78.96 | 89.56 | 81.20 |
| High Altitude and Hilly Zone (HAHZ) | ||||||||||||
| CC | 0.68 | 0.67 | 0.89 | 0.79 | 0.72 | 0.73 | 0.75 | 0.56 | 0.92 | 0.92 | 0.89 | 0.70 |
| RMSE | 129.43 | 136.24 | 53.93 | 75.60 | 21.98 | 20.84 | 21.95 | 22.63 | 38.48 | 37.94 | 34.71 | 55.52 |
| NRMSE | 25.52 | 28.33 | 9.63 | 16.79 | 20.04 | 18.80 | 11.16 | 18.82 | 16.03 | 18.10 | 8.20 | 19.40 |
| Agreement | 74.48 | 71.67 | 90.37 | 83.21 | 79.96 | 81.20 | 88.84 | 81.18 | 83.97 | 81.90 | 91.80 | 80.60 |
| High Rainfall Zone (HRZ) | ||||||||||||
| CC | 0.98 | 0.96 | 0.22 | 0.10 | 0.60 | 0.70 | 0.81 | 0.45 | 0.34 | 0.34 | 0.71 | 0.59 |
| RMSE | 21.16 | 43.61 | 59.15 | 139.17 | 27.62 | 26.43 | 25.72 | 38.62 | 67.75 | 64.76 | 46.13 | 124.01 |
| NRMSE | 16.39 | 23.95 | 8.37 | 24.99 | 22.75 | 20.89 | 10.37 | 20.80 | 33.55 | 31.01 | 9.34 | 23.15 |
| Agreement | 83.61 | 76.05 | 91.63 | 75.01 | 77.25 | 79.11 | 89.63 | 79.20 | 66.45 | 68.99 | 90.66 | 76.85 |
| Northeastern Zone (NEZ) | ||||||||||||
| CC | 0.79 | 0.78 | 0.83 | 0.52 | 0.89 | 0.93 | 0.68 | 0.53 | 0.83 | 0.80 | 0.81 | 0.47 |
| RMSE | 149.40 | 146.96 | 80.78 | 222.17 | 15.07 | 11.44 | 19.63 | 31.18 | 62.79 | 64.59 | 72.79 | 104.69 |
| NRMSE | 19.43 | 18.53 | 8.20 | 19.45 | 18.96 | 17.02 | 10.58 | 22.63 | 18.29 | 17.67 | 11.06 | 21.87 |
| Agreement | 80.57 | 81.47 | 85.80 | 80.55 | 81.04 | 82.98 | 89.42 | 77.37 | 81.71 | 82.33 | 88.94 | 78.13 |
| North-western Zone (NWZ) | ||||||||||||
| CC | 0.99 | 0.99 | 0.80 | 0.44 | 0.94 | 0.92 | 0.58 | 0.48 | 0.70 | 0.71 | 0.44 | 0.40 |
| RMSE | 60.25 | 31.17 | 49.13 | 109.30 | 7.33 | 8.18 | 19.44 | 23.41 | 60.66 | 63.27 | 52.57 | 50.55 |
| NRMSE | 19.63 | 13.62 | 10.86 | 19.73 | 18.19 | 20.50 | 13.57 | 21.57 | 31.13 | 31.42 | 14.17 | 17.64 |
| Agreement | 80.37 | 86.38 | 89.14 | 80.27 | 81.81 | 79.50 | 86.43 | 78.43 | 68.87 | 68.58 | 85.83 | 82.36 |
| Southern Zone (SZ) | ||||||||||||
| CC | 0.86 | 0.75 | 0.58 | 0.35 | 0.84 | 0.84 | 0.64 | 0.26 | 0.84 | 0.86 | 0.85 | 0.71 |
| RMSE | 75.22 | 70.15 | 68.17 | 106.34 | 23.49 | 22.71 | 20.52 | 33.07 | 39.74 | 37.62 | 30.88 | 51.90 |
| NRMSE | 14.56 | 14.07 | 10.61 | 18.90 | 17.37 | 16.73 | 9.87 | 18.69 | 19.86 | 19.52 | 9.10 | 18.30 |
| Agreement | 85.44 | 85.93 | 89.39 | 81.10 | 82.63 | 83.27 | 90.13 | 81.31 | 80.14 | 80.48 | 90.90 | 81.70 |
| Western Zone (WZ) | ||||||||||||
| CC | 0.83 | 0.78 | 0.68 | 0.56 | 0.78 | 0.80 | 0.82 | 0.71 | 0.86 | 0.80 | 0.72 | 0.30 |
| RMSE | 54.53 | 54.50 | 51.66 | 41.74 | 17.04 | 14.33 | 13.29 | 25.26 | 22.55 | 24.33 | 26.50 | 32.22 |
| NRMSE | 18.18 | 15.95 | 11.42 | 20.45 | 21.08 | 19.66 | 8.02 | 19.85 | 13.74 | 15.30 | 9.93 | 14.98 |
| Agreement | 81.82 | 84.05 | 88.58 | 85.69 | 78.92 | 80.34 | 89.98 | 80.15 | 86.26 | 84.70 | 90.07 | 85.02 |
| ACZ | 15 October | 15 November | 15 December | 16 October | 16 November | 16 December | 17 October | 17 November | 17 December |
|---|---|---|---|---|---|---|---|---|---|
| Southern Zone | Mi D | Mi W | Mi W | SD | ED | Mi D | Mi D | Mi D | Mi D |
| Northeast Zone | Mi D | Mi W | Mi D | ED | ED | Mi D | Mi D | Mi D | Mi D |
| High Rainfall Zone | MD | N | N | SD | ED | Mi D | MW | Mi D | MW |
| Cauvery Delta Zone | Mi D | Mi D | Mi D | SD | ED | Mi D | Mi D | Mi D | Mi D |
| Western Zone | Mi D | SW | MW | SD | ED | Mi D | N | Mi D | N |
| High Altitude and Hilly Zone | Mi D | SW | SW | SD | ED | Mi D | Mi W | Mi D | Mi W |
| North-western Zone | Mi D | SW | Mi D | ED | MD | Mi D | N | Mi D | N |
| Drought Severity Class | Number of Districts | ||||||||
|---|---|---|---|---|---|---|---|---|---|
| 15 October | 15 November | 15 December | 16 October | 16 November | 16 December | 17 October | 17 November | 17 December | |
| No drought | 1 | 31 | 20 | 0 | 0 | 6 | 6 | 3 | 2 |
| Mild drought | 6 | 1 | 9 | 0 | 0 | 6 | 7 | 8 | 4 |
| Moderate drought | 24 | 0 | 3 | 12 | 3 | 15 | 17 | 20 | 18 |
| Severe drought | 1 | 0 | 0 | 20 | 29 | 5 | 2 | 1 | 8 |
Disclaimer/Publisher’s Note: The statements, opinions and data contained in all publications are solely those of the individual author(s) and contributor(s) and not of MDPI and/or the editor(s). MDPI and/or the editor(s) disclaim responsibility for any injury to people or property resulting from any ideas, methods, instructions or products referred to in the content. |
© 2023 by the authors. Licensee MDPI, Basel, Switzerland. This article is an open access article distributed under the terms and conditions of the Creative Commons Attribution (CC BY) license (https://creativecommons.org/licenses/by/4.0/).
Share and Cite
Pazhanivelan, S.; Geethalakshmi, V.; Samykannu, V.; Kumaraperumal, R.; Kancheti, M.; Kaliaperumal, R.; Raju, M.; Yadav, M.K. Evaluation of SPI and Rainfall Departure Based on Multi-Satellite Precipitation Products for Meteorological Drought Monitoring in Tamil Nadu. Water 2023, 15, 1435. https://doi.org/10.3390/w15071435
Pazhanivelan S, Geethalakshmi V, Samykannu V, Kumaraperumal R, Kancheti M, Kaliaperumal R, Raju M, Yadav MK. Evaluation of SPI and Rainfall Departure Based on Multi-Satellite Precipitation Products for Meteorological Drought Monitoring in Tamil Nadu. Water. 2023; 15(7):1435. https://doi.org/10.3390/w15071435
Chicago/Turabian StylePazhanivelan, Sellaperumal, Vellingiri Geethalakshmi, Venkadesh Samykannu, Ramalingam Kumaraperumal, Mrunalini Kancheti, Ragunath Kaliaperumal, Marimuthu Raju, and Manoj Kumar Yadav. 2023. "Evaluation of SPI and Rainfall Departure Based on Multi-Satellite Precipitation Products for Meteorological Drought Monitoring in Tamil Nadu" Water 15, no. 7: 1435. https://doi.org/10.3390/w15071435