
Geochemistry of Metals and Organic Matter in Water and Sediments of the Karst River Cetina, Croatia


Abstract
:1. Introduction
2. Materials and Methods
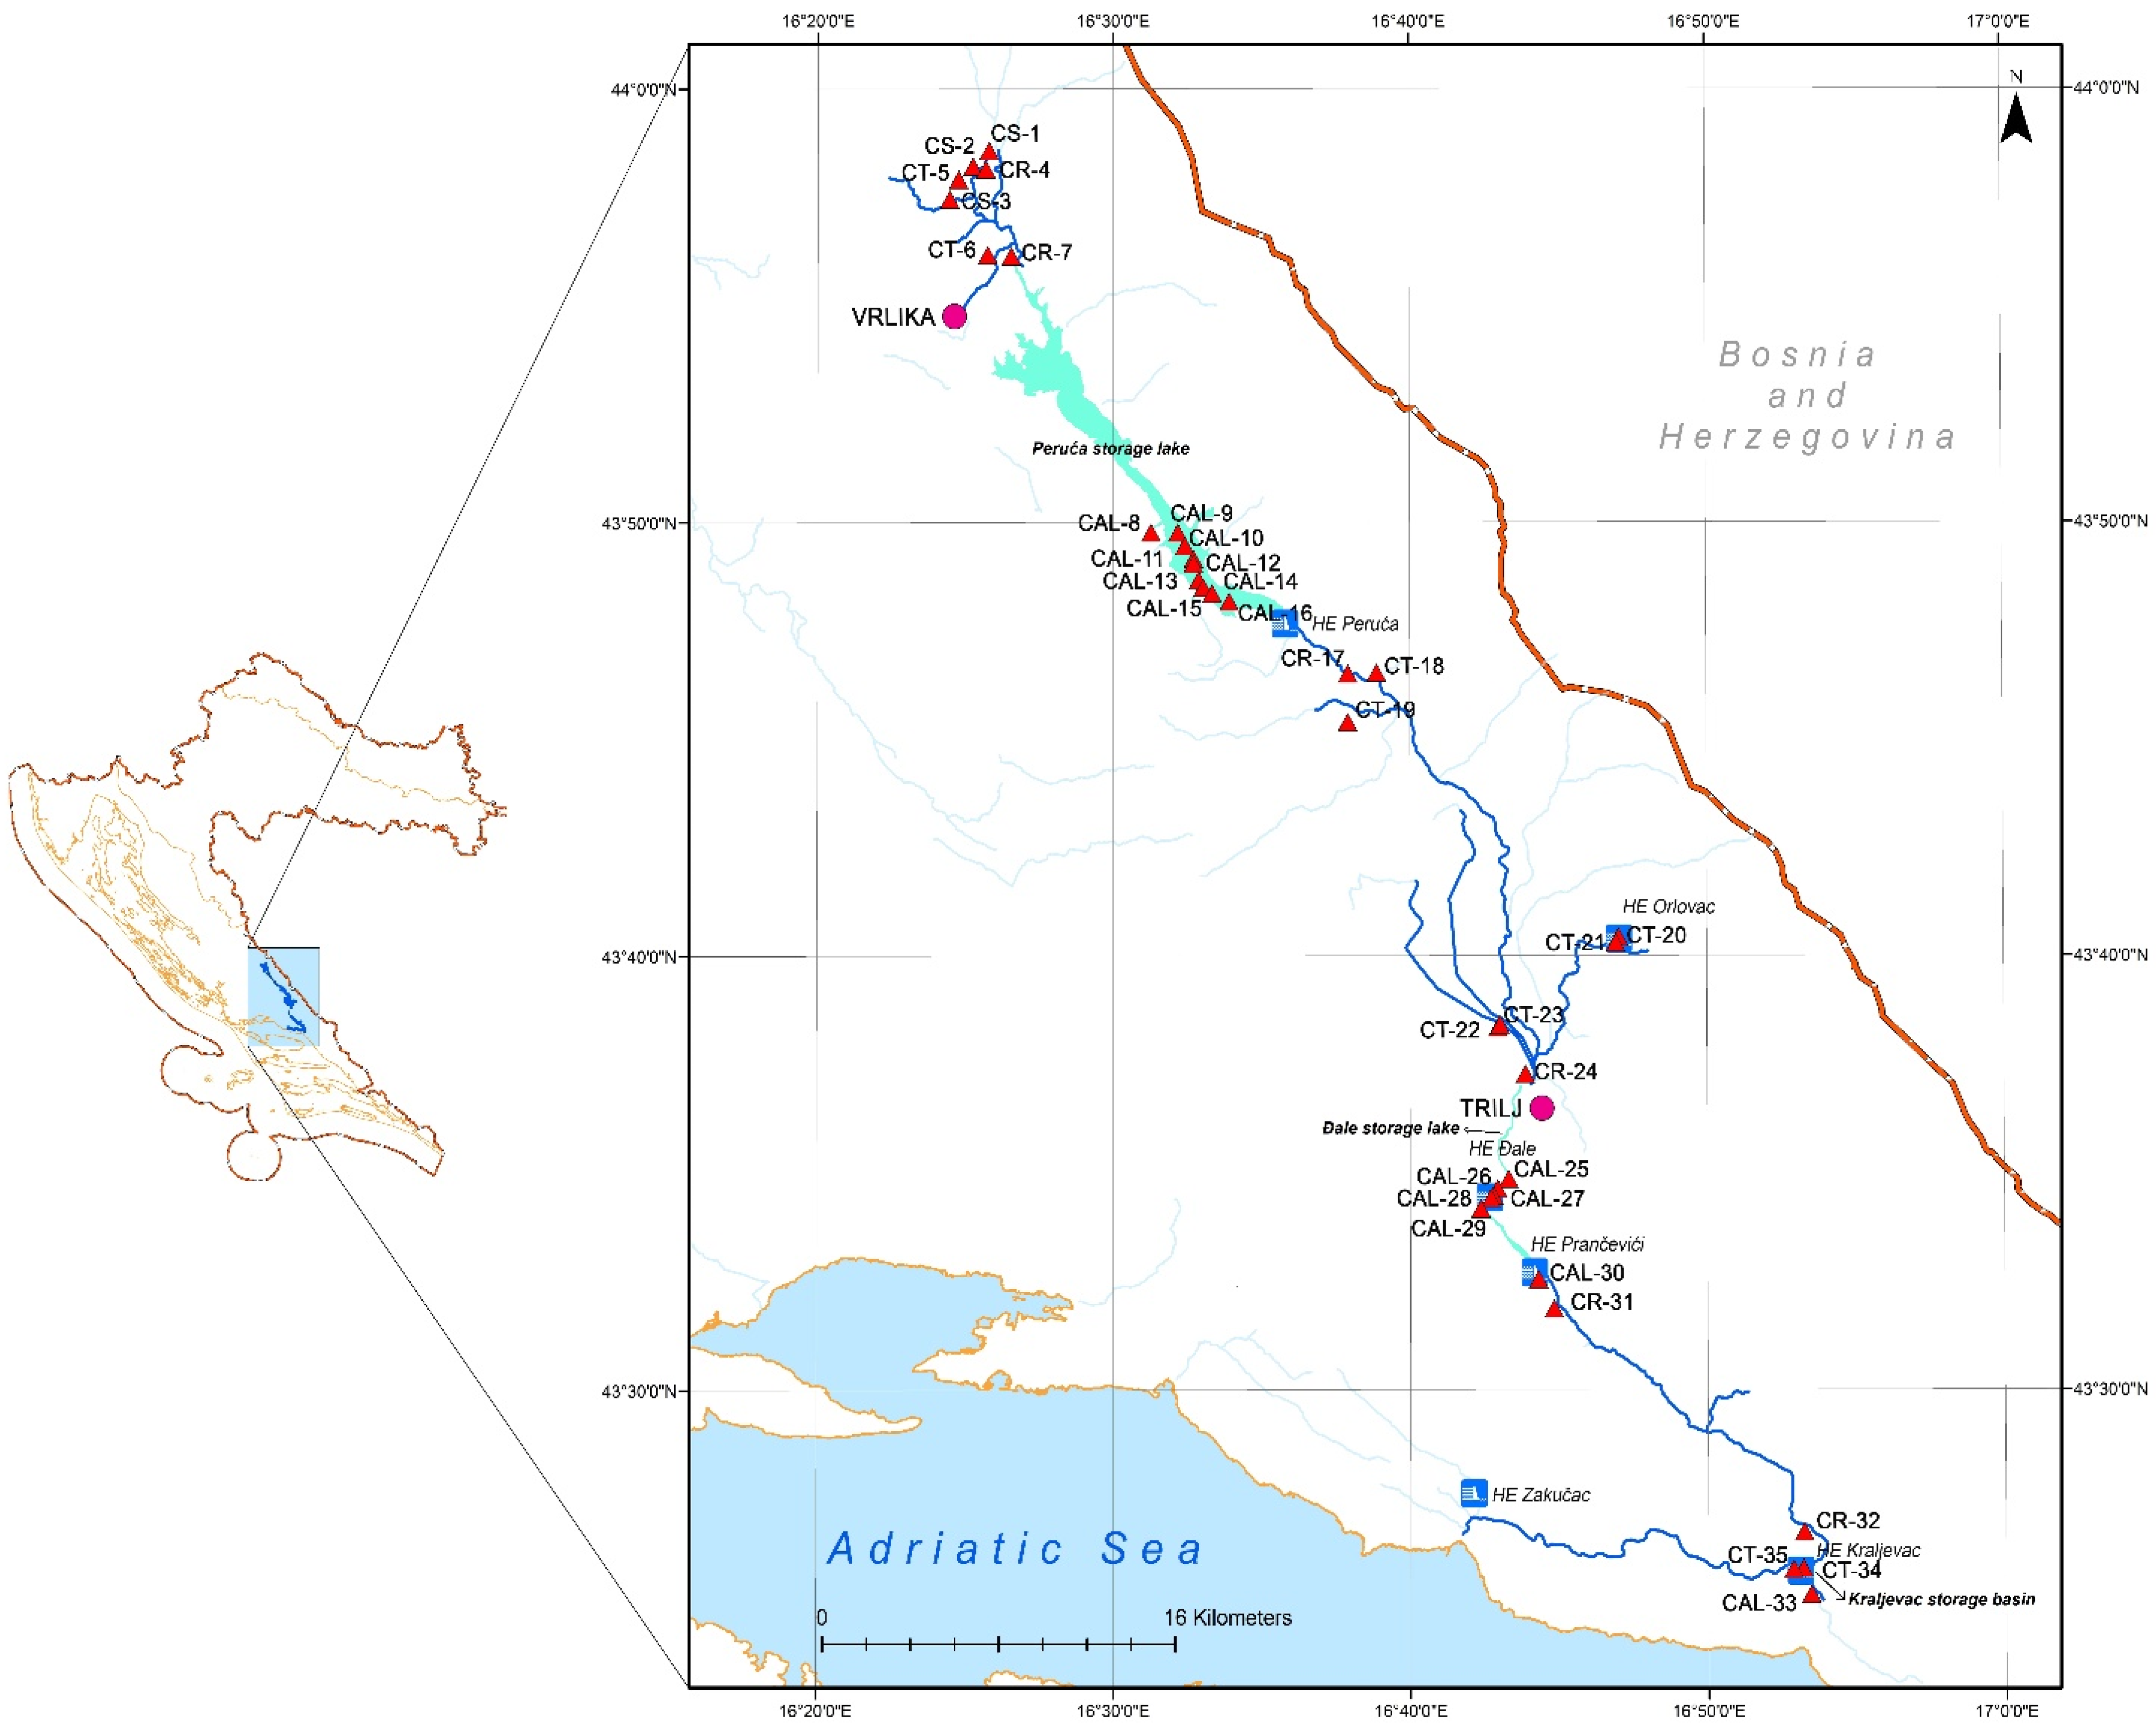
2.1. Study Area Overview
2.2. Sampling
2.2.1. Methods for Water Analyses
2.2.2. Methods for Sediment Analyses
2.2.3. Data Treatment
3. Results and Discussion
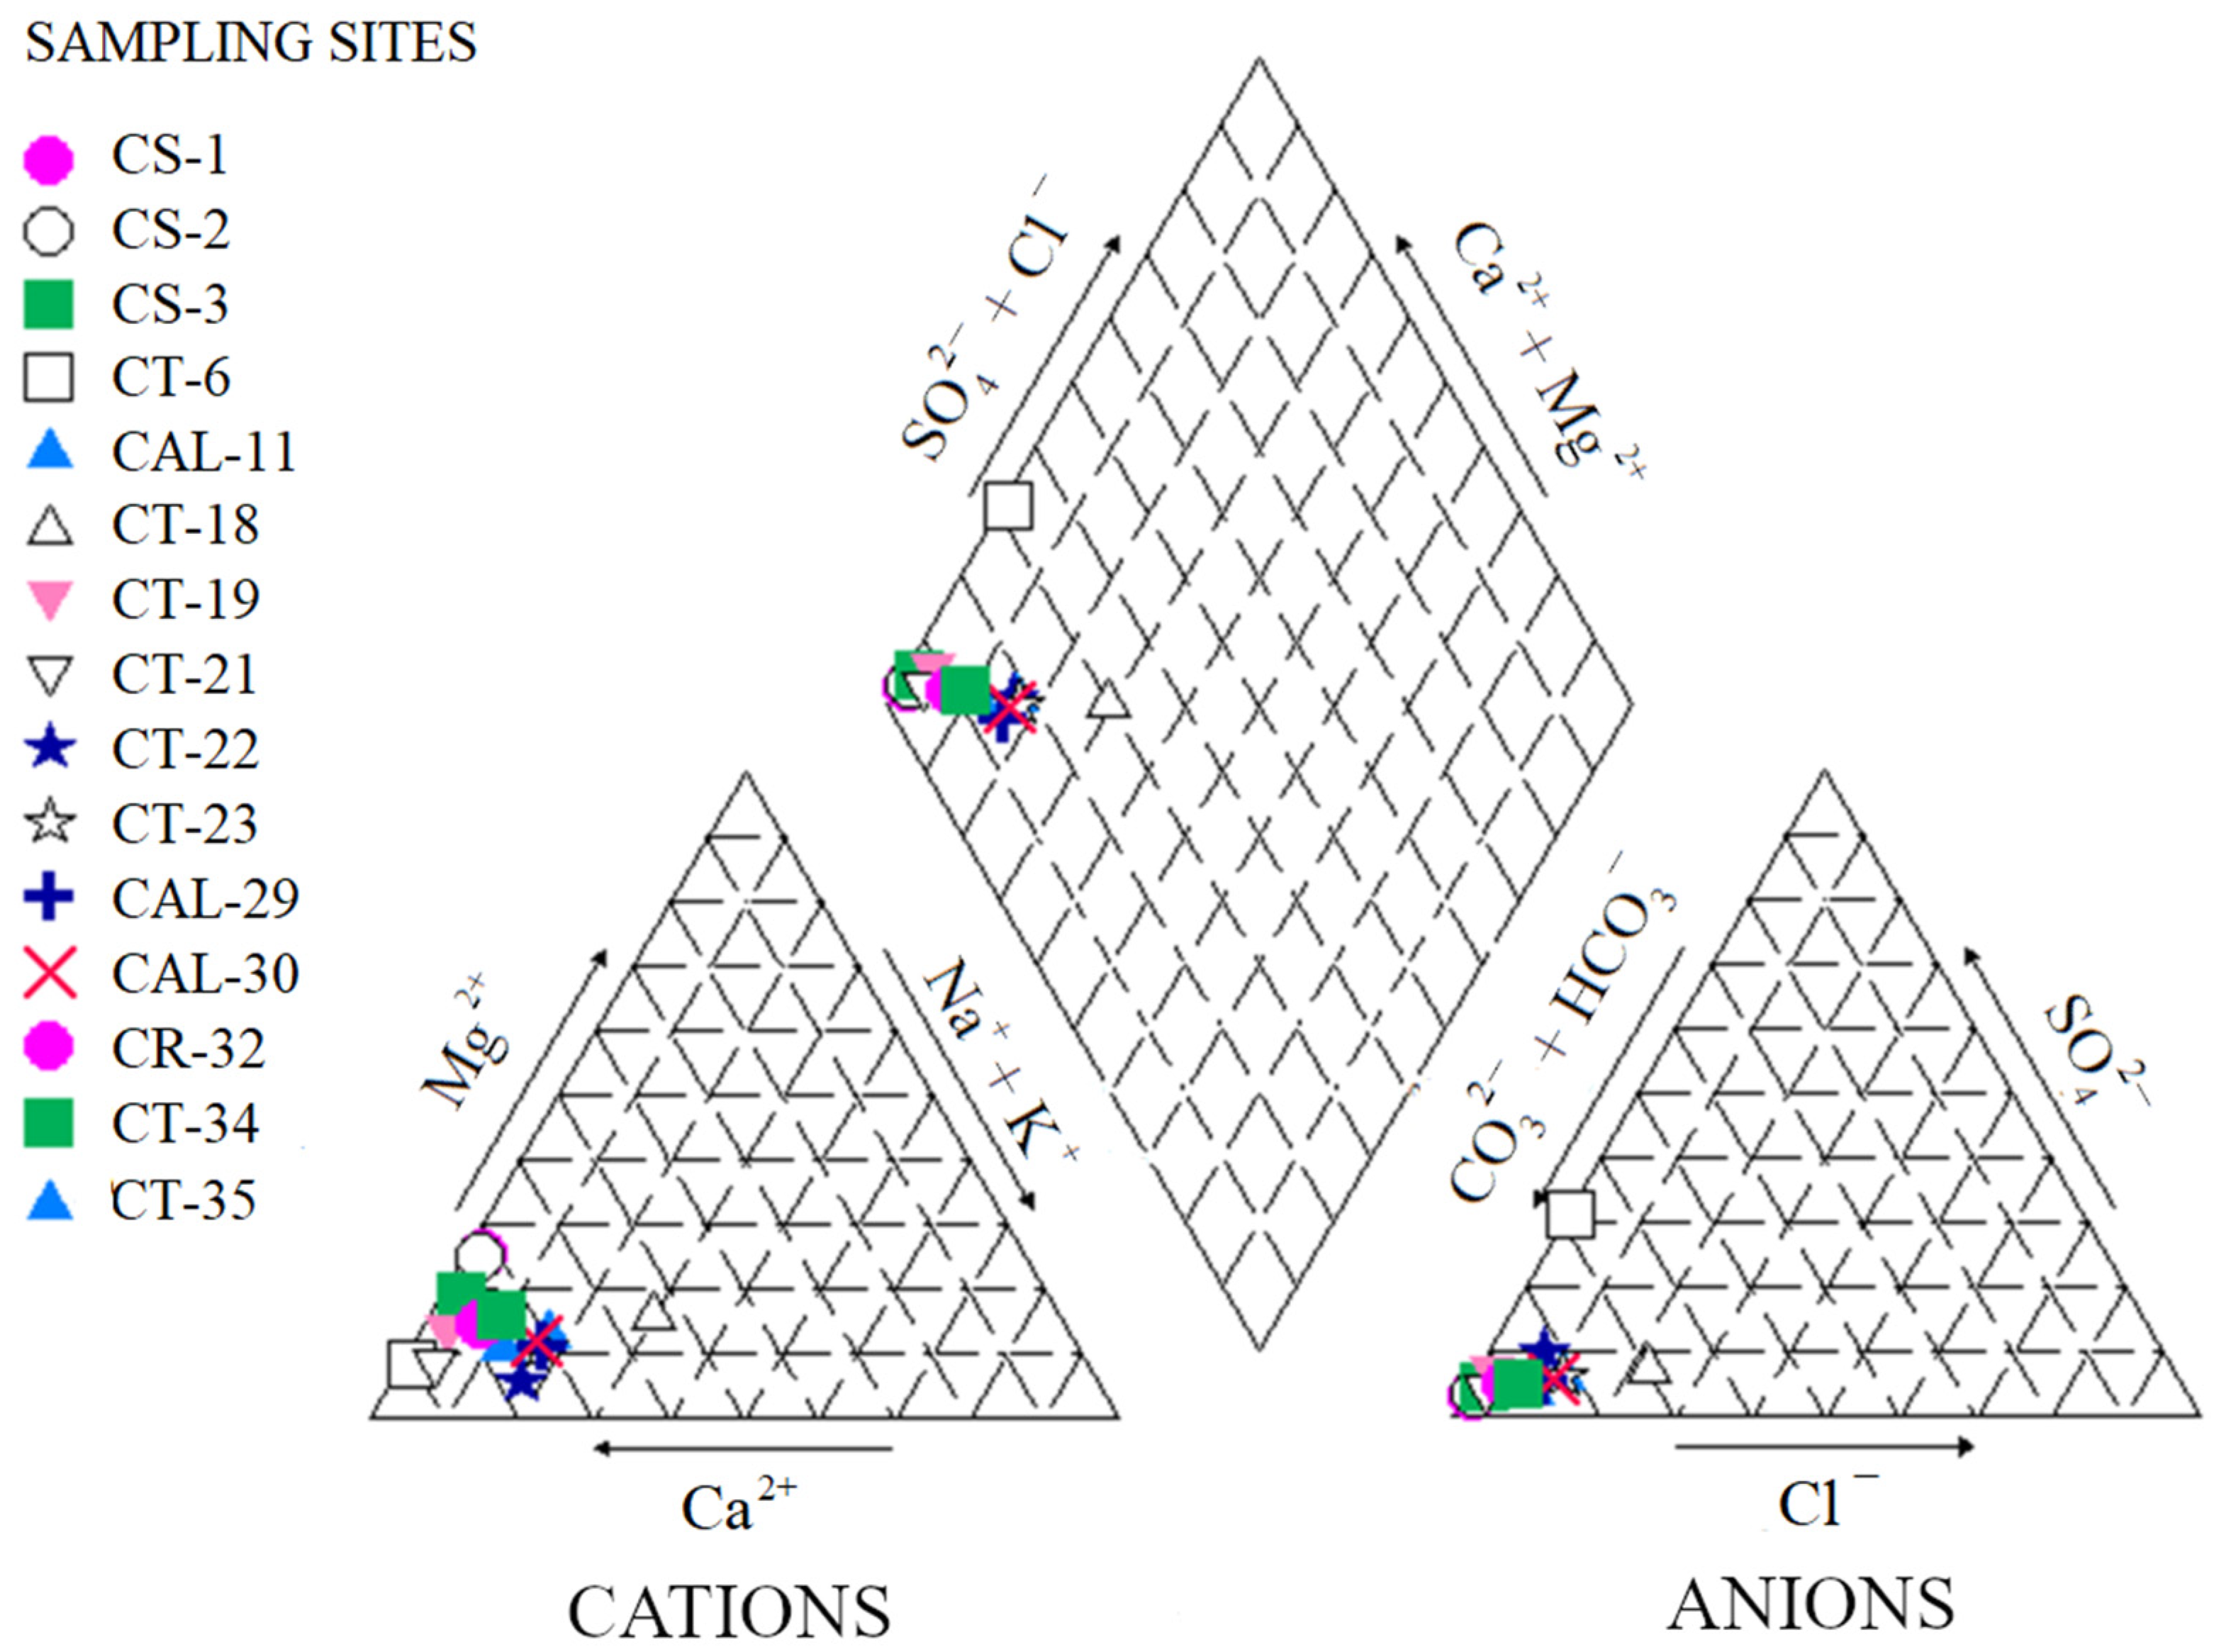
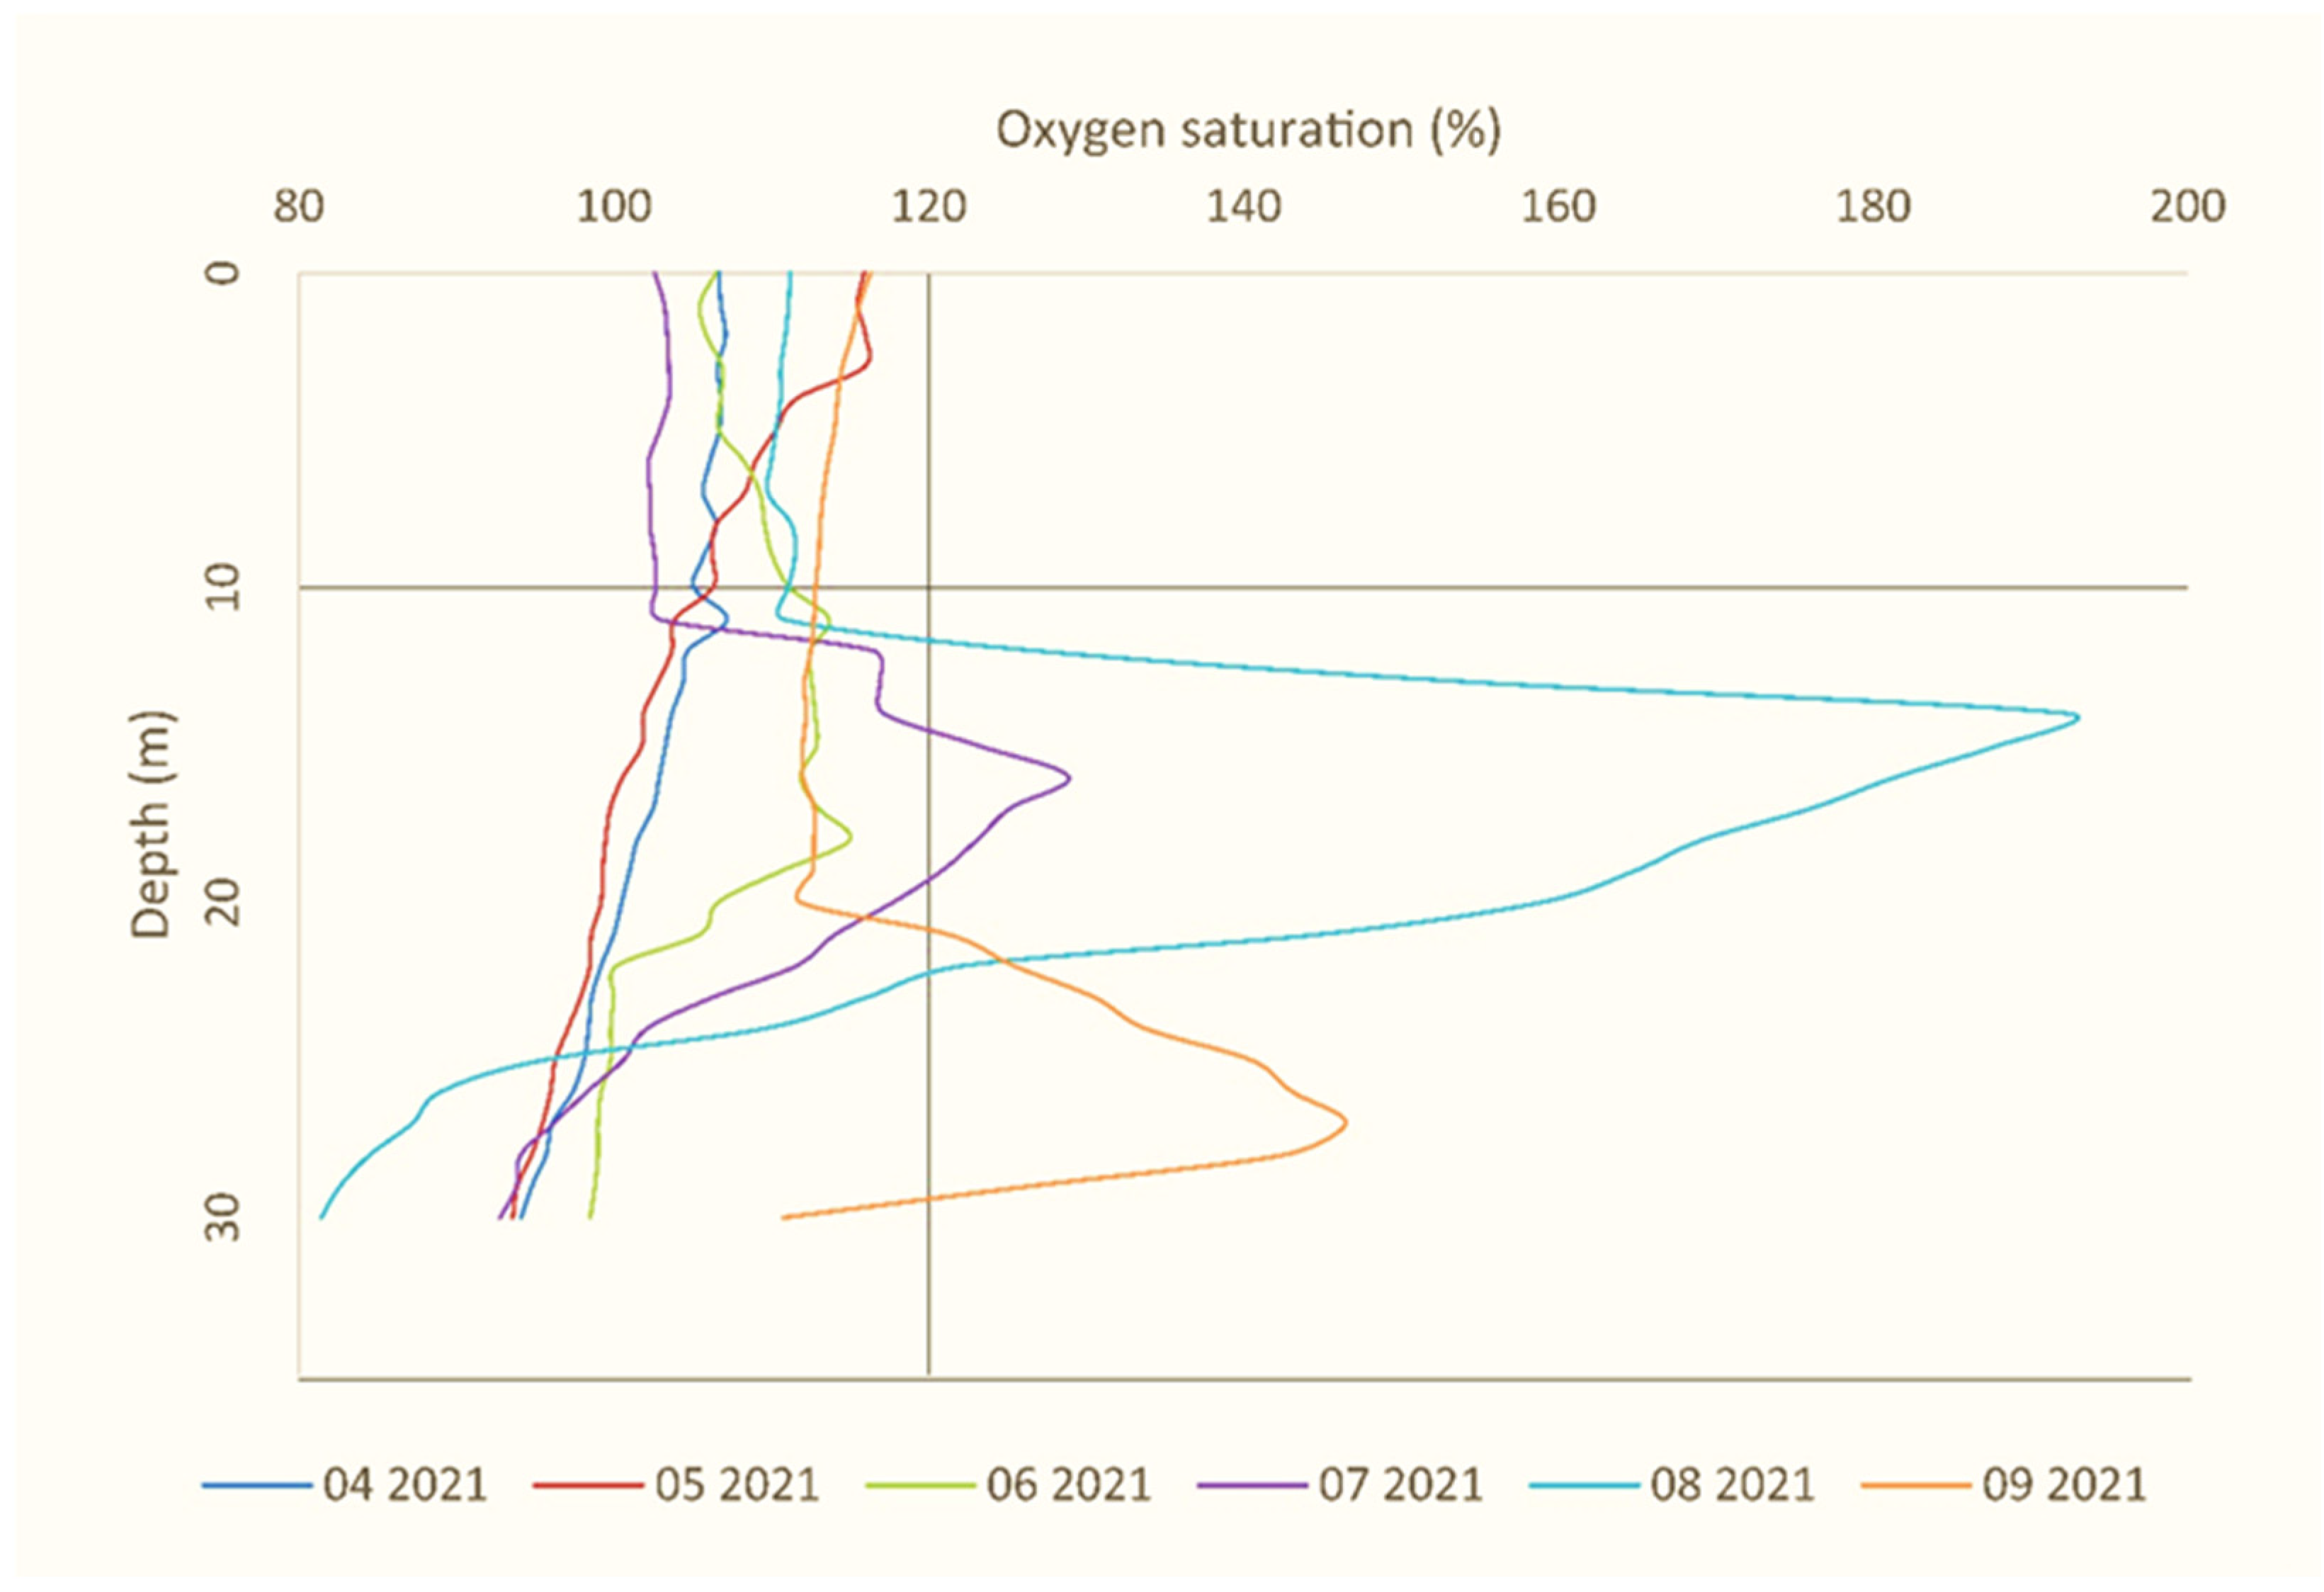
3.1. Water Analyses
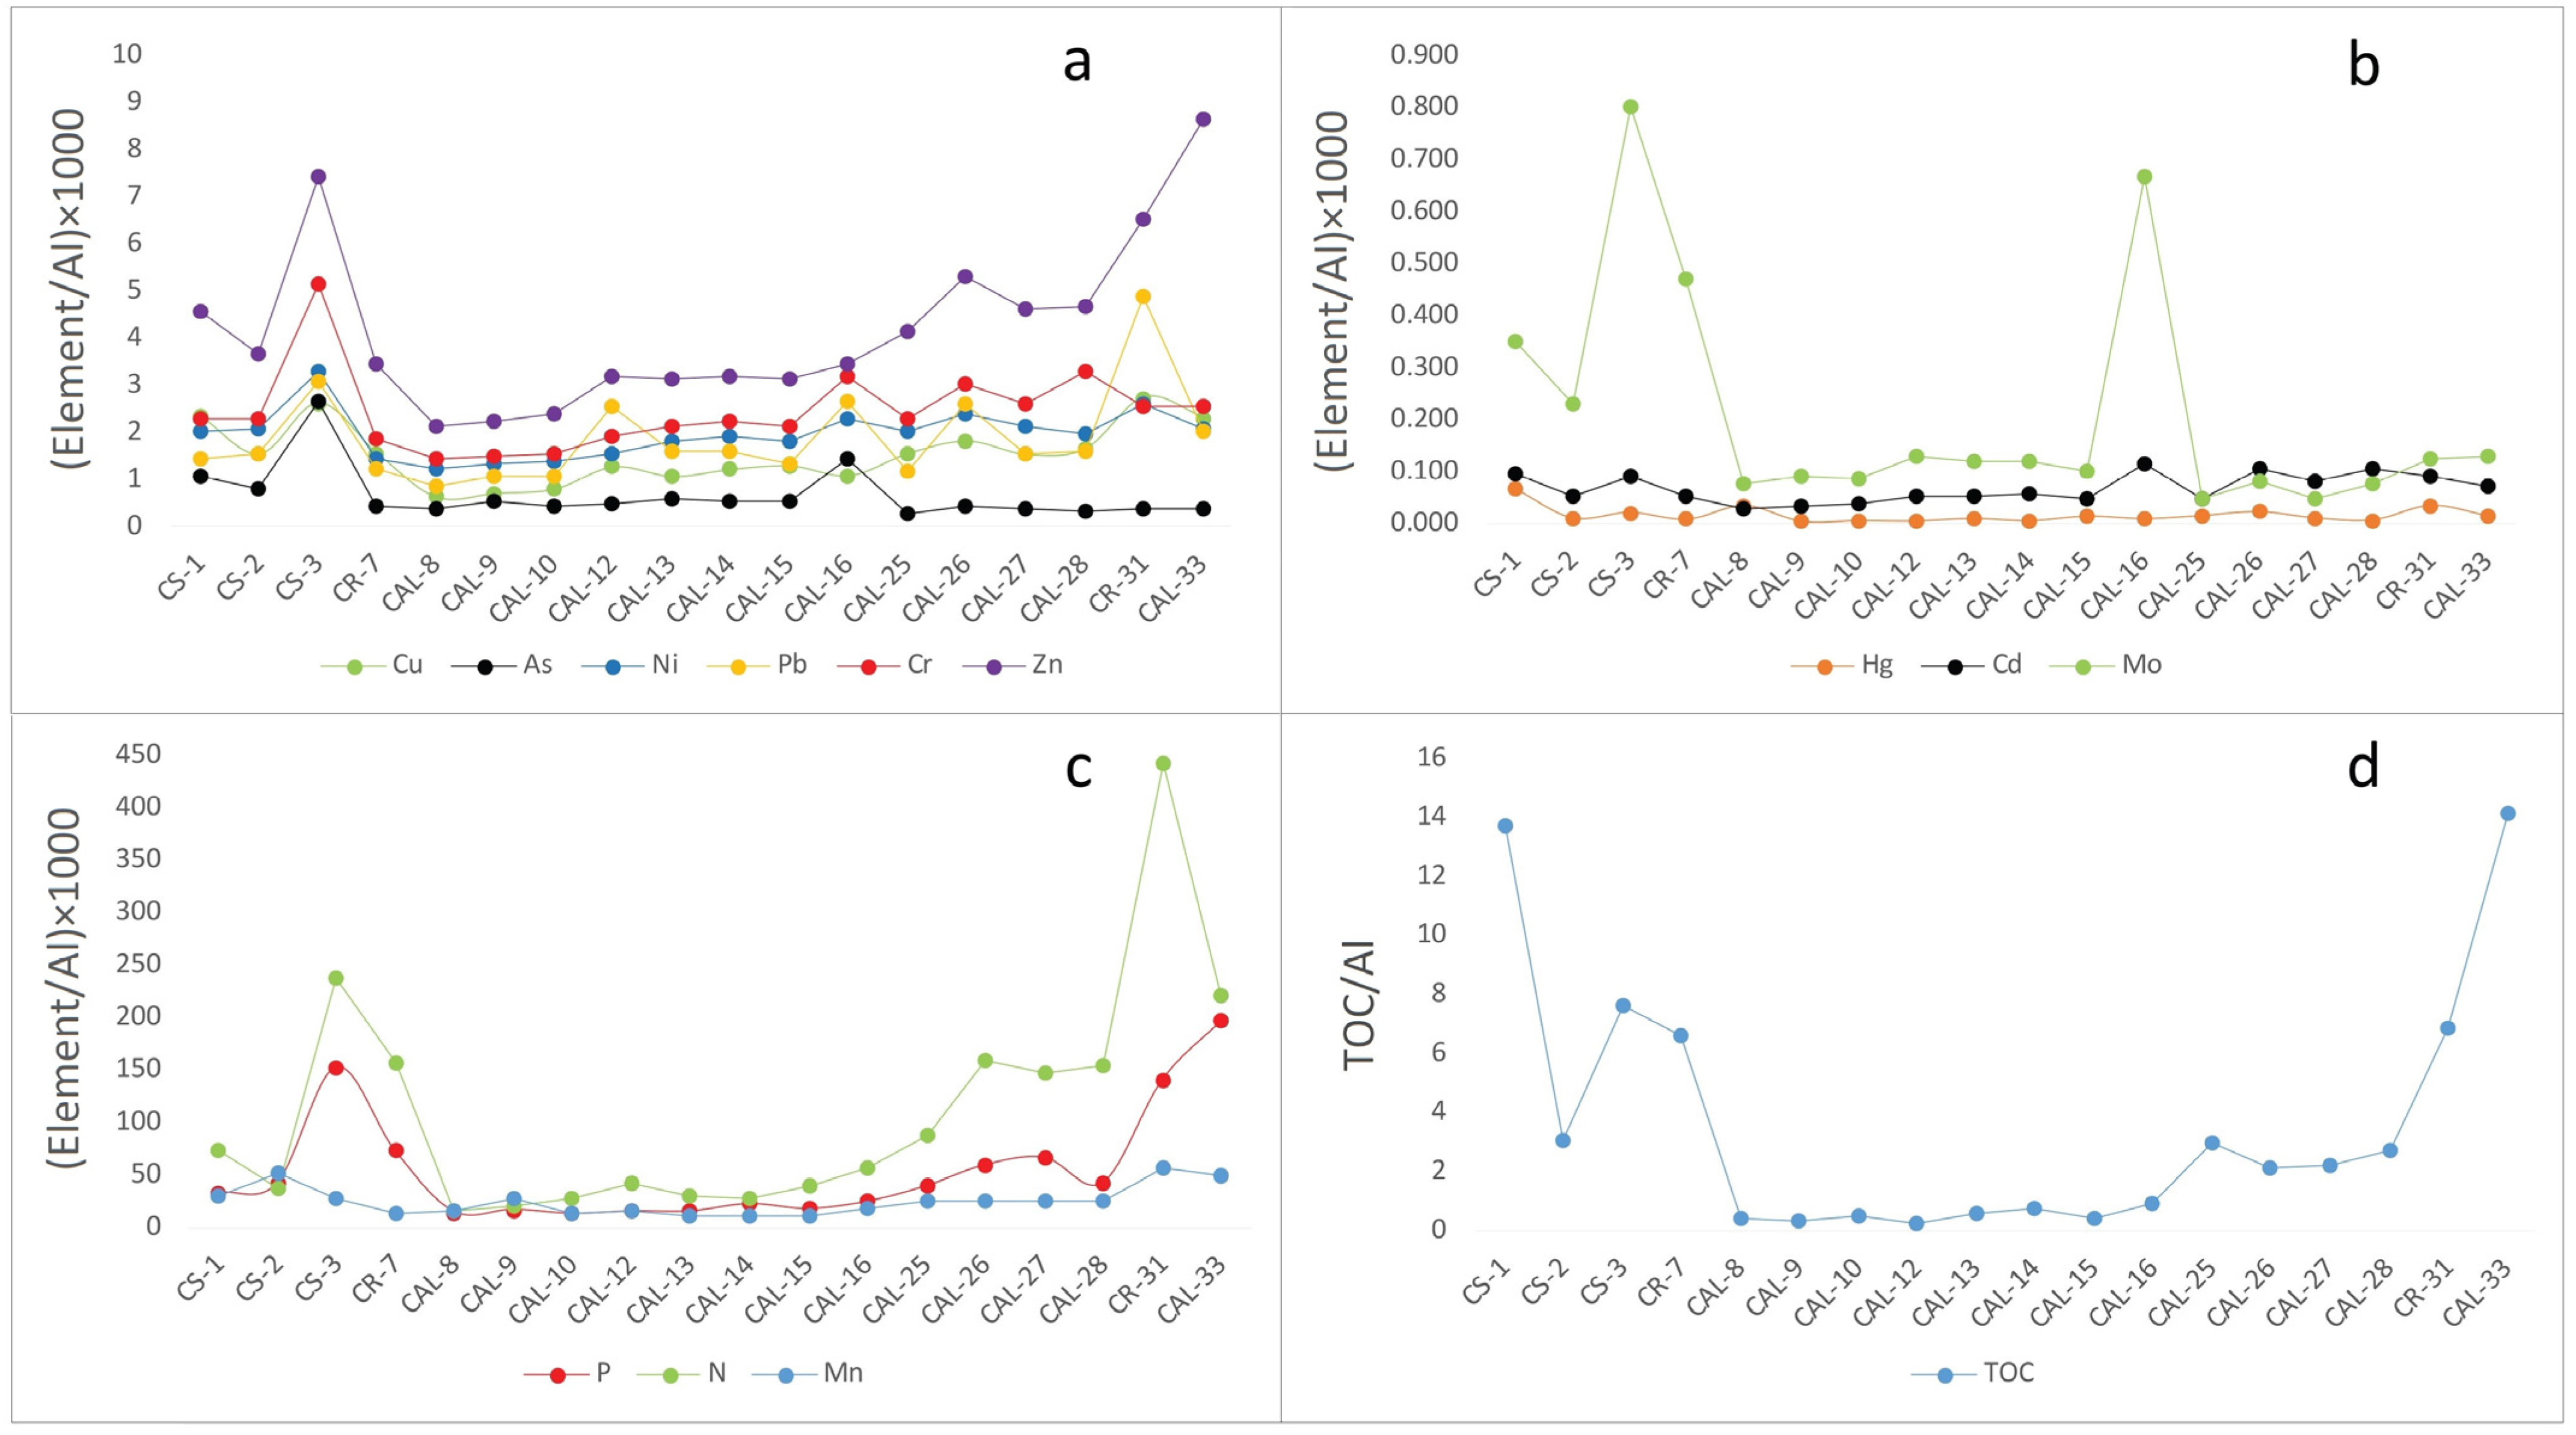
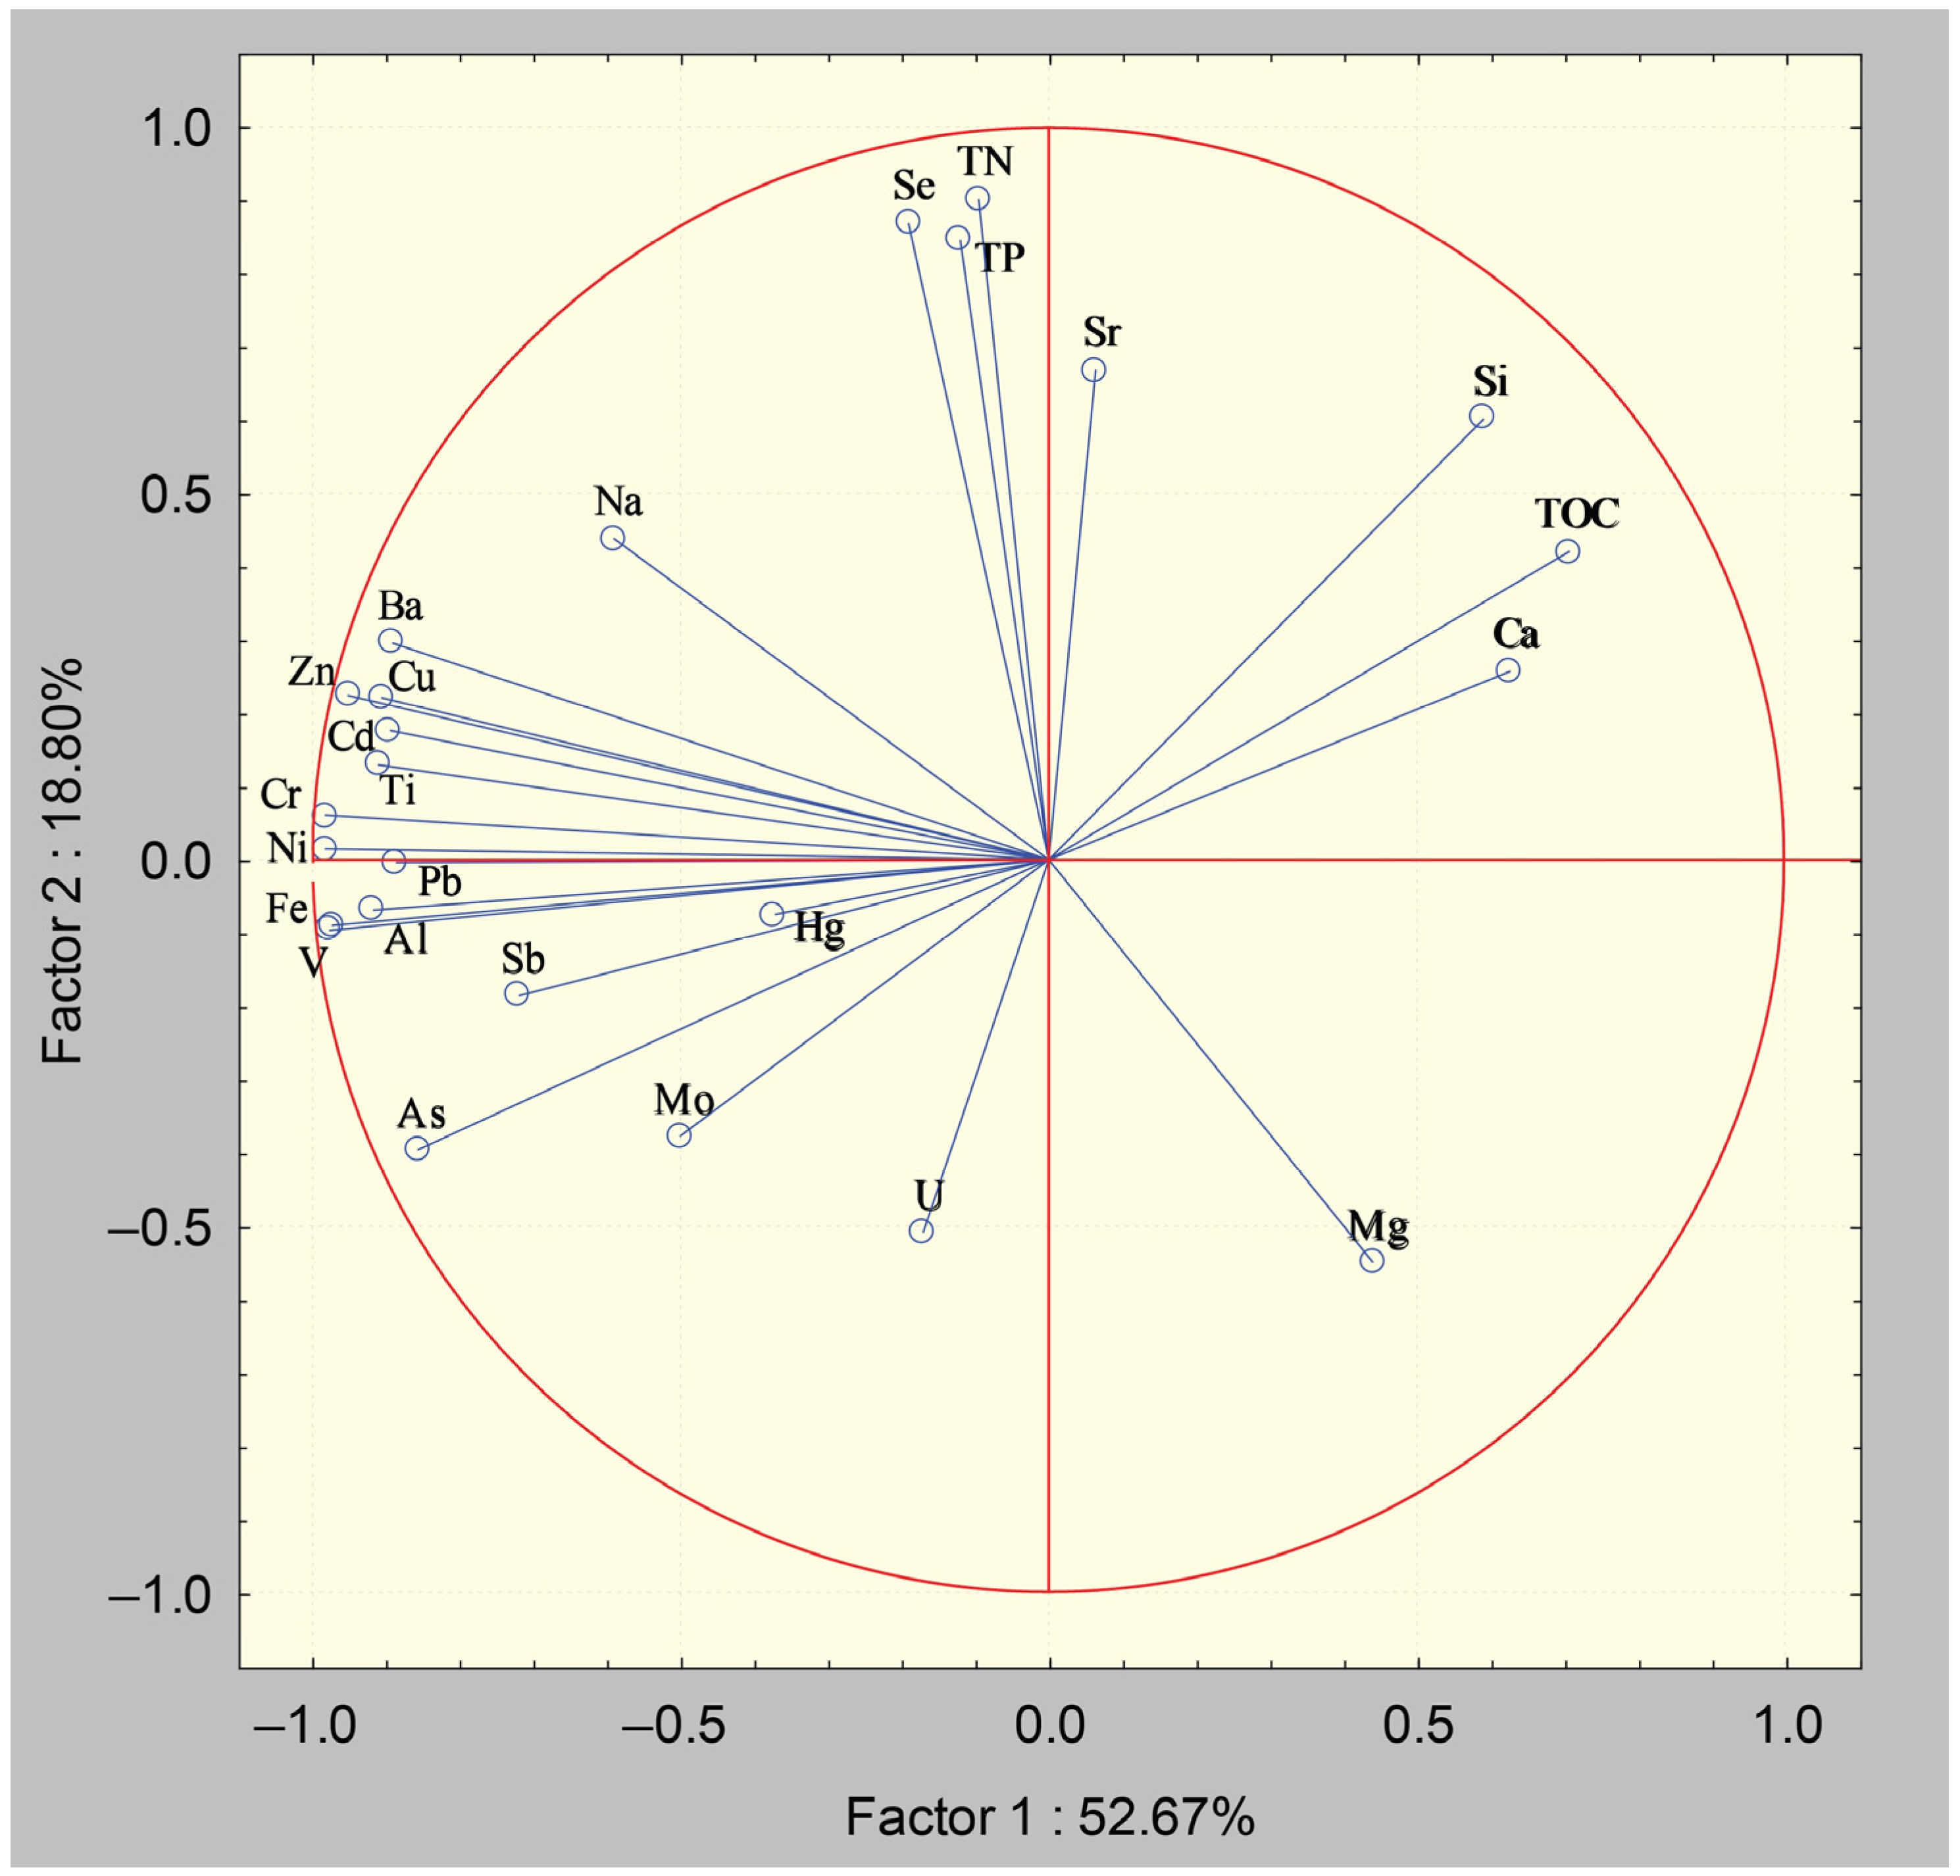
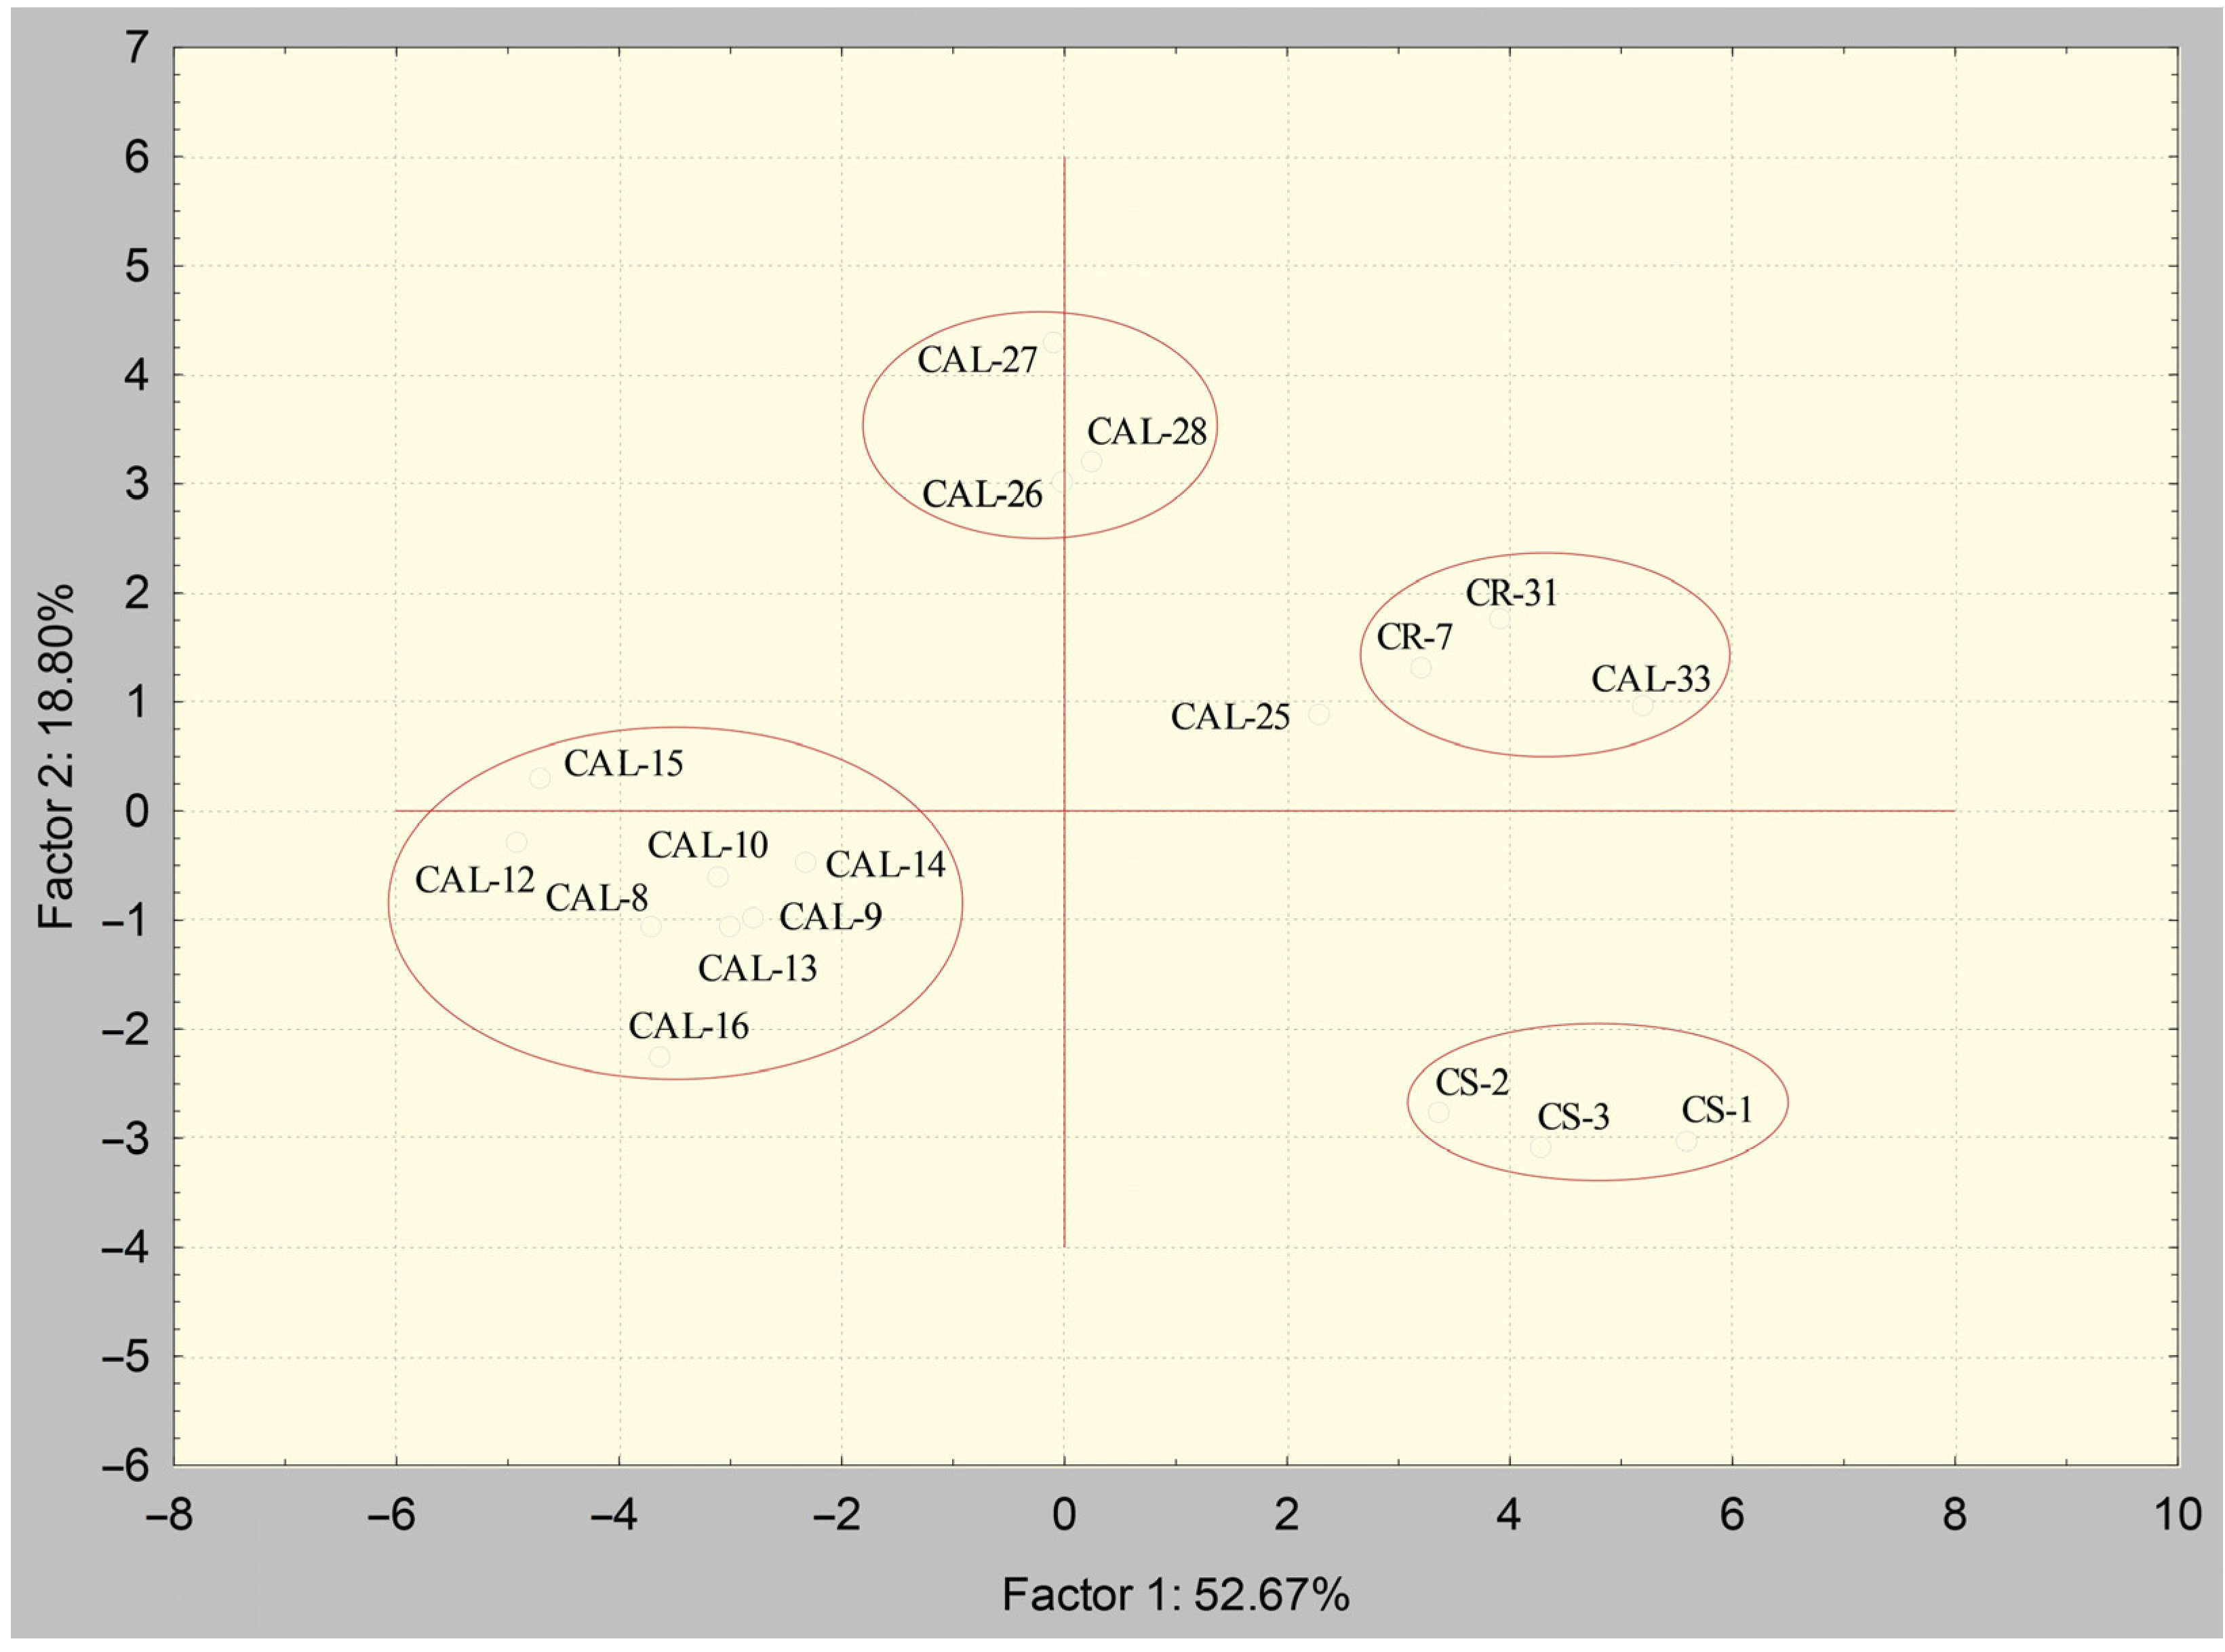
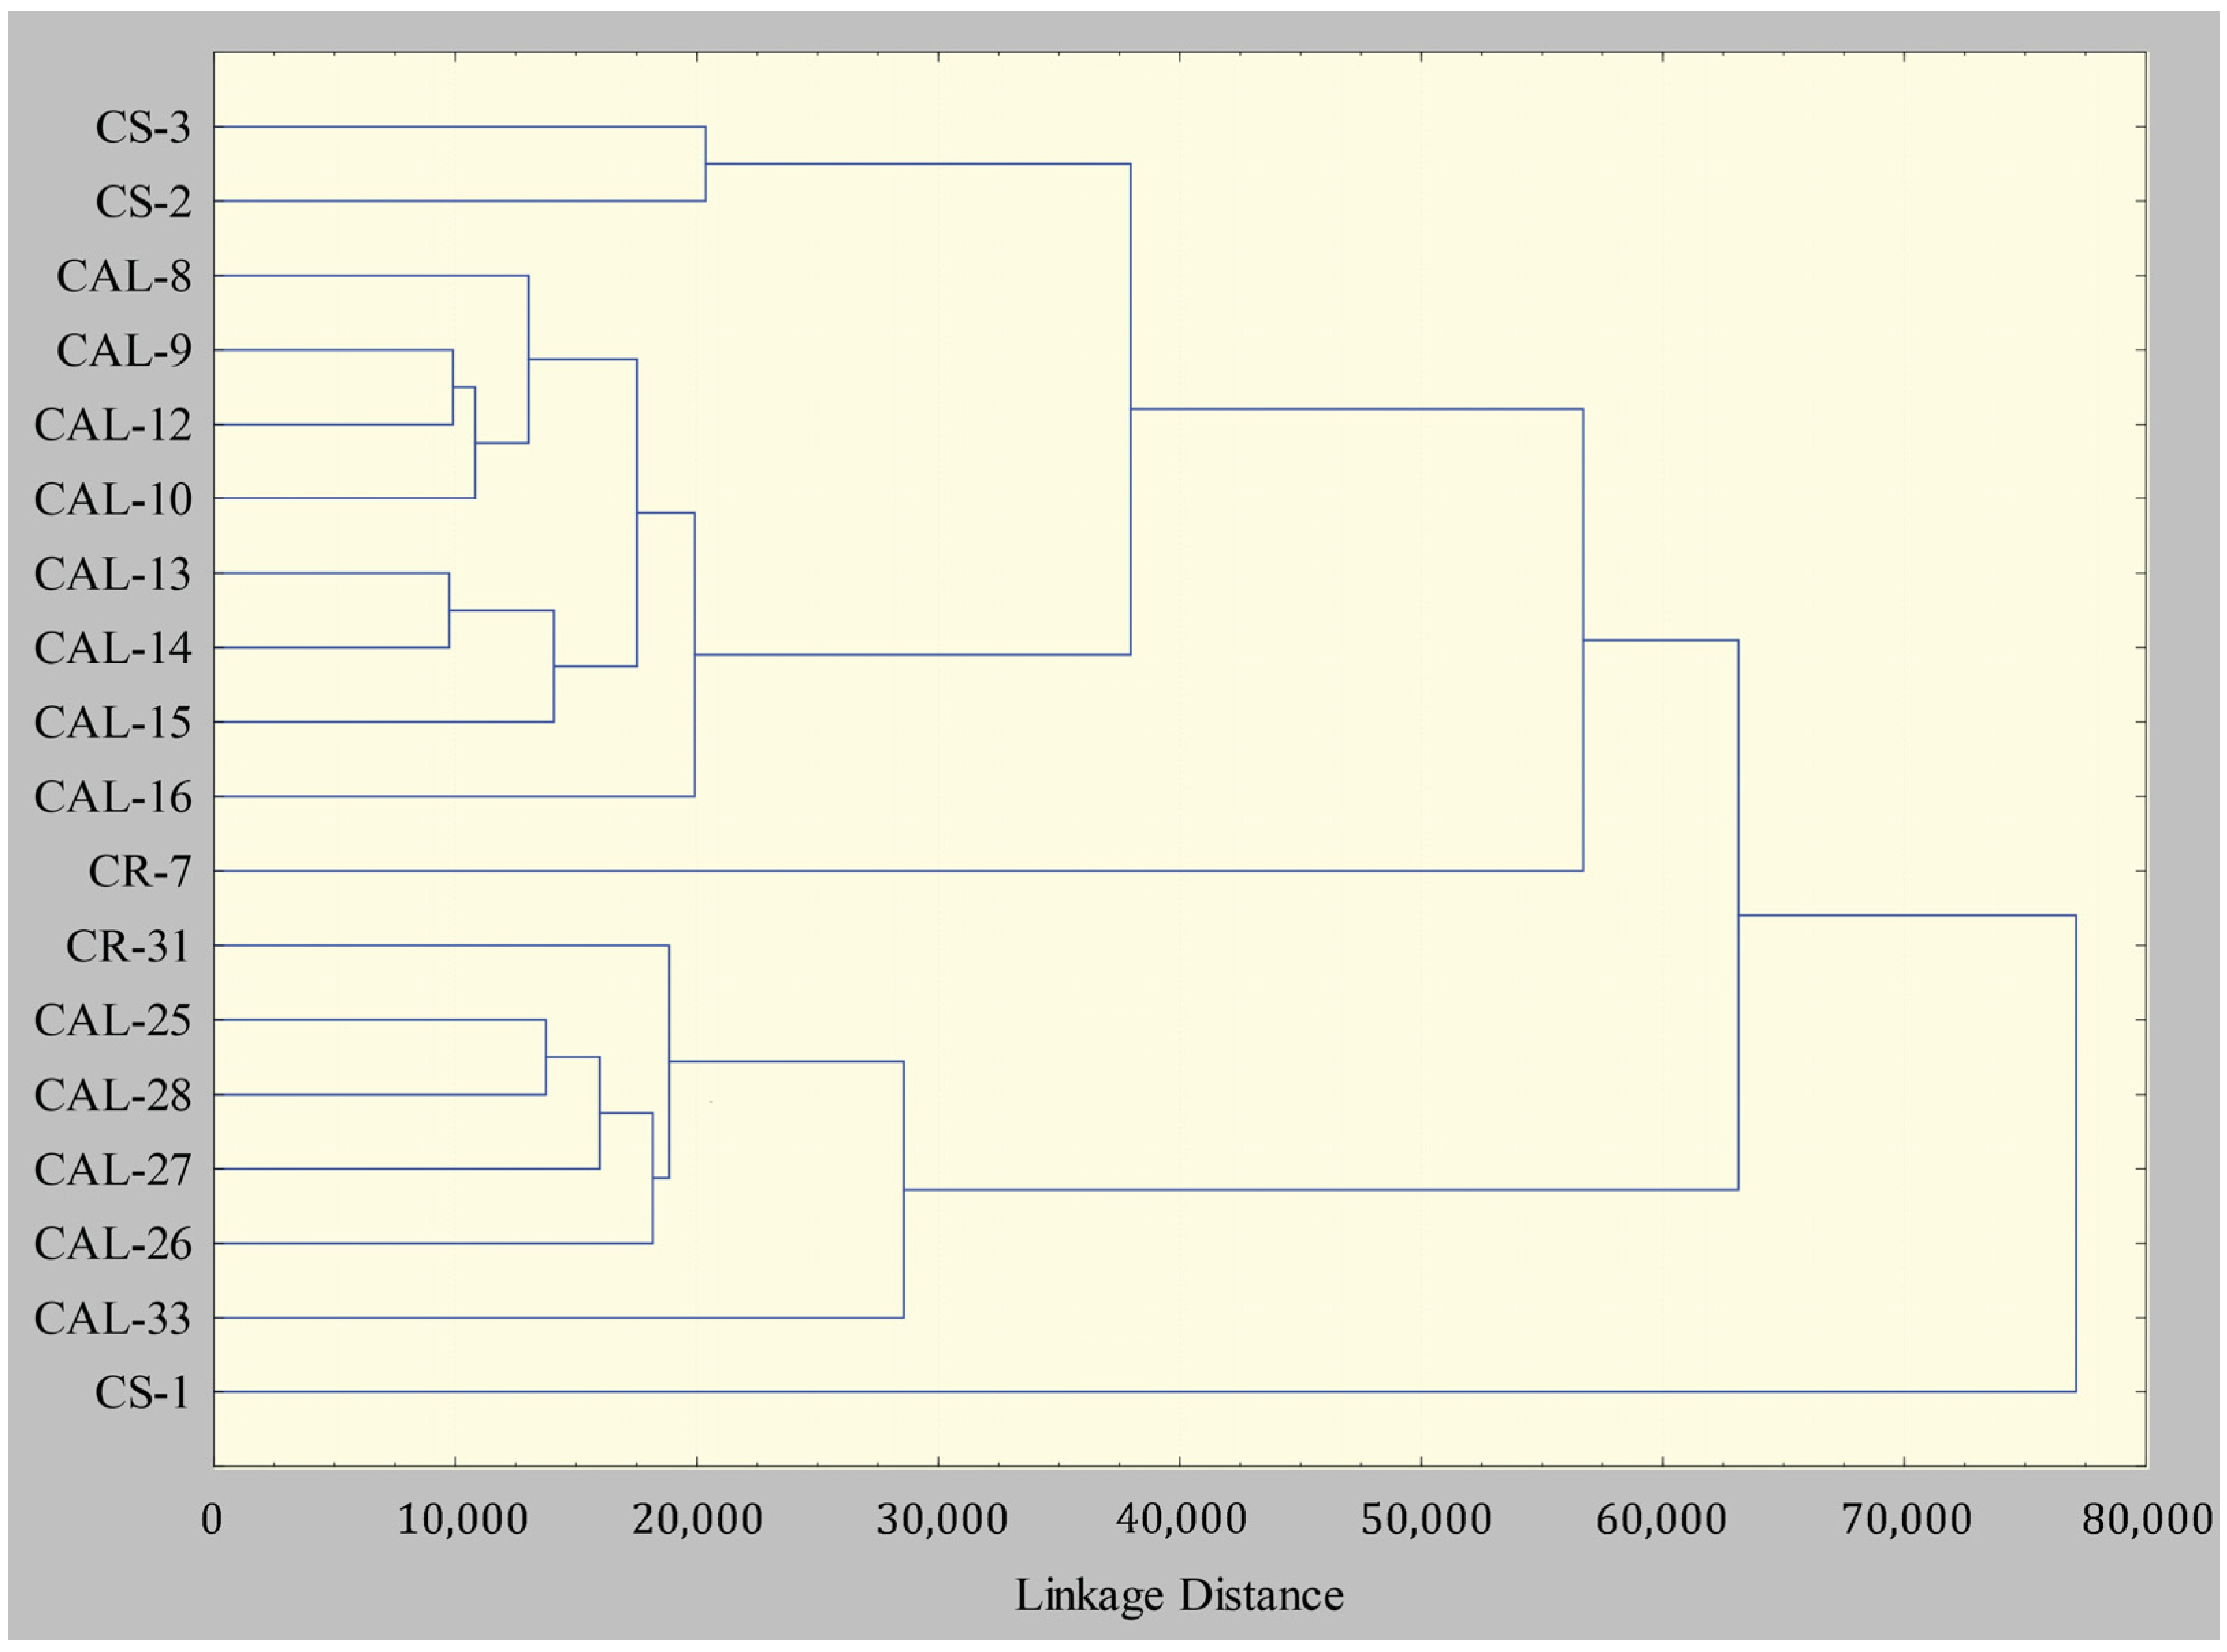
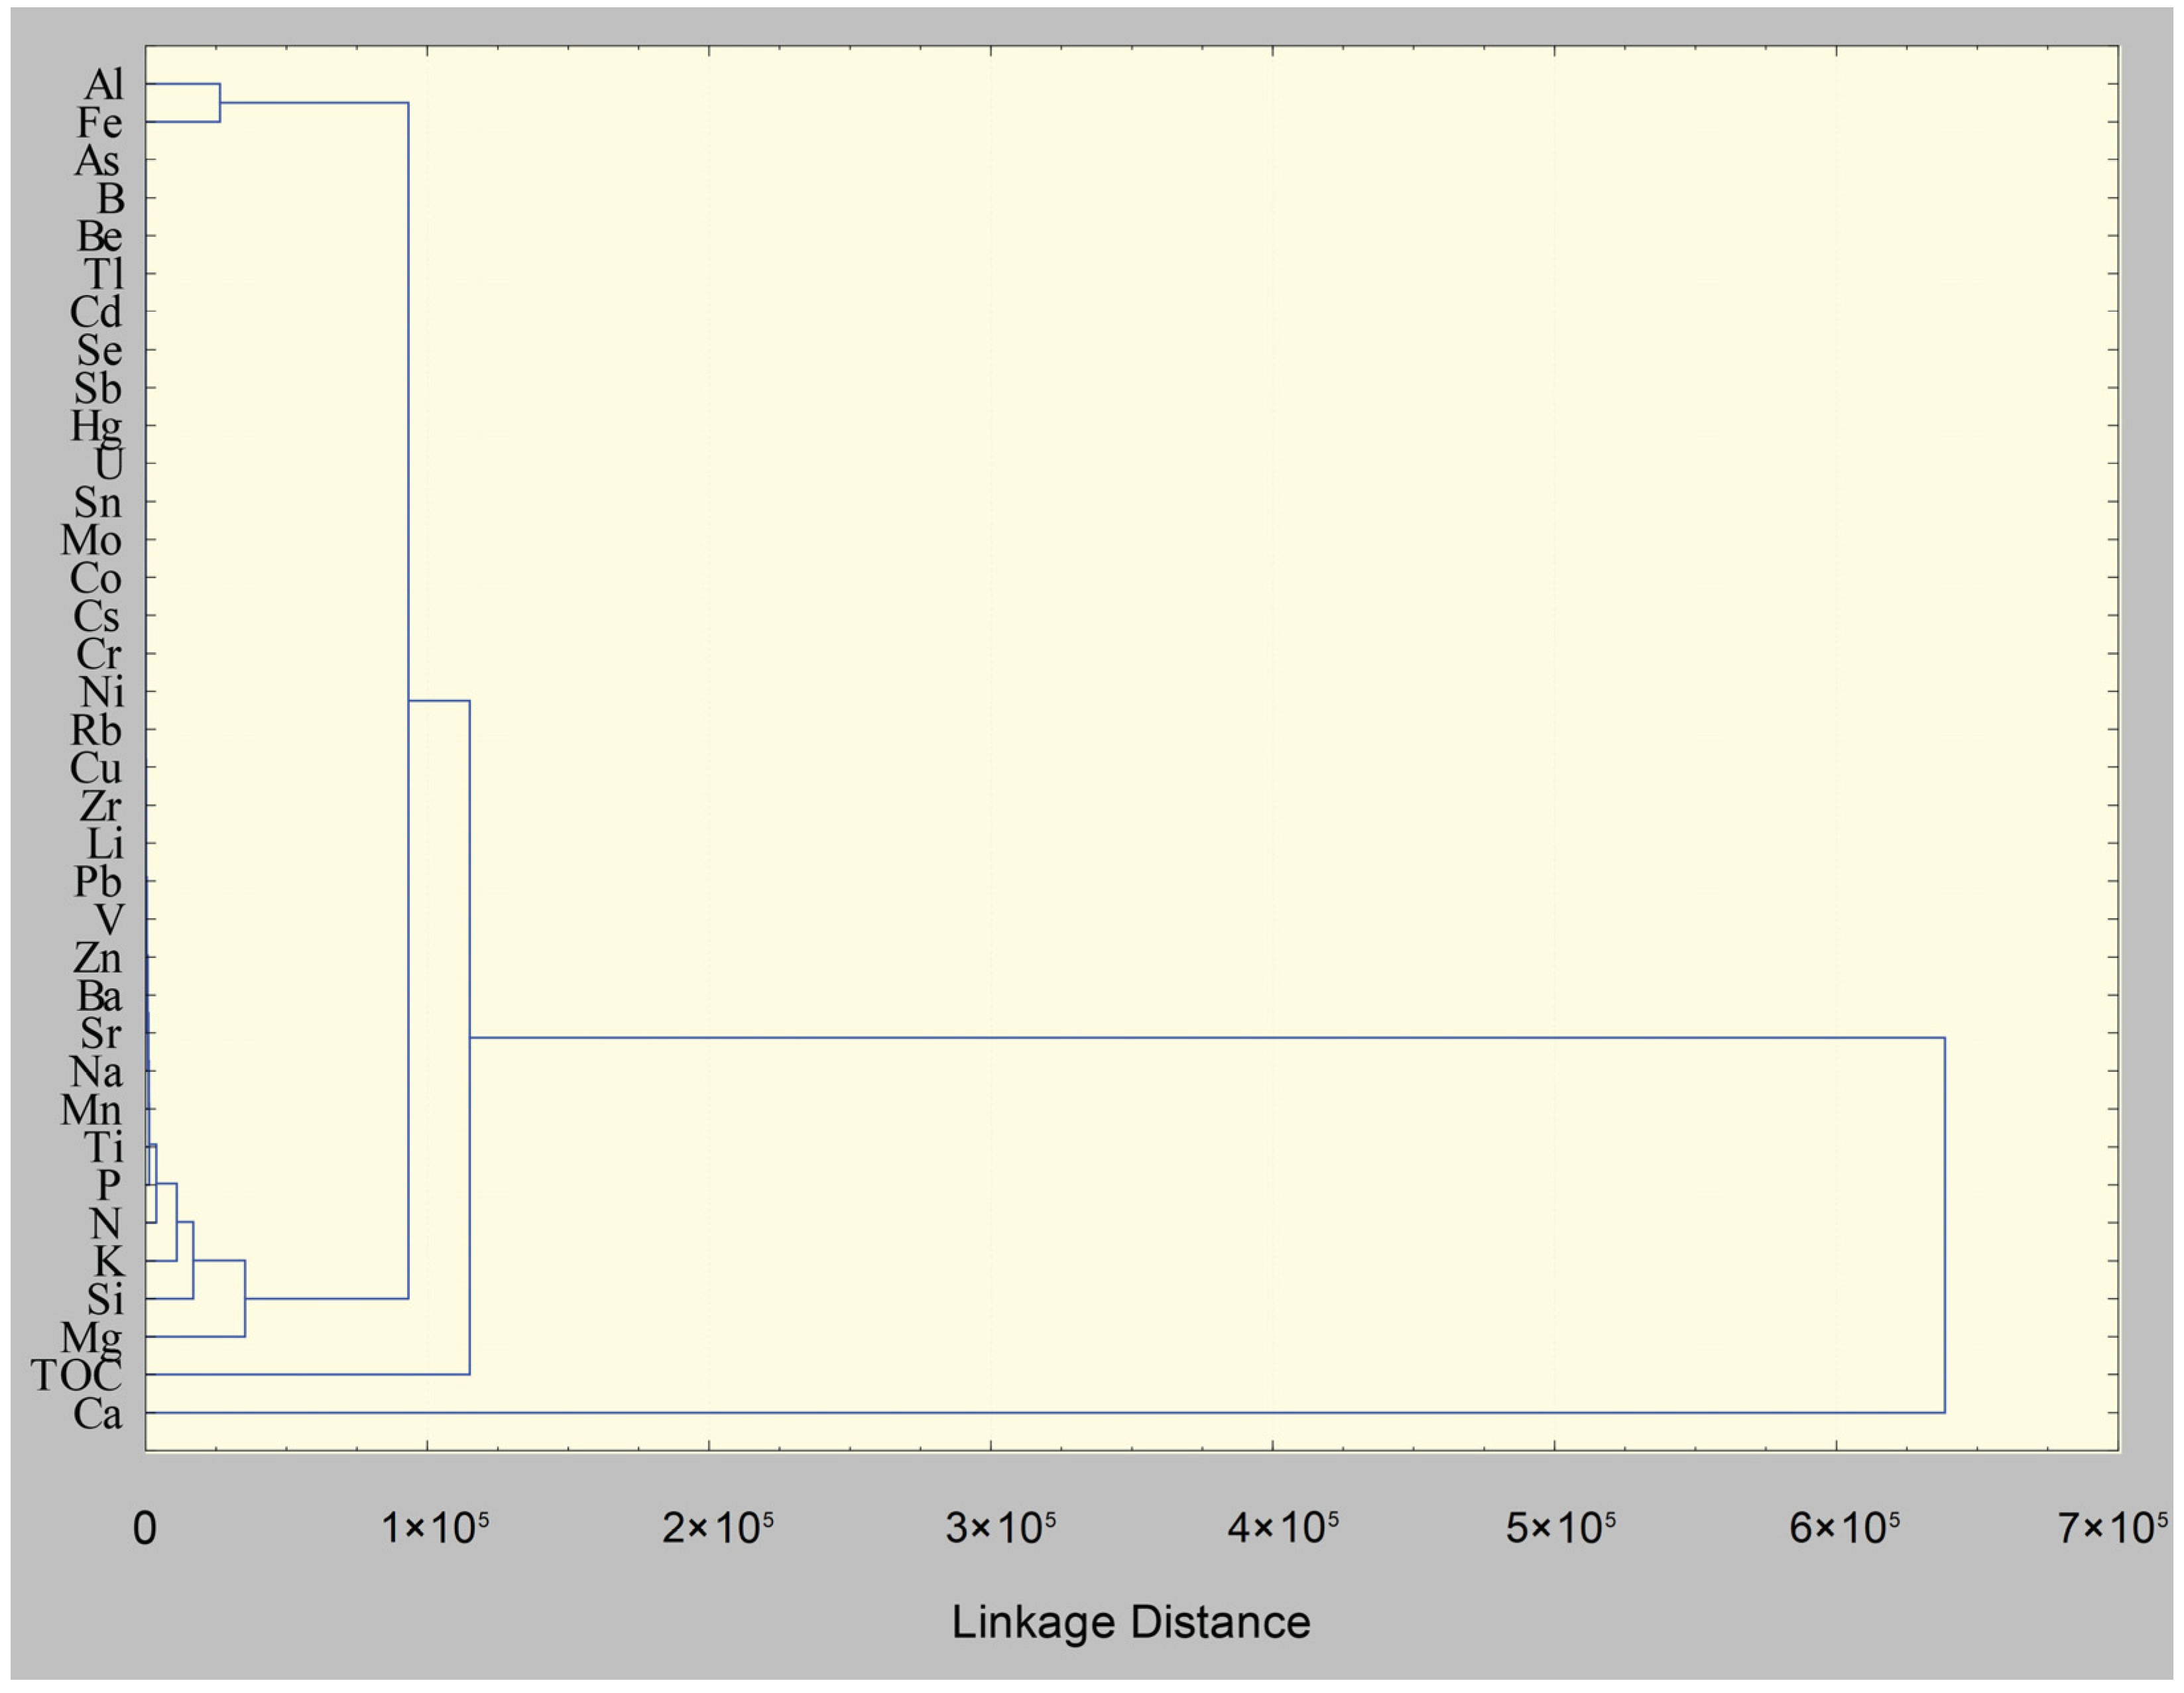
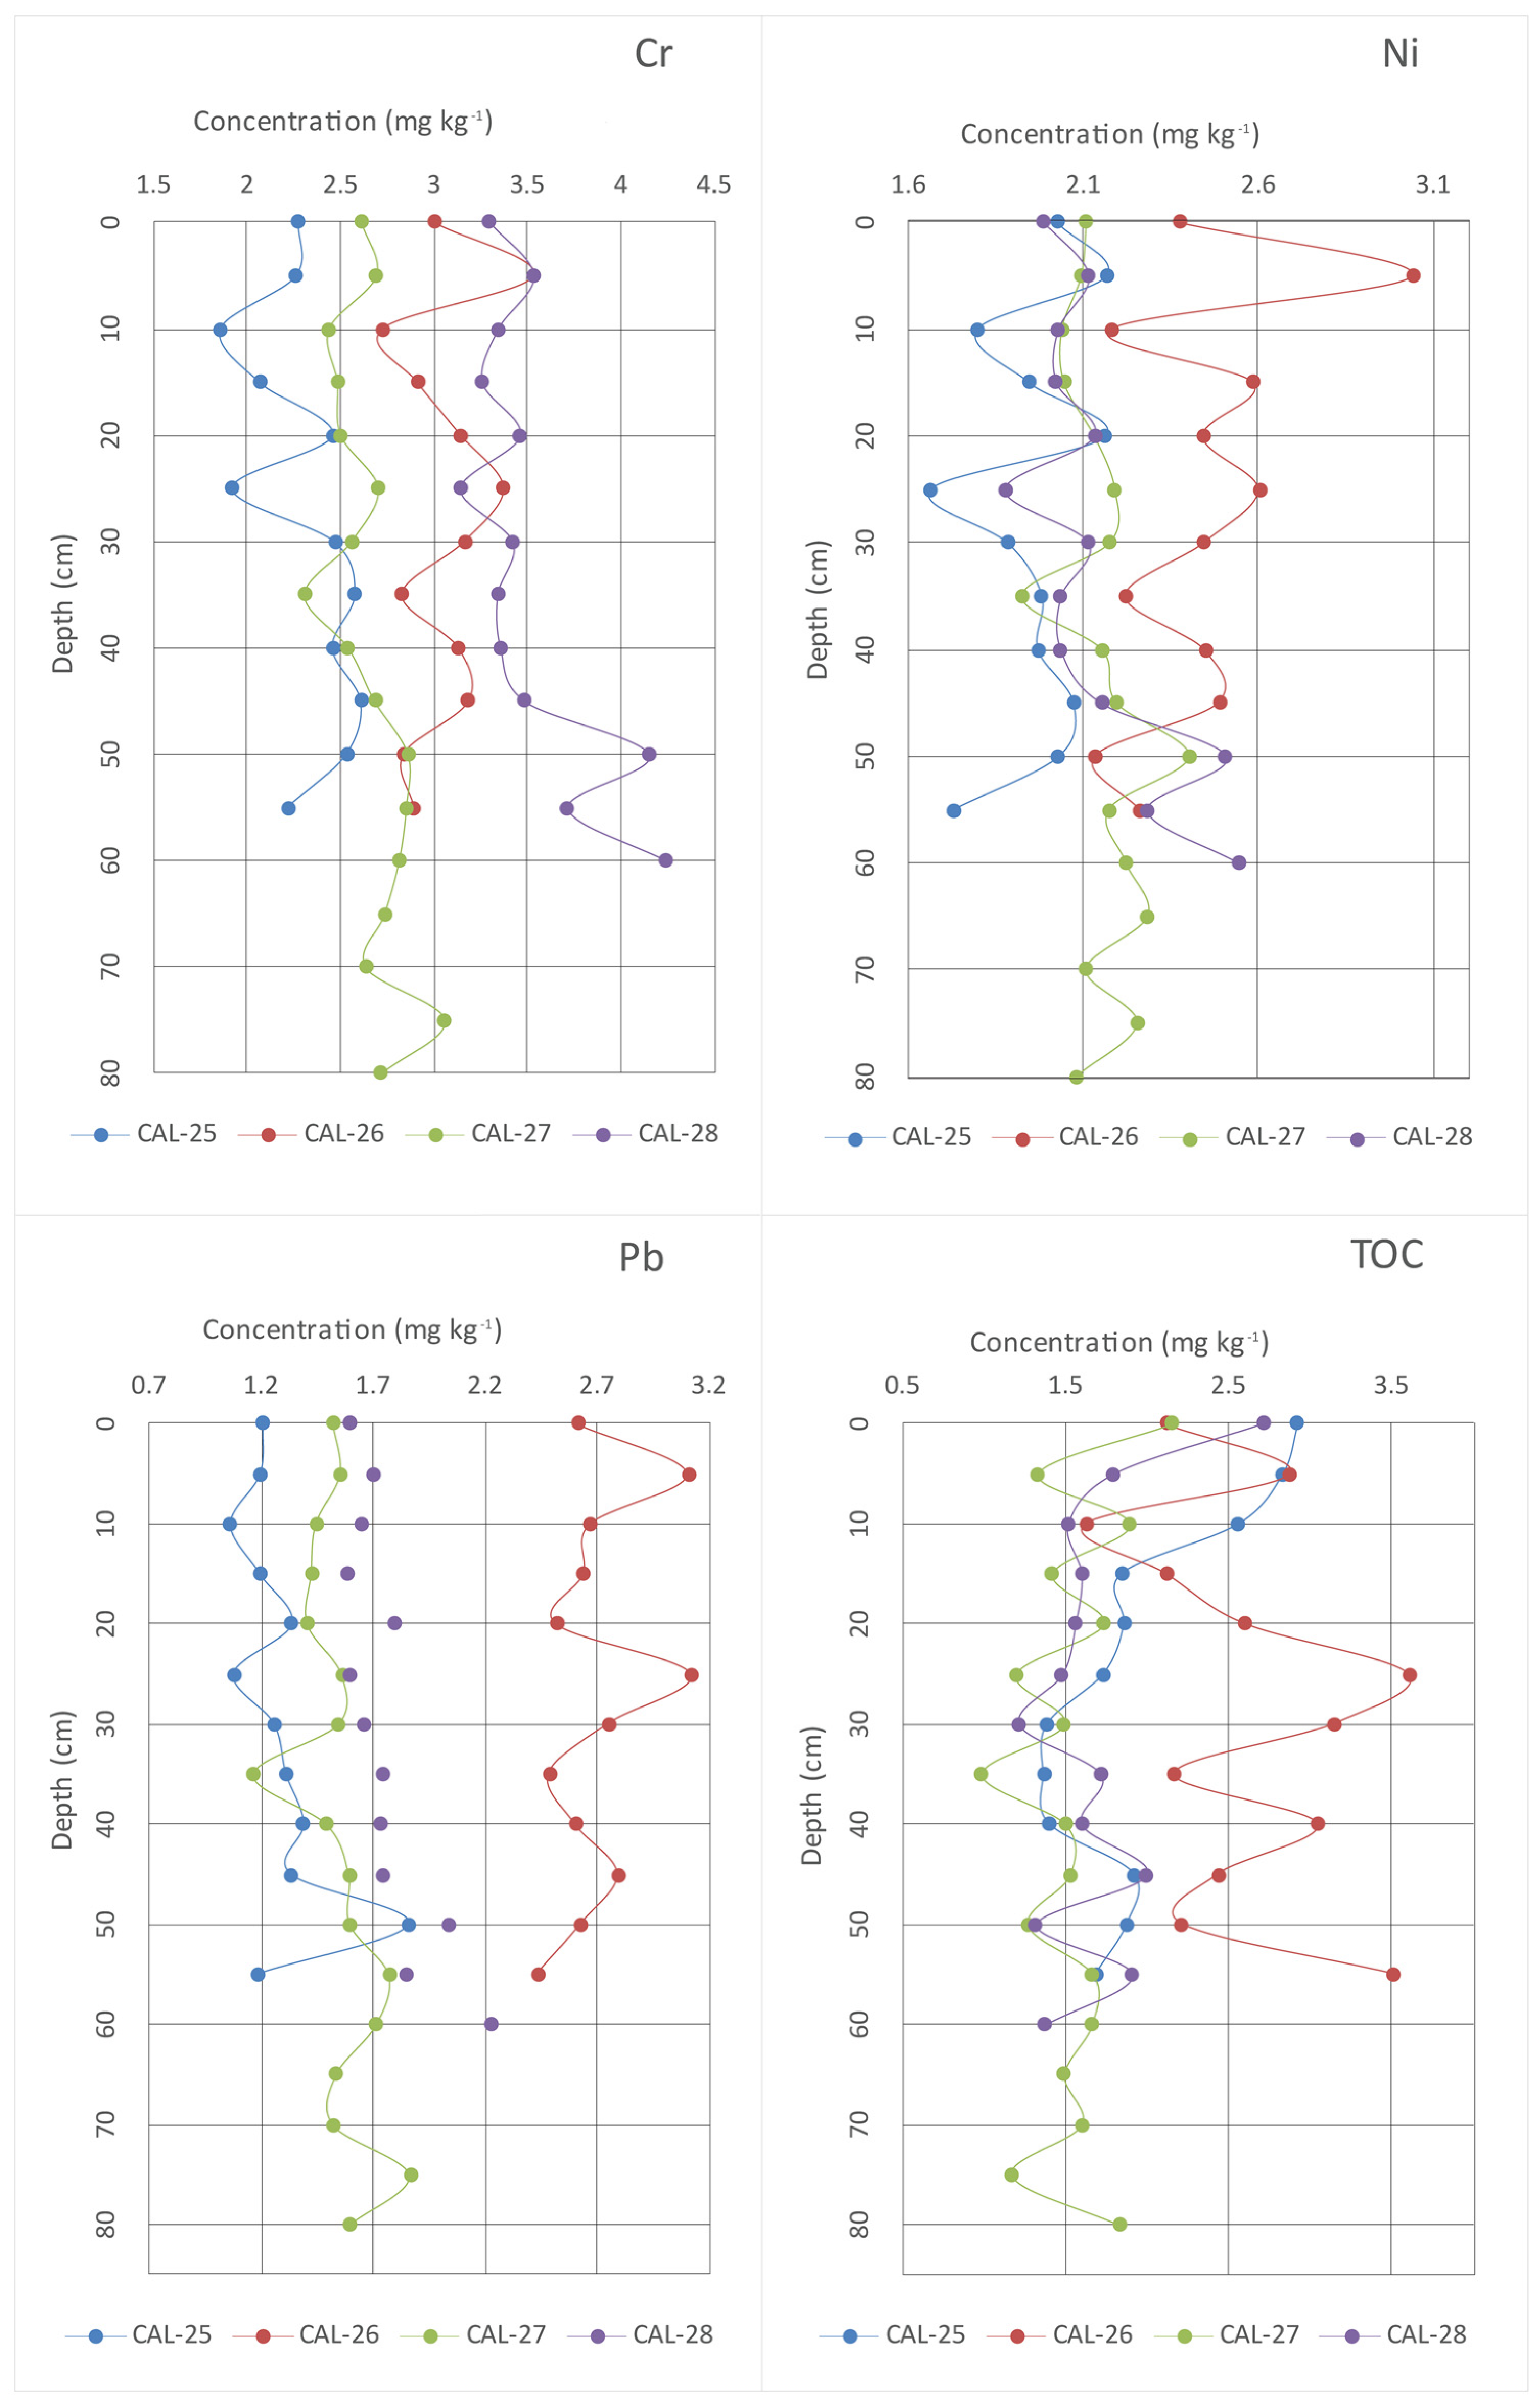
3.2. Sediment Analyses
4. Conclusions
Supplementary Materials
Author Contributions
Funding
Data Availability Statement
Acknowledgments
Conflicts of Interest
References
- Lee, C.; Wakeham, S.G. Organic Matter in Seawater: Biogeochemical Processes; Academic Press: Cambridge, MA, USA, 1988. [Google Scholar]
- Razak, I.S.; Tan, Z.Z.; Nor, Z.M.; Wahid, N.B.A.; Mushrifah, I.; Latif, M.T. Correlation between surfactants and heavy metals in a natural lake. Environ. Forensics 2013, 14, 59–68. [Google Scholar] [CrossRef]
- Massas, I.; Ehaliotis, C.; Gerontidis, S.; Sarris, E. Elevated heavy metal concentrations in top soils of an Aegean island town (Greece): Total and available forms, origin and distribution. Environ. Monit. Assess. 2009, 151, 105–116. [Google Scholar] [CrossRef]
- Gaillardet, J.; Viers, J.; Dupré, B. Trace elements in river waters. Treatise Geochem. 2003, 5, 605. [Google Scholar]
- Nieboer, E.; Richardson, D.H. The replacement of the nondescript term ‘heavy metals’ by a biologically and chemically significant classification of metal ions. Environ. Pollut. Ser. B Chem. Phys. 1980, 1, 3–26. [Google Scholar] [CrossRef]
- Stavreva Veselinovska, S.; Zivanovic, J.; Gokik, M. Toxic influence of excessive concentrations of some haevy metals upon anthocians, flavonoids, and phenols in pepper (Capsicum annuum) as a vegetable. Nat. Montenegrina 2007, 2, 527–534. [Google Scholar]
- Besser, J.M.; Leib, K.J. Toxicity of metals in water and sediment to aquatic biota. In Integrated Investigations of Environmental Effects of Historical Mining in the Animas River Watershed, San Juan County, Colorado; Church, S.E., Von Guerard, P., Finger, S.E., Eds.; US Department of the Interior, US Geological Survey: Reston, VA, USA, 2007. [Google Scholar]
- Hooda, P.S. (Ed.) Assessing bioavailability of soil trace elements. In Trace Elements in Soils; John Wiley & Sons: Hoboken, NJ, USA, 2010; pp. 227–265. [Google Scholar]
- Vdović, N.; Lučić, M.; Mikac, N.; Bačić, N. Partitioning of Metal Contaminants between Bulk and Fine-Grained Fraction in Freshwater Sediments: A Critical Appraisal. Minerals 2021, 11, 603. [Google Scholar] [CrossRef]
- Martinčić, D.; Kwokal, Ž.; Branica, M. Distribution of zinc, lead, cadmium and copper between different size fractions of sediments II. The Krka River Estuary and the Kornati Islands (Central Adriatic Sea). Sci. Total Environ. 1990, 95, 217–225. [Google Scholar] [CrossRef]
- Fabbri, D.; Gabbianelli, G.; Locatelli, C.; Lubrano, D.; Trombini, C.; Vassura, I. Distribution of Mercury and Other Heavy Metals in Core Sediments of the Northern Adriatic Sea. Water Air Soil Pollut. 2001, 129, 143–153. [Google Scholar] [CrossRef]
- Calace, N.; Cardellicchio, N.; Petronio, B.; Pietrantonio, M.; Pietroletti, M. Metal distribution in sediments from the Adriatic Sea. Toxicol. Environ. Chem. 2010, 92, 1065–1081. [Google Scholar] [CrossRef]
- Mikulic, N.; Orescanin, V.; Elez, L.; Pavicic, L.; Pezelj, D.; Lovrencic, I.; Lulic, S. Distribution of trace elements in the coastal sea sediments of Maslinica Bay, Croatia. Environ. Geol. 2008, 53, 1413–1419. [Google Scholar] [CrossRef]
- Filgueiras, A.V.; Lavilla, I.; Bendicho, C. Chemical sequential extraction for metal partitioning in environmental solid samples. J. Environ. Monit. 2002, 4, 823–857. [Google Scholar] [CrossRef] [PubMed]
- Tessier, A.; Campbell, P.G.C.; Bisson, M. Sequential extraction procedure for the speciation of particulate trace metals. Anal. Chem. 1979, 51, 844–851. [Google Scholar] [CrossRef]
- John, D.; Leventhal, J. Bioavailability of metals. In Preliminary Compilation of Descriptive Geoenvironmental Mineral Deposit Models; Open-File Report; U.S. Department of the Interior U.S. Geological Survey: Reston, VA, USA, 1995; Chapter 2; pp. 95–831. [Google Scholar]
- Polemio, M.; Dragone, V.; Limoni, P. Monitoring and methods to analyse the groundwater quality degradation risk in coastal karstic aquifers (Apulia, Southern Italy). Environ. Geol. 2009, 58, 299–312. [Google Scholar] [CrossRef] [Green Version]
- Post, V. Fresh and saline groundwater interaction in coastal aquifers: Is our technology ready for the problems ahead? Hydrogeol. J. 2005, 13, 120–123. [Google Scholar] [CrossRef]
- Kadić, A.; Dadić, A.; Slatina, I.; Duplančić-Leder, T.; Jukić, D.; Denić-Jukić, V. Hydrological functioning of three karst springs located in the Cetina River catchment in Croatia. Geophys. Res. Abstr. EGU Gen. Assem. 2019, 21, 1. [Google Scholar]
- Bonacci, O.; Roje-Bonacci, T. Hidrološke promjene duž toka rijeke Cetine. Hrvat. Vode 2001, 37, 395–408. [Google Scholar]
- Veress, M. Covered Karsts; Springer geology; Springer: Dordrecht, The Netherlands, 2016; ISBN 978-94-017-7518-2. [Google Scholar]
- Bakalowicz, M. The epikarst, the skin of karst. Epikarst. Spec. Publ. 2004, 9, 16–22. [Google Scholar]
- Williams, P.W. The role of the epikarst in karst and cave hydrogeology: A review. Int. J. Speleol. 2008, 37, 4687. [Google Scholar] [CrossRef] [Green Version]
- Stroj, A.; Briški, M.; Oštrić, M. Study of groundwater flow properties in a karst system by coupled analysis of diverse environmental tracers and discharge dynamics. Water 2020, 12, 2442. [Google Scholar] [CrossRef]
- Ford, D.; Williams, P.D. Karst Hydrogeology and Geomorphology; John Wiley & Sons: Hoboken, NJ, USA, 2007. [Google Scholar]
- Goldscheider, N.; Drew, D. Methods in Karst Hydrogeology; IAH: International Contributions to Hydrogeology, 26; CRC Press: Boca Raton, FL, USA, 2014. [Google Scholar]
- Matić, N.; Maldini, K.; Cuculić, V.; Frančišković-Bilinski, S. Investigations of karstic springs of the Biokovo Mt from the Dinaric karst of Croatia. Geochemistry 2012, 72, 179–190. [Google Scholar] [CrossRef]
- Filipović, M.; Frangen, T.; Terzić, J.; Lukač Reberski, J. Hydrogeology of a complex karst catchment in Southern Dalmatia (Croatia) and Western Herzegovina (Bosnia and Herzegovina). J. Maps 2022, 1–12. [Google Scholar] [CrossRef]
- Shahbazbegian, M.; Noori, R. Hydropolitical System Archetypes: Feedback Structures, Physical Environments, Unintended Behaviors, and a Diagnostic Checklist. Hydrology 2022, 9, 207. [Google Scholar] [CrossRef]
- Feeser, I.; O’Connell, M. Fresh insights into long-term changes in flora, vegetation, land use and soil erosion in the karstic environment of the Burren, western Ireland. J. Ecol. 2009, 97, 1083–1100. [Google Scholar] [CrossRef]
- Bakalowicz, M. Karst groundwater: A challenge for new resources. Hydrogeol. J. 2005, 13, 148–160. [Google Scholar] [CrossRef]
- Goldscheider, N.; Madl-Szonyi, J.; Eross, A.; Schill, E. Review: Thermal water resources in carbonate rock aquifers. Hydrogeol. J. 2010, 18, 1303–1318. [Google Scholar] [CrossRef] [Green Version]
- Goldscheider, N. A holistic approach to groundwater protection and ecosystem services in karst terrains. Carbonates Evaporites 2019, 34, 1241–1249. [Google Scholar] [CrossRef]
- Hartmann, J.; Jansen, N.; Duerr, H.H.; Kempe, S.; Koehler, P. Global CO2-consumption by chemical weathering: What is the contribution of highly active weathering regions. Glob. Planet. Chang. 2009, 69, 185–194. [Google Scholar] [CrossRef] [Green Version]
- Liu, Z.H.; Dreybrodt, W.; Wang, H.J. A new direction in effective accounting for the atmospheric CO2 budget: Considering the combined action of carbonate dissolution, the global water cycle and photosynthetic uptake of DIC by aquatic organisms. Earth Sci. Rev. 2010, 99, 162–172. [Google Scholar] [CrossRef]
- Clements, R.; Sodhi, N.S.; Schilthuizen, M.; Ng, P.K.L. Limestone karsts of Southeast Asia: Imperiled arks of biodiversity. Bioscience 2006, 56, 733–742. [Google Scholar] [CrossRef] [Green Version]
- Gasparatos, D. Soil Contamination by Heavy Metals and Metalloids. Environments 2022, 9, 32. [Google Scholar] [CrossRef]
- Guidance Document No. 25: Guidance On Chemical Monitoring of Sediment and Biota Under The Water Framework Directive, Common Implementation Strategy for The Water Framework Directive (2000/60/EC). 2010. Available online: https://circabc.europa.eu/sd/a/7f47ccd9-ce47-4f4a-b4f0-cc61db518b1c/Guidance%20No%2025%20-%20Chemical%20Monitoring%20of%20Sediment%20and%20Biota.pdf (accessed on 1 February 2023).
- Gupta, S.K. Modern Hydrology and Sustainable Water Development; Wiley & Sons—Blackwell Publishing: Hoboken, NJ, USA, 2011. [Google Scholar]
- Boyd, C.E. Carbon Dioxide, pH and Alkalinity. In Water Quality; Springer: Cham, Switzerland, 2020. [Google Scholar] [CrossRef]
- Piper, A. A graphic procedure in the geochemical interpretation of water-analyses. Eos Trans. Am. Geophys. Union 1944, 25, 914–928. [Google Scholar] [CrossRef]
- Taylor, S. Abundance of chemical elements in the continental crust: A new table. Geochim. Cosmochim. Acta 1964, 28, 1273–1285. [Google Scholar] [CrossRef]
- Din, Z. Use of aluminium to normalize heavy-metal data from estuarine and coastal sediments of Straits of Melaka. Mar. Pollut. Bull. 1992, 24, 484–491. [Google Scholar] [CrossRef]
- Covelli, S.; Fontolan, G. Application of a normalization procedure in determining regional geochemical baselines. Environ. Geol. 1997, 30, 34–45. [Google Scholar] [CrossRef]
- Uścinowicz, S.; Szefer, P.; Sokołowski, K. Trace elements in the Baltic Sea sediments. In Geochemistry of Baltic Sea Sediments; Polish Geological Institute-National Research Institute: Warsaw, Poland, 2011; pp. 214–274. [Google Scholar]
- Matić, N.; Miklavčić, I.; Maldini, K.; Tomas, D.; Cuculić, V.; Cardellini, C.; Frančišković-Bilinski, S. Geochemical and isotopic characteristics of karstic springs in coastal mountains (Southern Croatia). J. Geochem. Explor. 2013, 132, 90–110. [Google Scholar] [CrossRef]
- Noori, R.; Ansari, E.; Jeong, Y.-W.; Aradpour, S.; Maghrebi, M.; Hosseinzadeh, M.; Bateni, S.M. Hyper-Nutrient Enrichment Status in the Sabalan Lake, Iran. Water 2021, 13, 2874. [Google Scholar] [CrossRef]
- Noori, R.; Woolway, R.I.; Saari, M.; Pulkkanen, M.; Klove, B. Six decades of thermal change in a pristine lake situated north of the Arctic Circle. Water Resour. Res. 2022, 58, e2021WR031543. [Google Scholar] [CrossRef]
- Matić, N.; Maldini, K.; Tomas, D.; Ćuk, R.; Milović, S.; Miklavčić, I.; Širac, S. Geochemical characteristics of the Gacka River karstic springs (Dinaric karst, Croatia) with macroinvertebrate assemblages’ overview. Environ. Earth Sci. 2016, 75, 1308. [Google Scholar] [CrossRef]
- Fiket, Ž. Geokemijske Značajke Sedimenata Područja Novigradskog Mora. Ph.D. Thesis, University of Zagreb, Zagreb, Croatia, 2013. [Google Scholar]
- Aradpour, S.; Noori, R.; Naseh, M.R.V.; Hosseinzadeh, M.; Safavi, S.; Ghahraman-Rozegar, F.; Maghrebi, M. Alarming carcinogenic and non-carcinogenic risk of heavy metals in Sabalan dam reservoir, Northwest of Iran. Environ. Pollut. Bioavailab. 2021, 33, 278–291. [Google Scholar] [CrossRef]
- Brumelis, G.; Lapilla, L.; Nikodemus, O.; Tabors, G. Use of an artificial model of monitoring data to aid interpretation of principal component analysis. Environ. Model. Softw. 2000, 15, 755–763. [Google Scholar] [CrossRef]
- Hair, J.F.; Anderson, R.E.; Babin, B.J.; Black, W.C. Multivariate Data Analysis: A Global Perspective; Pearson Education: London, UK, 2010; Volume 7. [Google Scholar]
- Salminen, R.; Batista, M.J.; Bidovec, M.; Demetriades, A.; De Vivo, B.; De Vos, W.; Duris, M.; Gilucis, A.; Gregorauskiene, V.; Halamic, J.; et al. Part 1—Background information, methodology and maps. In Geochemical Atlas of Europe; Geological Survey of Finland: Espoo, Finland, 2005. [Google Scholar]
- Aradpour, S.; Noori, R.; Tang, Q.; Bhattarai, R.; Hooshyaripor, F.; Hosseinzadeh, M.; Haghighi, A.T.; Klöve, B. Metal contamination assessment in water column and surface sediments of a warm monomictic man-made lake: Sabalan Dam Reservoir, Iran. Hydrol. Res. 2020, 51, 799–814. [Google Scholar] [CrossRef]
- Cohuo, S.; Moreno-López, A.; Escamilla-Tut, N.Y.; Pérez-Tapia, A.M.; Santos-Itzá, I.; Macario-González, L.A.; Villegas-Sánchez, C.A.; Medina-Quej, A. Assessment of Water Quality and Heavy Metal Environmental Risk on the Peri-Urban Karst Tropical Lake La Sabana, Yucatán Peninsula. Water 2023, 15, 390. [Google Scholar] [CrossRef]
- Vučković, I.; Štulac, M.; Kereković, A.; Pletikapić, Z.; Vidaković, I.; Čargonja Reicher, K.; Botušić Brebrić, J.; Dorić, V.; Goja, L.; Plantak, M.; et al. D. KKPE Peruća, Studija o Utjecaju na Okoliš; Elektroprojekt Zagreb: Zagreb, Croatia, 2016. [Google Scholar]
- Dunn, O.J.; Clark, V.A. Applied Statistics: Analysis of Variance and Regression; Wiley: New York, NY, USA, 1974. [Google Scholar]
- Lovrenčić Mikelić, I.; Oreščanin, V.; Barišić, D. Distribution and origin of major, minor, and trace elements in sediments and sedimentary rocks of the Kasštela Bay (Croatia) coastal area. J. Geochem. Explor. 2013, 128, 1–13. [Google Scholar] [CrossRef]
- Nodefarahani, M.; Aradpour, S.; Noori, R.; Tang, Q.; Partani, S.; Klöve, B. Metal pollution assessment in surface sediments of Namak Lake, Iran. Environ. Sci. Pollut. Res. 2020, 27, 45639–45649. [Google Scholar] [CrossRef] [PubMed]
- Durn, G. Terra rossa in the Mediterranean region: Parent materials, composition and origin. Geol. Croat. 2003, 56, 83–100. [Google Scholar] [CrossRef]


| a | b | ||||||
|---|---|---|---|---|---|---|---|
| Factor—1 | Factor—2 | Factor—3 | Factor—1 | Factor—2 | Factor—3 | ||
| Cl− | 0.758 | 0.137 | 0.079 | TDS | 0.897 | 0.340 | 0.204 |
| SO42− | 0.617 | 0.092 | 0.589 | NO3− | 0.047 | 0.900 | 0.169 |
| TOC | 0.871 | 0.029 | −0.321 | Cl− | 0.939 | −0.159 | −0.071 |
| COD | 0.876 | 0.070 | −0.183 | SO42− | 0.939 | −0.089 | 0.114 |
| Fe | −0.001 | −0.912 | 0.155 | TOC | −0.344 | 0.329 | −0.057 |
| TN | −0.014 | −0.260 | 0.710 | Ca+ | 0.209 | 0.630 | 0.575 |
| TP | 0.274 | 0.002 | −0.576 | Mg+ | 0.851 | 0.201 | 0.253 |
| Zn | −0.202 | −0.905 | 0.045 | TN | 0.024 | 0.907 | −0.067 |
| Expl.Var | 2.598 | 1.752 | 1.352 | TP | −0.015 | 0.080 | −0.913 |
| Prp.Totl | 0.325 | 0.219 | 0.169 | Na+ | −0.430 | −0.231 | −0.524 |
| Expl.Var | 3.642 | 2.388 | 1.600 | ||||
| Prp.Totl | 0.364 | 0.239 | 0.160 | ||||
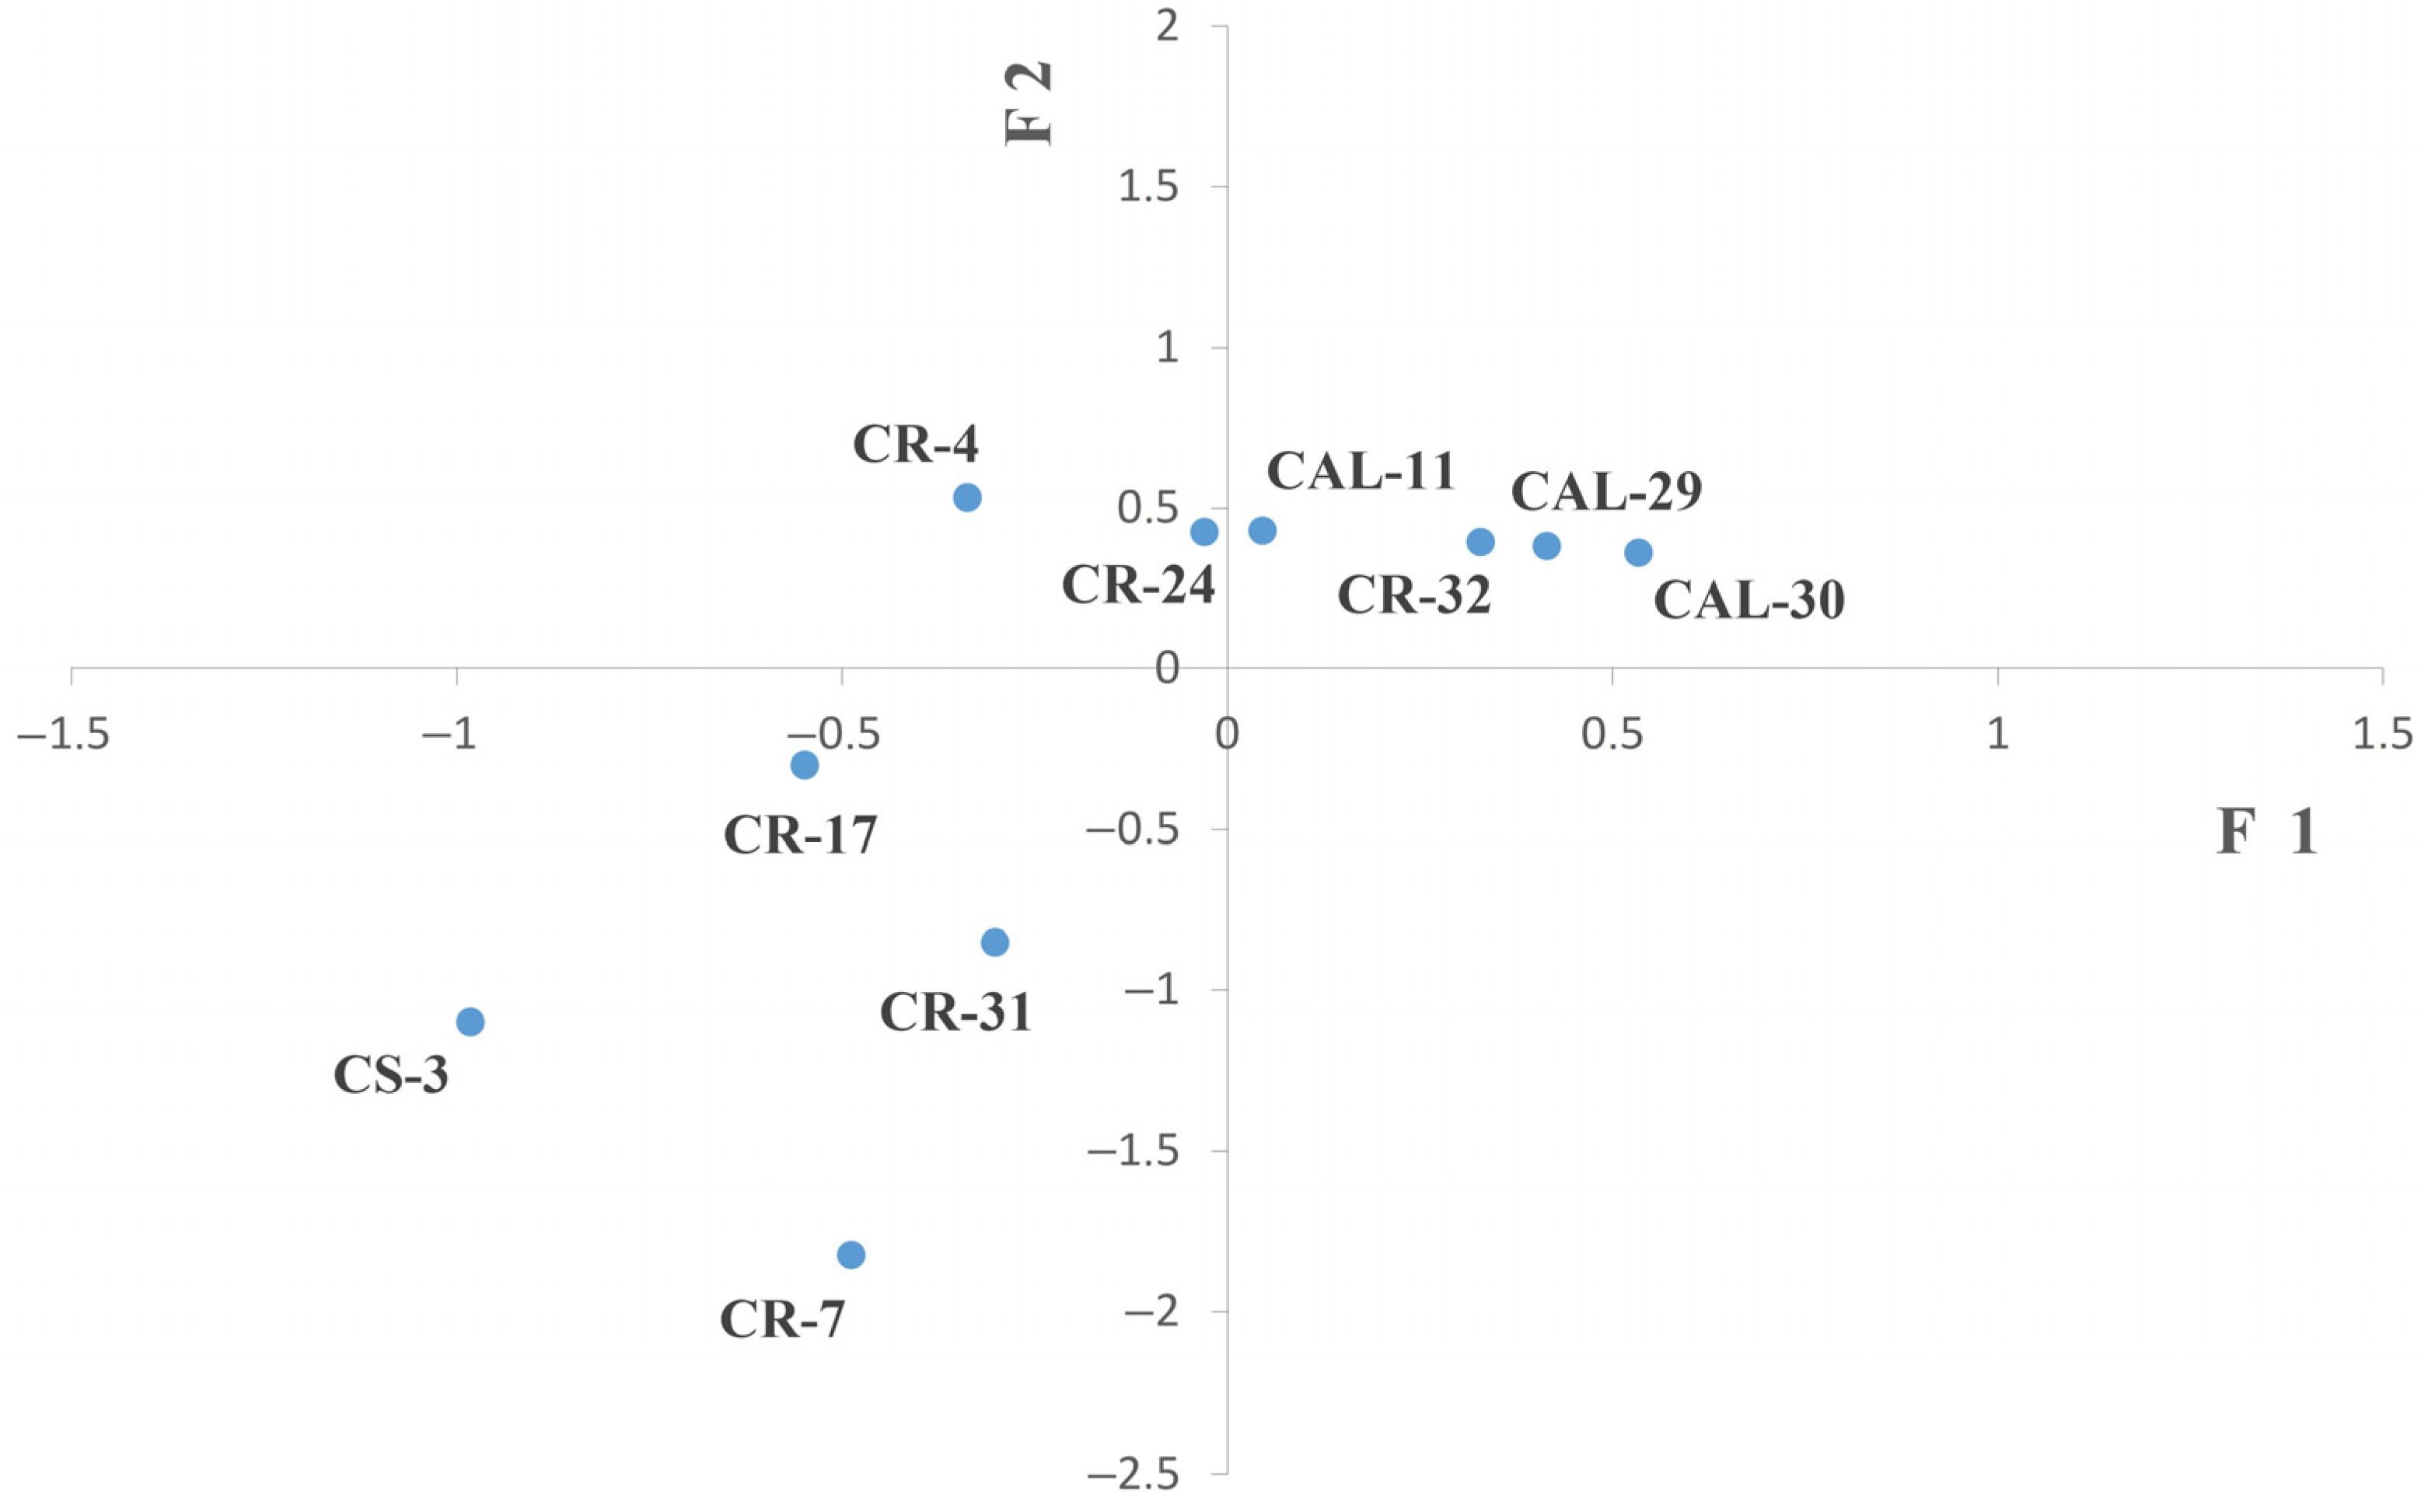
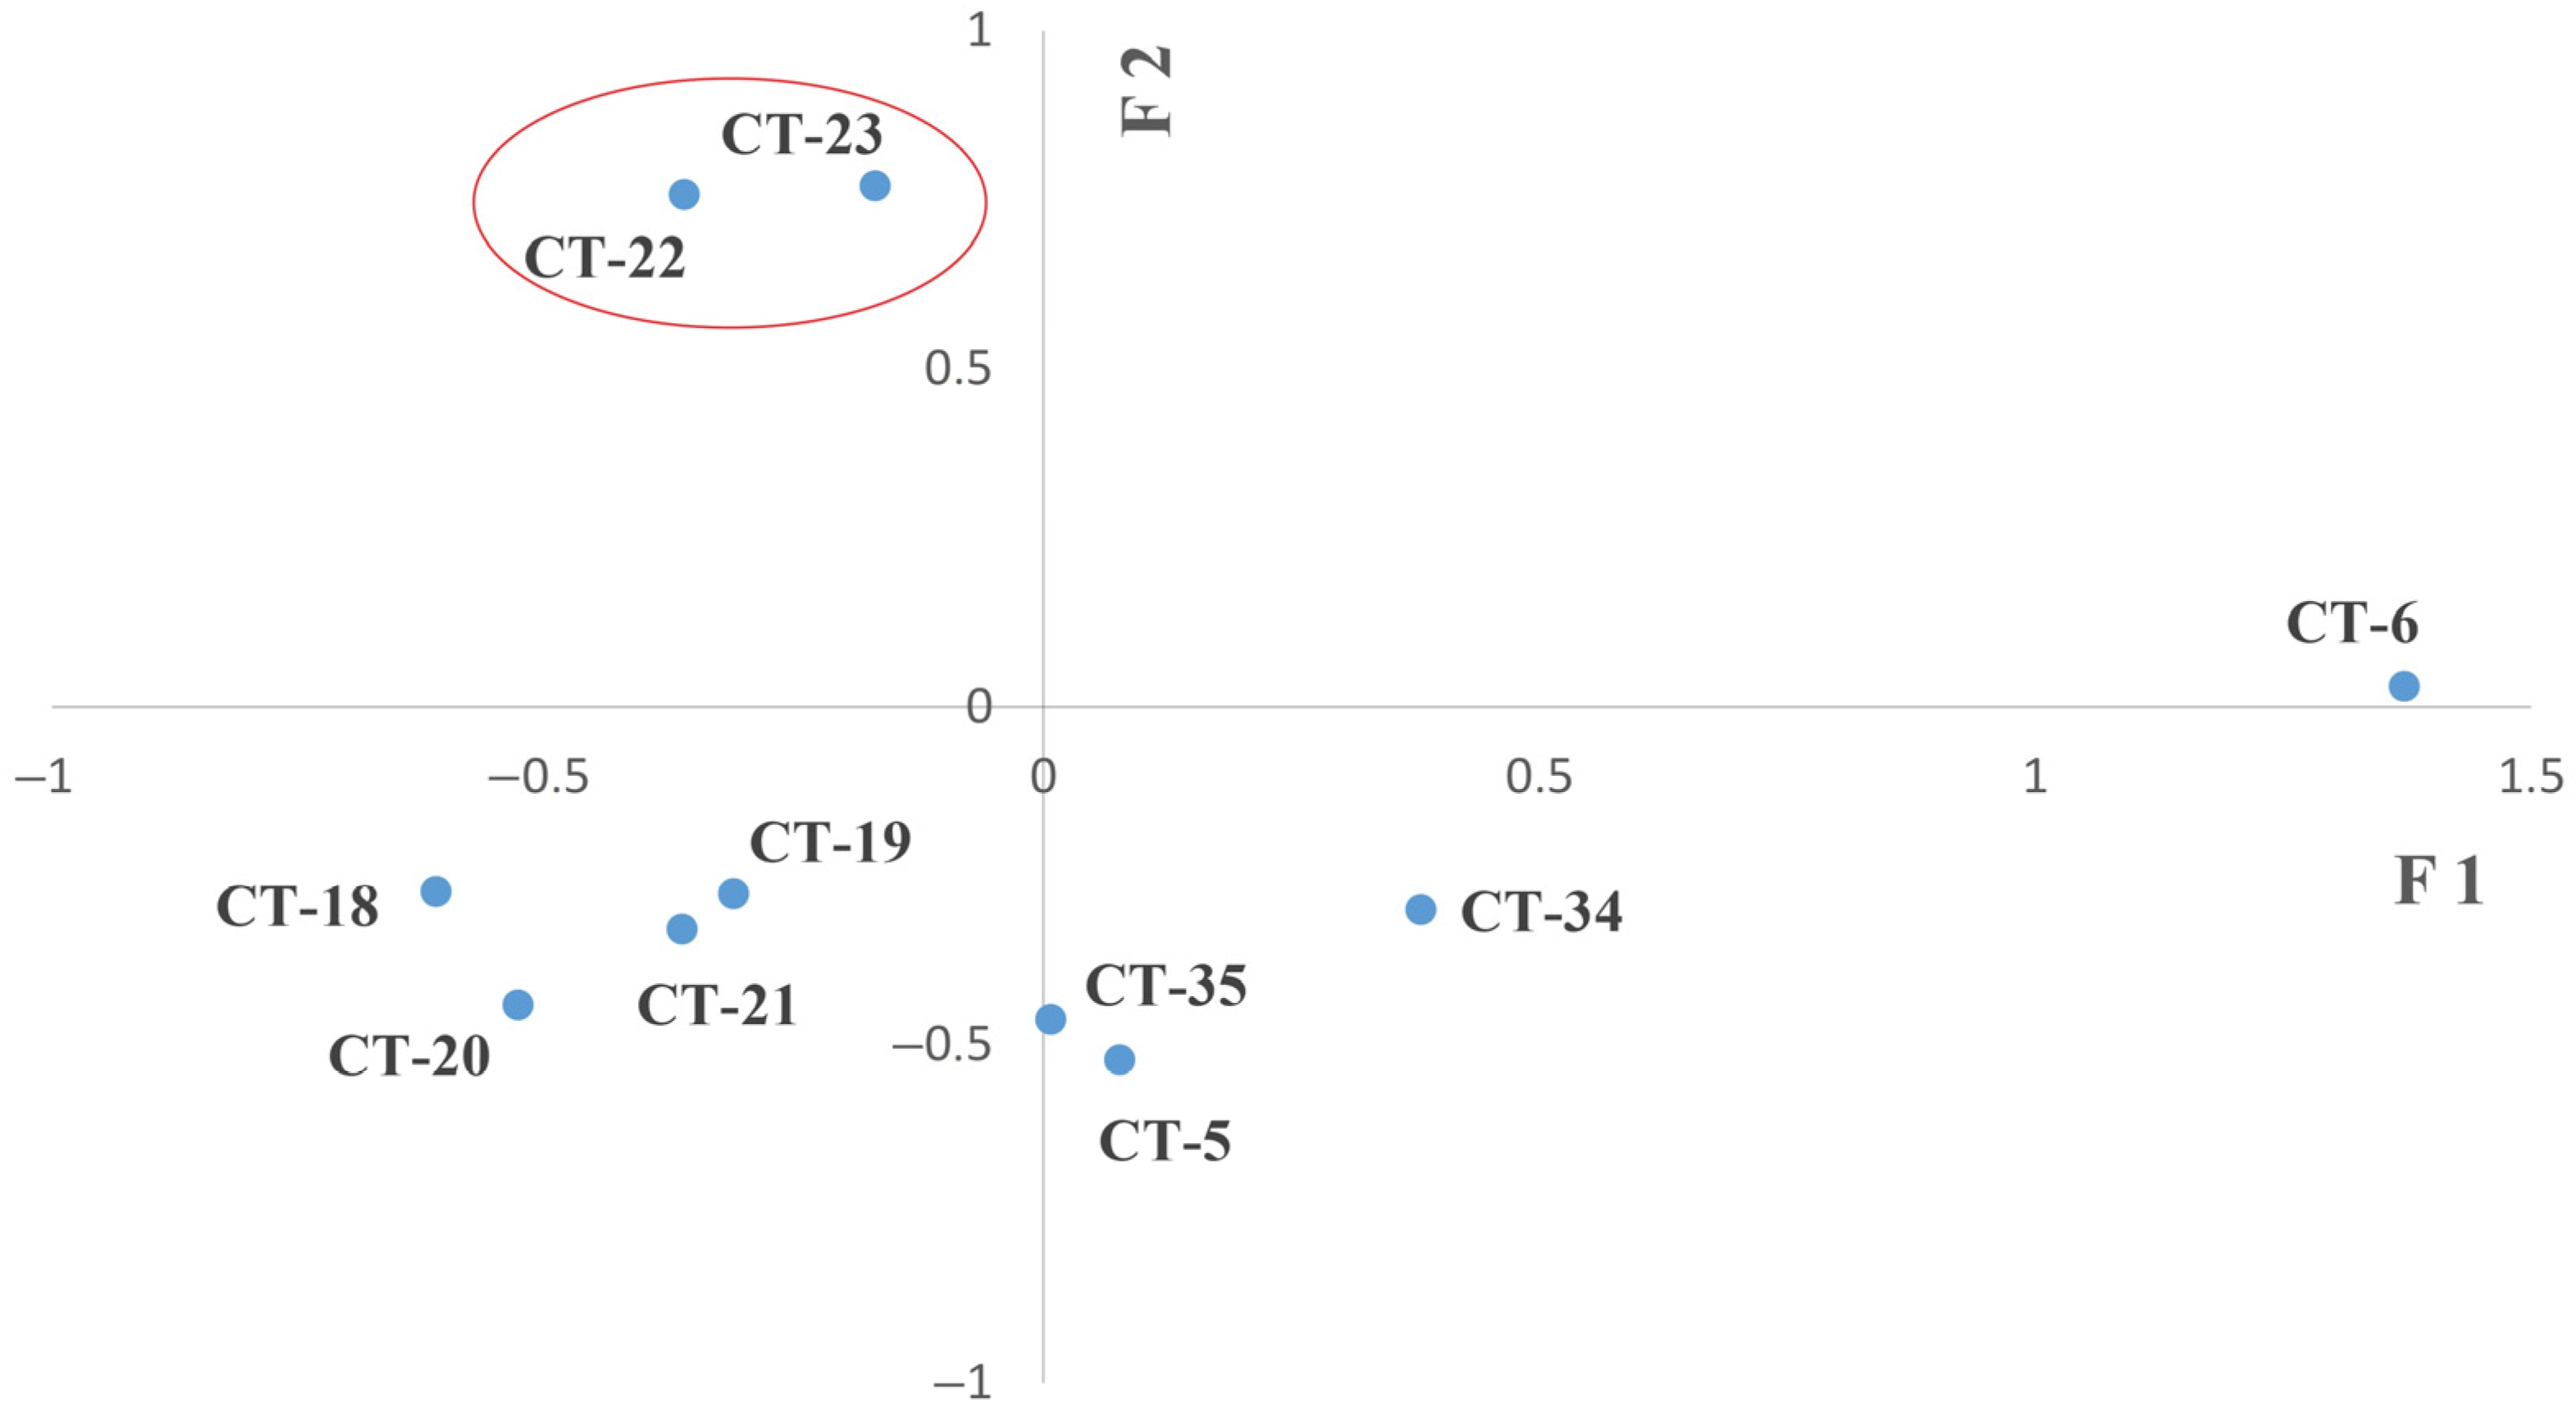
| a | b | ||||||
|---|---|---|---|---|---|---|---|
| Factor—1 | Factor—2 | Factor—3 | Factor—1 | Factor—2 | Factor—3 | ||
| CS-3 | −0.983 | −1.098 | 0.096 | CT-5 | 0.077 | −0.523 | −0.160 |
| CR-4 | −0.337 | 0.533 | −0.802 | CT-6 | 1.371 | 0.030 | −0.571 |
| CR-7 | −0.488 | −1.825 | −0.549 | CT-18 | −0.612 | −0.273 | −0.100 |
| CAL-11 | 0.046 | 0.430 | 0.014 | CT-19 | −0.313 | −0.277 | 1.110 |
| CR-17 | −0.549 | −0.299 | −0.260 | CT-20 | −0.530 | −0.440 | −0.381 |
| CR-24 | −0.030 | 0.427 | −0.491 | CT-21 | −0.364 | −0.329 | −0.221 |
| CR-29 | 0.414 | 0.383 | 0.109 | CT-22 | −0.363 | 0.758 | −0.368 |
| CAL-30 | 0.534 | 0.361 | 0.072 | CT-23 | −0.170 | 0.771 | 0.061 |
| CR-31 | −0.302 | −0.851 | 0.482 | CT-34 | 0.380 | −0.300 | 0.453 |
| CR-32 | 0.329 | 0.395 | 0.849 | CT-35 | 0.007 | −0.462 | 0.530 |
Disclaimer/Publisher’s Note: The statements, opinions and data contained in all publications are solely those of the individual author(s) and contributor(s) and not of MDPI and/or the editor(s). MDPI and/or the editor(s) disclaim responsibility for any injury to people or property resulting from any ideas, methods, instructions or products referred to in the content. |
© 2023 by the authors. Licensee MDPI, Basel, Switzerland. This article is an open access article distributed under the terms and conditions of the Creative Commons Attribution (CC BY) license (https://creativecommons.org/licenses/by/4.0/).
Share and Cite
Maldini, K.; Cukrov, N.; Pikelj, K.; Matić, N.; Mlakar, M. Geochemistry of Metals and Organic Matter in Water and Sediments of the Karst River Cetina, Croatia. Water 2023, 15, 1429. https://doi.org/10.3390/w15071429
Maldini K, Cukrov N, Pikelj K, Matić N, Mlakar M. Geochemistry of Metals and Organic Matter in Water and Sediments of the Karst River Cetina, Croatia. Water. 2023; 15(7):1429. https://doi.org/10.3390/w15071429
Chicago/Turabian StyleMaldini, Krešimir, Neven Cukrov, Kristina Pikelj, Natalija Matić, and Marina Mlakar. 2023. "Geochemistry of Metals and Organic Matter in Water and Sediments of the Karst River Cetina, Croatia" Water 15, no. 7: 1429. https://doi.org/10.3390/w15071429