1. Introduction
Various types of hydrogeological responses to the passage of seismic waves from earthquakes have been recorded over a long period of standard and precision observations of groundwater levels in wells [
1,
2,
3,
4,
5]. The intensity and amplitude of hydrogeological effects depend on the parameters of the earthquake focus, epicentral distance, lithology of water-bearing rocks, hydraulic relationship between aquifers of different ages, and others. The response of groundwater to seismic impact is considered as an indicator of the deformation mode of a water-saturated reservoir. Abrupt or gradual changes in the groundwater level of various durations were noted for static (irreversible) deformation of water-saturated reservoirs [
6,
7,
8,
9]. Coseismic and postseismic variations in the pore pressure complicated with oscillations were detected for dynamic and quasi-reversible deformation of water-saturated reservoirs [
10,
11,
12].
Similar hydrogeological effects have been established during the seismic impact of large-scale explosions on the rock mass in the last century [
13,
14,
15] despite the differences in the conditions of the wave field formation. For example, water gushing from wells 101–111 m deep followed by a decrease in the groundwater level by 50 m or more was recorded over a period of six months during an underground large-scale explosion at the Semipalatinsk Test Site, at a reduced distance (
—the ratio of the epicentral distance to the cube root of the maximum explosion mass) of 1.2–1.3 m/kg
1/3 [
16]. A postseismic level rise of 3.1–6.5 m was detected at the reduced distances of 1.8 m/kg
1/3 [
17]. The pore pressure in wells 113–2134 m deep varied from 2 to 10 bar during the Milrow and Cannikin explosions on Amchitka Island at the reduced distance of 2–23 m/kg
1/3 [
18,
19,
20]. Two days after the Cannikin explosion the groundwater level decreased by 2 m at the reduced distance of 4 m/kg
1/3. Coseismic variations in the pore pressure in wells located at the reduced distances of 13-23 m/kg
1/3 were recorded.
Liquefaction under large-scale explosions was registered at high magnitudes if compared to the data obtained in earthquakes, but the dependence of seismic energy on maximal distance from the liquefaction area to the hypocenter of threshold energy persists [
21].
Seismic safety and monitoring of the geodynamic situation are the main tasks which require special attention during the field development with explosive technologies. Groundwater is a hindrance to mining activities. Intensive water inflows complicate the excavation of mine workings and create a real threat of a water breakthrough. The increased watering of the massif contributes to the activation of natural and technogenic processes and affects the microseismic noise [
22]. The results of geophysical monitoring carried out in the mines of the Khibiny massif indicate a raise in seismicity during periods of increased watering of the massif [
23].
Various methods are used to assess the hydrogeological conditions of a mine. For example, the usage of borehole telemetry and electromagnetic detection methods at a coal deposit in China made it possible to identify areas of increased watering in rocks [
24]. Drainage work to drain the roof of the excavation reduces the risk of roof falls. The measurement data taken before and after the experimental work to reduce the hydrostatic pressure indicated an increase in the apparent resistivity and a decrease in microseismic noise.
Many investigations deal with estimations of permeability of fractured rock in the zones of Chinese coal deposits under development. This parameter is considered to be the main one that controls water inflow into mine workings. Moving the front of mining activities leads to a decrease of the inflow from the zones of high fracturing that have already been formed. A simplified conceptual model of rock deformation is used to calculate the water inflow into the mining field [
25].
The studies of the impact of mass explosions on the state of water-saturated reservoirs during the development of solid mineral deposits are limited. However, an analysis of variations in the travel time of P- and S-waves, which were generated by a constantly operating vibration source over 14 months in Toyohashi (Central Japan), showed that long-term variations in seismic waves can be associated with changes in fluid saturation and reservoir fracturing [
26].
The amount of geological, hydrogeological, geophysical and geodetic measurements determines reliability of forecasting the conditions of a mineral deposit being developed. A compiled database of experimental records can be used in constructing 3D models of rock masses and assessing the effects of anthropogenic and natural factors on stability of mine workings [
27].
The importance of quantitative and qualitative assessments of the negative consequences of substantial changes of the hydrogeodynamic situation due to mass explosions in the process of developing iron ore deposits of the KMA determines the relevance of this study. For the first time, synchronous monitoring of seismic, barometric, and hydrogeological data is being carried out at sites located near the town of Gubkin (Belgorod Region, Russia) [
28]. Numerous variations in the pore pressure in the “reservoir–well” system were recorded at two observation points during mass explosions in the mine at the Korobkovskoe deposit and in the quarry at the Lebedinskoe deposit. The processing of experimental data detected a postseismic decrease in the level of groundwater [
29]. The purpose of this work was to identify the main regularities of the responses of a water-saturated reservoir to mass explosions during the development of iron ore deposits of KMA and to analyze interrelationships between the detected post-seismic effects and the conditions of the ore-crystalline rock. The object of the research was the groundwater in the zones of exogenous weathering and tectonic fracturing of the ore-crystalline basement of the Archean-Proterozoic. A complex monitoring of the activities accompanying the development of mineral deposits will allow to detect in proper time possible changes in filtration structure of the aquifer and elaborate recommendations on minimizing the risk of hazards produced by a possible increase of water inflow into the mine workings.
2. Description of the Area under Investigation
The object under study is located within the KMA megablock of the Voronezh crystalline massif [
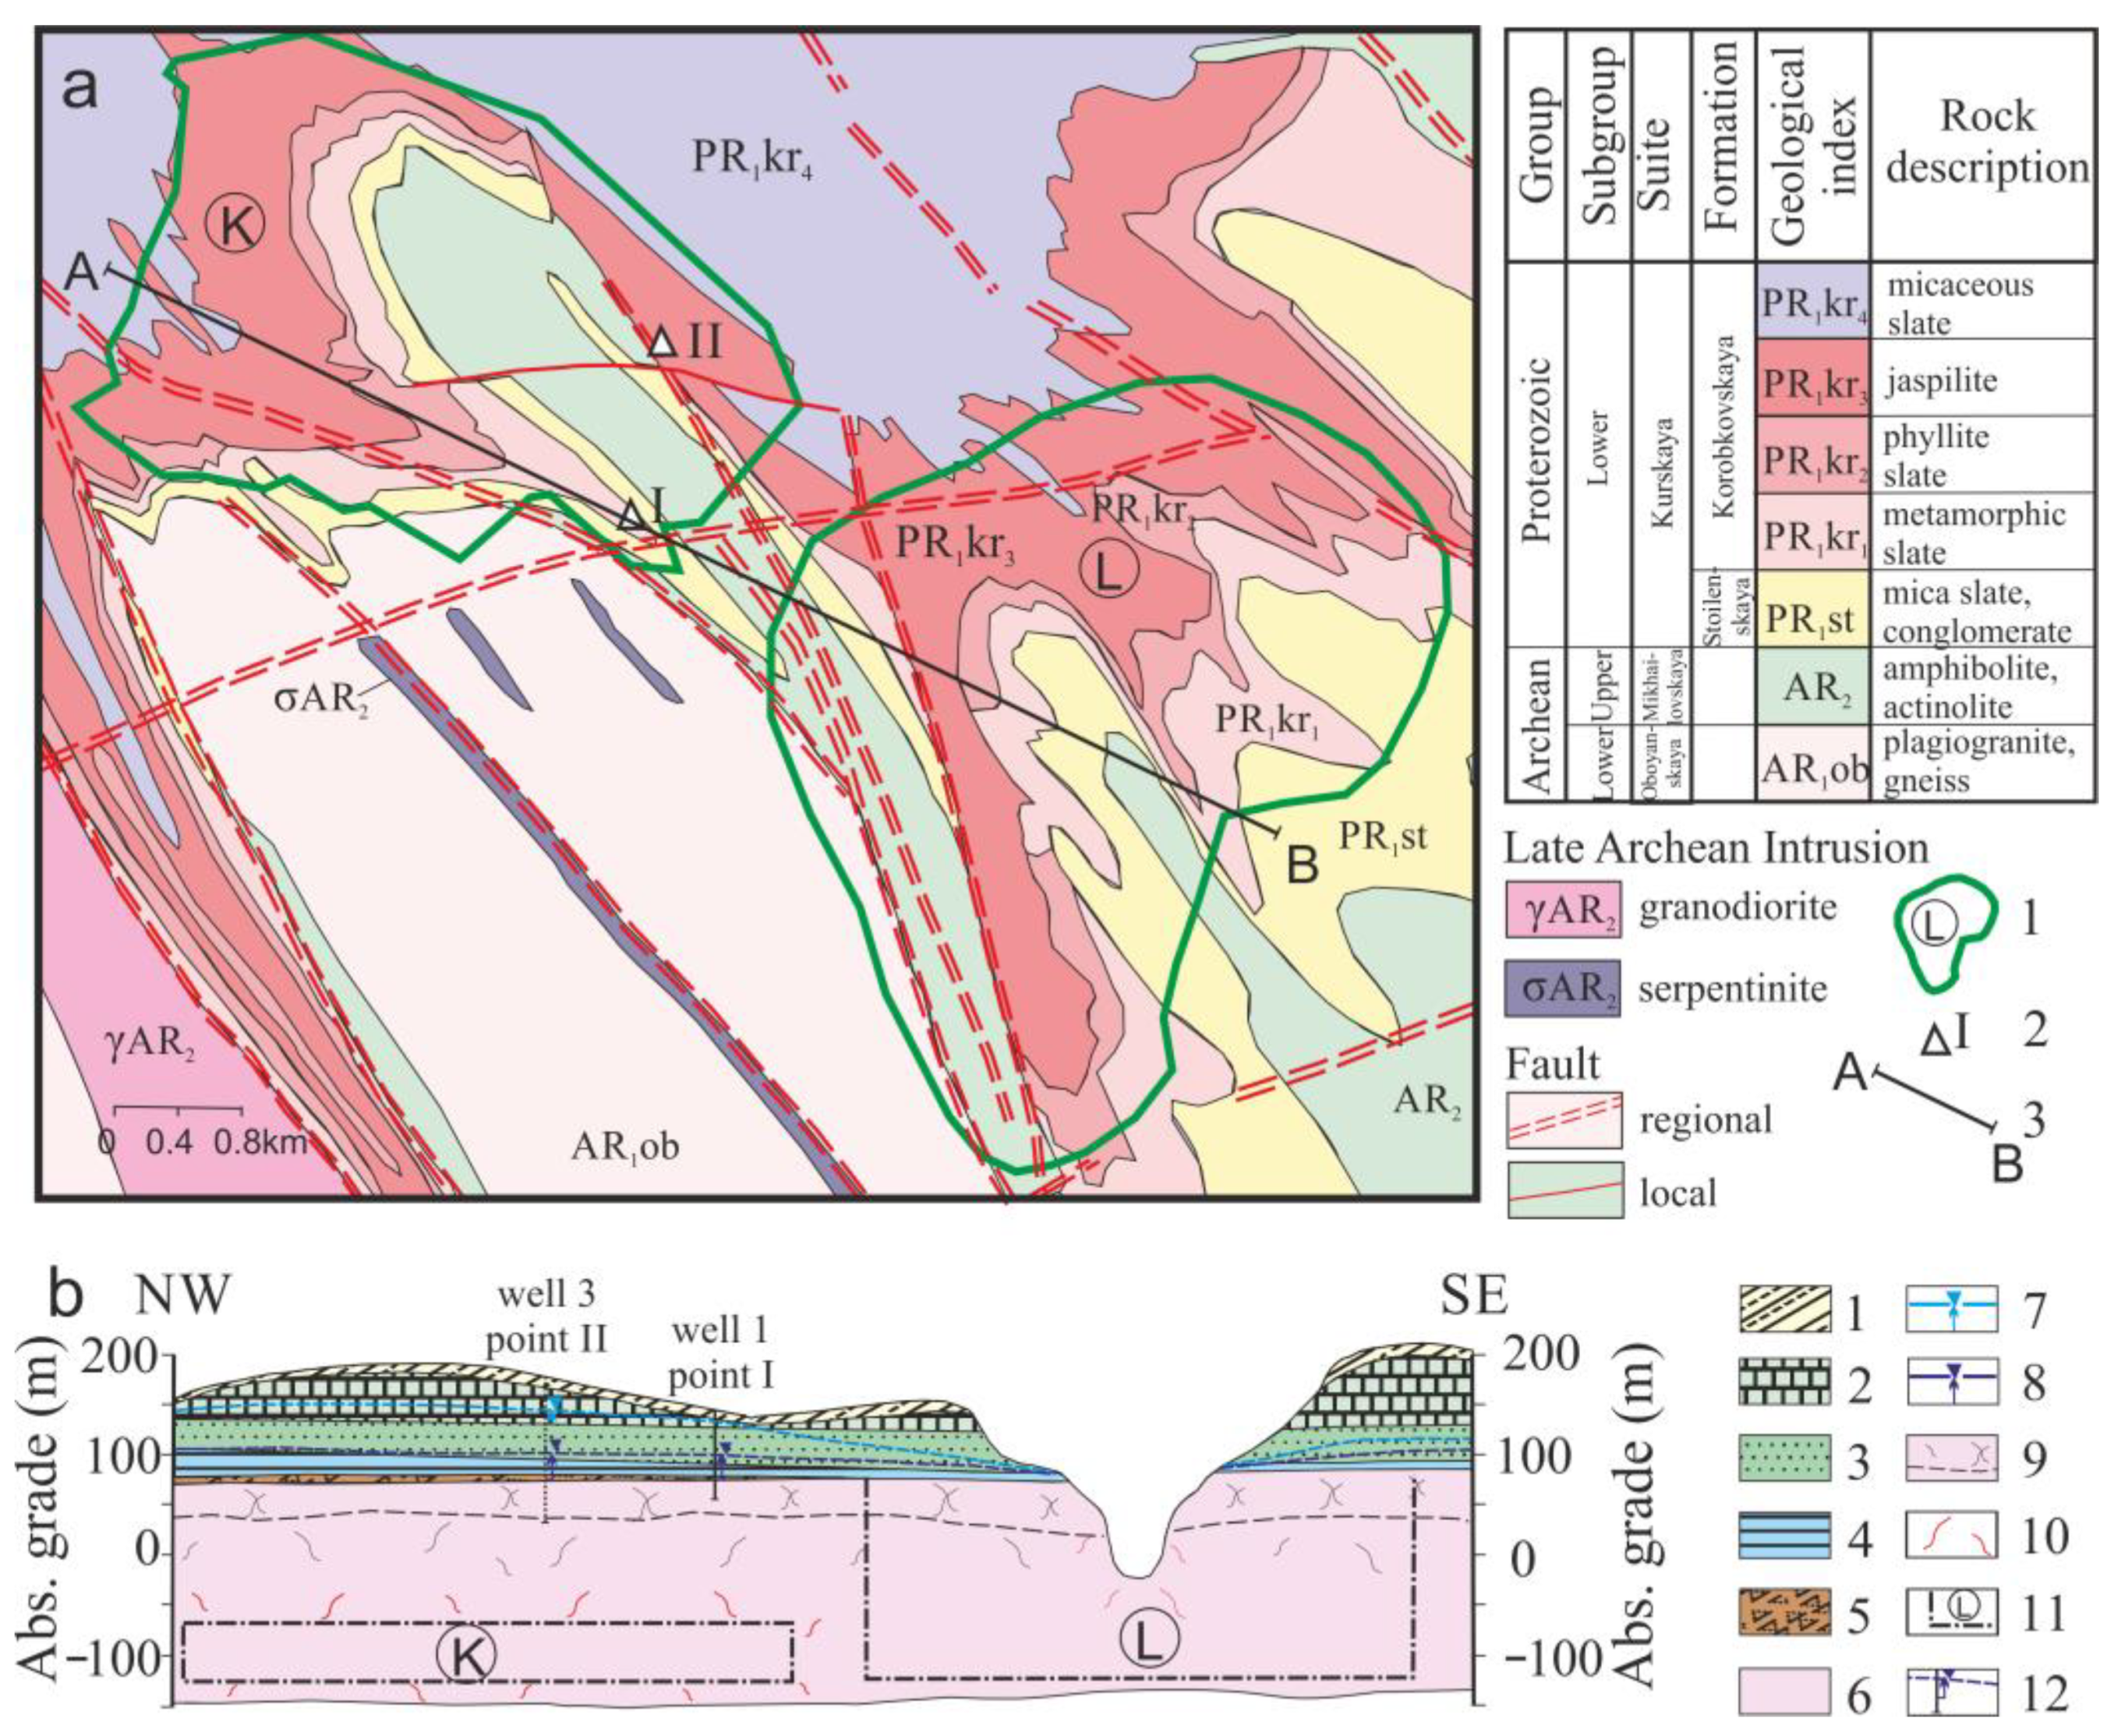
30]. The rocks of Archean-Proterozoic basement are intensively metamorphosed, crumpled into folds, and intruded by intrusive formations (
Figure 1). Archean rocks include the Lower Archean Oboyanskaya suite (AR
1ob) represented by the plagiogneisses and granite-gneisses, and the Upper Archean Mikhailovskaya suite (AR
2mh) composed of quartz porphyries and amphibolites. Two-mica slates and metasandstones of the Stoilenskaya formation of the Kurskaya suite (PR
1st) are predominantly distributed at the base of the Lower Proterozoic.
The Korobkovskaya formation is characterized by conformity bedding on the Stoilenskaya formation and is divided into four subformations: lower iron ore (PR1kr1), intermediate slate (PR1kr2), upper iron ore (PR1kr3), and upper slate (PR1kr4).
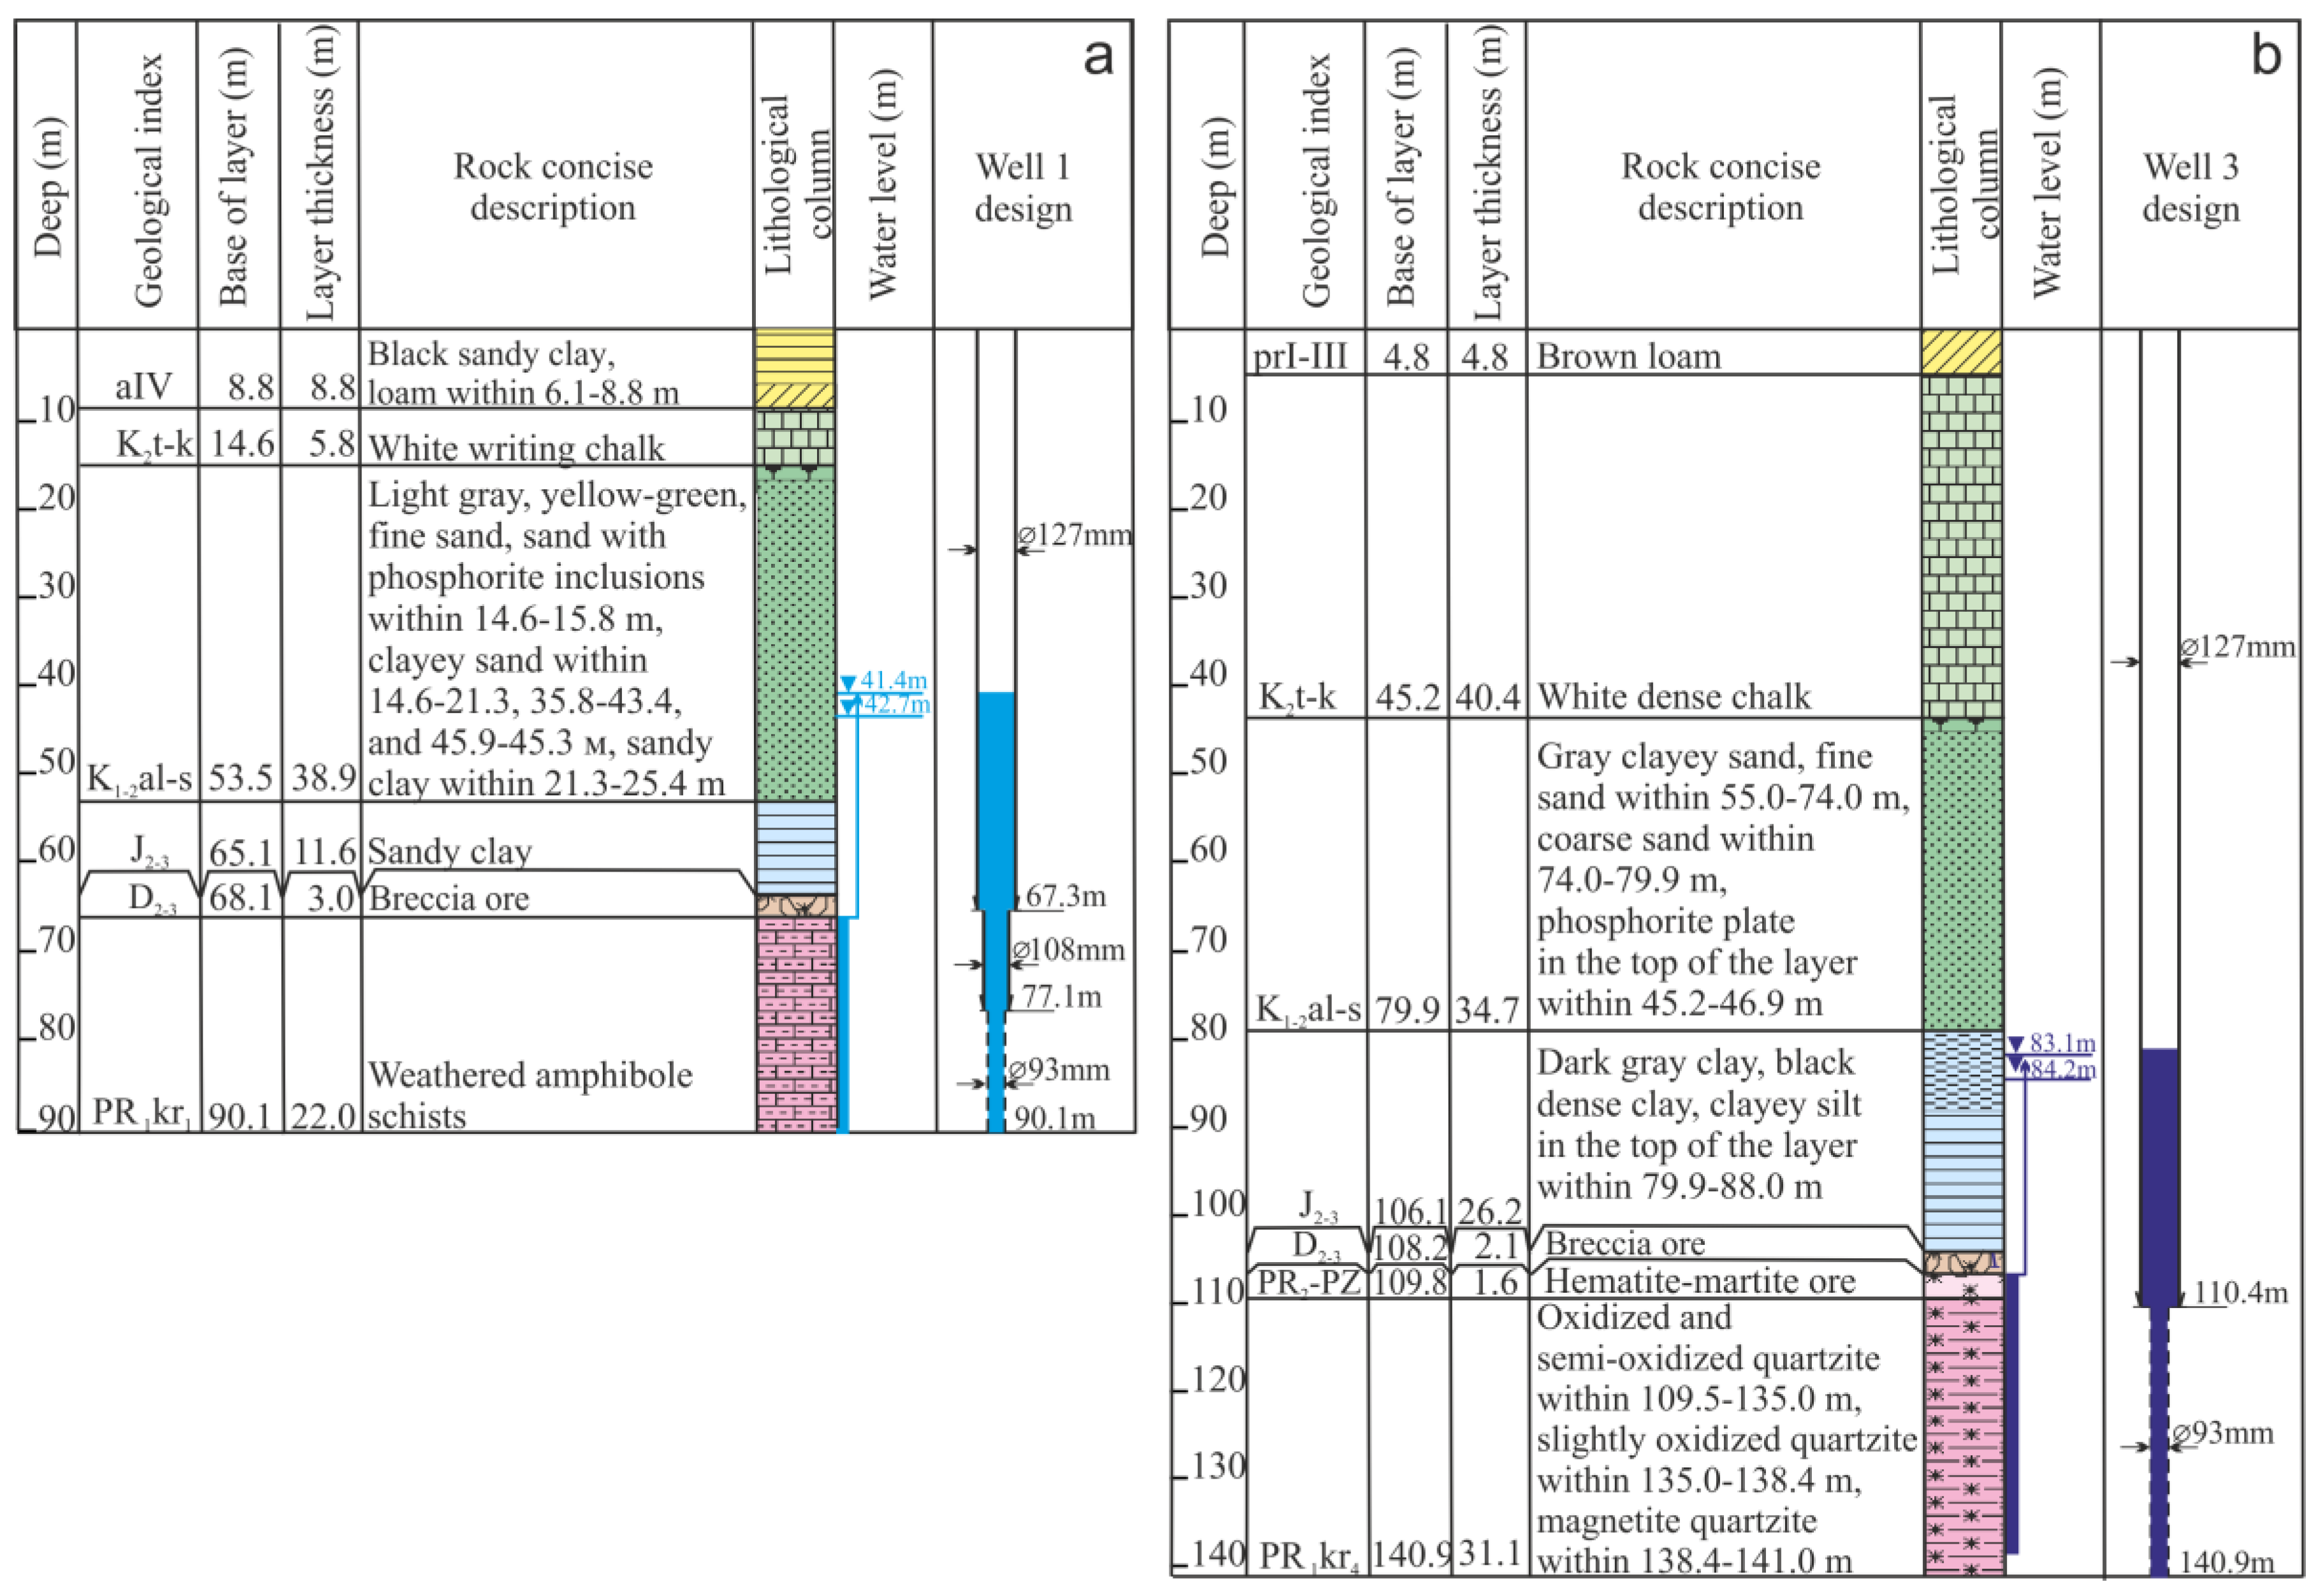
The sedimentary cover, with a thickness of 62–165 m lies with an angular unconformity on the basement rocks and is represented in the section of observation wells from bottom to top by sedimentary-terrigenous deposits of Jurassic and Cretaceous, overlain by alluvial and alluvial-proluvial deposits of the Quaternary system (
Figure 2). Devonian deposits are limited in distribution and related to depressions in the crystalline basement [
31,
32].
The Albian-Cenomanian confined aquifer of the Lower-Middle Cretaceous is predominantly distributed in the sedimentary strata. The Archean-Proterozoic confined aquifer is related to the zone of exogenous weathering and tectonic fracturing of the basement rocks. A regional aquiclude (clay deposits of Jurassic and Devonian) determines the hydraulic separation of groundwater levels.
The structural plan of the deposit is controlled by the faults of different ranks and folding. Interstratal movements are distinguished in the form of slip mirrors and brecciation zones on the wings of the folds. Horizontal and gently sloping microshears with an amplitude of 1–10 m are noted. Fracture zones of NW-strike are traced in the northern and southwestern parts of the field. Elements of microtectonics are expressed by different forms of cleavage and the development of thin cracks with the displacements up to 1–2 cm at an angle to the bedding of ferruginous quartzites.
Hydrogeological conditions are complex. The watering of the ore-crystalline massif within the mine field of the Korobkovskoe deposit is uneven, manifesting itself in the form of moisture, dripping, and water seepage. A permanent withdrawal of groundwater, which enters the lower horizons of the workings, is carried out during the development of the deposit. The operation of the Lebedinskoe deposit goes on with preliminary dewatering and drying of loose overburden rocks and ore-crystalline massif. The area is characterized by a technogenically disturbed groundwater regime as a result of the operation of drainage installations (
Figure 3).
The Archean-Proterozoic aquifer is confined. In the well #1 (point I) it is tapped in the interval of 68–90 m and is related to metamorphic slates of the lower iron ore subformation. The amplitude of seasonal level variations varies from 0.3 to 0.8 m. A regional trend of level lowering to 2 m was traced over 3.5 years of observations. The aquifer is tapped in the interval of 108–138 m in ferruginous quartzites of the upper iron ore subformation in the well #3 (point II) located at the distance of 1.3 km north of point I (
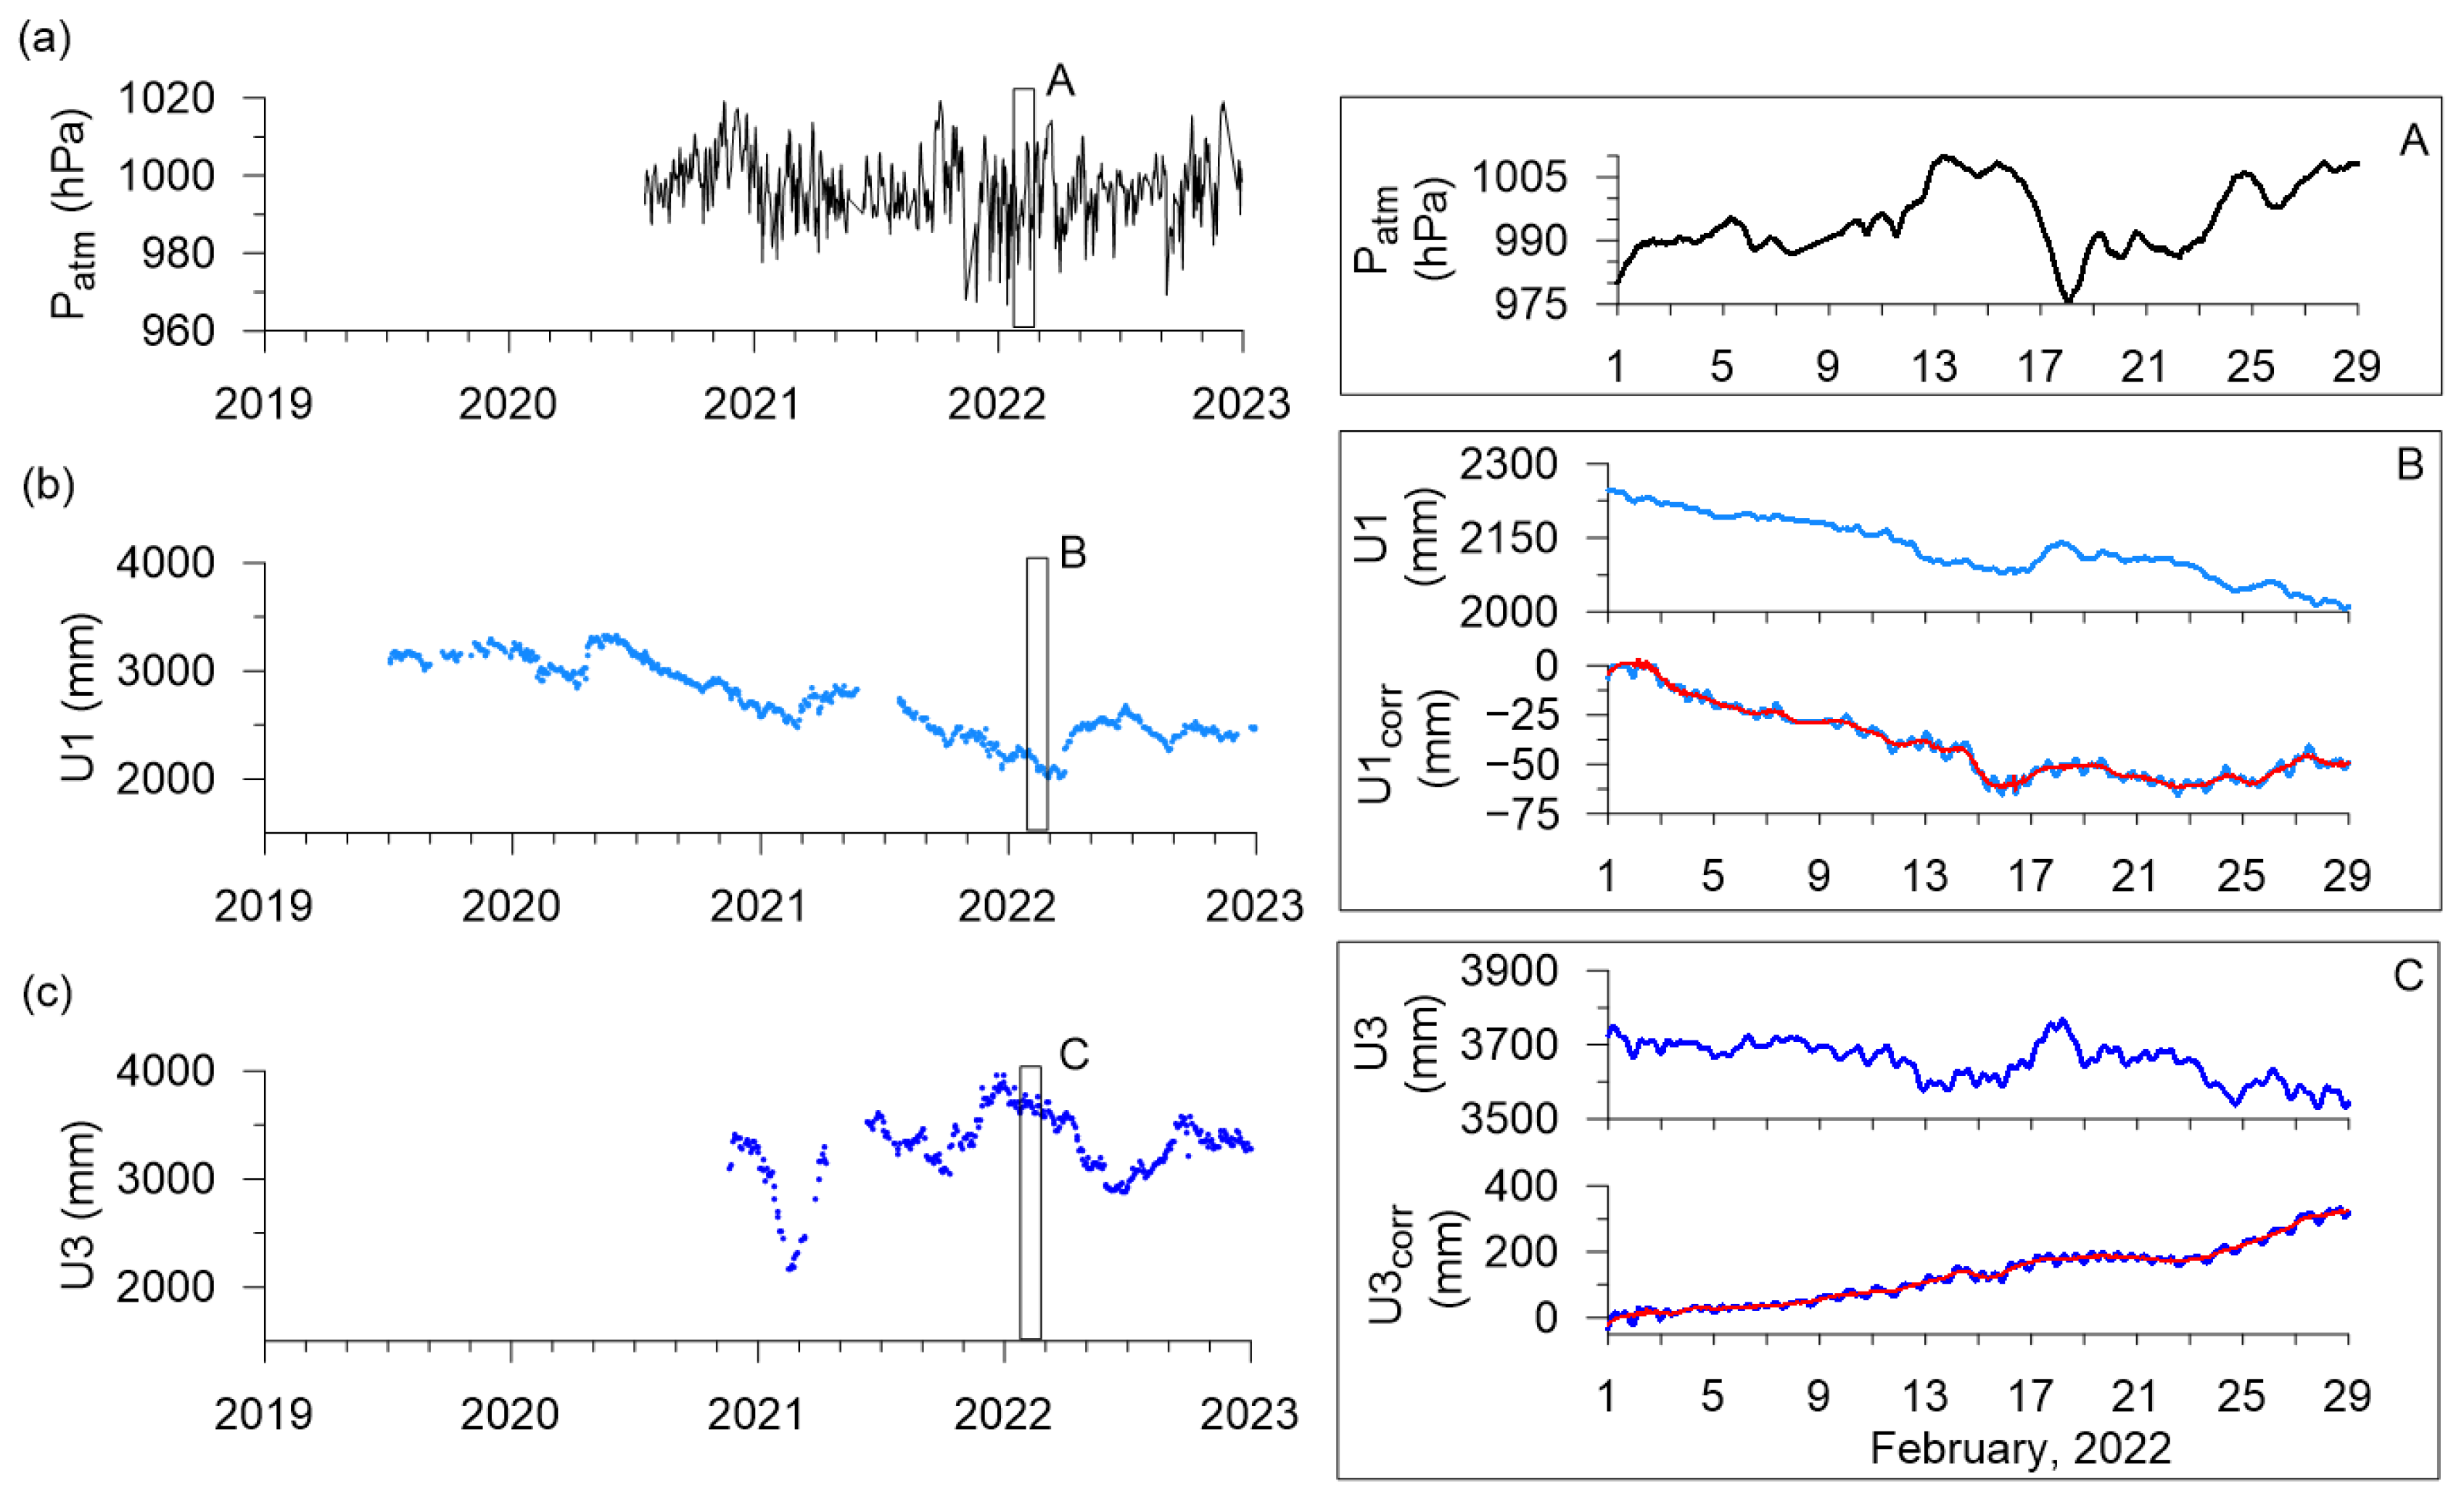
Figure 1). The amplitude of annual variations in the water level reaches 2 m. The influence of the atmospheric pressure on the regime of the Archean-Proterozoic aquifer is clearly manifested in a quasi-stationary filtration. The groundwater level variations are asynchronous to changes in the atmospheric pressure (
Figure 3, A, B, C).
The regional trend of the water level lowering in the regime of the Archean-Proterozoic aquifer persists after the level was cleared from the influence of the atmospheric pressure and the earth’s tides. Under natural conditions, the main direction of groundwater movement is northeast. In technogenically disturbed conditions, groundwater is discharged along the western side of the Lebedinsky quarry, towards the drainage system of working wells. The roof of the Archean-Proterozoic aquifer within the quarry is drained.
The main hydrogeological parameters were determined based on the results of test pumpings carried out in the wells #1 and #3 in July, 2019 (
Table 1). The rocks of the lower iron ore subformation are represented by metamorphic slates in the well #1 (point I). They are characterized by increased watering compared to the deposits of the upper iron ore subformation composed of ferruginous quartzites tapped in the well #3 (point II).
3. Methods
Observation points I and II are located in the eastern part of the mine field of the Korobkovskoe iron ore deposit of KMA and are equipped with up-to-date measurement systems. The systems include a three-component seismic sensor SPV-3K, an atmospheric pressure sensor RAA-33X, and submersible level probes PR-36XW installed in the wells #1 and #3, which tapped the Archean-Proterozoic aquifer. The frequency range of the SPV-3K seismometer is 0.5–65 Hz. The atmospheric pressure sensor is designed to record an absolute atmospheric pressure in the range of 0.8–1.2 bar, the water level sensor—for high-precision registration of the water level in the range of 0–5 m. The accuracy of the atmospheric pressure sensor is 0.05% FS, the water level sensor −0.15% FS. Registration of signals with a sampling rate of 200 Hz is carried out by a 6-channel REFTEK-130 datalogger in the point I and Centaur CTR4 digital recorder in the point II. Synchronization of experimental data at two points is provided by GPS modules. The results of synchronous registration of seismic, hydrogeological, and barometric data form a database, which is stored at the server of Sadovsky Institute of Geospheres Dynamics of Russian Academy of Sciences (IDG RAS) and is constantly updated.
To determine the background parameters of the water-saturated reservoirs, the data series were decimated to times-steps of 300 s. The barometric efficiency shows the influence of the atmospheric pressure on the water level response and can be calculated as the ratio of the level amplitude to the barometric load. To analyze tidal waves in the groundwater levels bandpass filtration in the ranges of 12.32–12.52 and 25.7–25.9 h was performed. The tides in the vertical ground displacement were calculated using the ETERNA 3.0 software in relation to the coordinates of the observation points (point I—51° 16.9′ N 37° 35.2′ E, point II—51° 17.6′ N 37° 35.2′ E) [
33]. The tidal factor (water level sensitivity to tidal deformation of water-bearing rocks) is calculated as the ratio of the amplitudes of the tidal response of the water level to the tidal changes in volumetric deformation.
The phase shift between M
2 tidal wave identified in the ground displacement and level of the confined aquifer was estimated using the phase trajectory method [
34]. This technique is based on the construction of phase trajectories in the coordinates “ground displacement—water level change” in the form of ellipses. The obtained values of the phase shift were used to calculate the aquifer transmissivity and rock permeability [
35] within the poroelastic model [
36].
Blasting operations are regularly carried out during the exploitation of iron ore deposits of KMA. Short-delay blasting is used. Ore extraction in the mine is conducted by a room-and-pillar technology. In each mass explosion, from one to four rooms are detonated with an interval of 30–50 s located at a distance of 0.5–3.1 km from the observation points. In the quarry, groups of blocks are blasted with an interval of 10–30 s located at the epicentral distances of 2.1–4.5 km from the points. A time series of seismic, barometric, and hydrogeological records with a duration of 40 s for each blast in the mine and 30 s for each explosion in the quarry form a database.
The modulus of the ground velocity
(hereinafter—the ground velocity) was used to quantify the seismic impact from each blast in mass explosion:
where
VZ,
VN,
VE—the amplitudes of the ground velocity along
Z,
N,
E components.
To compare the response of the “reservoir–well” system to the detonation of different groups of blocks the reduced distance
was used:
where
R is the epicentral distance from the room in the mine (the nearest edge of the blasted block in the quarry) to the observation point, m;
Q is a maximum mass of explosives in one groups of drillholes in the mine (an average mass of explosives within the explosive block in the quarry).
The probabilistic approach [
37] was used to analyze the background characteristics of seismic, barometric, and hydrogeological data. The data used for analysis were divided into intervals of 2-h duration each with a 1-h overlap. The linear trend was removed preliminarily. The power spectral density (PSD) was calculated for each 2-h interval with the Welch method in a running window of the length of 2/13 h with a 75% overlap. The obtained data of PSD were used to calculate the probability density for each frequency. For this purpose, the PSD was averaged in a running window of the length of 1 octave with an overlap of 1/16 octave. This allowed us to reduce frequencies and obtain an even sampling over frequency in the logarithmic scale. Then the spectrogram of probability density function (PDF) of the occurrence of a certain value of PSD at each frequency was plotted. The statistical mode, 10th and 90th percentiles are used for further analysis. Calculated PSDs of seismic signals and hydrogeological responses to blasts in the mine and quarry from the database are compared to background PDF values of PSD.
The main focus of the analysis was the postseismic effects identified in the monthly data series of the water level in the Archean-Proterozoic aquifer during the first day after the mass explosions. Data series of the water level were preliminarily cleaned from the influence of the atmospheric pressure and the earth’s tides. Removal of fluctuations in the range of periods of 8–36 h was carried out by applying a bandstop Butterworth filter of a second-order in the period range of 8-36 h. Based on the results of processing the experimental data, the duration and amplitude of the level lowering were determined.
4. Results
4.1. Establishing Background Parameters of Archaean-Proterozoic Aquifer
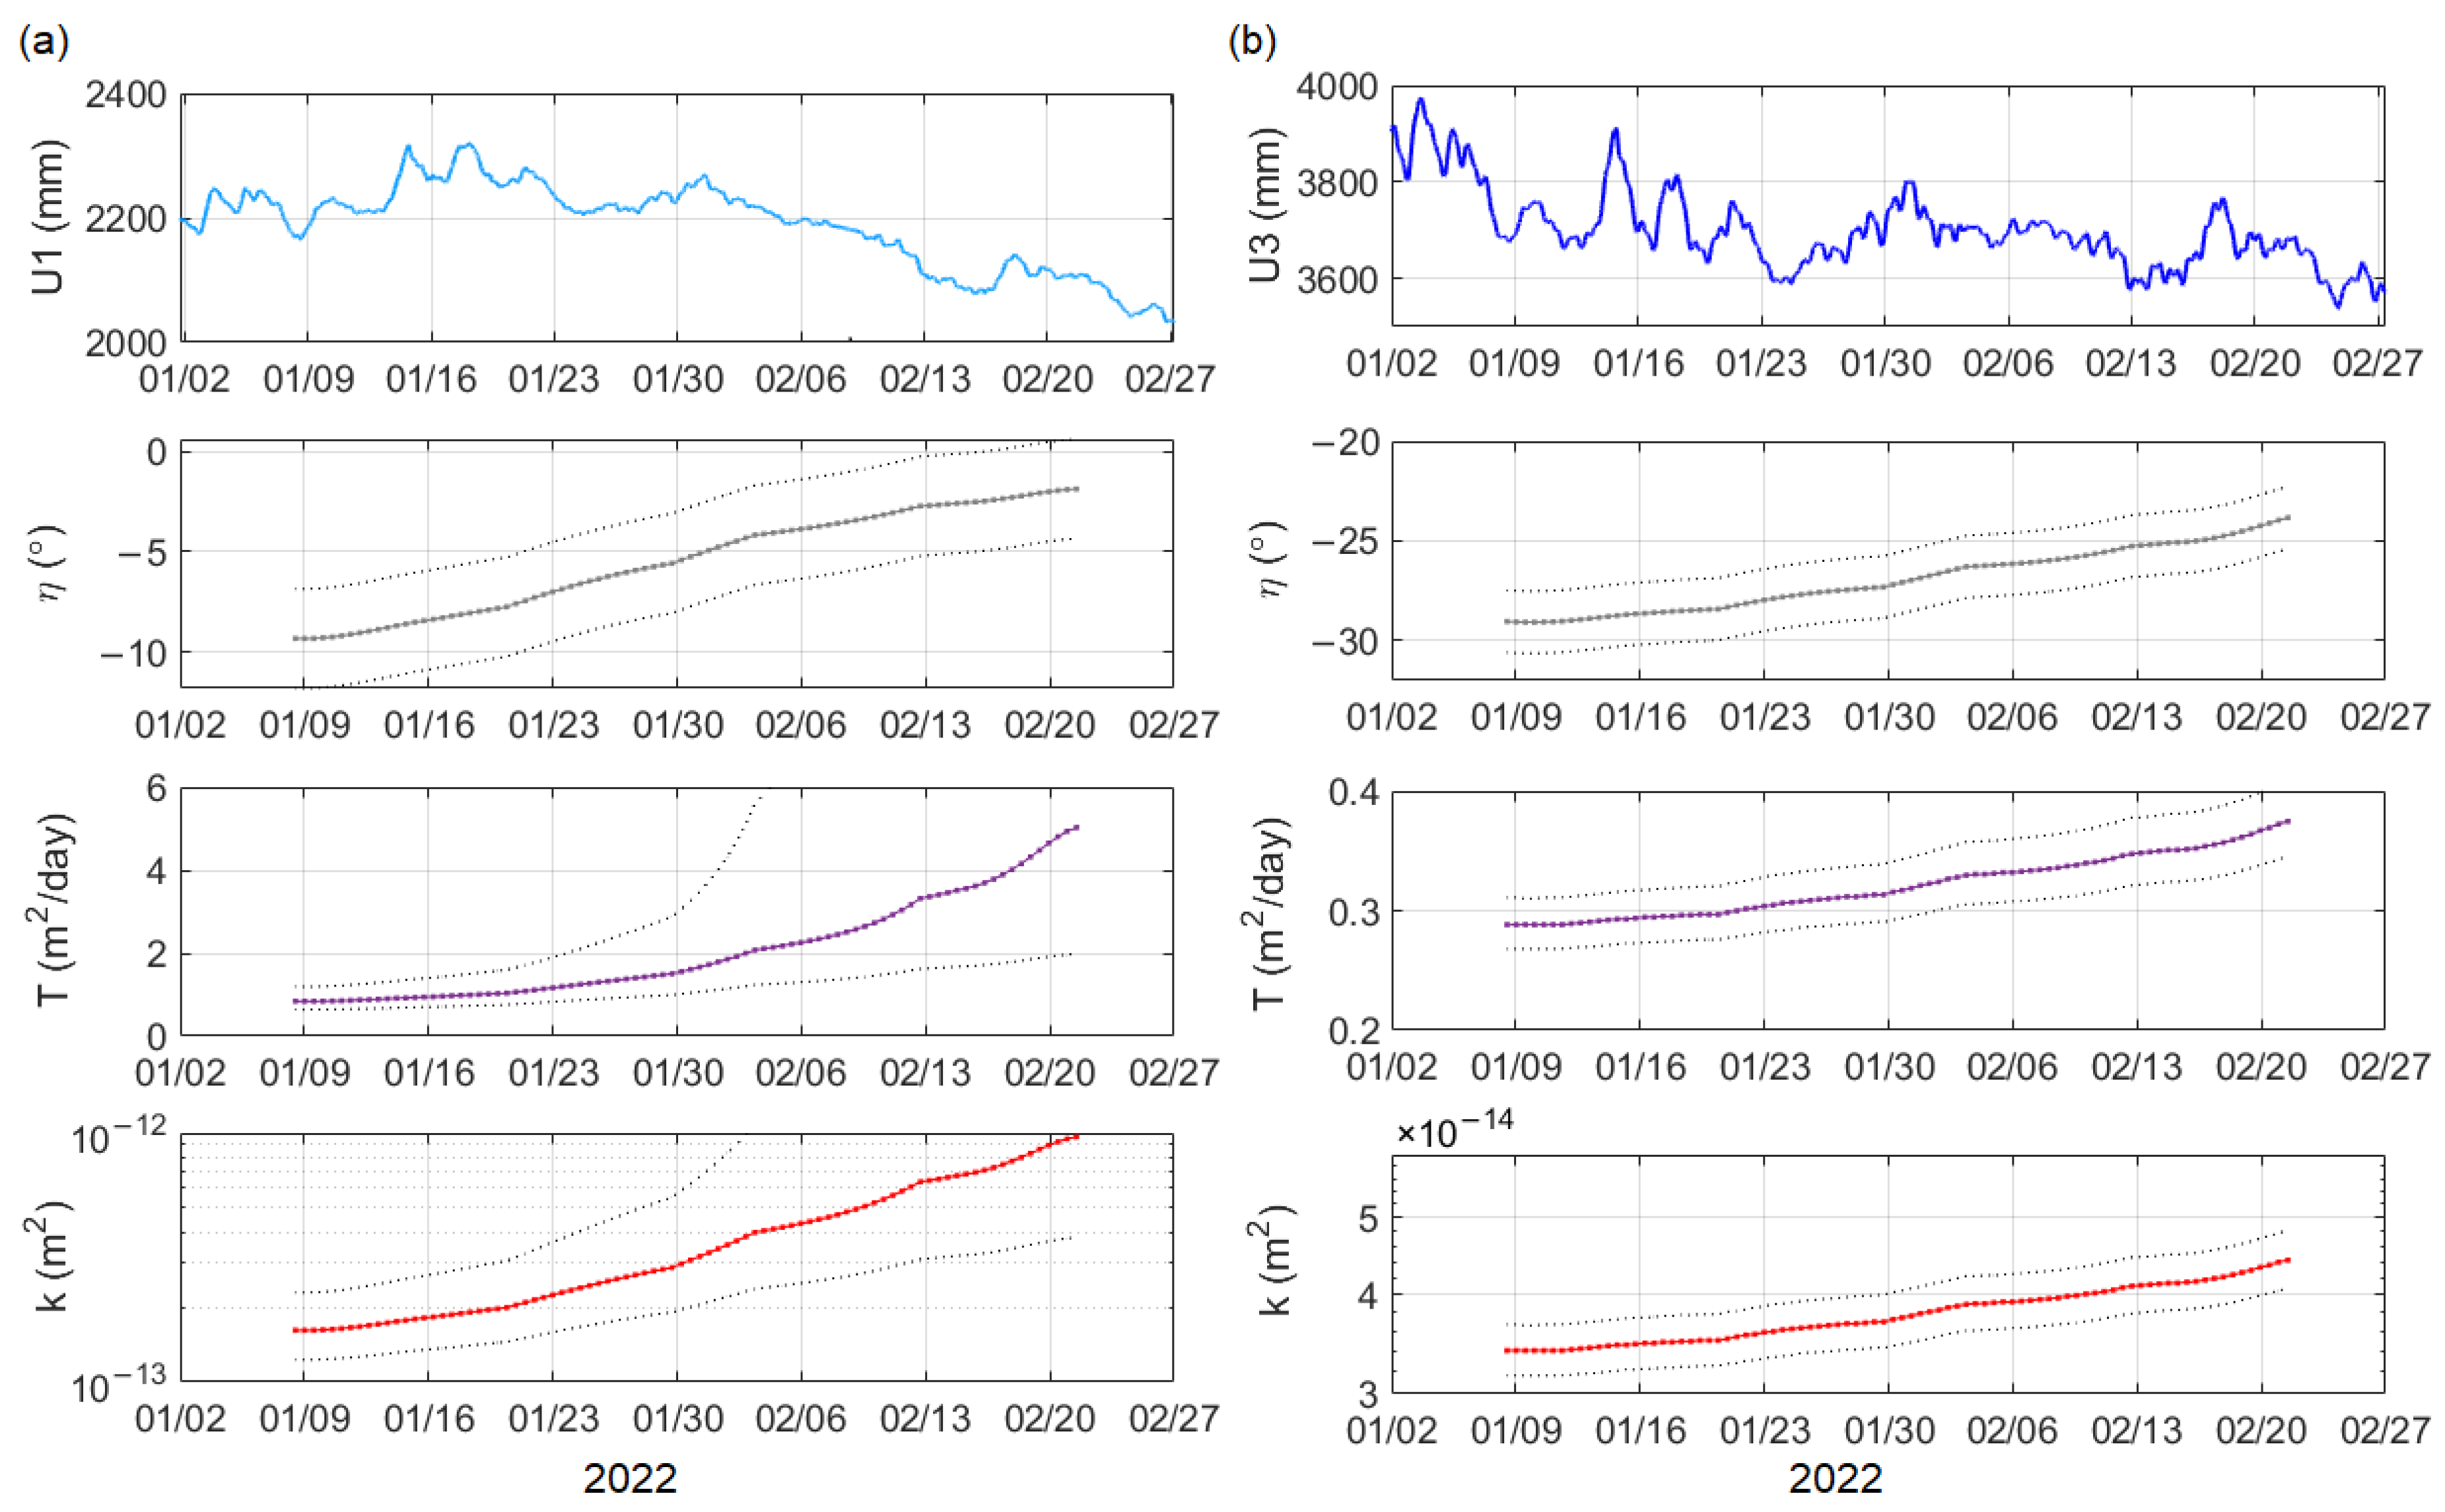
Seismic, hydrogeological, and barometric monitoring of activities within Korobkovskoe and Lebedinskoe iron ore deposits is being performed in two points. According to the simultaneously processes data on variations of the atmospheric pressure and the water level in the Archaean-Proterozoic aquifer for the period January 2022–February 2022, the barometric efficiency is −0.4 in the well #1 (point I), and it is −0.6 in the well #3 (point II). The aquifer of the upper iron ore subformation is characterized by a higher barometric efficiency if compared to water-bearing sediments of the lower iron ore subformation in the well #1. Diurnal and semi-diurnal tidal waves can be persistently detected via spectral analysis in the aquifer of the upper iron ore subformation, which is characterized by a deeper occurrence of the top of water-bearing sediments. The tidal factor reaches the value of 0.9 mm/nano. But its value is less than 0.42 mm/nano in the water-bearing sediments of the lower iron-ore subformation. The semi-diurnal tidal wave M2 of the lunar type is persistently detected in the water-bearing sediments of the upper and lower iron ore subformations. It is used to monitor the filtration properties of the aquifer.
The estimation of permeability (
k) of the upper and lower iron ore subformations is performed via the analysis of phase shift (
η) in the tidal wave M
2 detected in variations of the water level and the ground displacement under a quasi-stationary filtration regime (
Figure 4).
Permeability (T) of the upper iron-ore subformation (well #3) consisting mainly of ferruginous quartzite change in the range of (3.4–4.4) ×10−14 m2, while permeability of the lower iron-ore subformation (well #1) vary in the range from 9.9×10⁻¹⁴ to 5.9×10⁻¹³ m2.
4.2. Reaction of the System “Reservoir–Well” to Short-Delay Blasting
Series of pulses in the form of repeated, gradually decaying wavetrains are regularly recorded in synchronous seismic, hydrogeological, and barometric measurements. They correspond to short-delay explosions in the mine and in the quarry. Duration of blasting groups of wells in the rooms of the mine and in the blocks at the quarry alter from 0.04–0.06 to 10 s.
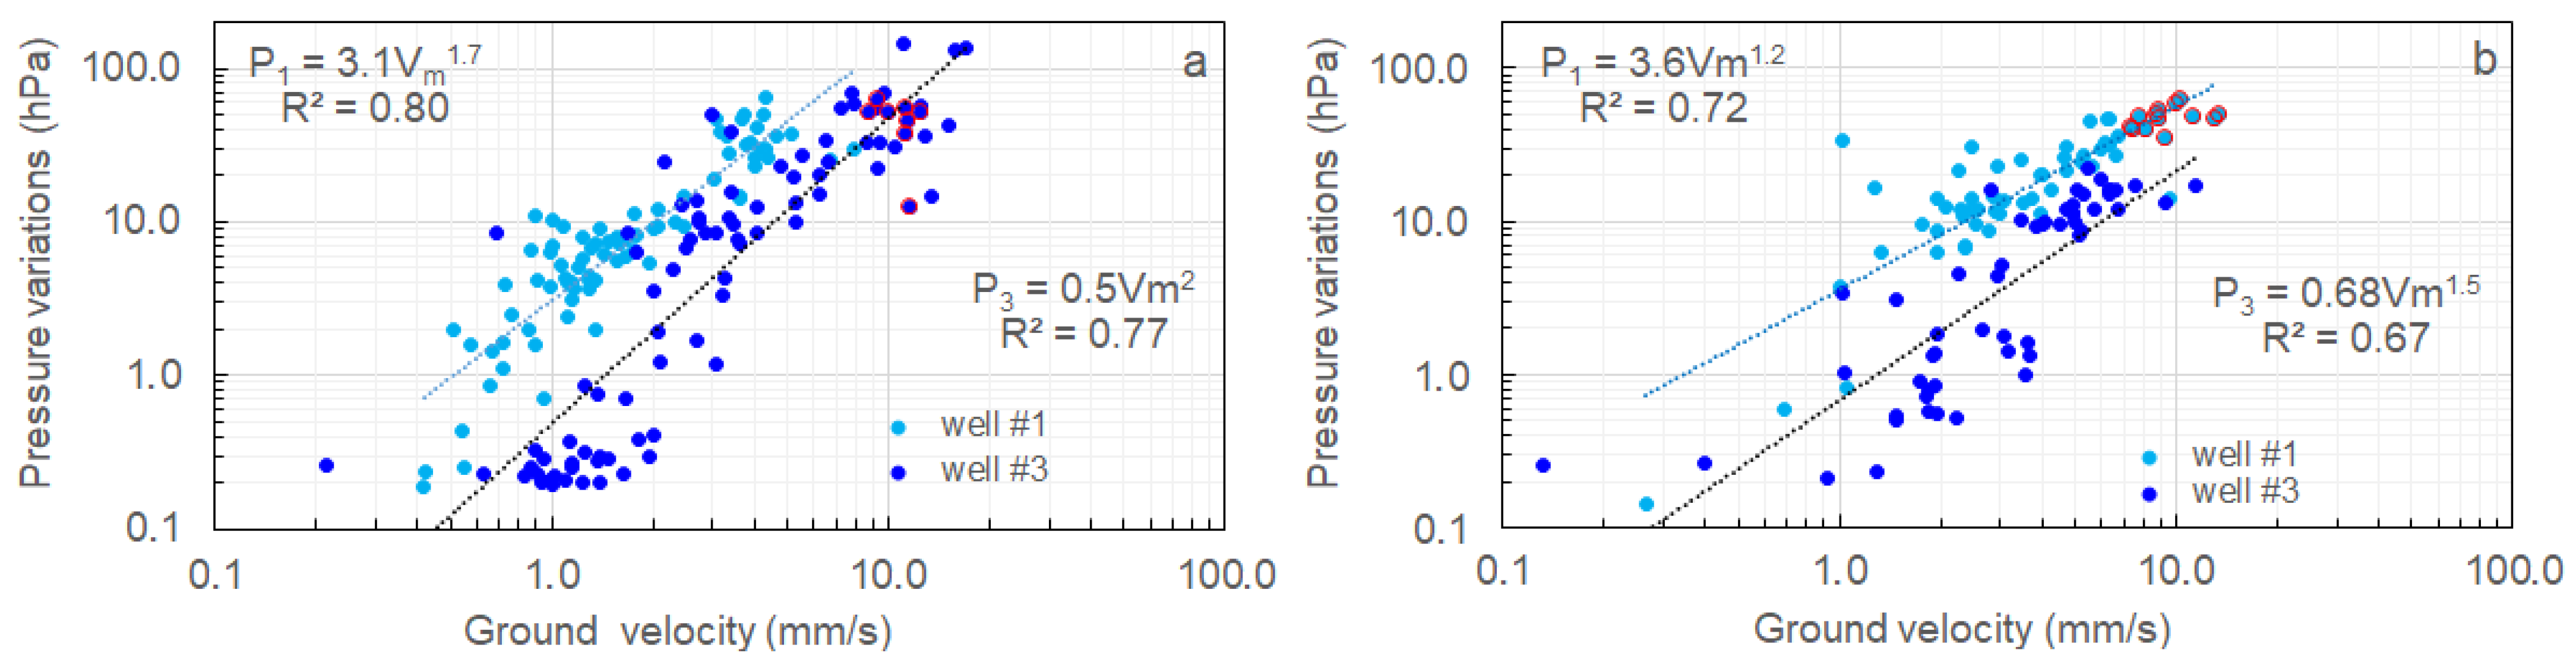
For the period of observations 2019–2022, amplitudes of hydrogeological responses of the lower iron ore subformation at the point I to short-delay explosions in the mine altered from 0.4 to 65 hPa, the corresponding ground velocity being 0.2–4.3 mm/s (
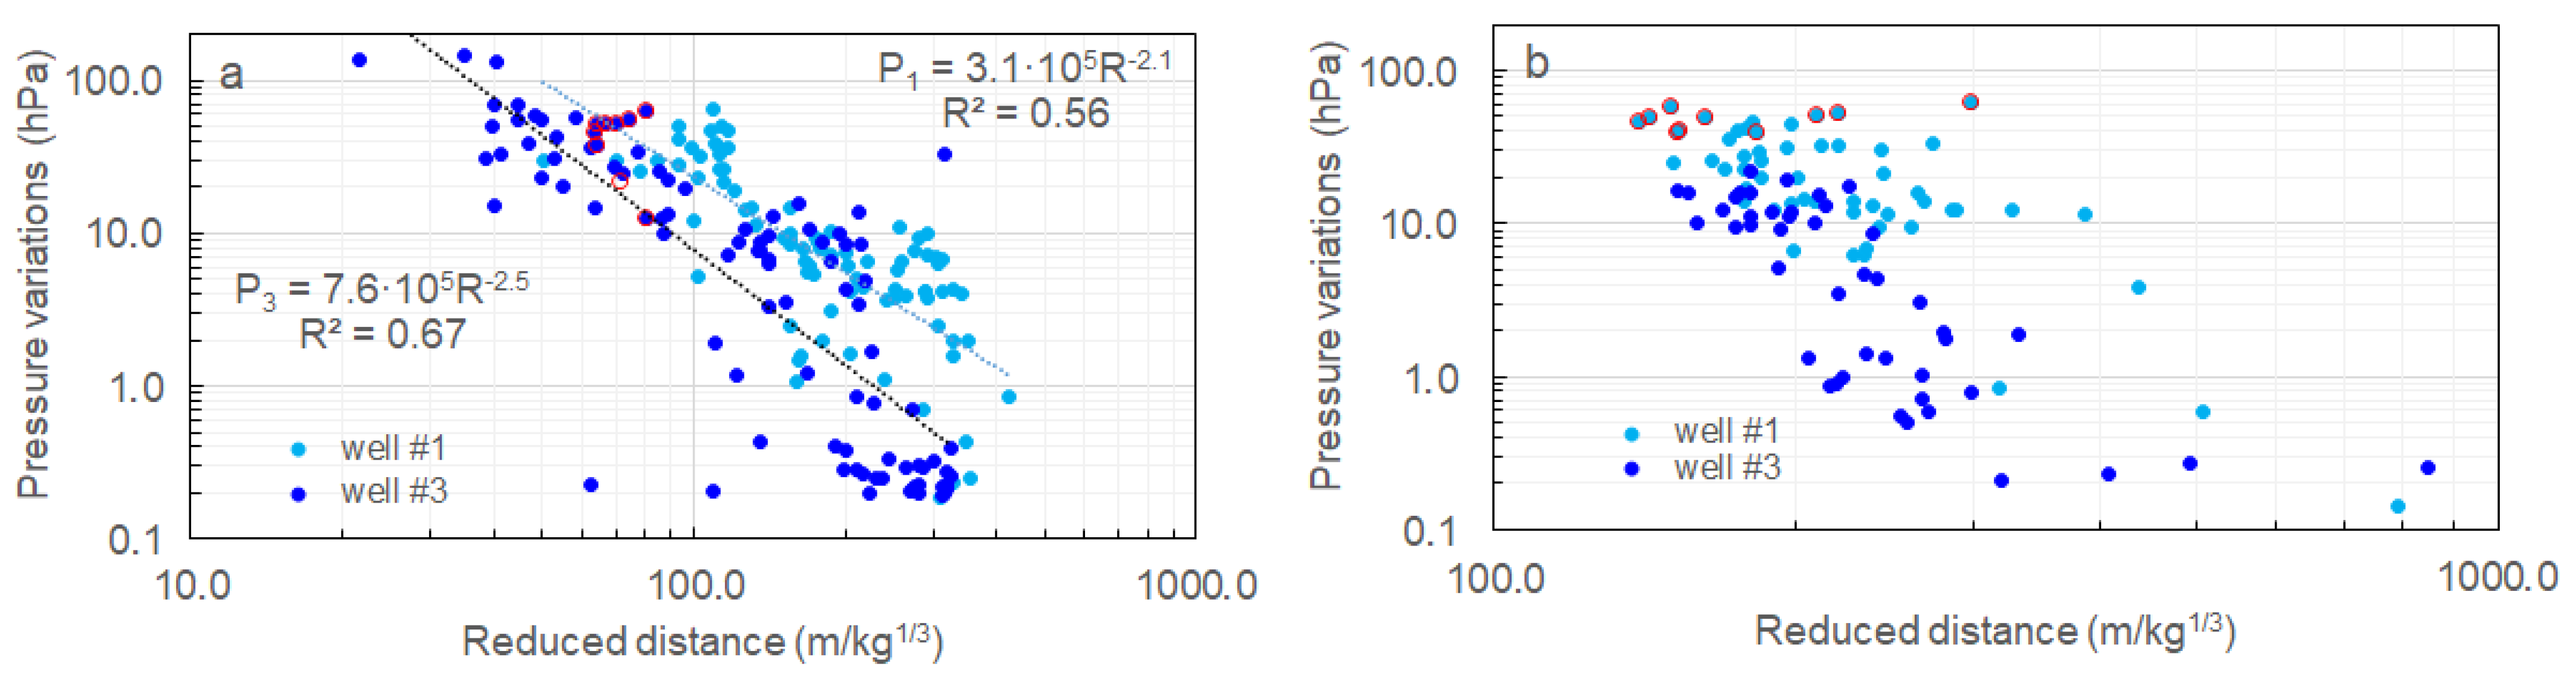
Figure 5a). Variations of the pore pressure in the system “reservoir–well” of the upper iron ore subformation are registered in a wide range from 0.2 to 134.6 hPa, the corresponding ground velocity being 0.6–17 mm/s. The diagram of the pore pressure variations versus reduced distance shows that maximum amplitudes of hydrogeological responses were registered at the point II, when it was located in the near field of explosions at reduced distances of 22–80 m/kg
1/3 (
Figure 6a).
During short-delay explosions in the quarry, maximum amplitudes of hydrogeological responses up to 61.6 hPa were registered at the point I in the lower iron-ore subformation, the ground velocity being the maximum (
Figure 5b), with the reduced distance being the minimum (
Figure 6b). Diagrams of the pressure variations in the system “reservoir–well” versus peak ground velocity are best fitted by power functions, which have different factors of determination.
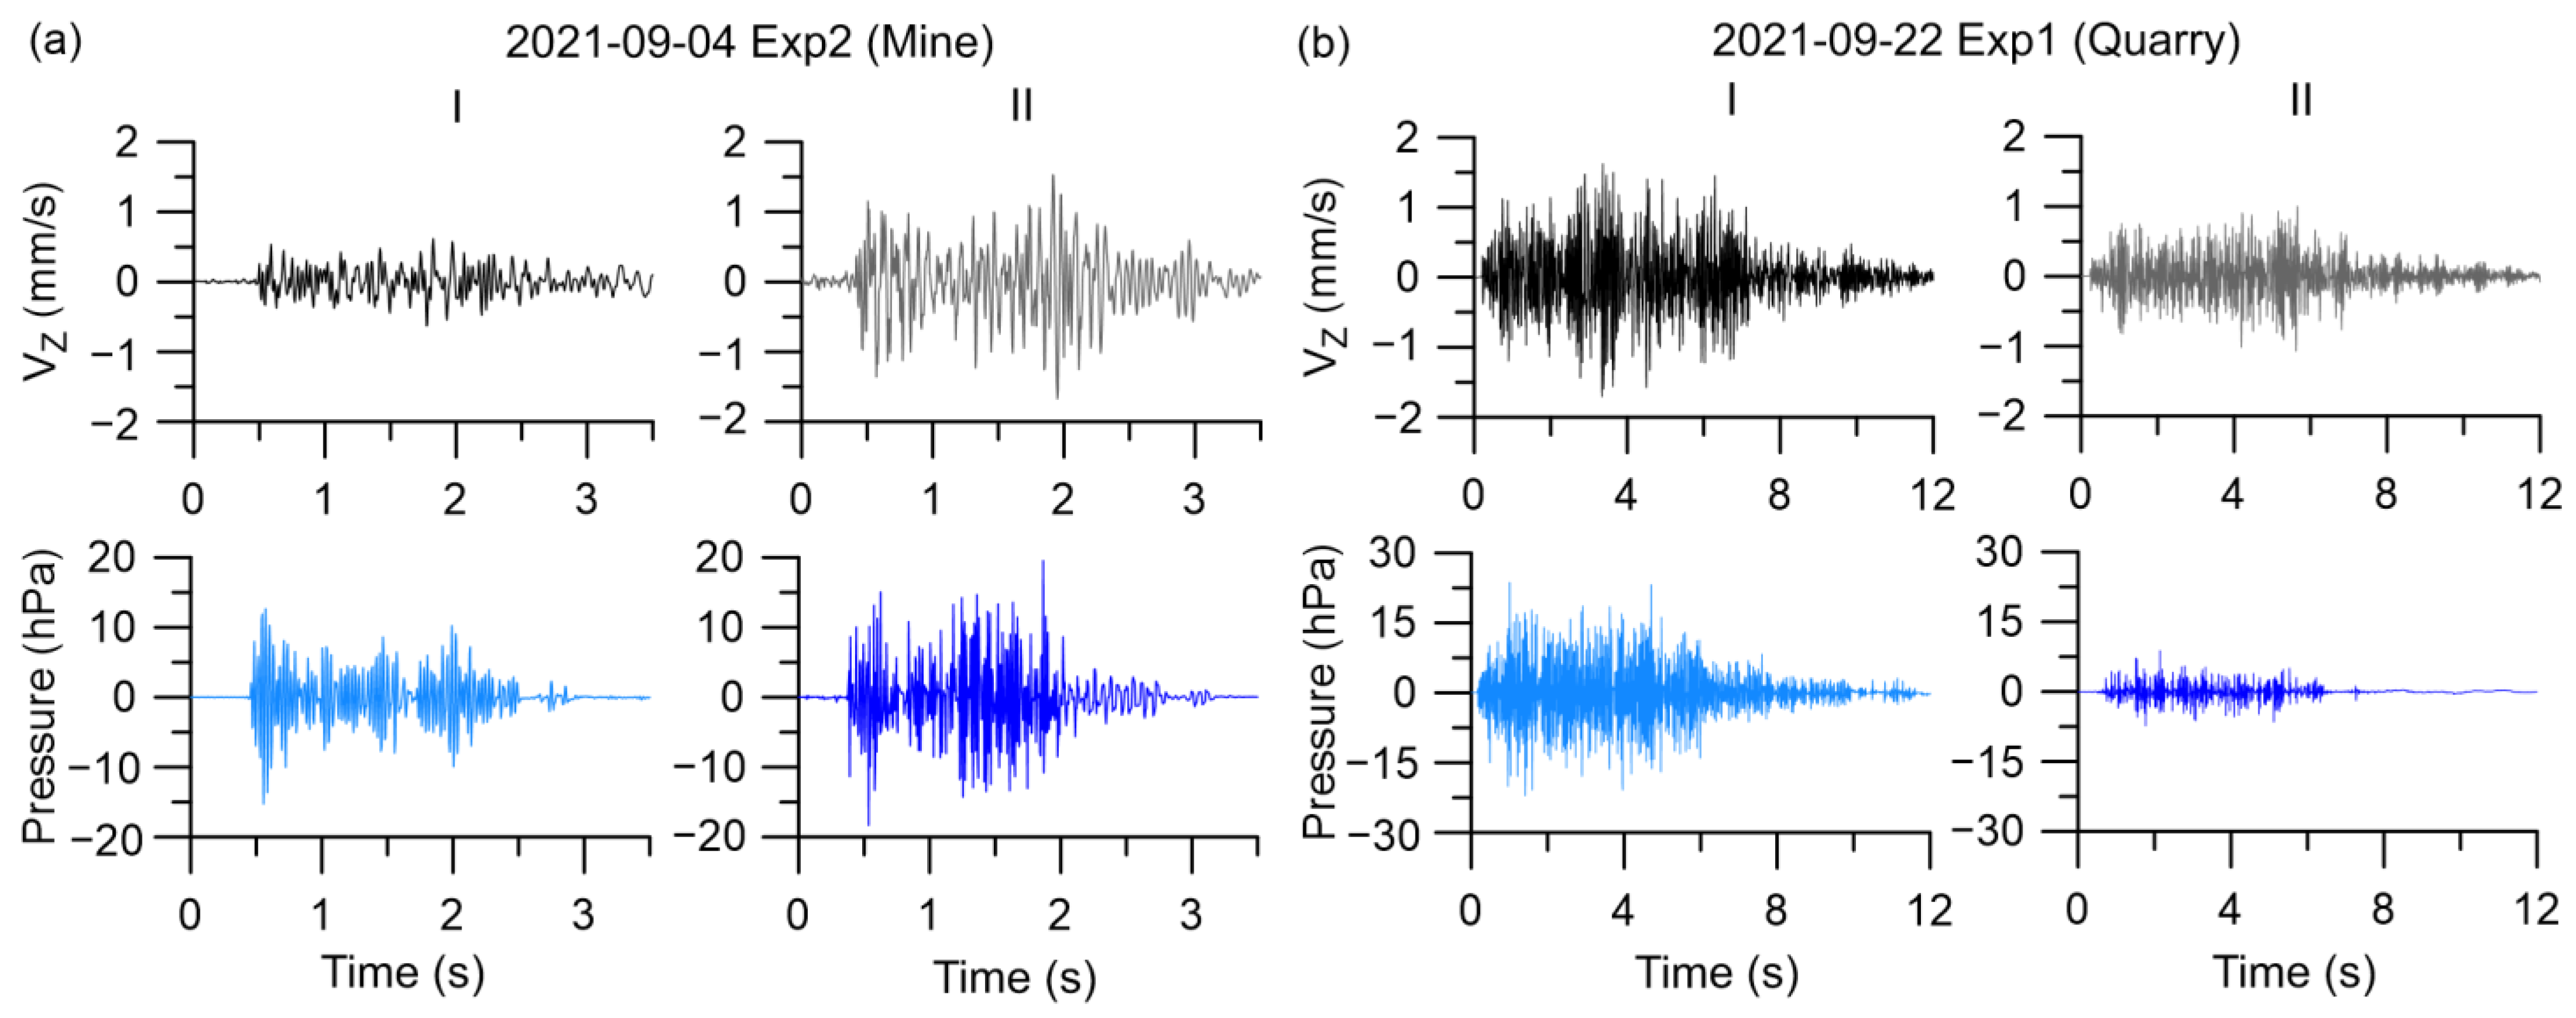
Waveforms of hydrogeological responses of the upper and lower Proterozoic subformations to short-delay explosions differ. They depend on local structural and geological conditions, frequency responses of wells, and parameters of explosions [
31,
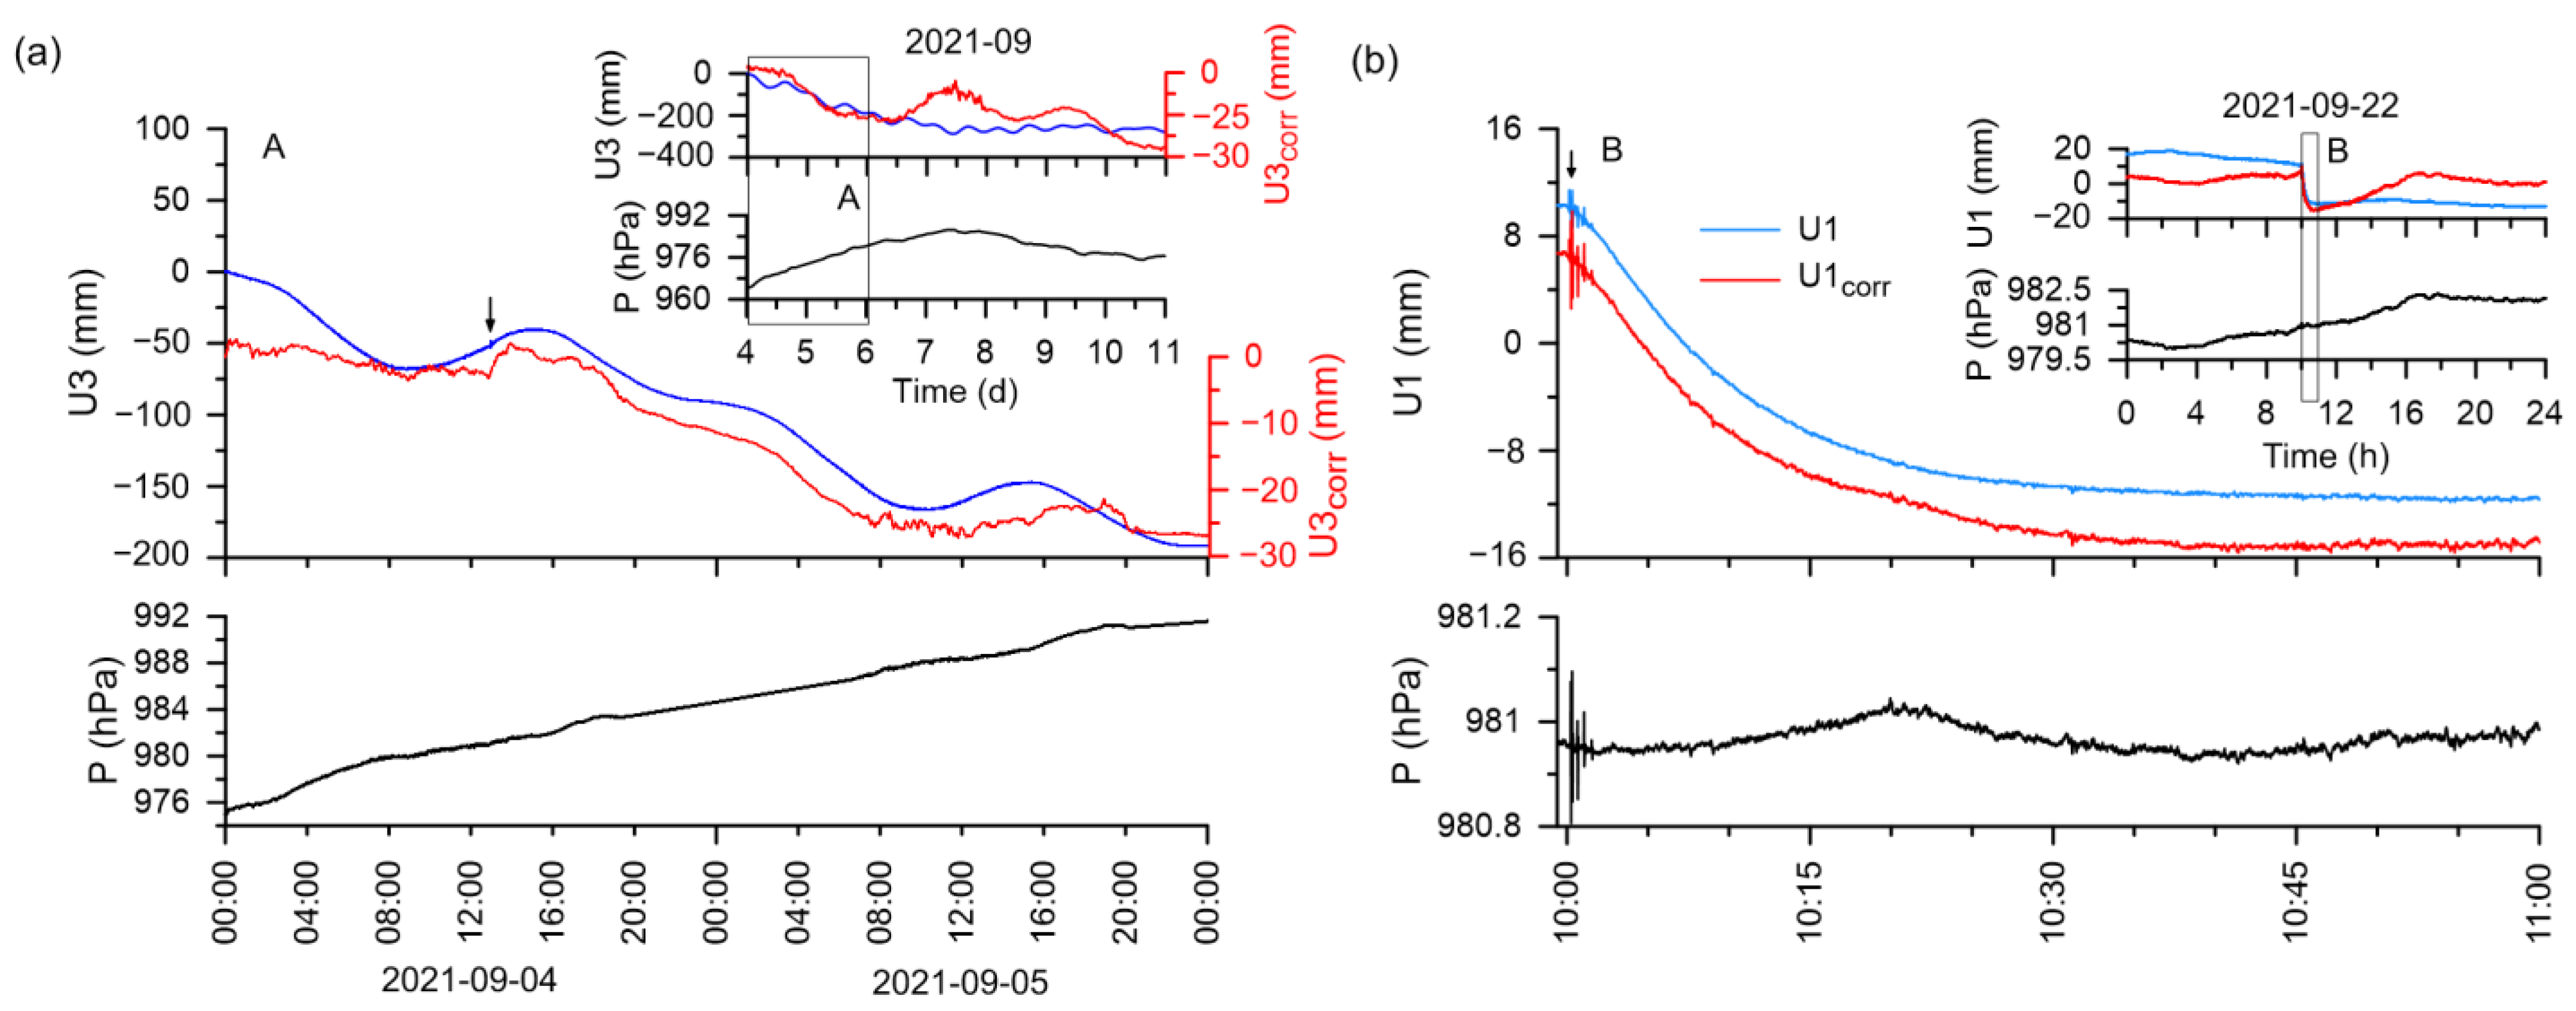
32]. For example, the explosion in the mine on 4 September 2021. Higher ground velocities and amplitude of hydrogeological response were registered at the point II, which is located within the same block with the ore field being excavated, unlike the point I (
Figure 7, to the left). An opposite pattern was registered during the explosion in the quarry on 22 September 2021. Peak ground velocity and pore pressure variations in the system “reservoir–well” were registered at the point I. It was located at a closer reduced distance to the group of blocks being blasted than the point II (
Figure 7, to the right). Explosions in the quarry are accompanied by a propagating low-frequency air wave, which can manifest in seismic records and records of water level too. So, in processing the “quarry” records the lengths of data series were limited by the arrivals of the air waves at the points.
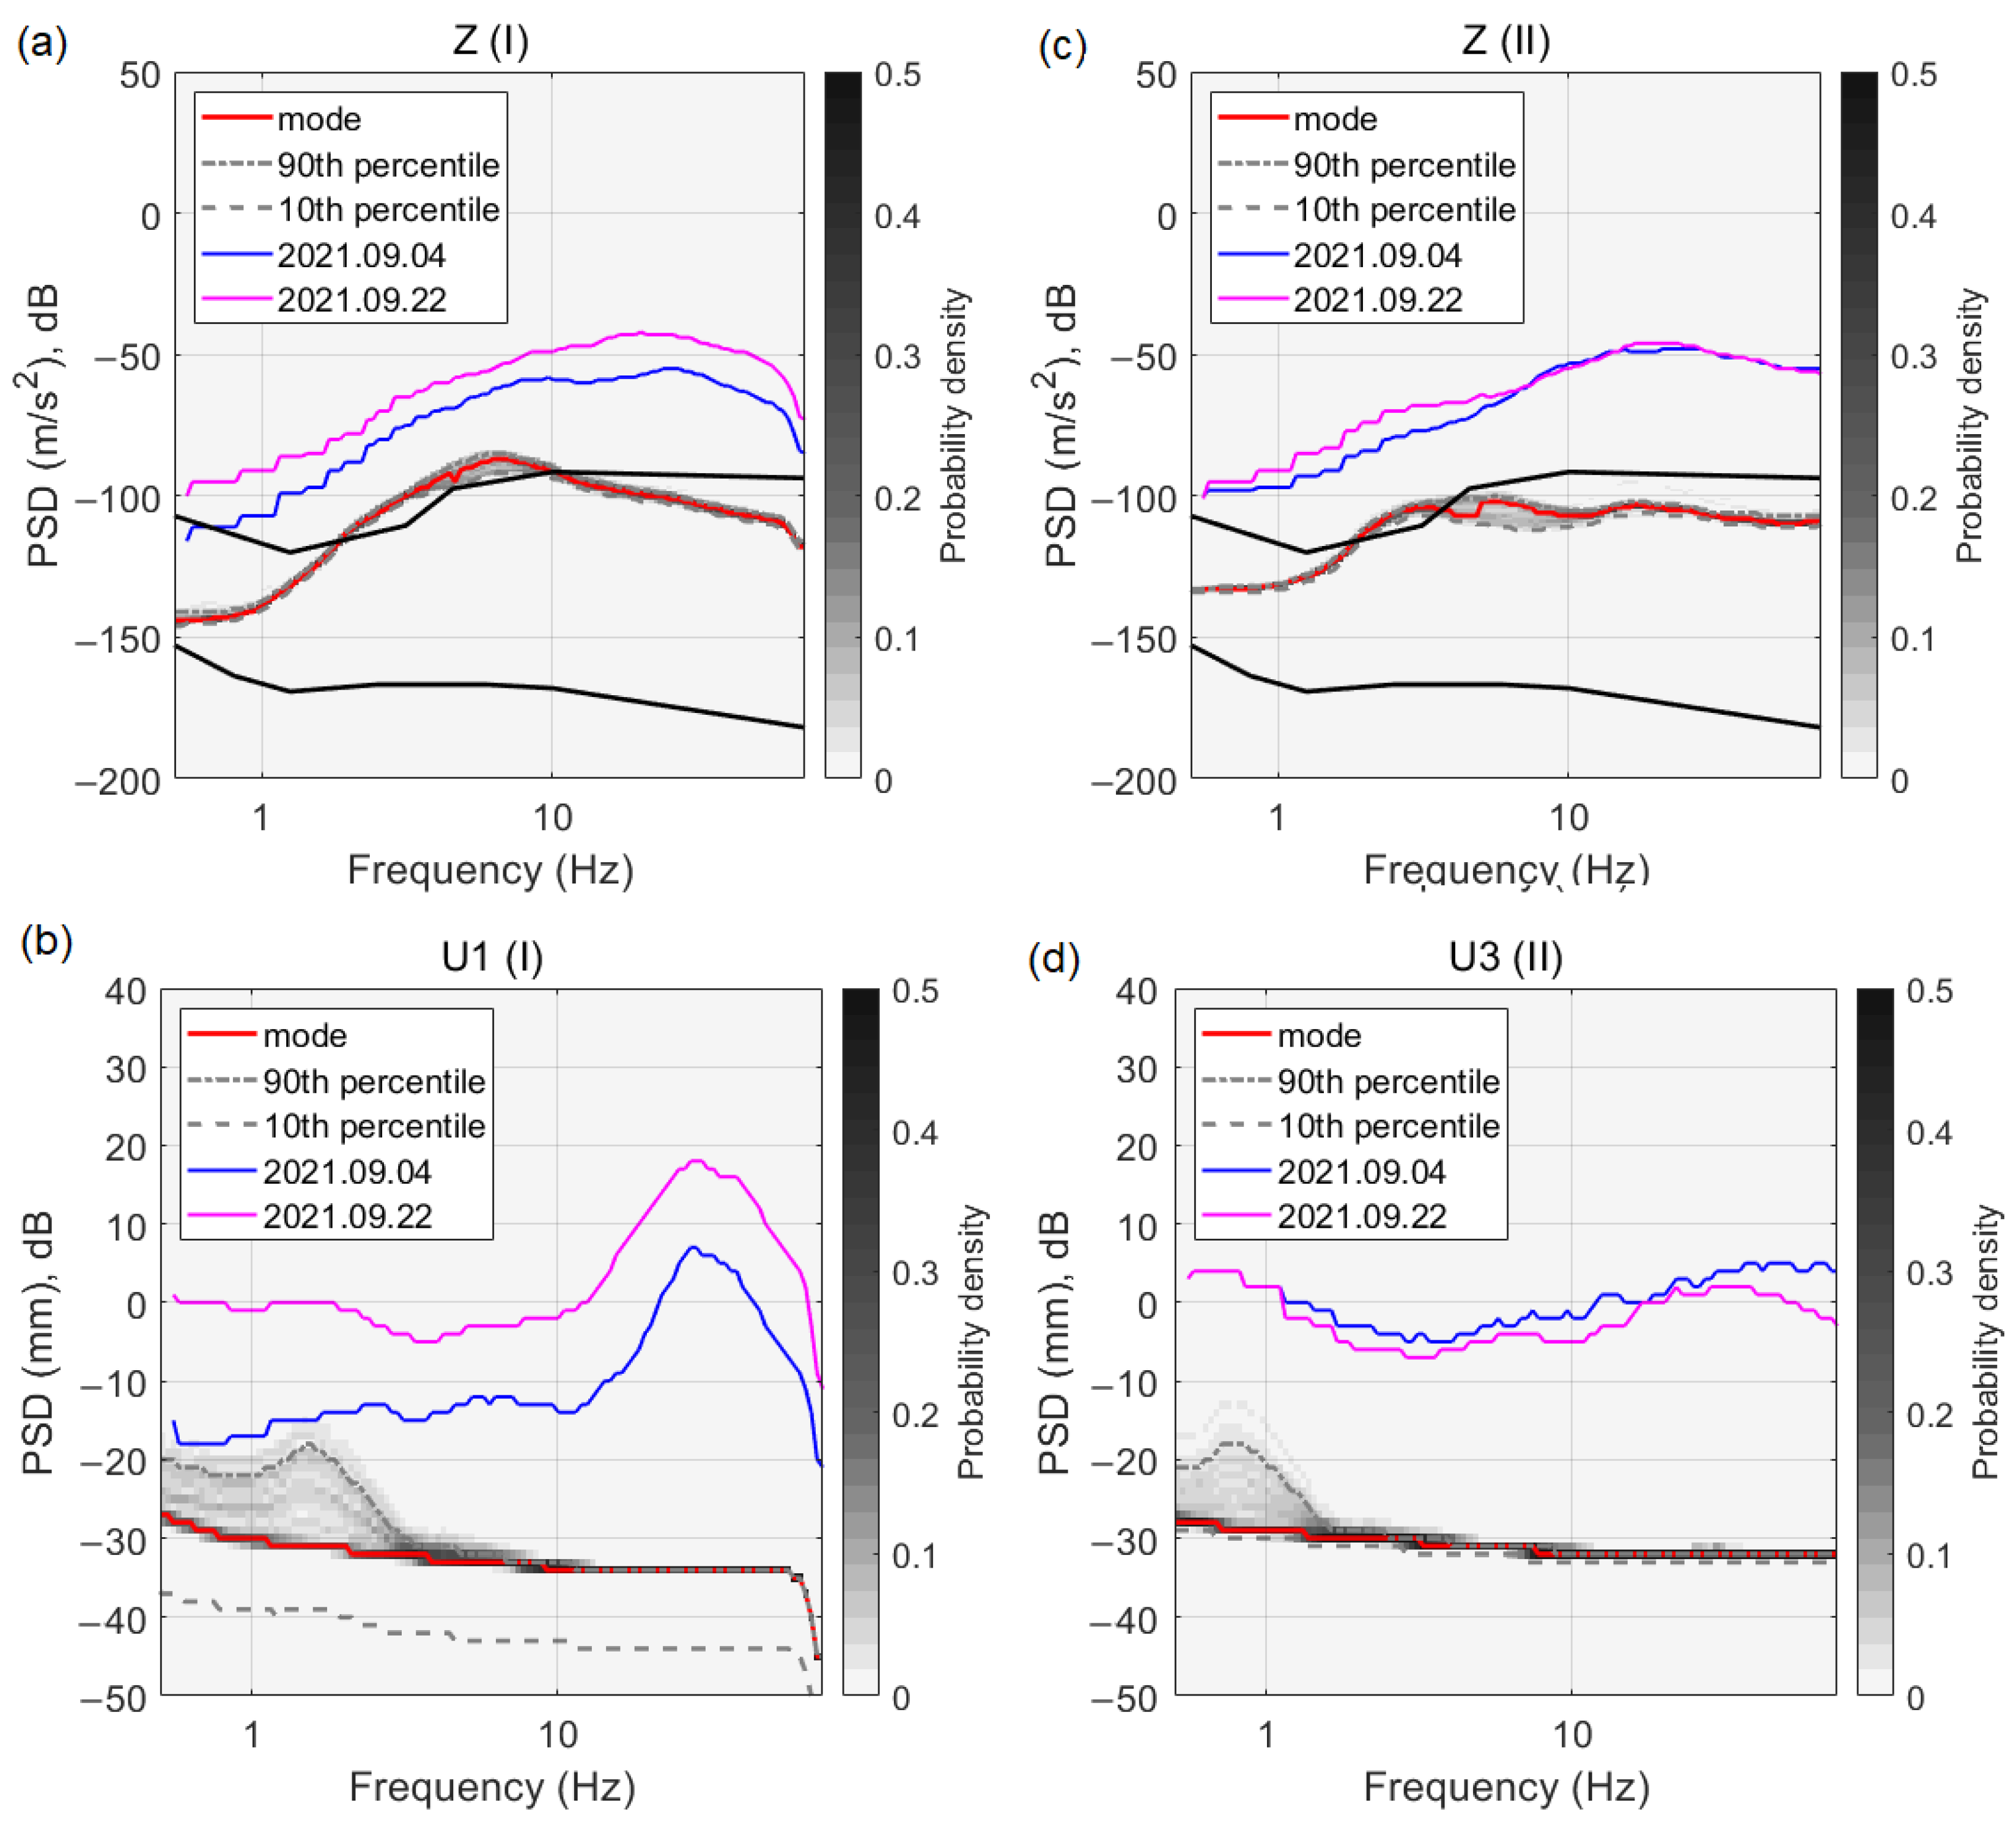
The increasing intensity of power spectral density (PSD) of the ground velocity calculated for the period of measurements in September, 2021 manifests in the range of 2–8 Hz at the background of the mode at the points I and II. Such effect may be caused by technogenic disturbance associated with the injection of technological waste. The value of the mode at the point I is higher by ~25 dB in comparison to the point II (
Figure 8a,c).
The extremum of PSD of the ground velocity during the explosions in the mine and the quarry manifests itself in the frequency range of 10–30 Hz. During the explosion in the quarry on 22 September 2021 the intensity of PSD of the ground velocity is by ~20 dB higher than the values during the explosion in the mine on 4 September 2021 at the point I. The PSD values of ground velocities at the point II mainly coincide for blasts in the mine and the quarry.
The extremum of PSD of the pore pressure variations in the system “reservoir–well” corresponding to seismic impact were traced in the range of higher frequencies of 30–40 Hz (
Figure 8b,d). During the explosions in the mine and the quarry at the point II, located at the reduced distance of 64 and 96 m/kg
1/3 respectively, two extrema appear in the frequency ranges of 0.8-0.9 and 30–40 Hz (
Figure 8d). Intensity of the pore pressure variations at the point I during the explosion in the quarry at the reduced distance of 139 m/kg
1/3 is by ~12 dB higher than the hydrogeological response recorded during the explosion in the mine at the reduced distance of 153 m/kg
1/3 (
Figure 8b). Localization of hydrogelogical responses in a narrower frequency range under seismic action can be due to peculiarities of frequency responses of the system reservoir well [
32].
4.3. Postseismic Hydrogeological Effects
A series of postseismic hydrogeological effects were detected in data processing. When explosions were conducted in the mine in rooms located down the direction of underground stream at the reduced distance of 64–75 m/kg
1/3, the amplitude of postseismic lowering of underground water level at the point II varied from 26 to 146 mm (in one case it was only 21 mm at the point I) during 2.1–6.1 days (
Figure 5). When explosions were conducted in rooms at closer reduced distances of 22–40 m/kg
1/3 up the direction of underground stream, the amplitude of level lowering was less than 2–5 mm during 0.1–0.5 days.
Figure 9a shows a fragment of postseismic water level lowering in the well #3, “cleaned” from the effects of the atmospheric pressure and the earth’s tides. It was registered at ~0.5 h after the explosion in the mine on 4 September 2021. A gradual and long water level lowering is the result of low water transmissivity and permeability of the upper iron ore subformation composed of ferruginous quartzites.
When groups of block were blasted mainly at the western side of the quarry in the range of depths of 200–300 m from the surface at reduced distances of 116–182 m/kg
1/3 from the point I, the postseismic lowering of the water level in the Archaean-Proterozoic aquifer was established accompanied by maximum amplitudes of coseismic variations of the pore pressure in the well #1 (
Figure 6). A step-wise drop of underground water level was registered during the passage of seismic waves produced by the explosion (
Figure 9b). The peak drop of level in the sediments of the lower iron ore subformation composed of metamorphic slate (which shows a rather high water transmissivity and permeability) is less than 7–41 mm during the first hour after the explosion.
The obtained value of maximum drop of underground water level after the explosion in the mine can be used to assess of the overall water production to the zones of induced fracturing. The plot of lowering water level after the explosion in the mine testifies that a quasi-stationary regime of filtration has formed. In these conditions the hydraulic diffusivity (
a), that specifies the rate of depression development, is estimated according to the formula [
39]:
where
Rd is the radius of the zone of quasi-stationary regime, meters;
t0 is the time of emergence of the quasi-stationary regime, days. The storativity (
µ*) can be estimated as follows:
where
T is the transmissivity of the layer, m
2/day.
Under a constant water inflow along the contour of the depression crater, that formed during the explosion, the volume of incoming water (
V) will be proportional to the maximum lowering of the level (
S), the area of formation of the disturbed regime of underground water (
F) and the storativity (
µ*):
For the epicentral distance of 663 m in the alignment “room–well #3” the hydraulic diffusivity (
a) will be 1.8∙10
5 m
2/day, the storativity (
µ*) (with account for the data on probe pumping performed in the well #3, see
Table 1) will be 1.1 × 10
−6. Hence, the volume of water that came to fill the zone of induced fracturing (or the volume of the fractures that emerged during the explosion) will be 0.22 m
3.
5. Discussion
It has been established that in recovering Korobkovskoe and Lebedinskoe iron ore deposits, coseismic and postseismic hydrogeological effects manifest, which differ in their mechanisms of emergence. Coseismic variations are caused by poroelastic deformations of the aquifer under seismic action of explosion waves on the system “reservoir–well”. This is supported by a comparison of the PSD diagrams of the ground velocity and of the pore pressure variations in the system “reservoir–well” during explosions in the mine and in the quarry.
Postseismic effects in the form of a fluent or step-wise decrease of water level in the Archaean-Proterozoic confined aquifer after a short-delay explosion may be caused by two mechanisms: the skin effect (a change in the permeability of a fluid-saturated reservoir in the near-wellbore space) and the irreversible static deformations of the zones of ore crystalline rock disturbed by anthropogenic activities. Conducting explosions in the mine or in the quarry determines the conditions of emerging induced fracturing. In the case of a complex filtering structure, zones of water conductive fractures emerge, which can be attached not only to the well environment, but to boundaries separating eroded and monolithe rocks, lithologic-stratigraphical contacts and discontinuities as well.
Analogous effects of lowering the level of underground water to a value of 8.9 cm were registered in the well Liuja in Taiwan during the passage of seismic waves produced by the Wenchuan earthquake on 12 May 2008 M
W 7.9 in the far field [
40]. Authors suggest such probable mechanisms as fracture unclogging and a breach in the hydraulic links between water-bearing horizons. A step-wise drop of the pore pressure by 12.8–22 kPa was observed at the Kamioka mine in central Japan at the distance of 528 km from the epicenter of the Tohoku earthquake on 11 March 2011 M
W 9.1 in self-streaming horizontal wells #1 and #2 drilled in gneiss 6 m apart [
2]. The authors think that a step-wise drop in pore pressure during the Tohoku is probably caused by the change in the static stress. The authors made calculations according to the model [
41] for volume strain of 340·10
−9, which showed that the change of theoretic pore pressure should had been 6 kPa, which is 2–3 times less than the measured one. Consequently, the decreasing pore pressure during several days after the Tohoku can’t be explained by the change in the poroelastic response only, but probably is supported by the change in permeability of the aquifer and redistribution of the underground stream to the zones of induced fracturing.
Mechanisms of explosions and earthquakes differ: wavefield of an explosion corresponds to a source presenting a center of expansion and vice versa, an earthquake source is characterized by a couple of forces with a quadratic distribution of compression and tension. However, in the zone of static deformation of the aquifer, which corresponds to the near field of the seismic effect, irreversible processes of similar type in the form of dilatancy (fracturing) can probably take place. They manifest both in explosions and in earthquakes. Besides that, alongside with main fractures, local zones of induced fracturing can form both in explosions and in earthquakes. These zones localize along the interfaces of media with different physical and mechanical properties.
The observed postseismic effects probably testify presence of static, irreversible changes in the structure of the water-bearing reservoir. Conducting short-delay explosions in recovering iron ore deposits of KMA leads to an activation of anthropogenic fracturing. In their turn, the emerged areas of induced fracturing can be hydraulically linked to watered zones of exogenous and tectonic fracturing in the ore-crystalline rock.
The Archaean-Proterozoic aquifer under consideration is located in the zone of anthropogenic effect and exhibits a regional trend to lowering the underground water level. Conducting explosions leads to a change in the conditions of underground water transit in the direction to the areas of man-caused discharge due to drainage activities. The slope of underground water stream changes in lateral direction along the contour of Lebedinsky quarry due to increasing area and depth of iron ore excavation. Developing the mine field of the Korobkovskoe deposit promotes the vertical filtration of underground water in the zones of exogenous and tectonic fracturing. The duration of underground water level lowering probably corresponds to the time of infilling the zones of induced fracturing, which probably coincide with potentially unstable zones.
6. Conclusions
As a result of a complex monitoring in two points located within the zones of Korobkovskoe and Lebedinskoe iron ore deposits, that being developed using blasting techniques, the following facts are established:
- -
Coseismic variations of pore pressure manifest in the system reservoir-well during the passage of seismic waves from mass explosions. Amplitudes of hydrogeological responses to blasts in the mine at reduced distances of 22–424 m/kg1/3 at ground velocities of 0.2–17 mm/s change from 0.2 to 14 hPa, and to blasts in the quarry the responses are less than 62 hPa at reduced distances beginning from 139 m/kg1/3 at ground velocity from 13 mm/s.
- -
Waveforms of hydrogeological responses depend on local geological and structural conditions, frequency responses of wells, and parameters of explosions.
- -
Postseismic hydrogeological effects are present. When explosions are conducted in the mine in rooms located down the direction of underground water stream at the reduced distances of 64–75 m/kg1/3, a gradual level lowering was traced during 1–5 days by 2-15 cm. When groups of blocks were blasted at the western side of the Lebedinsky quarry at the reduced distances of 103 and 116-182 m/kg1/3 from the point I, a step-wise drop of the water level by 6–22 mm during the first hour was observed. Registered values of water level lowering after explosions were used to assess the volume of induced fracturing.
A preliminary processing of the obtained data indirectly verifies the irreversible changes in filtration structure of the ore-crystalline rock in the course of developing iron ore deposits of KMA. During developing iron ore deposits it is necessary to provide for high-precision hydrogeological measurements not only in wells on the surface, but also in mines to control changes in the hydrogeodynamic situation. The importance of studying the filtration structure of a mine field lies in the necessity of a predictive assessment of the geoecological safety of mining operations using explosive technologies.
Author Contributions
Conceptualization, E.G.; Formal analysis, E.G., A.B., S.P. and D.P.; Investigation, D.P.; Methodology, E.G. and A.B.; Project administration, E.G.; Software, A.B. and S.P.; Writing—original draft, E.G., A.B., S.P. and D.P.; Writing—review & editing, E.G., A.B., S.P. and D.P. All authors have read and agreed to the published version of the manuscript.
Data Availability Statement
Data is available by request.
Acknowledgments
We are grateful to anonymous reviewers and academic editor for their useful comments.
Conflicts of Interest
The authors declare no conflict of interest.
References
- Kissin, I.G. Fluids in the Earth’s Crust. Geophysical and Tectonic Aspects; Nauka: Moscow, Russia, 2015; 328p. (In Russian) [Google Scholar]
- Kinoshita, C.; Kano, Y.; Ito, H. Shallow crustal permeability enhancement in central Japan due to the 2011 Tohoku earthquake. Geophys. Res. Lett. 2015, 42, 1–8. [Google Scholar] [CrossRef] [Green Version]
- Zhang, Y.; Fu, L.-Y.; Ma, Y.; Hu, J. Different hydraulic responses to the 2008 Wenchuan and 2011 Tohoku earthquakes in two adjacent far-field wells: The effect of shales on aquifer lithology. Earth Planets Space 2016, 1–16. [Google Scholar] [CrossRef] [Green Version]
- Ma, Y.; Huang, F. Coseimic water level changes induced by two distant earthquakes in multiple wells of the Chinese mainland. Tectonophysics 2017, 694, 57–68. [Google Scholar] [CrossRef]
- Wang, C.-Y.; Manga, M. Water and Earthquakes; Springer Nature: Berkeley, CA, USA, 2021; 386p. [Google Scholar] [CrossRef]
- Chia, Y.-P.; Wang, Y.-S.; Huang, C.-C.; Chen, J.-S.; Wu, H.-P. Coseismic changes of groundwater level in response to the 1999 Chi-Chi earthquake. West. Pac. Earth Sci. 2002, 2, 261–272. [Google Scholar]
- Liao, X.; Wang, C.-Y.; Liu, C.-P. Disruption of groundwater systems by earthquakes. Geophys. Res. Lett. 2015, 42, 9758–9763. [Google Scholar] [CrossRef]
- Shi, Z.; Wang, G.; Liu, C.; Mei, J.; Wang, J.; Fang, H. Coseismic response of groundwater level in the Three Gorges well network and its relationship to aquifer parameters. Chin. Sci. Bulletin. Sept. 2013, 58, 3080–3087. [Google Scholar] [CrossRef] [Green Version]
- Shi, Z.; Wang, G. Earthquakes switch aquifers from confined to semi-confined. Geophys. Res. Lett. 2016, 43, 11,161–11,172. [Google Scholar] [CrossRef]
- Chelidze, T.L.; Shengelia, I.; Zhukova, N.; Matcharashvili, T.; Melikadze, G.; Kobzev, G. M9 Tohoku Earthquake Hydro- and Seismic Response in the Caucasus and North Turkey. Acta Geophys. 2016, 64, 567–588. [Google Scholar] [CrossRef] [Green Version]
- Kopylova, G.N.; Boldina, S.V. Effects of Seismic Waves in Water Level Changes in a Well: Empirical Data and Models. Izv. Phys. Solid Earth 2020, 56, 530–549. [Google Scholar] [CrossRef]
- Sun, X.; Wang, G.; Yang, X. Coseismic Response of Water Level in Changping Well, China, to the Mw 9.0 Tohoku Earthquake. J. Hydrol. 2015, 531, 1028–1039. [Google Scholar] [CrossRef]
- Izrael, Y.A.; Petrov, V.N.; Pressman, A.Y.; Rovinskiy, F.Y.; Stukin, E.D.; Ter-Saakov, A.A. Radioactive Contamination of the Underground Media for Underground Nuclear Explosions and Forecasting Methods; Gidromet: Leningrad, Russia, 1970; 68p. (In Russian) [Google Scholar]
- Adushkin, V.V.; Spivak, A.A.; Gorbunova, E.M.; Ferapontova, E.N. Hydrogeological effects of underground nuclear expositions. Doclady Earth Sci. 1993, 332, 372–374. [Google Scholar]
- Knox, B.J.; Rawson, D.E.; Korver, J.A. Analysis of a Groundwater Anomaly Created by an Underground Nuclear Explosion. J. Geophys. Res. 1965, 70, 823–835. [Google Scholar] [CrossRef]
- Gorbunova, E. Large-Scale Explosion and Induced Seismicity: Geological, Structural, and Hydrogeological Impacts. Pure Appl. Geophys. 2021, 178, 1223–1234. [Google Scholar] [CrossRef]
- Gorbunova, E.M.; Svintsov, I.S. Retrospective analysis of ground water regime while conducting large scale experiments. Vestn. NYaTs RK 2010, 1, 88–96. (In Russian) [Google Scholar]
- Geologic and Hydrologic Effects of the MILROW Event, Amchitka, Aleutian Islands, Alaska; U.S. Geol. Surv. Rept.: Reston, VA, USA, 1971; USGS-474-32; 85p.
- Gonzales, D.D.; Wollitz, L.E. Hydrogeological effects of the Cannikin event. Bull. Seism. Soc.Am. 1972, 62, 1527–1542. [Google Scholar] [CrossRef]
- Hassan, A.; Pohlmann, K.; Chapman, J. Modeling Groundwater Flow and Transport of Radionuclides at Amchitka Island’s Underground Nuclear Tests: Mirlow, Long Shot, and Cannikin; Nevada Operations Office. U.S. Department of Energy: Las Vegas, NV, USA, 2002; p. 338.
- Wang, C.-Y.; Wong, A.; Dreger, D.S.; Manga, M. Liquefaction limit during earthquakes and underground explosions: Implications on ground-motion attenuation. Bull. Seismol. Soc. Am. 2006, 96, 355–363. [Google Scholar] [CrossRef]
- Huang, L.; Xu, Y.; Liu, S.; Gai, Q.; Miao, W.; Li, Y.; Zhao, L. Research on the formation mechanism of pre-mining microseismic and risk assessment of floor water inrush: A case study of the Wutongzhuang coal mine in China. Sustainability 2022, 14, 9774. [Google Scholar] [CrossRef]
- Zhukova, S.A.; Zhuravleva, O.G.; Onuprienko, V.S.; Streshnev, A.A. Peculiarities of the seismic regime of the rock mass during the development of rock burst-prone deposits of the Khibiny massif. Min. Inf. Anal. Bull. 2022, 7, 5–17. [Google Scholar] [CrossRef]
- Lai, X.; Dai, J.; Xu, H.; Chen, X. Multifield environmental analysis and hazards prevention of steeply inclined deep coal mining. Adv. Civil. Eng. 2021, 6651088, 12. [Google Scholar] [CrossRef]
- Wang, W.X.; Sui, W.H.; Faybishenko, B.; Stringfellow, W.T. Permeability variations within mining-induced fractured rock mass and its influence on groundwater inrush. Environ Earth Sci. 2016, 75, 326. [Google Scholar] [CrossRef] [Green Version]
- Suzuki, R.; Yamaoka, K.; Tsuji, S.; Watanabe, T. Ground water-induced changes in velocities of P and S waves (VP and VS) measured using an accurately controlled seismic source. Earth Planets Space 2021, 73, 152. [Google Scholar] [CrossRef]
- Karablin, M.M.; Prostov, S.M.; Smirnov, N.A. Assessing the impact made by groundwater processes and undermining on coal pit wall stability. Izv. Vyss. Uchebnykh Zavedenii. Gorn. Zhurnal. 2021, 1, 36–44. [Google Scholar] [CrossRef]
- Pavlov, D.V.; Besedina, A.N.; Gorbunova, E.M.; Ostapchuk, A.A. Response of an aquifer to the passage of seismic waves in the close-in zone of a ripple-fired explosion in a mine. In Proceedings of the International Society for Rock Mechanics and Rock Engineering. Norwegian Group for Rock Mechanics. EUROCK 2020 Symposium Proceedings, Trondheim, Norway, 14–19 July 2020; ISBN 978-82-8208-072-9. ISRM-EUROCK-2020-166. [Google Scholar]
- Gorbunova, E.M.; Besedina, A.N.; Kabychenko, N.V.; Batukhtin, I.V.; Petukhova, S.M. Postseismic effects of mass explosions identified during the development of KMA iron ore deposits. Dyn. Processes Geosph. 2022, 1, 51–68. [Google Scholar] [CrossRef]
- Golivkin N., I.; Canons, V.P. Iron Ores of KMA; Geoinformmark: Moscow, Russia, 2001; 616p. (In Russian) [Google Scholar]
- Gorbunova, E.M.; Besedina, A.N.; Kabychenko, N.V.; Batukhtin, I.V.; Petukhova, S.M. Response of Water-Saturated Reservoirs to a Dynamic Impact Based on the Data of Groundwater-Level Monitoring by Precision Measurements. Izv. Phys. Solid Earth 2021, 57, 644–658. [Google Scholar] [CrossRef]
- Gorbunova, E.M.; Besedina, A.N.; Kabychenko, N.V.; Batukhtin, I.V.; Petukhova, S.M. Precision Hydrogeological Monitoring in Technogenically Disturbed Conditions: Organization, Execution, and Processing of Experimental Data. Seism. Instr. 2021, 57, 600–613. [Google Scholar] [CrossRef]
- Wenzel, H.G. Earth tide analysis package ETERNA 3.0. BIM 1994, 118, 8719–8721. [Google Scholar]
- Kabychenko, N.V. Evaluation of the phase shift between tidal deformation and variations in the water level in the well. In Local and Global Manifestations of Impacts on the Geosphere: Collection of Scientific Papers of IDG RAS; GEOS: Moscow, Russia, 2008; p. 6272. (In Russian) [Google Scholar]
- Vinogradov, E.; Gorbunova, E.; Besedina, A.; Kabychenko, N. Earth Tide Analysis Specifics in Case of Unstable Aquifer Regime. Pure Appl. Geophys. 2017, 174. [Google Scholar] [CrossRef]
- Hsieh, P.; Bredehoeft, J.; Farr, J. Determination of aquifer transmissivity from earth tide analysis. Water Resour. Res 1987, 23, 1824–1832. [Google Scholar] [CrossRef]
- McNamara, D.E.; Buland, R.P. Ambient noise levels in the continental United States. Bull. Seismol. Soc. Amer. 2004, 94, 1517–1527. [Google Scholar] [CrossRef]
- Peterson, J. Observations and modeling of seismic background noise. U.S. Geol. Surv. Open-File Report 93-322 1993, 1–95. [Google Scholar] [CrossRef]
- Borevsky, B.V.; Samsonov, B.G.; Yazvin, L.S. Method for Determining the Parameters of Aquifers According to Pumping Data; Nedra: Moscow, Russia, 1979; (In Russian). 326p. [Google Scholar]
- Lee, T.-P.; Chia, Y.; Yang, H.-Y.; Liu, C.-Y.; Chiu, Y.-C. Groundwater Level Changes in Taiwan Caused by The Wenchuan Earthquake. Pure Appl. Geophys. 2012, 169, 1947–1962. [Google Scholar] [CrossRef]
- Okada, Y. Internal deformation due to shear and tensile faults in a half space. Bull. Seismol. Soc. Am. 1992, 82, 1018–1040. [Google Scholar] [CrossRef]
| Disclaimer/Publisher’s Note: The statements, opinions and data contained in all publications are solely those of the individual author(s) and contributor(s) and not of MDPI and/or the editor(s). MDPI and/or the editor(s) disclaim responsibility for any injury to people or property resulting from any ideas, methods, instructions or products referred to in the content. |
© 2023 by the authors. Licensee MDPI, Basel, Switzerland. This article is an open access article distributed under the terms and conditions of the Creative Commons Attribution (CC BY) license (https://creativecommons.org/licenses/by/4.0/).


 —Korobkovskoe,
  —Lebedinskoe); 2—observation points and their numbers (I and II); 3—the line of cross section; 1–12b: 1–6—deposits: 1—Quaternary, 2—Upper Cretaceous, 3—Lower Cretaceous,4—Jurassic, 5—Devonian, 6—Archean-Proterozoic; 7—the level of the upper aquifer; 8—level of the lower aquifer; 9—zone of exogenous fracturing (top) and systems of individual fractures (bottom); 10—technogenic fractures; 11—boundaries of iron ore deposits; 12—well) (based on [30]).


