
A Multi-Criteria Decision-Making Technique Using Remote Sensors to Evaluate the Potential of Groundwater in the Arid Zone Basin of the Atacama Desert

 ,
,  ,
,  and
and 
Abstract
:1. Introduction
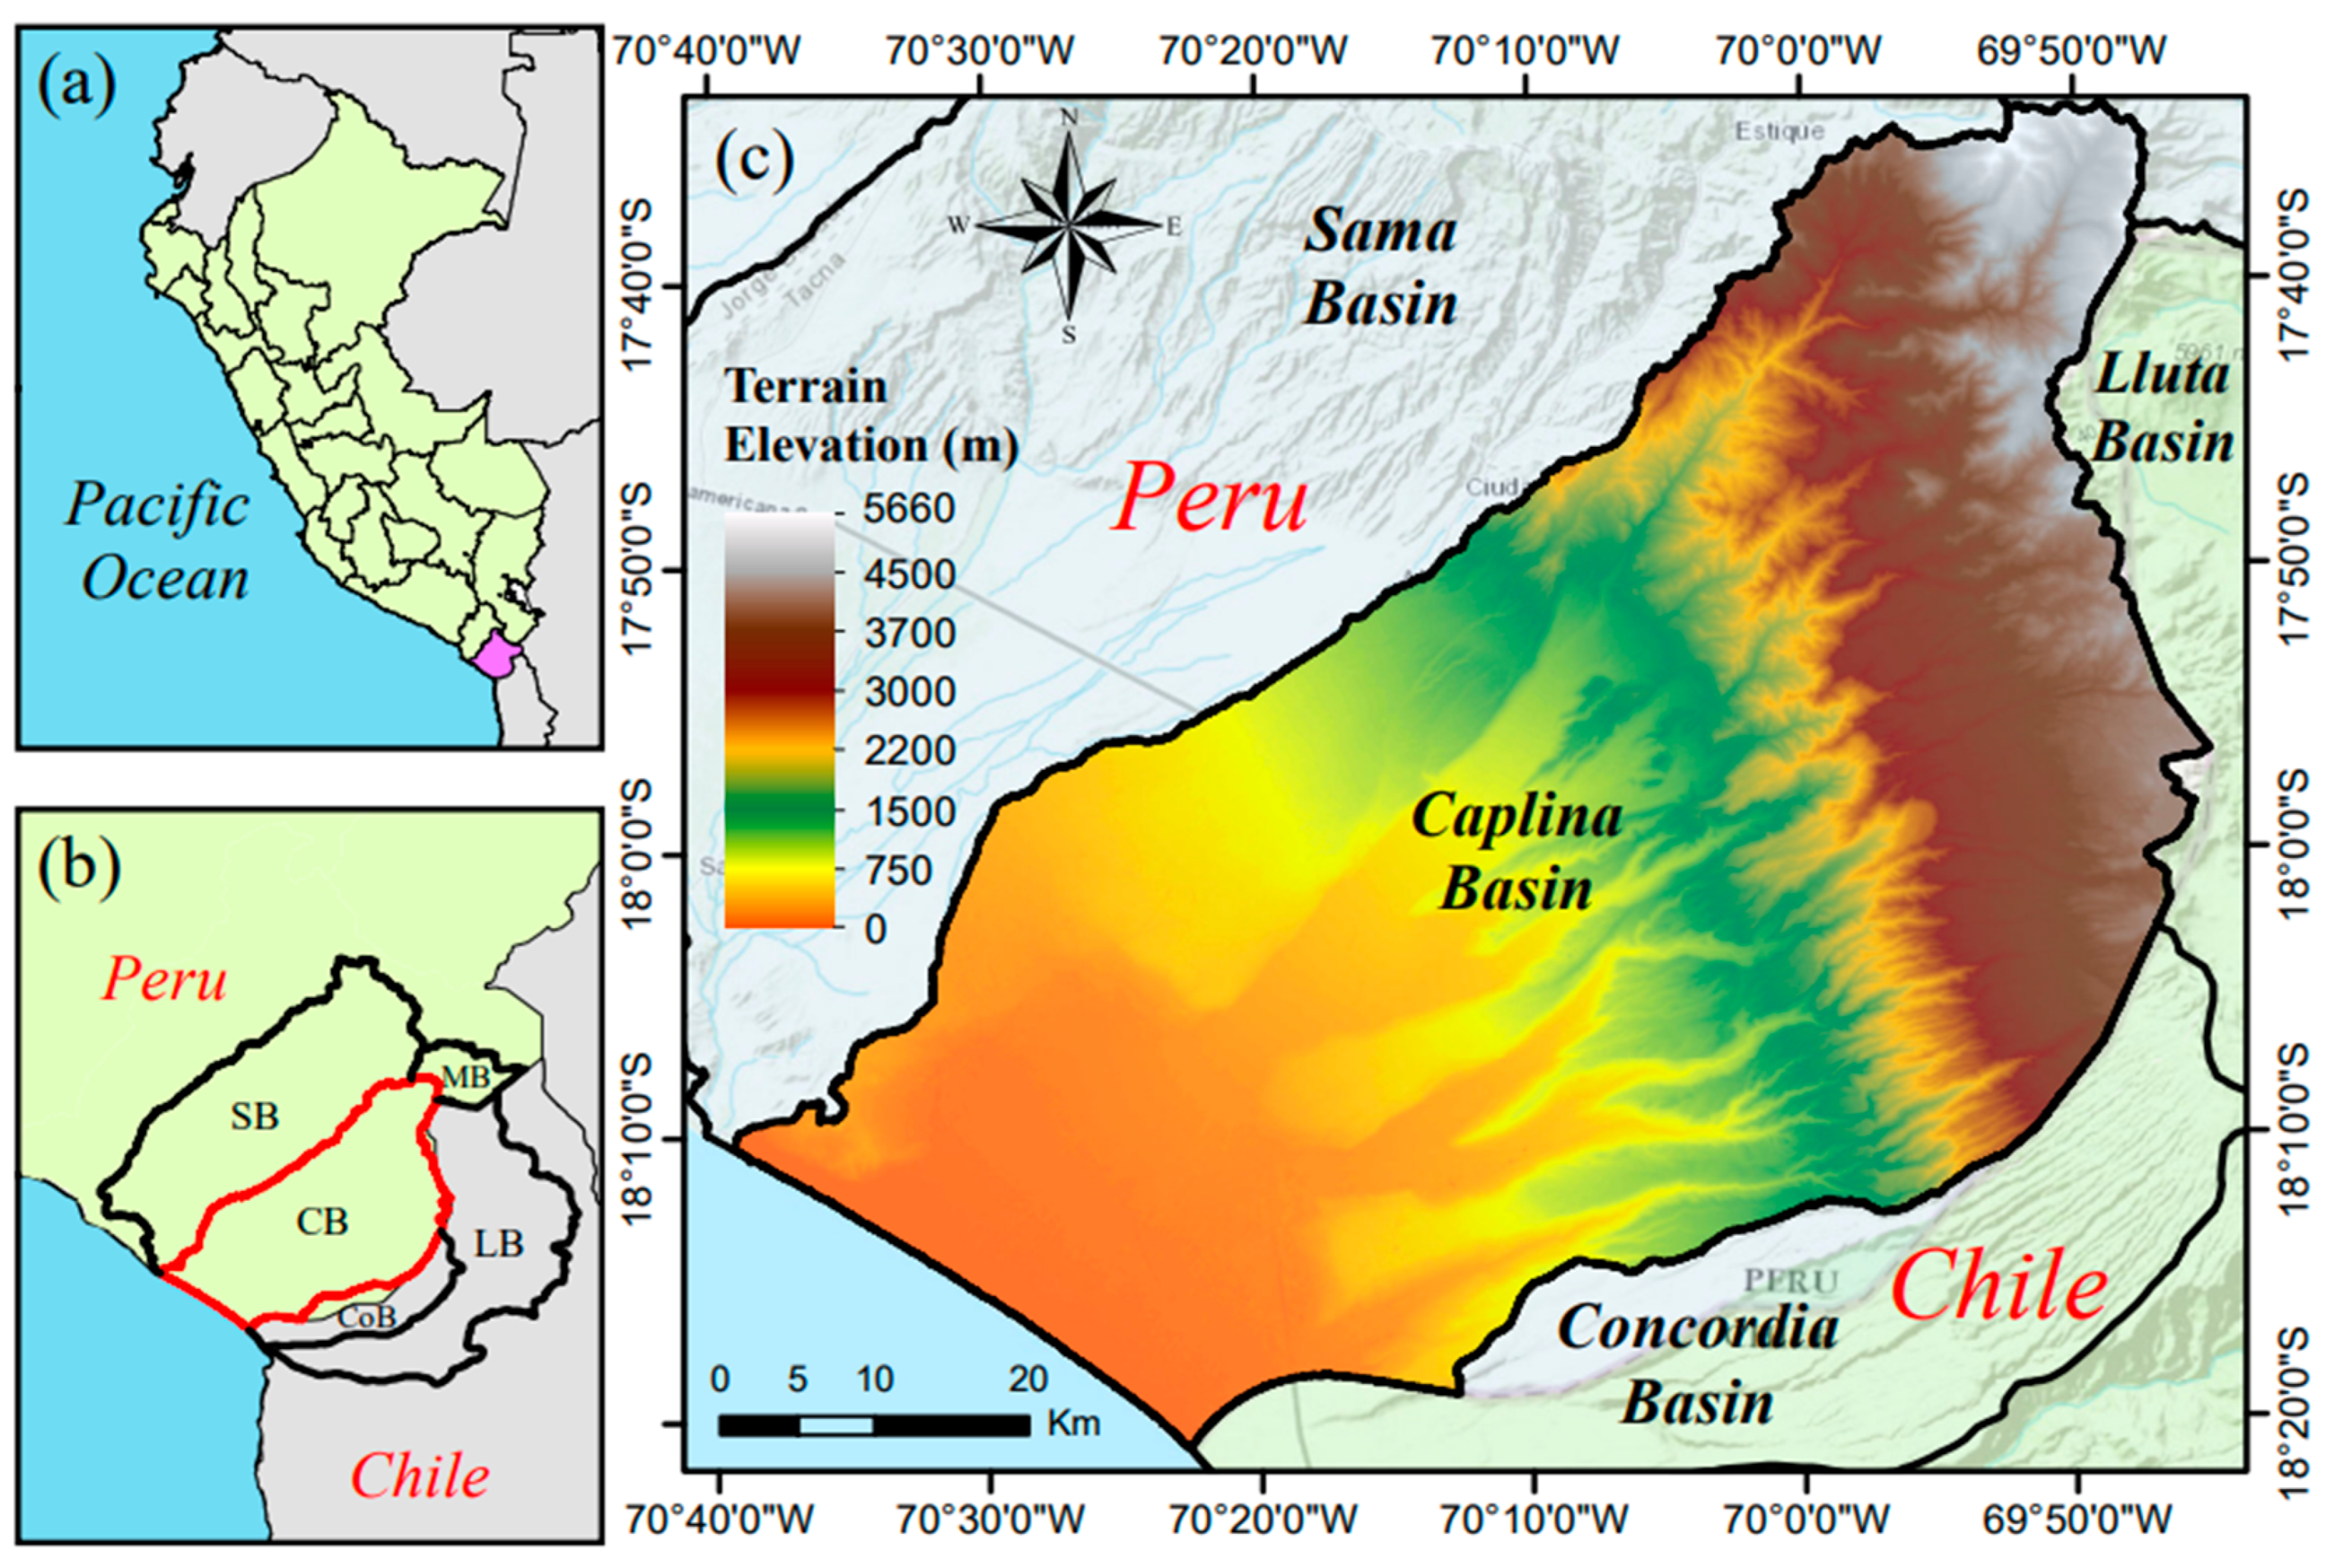
2. Study Area
2.1. Location and Climate
2.2. Geological Setting
3. Materials and Methods
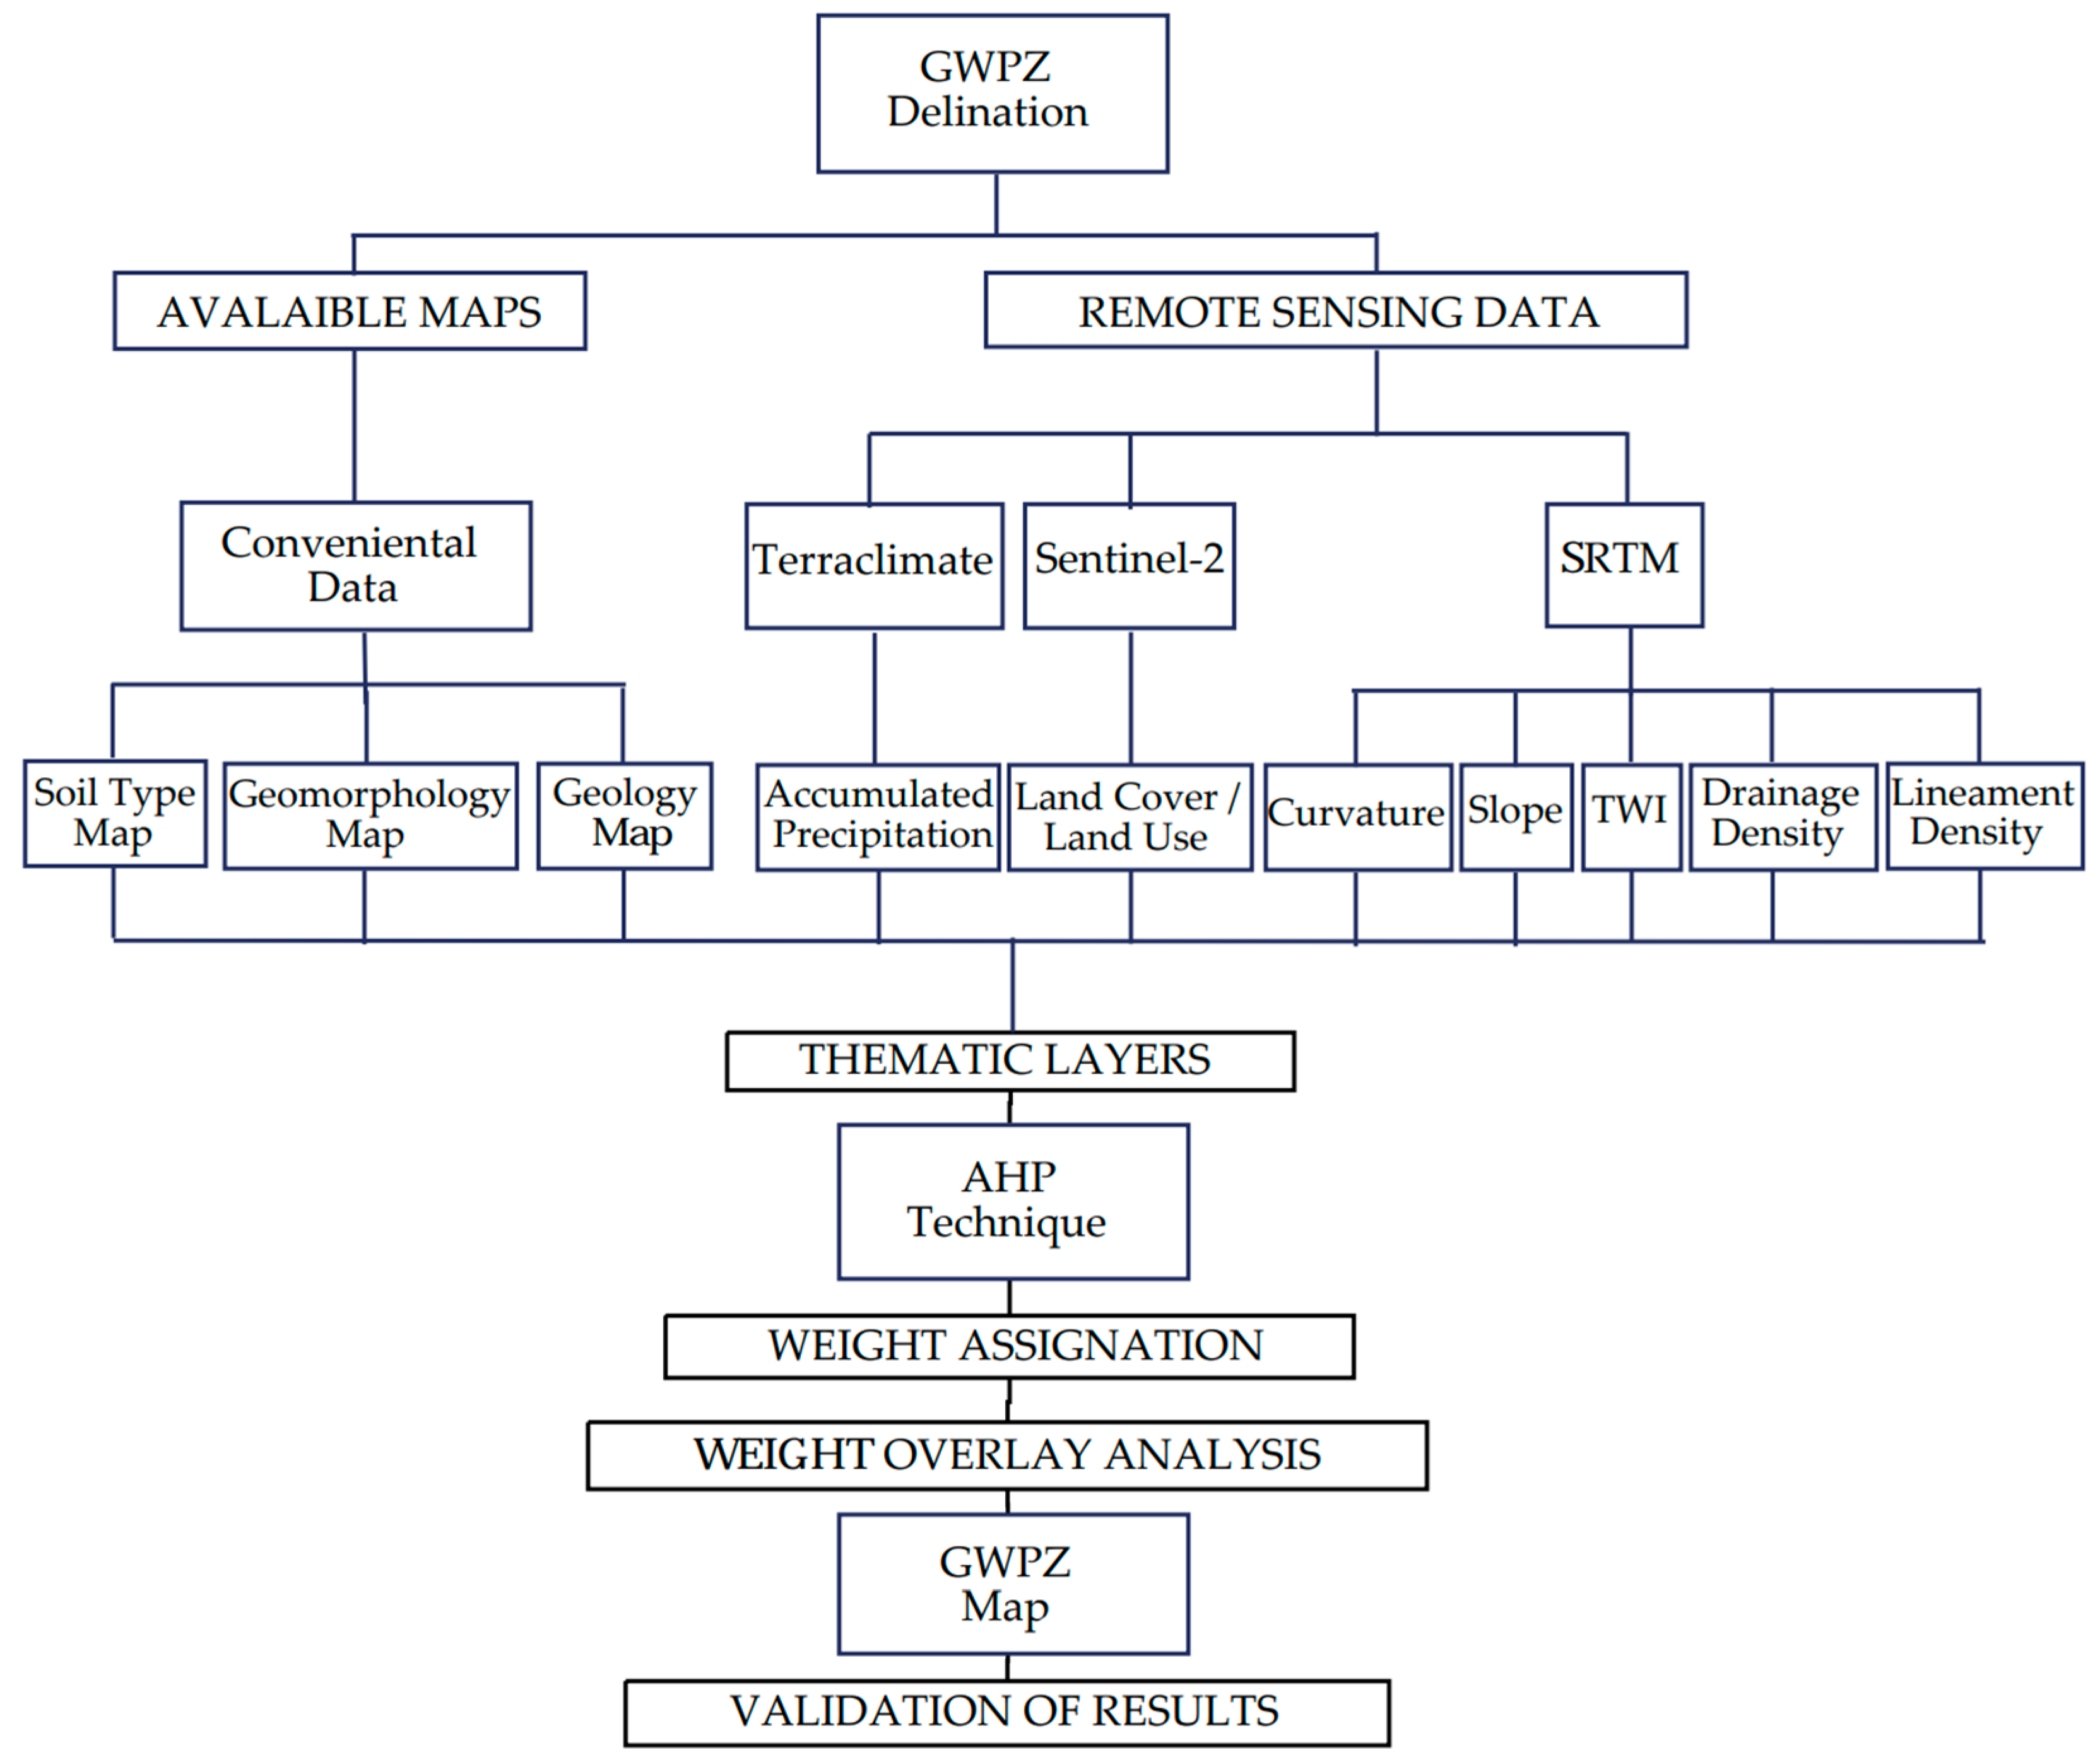
3.1. Methodology
3.2. Datasets and Sources
3.3. Weight Assignment Using AHP
3.4. Weighted Overlay Integration

| GL | SL | GM | AP | LU | SO | LD | DD | CV | TWI | |
| GL | 1 | 2.00 | 3.00 | 3.00 | 5.00 | 9.00 | 6.00 | 7.00 | 8.00 | 9.00 |
| SL | 0.50 | 1 | 2.00 | 4.00 | 5.00 | 7.00 | 5.00 | 7.00 | 6.00 | 8.00 |
| GM | 0.33 | 0.50 | 1 | 3.00 | 4.00 | 5.00 | 7.00 | 6.00 | 7.00 | 8.00 |
| AP | 0.33 | 0.25 | 0.33 | 1 | 2.00 | 3.00 | 5.00 | 7.00 | 6.00 | 8.00 |
| LU | 0.20 | 0.20 | 0.25 | 0.50 | 1 | 2.00 | 3.00 | 4.00 | 3.00 | 4.00 |
| SO | 0.11 | 0.14 | 0.20 | 0.33 | 0.50 | 1 | 2.00 | 3.00 | 3.00 | 4.00 |
| LD | 0.17 | 0.20 | 0.14 | 0.20 | 0.33 | 0.50 | 1 | 2.00 | 2.00 | 4.00 |
| DD | 0.14 | 0.14 | 0.17 | 0.14 | 0.25 | 0.33 | 0.50 | 1 | 3.00 | 4.00 |
| CV | 0.12 | 0.17 | 0.14 | 0.17 | 0.33 | 0.33 | 0.50 | 0.33 | 1 | 2.00 |
| TWI | 0.11 | 0.12 | 0.12 | 0.12 | 0.25 | 0.25 | 0.25 | 0.25 | 0.50 | 1 |
| Sum | 3.02 | 4.73 | 7.36 | 12.47 | 18.67 | 28.42 | 30.25 | 37.58 | 39.50 | 52.00 |
| GL | SL | GM | AP | LU | SO | LD | DD | CV | TWI | Nwt % | |
| GL | 0.331 | 0.423 | 0.408 | 0.241 | 0.268 | 0.317 | 0.198 | 0.186 | 0.203 | 0.173 | 28.00 |
| SL | 0.165 | 0.212 | 0.272 | 0.321 | 0.268 | 0.246 | 0.165 | 0.186 | 0.152 | 0.154 | 22.40 |
| GM | 0.110 | 0.106 | 0.136 | 0.241 | 0.214 | 0.176 | 0.231 | 0.160 | 0.177 | 0.154 | 17.40 |
| AP | 0.110 | 0.053 | 0.045 | 0.080 | 0.107 | 0.106 | 0.165 | 0.186 | 0.152 | 0.154 | 11.20 |
| LU | 0.066 | 0.042 | 0.034 | 0.040 | 0.054 | 0.070 | 0.099 | 0.106 | 0.076 | 0.077 | 6.50 |
| SO | 0.037 | 0.030 | 0.027 | 0.027 | 0.027 | 0.035 | 0.066 | 0.080 | 0.076 | 0.077 | 4.60 |
| LD | 0.055 | 0.042 | 0.019 | 0.016 | 0.018 | 0.018 | 0.033 | 0.053 | 0.051 | 0.077 | 3.50 |
| DD | 0.047 | 0.030 | 0.023 | 0.011 | 0.013 | 0.012 | 0.017 | 0.027 | 0.076 | 0.077 | 2.90 |
| CV | 0.041 | 0.035 | 0.019 | 0.013 | 0.018 | 0.012 | 0.017 | 0.009 | 0.025 | 0.038 | 2.10 |
| TWI | 0.037 | 0.026 | 0.017 | 0.010 | 0.013 | 0.009 | 0.008 | 0.007 | 0.013 | 0.019 | 1.50 |
| Sum | 1.000 | 1.000 | 1.000 | 1.000 | 1.000 | 1.000 | 1.000 | 1.000 | 1.000 | 1.000 | 100.00 |
4. Results
4.1. Thematic Layer Description
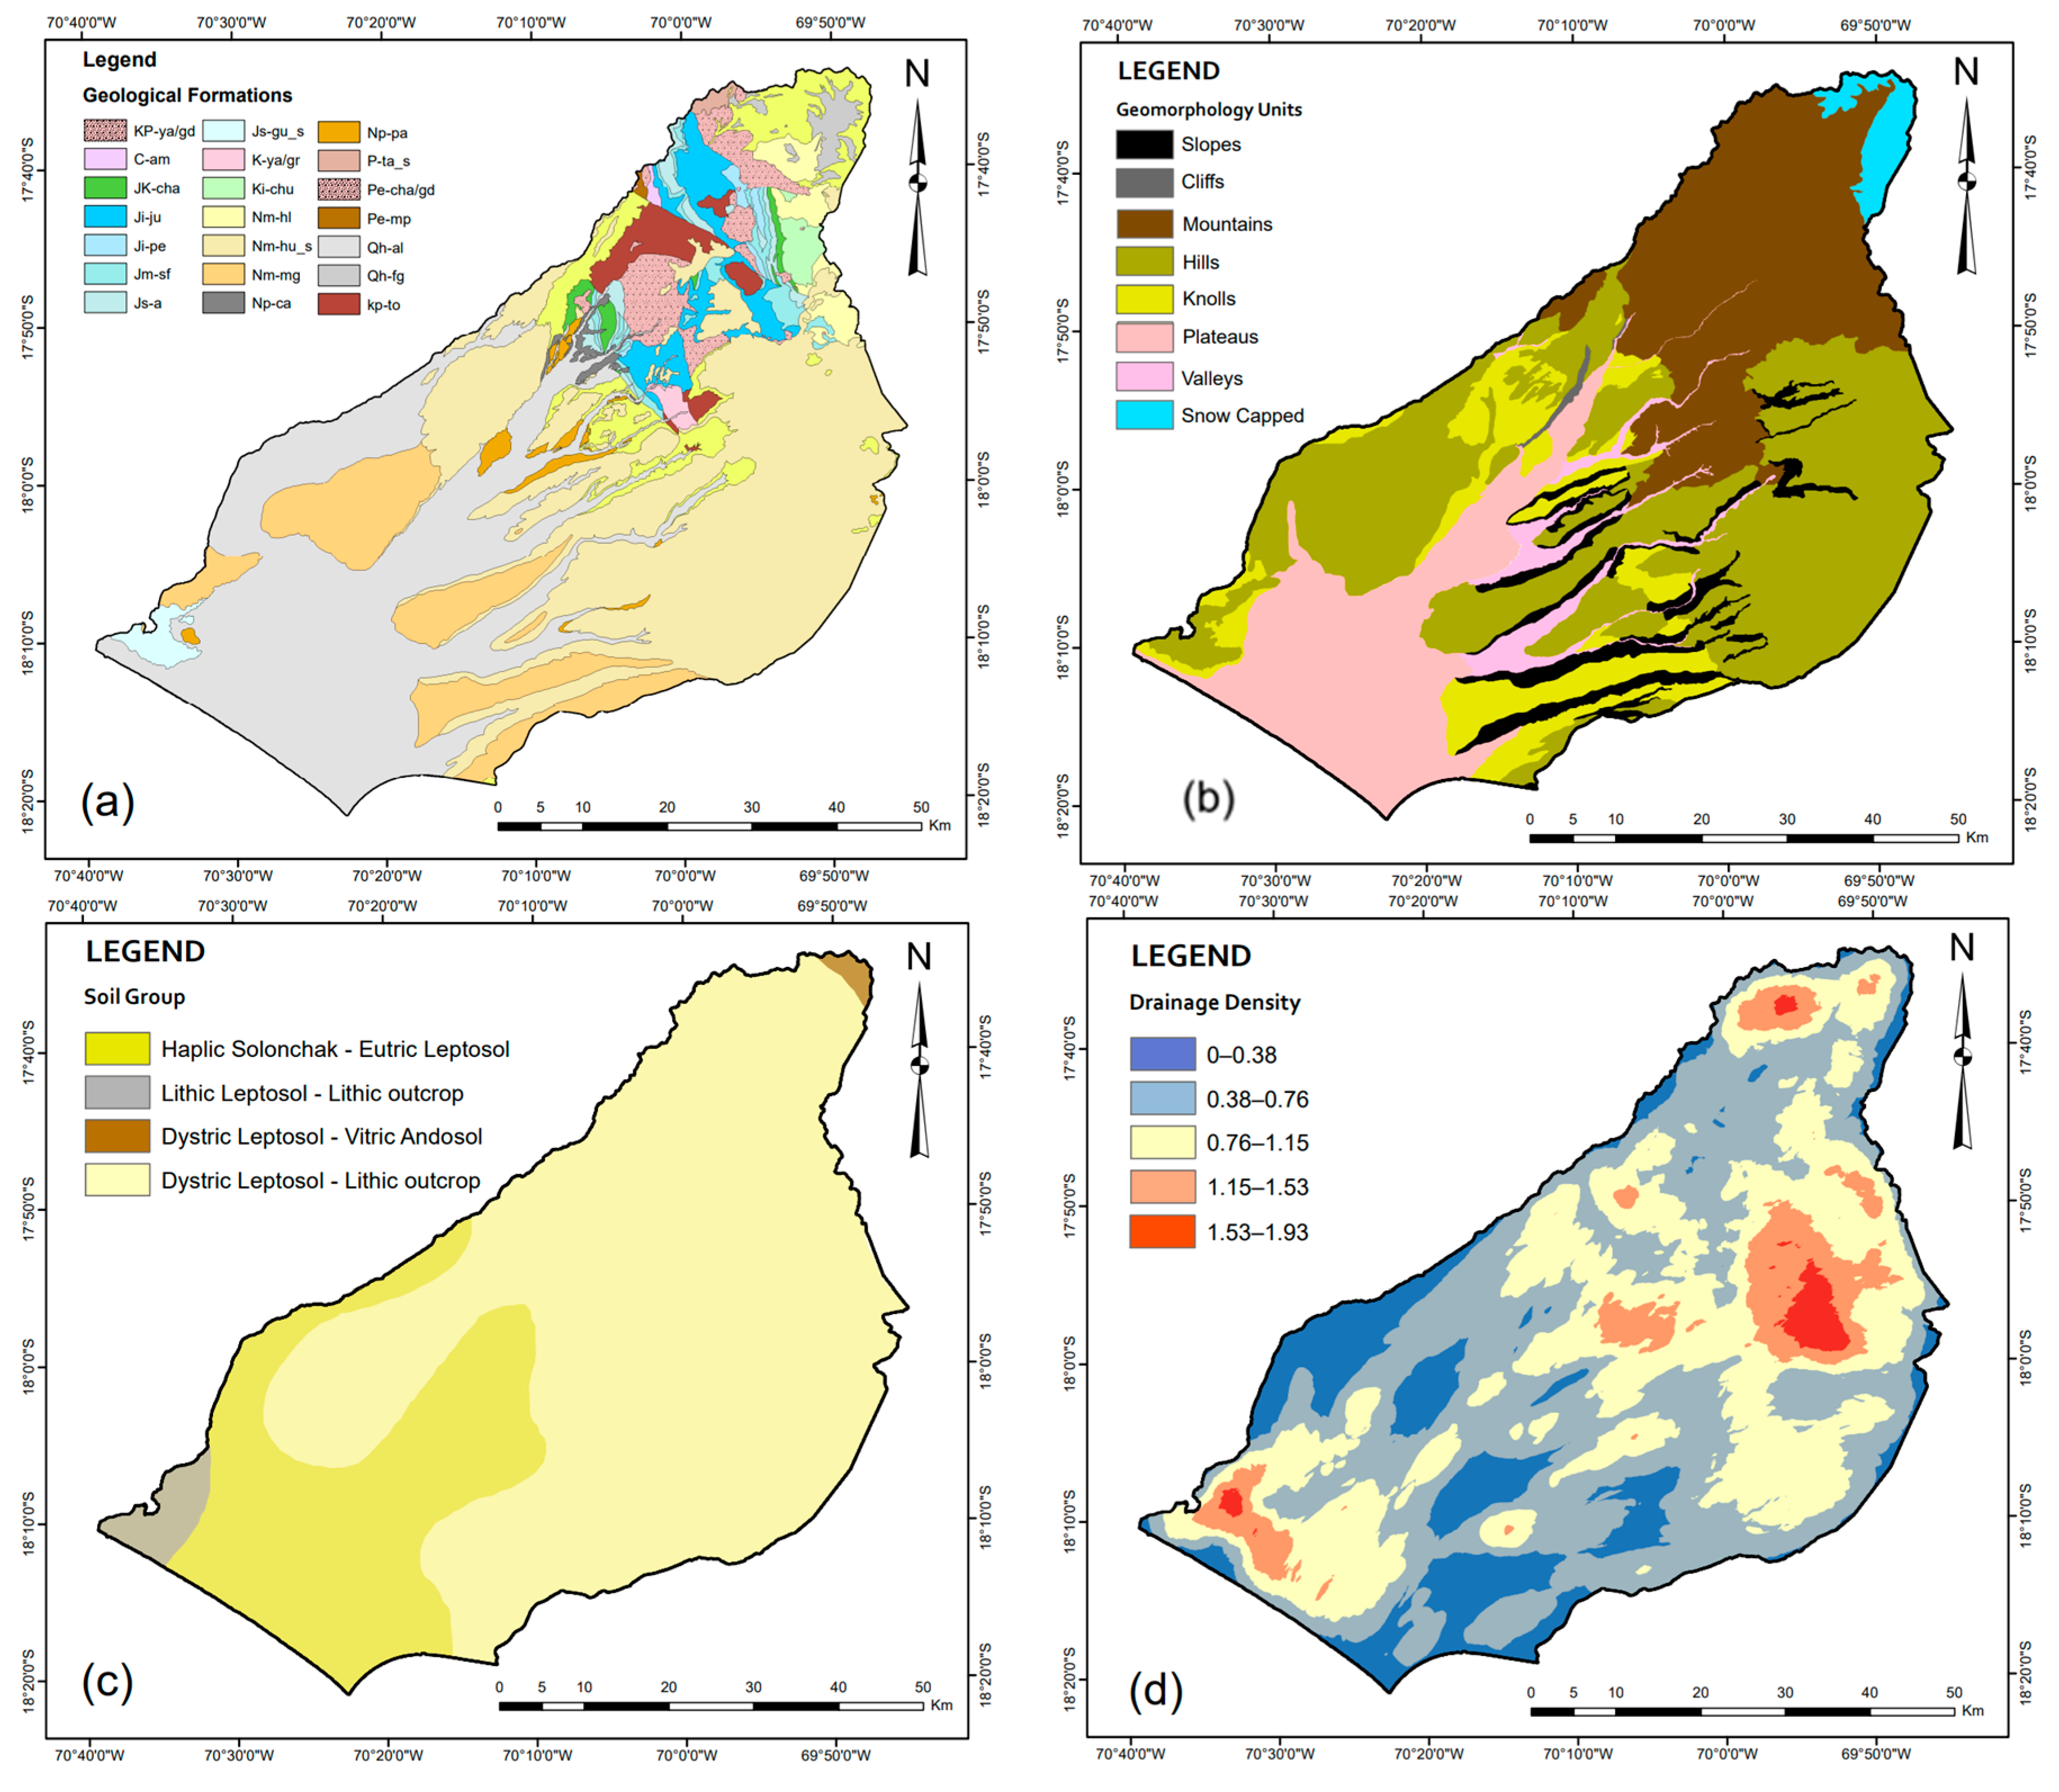
4.1.1. Geology
4.1.2. Geomorphology
4.1.3. Soil
4.1.4. Drainage Density
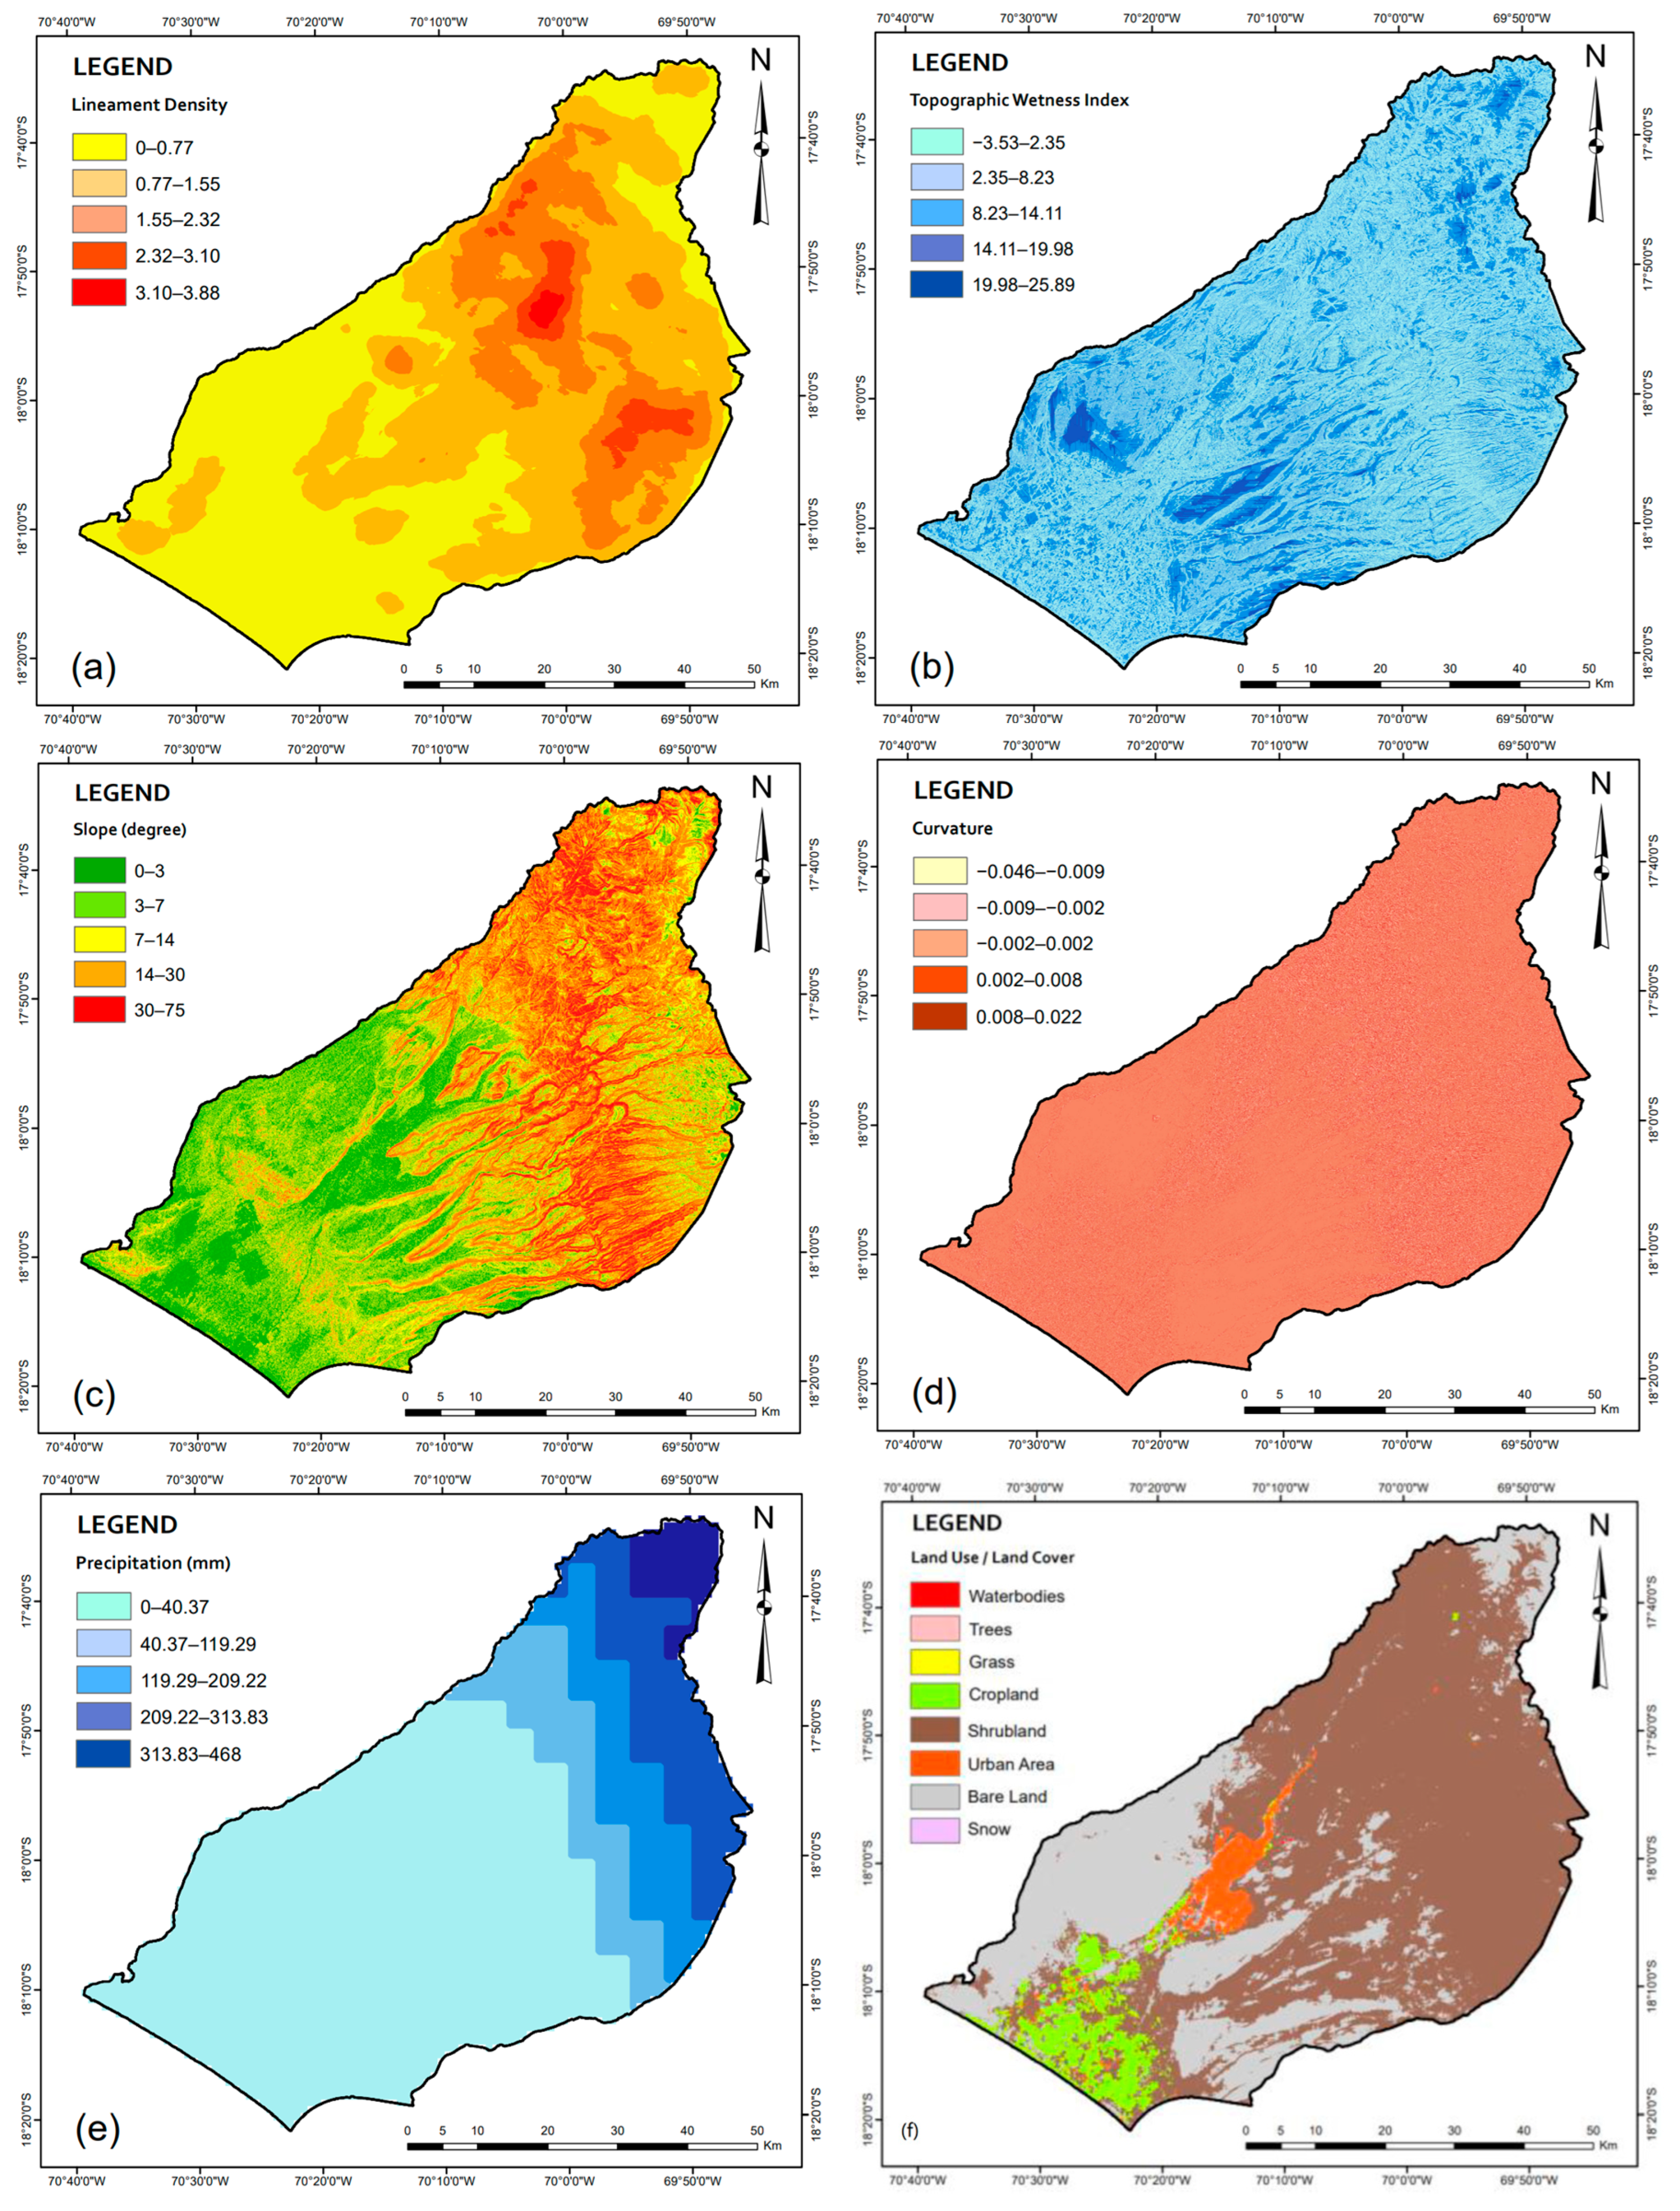
4.1.5. Lineament Density
4.1.6. Topographic Wetness Index
4.1.7. Slope
4.1.8. Curvature
4.1.9. Accumulated Precipitation
4.1.10. LU/LC
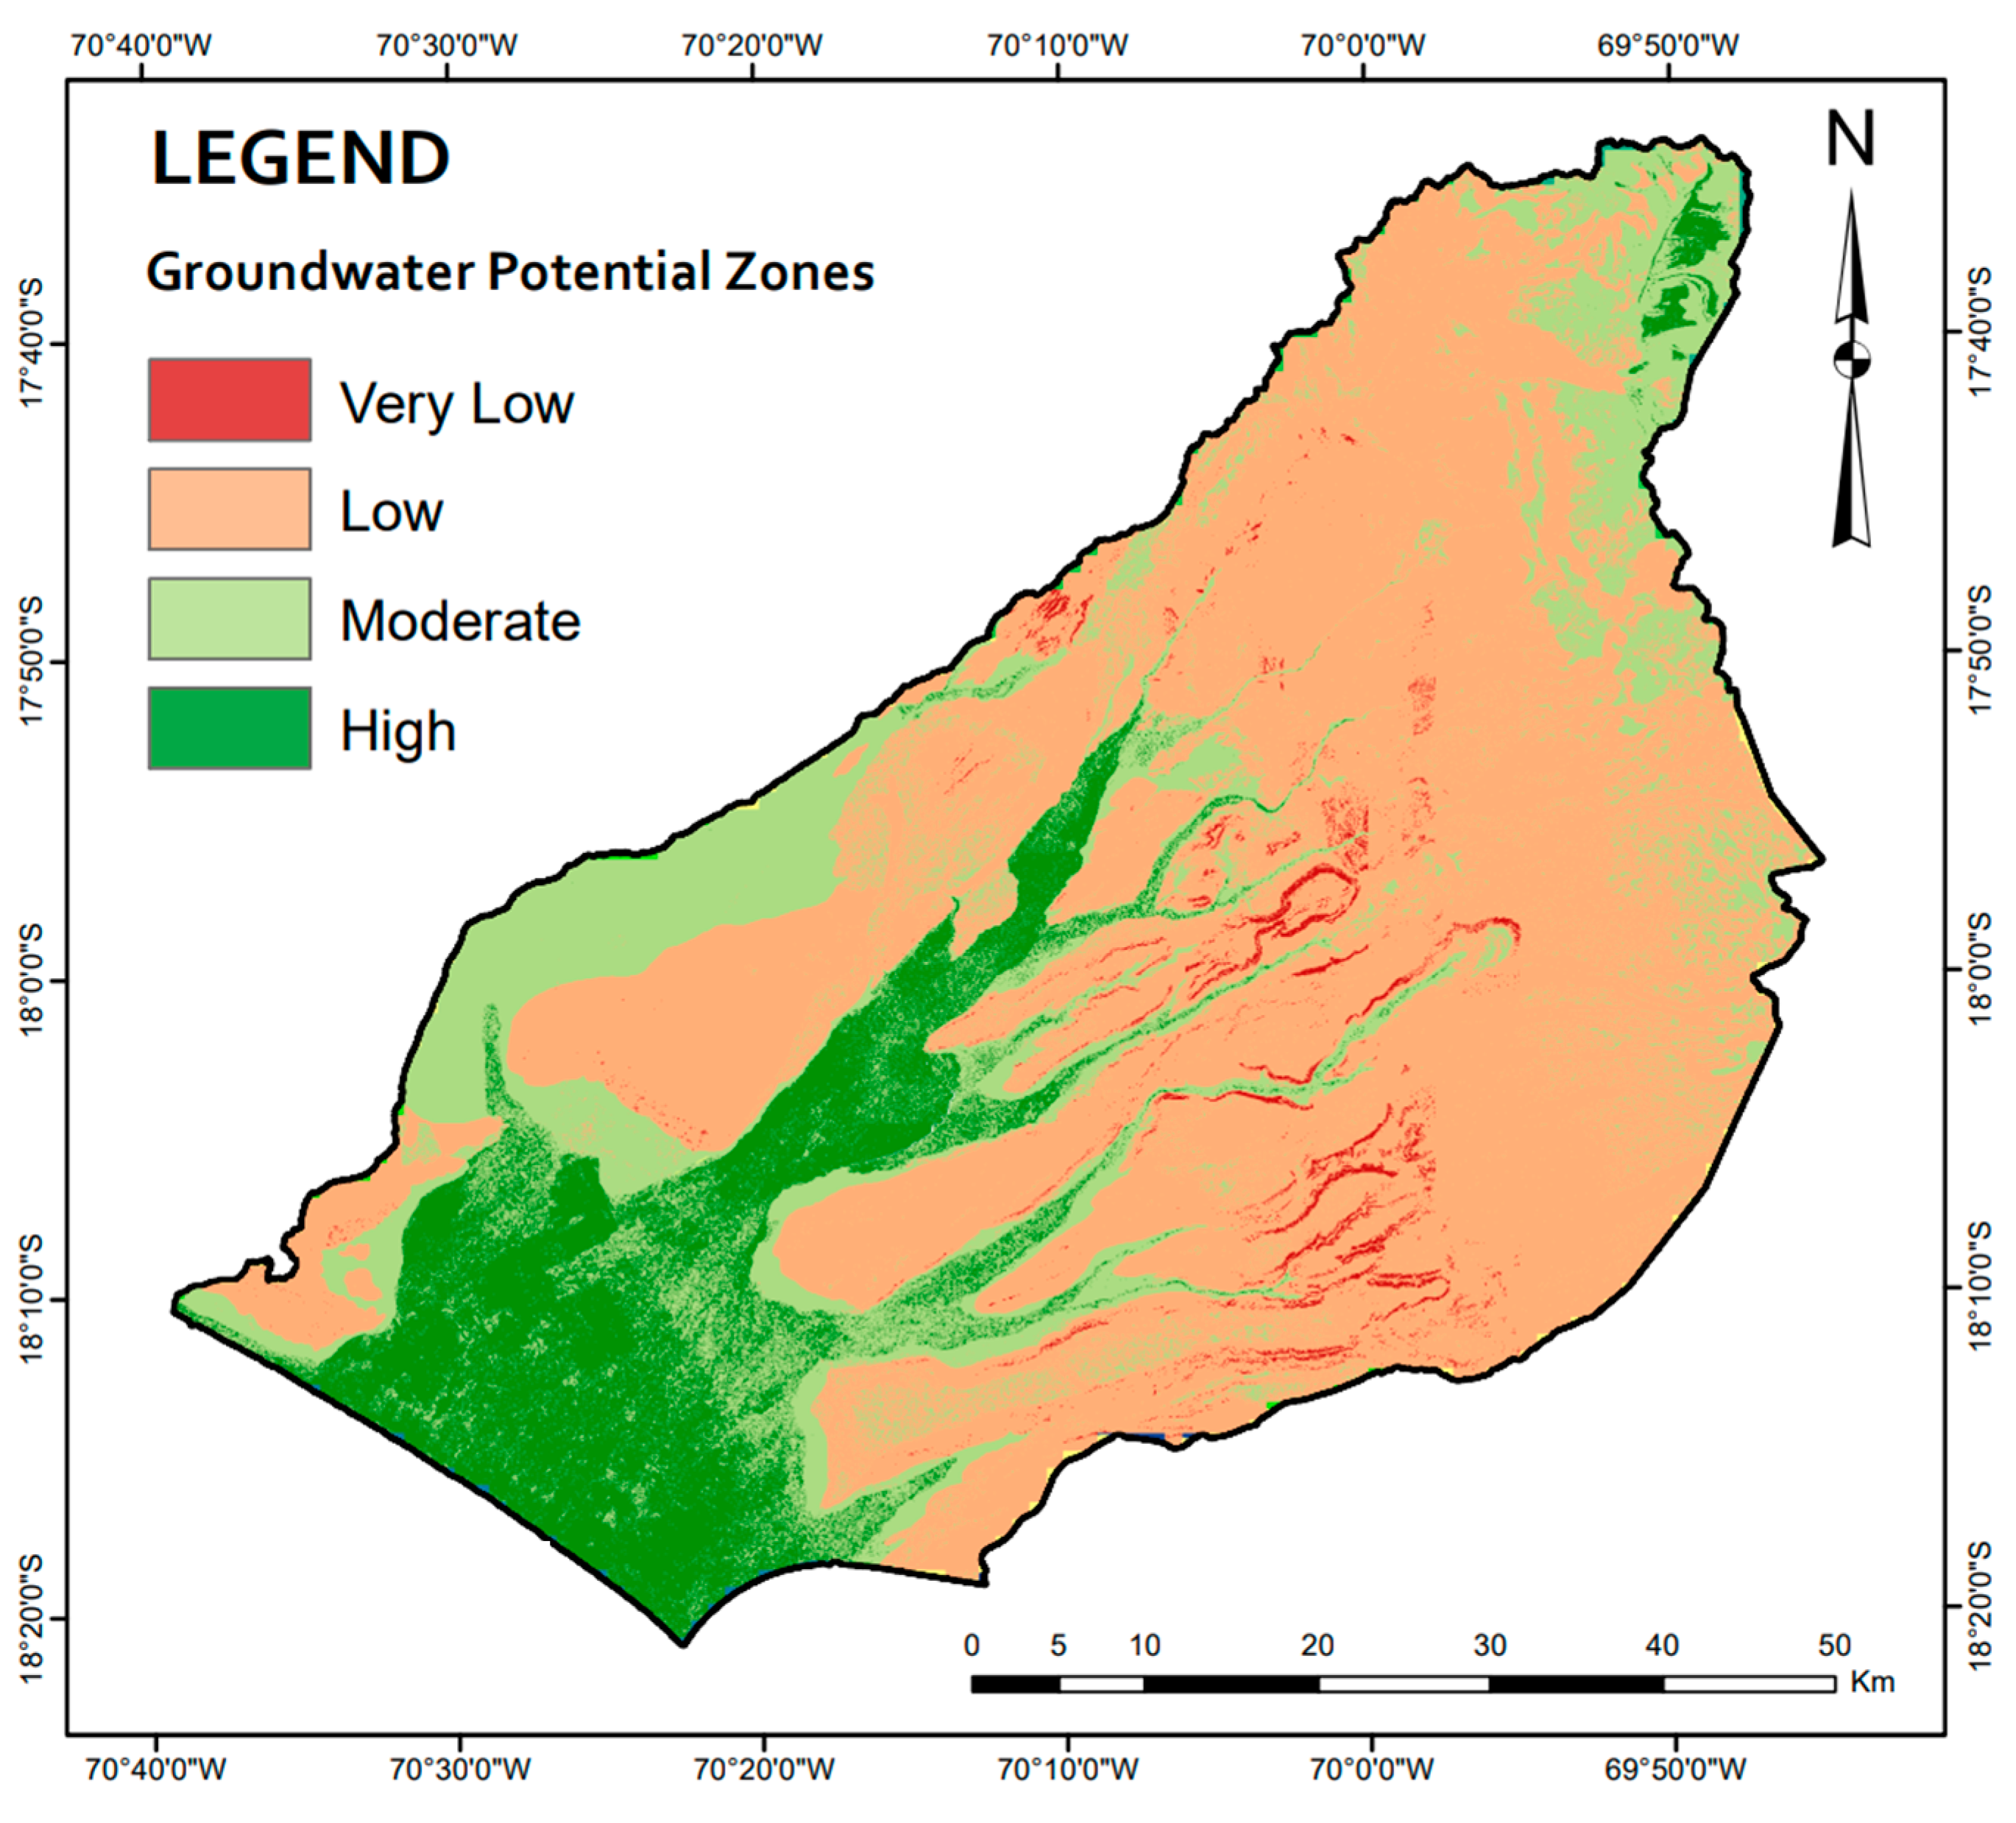
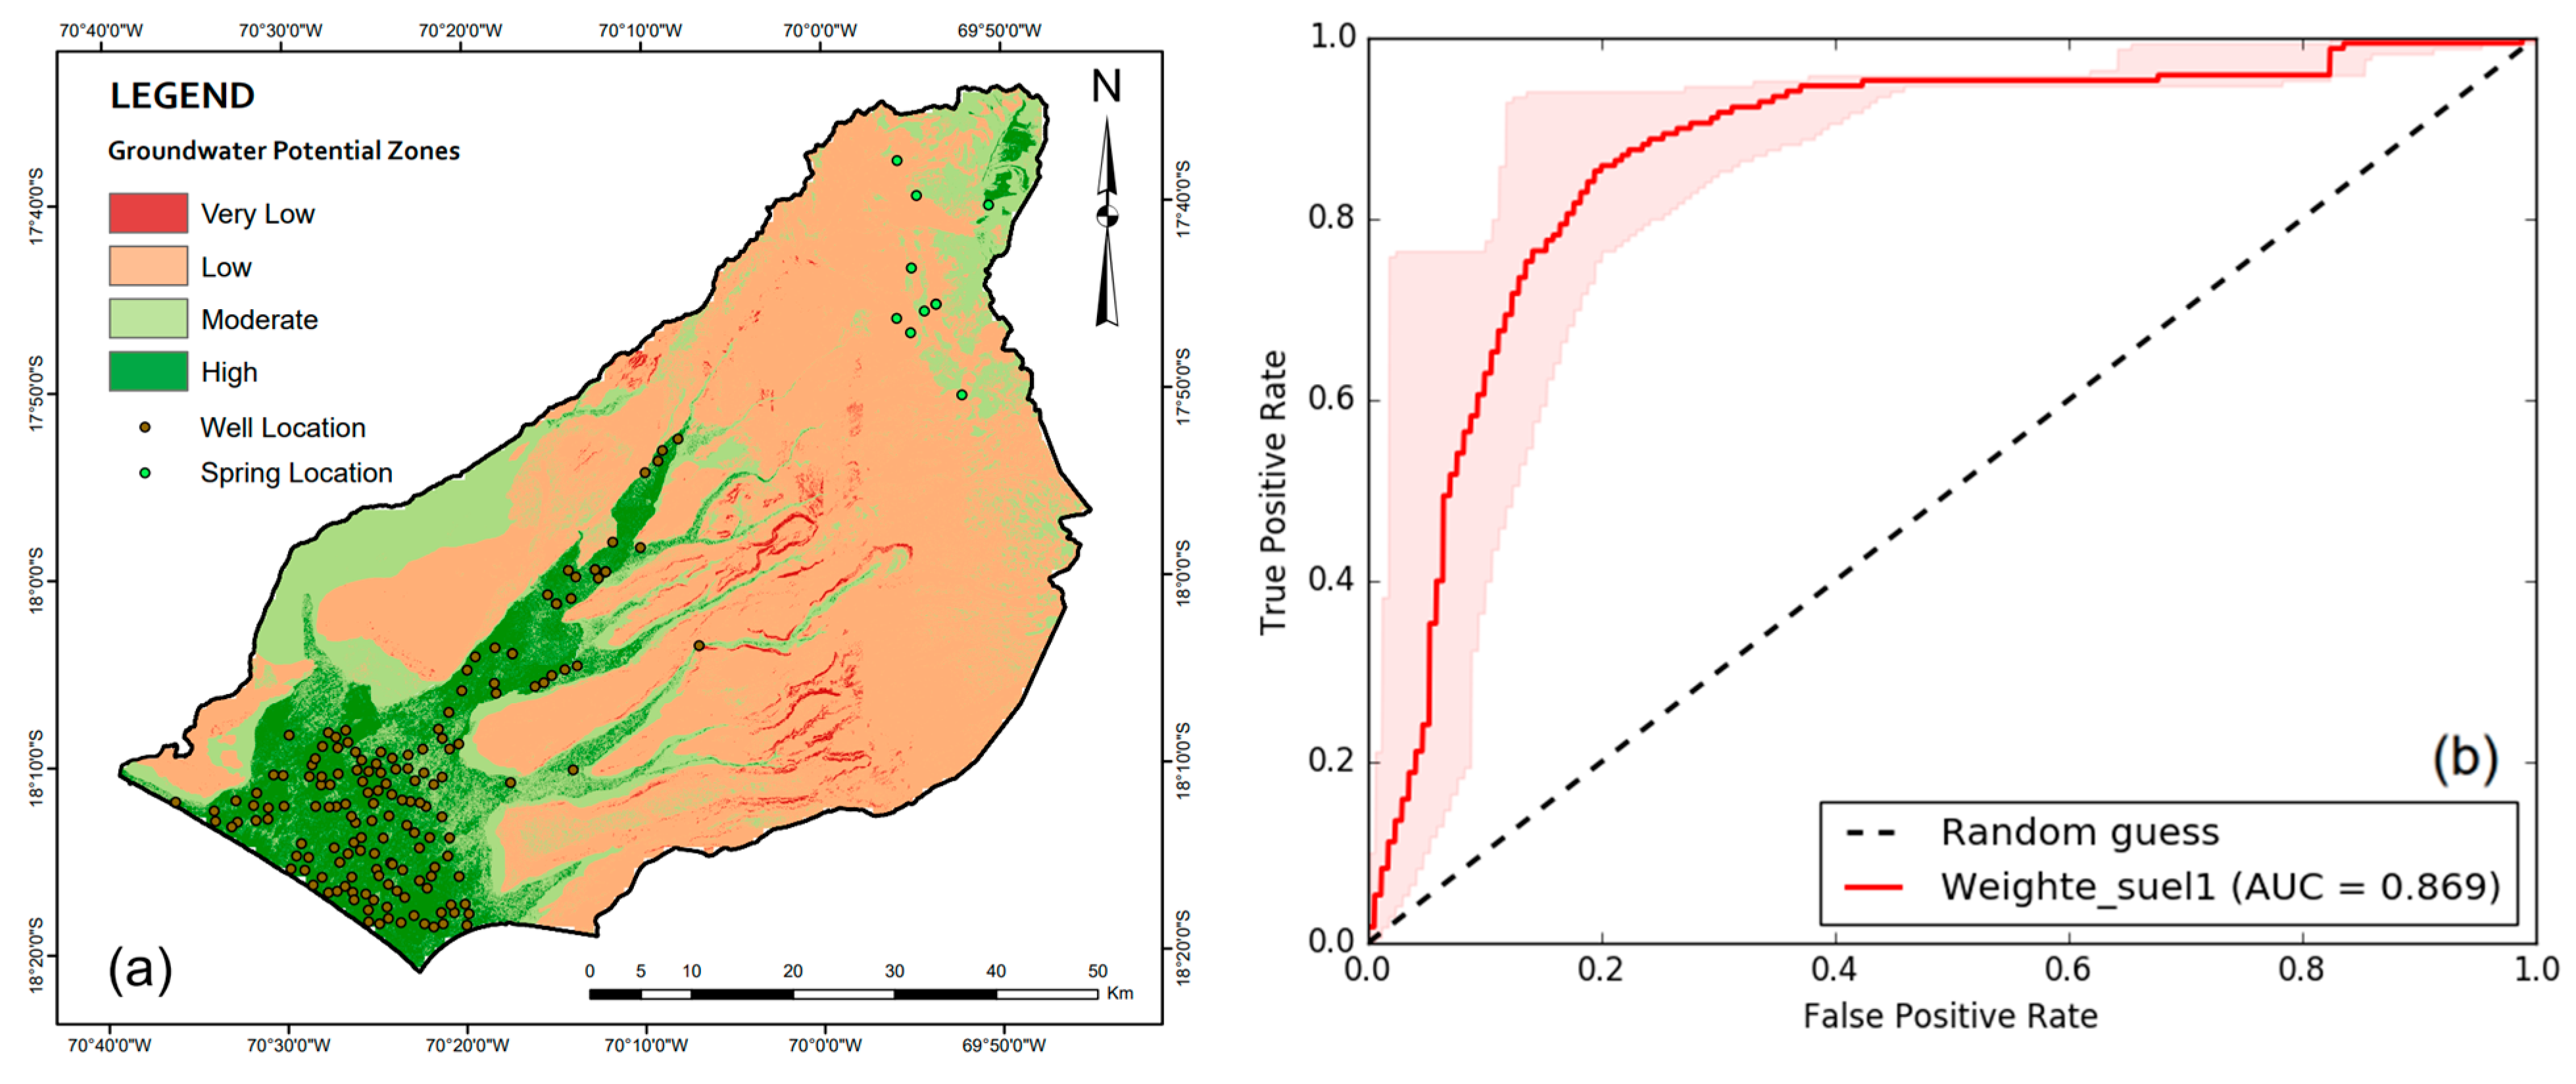
4.2. Groundwater Potential Zone Map
4.3. Validation
5. Discussion
6. Conclusions
Author Contributions
Funding
Acknowledgments
Conflicts of Interest
References
- Tapia-Villaseñor, E.M.; Shamir, E.; Cruz-Ayala, M.-B.; Megdal, S.B. Assessing Groundwater Withdrawal Sustainability in the Mexican Portion of the Transboundary Santa Cruz River Aquifer. Water 2022, 14, 233. [Google Scholar] [CrossRef]
- Espinoza-Molina, J.; Acosta-Caipa, K.; Chambe-Vega, E.; Huayna, G.; Pino-Vargas, E.; Abad, J. Spatiotemporal Analysis of Urban Heat Islands in Relation to Urban Development, in the Vicinity of the Atacama Desert. Climate 2022, 10, 87. [Google Scholar] [CrossRef]
- Abrams, W.; Ghoneim, E.; Shew, R.; LaMaskin, T.; Al-Bloushi, K.; Hussein, S.; AbuBakr, M.; Al-Mulla, E.; Al-Awar, M.; El-Baz, F. Delineation of Groundwater Potential (GWP) in the Northern United Arab Emirates and Oman Using Geospatial Technologies in Conjunction with Simple Additive Weight (SAW), Analytical Hierarchy Process (AHP), and Probabilistic Frequency Ratio (PFR) Techniques. J. Arid Environ. 2018, 157, 77–96. [Google Scholar] [CrossRef]
- Houston, J.; Hartley, A.J. The Central Andean West-Slope Rainshadow and Its Potential Contribution to the Origin of Hyper-Aridity in the Atacama Desert. Int. J. Climatol. 2003, 23, 1453–1464. [Google Scholar] [CrossRef]
- McKay, C.P.; Friedmann, E.I.; Gómez-Silva, B.; Cáceres-Villanueva, L.; Andersen, D.T.; Landheim, R. Temperature and Moisture Conditions for Life in the Extreme Arid Region of the Atacama Desert: Four Years of Observations Including the El Niño of 1997–1998. Astrobiology 2003, 3, 393–406. [Google Scholar] [CrossRef]
- Gómez-Silva, B.; Batista-García, R.A. The Atacama Desert: A Biodiversity Hotspot and Not Just a Mineral-Rich Region. Front. Microbiol. 2022, 13, 812842. [Google Scholar] [CrossRef]
- Hartley, A.J.; Chong, G.; Houston, J.; Mather, A.E. 150 Million Years of Climatic Stability: Evidence from the Atacama Desert, Northern Chile. J. Geol. Soc. Lond. 2005, 162, 421–424. [Google Scholar] [CrossRef]
- Rundel, P.W.; Dillon, M.O.; Palma, B.; Mooney, H.A.; Gulmon, S.L.; Ehleringer, J.R. The Phytogeography and Ecology of the Coastal Atacama and Peruvian Deserts. Aliso 1991, 13, 1–49. [Google Scholar] [CrossRef] [Green Version]
- Balacco, G.; Alfio, M.R.; Fidelibus, M.D. Groundwater Drought Analysis under Data Scarcity: The Case of the Salento Aquifer (Italy). Sustainability 2022, 14, 707. [Google Scholar] [CrossRef]
- Vera, A.; Pino-Vargas, E.; Verma, M.P.; Chucuya, S.; Chávarri, E.; Canales, M.; Torres-Martínez, J.A.; Mora, A.; Mahlknecht, J. Hydrodynamics, Hydrochemistry, and Stable Isotope Geochemistry to Assess Temporal Behavior of Seawater Intrusion in the La Yarada Aquifer in the Vicinity of Atacama Desert, Tacna, Peru. Water 2021, 13, 3161. [Google Scholar] [CrossRef]
- Sappa, G.; De Filippi, F.M.; Ferranti, F.; Iacurto, S. Environmental Issues and Anthropic Pressures in Coastal Aquifers: A Case Study in Southern Latium Region. Acque Sotter.-Ital. J. Groundw. 2019, 8, 47–51. [Google Scholar] [CrossRef]
- Pino, V.E.; Chávarri, V.E.; Ramos, F.L. Crisis de Gobernanza y Gobernabilidad y Sus Implicancias En El Uso Inadecuado Del Agua Subterránea, Caso Acuífero Costero de La Yarada, Tacna, Perú. Idesia 2018, 36, 77–85. [Google Scholar] [CrossRef] [Green Version]
- Nigussie, W.; Hailu, B.T.; Azagegn, T. Mapping of Groundwater Potential Zones Using Sentinel Satellites (−1 SAR and -2A MSI) Images and Analytical Hierarchy Process in Ketar Watershed, Main Ethiopian Rift. J. Afr. Earth Sci. 2019, 160, 103632. [Google Scholar] [CrossRef]
- Pino, E. Conflictos Por El Uso Del Agua En Una Región Árida: Caso Tacna, Perú. Diálogo Andin. 2021, 65, 405–415. [Google Scholar] [CrossRef]
- Uc Castillo, J.L.; Martínez Cruz, D.A.; Ramos Leal, J.A.; Tuxpan Vargas, J.; Rodríguez Tapia, S.A.; Marín Celestino, A.E. Delineation of Groundwater Potential Zones (GWPZs) in a Semi-Arid Basin through Remote Sensing, GIS, and AHP Approaches. Water 2022, 14, 2138. [Google Scholar] [CrossRef]
- Derdour, A.; Bouanani, A.; Kaid, N.; Mukdasai, K.; Algelany, A.M.; Ahmad, H.; Menni, Y.; Ameur, H. Groundwater Potentiality Assessment of Ain Sefra Region in Upper Wadi Namous Basin, Algeria Using Integrated Geospatial Approaches. Sustainability 2022, 14, 4450. [Google Scholar] [CrossRef]
- Tóth, J. A Theoretical Analysis of Groundwater Flow in Small Drainage Basins. J. Geophys. Res. 1963, 68, 4795–4812. [Google Scholar] [CrossRef]
- Tiwari, A.; Rai, B. Hydromorphogeological Mapping for Groundwater Prospecting Using Landsat-MSS Images—A Case Study of Part of Dhanbad District, Bihar. J. Indian Soc. Remote Sens. 1996, 24, 281–285. [Google Scholar] [CrossRef]
- Das, S.; Behera, S.C.; Kar, A.; Narendra, P.; Guha, S. Hydrogeomorphological Mapping in Ground Water Exploration Using Remotely Sensed Data—A Case Study in Keonjhar District, Orissa. J. Indian Soc. Remote Sens. 1997, 25, 247–259. [Google Scholar] [CrossRef]
- Thomas, A.; Sharma, P.K.; Sharma, M.K.; Sood, A. Hydrogeomorphological Mapping in Assessing Ground Water by Using Remote Sensing Data—A Case Study in Lehra Gaga Block, Sangrur District, Punjab. J. Indian Soc. Remote Sens. 1999, 27, 31–42. [Google Scholar] [CrossRef]
- Moodley, T.; Seyam, M.; Abunama, T.; Bux, F. Delineation of Groundwater Potential Zones in KwaZulu-Natal, South Africa Using Remote Sensing, GIS and AHP. J. Afr. Earth Sci. 2022, 193, 104571. [Google Scholar] [CrossRef]
- Dube, T.; Shoko, C.; Sibanda, M.; Baloyi, M.M.; Molekoa, M.; Nkuna, D.; Rafapa, B.; Rampheri, B.M. Spatial Modelling of Groundwater Quality across a Land Use and Land Cover Gradient in Limpopo Province, South Africa. Phys. Chem. Earth Parts A/B/C 2020, 115, 102820. [Google Scholar] [CrossRef]
- Saaty, T.L. The Analytic Hierarchy Process: Planning, Priority Setting, Resource Allocation; McGraw-Hill: New York, NY, USA, 1980. [Google Scholar]
- Saaty, T.L. Axiomatic Foundation of the Analytic Hierarchy Process. Manag. Sci. 1986, 32, 841–855. [Google Scholar] [CrossRef]
- Saaty, T.L. What Is the Analytic Hierarchy Process? In Mathematical Models for Decision Support; Springer: Berlin/Heidelberg, Germany, 1988; pp. 109–121. [Google Scholar]
- Narvaez-Montoya, C.; Torres-Martínez, J.A.; Pino-Vargas, E.; Cabrera-Olivera, F.; Loge, F.J.; Mahlknecht, J. Predicting Adverse Scenarios for a Transboundary Coastal Aquifer System in the Atacama Desert (Peru/Chile). Sci. Total Environ. 2022, 806, 150386. [Google Scholar] [CrossRef]
- Chucuya, S.; Vera, A.; Pino-Vargas, E.; Steenken, A.; Mahlknecht, J.; Montalván, I. Hydrogeochemical Characterization and Identification of Factors Influencing Groundwater Quality in Coastal Aquifers, Case: La Yarada, Tacna, Peru. Int. J. Environ. Res. Public Health 2022, 19, 2815. [Google Scholar] [CrossRef]
- Pino, E.; Chávarri, E. Evidencias de Cambio Climático En La Región Hiperárida de La Costa Sur de Perú, Cabecera Del Desierto de Atacama. Tecnol. Cienc. Agua 2022, 13, 333–376. [Google Scholar] [CrossRef]
- Pino, E. El Acuífero Costero La Yarada, Después de 100 Años de Explotación Como Sustento de Una Agricultura En Zonas Áridas: Una Revisión Histórica. Idesia 2019, 37, 39–45. [Google Scholar] [CrossRef] [Green Version]
- Pino-Vargas, E.; Chávarri-Velarde, E.; Ingol-Blanco, E.; Mejía, F.; Cruz, A.; Vera, A. Impacts of Climate Change and Variability on Precipitation and Maximum Flows in Devil’s Creek, Tacna, Peru. Hydrology 2022, 9, 10. [Google Scholar] [CrossRef]
- Pino-Vargas, E.; Huayna, G. Spatial and Temporal Evolution of Olive Cultivation Due to Pest Attack, Using Remote Sensing and Satellite Image Processing. Sci. Agropecu. 2022, 13, 149–157. [Google Scholar] [CrossRef]
- Pino-Vargas, E.; Taya-Acosta, E.; Ingol-Blanco, E.; Torres-Rúa, A. Deep Machine Learning for Forecasting Daily Potential Evapotranspiration in Arid Regions, Case: Atacama Desert Header. Agriculture 2022, 12, 1971. [Google Scholar] [CrossRef]
- Peña, F.; Cotrina, G.; Acosta, H. Hidrogeología de La Cuenca Del Río Caplina—Región Tacna—[Boletín H 1]; Instituto Geológico, Minero y Metalúrgico—INGEMMET: Lima, Perú, 2009. [Google Scholar]
- Machaca-Pillaca, R.; Pino-Vargas, E.; Ramos-Fernández, L.; Quille-Mamani, J.; Torres-Rua, A. Estimación de La Evapotranspiración Con Fines de Riego En Tiempo Real de Un Olivar a Partir de Imágenes de Un Drone En Zonas Áridas, Caso La Yarada, Tacna, Perú. Idesia 2022, 40, 55–65. [Google Scholar] [CrossRef]
- Condori Tintaya, F.; Pino Vargas, E.; Tacora Villegas, P. Pérdida de Suelos Por Erosión Hídrica En Laderas Semiáridas de La Subcuenca Cairani-Camilaca, Perú. Idesia 2022, 40, 7–15. [Google Scholar] [CrossRef]
- Bellido, E. Sinopsis de La Geología Del Perú—[Boletín A 22]; Instituto Geológico, Minero y Metalúrgico—INGEMMET: Lima, Perú, 1969. [Google Scholar]
- Benavides, V. Chapter 3: Orogenic Evolution of the Peruvian Andes: The Andean Cycle. In Geology and Ore Deposits of the Central Andes; Society of Economic Geologists: Lima, Perú, 1999. [Google Scholar]
- Marocco, R.; Delfaud, J.; Lavenu, A. Ambiente Deposicional de Una Cuenca Continental Intramontañosa Andina: El Grupo Moquegua (Sur de Perú) Primeros Resultados. Soc. Geológica Perú 1985, 75, 73–90. [Google Scholar]
- Sanchez, A.; Rosell, W.; Raymundo, T. Memoria Explicativa de La Revisión Geológica En Los Cuadrángulos de Punta de Bombón (35-s), Clemesí (35-t), Ilo (36-t), Locumba (36-u), La Yarada (37-u), Tacna (37-v), Huaylillas (37-x), Juli (33-y), Pizacoma(34-y) e Isla Anápia (33-z) [Escala 1:100,000]; Instituto Geológico, Minero y Metalúrgico—INGEMMET: Lima, Perú, 2000. [Google Scholar]
- Alvan, A.A.; Bustamante, Y.F.; Sánchez, E.A.; Mamani, M.I. Arquitectura Estratigráfica, Paleogeografía y Proveniencia Sedimentaria de Las Rocas Cenozoicas Del Sur de Perú (Tacna, 18° S). Andean Geol. 2020, 47, 351. [Google Scholar] [CrossRef]
- Yousif, M.; Sabet, H.S.; Ghoubachi, S.Y.; Aziz, A. Utilizing the Geological Data and Remote Sensing Applications for Investigation of Groundwater Occurrences, West El Minia, Western Desert of Egypt. NRIAG J. Astron. Geophys. 2018, 7, 318–333. [Google Scholar] [CrossRef] [Green Version]
- Abatzoglou, J.T.; Dobrowski, S.Z.; Parks, S.A.; Hegewisch, K.C. TerraClimate, a High-Resolution Global Dataset of Monthly Climate and Climatic Water Balance from 1958–2015. Sci. Data 2018, 5, 170191. [Google Scholar] [CrossRef] [Green Version]
- Scanlon, B.R.; Keese, K.E.; Flint, A.L.; Flint, L.E.; Gaye, C.B.; Edmunds, W.M.; Simmers, I. Global Synthesis of Groundwater Recharge in Semiarid and Arid Regions. Hydrol. Process. 2006, 20, 3335–3370. [Google Scholar] [CrossRef]
- Wheater, H.; Mathias, S.; Li, X. (Eds.) Groundwater Modelling in Arid and Semi-Arid Areas; Cambridge University Press: Cambridge, UK, 2010; Vol. 9780521111. [Google Scholar]
- Vera, A.; Verma, M.P.; Pino-Vargas, E.; Huayna, G. Metodología de Ponderación Morfométrica e Hidrogeoquímica Para Clasificar La Susceptibilidad a La Meteorización Química En Las Subcuencas Del Río Caplina, Tacna, Perú. Tecnol. Cienc. Agua 2022, 13, 276–340. [Google Scholar] [CrossRef]
- Pino, E.; Ramos, L.; Avalos, O.; Tacora, P.; Chávarri, E.; Angulo, O.; Ascensios, D.; Mejía, J. Factores Que Inciden En El Agotamiento y La Contaminación Por Intrusión Marina En El Acuífero Costero de La Yarada, Tacna, Perú. Tecnol. Cienc. Agua 2019, 10, 177–213. [Google Scholar] [CrossRef]
- Pino, E.; Tacora, P.; Steenken, A.; Alfaro, L.; Valle, A.; Chávarri, E.; Ascencios, D.; Mejía Marcacuzco, J. Effect of Environmental and Geological Characteristics on Water Quality in the Caplina River Basin, Tacna, Peru. Tecnol. Cienc. Agua 2017, 8, 77–99. [Google Scholar] [CrossRef]
- Ayazi, M.H.; Pirasthe, S.; Pili, A.; Biswajeet, P.; Nikouravan, B.; Mansor, S.B. Disasters and Risk Reduction in Groundwater: Zagros Mountain Southwest Iran Using Geoinformatics Techniques. Disaster Adv. 2010, 3, 51–57. [Google Scholar]
- Avinash, K.; Jayappa, K.S.; Deepika, B. Prioritization of Sub-Basins Based on Geomorphology and Morphometricanalysis Using Remote Sensing and Geographic Informationsystem (GIS) Techniques. Geocarto Int. 2011, 26, 569–592. [Google Scholar] [CrossRef]
- Chowdary, V.M.; Ramakrishnan, D.; Srivastava, Y.K.; Chandran, V.; Jeyaram, A. Integrated Water Resource Development Plan for Sustainable Management of Mayurakshi Watershed, India Using Remote Sensing and GIS. Water Resour. Manag. 2009, 23, 1581–1602. [Google Scholar] [CrossRef]
- Das, D. Drainage and Lineament Analysis towards Artificial Recharge of Groundwater. In Advances in the Research of Aquatic Environment; Springer: Berlin/Heidelberg, Germany, 2011; pp. 37–44. [Google Scholar]
- Ibrahim-Bathis, K.; Ahmed, S.A. Geospatial Technology for Delineating Groundwater Potential Zones in Doddahalla Watershed of Chitradurga District, India. Egypt. J. Remote Sens. Space Sci. 2016, 19, 223–234. [Google Scholar] [CrossRef] [Green Version]
- Strahler, A.N. Part II. Quantitative Geomorphology of Drainage Basins and Channel Networks. In Handbook of Applied Hydrology; McGraw-Hill Education: New York, NY, USA, 1964; pp. 4–39. [Google Scholar]
- Shekhar, S.; Pandey, A.C. Delineation of Groundwater Potential Zone in Hard Rock Terrain of India Using Remote Sensing, Geographical Information System (GIS) and Analytic Hierarchy Process (AHP) Techniques. Geocarto Int. 2015, 30, 402–421. [Google Scholar] [CrossRef]
- Ankana; Dhanaraj, G. Study of Selected Influential Criteria on Groundwater Potential Storage Using Geospatial Technology and Multi-Criteria Decision Analysis (MCDA) Approach: A Case Study. Egypt. J. Remote Sens. Space Sci. 2021, 24, 649–658. [Google Scholar] [CrossRef]
- Ghoneim, E. Optimum Groundwater Locations in the Northern United Arab Emirates. Int. J. Remote Sens. 2008, 29, 5879–5906. [Google Scholar] [CrossRef]
- Mokarram, M.; Roshan, G.; Negahban, S. Landform Classification Using Topography Position Index (Case Study: Salt Dome of Korsia-Darab Plain, Iran). Model. Earth Syst. Environ. 2015, 1, 40. [Google Scholar] [CrossRef] [Green Version]
- Mallick, J.; Khan, R.A.; Ahmed, M.; Alqadhi, S.D.; Alsubih, M.; Falqi, I.; Hasan, M.A. Modeling Groundwater Potential Zone in a Semi-Arid Region of Aseer Using Fuzzy-AHP and Geoinformation Techniques. Water 2019, 11, 2656. [Google Scholar] [CrossRef] [Green Version]
- Tehrany, M.S.; Pradhan, B.; Jebur, M.N. Flood Susceptibility Mapping Using a Novel Ensemble Weights-of-Evidence and Support Vector Machine Models in GIS. J. Hydrol. 2014, 512, 332–343. [Google Scholar] [CrossRef]
- Tehrany, M.S.; Pradhan, B.; Mansor, S.; Ahmad, N. Flood Susceptibility Assessment Using GIS-Based Support Vector Machine Model with Different Kernel Types. CATENA 2015, 125, 91–101. [Google Scholar] [CrossRef]
- De Reu, J.; Bourgeois, J.; Bats, M.; Zwertvaegher, A.; Gelorini, V.; De Smedt, P.; Chu, W.; Antrop, M.; De Maeyer, P.; Finke, P.; et al. Application of the Topographic Position Index to Heterogeneous Landscapes. Geomorphology 2013, 186, 39–49. [Google Scholar] [CrossRef]
- Zevenbergen, L.W.; Thorne, C.R. Quantitative Analysis of Land Surface Topography. Earth Surf. Process. Landf. 1987, 12, 47–56. [Google Scholar] [CrossRef]
- Lee, S.; Pradhan, B. Landslide Hazard Mapping at Selangor, Malaysia Using Frequency Ratio and Logistic Regression Models. Landslides 2007, 4, 33–41. [Google Scholar] [CrossRef]
- Pothiraj, P.; Rajagopalan, B. A GIS and Remote Sensing Based Evaluation of Groundwater Potential Zones in a Hard Rock Terrain of Vaigai Sub-Basin, India. Arab. J. Geosci. 2013, 6, 2391–2407. [Google Scholar] [CrossRef]
- Manap, M.A.; Nampak, H.; Pradhan, B.; Lee, S.; Sulaiman, W.N.A.; Ramli, M.F. Application of Probabilistic-Based Frequency Ratio Model in Groundwater Potential Mapping Using Remote Sensing Data and GIS. Arab. J. Geosci. 2014, 7, 711–724. [Google Scholar] [CrossRef]
- Shrestha, R.M.; Sthapit, A.B. Temporal Variation of Rainfall in the Bagmati River Basin, Nepal. Nepal J. Sci. Technol. 2016, 16, 31–40. [Google Scholar] [CrossRef]
- Rejith, R.G.; Anirudhan, S.; Sundararajan, M. Delineation of Groundwater Potential Zones in Hard Rock Terrain Using Integrated Remote Sensing, GIS and MCDM Techniques: A Case Study From Vamanapuram River Basin, Kerala, India. In GIS and Geostatistical Techniques for Groundwater Science; Elsevier: Amsterdam, The Netherlands, 2019; pp. 349–364. [Google Scholar]
- Lerner, D.N.; Harris, B. The Relationship between Land Use and Groundwater Resources and Quality. Land Use Policy 2009, 26, S265–S273. [Google Scholar] [CrossRef]
- Guzha, A.C.; Rufino, M.C.; Okoth, S.; Jacobs, S.; Nóbrega, R.L.B. Impacts of Land Use and Land Cover Change on Surface Runoff, Discharge and Low Flows: Evidence from East Africa. J. Hydrol. Reg. Stud. 2018, 15, 49–67. [Google Scholar] [CrossRef]
- Pino, E.; Ramos, L.; Mejía, J.; Chávarri, E.; Ascensios, D. Mitigation Measures for the La Yarada Coastal Aquifer, an Overexploited System in Arid Areas. Idesia 2020, 38, 21–31. [Google Scholar]
- Pino-Vargas, E.; Guevara-Pérez, E.; Avendaño-Jihuallanga, C. Evolución Histórica de La Conceptualización Hidrogeológica y Del Uso Del Acuífero Caplina Ubicado En El Borde Norte Del Desierto de Atacama. Rev. Ing. UC 2021, 28, 378–391. [Google Scholar] [CrossRef]
- Pino-Vargas, E.; Ascencios-Templo, D. La Implementación de Veda Como Una Herramienta Para Controlar La Degradación Del Acuífero Costero La Yarada, Tacna, Perú. Diálogo Andin. 2021, 66, 489–496. [Google Scholar] [CrossRef]
- Bakır, M.; Atalık, Ö. Application of Fuzzy AHP and Fuzzy MARCOS Approach for the Evaluation of E-Service Quality in the Airline Industry. Decis. Mak. Appl. Manag. Eng. 2021, 4, 127–152. [Google Scholar] [CrossRef]
- Sivaprakasam, P.; Angamuthu, M. Generalized Z-fuzzy soft β-covering based rough matrices and its application to MAGDM problem based on AHP method. Decis. Mak. Appl. Manag. Eng. 2023, 7, 1–19. [Google Scholar] [CrossRef]


| Dataset | Source | Thematic Layers |
|---|---|---|
| Shuttle Radar Topography Mission | USGS (https://earthexplorer.usgs.gov/, accessed on 15 January 2020) | Lineament density, Drainage density, Topographic wetness index, Slope, Curvature |
| Sentinel-2 LU/LC | ArcGIS (https://www.arcgis.com/home/ accessed on 20 January 2020) | Land use/Land cover |
| Terraclimate | Google Earth Engine (https://developers.google.com/earth-engine/datasets, accessed on 21 January 2020) | Annual accumulated precipitation |
| Geology | Geological, Mining and Metallurgical Institute | Lithological formations |
| Geomorphology | Geological, Mining and Metallurgical Institute | Geomorphology units |
| Soil | Ministry of the Environment | Soil type |
| Scale | Definition | Explanation |
|---|---|---|
| 1 | Equal importance | Two elements contribute equally to the objective. |
| 3 | Moderate importance | Experience and judgment slightly favor one element over another. |
| 5 | Strong importance | Experience and judgment strongly favor one element over another. |
| 7 | Very strong importance | One element is favored very strongly over another. |
| 9 | Extreme importance | The evidence favoring one element over another equals the highest possible order of affirmation. |
| 2,4,6,8 | Intermediate values | When compromise is needed. |
| Thematic Layer | Assigned Weight | Classes | Rank |
|---|---|---|---|
| Geology | 0.28 | Sedimentary rocks | 4 |
| Volcanic rocks | 1 | ||
| Volcanic sedimentary | 2 | ||
| Intrusive rocks | 1 | ||
| Alluvial deposits | 5 | ||
| Fluvio-glacial deposits | 3 | ||
| Geomorphology | 0.17 | Hills | 2 |
| Escarps | 2 | ||
| Mountains | 1 | ||
| Snow covered | 4 | ||
| Plains | 5 | ||
| Slope | 1 | ||
| Valleys | 4 | ||
| Knolls | 3 | ||
| Soil | 0.04 | SCh–LPe | 1 |
| LPq–R | 3 | ||
| LPd–ANz | 4 | ||
| LPd–R | 5 | ||
| Drainage density | 0.02 | 0–0.38 | 5 |
| 0.38–0.76 | 4 | ||
| 0.76–1.15 | 3 | ||
| 1.15–1.53 | 2 | ||
| 1.53–1.93 | 1 | ||
| Lineament density | 0.03 | 0–0.77 | 1 |
| 0.77–1.55 | 2 | ||
| 1.55–2.32 | 3 | ||
| 2.32–3.10 | 4 | ||
| 3.10–3.88 | 5 | ||
| TWI | 0.01 | −3.53–2.35 | 1 |
| 2.35–8.23 | 2 | ||
| 8.23–14.11 | 3 | ||
| 14.11–19.98 | 4 | ||
| 19.98–25.89 | 5 | ||
| Slope | 0.22 | 0–3 | 5 |
| 3–7 | 4 | ||
| 7–14 | 3 | ||
| 14–30 | 2 | ||
| 30–75 | 1 | ||
| Curvature | 0.03 | −0.046–−0.009 | 1 |
| −0.009–−0.002 | 2 | ||
| −0.002–0.002 | 3 | ||
| 0.002–0.008 | 4 | ||
| 0.008–0.022 | 5 | ||
| Precipitation | 0.11 | 0–40.37 | 1 |
| 40.37–119.29 | 2 | ||
| 119.29–209.22 | 3 | ||
| 209.22–313.83 | 4 | ||
| 313.83–468 | 5 | ||
| LU/LC | 0.06 | Waterbodies | 4 |
| Trees | 2 | ||
| Grass | 4 | ||
| Cropland | 5 | ||
| Shrubland | 3 | ||
| Urban Area | 2 | ||
| Bare Land | 1 | ||
| Snow | 4 |
Disclaimer/Publisher’s Note: The statements, opinions and data contained in all publications are solely those of the individual author(s) and contributor(s) and not of MDPI and/or the editor(s). MDPI and/or the editor(s) disclaim responsibility for any injury to people or property resulting from any ideas, methods, instructions or products referred to in the content. |
© 2023 by the authors. Licensee MDPI, Basel, Switzerland. This article is an open access article distributed under the terms and conditions of the Creative Commons Attribution (CC BY) license (https://creativecommons.org/licenses/by/4.0/).
Share and Cite
Pocco, V.; Chucuya, S.; Huayna, G.; Ingol-Blanco, E.; Pino-Vargas, E. A Multi-Criteria Decision-Making Technique Using Remote Sensors to Evaluate the Potential of Groundwater in the Arid Zone Basin of the Atacama Desert. Water 2023, 15, 1344. https://doi.org/10.3390/w15071344
Pocco V, Chucuya S, Huayna G, Ingol-Blanco E, Pino-Vargas E. A Multi-Criteria Decision-Making Technique Using Remote Sensors to Evaluate the Potential of Groundwater in the Arid Zone Basin of the Atacama Desert. Water. 2023; 15(7):1344. https://doi.org/10.3390/w15071344
Chicago/Turabian StylePocco, Víctor, Samuel Chucuya, Germán Huayna, Eusebio Ingol-Blanco, and Edwin Pino-Vargas. 2023. "A Multi-Criteria Decision-Making Technique Using Remote Sensors to Evaluate the Potential of Groundwater in the Arid Zone Basin of the Atacama Desert" Water 15, no. 7: 1344. https://doi.org/10.3390/w15071344