

Impacts of River Bank Filtration on Groundwater Hydrogeochemistry in the Upper of Hutuo River Alluvial Plain, North China
 , and
, and 
Abstract
:1. Introduction
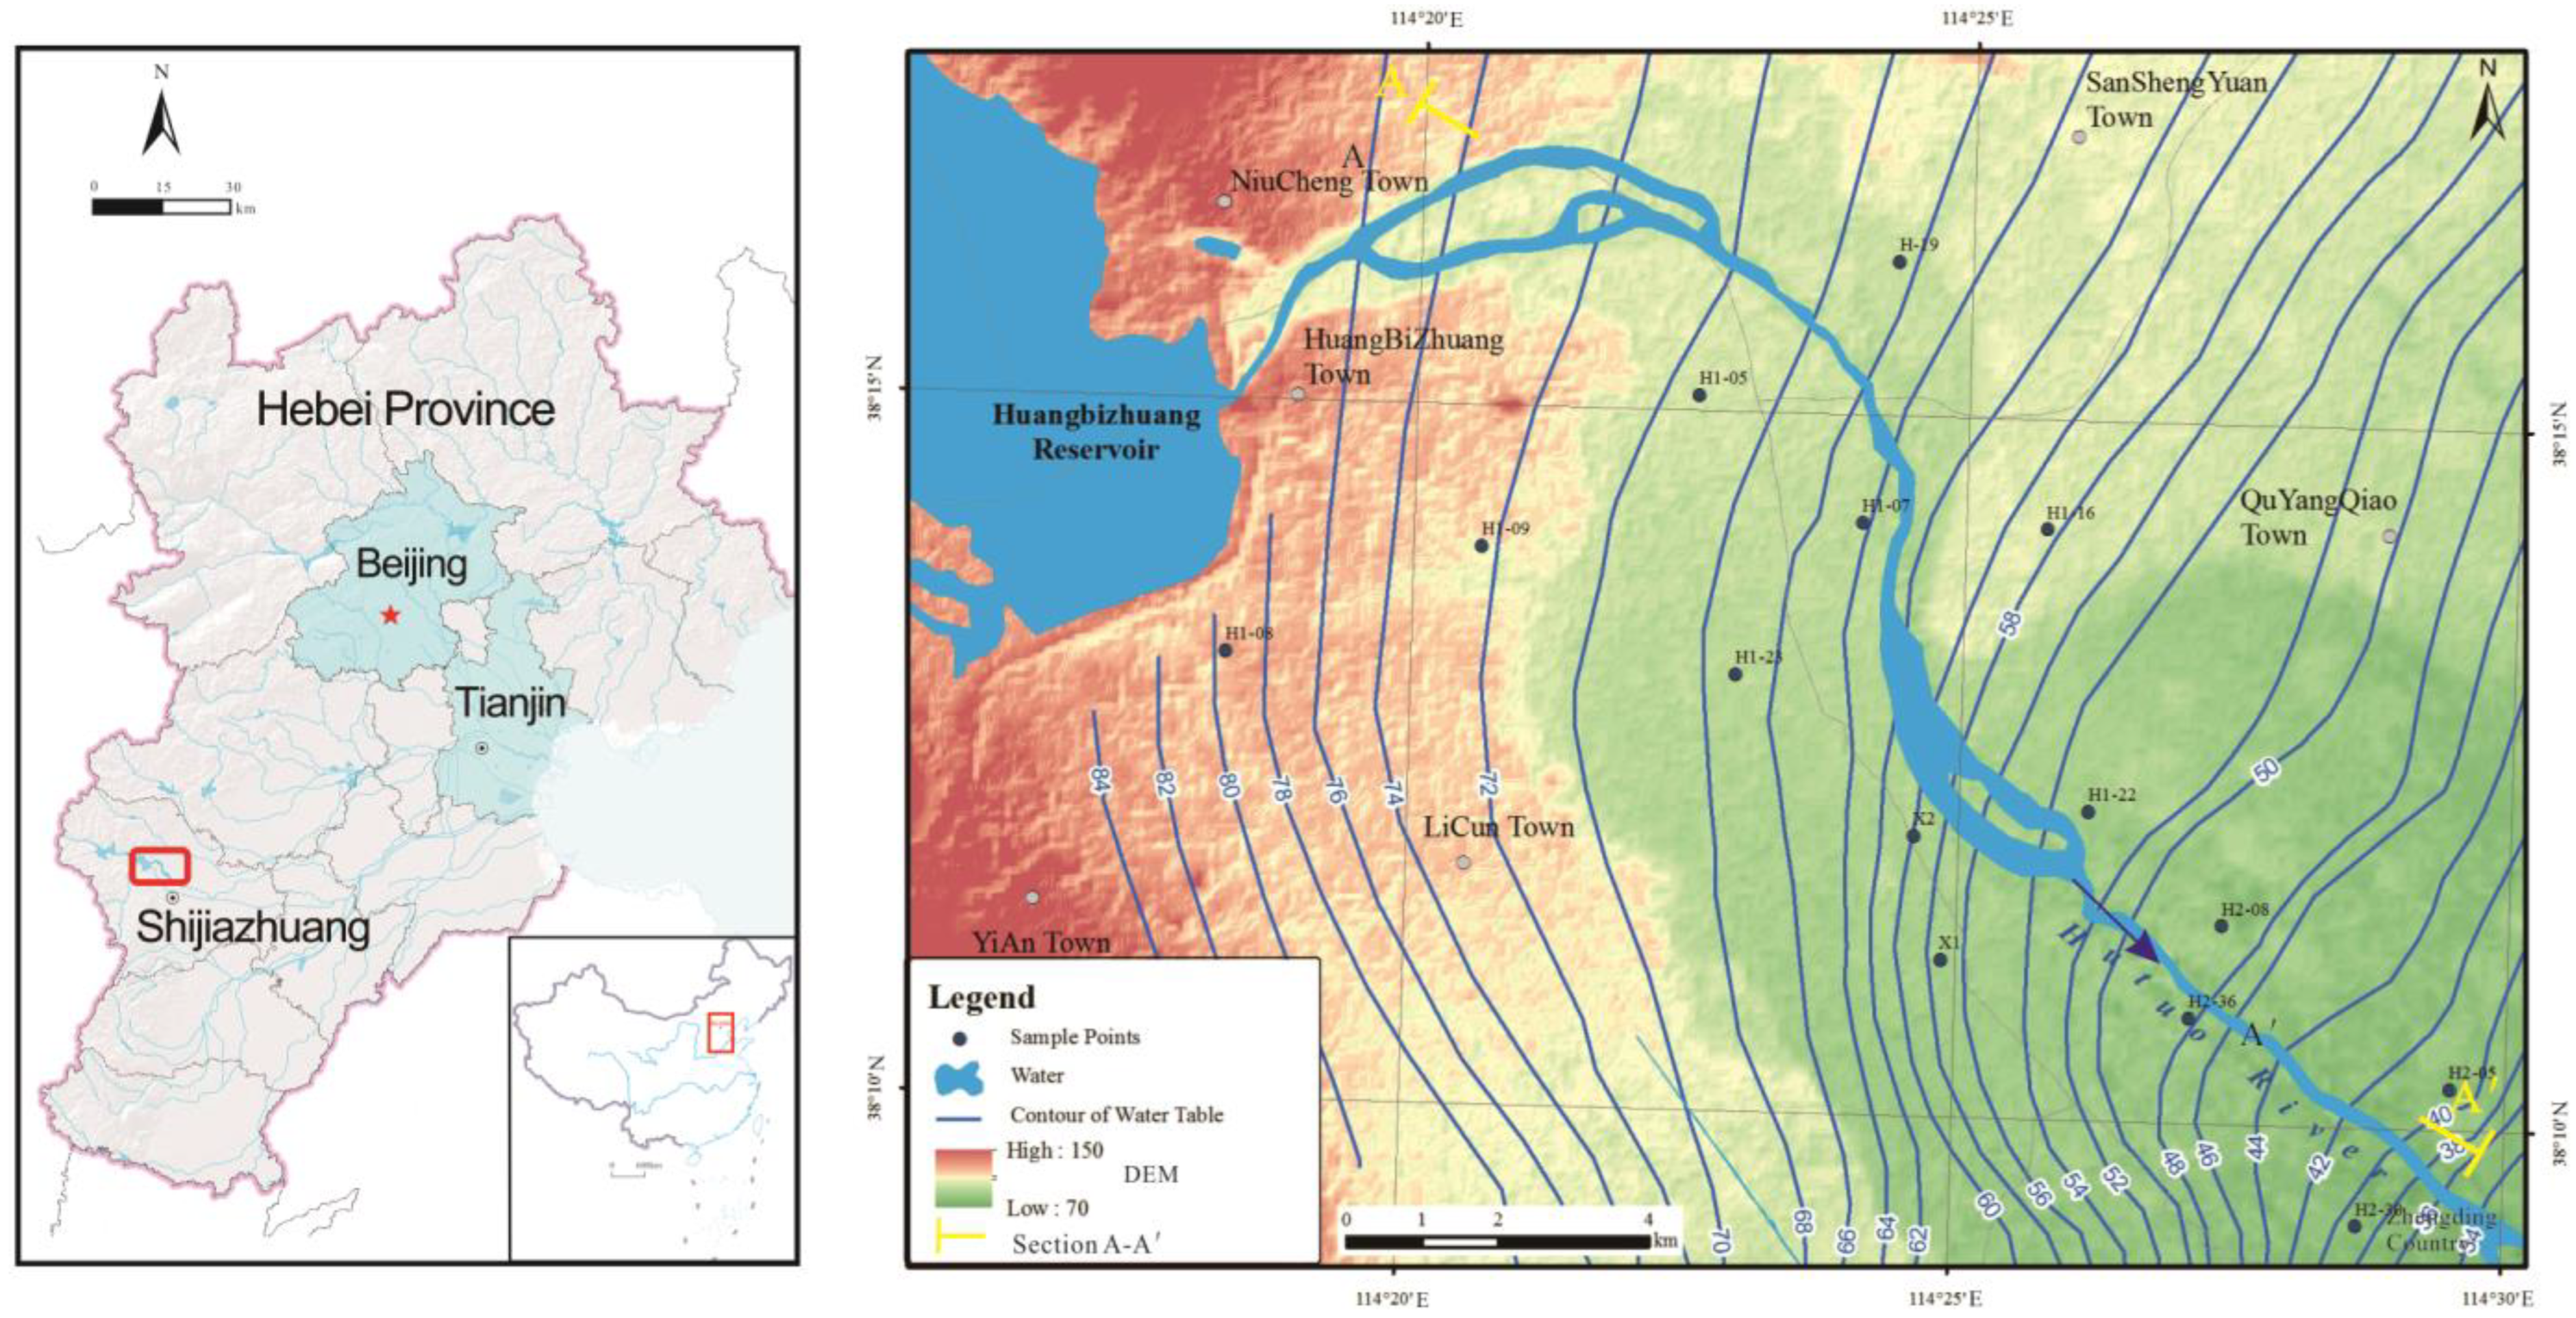
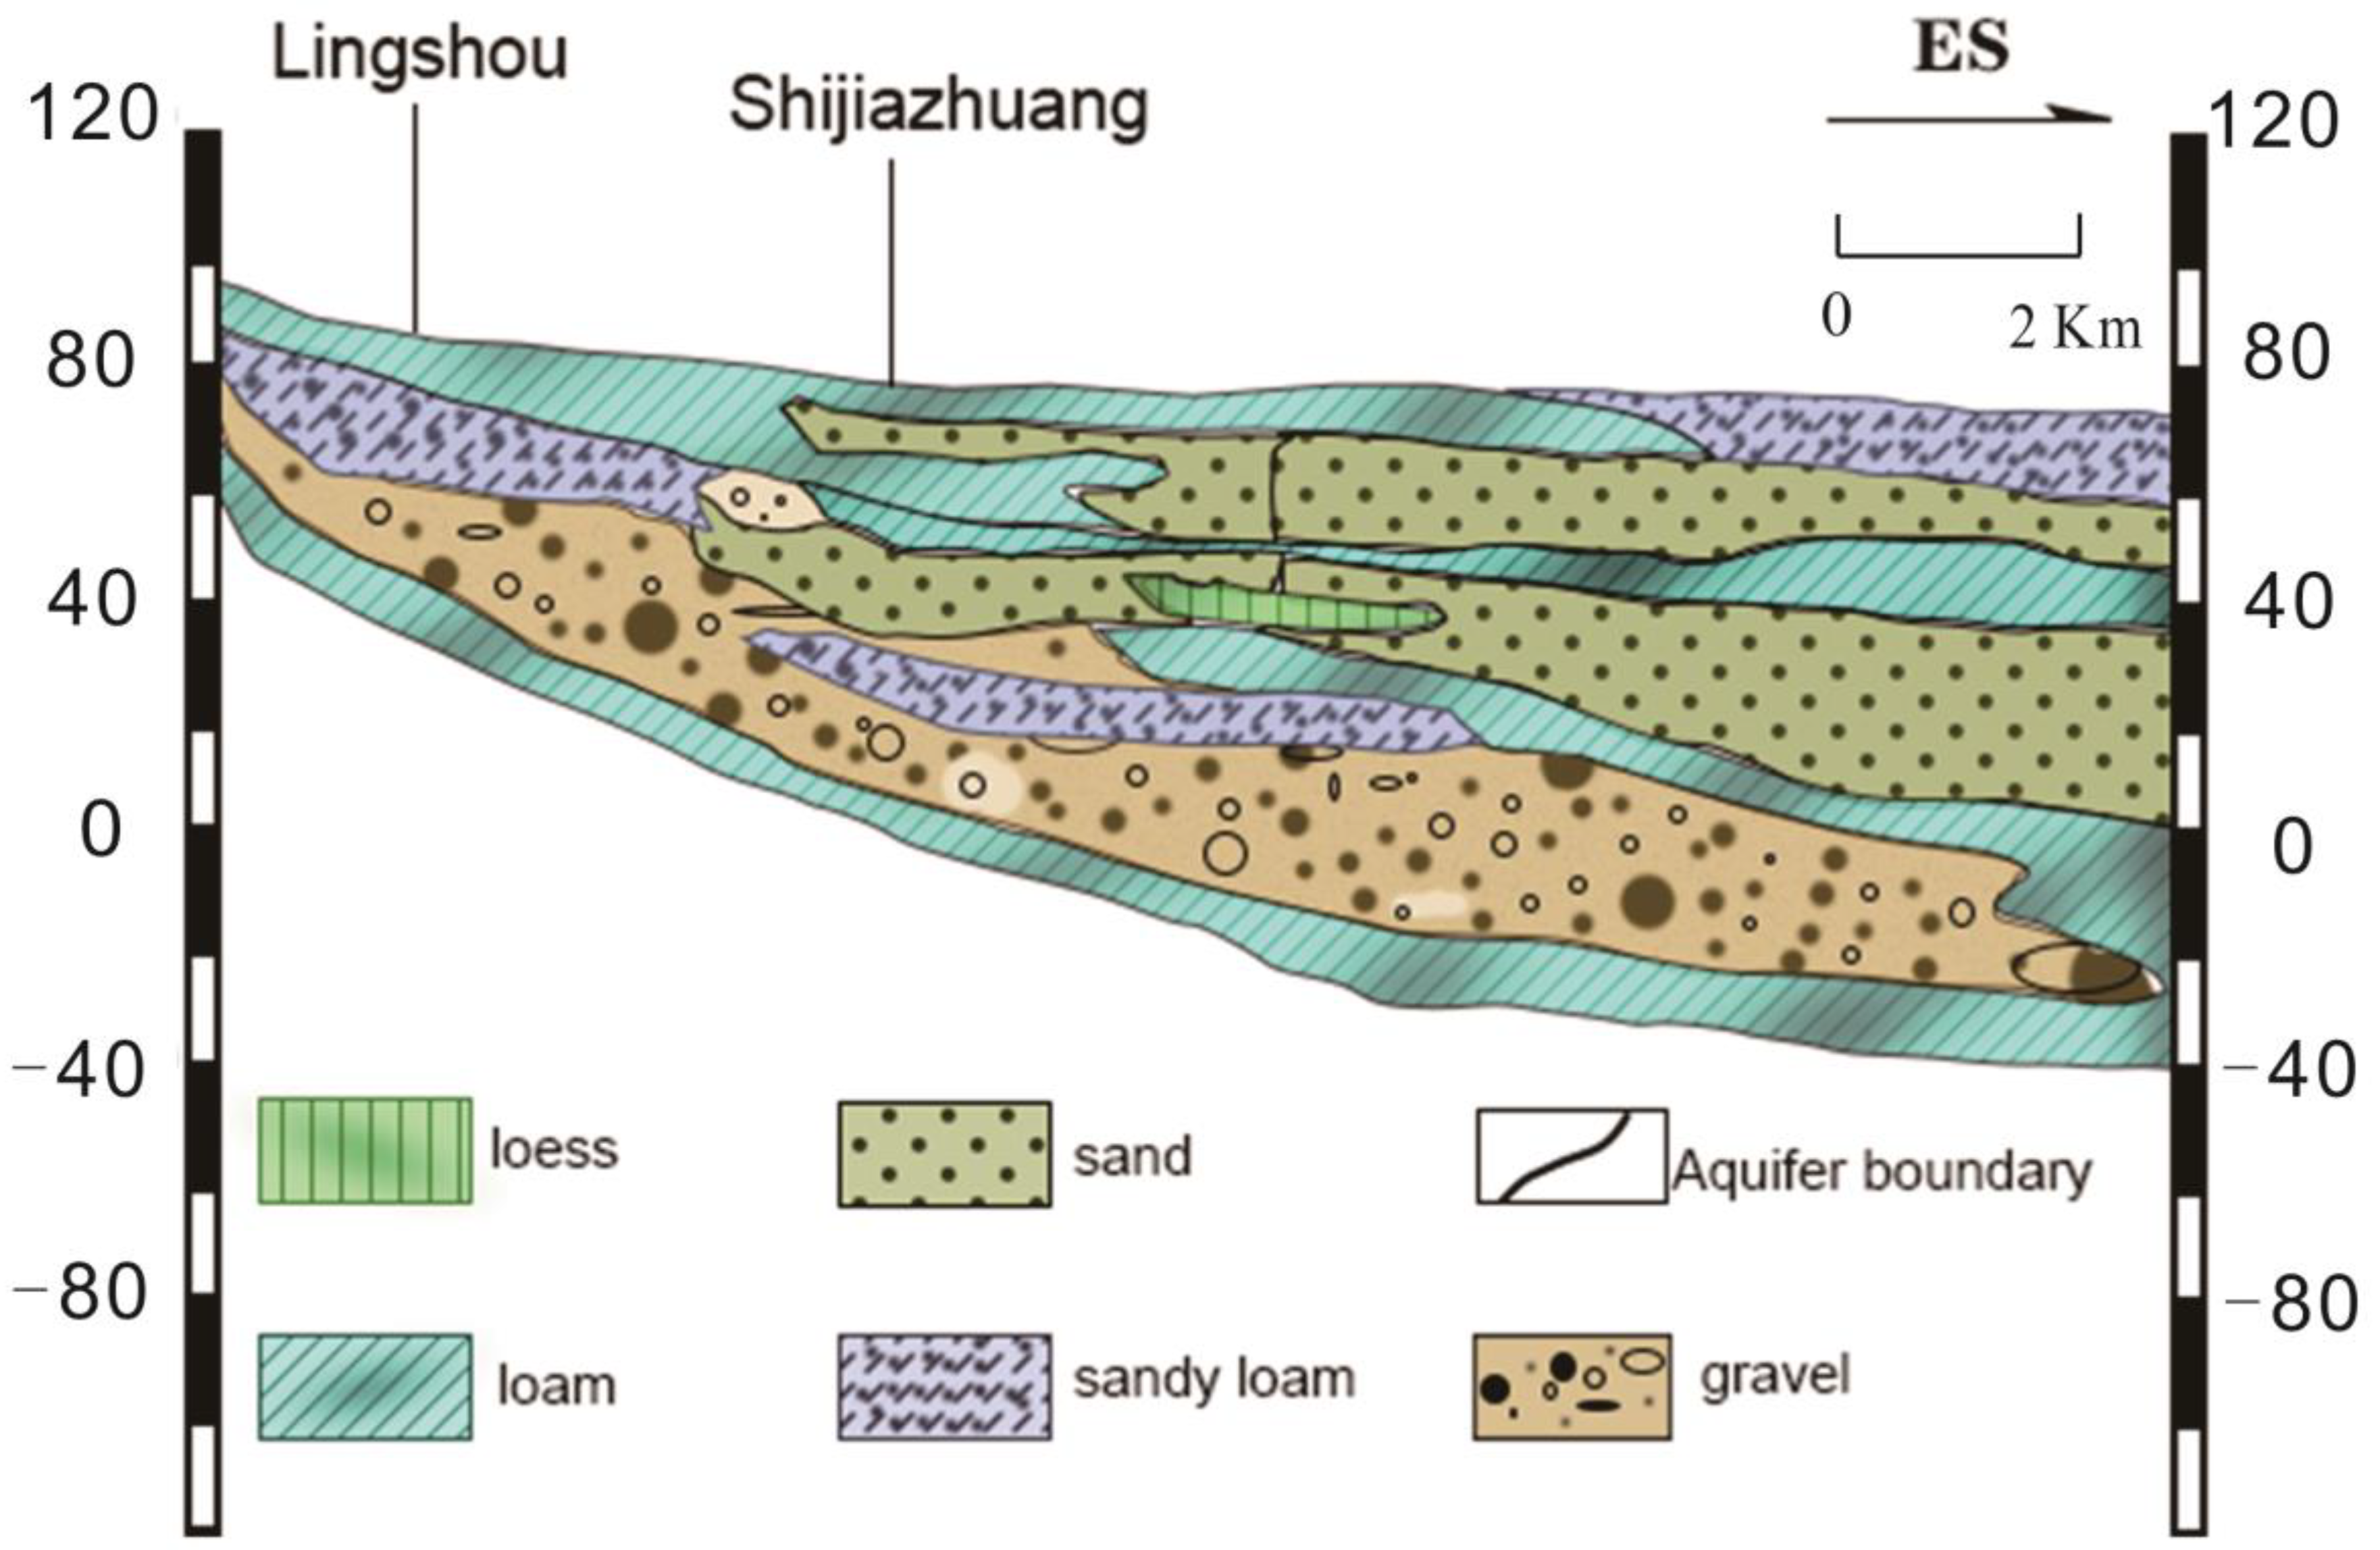
2. Study Area
3. Materials and Methods
3.1. Water Sample Collection
3.2. Analysis and Testing
4. Results
4.1. Hydrochemical Characteristics of Groundwater
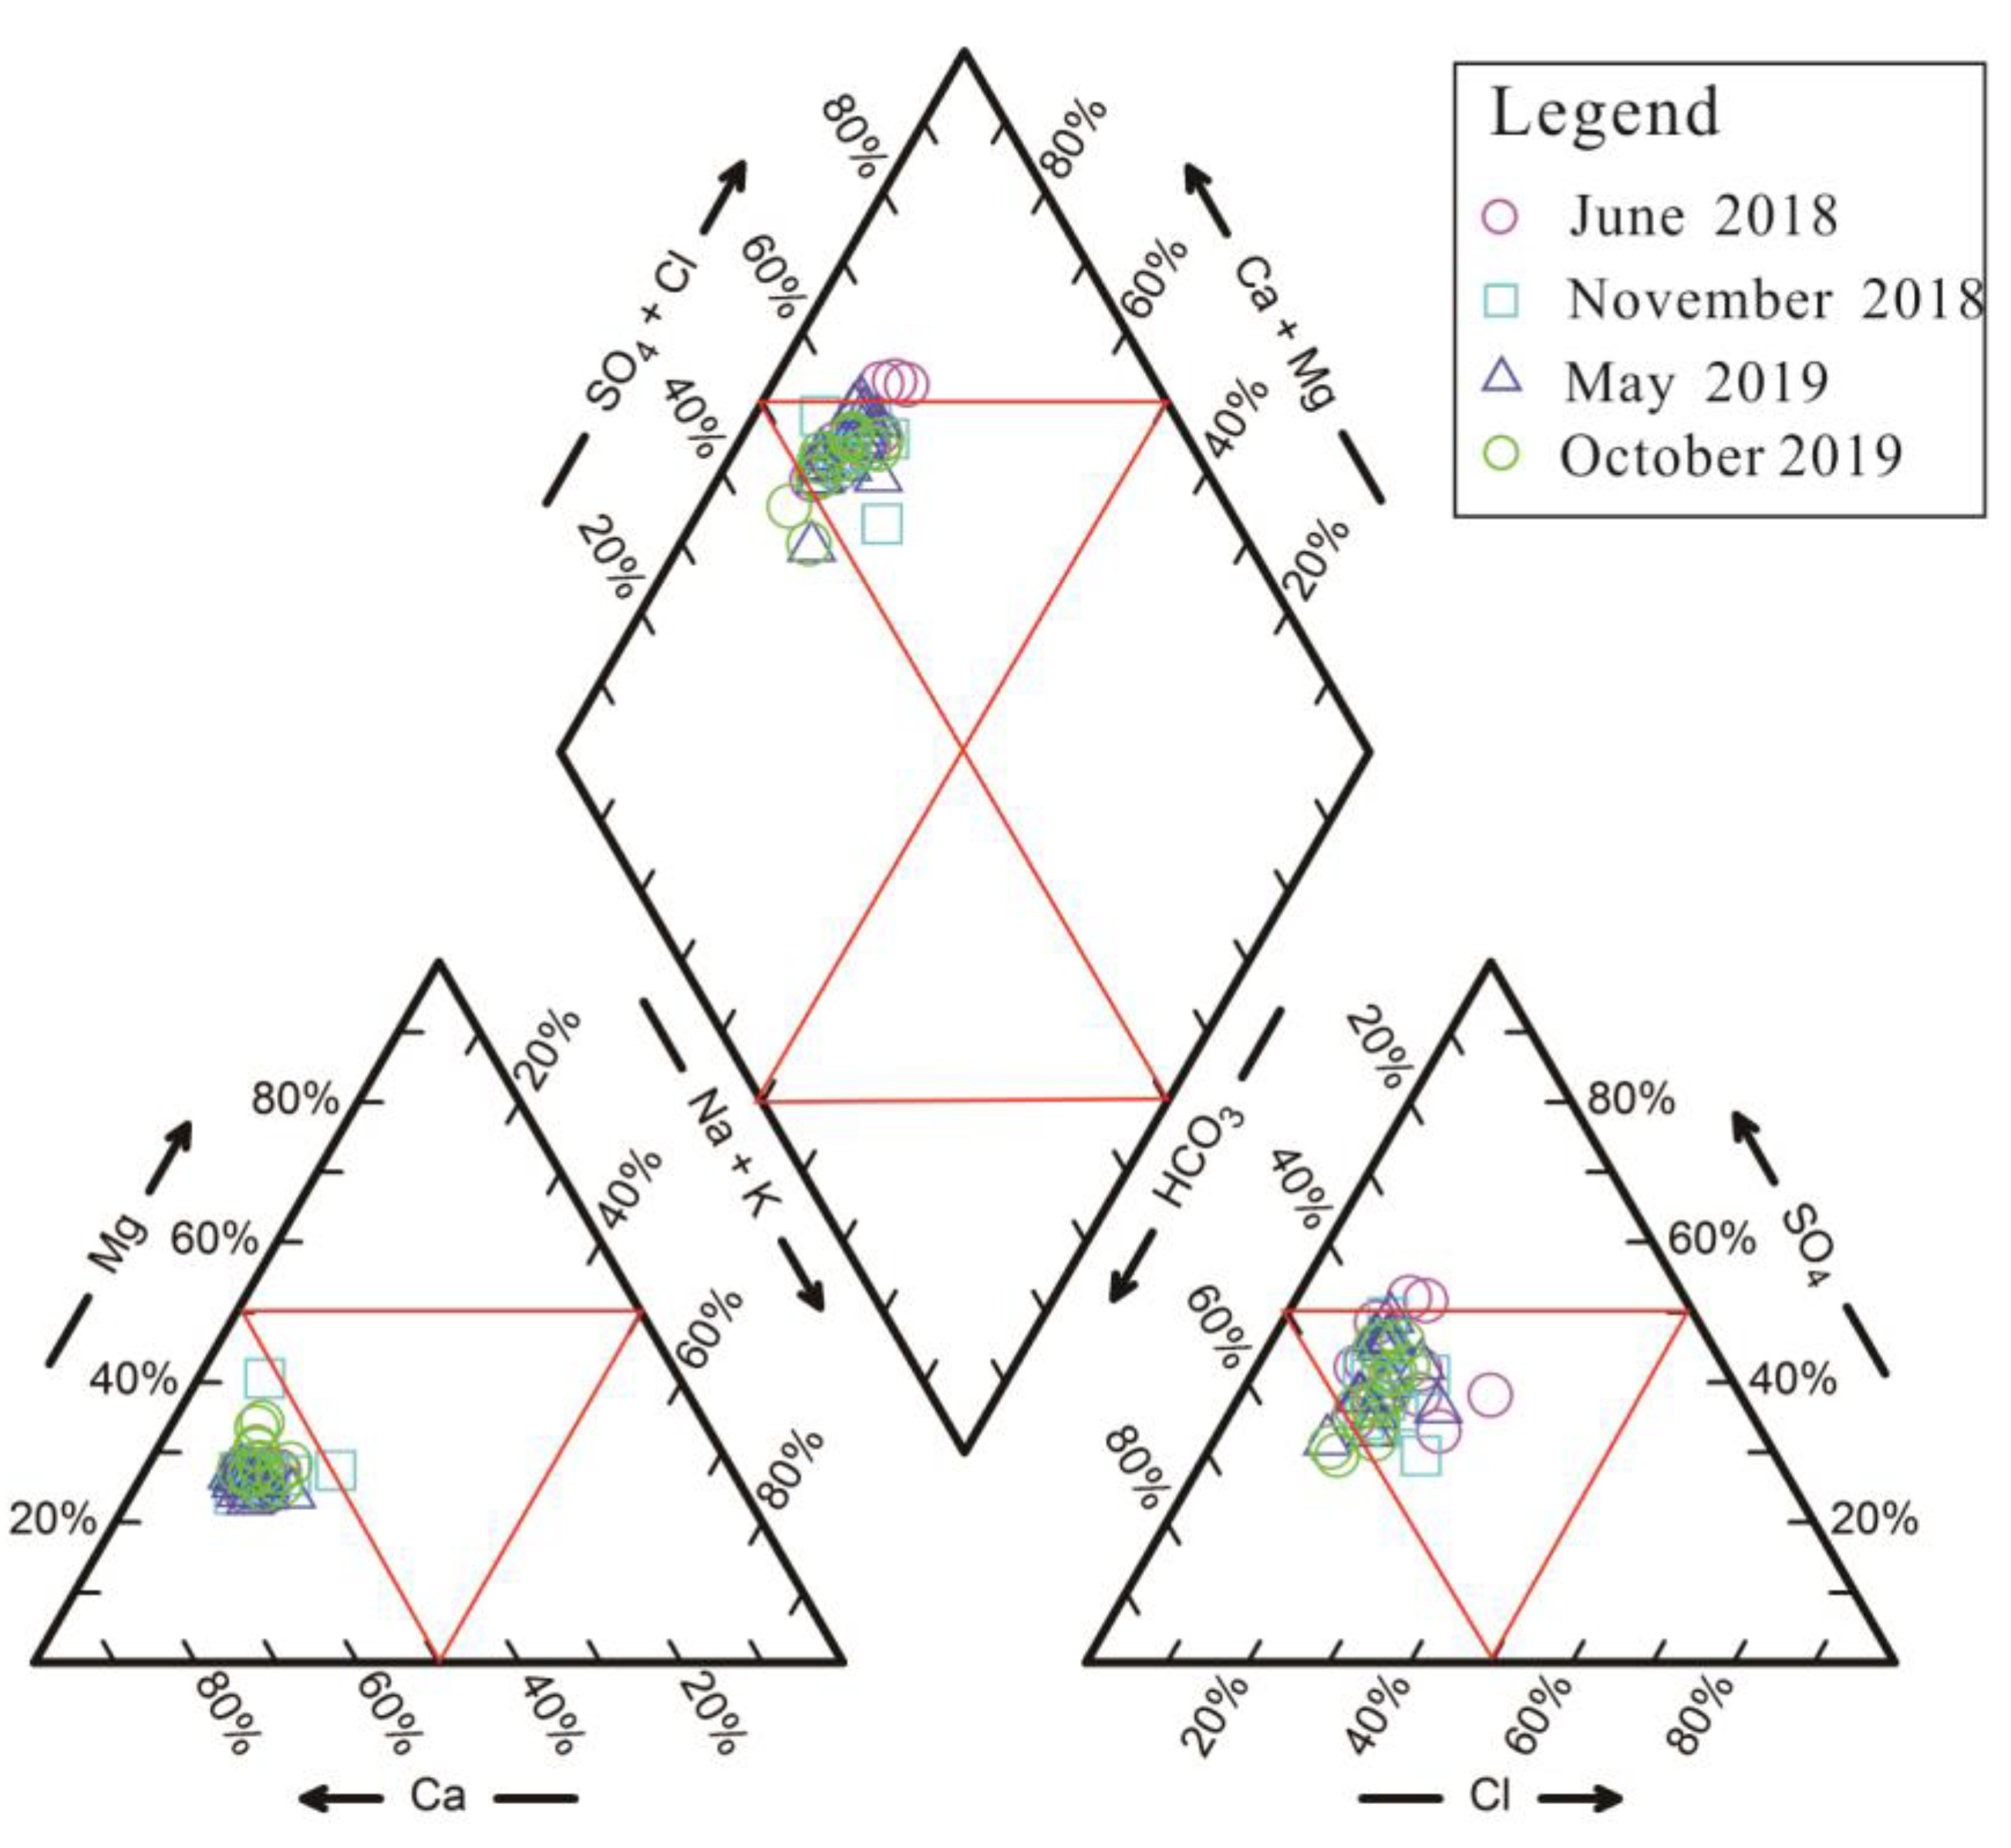
4.2. Hydrochemical Facies
5. Discussion
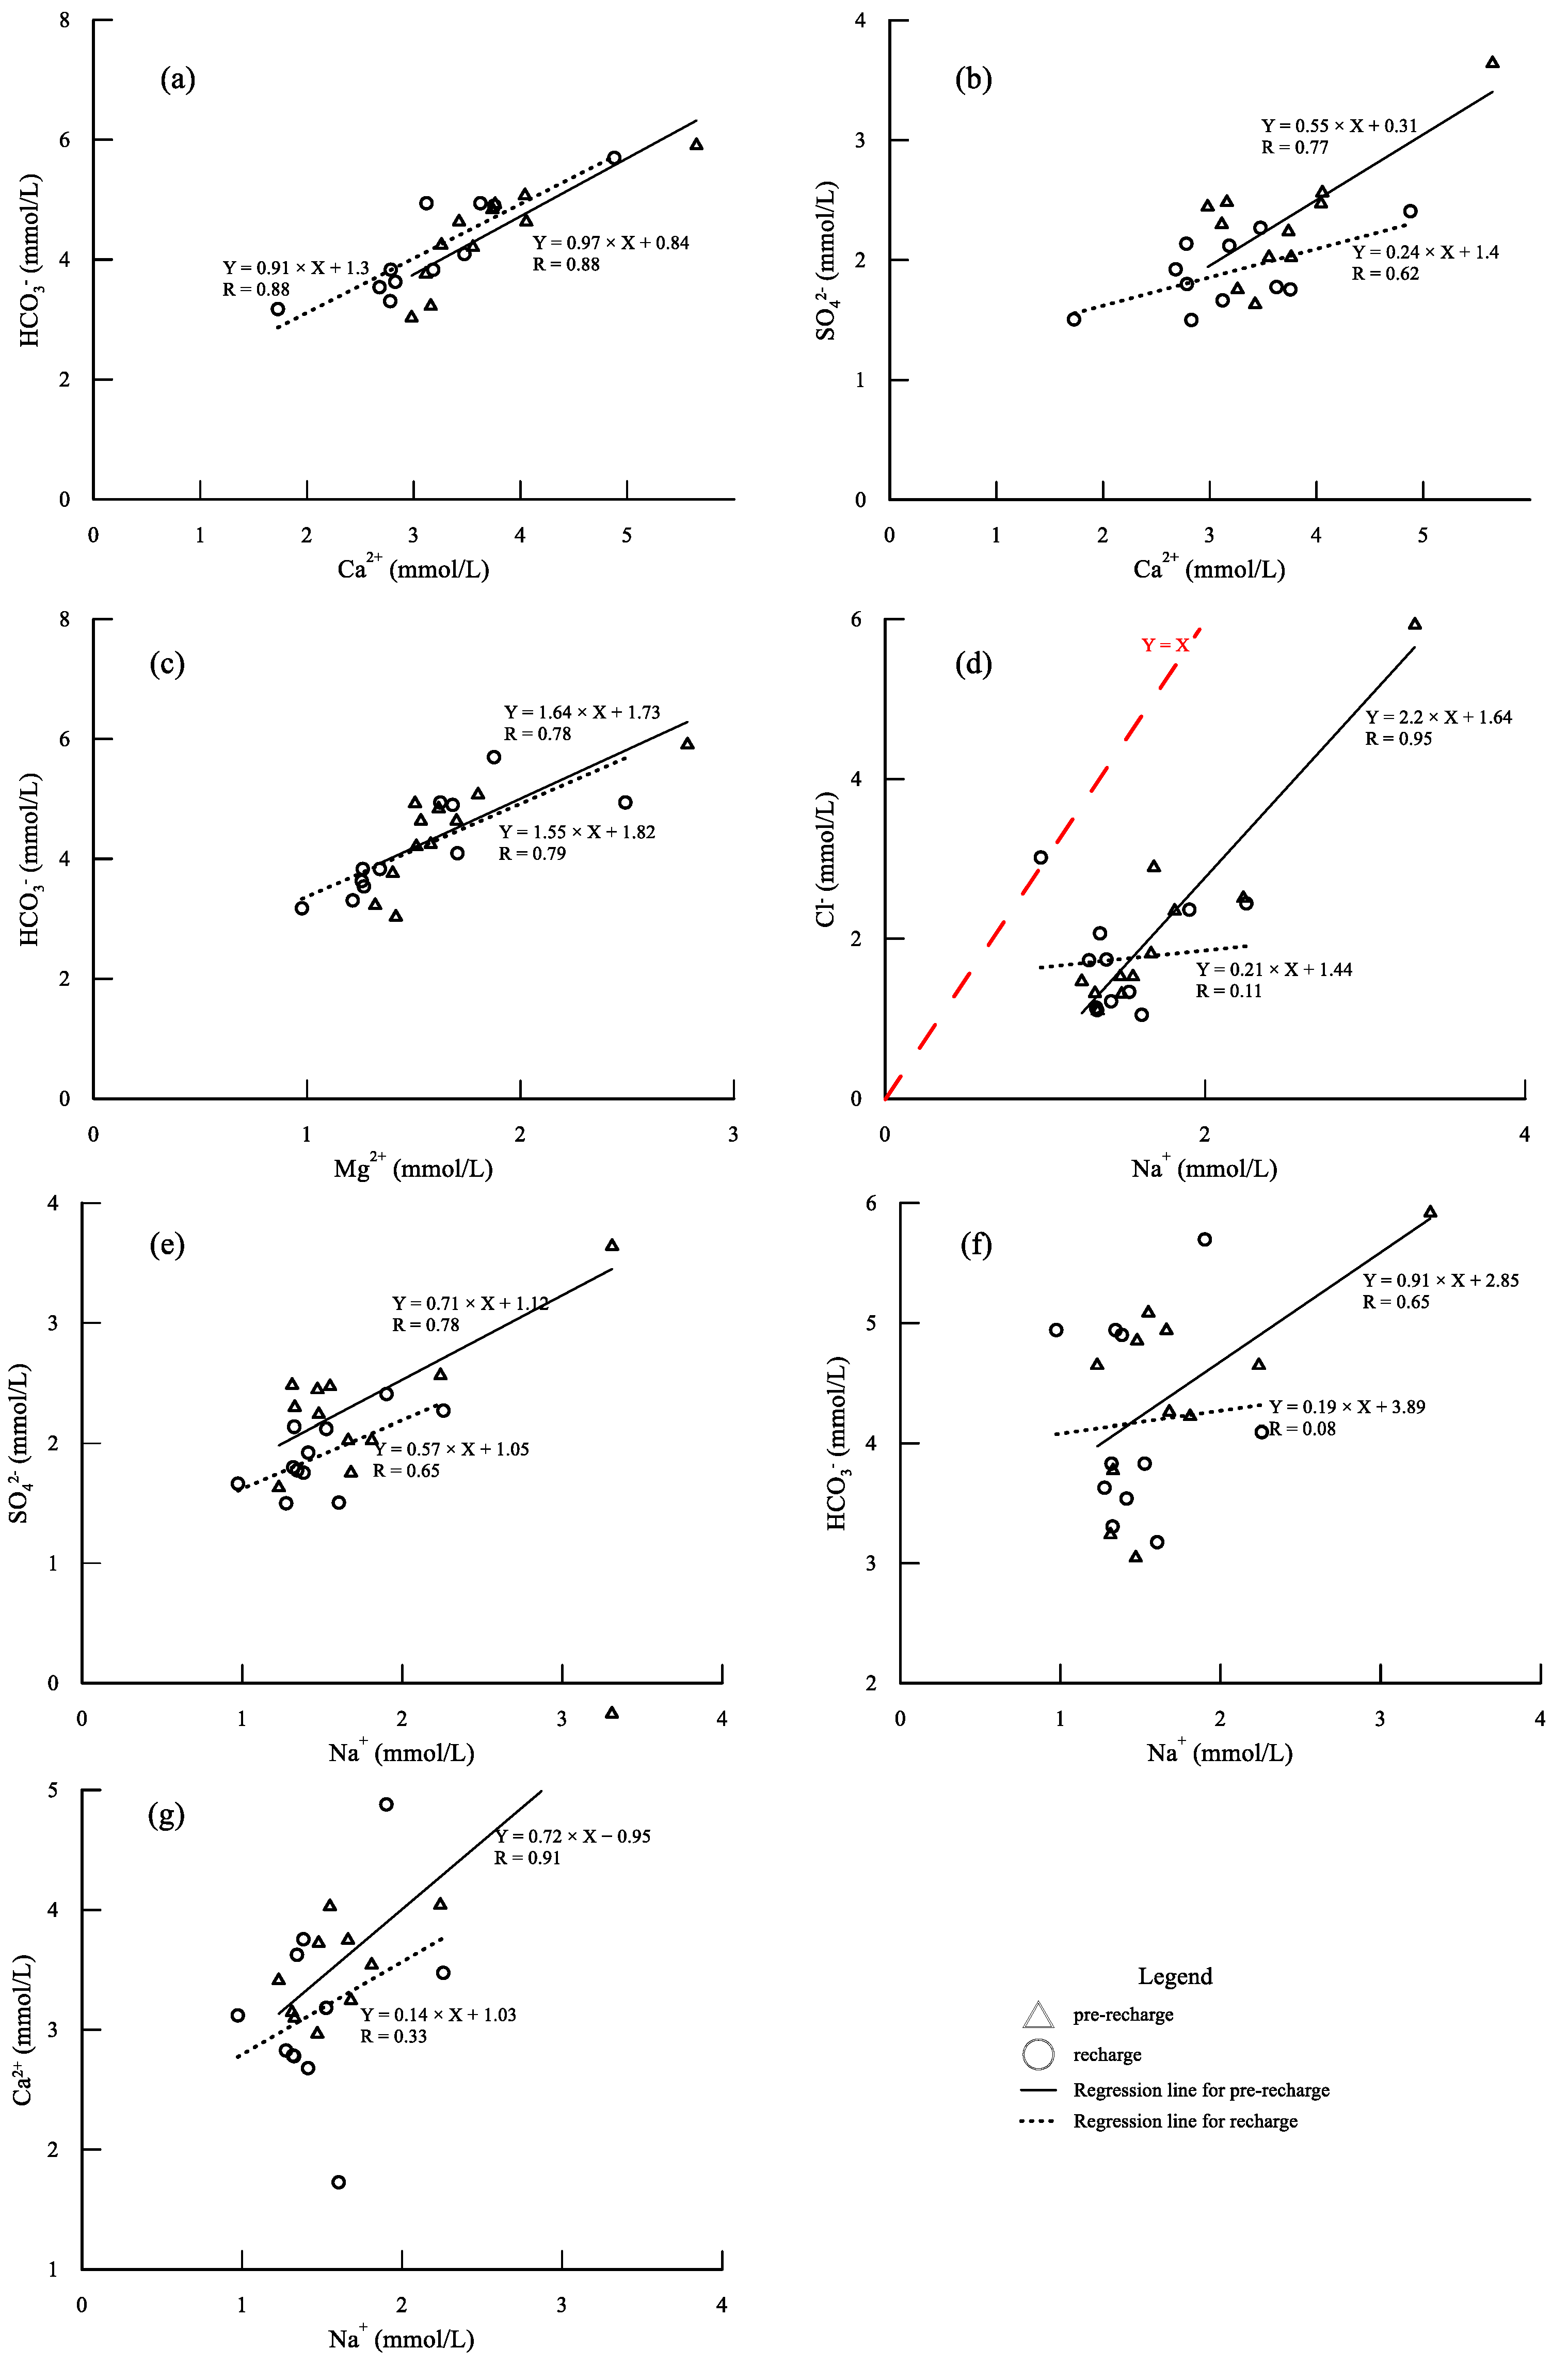
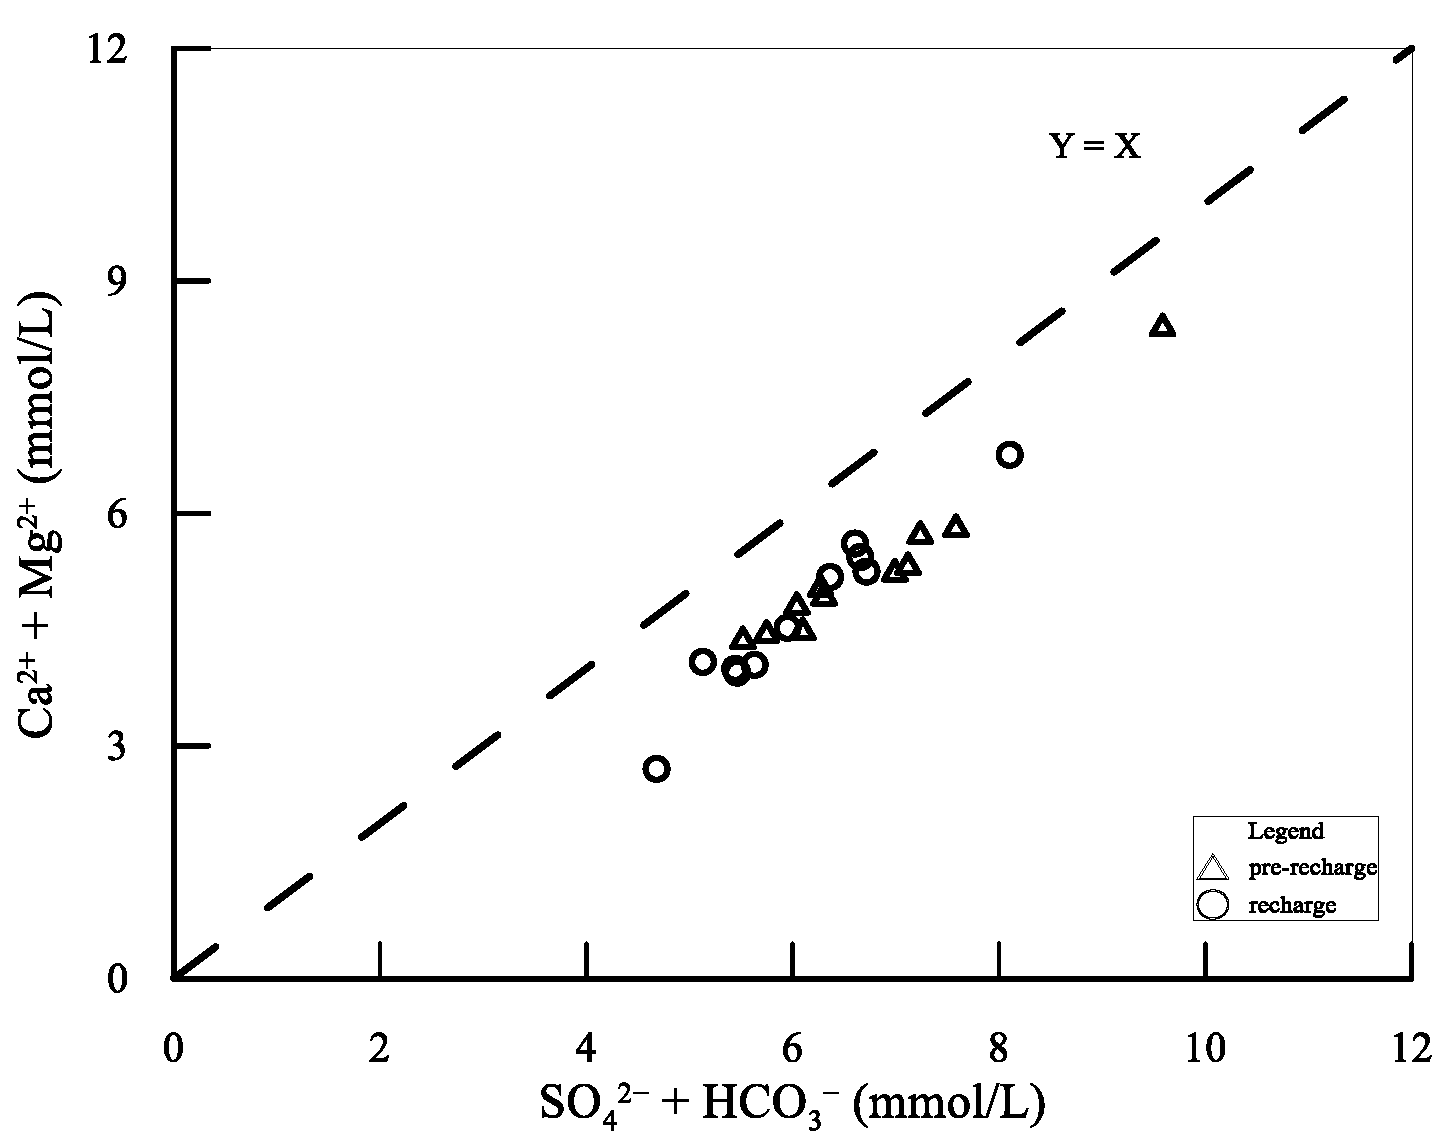
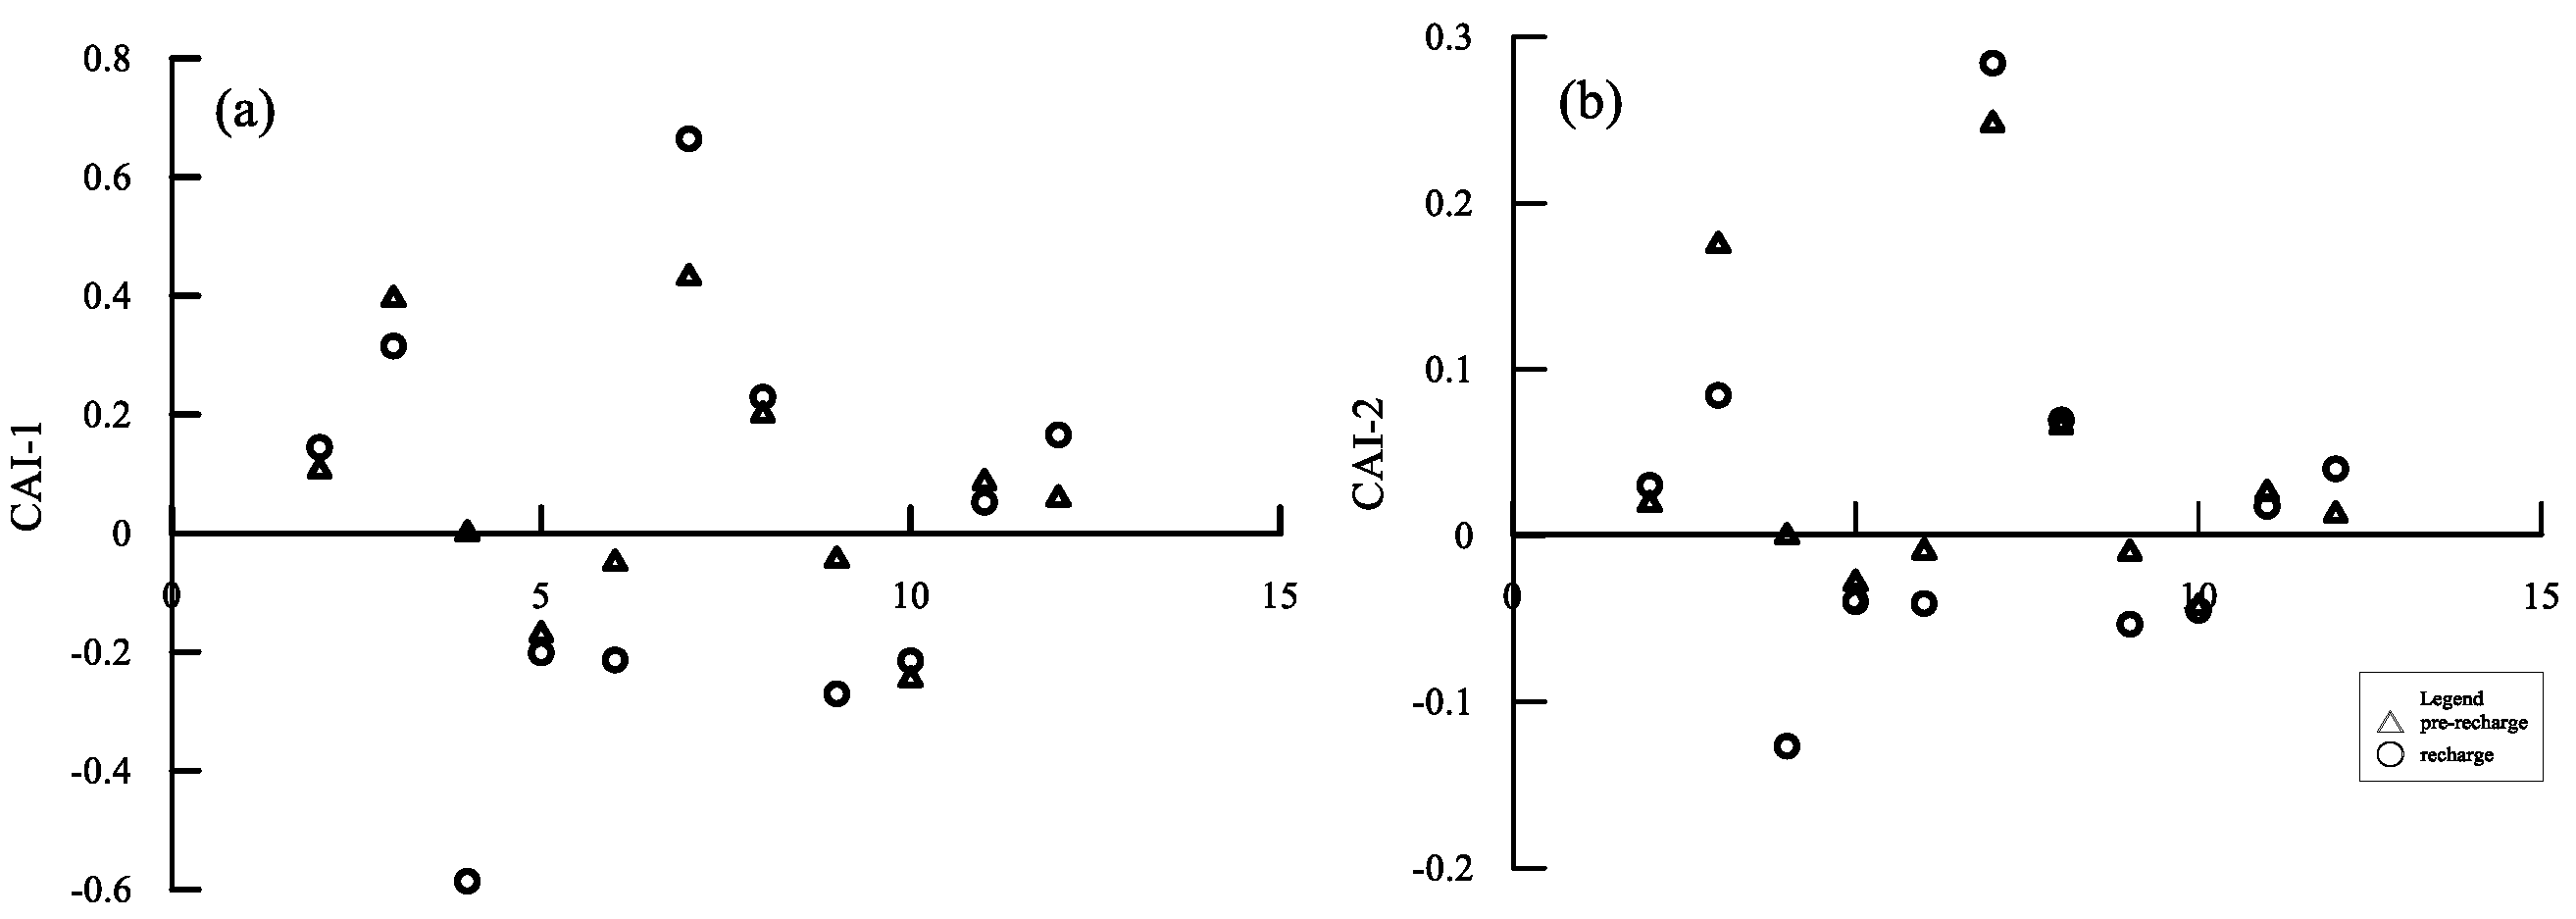
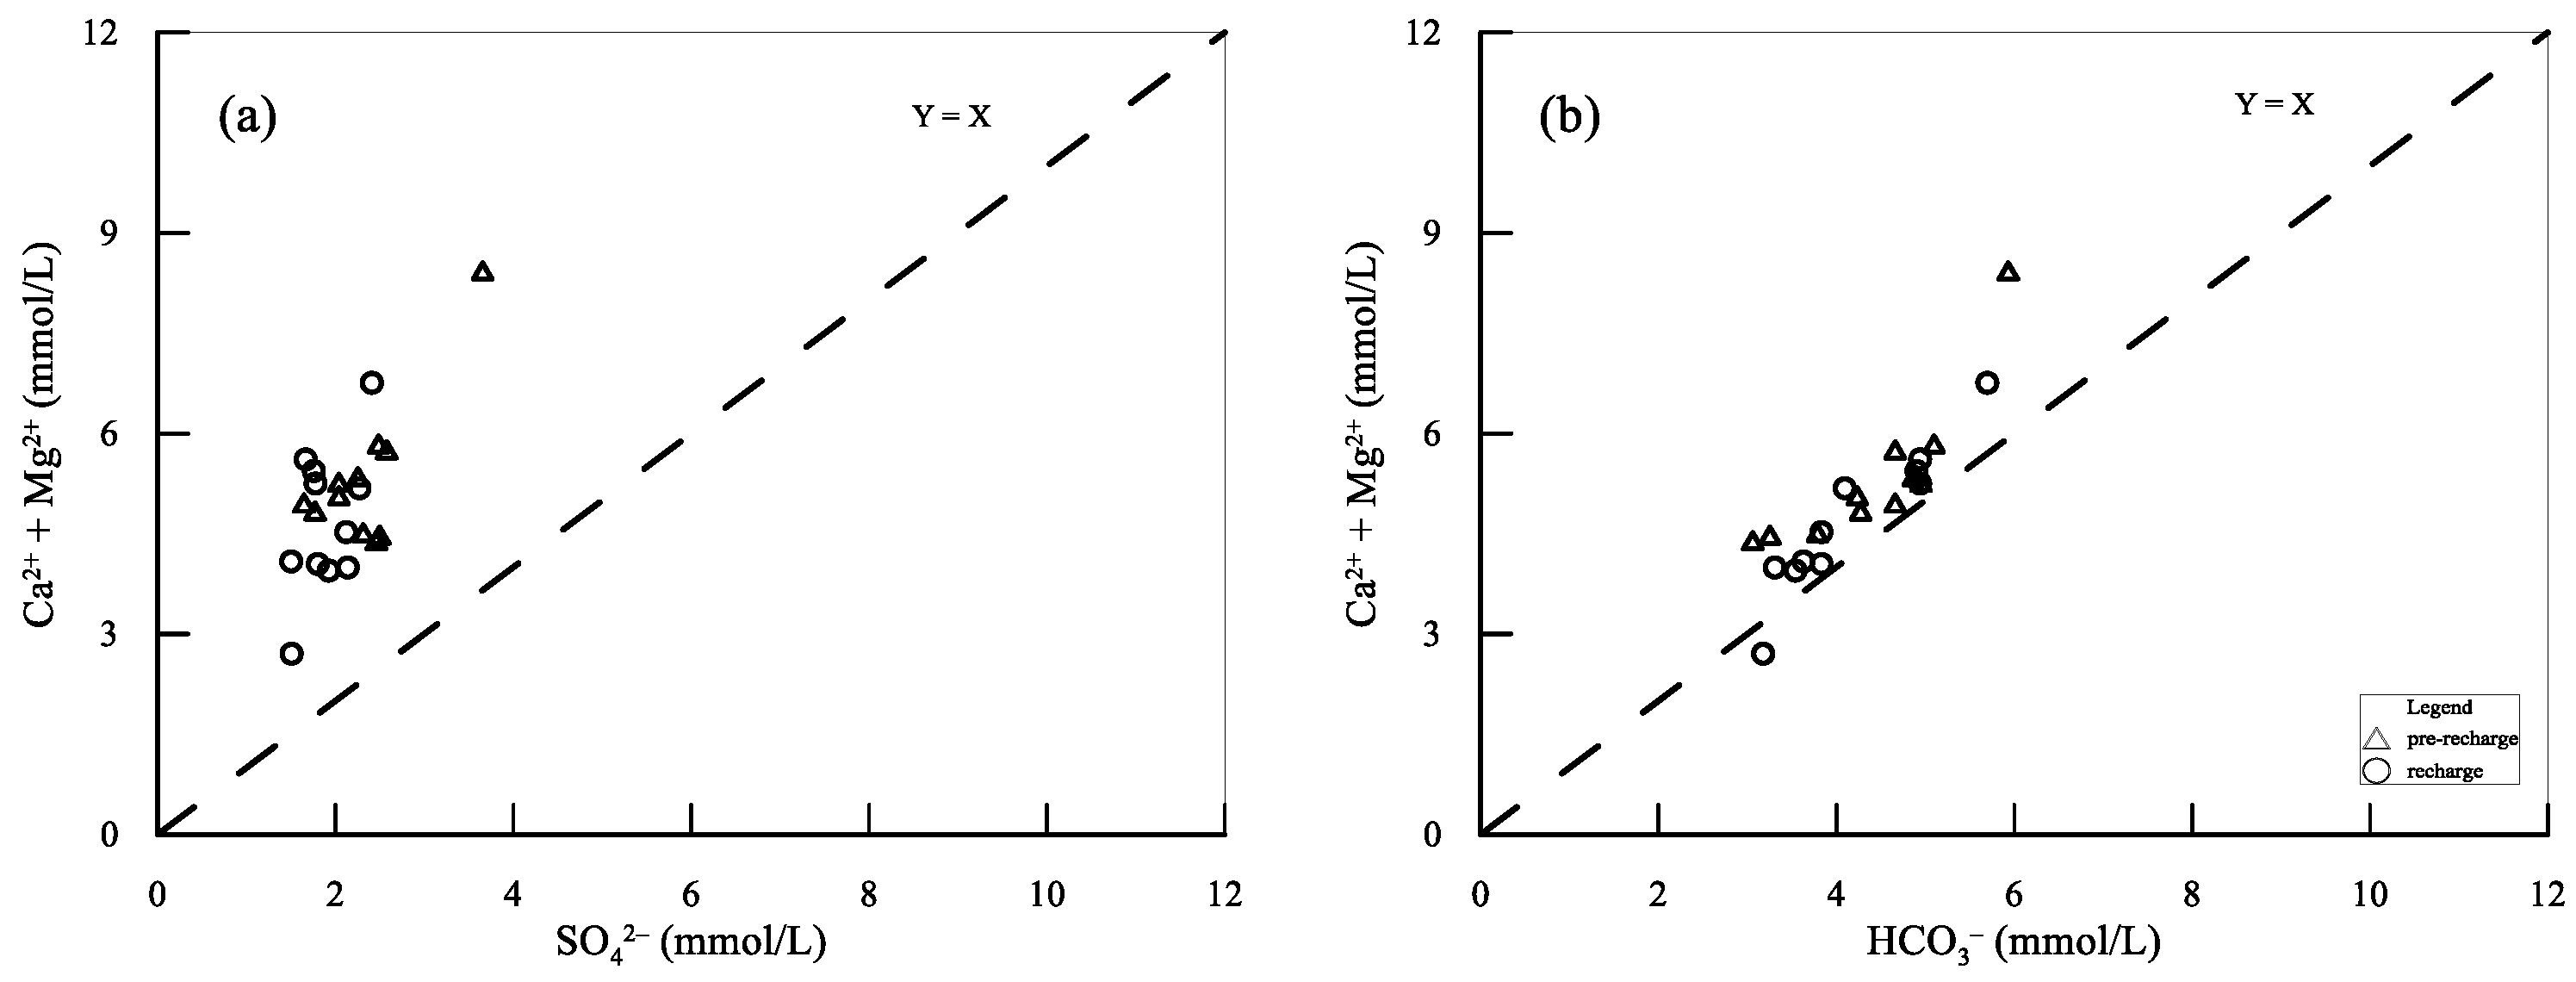
5.1. Hydrogeochemical Processes
5.2. The Change of Groundwater Quality during Water Recharge
6. Conclusions
Author Contributions
Funding
Data Availability Statement
Acknowledgments
Conflicts of Interest
References
- Regnery, J.; Li, D.; Lee, J.; Smits, K.M.; Sharp, J.O. Hydrogeochemical and microbiological effects of simulated recharge and drying within a 2D meso-scale aquifer. Chemosphere 2020, 241, 9. [Google Scholar] [CrossRef] [PubMed]
- Regnery, J.; Gerba, C.P.; Dickenson, E.R.V.; Drewes, J.E. The importance of key attenuation factors for microbial and chemical contaminants during managed aquifer recharge: A review. Crit. Rev. Environ. Sci. Technol. 2017, 47, 1409–1452. [Google Scholar] [CrossRef]
- Dillon, P.; Stuyfzand, P.; Grischek, T.; Lluria, M.; Pyne, R.D.G.; Jain, R.C.; Bear, J.; Schwarz, J.; Wang, W.; Fernandez, E.; et al. Sixty years of global progress in managed aquifer recharge. Hydrogeol. J. 2019, 27, 1–30. [Google Scholar] [CrossRef] [Green Version]
- Zhu, Y.; Zhai, Y.; Du, Q.; Teng, Y.; Wang, J.; Yang, G. The impact of well drawdowns on the mixing process of river water and groundwater and water quality in a riverside well field, Northeast China. Hydrol. Process. 2019, 33, 945–961. [Google Scholar] [CrossRef]
- Cao, Y.; Wei, Y.; Fan, W.; Peng, M.; Bao, L. Experimental study of land subsidence in response to groundwater withdrawal and recharge in Changping District of Beijing. PLoS ONE 2020, 15, e0232828. [Google Scholar] [CrossRef] [PubMed]
- Dillon, P.; Toze, S.; Page, D.; Vanderzalm, J.; Bekele, E.; Sidhu, J.; Rinck-Pfeiffer, S. Managed aquifer recharge: Rediscovering nature as a leading edge technology. Water Sci. Technol. 2010, 62, 2338–2345. [Google Scholar] [CrossRef]
- Hu, B.; Teng, Y.; Zhai, Y.; Zuo, R.; Li, J.; Chen, H. Riverbank filtration in China: A review and perspective. J. Hydrol. 2016, 541, 914–927. [Google Scholar] [CrossRef]
- Massmann, G.; Nogeitzig, A.; Taute, T.; Pekdeger, A. Seasonal and spatial distribution of redox zones during lake bank filtration in Berlin, Germany. Environ. Geol. 2007, 54, 53–65. [Google Scholar] [CrossRef]
- Yuan, J.; Dyke, M.I.V.; Huck, P.M. Water reuse through managed aquifer recharge (MAR): Assessment of regulations/guidelines and case studies. Water Pollut. Res. J. Can. 2016, 51, 357–376. [Google Scholar] [CrossRef]
- Hiscock, K.M.; Grischek, T. Attenuation of groundwater pollution by bank filtration. J. Hydrol. 2002, 266, 139–144. [Google Scholar] [CrossRef] [Green Version]
- Grischek, T.; Bartak, R. Riverbed clogging and sustainability of riverbank filtration. Water 2016, 8, 604. [Google Scholar] [CrossRef] [Green Version]
- Ganot, Y.; Holtzman, R.; Weisbrod, N.; Russak, A.; Katz, Y.; Kwtzman, D. Geochemical processes during managed aquifer recharge with desalinated seawater. Water Resour. Res. 2018, 54, 978–994. [Google Scholar] [CrossRef]
- Kurki, V.; Lipponen, A.; Katko, T. Managed aquifer recharge in community water supply: The Finnish experience and some international comparisons. Water Int. 2013, 38, 774–789. [Google Scholar] [CrossRef]
- Bartak, R.; Page, D.; Sandhu, C.; Grischek, T.; Saini, B.; Mehrotra, I.; Chakresh, K.J.; Narayan, C. Ghosh Application of risk-based assessment and management to riverbank filtration sites in India. J. Water Health 2015, 13, 174–189. [Google Scholar] [CrossRef] [PubMed]
- Daess, L.W.; Andrade-Tafoya, P.D.; Lafarga-Moreao, J.; Mahlknecht, J.; van Geldern, R.; Beramendi-Orosco, L.E.; Barth, J.A.C. Groundwater recharge sites and pollution sources in the wine-producing Guadalupe Valley (Mexico): Restrictions and mixing prior to transfer of reclaimed water from the US-México border. Sci. Total Environ. 2020, 713, 136715. [Google Scholar] [CrossRef]
- Wang, D.; Yu, J.; Wang, P.; Zhu, B. Shallow Groundwater Chemistry Characteristics and Their Controlling Factors in the Ejina Delta. South-to-North Water Diversion. Water Sci. Technol. 2013, 11, 51–55. (In Chinese) [Google Scholar]
- Zhu, Y.; Zhai, Y.; Teng, Y.; Wang, G.; Du, Q.; Wang, J.; Yang, G. Water supply safety of riverbank filtration wells under the impact of surface water-groundwater interaction: Evidence from long-term field pumping tests. Sci. Total Environ. 2020, 711, 135141. [Google Scholar] [CrossRef]
- AlBassam, M.A.; Awad, H.S.; Al Alawi, J.A. DurovPlot: A computer program for processing and plotting hydrochemical data. Ground Water 1997, 35, 362–367. [Google Scholar] [CrossRef]
- Boving, T.B.; Patil, K.; D’Souza, F.; Barker, S.F.; McGuinness, S.L.; O’Toole, J.; Sinclair, M.; Forbes, A.B.; Leder, K. Performance of riverbank filtration under hydrogeologic conditions along the upper Krishna River in Southern India. Water 2019, 11, 12. [Google Scholar] [CrossRef] [Green Version]
- Li, C.; Li, B.; Bi, E. Characteristics of hydrochemistry and nitrogen behavior under long-term managed aquifer recharge with reclaimed water: A case study in north China. Sci. Total Environ. 2019, 668, 1030–1037. [Google Scholar] [CrossRef]
- Yu, Y.; Song, X.; Zhang, Y.; Zheng, F.; Liu, L. Impact of reclaimed water in the watercourse of Huai River on groundwater from Chaobai River basin, Northern China. Front. Earth Sci. 2016, 11, 643–659. [Google Scholar] [CrossRef]
- Pan, W.; Huang, Q.; Huang, G. Nitrogen and organics removal during riverbank filtration along a reclaimed water restored river in Beijing, China. Water 2018, 10, 491. [Google Scholar] [CrossRef] [Green Version]
- Horriche, F.J.; Benabdallah, S. Assessing aquifer water level and salinity for a managed artificial recharge site using reclaimed water. Water 2020, 12, 341. [Google Scholar] [CrossRef] [Green Version]
- Sprenger, C.; Lorenzen, G.; Hulshoff, I.; Grutzmacher, G.; Ronghang, M.; Pekdeger, A. Vulnerability of bank filtration systems to climate change. Sci. Total Environ. 2011, 409, 655–663. [Google Scholar] [CrossRef] [PubMed]
- Munz, M.; Oswald, S.E.; Schaefferling, R.; Lensing, H.-J. Temperature-dependent redox zonation, nitrate removal and attenuation of organic micropollutants during bank filtration. Water Res. 2019, 162, 225–235. [Google Scholar] [CrossRef]
- Guyennon, N.; Salerno, F.; Portoghese, I.; Romano, E. Climate Change Adaptation in a Mediterranean Semi-Arid Catchment: Testing Managed Aquifer Recharge and Increased Surface Reservoir Capacity. Water 2017, 9, 689. [Google Scholar] [CrossRef] [Green Version]
- Xanke, J.; Liesch, T.; Goeppert, N.; Klinger, J.; Gassen, N.; Goldscheider, N. Contamination risk and drinking water protection for a large-scale managed aquifer recharge site in a semi-arid karst region, Jordan. Hydrogeol. J. 2017, 25, 1795–1809. [Google Scholar] [CrossRef]
- Zammouri, M.; Brini, N. Efficiency of artificial groundwater recharge, quantification through conceptual modelling. Water Resour. Manag. 2020, 34, 3345–3361. [Google Scholar] [CrossRef]
- Groeschke, M.; Frommen, T.; Taute, T.; Schneider, M. The impact of sewage-contaminated river water on groundwater ammonium and arsenic concentrations at a riverbank filtration site in central Delhi, India. Hydrogeol. J. 2017, 25, 2185–2197. [Google Scholar] [CrossRef]
- Li, Y.; Zhang, Z.; Fei, Y.; Chen, H.; Qian, Y.; Dun, Y. Investigation of quality and pollution characteristics of groundwater in the Hutuo River Alluvial Plain, North China Plain. Environ. Earth Sci. 2016, 75, 581. [Google Scholar] [CrossRef]
- Zhang, X.; He, J.; He, B.; Sun, J. Assessment, formation mechanism, and different source contributions of dissolved salt pollution in the shallow groundwater of Hutuo River alluvial-pluvial fan in the North China Plain. Environ. Sci. Pollut. Res. 2019, 26, 35742–35756. [Google Scholar] [CrossRef] [PubMed]
- Zhang, Q.; Wang, H.; Wang, L. Tracing nitrate pollution sources and transformations in the over-exploited groundwater region of north China using stable isotopes. J. Contam. Hydrol. 2018, 218, 1–9. [Google Scholar] [CrossRef]
- Zhang, Q.; Wang, H.; Wang, Y.; Yang, M.; Zhu, L. Groundwater quality assessment and pollution source apportionment in an intensely exploited region of northern China. Environ. Sci. Pollut. Res. 2017, 24, 16639–16650. [Google Scholar] [CrossRef] [PubMed]
- GB/T 14848-2017; Quality Standard for Ground Water. Standardization Administration of the PRC: Beijing, China, 2017; p. 20. (In Chinese)
- Su, X.; Xu, W.; Du, S. Responses of groundwater vulnerability to artificial recharge under extreme weather conditions in Shijiazhuang City, China. J. Water. Supply Res. T. 2014, 63, 224–238. [Google Scholar] [CrossRef]
- Tian, X.; Meng, S.; Cui, X.; Zhang, X.; Zhang, Z.; Fei, Y. Hydrochemical Effect of Groundwater Recharge in Over-Exploited Area of Hutuo River Basin. Res. Environ. Sci. 2021, 34, 629–636. (In Chinese) [Google Scholar]
- He, P. Primary Analysis of Groundwater Circumstances Influence of Huangbizhuang Village Reservoir Waterproof Project to the Hutuo River Alluvium. Ground Water 2009, 31, 121–123. (In Chinese) [Google Scholar]
- Men, G. Design flood analysis of Huangbizhuang Reservoir downstream river channel. Water Sci. Eng. Technol. 2015, 4, 25–28. (In Chinese) [Google Scholar]
- Zheng, Y.; Vanderzalm, J.; Hartog, N.; Escalante, E.F.; Stefan, C. The 21st century water quality challenges for managed aquifer recharge: Towards a risk-based regulatory approach. Hydrogeol. J. 2022, 31, 189. [Google Scholar] [CrossRef]
- Piper, A.M. A Graphic Procedure in the Geochemical Interpretation of Water Analysis; United States Department of the Interior, Geological Survey, Water Resources Division, Ground Water Branch: Washington, DC, USA; CRC Press: Boca Raton, FL, USA, 1953; p. 63. [Google Scholar]
- Zhai, Y.; Zheng, F.; Zhao, X.; Xia, X.; Teng, Y. Identification of hydrochemical genesis and screening of typical groundwater pollutants impacting human health: A case study in Northeast China. Environ. Pollut. 2019, 252, 1202–1215. [Google Scholar] [CrossRef]
- Kang, X.; Niu, Y.; Yu, H.; Gou, P.; Hou, Q.; Lu, X.; Wu, Y. Effect of rainfall-runoff process on sources and transformations of nitrate using a combined approach of dual isotopes, hydrochemical and Bayesian model in the Dagang River basin. Sci. Total Environ. 2022, 837, 1–11. [Google Scholar] [CrossRef]
- Appelo, C.A.J.; Willemsen, A. Geochemical calculations and observations on salt water intrusions, I. A combined geochemical/minxing cell model. J. Hydrol. 1987, 94, 313–330. [Google Scholar] [CrossRef]
- Duan, R.; Li, P.; Wang, L.; He, X.; Zhang, L. Hydrochemical characteristics, hydrochemical processes and recharge sources of the geothermal systems in Lanzhou City, northwestern China. Urban Clim. 2022, 43, 1–15. [Google Scholar] [CrossRef]
- Su, Y.; Zhu, G.; Feng, Q.; Li, Z.; Zhang, F. Environmental isotopic and hydrochemical study of groundwater in the Ejina Basin, northwest China. Environ. Geol. 2009, 58, 601–614. [Google Scholar] [CrossRef]
- Bekele, E.; Zhang, Y.; Donn, M.; McFarlane, D. Inferring groundwater dynamics in a coastal aquifer near wastewater infiltration ponds and shallow wetlands (Kwinana, Western Australia) using combined hydrochemical, isotopic and statistical approaches. J. Hydrol. 2019, 568, 1055–1070. [Google Scholar] [CrossRef]
- Noble, J.; Ansari, M.A. Isotope hydrology and geophysical techniques for reviving a part of the drought prone areas of Vidarbha, Maharashtra, India. J. Hydrol. 2019, 570, 495–507. [Google Scholar] [CrossRef]
- Wang, Z.; Yin, J.; Pu, J.; Wang, P.; Liang, X.; Yang, P.; He, Q.; Gou, P.; Yuan, D. Integrated understanding of the Critical Zone processes in a subtropical karst watershed (Qingmuguan, Southwestern China): Hydrochemical and isotopic constraints. Sci. Total Environ. 2020, 749, 141257. [Google Scholar] [CrossRef]
- Dugga, P.; Pervez, S.; Tripathi, M.; Siddiqui, M.N. Spatiotemporal variability and source apportionment of the ionic components of groundwater of a mineral-rich tribal belt in Bastar, India. Groundw. Sustain. Dev. 2020, 10, 100356. [Google Scholar] [CrossRef]
- Hou, G.; Zhao, M.; Wang, Y. Groundwater Investigation in the Ordos Basin; China Geological Survey: Beijing, China, 2006. (In Chinese) [Google Scholar]
- Kong, X.; Wang, S.; Liu, B.; Sun, H.; Sheng, Z. Impact of water transfer on interaction between surface water and groundwater in the lowland area of North China Plain. Hydrol. Process. 2018, 32, 2044–2057. [Google Scholar] [CrossRef]
- Guo, X.; Zuo, R.; Wang, J.; Meng, L.; Teng, Y.; Shi, R.; Gao, X.; Ding, F. Hydrogeochemical Evolution of Interaction Between Surface Water and Groundwater Affected by Exploitation. Groundwater 2019, 57, 430–442. [Google Scholar] [CrossRef]
- Liu, J.; Gao, Z.; Wang, Z.; Xu, X.; Su, Q.; Wang, S.; Qu, W.; Xing, T. Hydrogeochemical processes and suitability assessment of groundwater in the Jiaodong Peninsula, China. Environ. Monit. Assess. 2020, 192, 17. [Google Scholar] [CrossRef]
- Lasaga, A.C. Chemical kinetics of water–rock interactions. J. Geophys. Res. 1984, 89, 4009–4025. [Google Scholar] [CrossRef]
- Wu, J.; Li, P.; Qian, H.; Duan, Z.; Zhang, X. Using correlation and multivariate statistical analysis to identify hydrogeochemical processes affecting the major ion chemistry of waters: A case study in Laoheba phosphorite mine in Sichuan, China. Arab. J. Geosci. 2014, 7, 3973–3982. [Google Scholar] [CrossRef]
- Liu, Y.; Fei, Y.; Meng, S.; Cui, X. Hydrochemical evolution of groundwater and soils in the water-level-fluctuation zone. Environ. Earth Sci. 2019, 78, 12. [Google Scholar] [CrossRef]
- Han, Y.; Zhai, Y.; Guo, M.; Cao, X.; Lu, H.; Li, J.; Wang, S.; Yue, W. Hydrochemical and isotopic characterization of the impact of water diversion on water in drainage channels, groundwater, and Lake Ulansuhai in China. Water 2021, 13, 3033. [Google Scholar] [CrossRef]
- Gibbs, R.J. Mechanisms controlling world water chemistry. Science 1970, 170, 1088–1090. [Google Scholar] [CrossRef] [PubMed]
- Marghade, D.; Malpe, D.B.; Zade, A.B. Major ion chemistry of shallow groundwater of a fast growing city of Central India. Environ. Monit. Assess. 2012, 184, 2405–2418. [Google Scholar] [CrossRef]
- Xing, L.; Guo, H.; Zhan, Y. Groundwater hydrochemical characteristics and processes along flow paths in the North China Plain. J. Asian Earth Sci. 2013, 70–71, 250–264. [Google Scholar] [CrossRef]
- Pant, R.R.; Zhang, F.; Rehman, F.U.; Wang, G.; Ye, M.; Zeng, C.; Tang, H. Spatiotemporal variations of hydrogeochemistry and its controlling factors in the Gandaki River Basin, Central Himalaya Nepal. Sci. Total Environ. 2018, 622–623, 770–782. [Google Scholar] [CrossRef]


| Time | June 2018 | November 2018 | May 2019 | October 2019 | ||||||||||||
|---|---|---|---|---|---|---|---|---|---|---|---|---|---|---|---|---|
| Number of Sample Points | 11 | 11 | 14 | 14 | ||||||||||||
| Inorganic Ions | Max | Min | Mean | Median | Max | Min | Mean | Median | Max | Min | Mean | Median | Max | Min | Mean | Median |
| K+ | 3.67 | 1.72 | 2.65 | 2.70 | 4.09 | 1.51 | 2.65 | 2.54 | 3.19 | 1.10 | 2.70 | 2.82 | 3.18 | 0.99 | 2.71 | 2.87 |
| Na+ | 76.15 | 28.27 | 39.87 | 35.63 | 51.92 | 22.39 | 34.12 | 31.82 | 52.26 | 28.72 | 37.98 | 37.33 | 52.62 | 30.12 | 38.62 | 37.32 |
| Ca2+ | 226.00 | 119.20 | 148.15 | 142.20 | 195.20 | 69.10 | 126.68 | 124.80 | 207.60 | 95.07 | 152.17 | 156.05 | 217.51 | 99.90 | 148.58 | 147.02 |
| Mg2+ | 66.79 | 31.67 | 39.65 | 36.81 | 59.80 | 23.43 | 36.43 | 32.19 | 56.69 | 24.62 | 39.12 | 40.61 | 70.84 | 29.31 | 45.01 | 39.82 |
| Cl− | 210.60 | 39.66 | 77.12 | 54.75 | 106.80 | 37.11 | 61.81 | 61.27 | 110.00 | 38.42 | 67.78 | 67.59 | 109.51 | 40.71 | 68.99 | 68.79 |
| SO4- | 350.80 | 157.90 | 224.47 | 221.90 | 231.10 | 144.00 | 182.00 | 172.80 | 263.00 | 143.90 | 218.41 | 223.05 | 255.70 | 140.60 | 207.10 | 210.55 |
| HCO3⁻ | 361.90 | 186.60 | 270.48 | 284.30 | 347.50 | 193.70 | 254.45 | 233.70 | 441.00 | 206.00 | 302.46 | 296.00 | 480.38 | 196.93 | 317.13 | 298.37 |
| CO32- | ND | ND | ND | ND | ND | ND | ND | ND | ND | ND | ND | ND | ND | ND | ND | ND |
| NO3- | 99.02 | 21.81 | 54.19 | 56.53 | 103.80 | 10.51 | 45.45 | 35.68 | 149.80 | 4.35 | 66.34 | 66.00 | 152.90 | 3.94 | 66.66 | 69.93 |
| DO | 7.98 | 3.35 | 7.32 | 7.39 | 8.0 | 3.34 | 7.23 | 7.35 | 8.0 | 4.04 | 7.28 | 7.06 | 7.99 | 3.56 | 7.31 | 7.38 |
| TDS | 1183 | 610 | 737 | 703 | 895 | 433 | 632 | 630 | 1045 | 505 | 745 | 738 | 1088 | 547 | 753 | 714 |
| pH | 8.10 | 7.61 | 7.82 | 7.86 | 7.94 | 7.51 | 7.72 | 7.75 | 7.73 | 7.31 | 7.50 | 7.51 | 7.93 | 7.45 | 7.69 | 7.67 |
| temperature | 15.8 | 11.9 | 13.8 | 14.3 | 14.2 | 15.5 | 12.1 | 14.1 | 14.5 | 15.9 | 11.4 | 13.9 | 14.3 | |||
| Time | Pre-Recharge | Recharge | ||
|---|---|---|---|---|
| Factors | Fac_1 | Fac_2 | Fac_1 | Fac_2 |
| Na+ | 0.90 | 0.33 | 0.94 | 0.38 |
| Ca2+ | 0.89 | 0.35 | 0.85 | 0.55 |
| Mg2+ | 0.87 | 0.28 | 0.95 | −0.14 |
| Cl− | 0.88 | 0.11 | 0.88 | 0.09 |
| SO42− | 0.85 | −0.18 | 0.24 | 0.82 |
| HCO3− | 0.32 | 0.81 | 0.92 | 0.33 |
| TDS | 0.92 | 0.39 | 0.89 | 0.58 |
| Kaiser–Meyer–Olkin Measure of Sampling Adequacy | 0.71 | 0.68 | ||
| Cumulative variance (%) | 65.58 | 88.90 | 61.75 | 83.02 |
| Water Type | Mixing Ratio | ||||||||
|---|---|---|---|---|---|---|---|---|---|
| Groundwater | 0.9 | 0.8 | 0.7 | 0.6 | 0.5 | 0.4 | 0.3 | 0.2 | 0.1 |
| Recharge Water | 0.1 | 0.2 | 0.3 | 0.4 | 0.5 | 0.6 | 0.7 | 0.8 | 0.9 |
| G:R | 9:1 | 8:2 | 7:3 | 6:4 | 5:5 | 4:6 | 3:7 | 2:8 | 1:9 |
|---|---|---|---|---|---|---|---|---|---|
| Na+ | 38.34 | 37.03 | 35.7 | 34.39 | 33.05 | 31.74 | 30.41 | 29.11 | 27.76 |
| HCO3− | 248.27 | 236.62 | 224.97 | 213.26 | 201.48 | 189.71 | 177.82 | 165.81 | 153.65 |
| Mg2+ | 32.712 | 31.2 | 29.688 | 28.176 | 26.664 | 25.152 | 23.6232 | 22.0968 | 20.568 |
| Ca2+ | 122.36 | 115.4 | 108.44 | 101.48 | 94.52 | 87.48 | 80.48 | 73.4 | 66.32 |
| SO42− | 216 | 161.37 | 155.71 | 150.05 | 144.29 | 138.62 | 132.86 | 127.11 | 121.34 |
| G:R | 9:1 | 8:2 | 7:3 | 6:4 | 5:5 | 4:6 | 3:7 | 2:8 | 1:9 |
|---|---|---|---|---|---|---|---|---|---|
| calcite | 0.03 | 0.03 | 0.02 | −0.02 | −0.1 | −0.21 | −0.36 | −0.59 | −0.96 |
| dolomite | 0.05 | 0.06 | 0.02 | −0.07 | −0.23 | −0.47 | −0.8 | −1.27 | −2.04 |
| gypsum | −0.08 | −0.16 | −0.25 | −0.35 | −0.47 | −0.6 | −0.75 | −0.95 | −1.2 |
| halite | −0.23 | −0.48 | −0.76 | −1.05 | −1.42 | −1.85 | −2.37 | −3.07 | −5.23 |
| mirabilite | −2.04 | −2.12 | −2.21 | −2.34 | −2.49 | −2.65 | −2.79 | −2.92 | −3.21 |
Disclaimer/Publisher’s Note: The statements, opinions and data contained in all publications are solely those of the individual author(s) and contributor(s) and not of MDPI and/or the editor(s). MDPI and/or the editor(s) disclaim responsibility for any injury to people or property resulting from any ideas, methods, instructions or products referred to in the content. |
© 2023 by the authors. Licensee MDPI, Basel, Switzerland. This article is an open access article distributed under the terms and conditions of the Creative Commons Attribution (CC BY) license (https://creativecommons.org/licenses/by/4.0/).
Share and Cite
Zhang, B.; Chen, L.; Li, Y.; Liu, Y.; Li, C.; Kong, X.; Zhang, Y. Impacts of River Bank Filtration on Groundwater Hydrogeochemistry in the Upper of Hutuo River Alluvial Plain, North China. Water 2023, 15, 1343. https://doi.org/10.3390/w15071343
Zhang B, Chen L, Li Y, Liu Y, Li C, Kong X, Zhang Y. Impacts of River Bank Filtration on Groundwater Hydrogeochemistry in the Upper of Hutuo River Alluvial Plain, North China. Water. 2023; 15(7):1343. https://doi.org/10.3390/w15071343
Chicago/Turabian StyleZhang, Baoyun, Lining Chen, Yasong Li, Yaci Liu, Chao Li, Xiangke Kong, and Yuanjing Zhang. 2023. "Impacts of River Bank Filtration on Groundwater Hydrogeochemistry in the Upper of Hutuo River Alluvial Plain, North China" Water 15, no. 7: 1343. https://doi.org/10.3390/w15071343