
Application and Automatic Monitoring and Analysis of Hybrid Support Structure in Ultra-DEEP Foundation Pit Engineering in the Lanzhou Area under Complex Environmental Conditions
Abstract
:1. Introduction
2. Project Overview
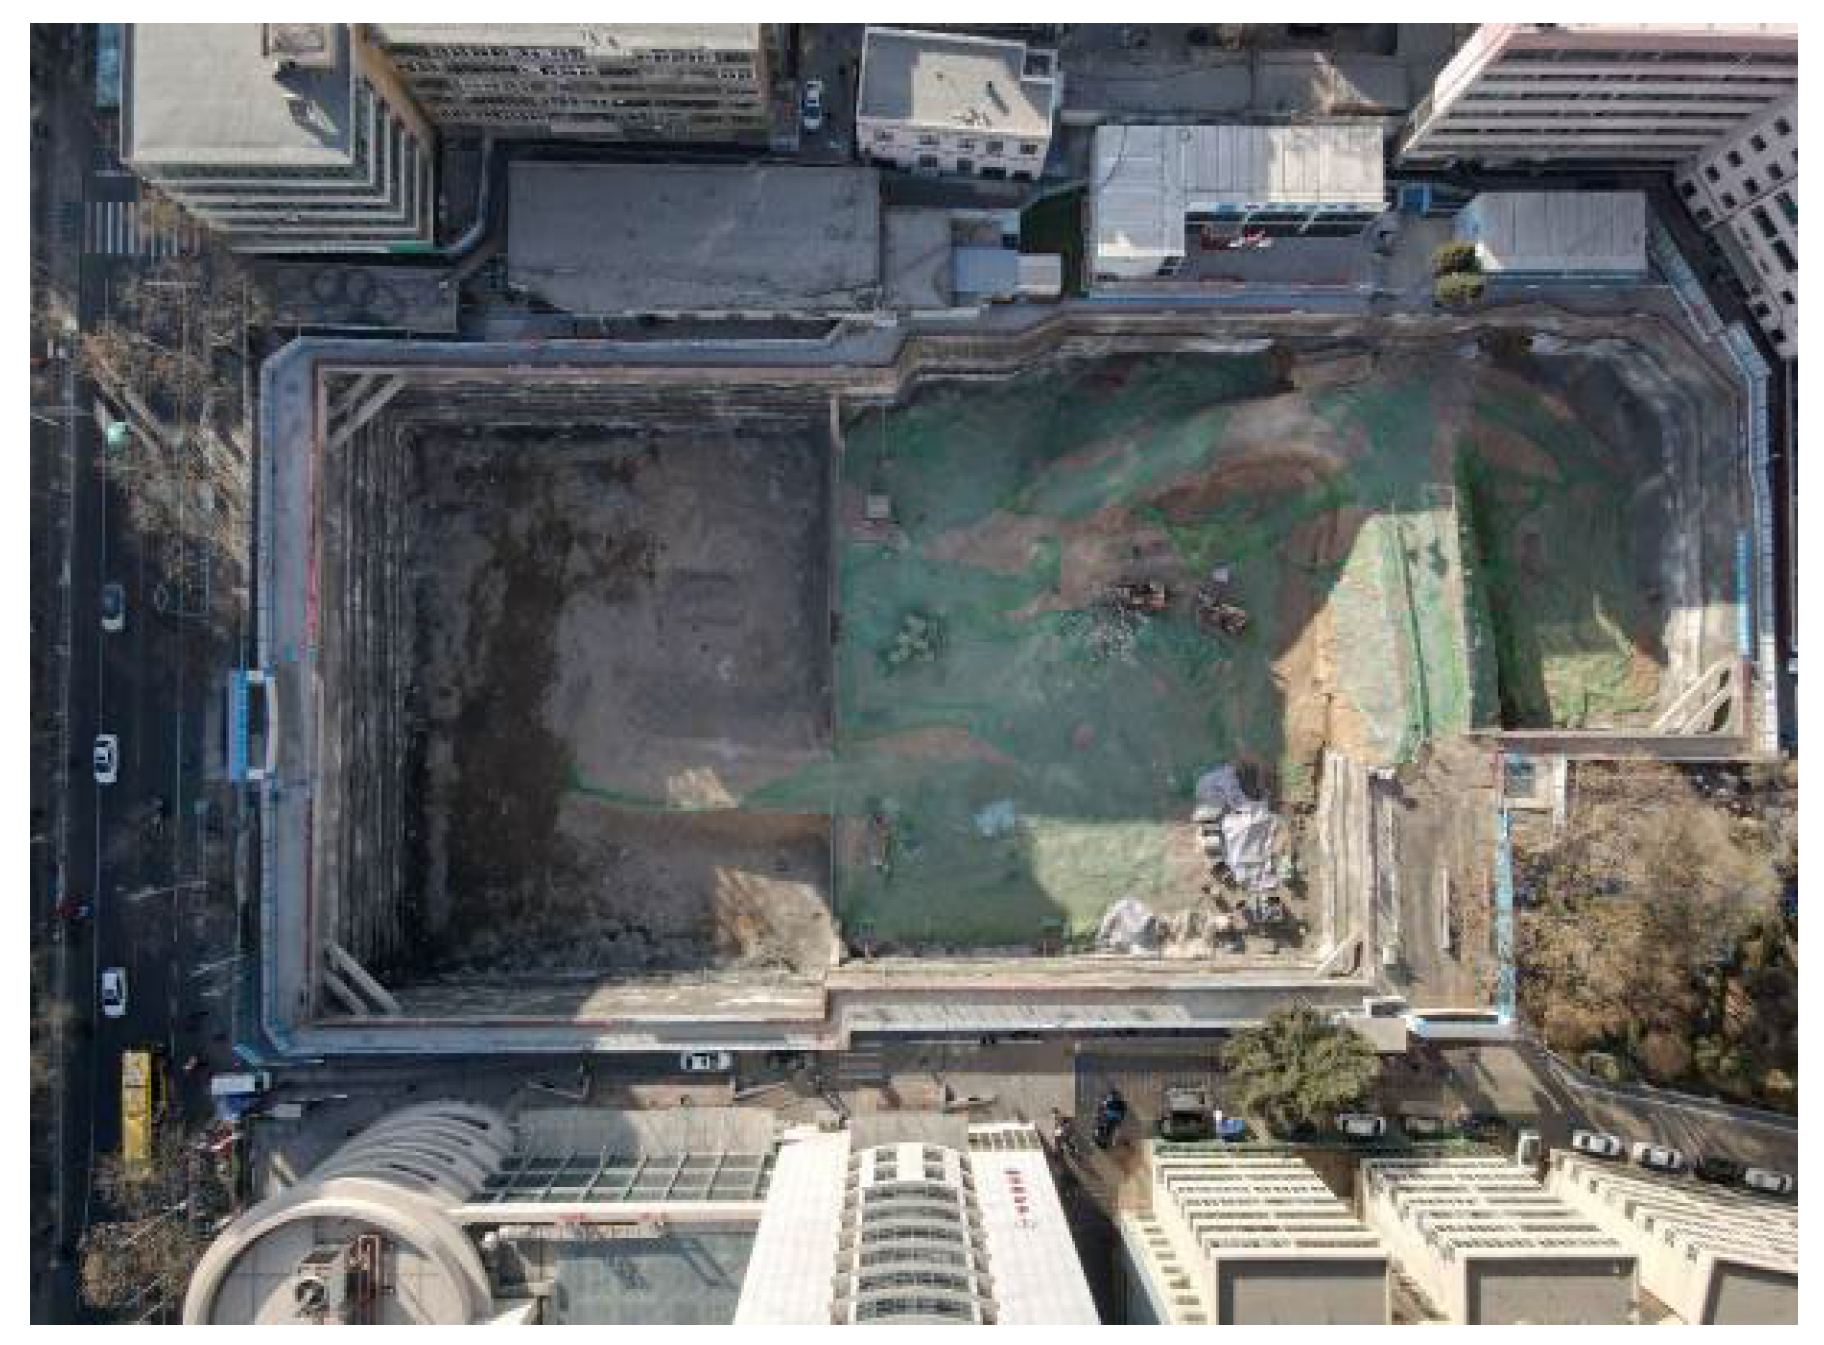
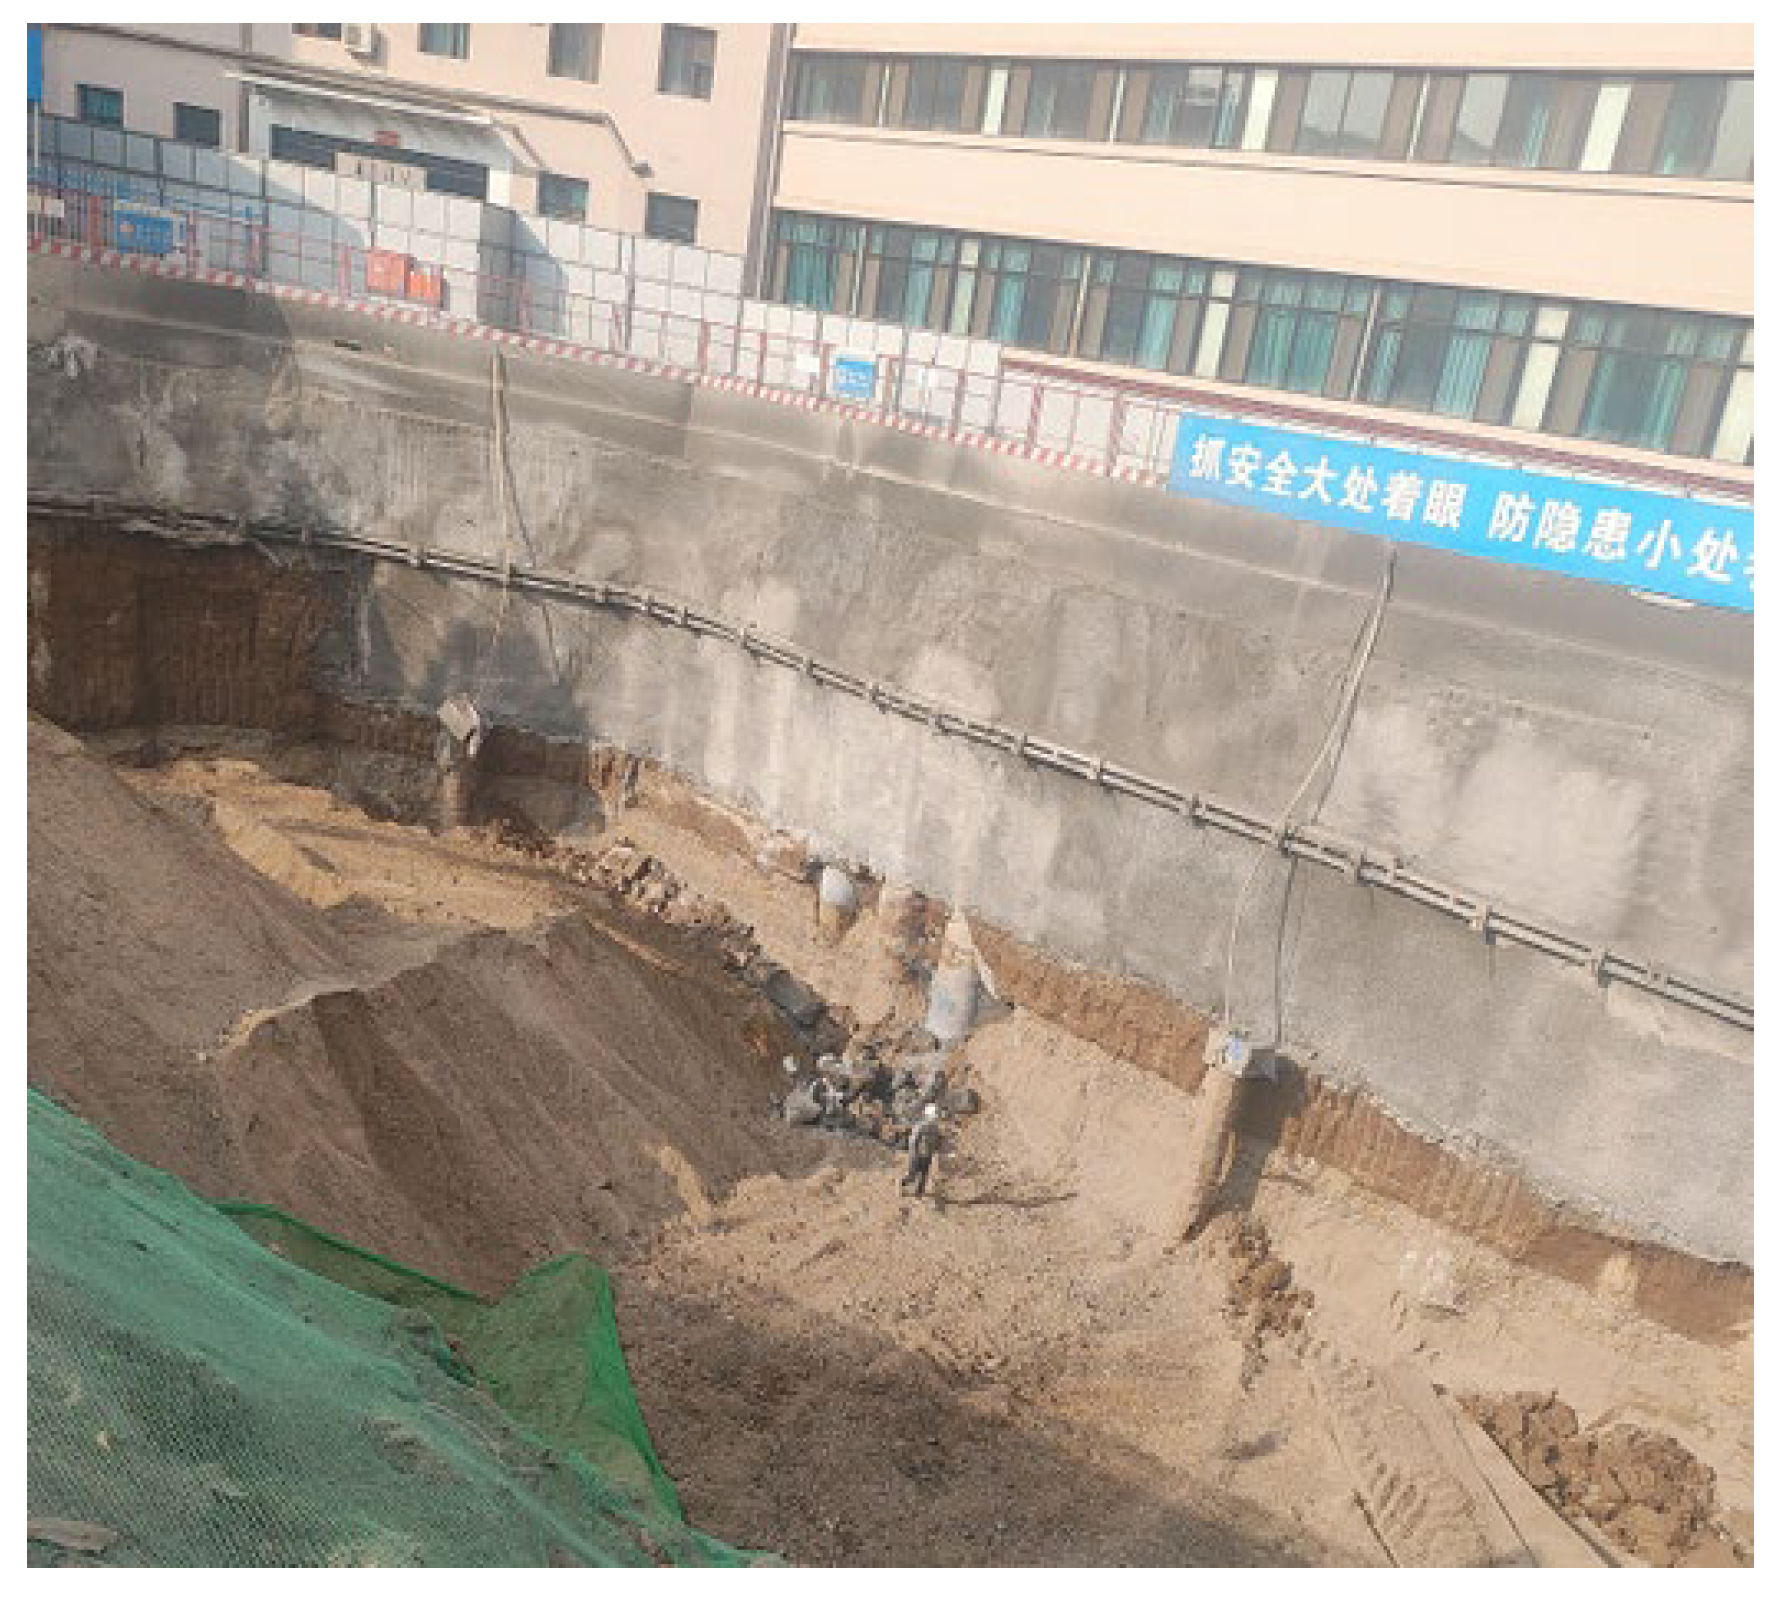
2.1. Site Overview
2.2. Hydrogeological Conditions
3. Pit Support Design Scheme and Construction
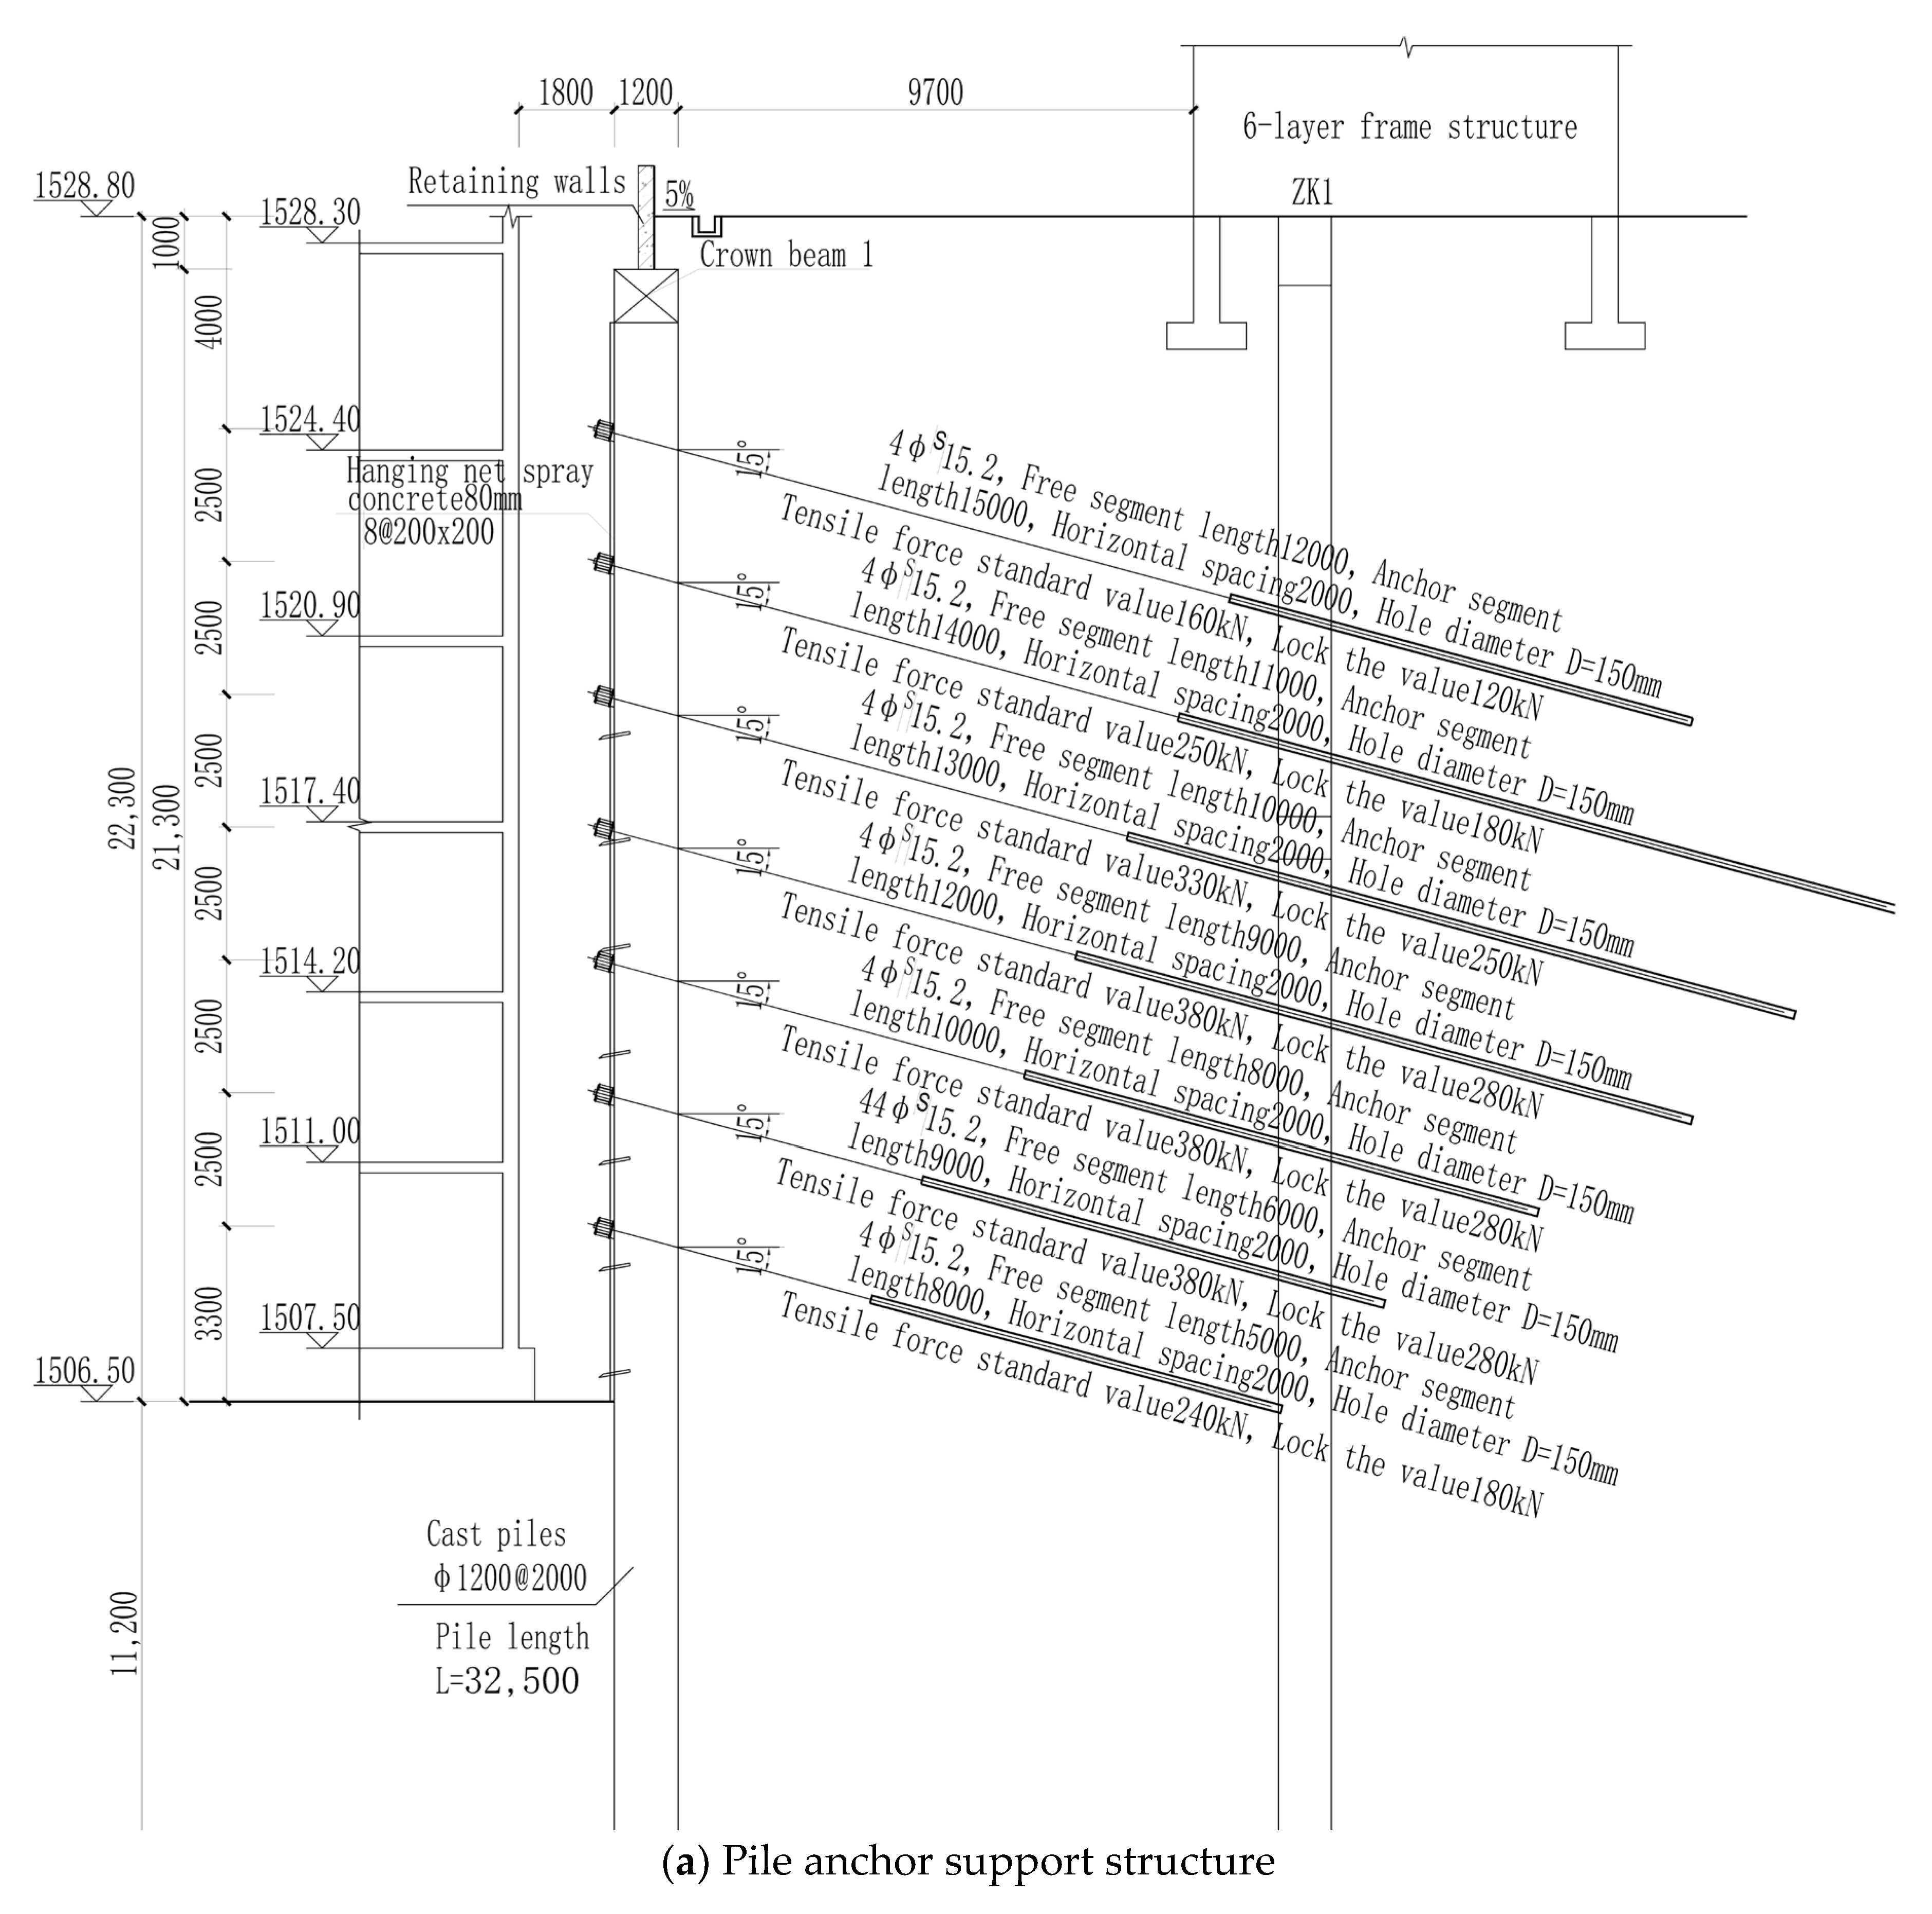
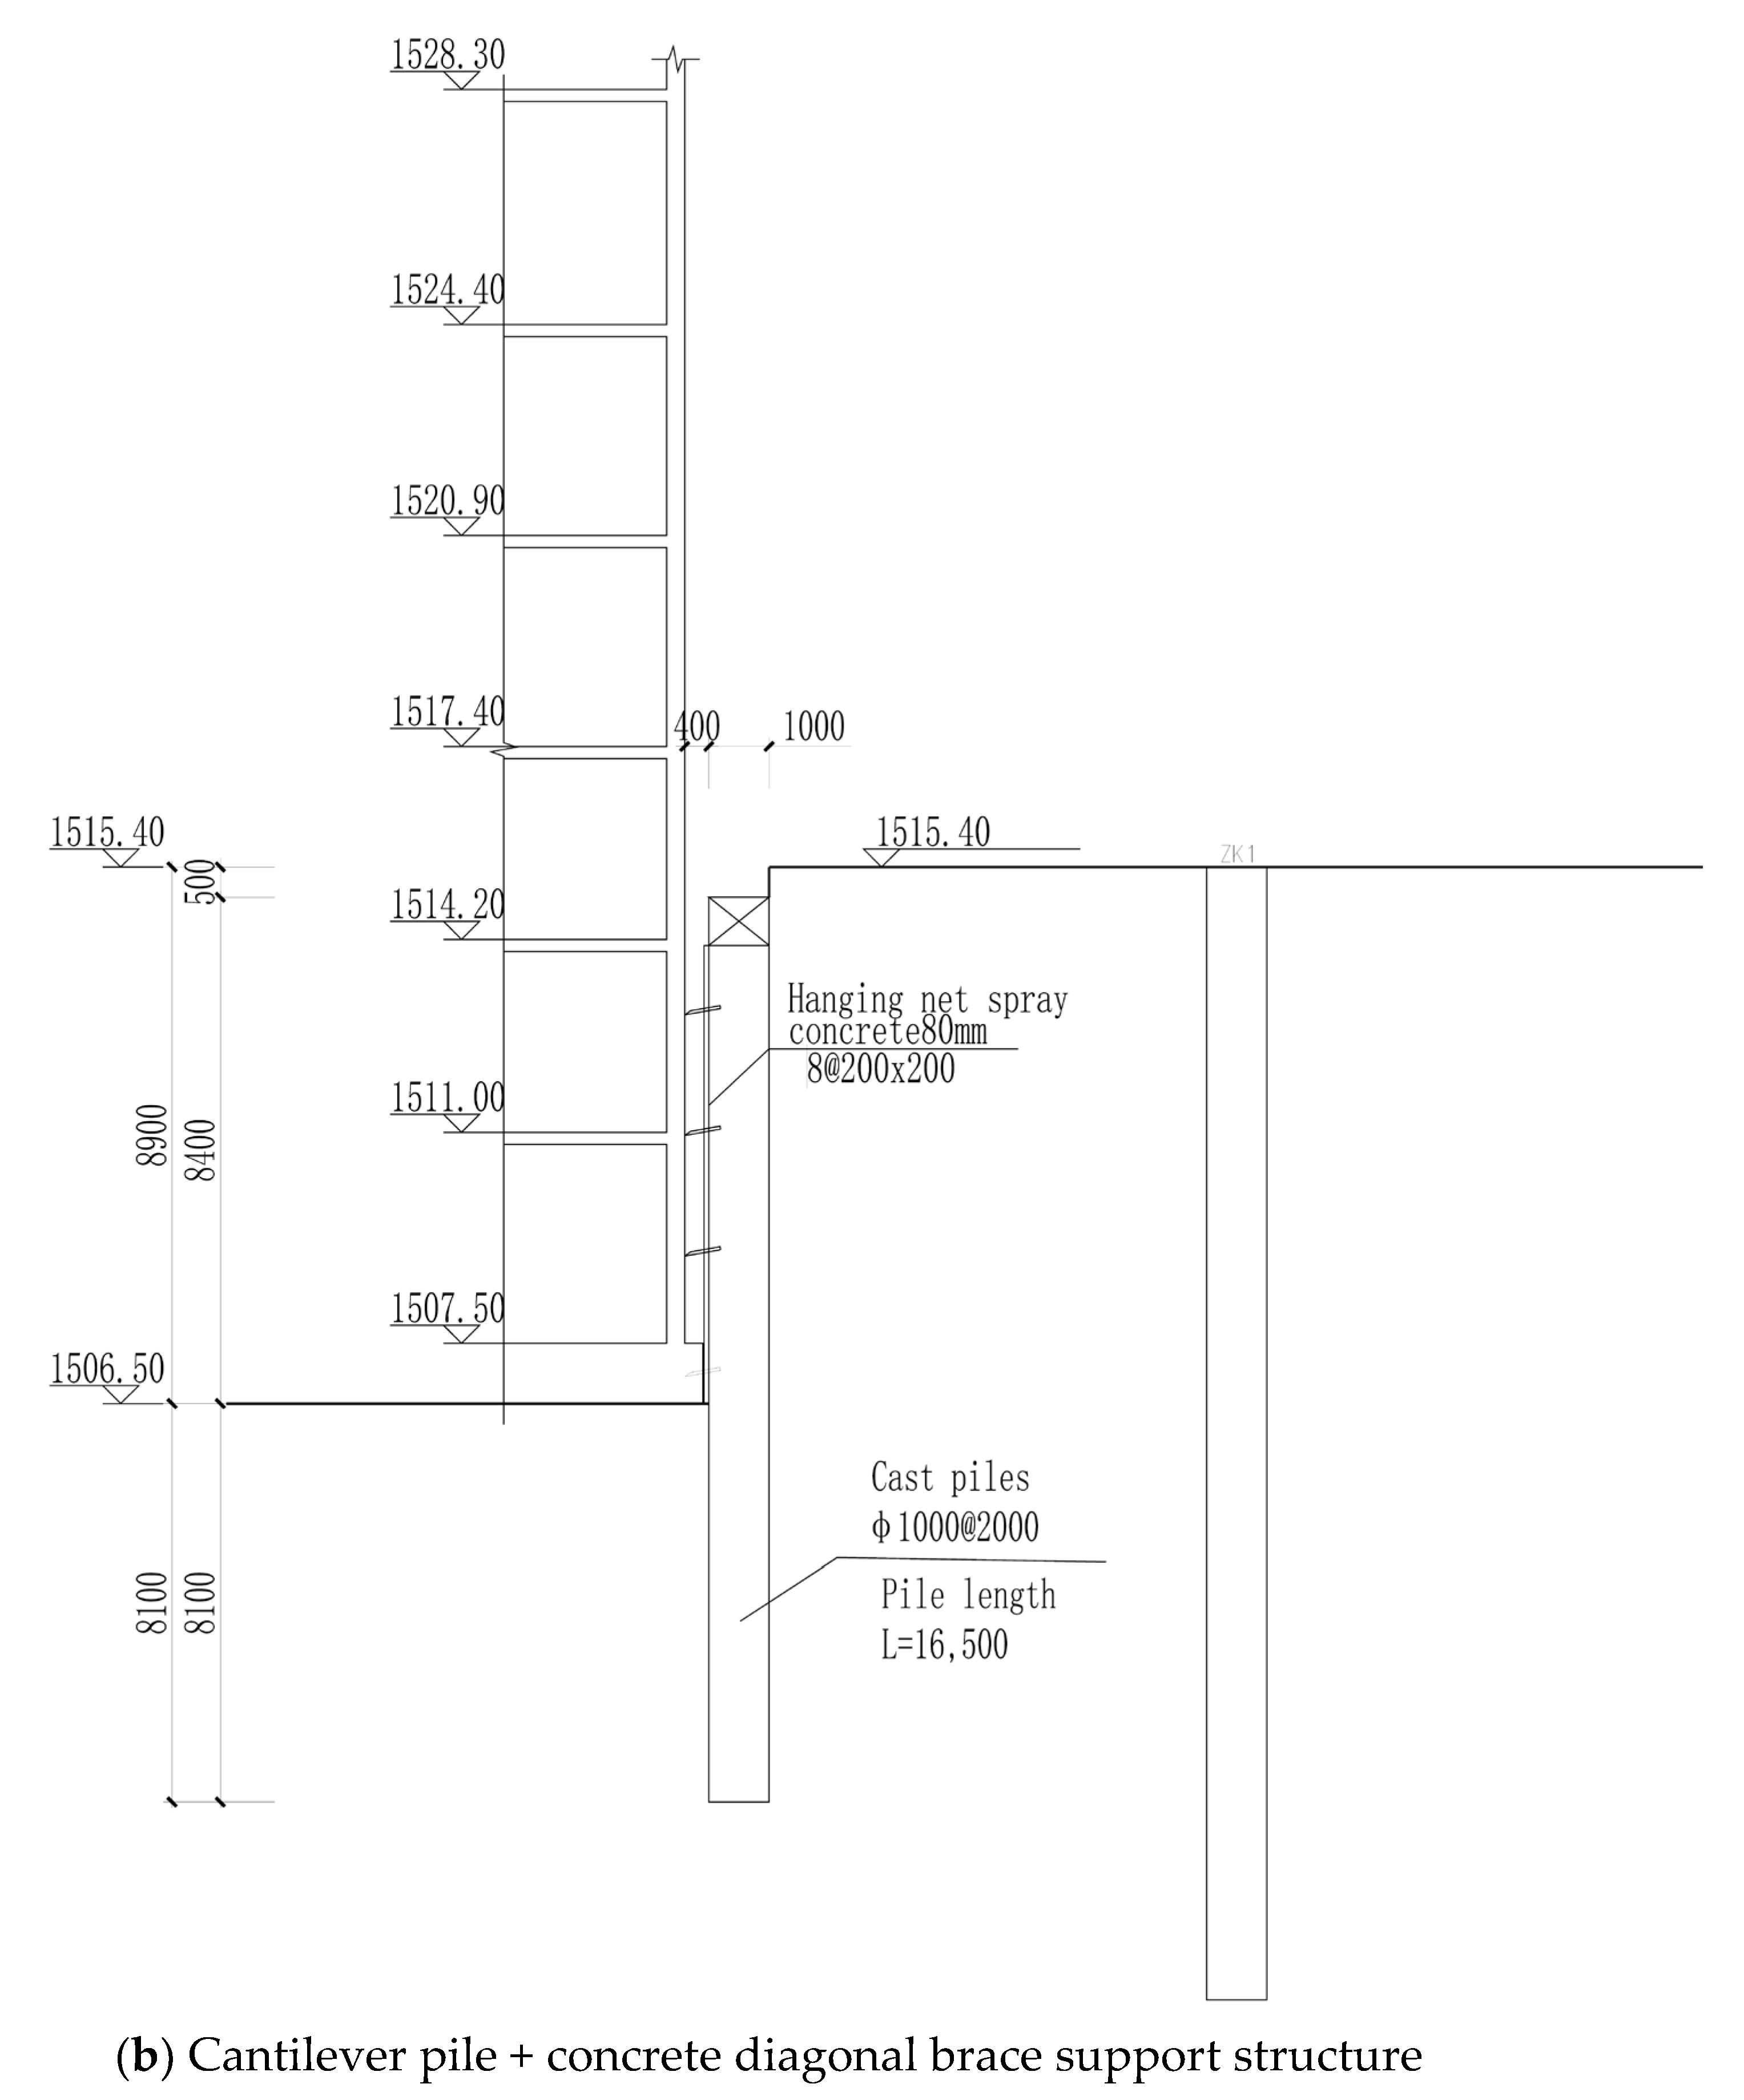
3.1. Selection of Supporting Structure
3.2. Reinforced Concrete Support Piles
3.3. Prestressed Anchor Cables
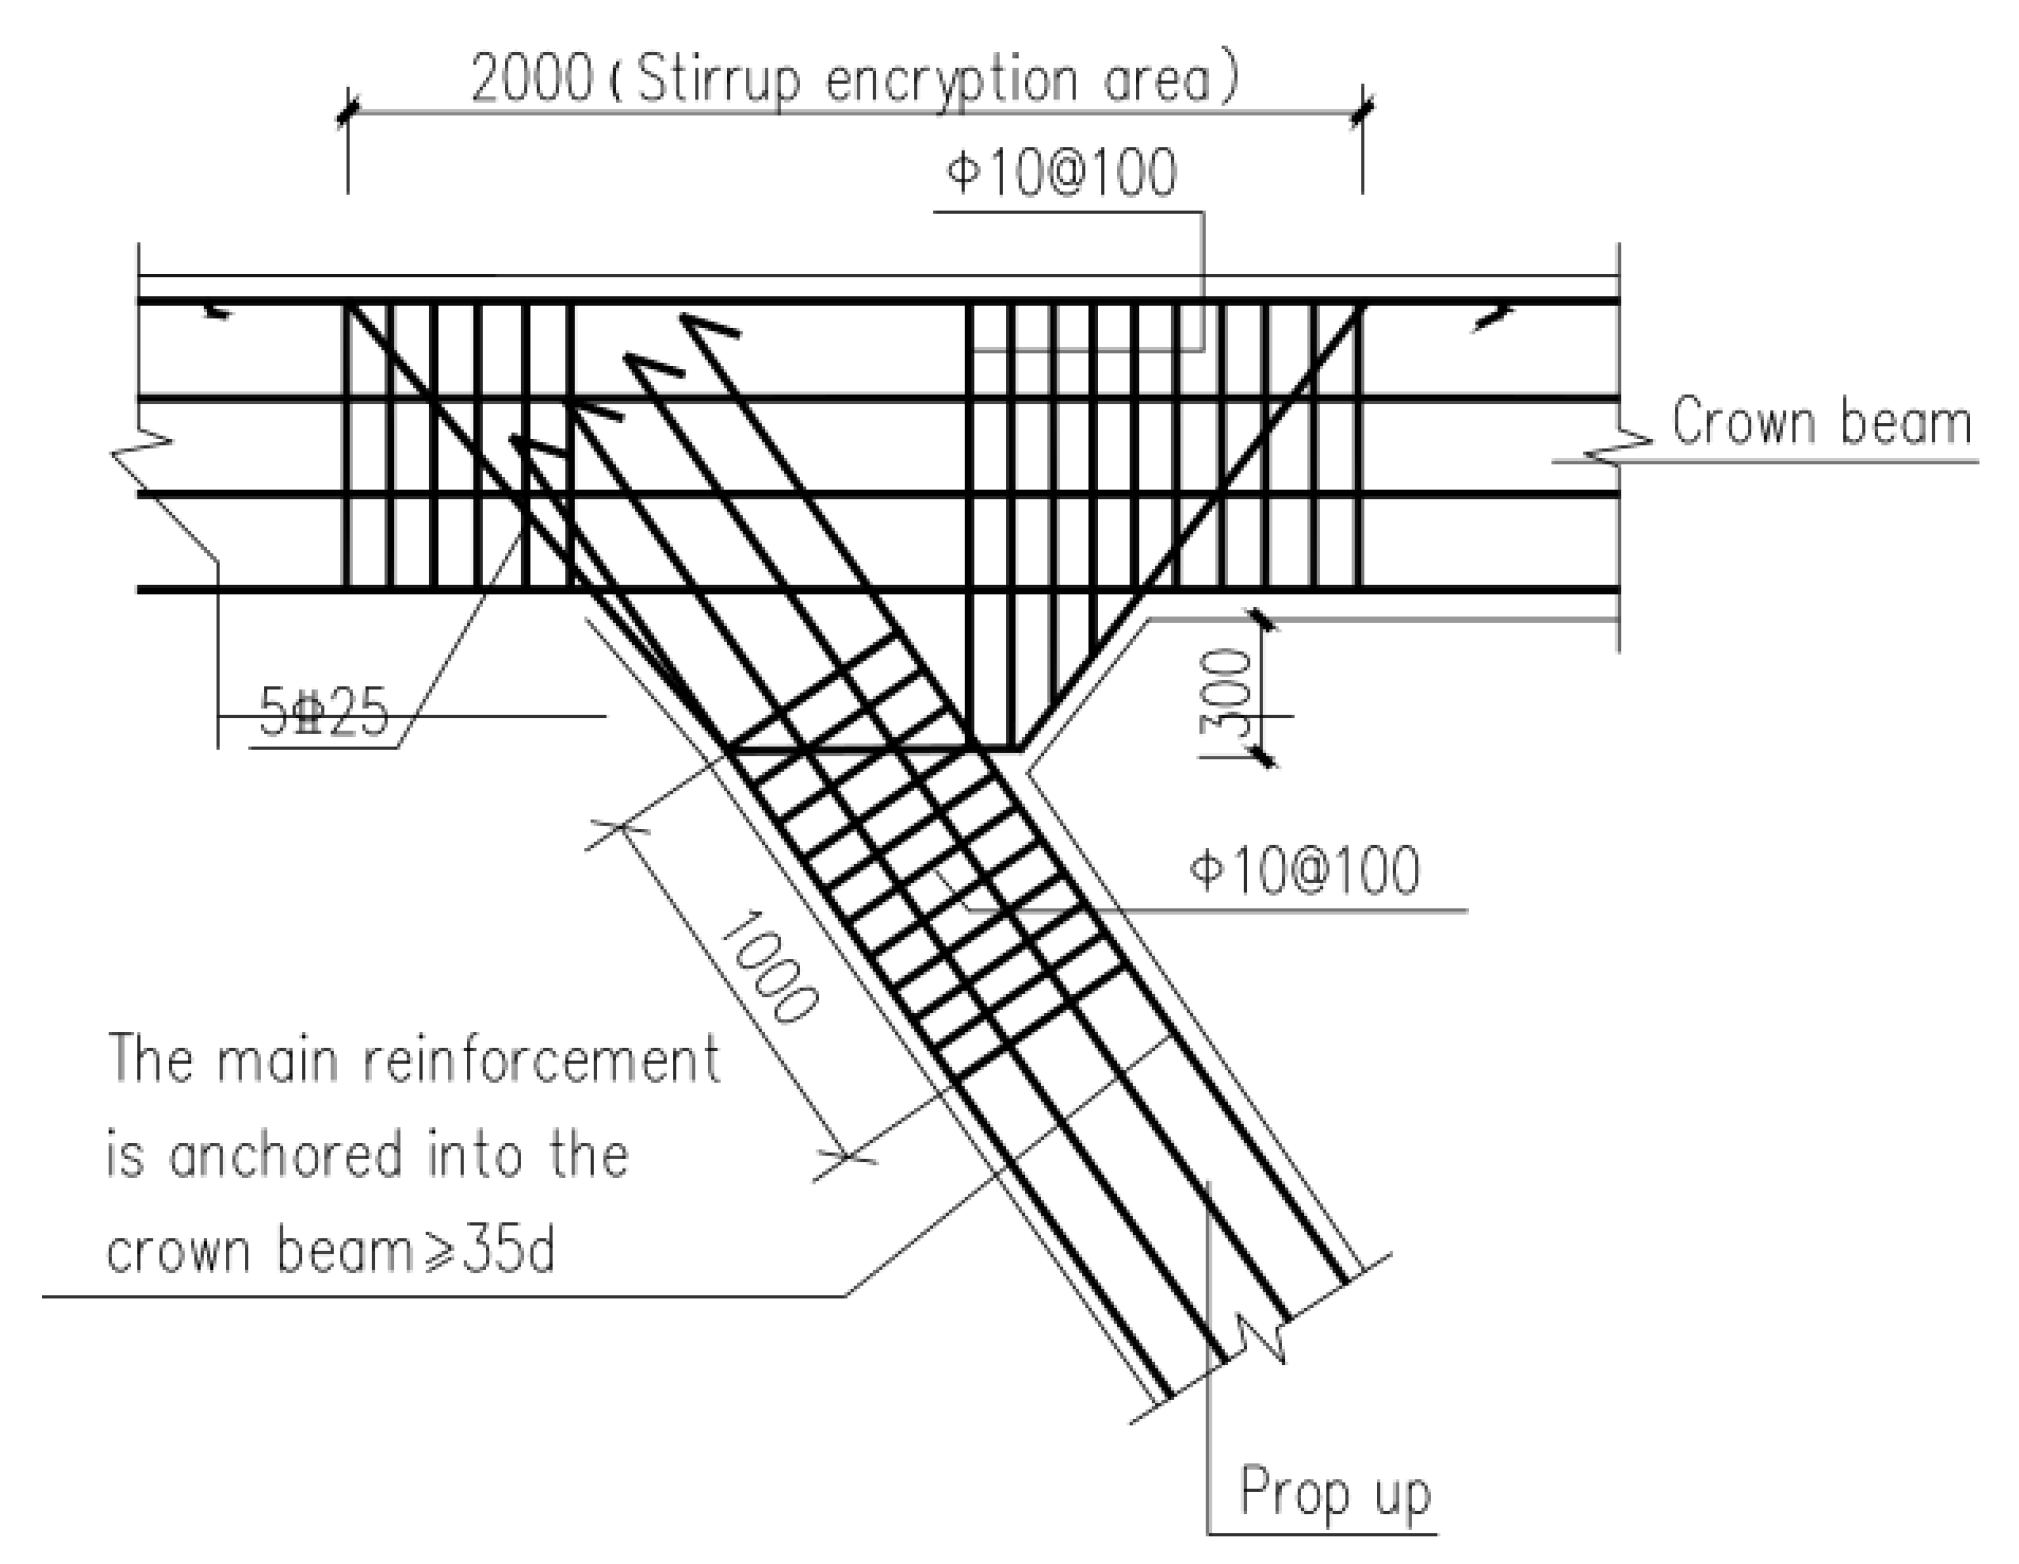
3.4. Crown Beam, Angle Brace
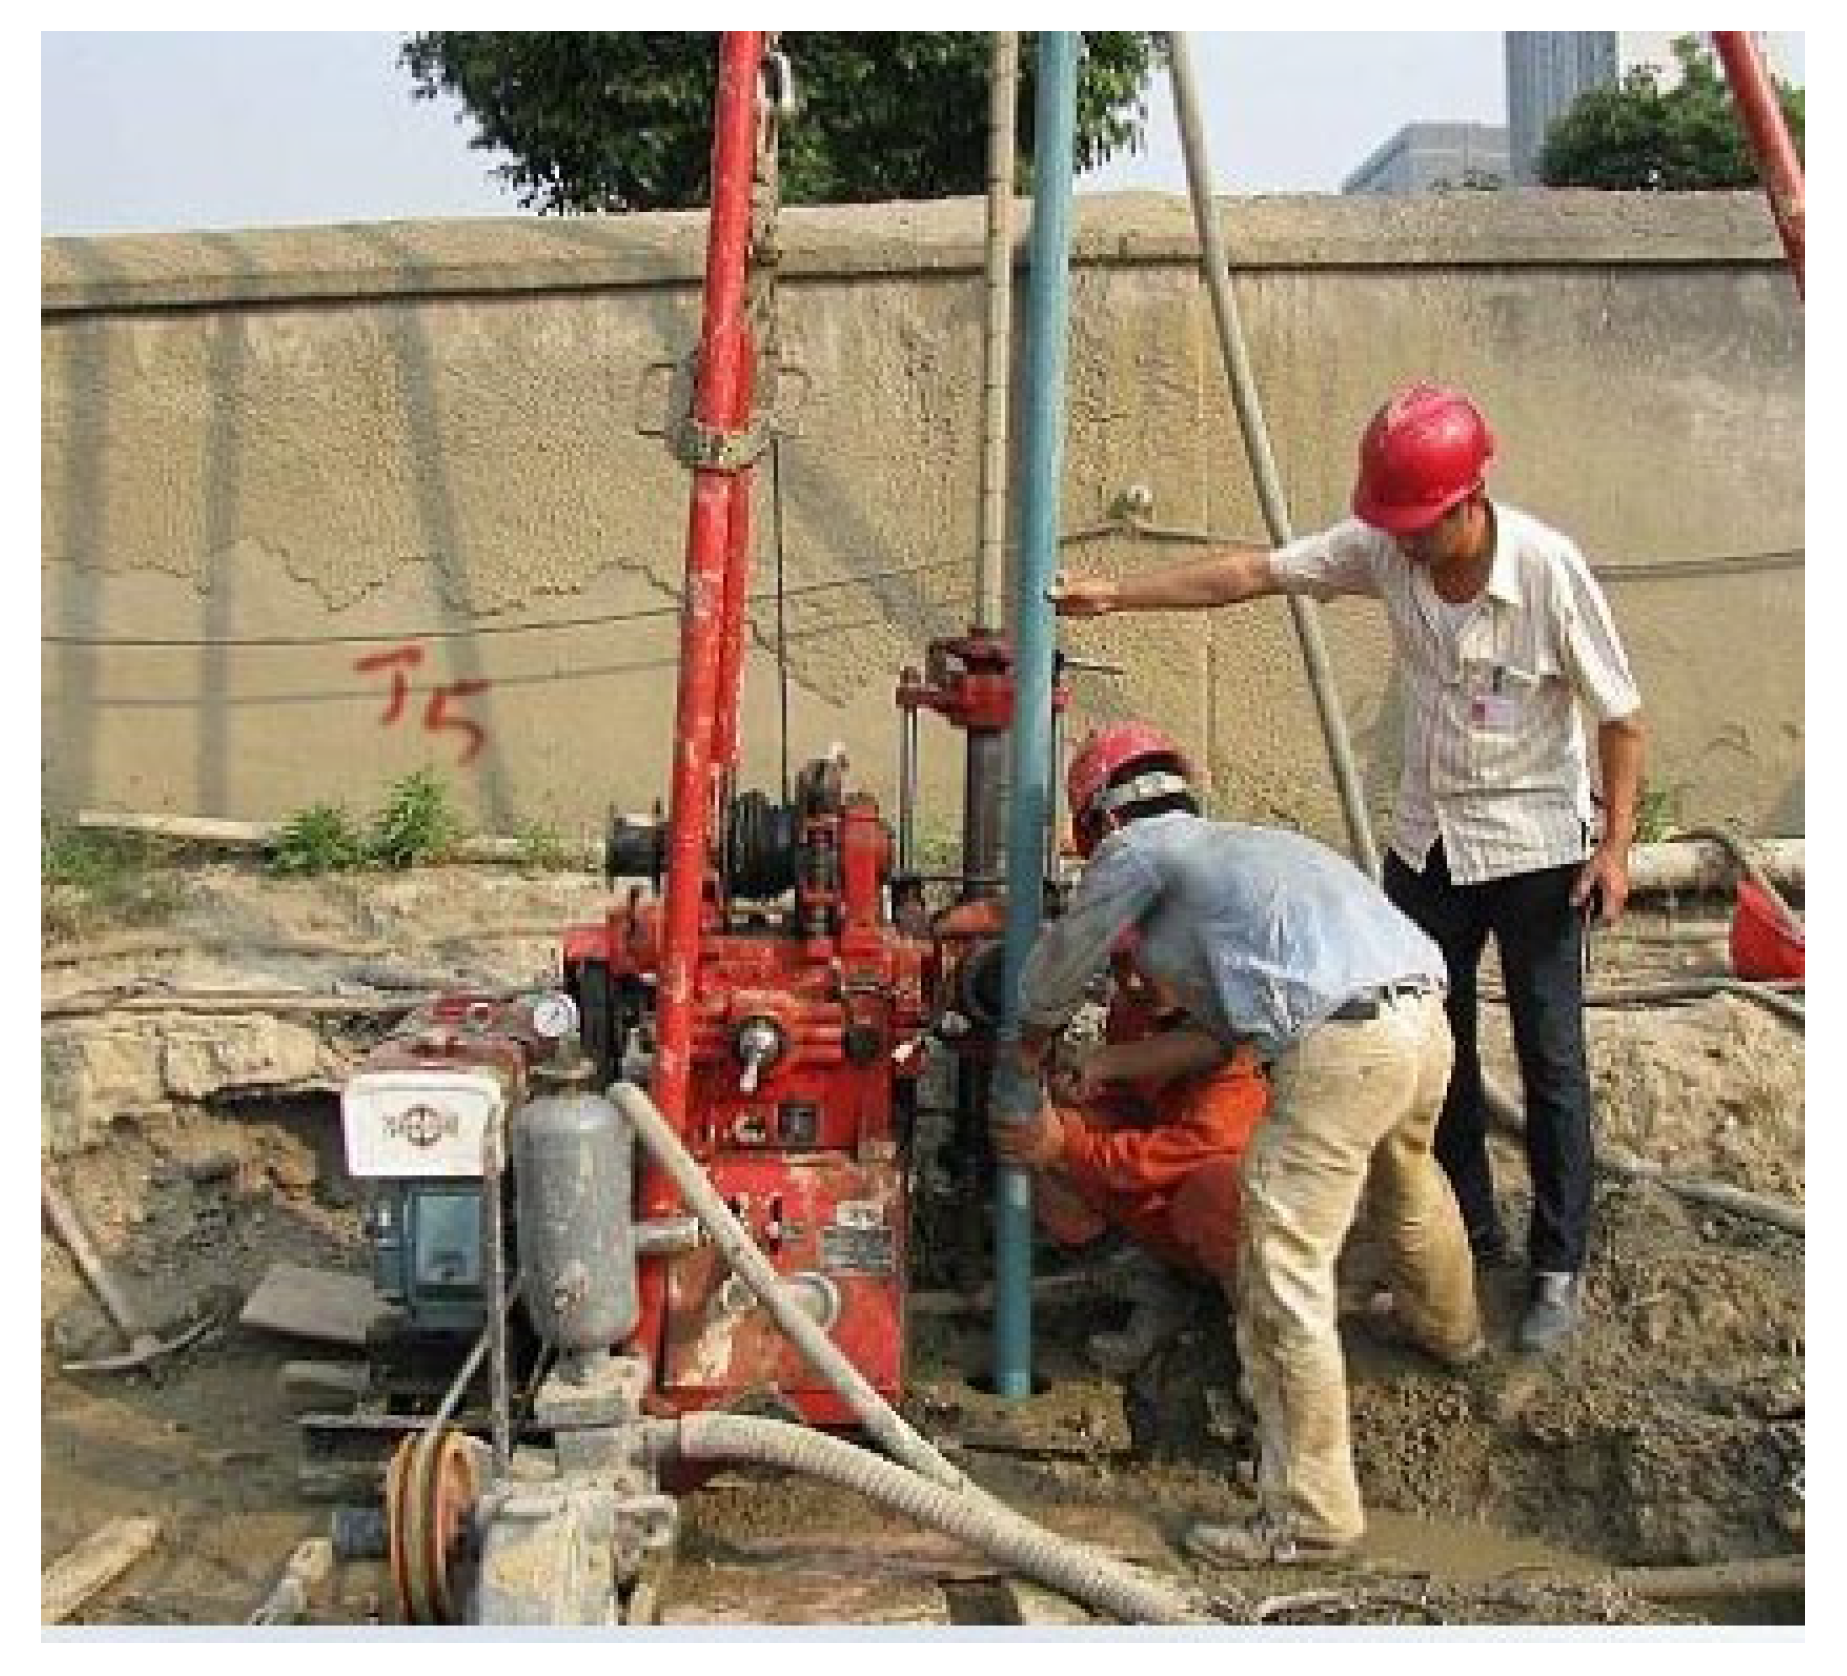
3.5. Foundation Pit Precipitation
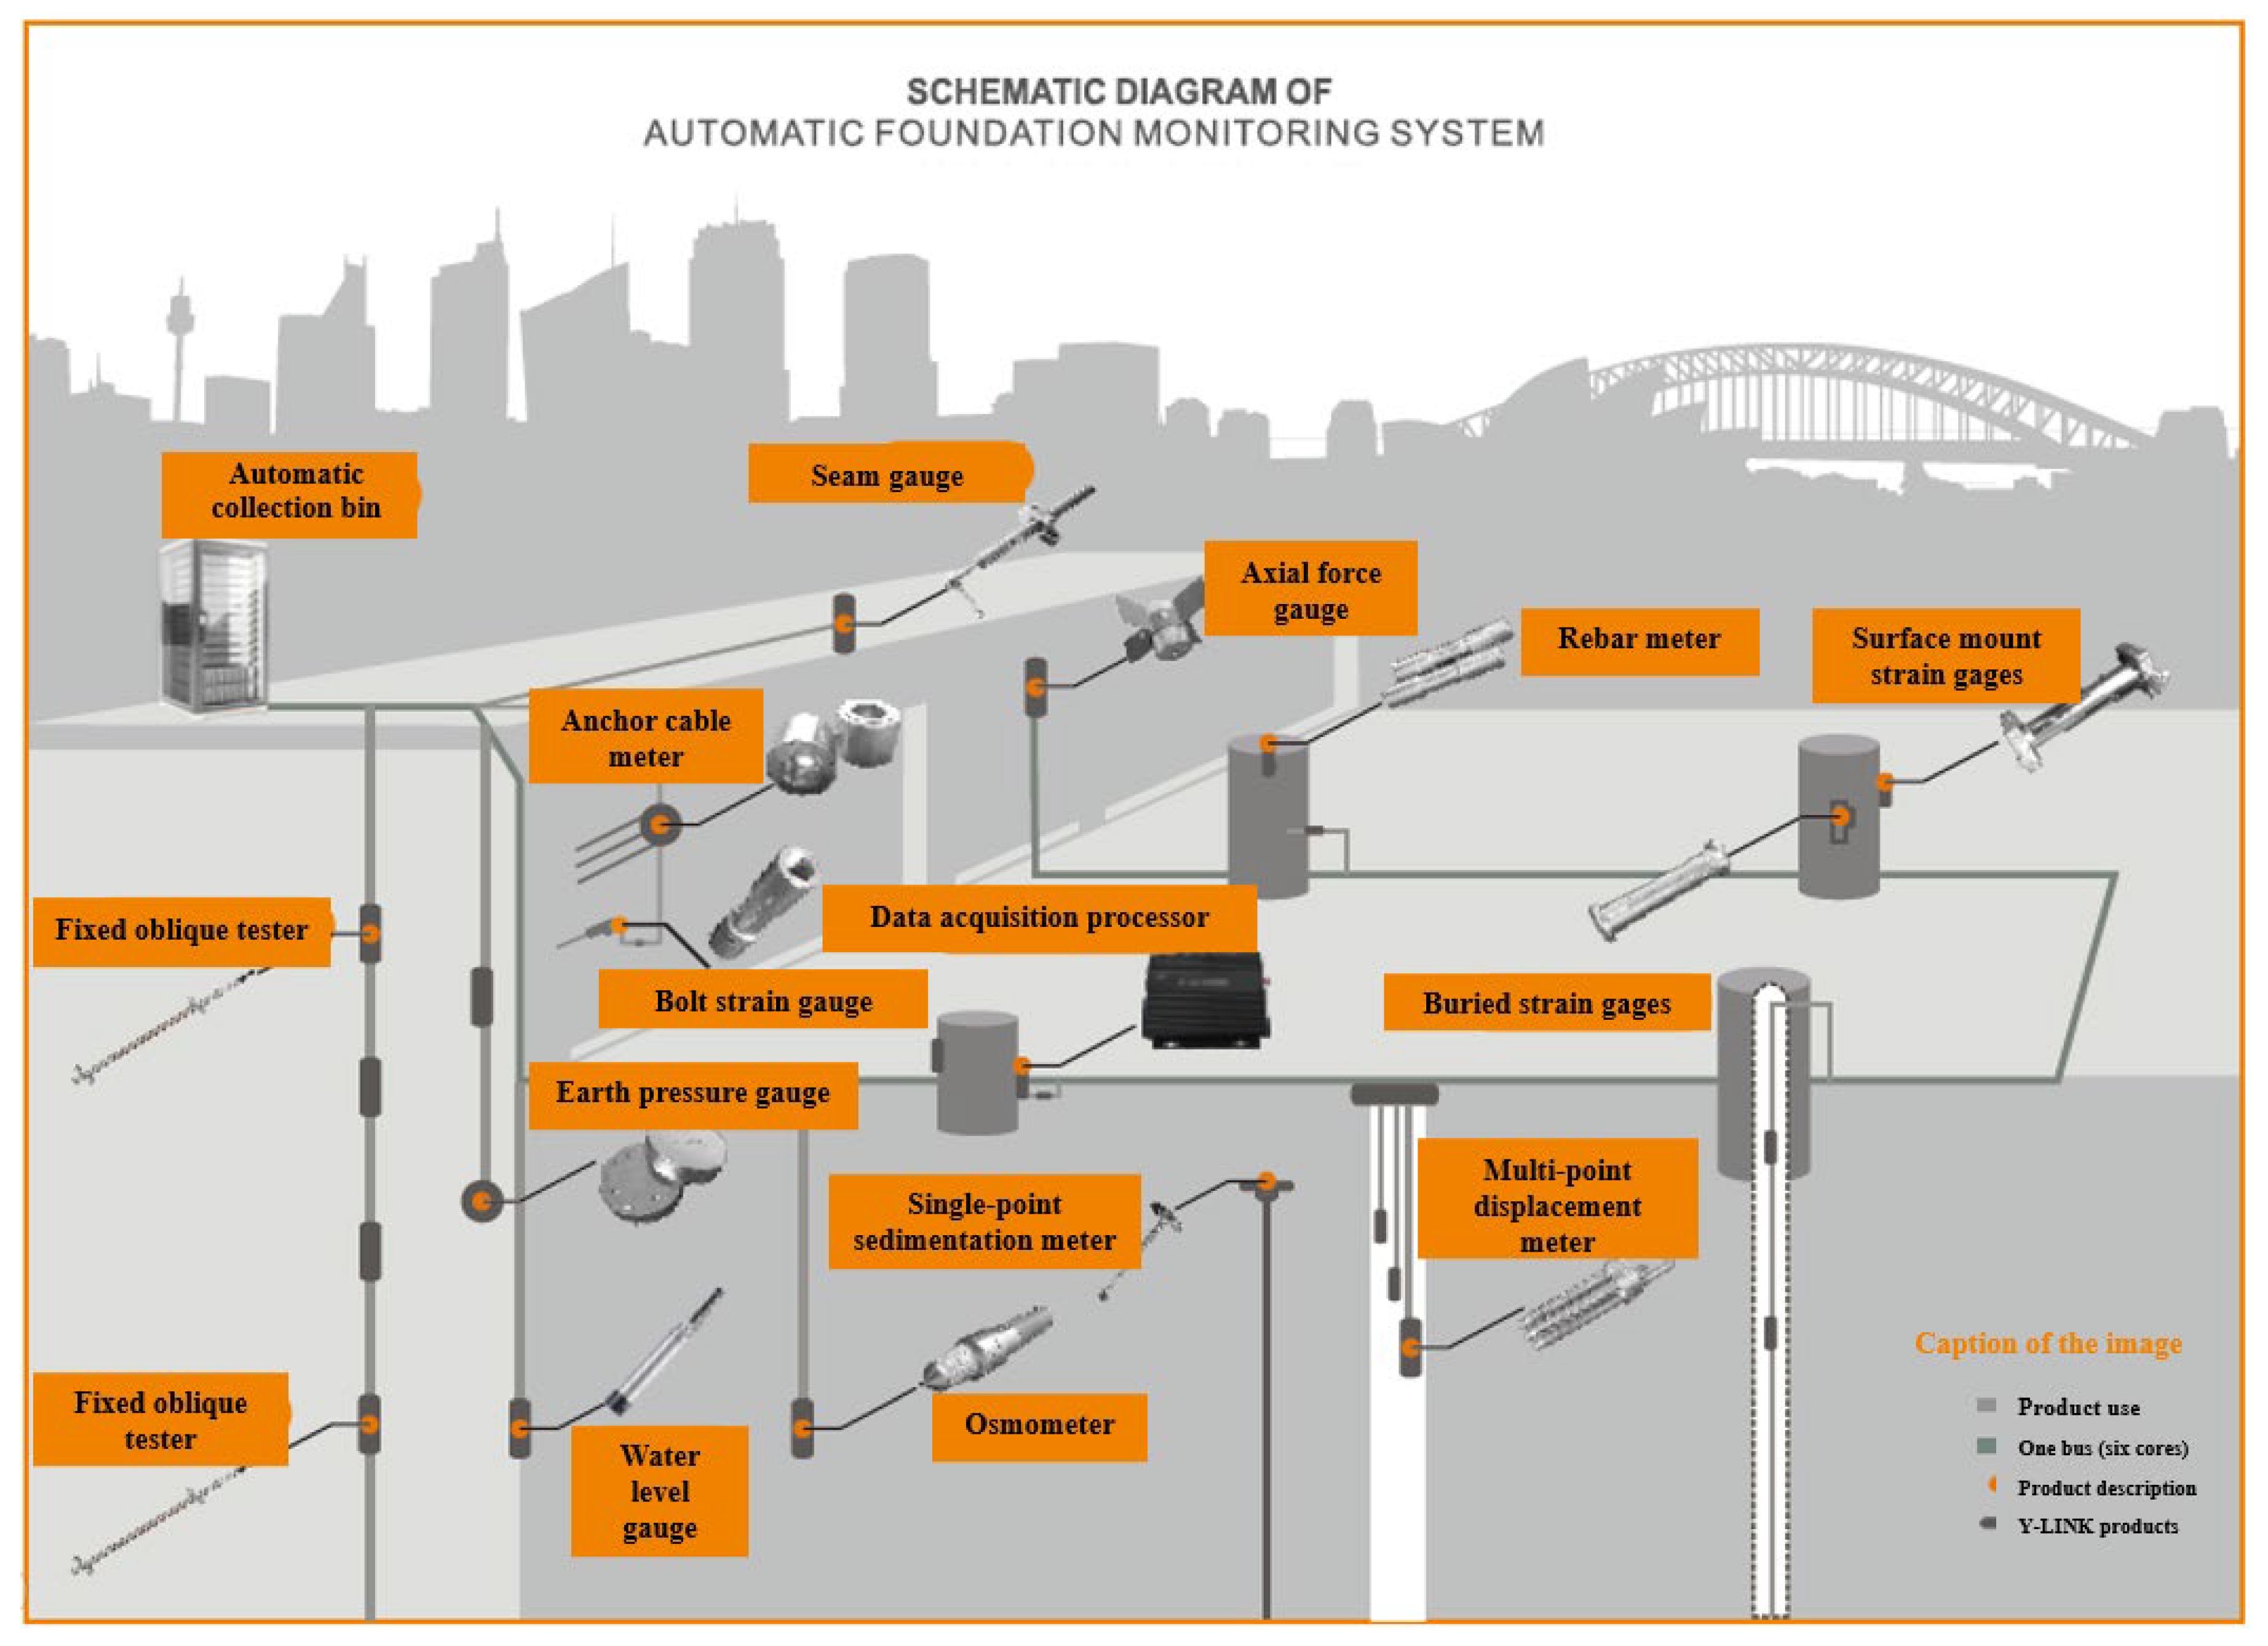
4. On-Site Monitoring and Data Analysis
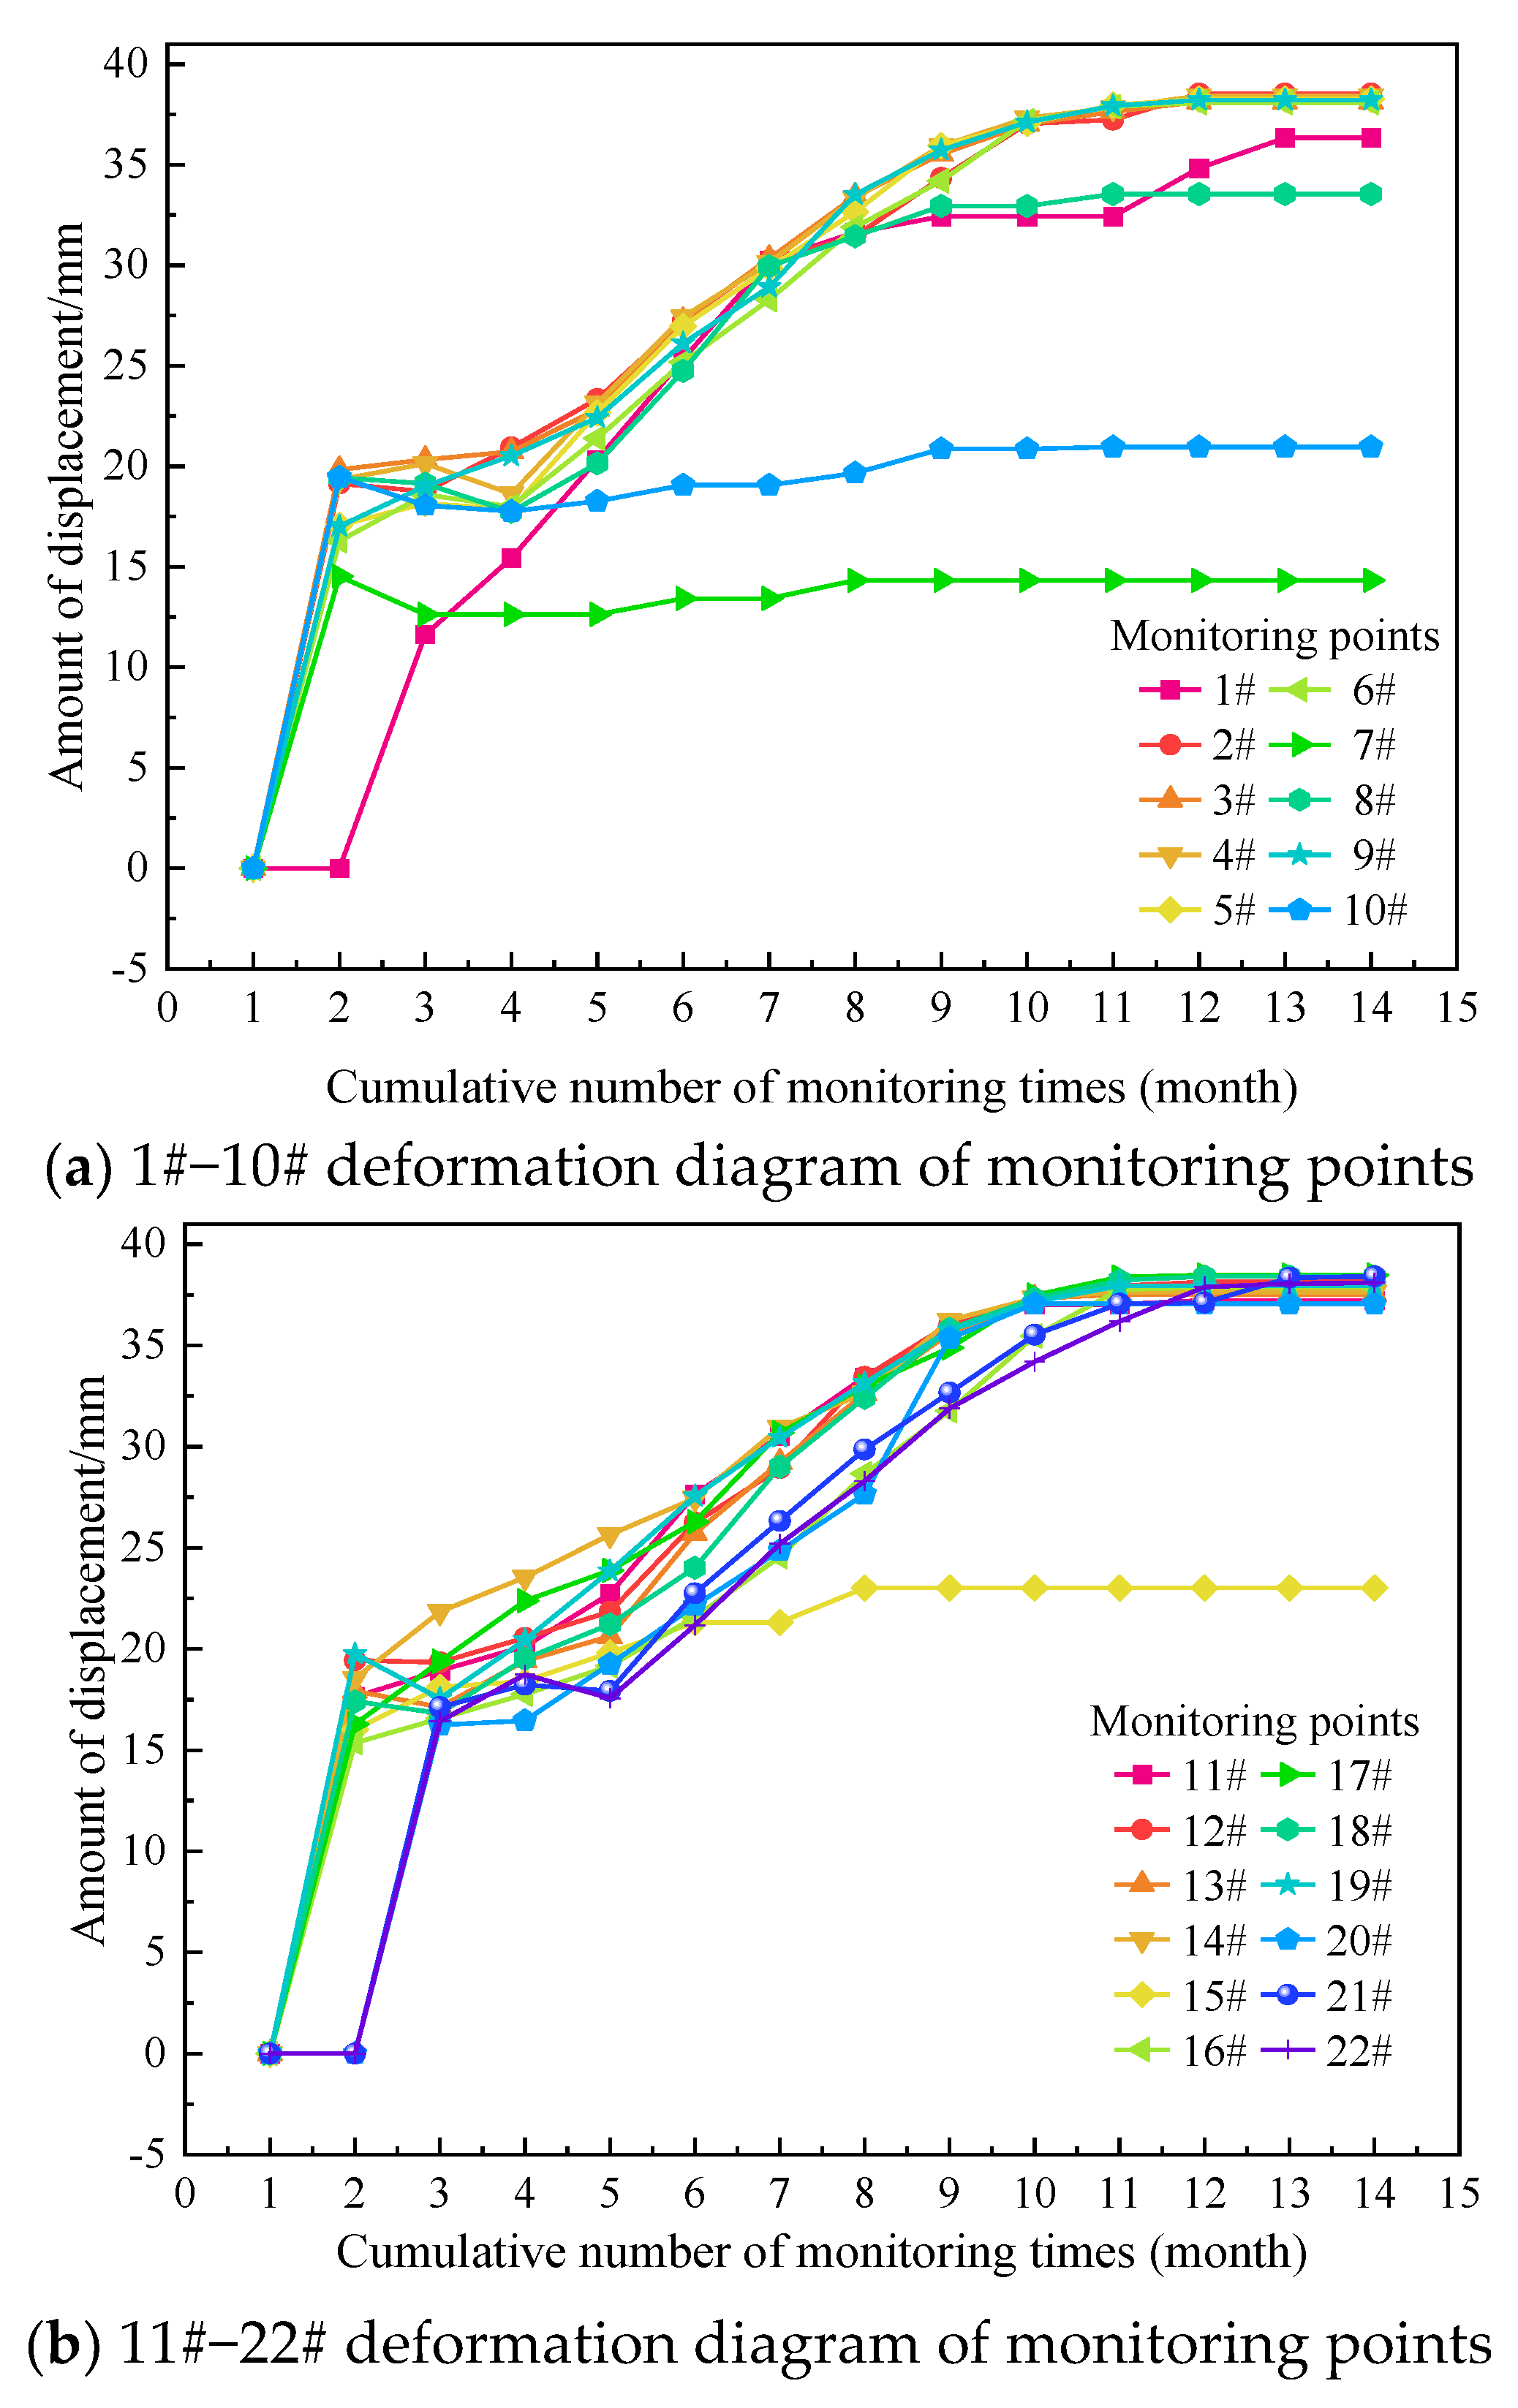
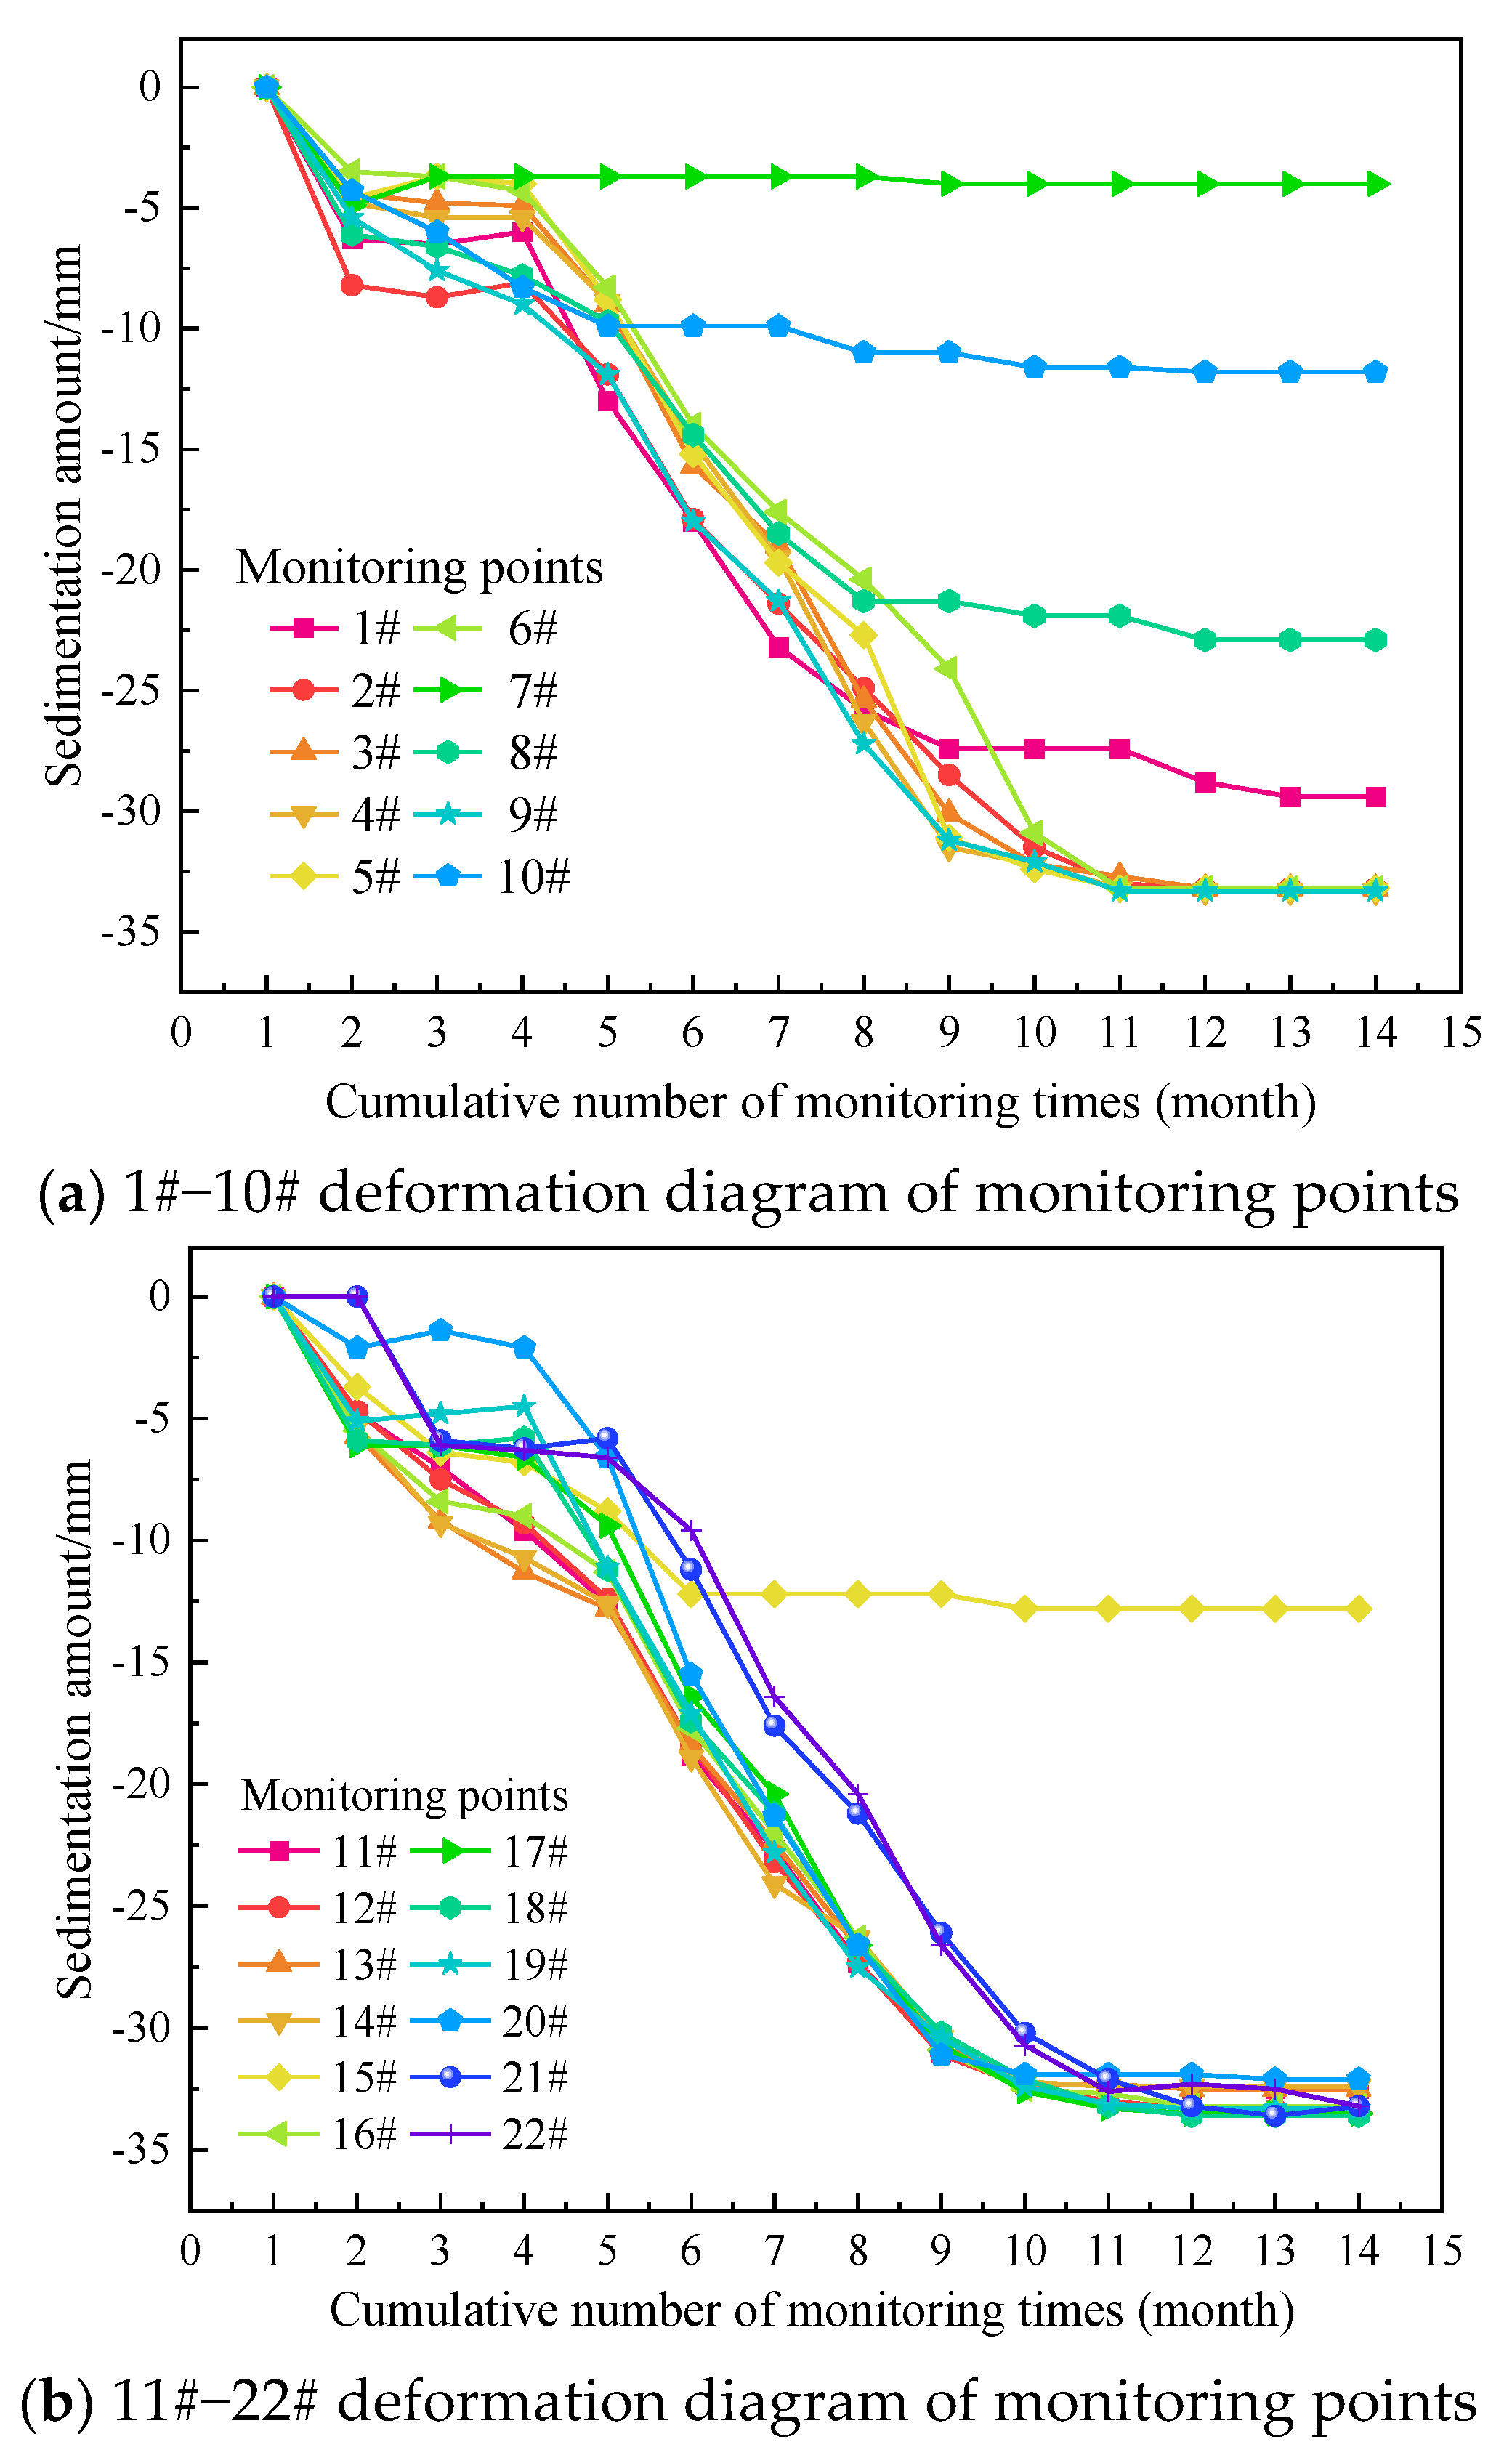
4.1. Settlement and Horizontal Displacement Monitoring of Supporting Structures
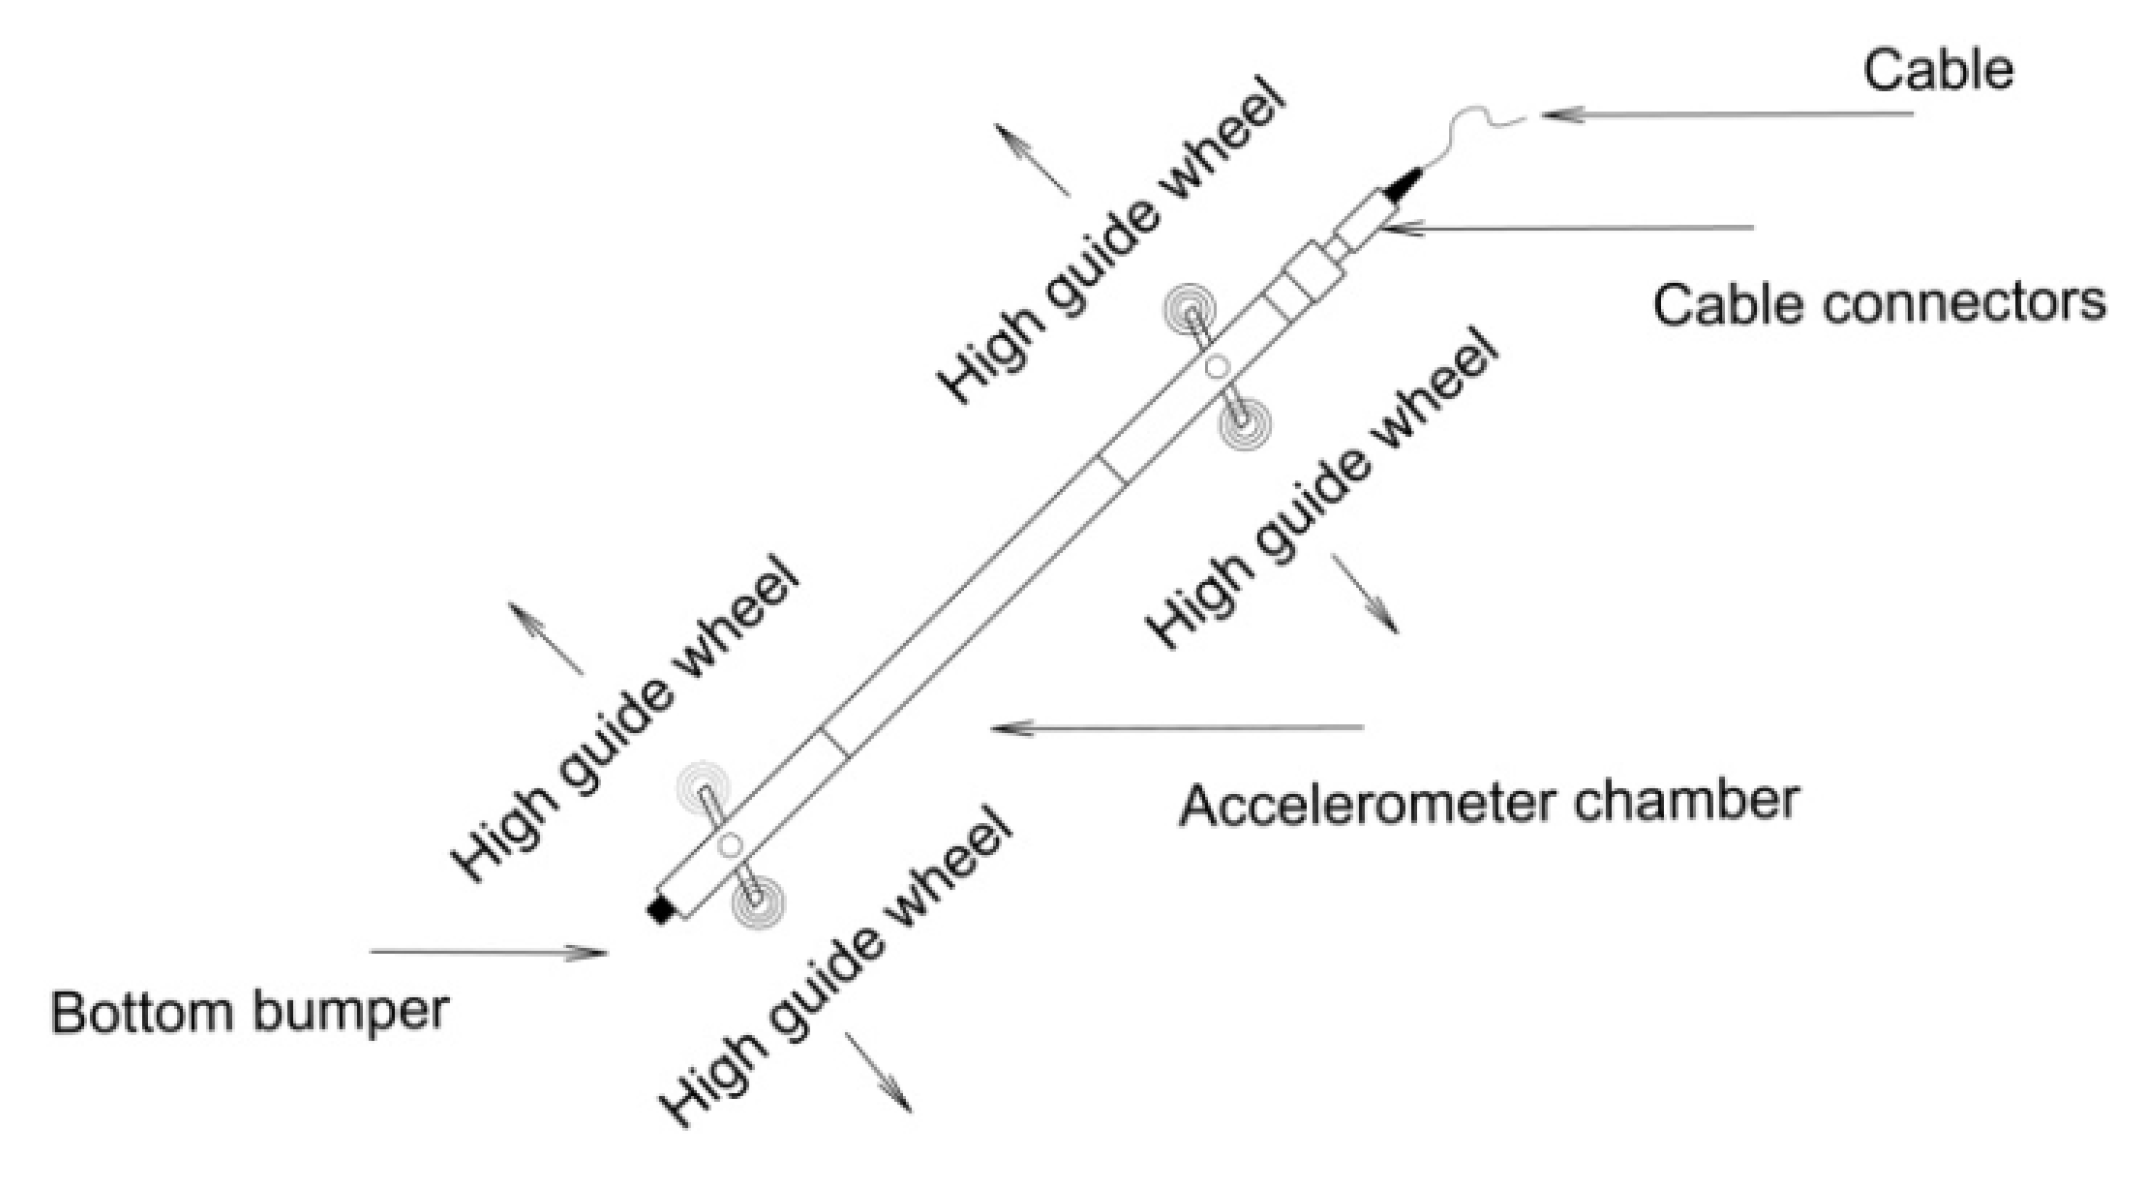
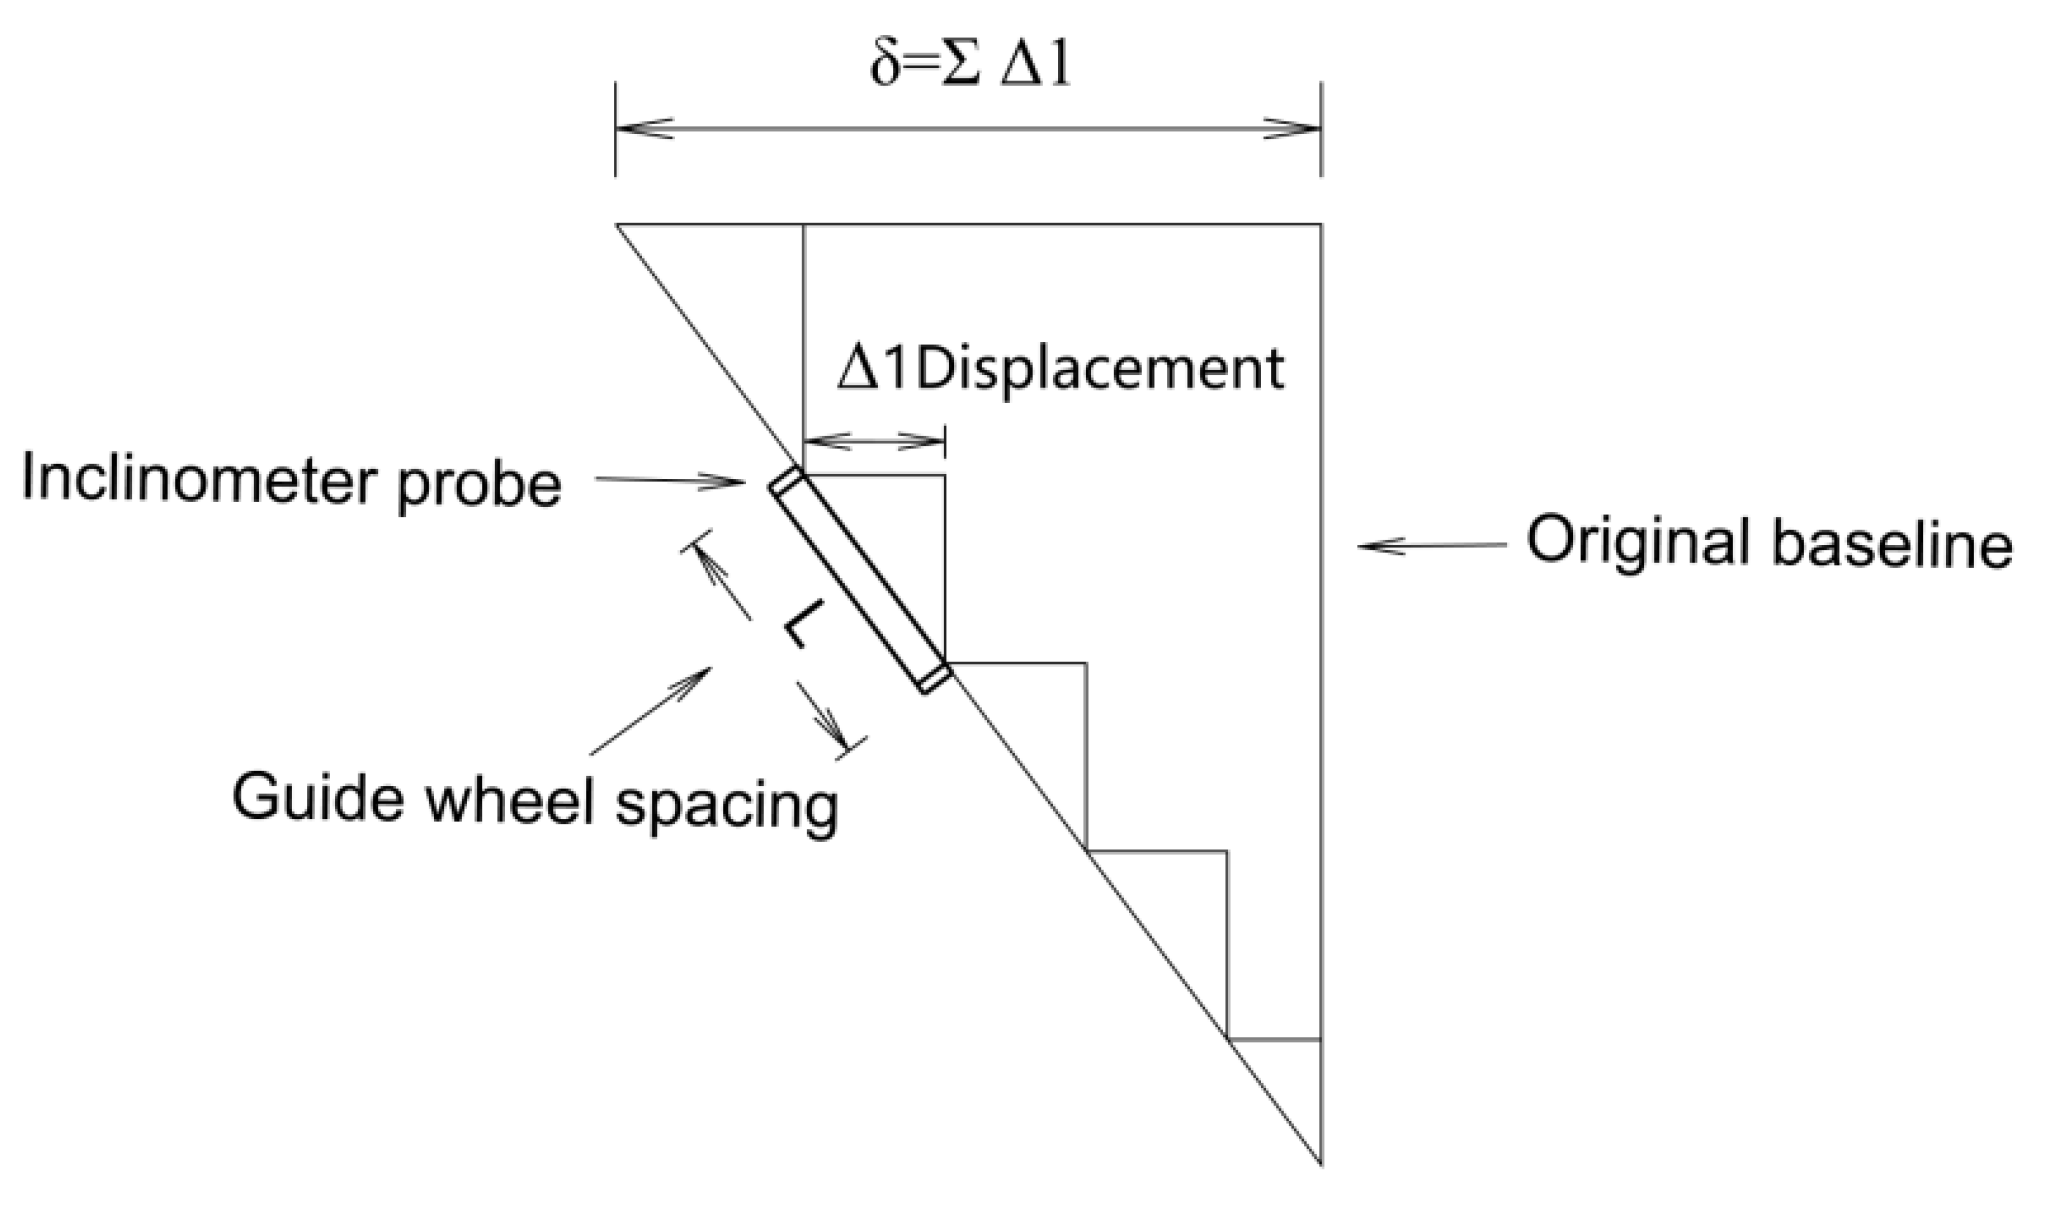
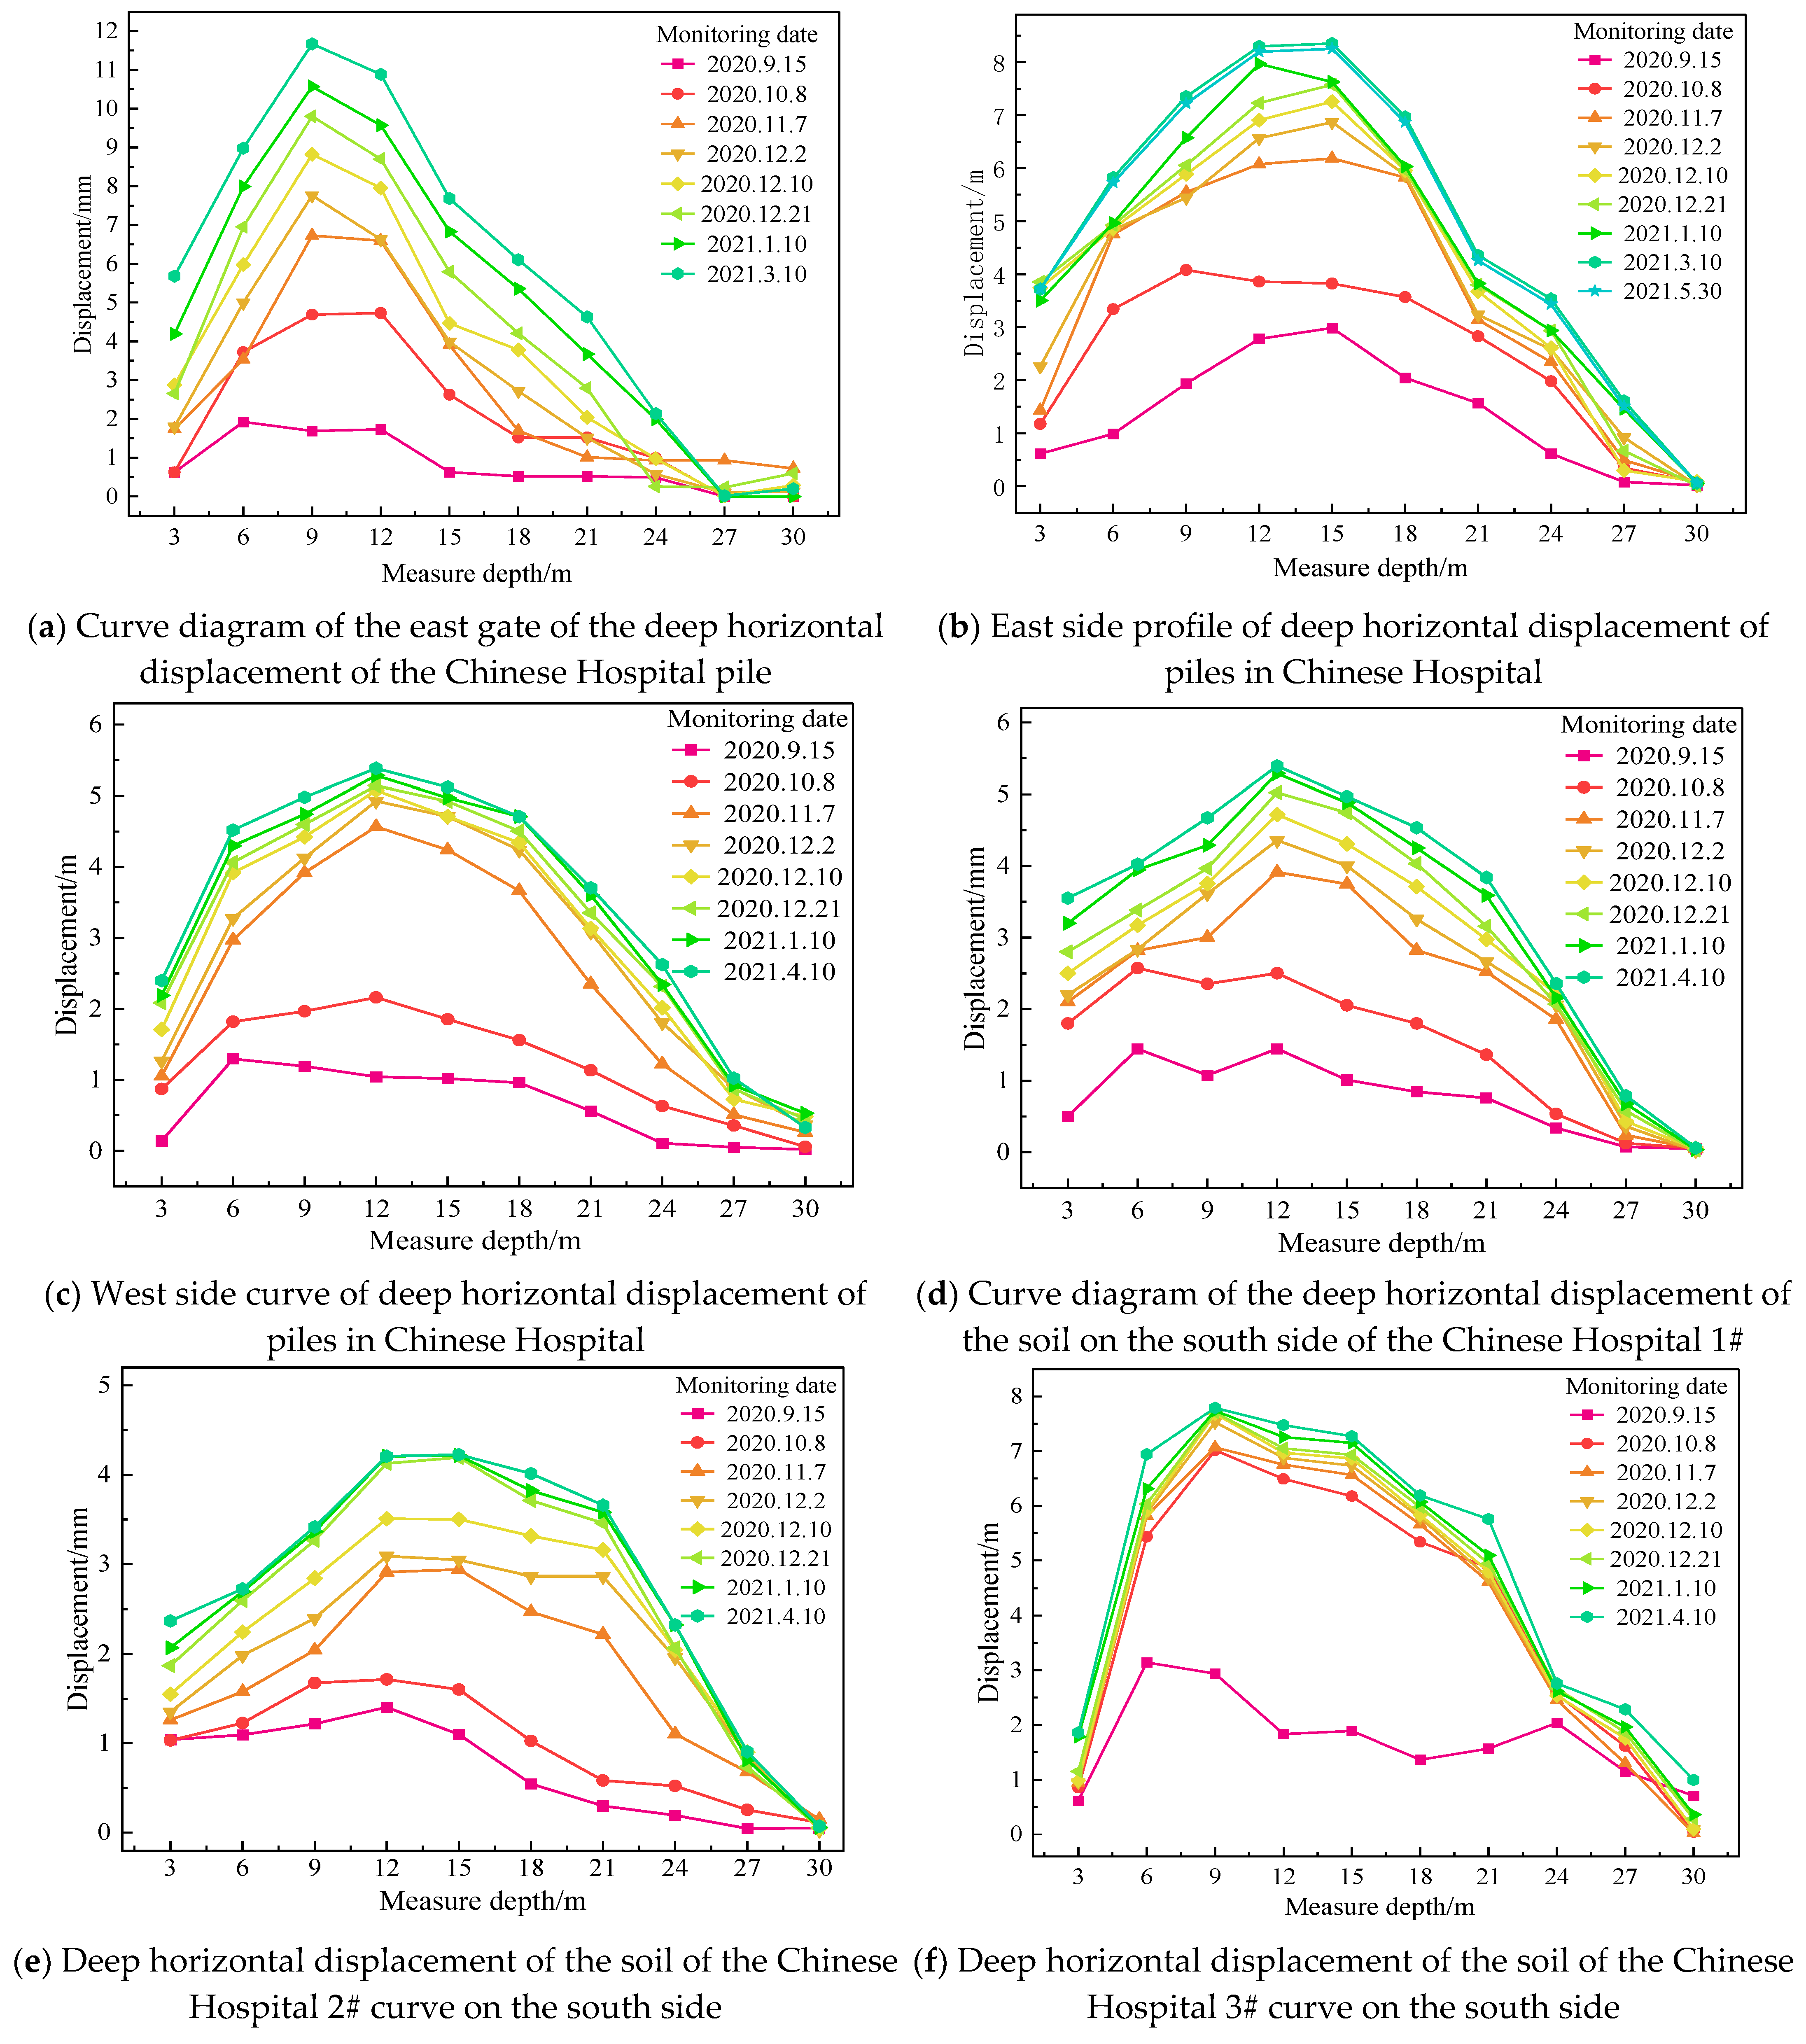
4.2. Horizontal Displacement of the Soil of the Foundation Pit
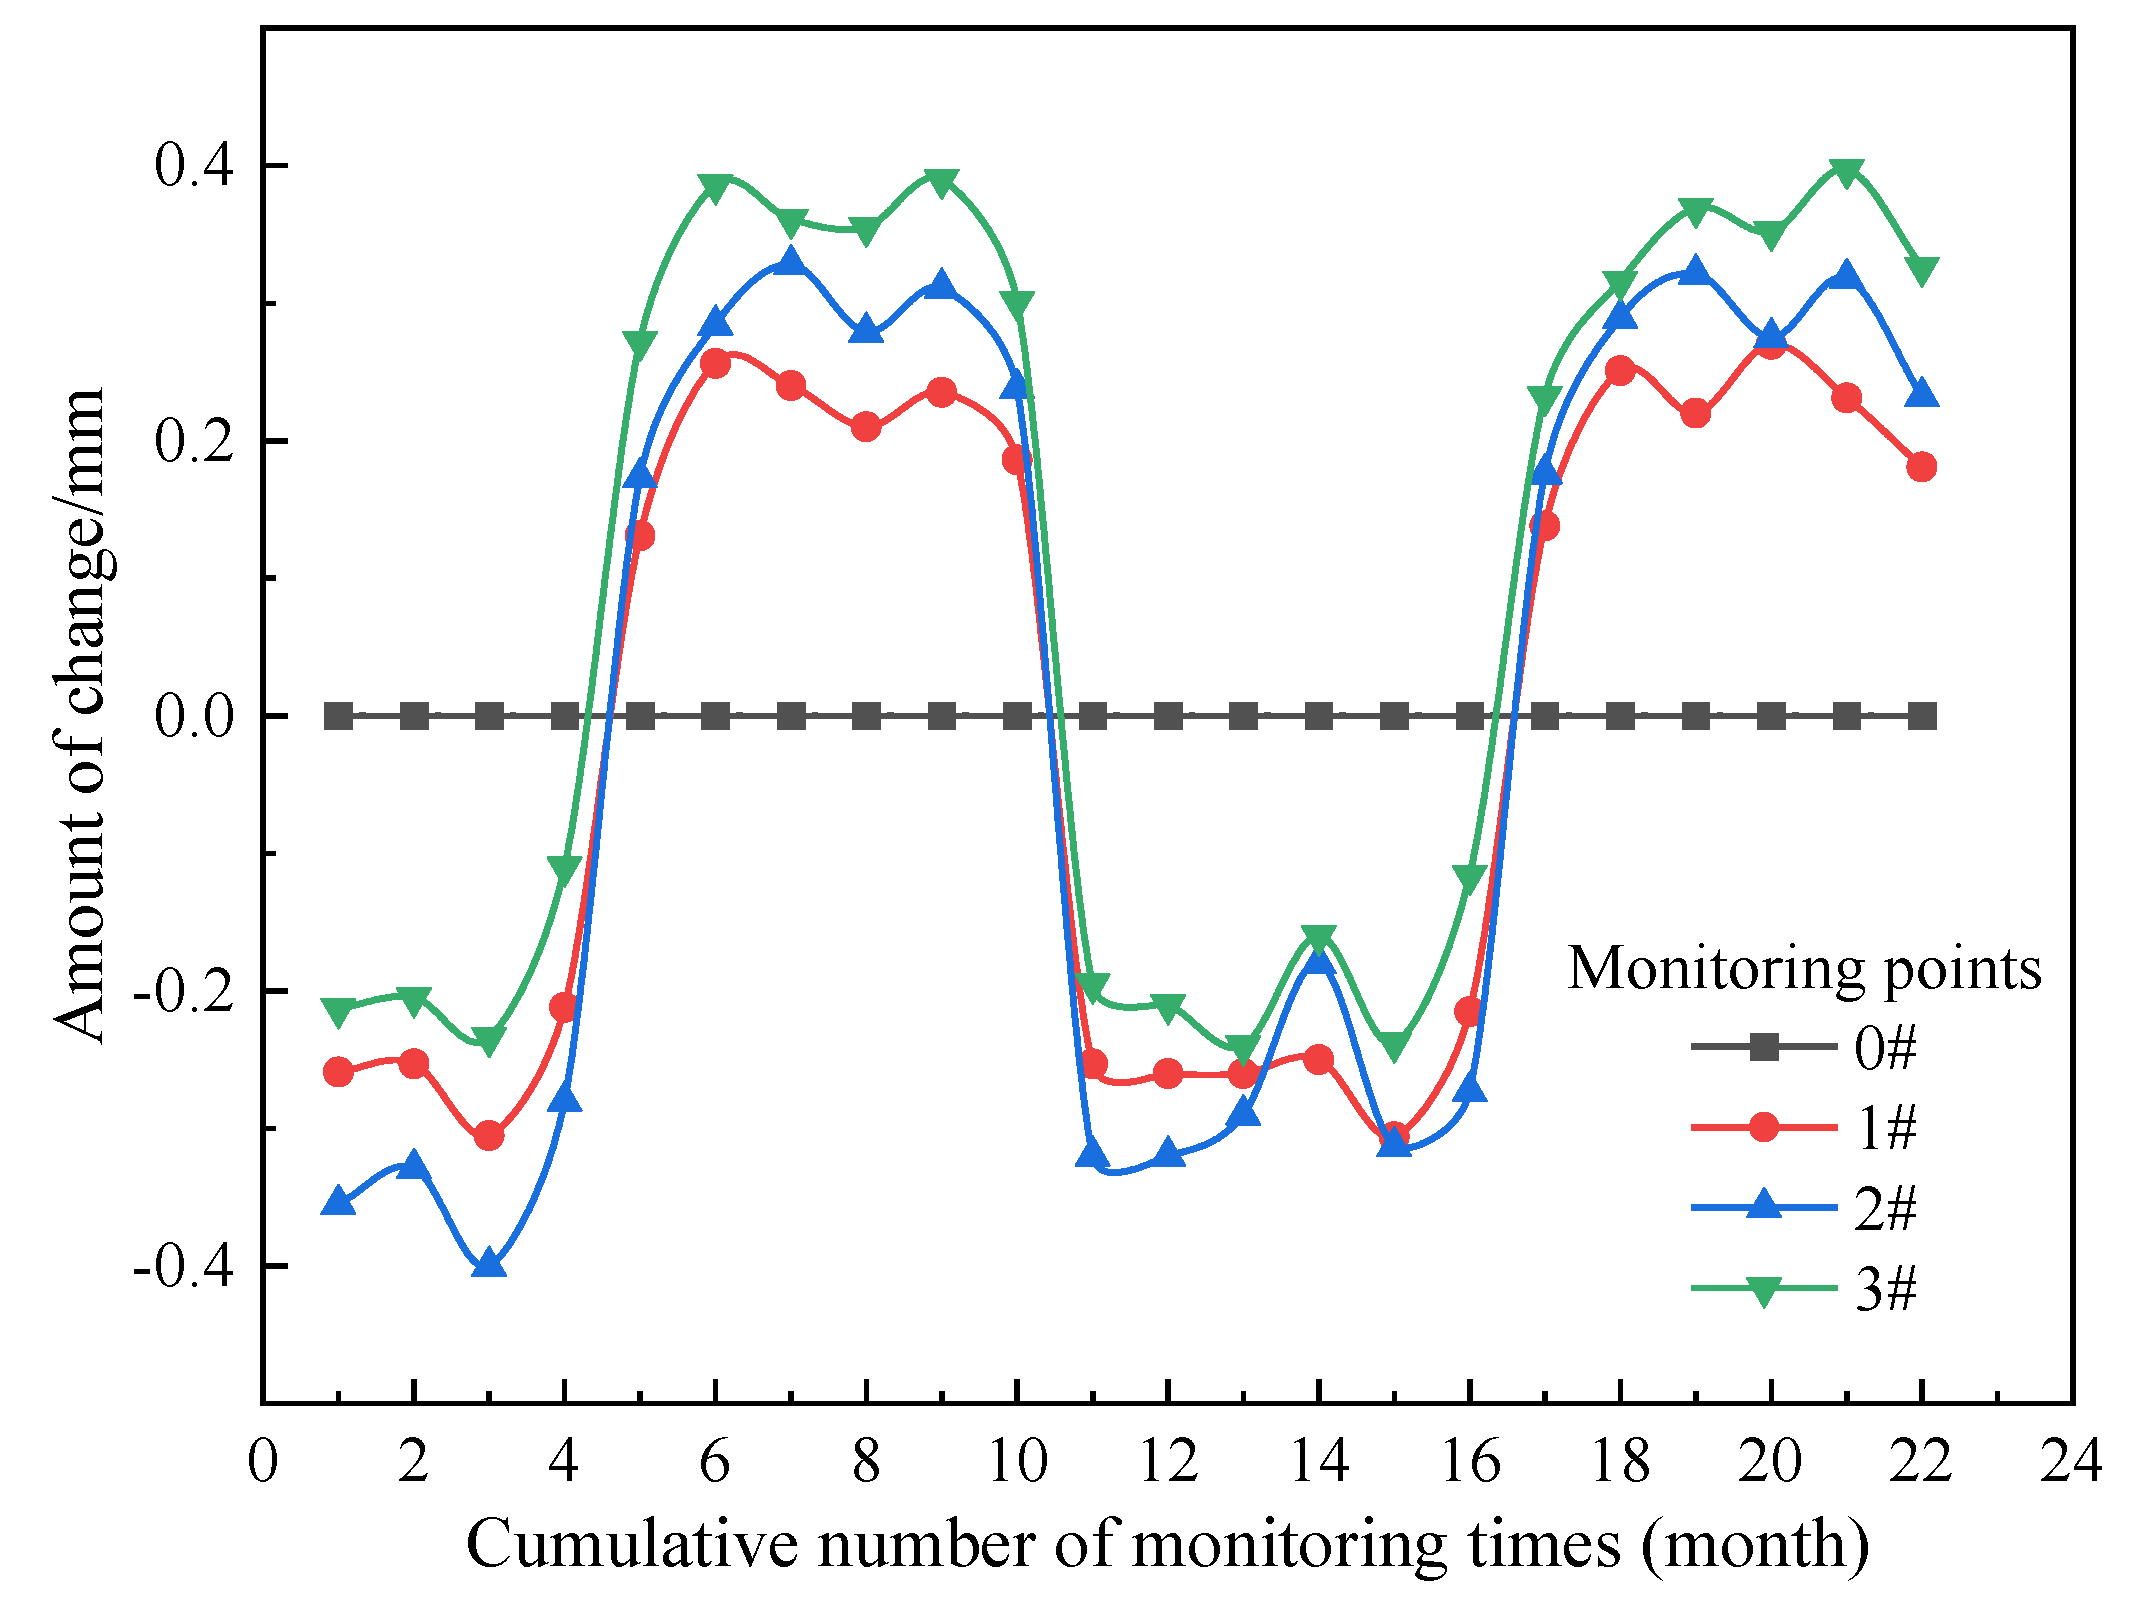
4.3. Vertical Displacement Monitoring of the Static Level
4.4. Perimeter Pipeline Monitoring
4.5. Internal Force Monitoring of Anchor Cables
4.6. Water Level Monitoring
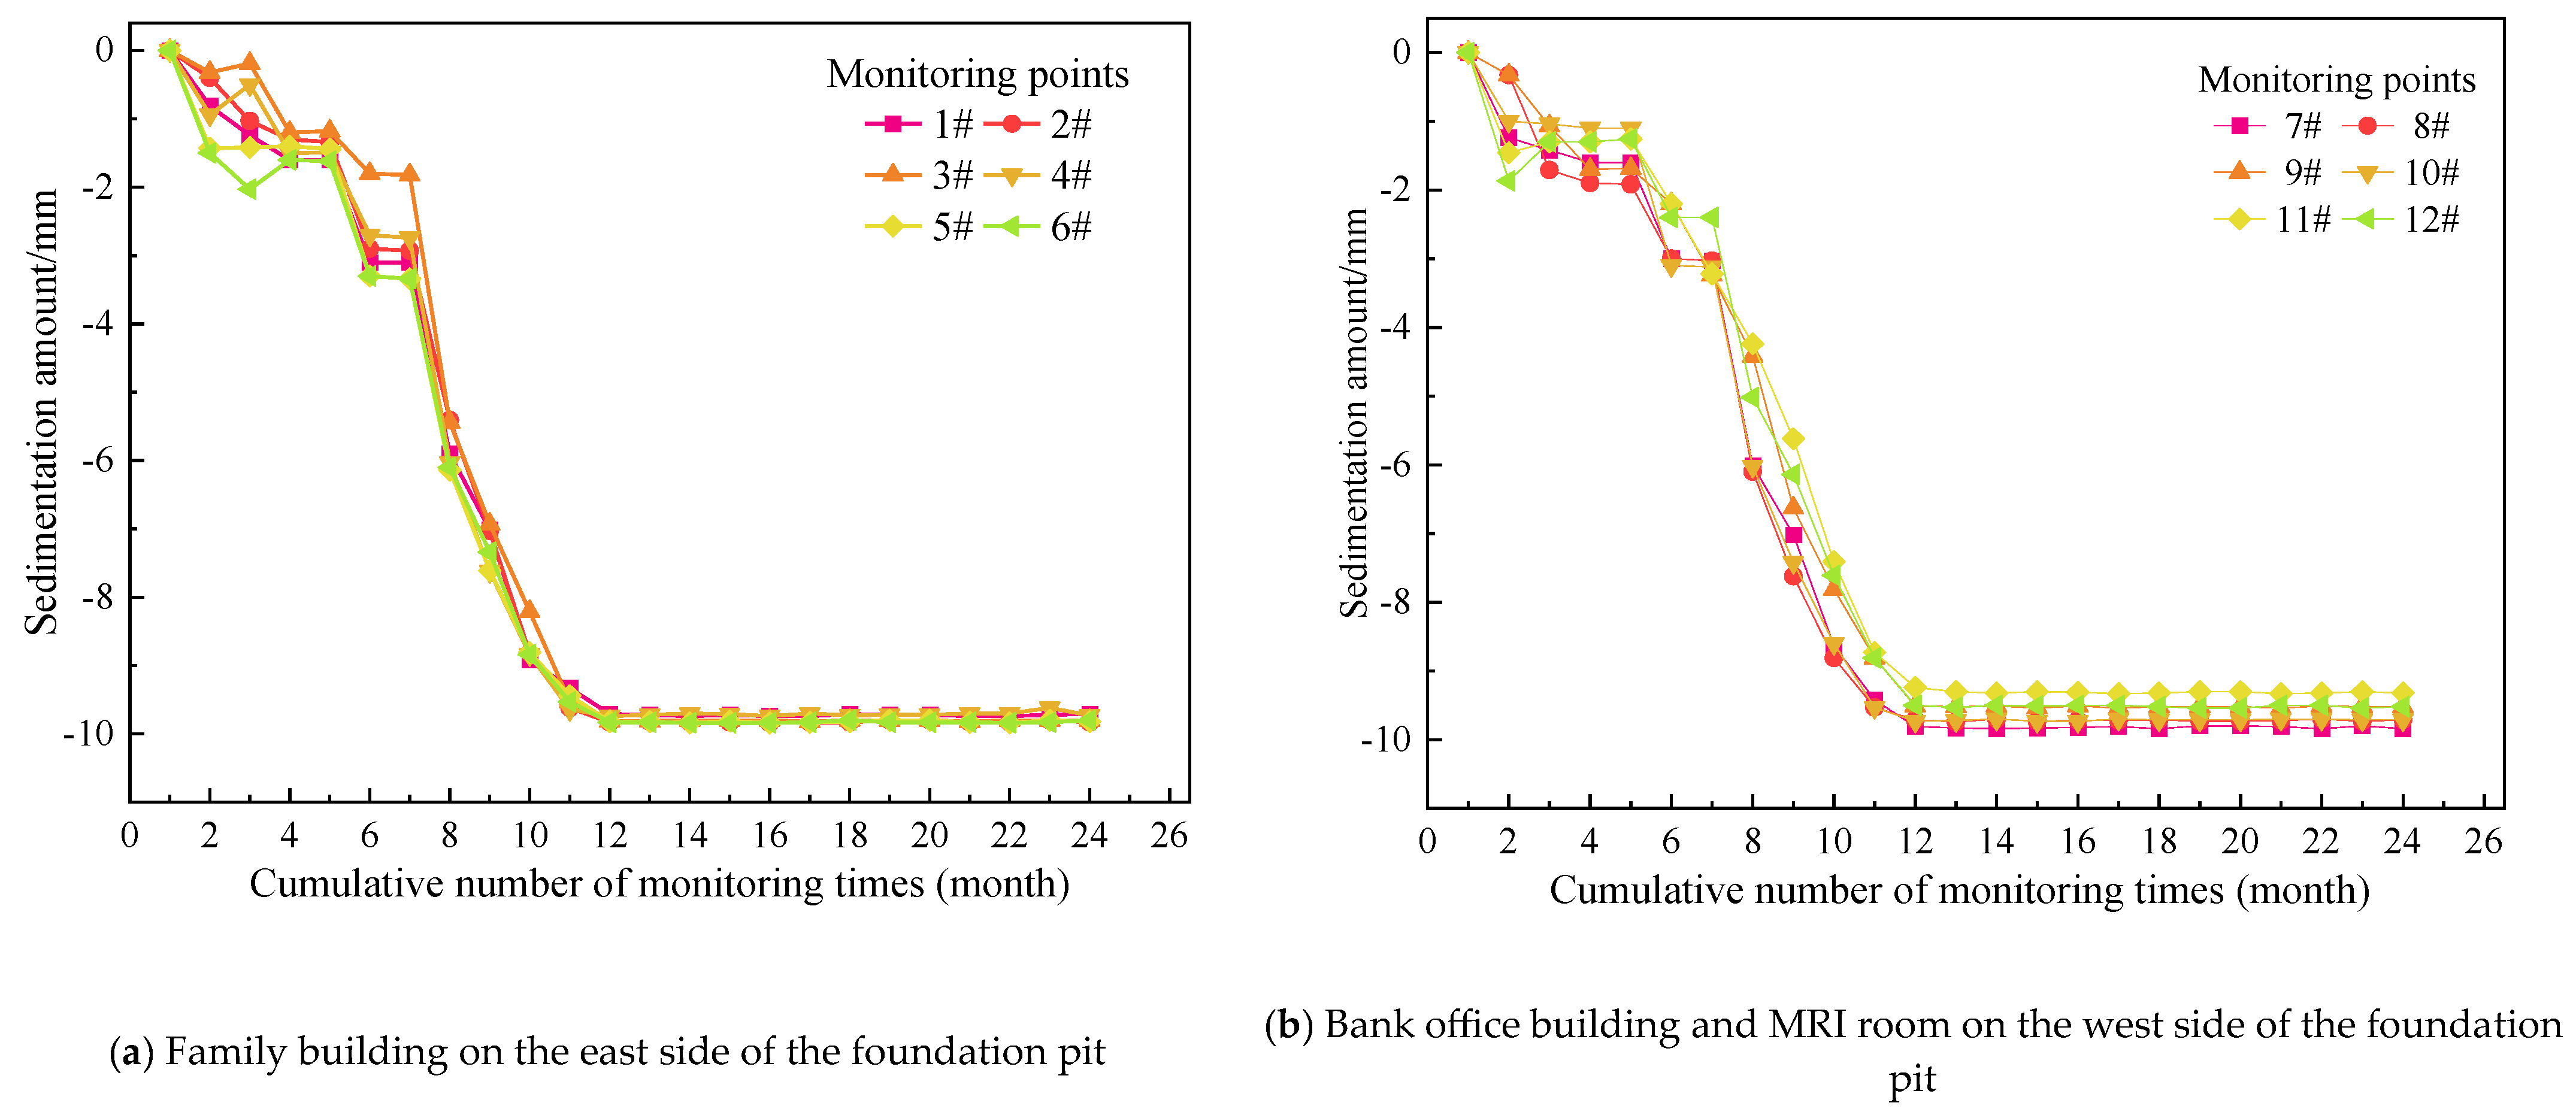
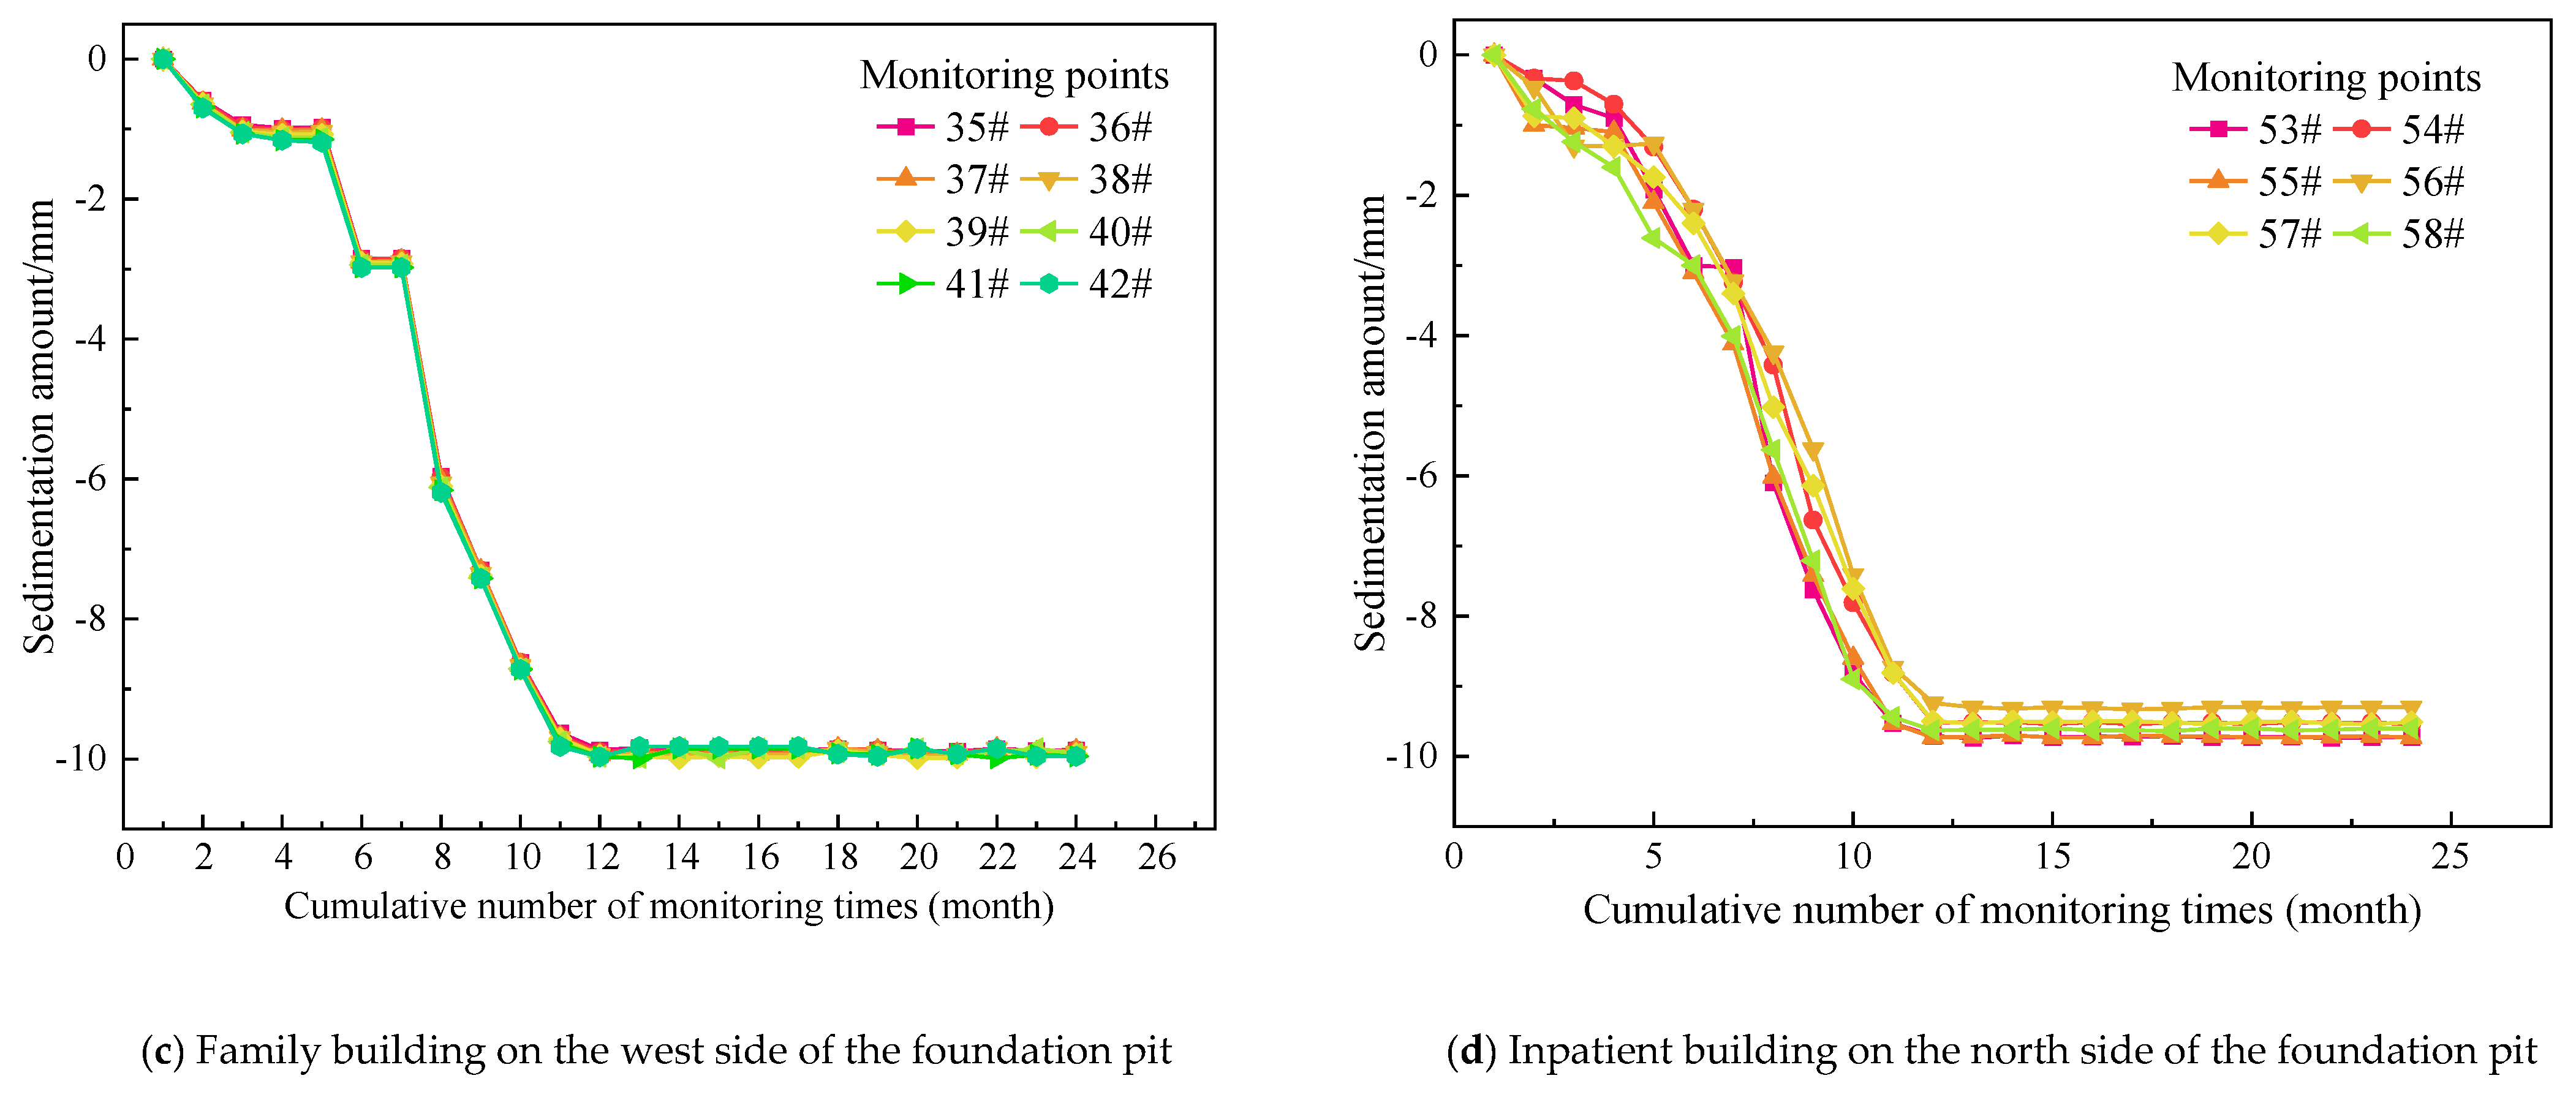
4.7. Vertical Displacement of Surrounding Buildings
5. Conclusions
- (1)
- Although the vertical and horizontal displacements of the support structure exceeded the specified warning values, the pit side walls were not continuously deformed and the surrounding cracks were not continuously developed through the later encrypted monitoring and on-site inspection by the site personnel, and the pit could be safely carried out. Therefore, it is suggested that the construction process of the foundation pit needs to focus on monitoring the displacement of the supporting structure to ensure the safety of the foundation pit.
- (2)
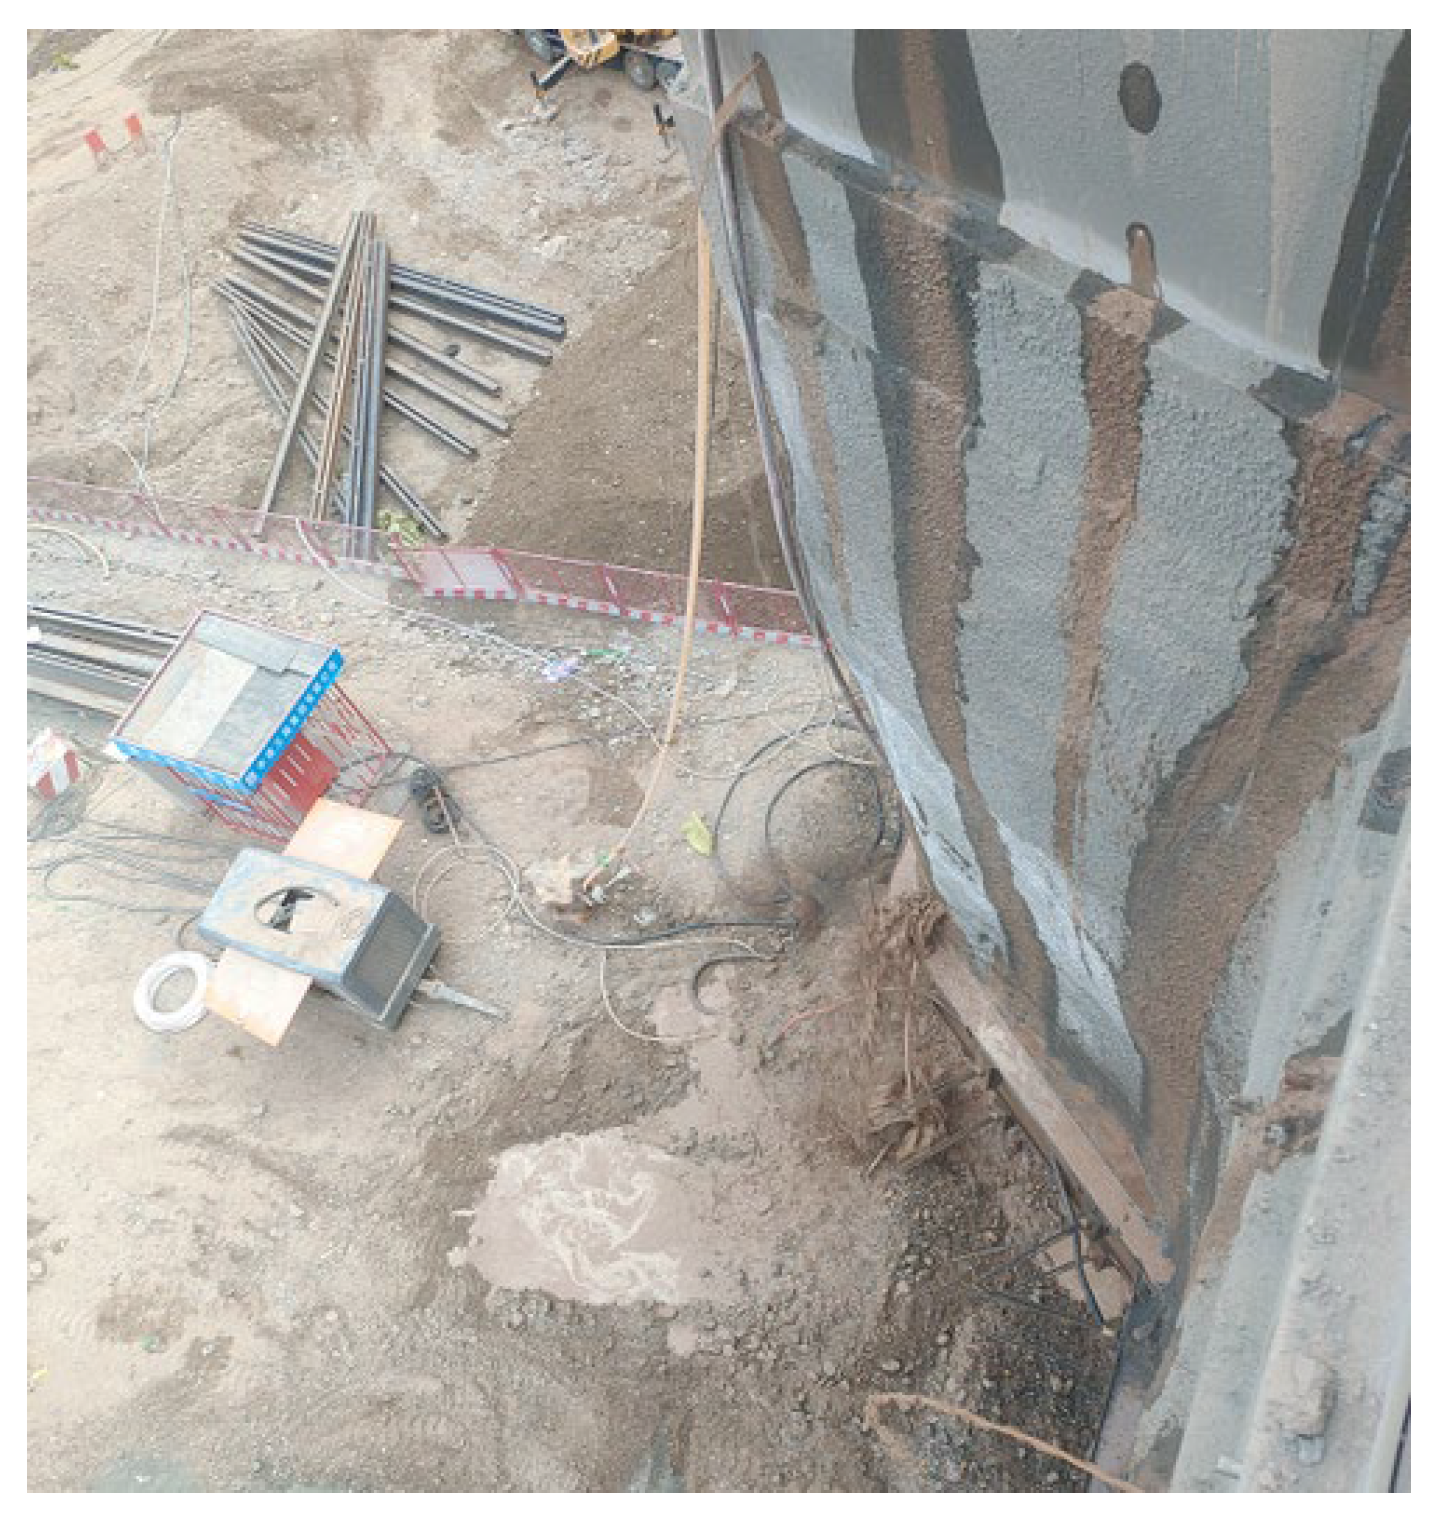
- The deep horizontal displacement monitoring point of the foundation pit partially exceeds the early warning value, but does not reach the alarm value, which does not affect the safety of the foundation pit and the safety of the foundation pit, and the impact of the water pipeline rupture on the horizontal displacement of the foundation pit is found in time through the early warning of the online monitoring system. It can be proved that the real-time monitoring system can timely discover the influence of external unfavourable factors on the foundation pit.
- (3)
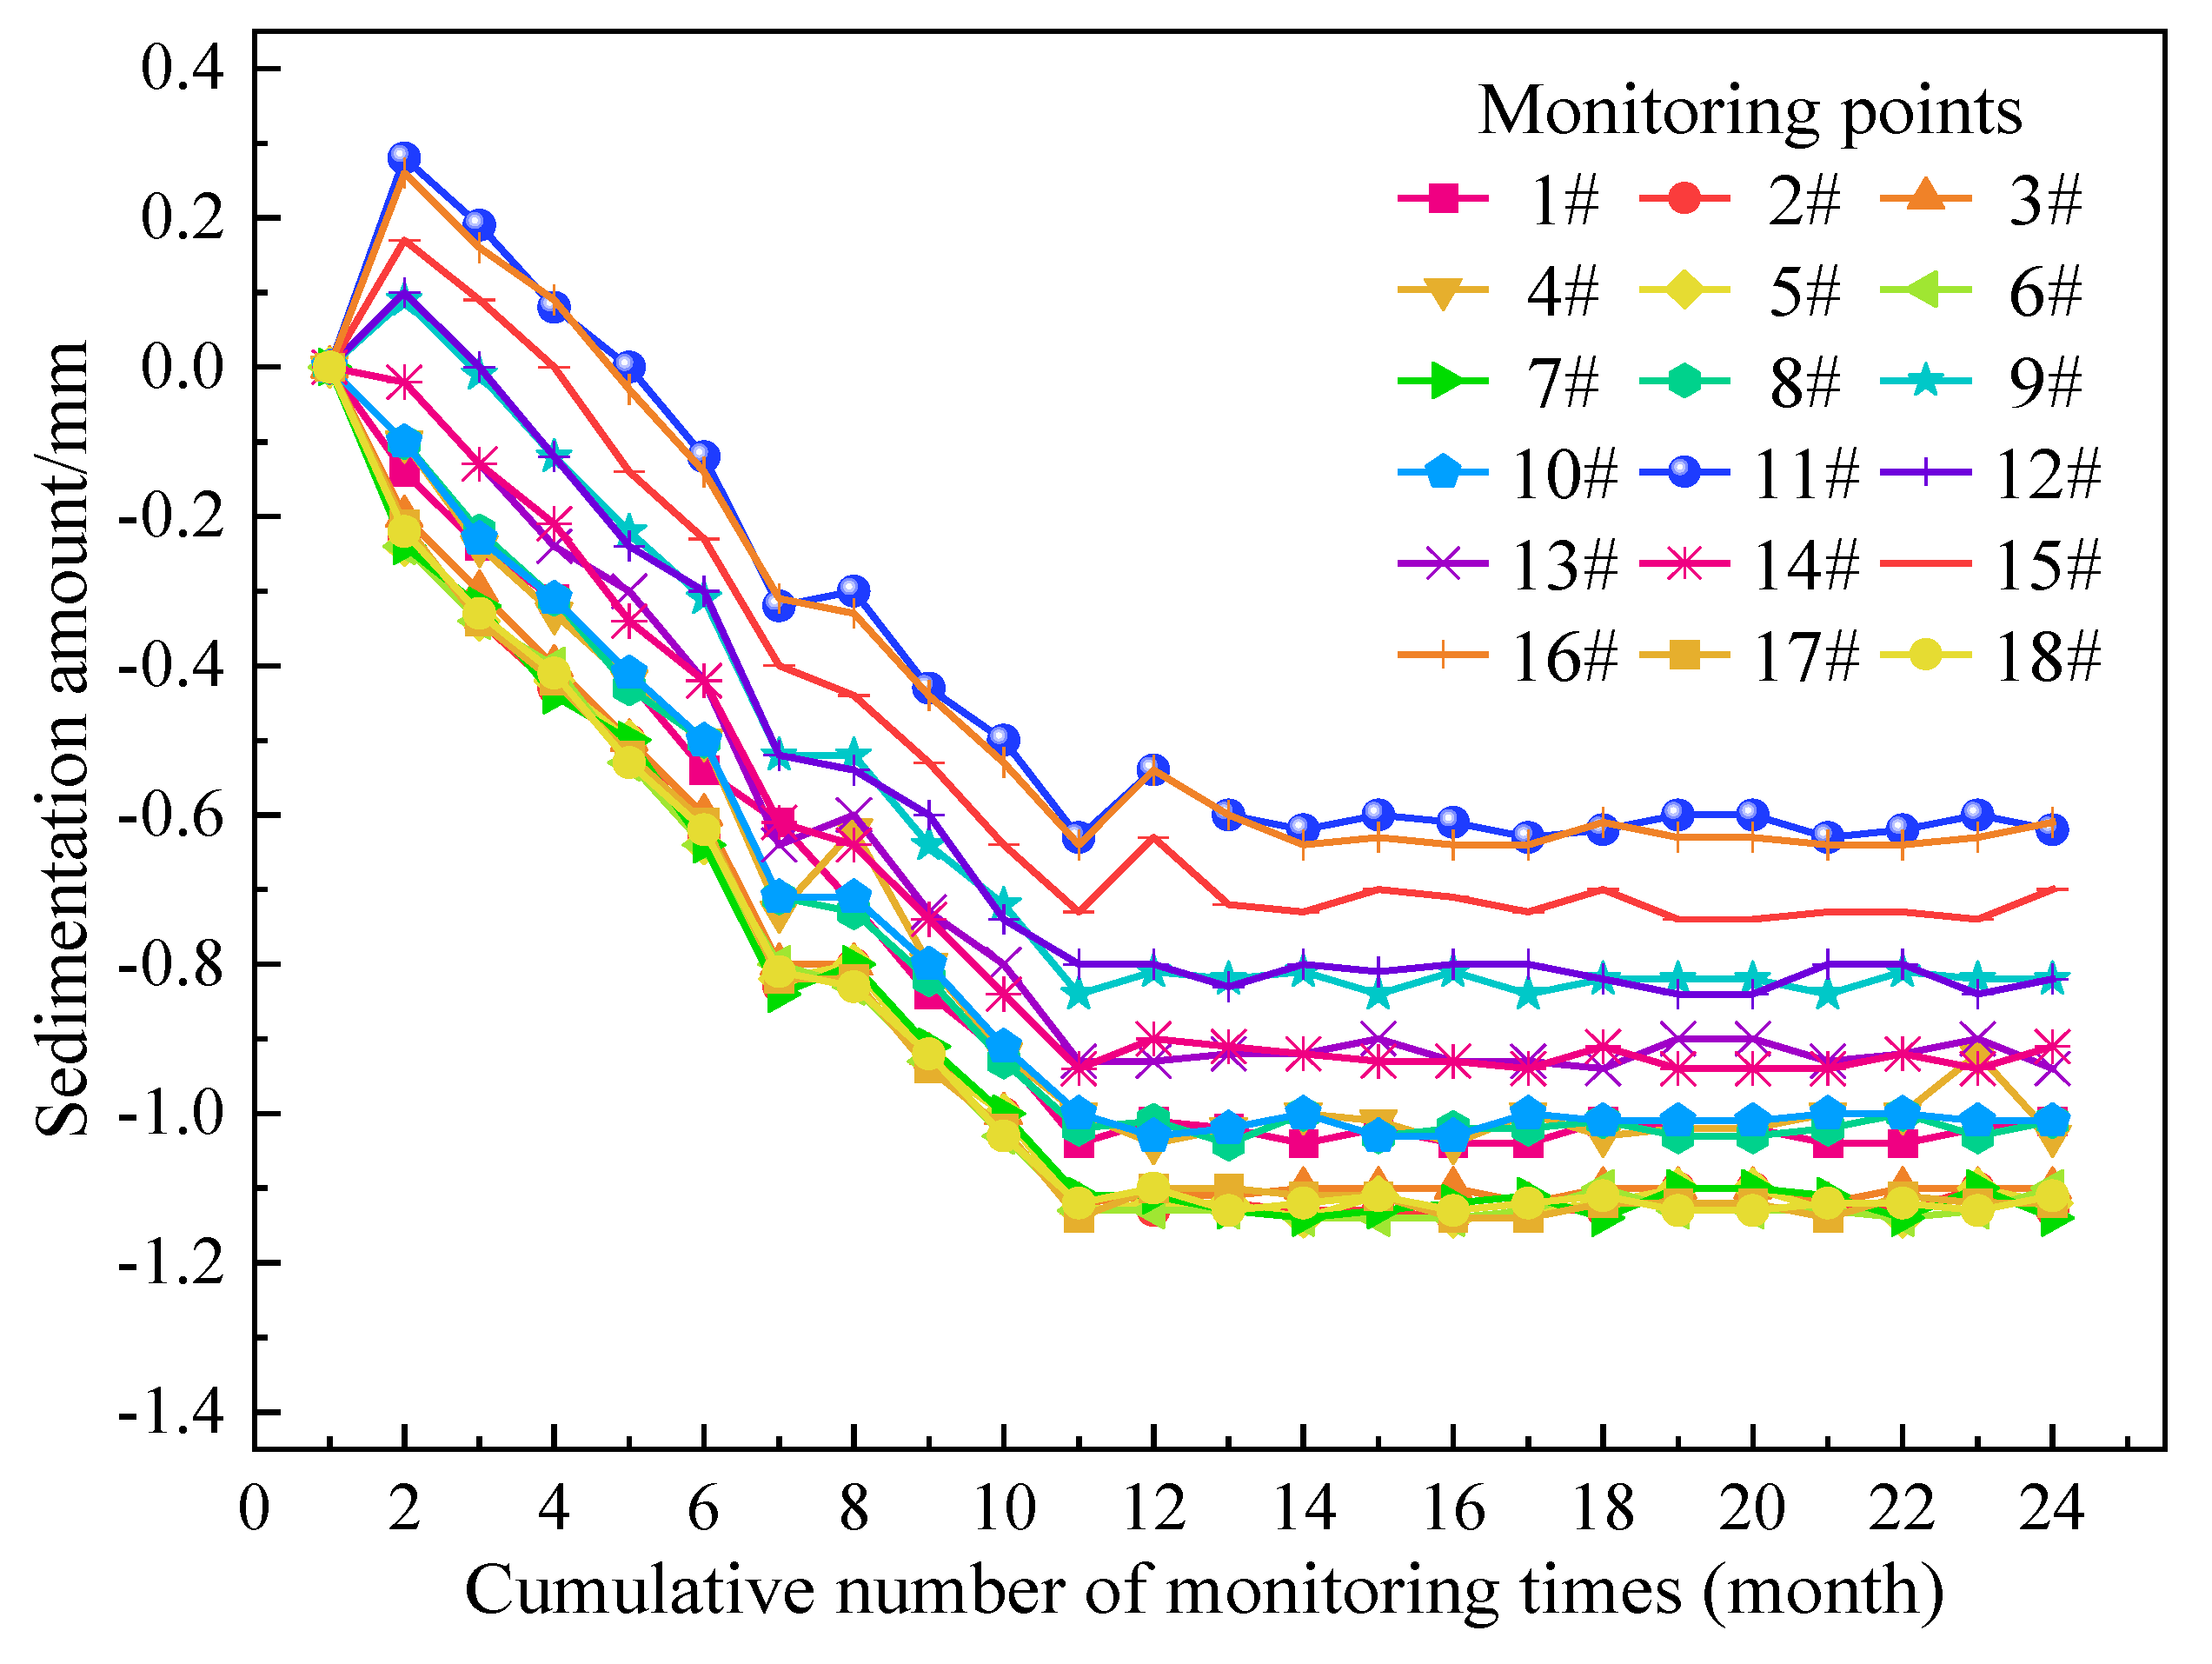
- All monitoring points have been vertically displaced, and some displacement values exceed the early warning value. However, the foundation pit is still in a stable state, which does not affect the safety of the foundation pit.
- (4)
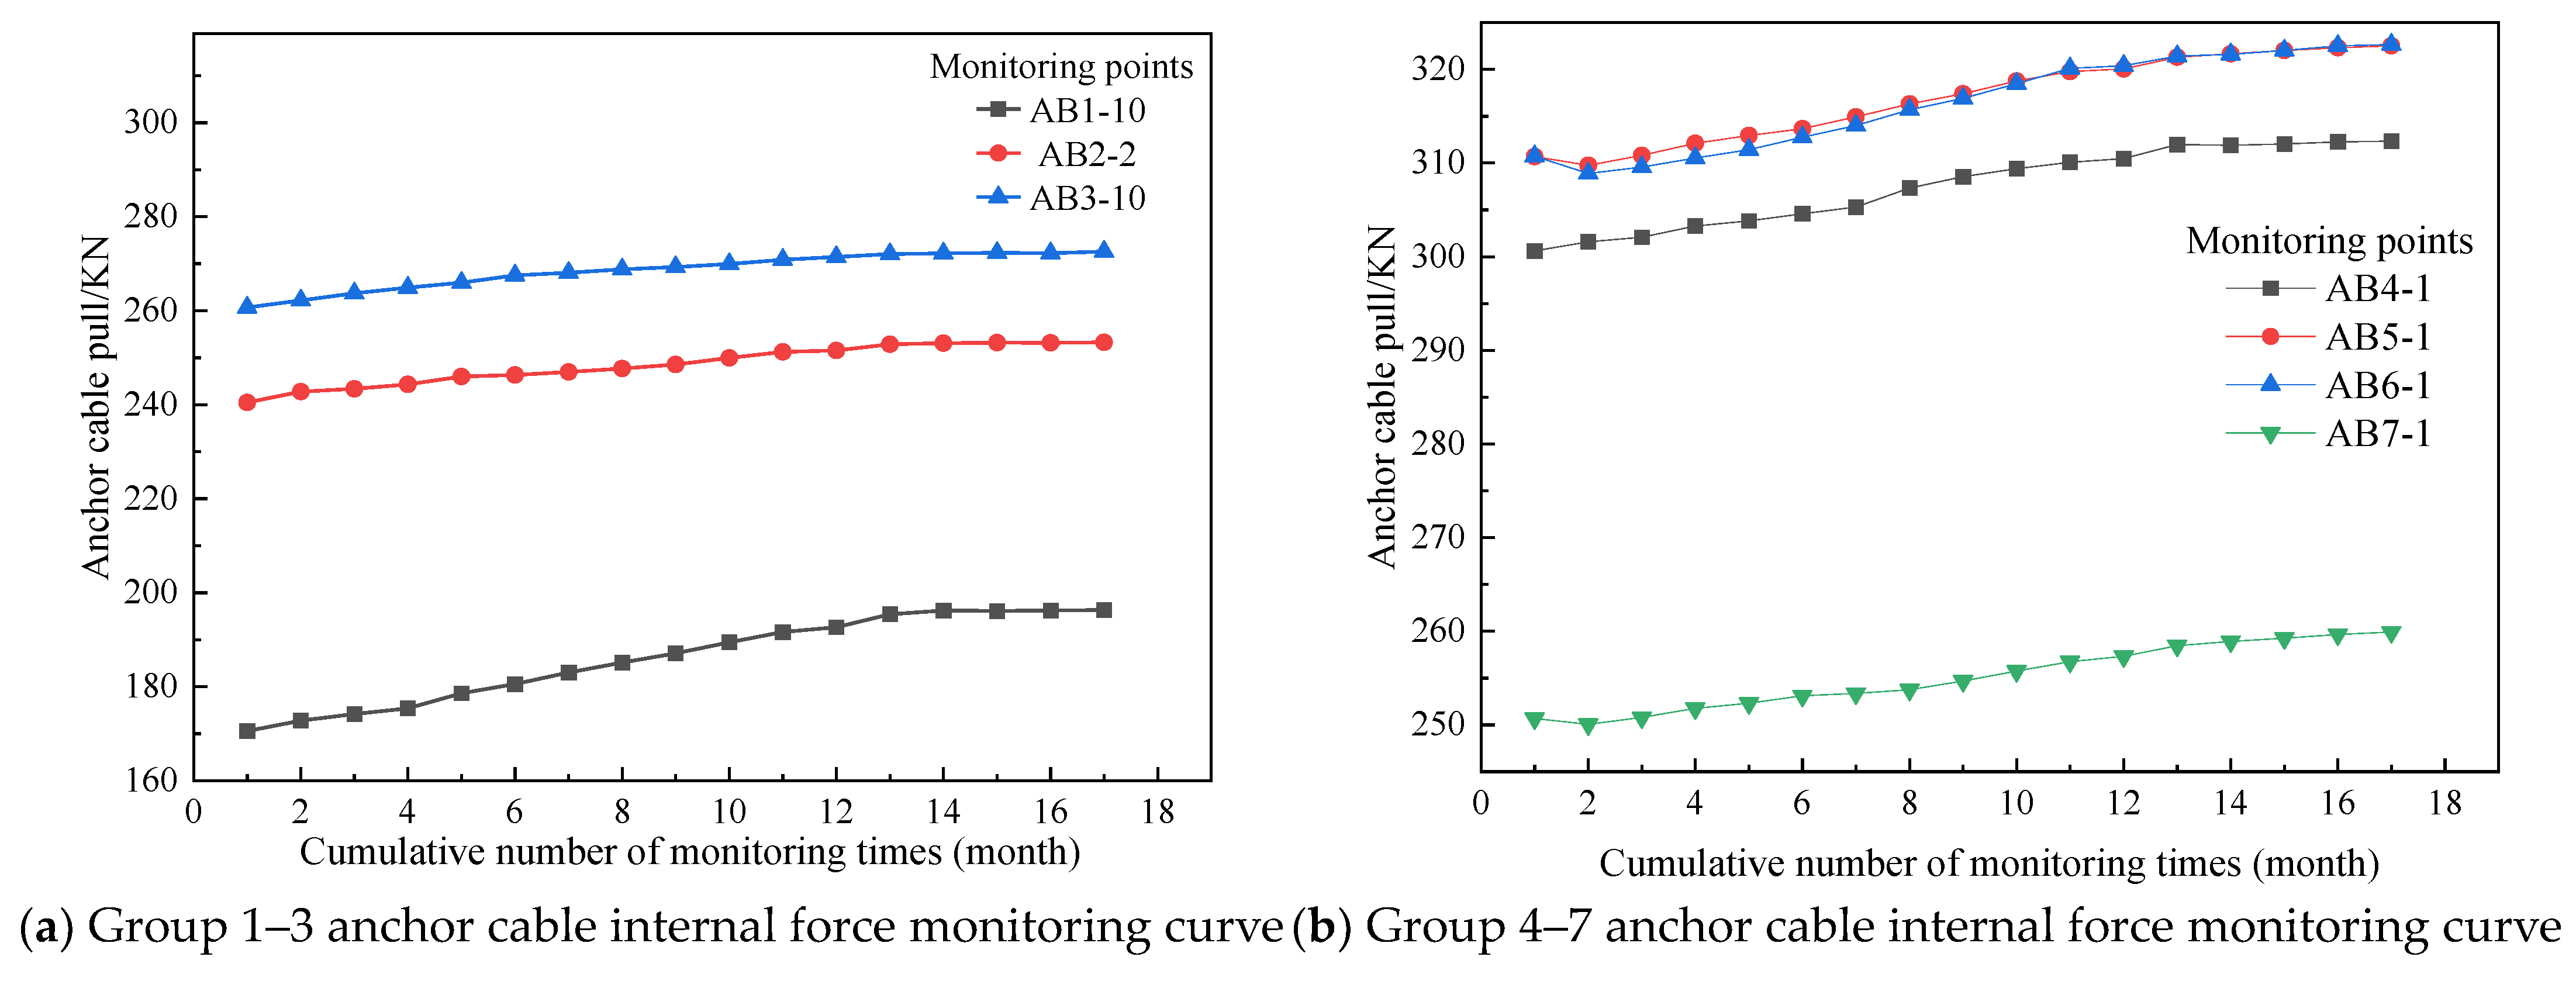
- Through the internal force monitoring of the prestressed anchor cable, it can be obtained that the prestress loss will occur after the anchor cable is locked. The tensile force value of the anchor cable monitoring can be increased to ensure that the locking value can reach the design lock value.
- (5)
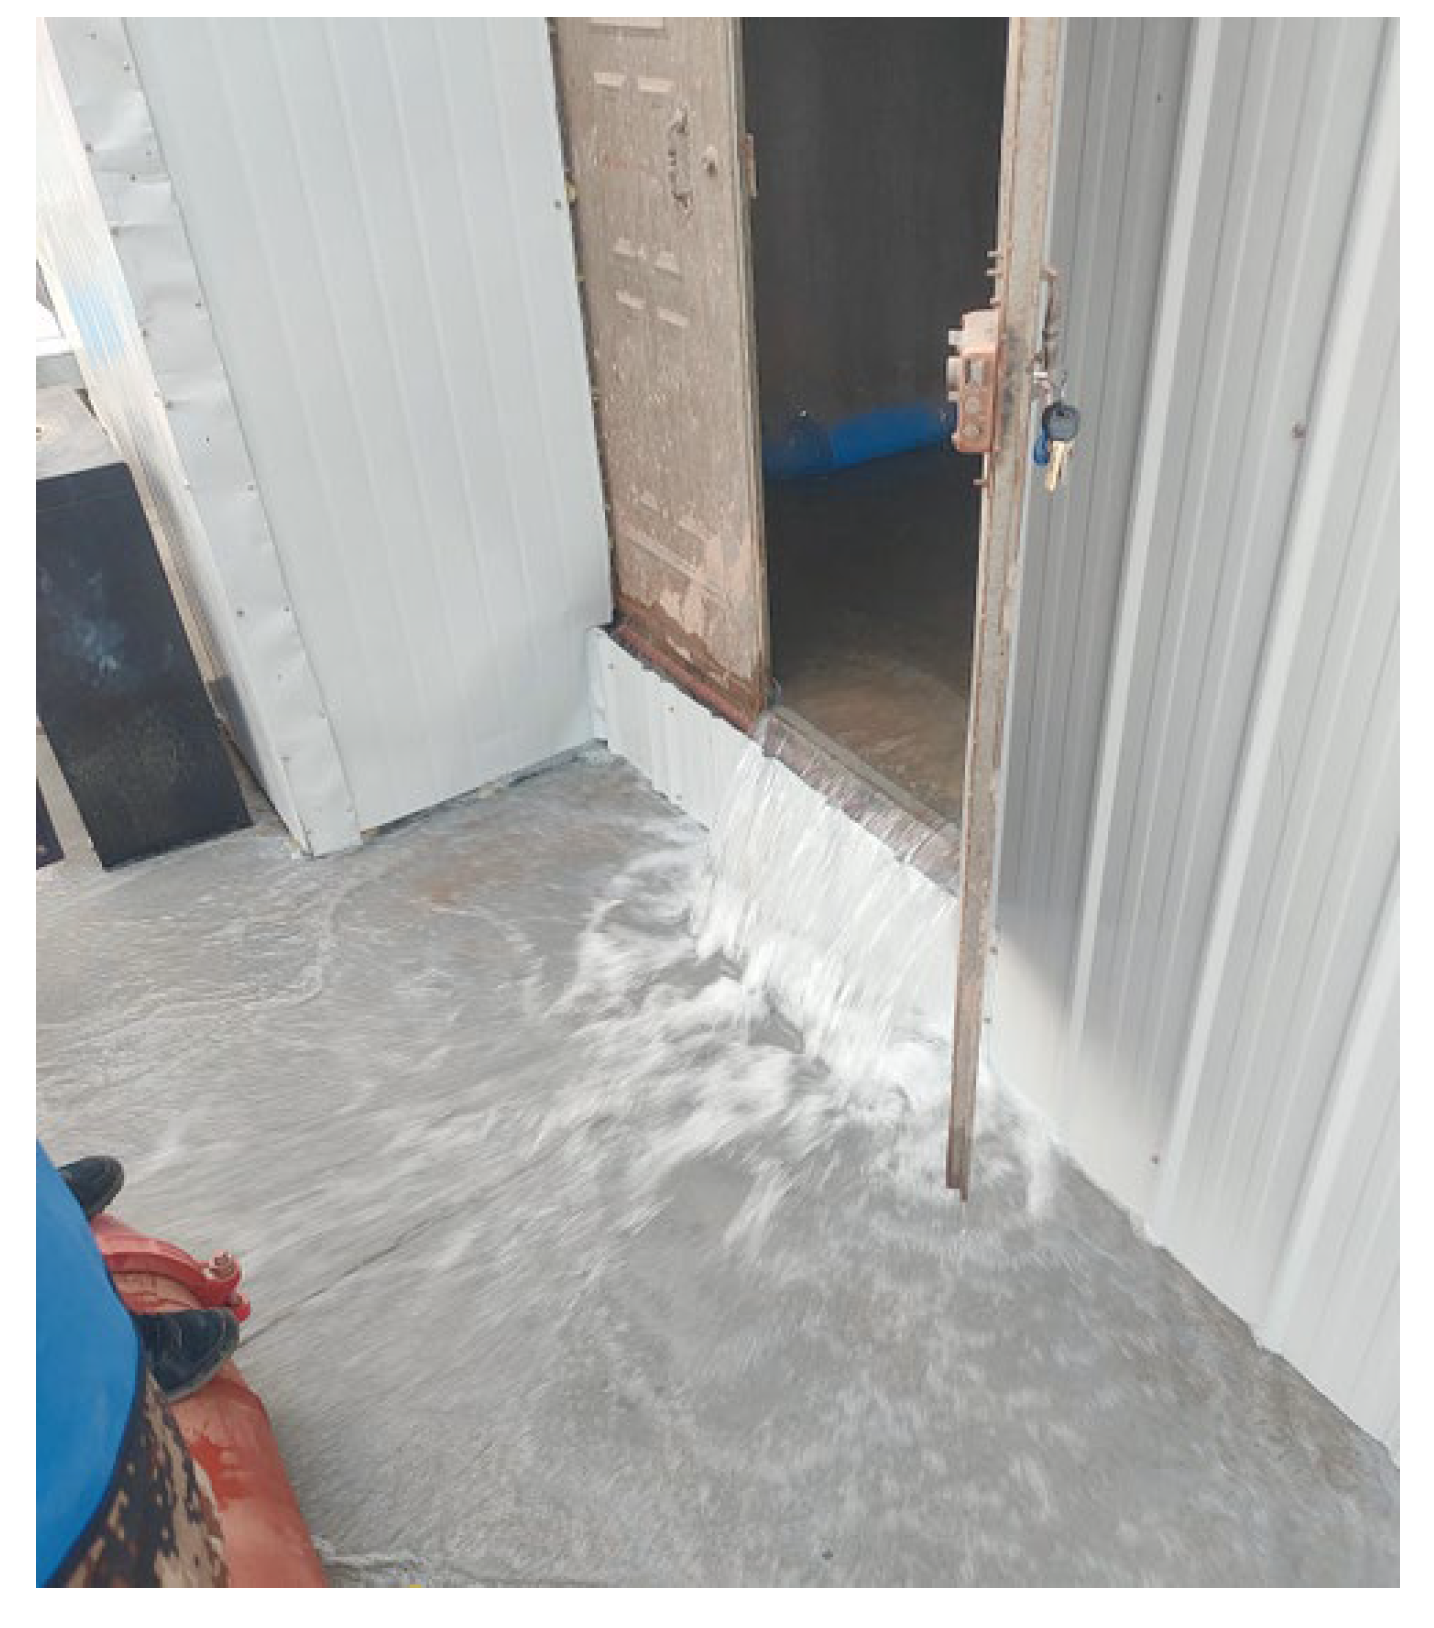
- By comparing the precipitation reference points, it is found that the individual monitoring data exceeded the warning range during the water level monitoring period, which was due to the damage of the pumping pump in the local precipitation well. The pumping pump collection and drainage capacity was strengthened in time in the later stage to stabilize the water level change.
- (6)
- During the excavation of the foundation pit, the surrounding pipelines, and surrounding buildings have obvious impacts, and the settlement occurs within the controllable range to ensure that the whole is in a stable state.
Author Contributions
Funding
Data Availability Statement
Conflicts of Interest
References
- Dmochowski, G.; Szolomicki, J. Technical and structural problems related to the interaction between a deep excavation and adjacent existing buildings. Appl. Sci. 2021, 11, 481. [Google Scholar] [CrossRef]
- Zhandos, Y.; Orazalin, M.; Andrew, J.; Whittle, M.; Matthew, B.; Olsen, M. Three-Dimensional Analyses of Excavation Support System for the Stata Center Basement on the MIT Campus. J. Geotech. Geoenviron. Eng. 2015, 141, 05015001. [Google Scholar] [CrossRef]
- Sebastian Bryson, M.; David, G.; Zapata-Medina, S. Method for Estimating System Stiffness for Excavation Support Walls. J. Geotech. Geoenviron. Eng. 2012, 138, 1104–1115. [Google Scholar] [CrossRef]
- Masini, L.; Gaudio, D.; Rampello, S.; Romani, E. Observed Performance of a Deep Excavation in the Historical Center of Rome. J. Geotech. Geoenviron. Eng. 2021, 147, 05020015. [Google Scholar] [CrossRef]
- Schwamb, T.; Soga, K. Numerical modelling of a deep circular excavation at Abbey Mills in London. Géotechnique 2015, 65, 604–619. [Google Scholar] [CrossRef]
- Sebastian Bryson, L.; Michael, J.; Kotheimer, M. Cracking in Walls of a Building Adjacent to a Deep Excavation. J. Perform. Constr. Facil. 2011, 25, 491–503. [Google Scholar] [CrossRef]
- Guo, P.; Gong, X.; Wang, Y.; Lin, H.; Zhao, Y. Analysis of observed performance of a deep excavation straddled by shallowly buried pressurized pipelines and underneath traversed by planned tunnels. Tunn. Undergr. Space Technol. 2023, 132, 104946. [Google Scholar] [CrossRef]
- Guoa, P.; Gong, X.; Wang, Y. Displacement and force analyses of braced structure of deep excavation considering unsymmetrical surcharge effect. Comput. Geotech. 2019, 113, 103102. [Google Scholar] [CrossRef]
- Zhou, Y.; Wang, H.; Zhu, Y. Construction Mechanics Behavior Analysis of Pile—Strut Supporting Structureof a Subway Deep Foundation Pit. J. Railw. Eng. Soc. 2019, 1, 86–92. [Google Scholar]
- Ye, S.; Ding, S.; Gong, X.; Gao, S.; Chen, C. Monitoring and numerical simulation of deep foundation pit of a subway station in Lanzhou. Chin. J. Geotech. Eng. 2018, 40 (Suppl. 1), 177–182. [Google Scholar]
- Mitew-Czajewska, M. A study of displacements of structures in the vicinity of deep excavation. Arch. Civ. Mech. Eng. 2019, 19, 547–556. [Google Scholar] [CrossRef]
- Rybak, J.; Ivannikov, A.; Kulikova, E.; Żyrek, T. Deep excavation in urban areas—Defects of surrounding buildings at various stages of construction. MATEC Web Conf. 2018, 146, 02012. [Google Scholar] [CrossRef]
- Just, M. Analysis of a Deep Excavation in Diaphragm Walls, on Surrounding Buildings. Arch. Inst. Civil Eng. 2018, 86–104. [Google Scholar] [CrossRef]
- Castaldo, P.; Calvello, M.; Palazzo, B. Structural safety of existing buildings near deep excavations. Int. J. Struct. Eng. 2014, 5, 163–187. [Google Scholar] [CrossRef]
- Dachowski, R.; Gałek, K. Selection of the Best Method for Underpinning Foundations Using the Promethee II Method. Sustainability 2020, 12, 5373. [Google Scholar] [CrossRef]
- Mrowczynska, M.; Grochowska, E.; Gibowski, S. Monitoring V ertical Displacements of an Engineeriong Object with Masonry Walls. J. Civ. Eng. Environ. Arch. 2018, 65, 53–62. [Google Scholar]
- Ye, S.; Li, D. Monitoring and simulation analysis of deep and large foundation pit excavation in complex environment. CHINA Civ. Eng. J. 2019, 52, 117–126. [Google Scholar]
- Yin, L.; Li, Y.; Zhu, Y.; Huo, B.; Yang, Z.; Duan, Q. Monitoring and numerical simulation of support for foundation pit at Yanyuan Road Station of Lanzhou Metro. Chin. J. Geotech. Eng. 2021, 43 (Suppl. 1), 111–116. [Google Scholar]
- Ye, S.; Chen, C.; Kou, W.; Zhu, Y. Displacement monitoring and deformation characteristics of a deep foundation pit in Lanzhou. Chin. J. Geotech. Eng. 2014, 36 (Suppl. 1), 440–445. [Google Scholar]
- Liu, L.; Mo, H.; Cao, H. Analysis and Application of Circular Section Prestressed Reinforced Concrete Cantilever Retaining Piles. J. Build. Struct. 2005, 35, 42–44. [Google Scholar]
- Wang, T.; Zhou, L.; Sun, H. Simplified calculation of asymmetrical reinforcement of circular section reinforced concrete support piles. J. China Foreign Highw. 2014, 34, 206–209. [Google Scholar]


| Soil Layer Sequence | Layer Name | Soil Thickness/m | γ/(kN/m3) | c/kPa | ϕ/(°) |
|---|---|---|---|---|---|
| ① | Miscellaneous fill (Q4m1) | 1.00~2.20 | 16.0 | 5.0 | 18.0 |
| ② | Plain fill (Q4m1) | 0.50~7.50 | 17.0 | 18.0 | 19.0 |
| ③ | Loess-like silt (Q4al+pl) | 2.70~10.10 | 17.0 | 19.0 | 25.0 |
| ③-1 | Gravelly sand (Q4al+pl) | 1.9 | 21.0 | 3.0 | 27.0 |
| ④ | Peaty silty fine san (Q4al+pl) | 0.70–2.10 | 20.0 | 11.0 | 20.0 |
| ⑤ | Fine sand (Q4al+pl) | 0.40~1.70 | 20.0 | 2.0 | 22.0 |
| ⑤-1 | Round gravel (Q4al+pl) | 0.50~1.70 | 21.0 | 3.0 | 27.0 |
| ⑥ | Cobble (Q4al+pl) | 10.30~18.30 | 22.0 | 3 | 38 |
| ⑥-1 | Fine sand (Q4al+pl) | 0.70 | 20.0 | 2.0 | 22.0 |
| ⑥-2 | Round gravel (Q4al+pl) | 0.50~5.10 | 21.0 | 3.0 | 27.0 |
| Section | D (Diameter/mm) | ① Longitudinal Rebar | Stiffeners | Spiral Ribs |
|---|---|---|---|---|
| M-M | 1200 | 22C28 | 2C16@2000 | C12@150 |
| N-N | 1200 | 23C28 | 2C16@2000 | C12@150 |
| O-O | 1000 | 22C25 | 1C16@2000 | C12@150 |
| P-P | 1000 | 22C25 | 1C16@2000 | C10@150 |
| Monitor Content | Number of Monitoring Points |
|---|---|
| Settlement and horizontal displacement monitoring of supporting structures | 22 points |
| Support anchor cable internal force monitoring | 7 sets of sections |
| Deep horizontal displacement monitoring | 6 wells |
| Groundwater level monitoring | 3 points |
| Settlement monitoring of buildings around foundation pits | 58 points |
| Perimeter pipeline displacement monitoring | 18 points |
| Crack monitoring | Laid out according to the actual situation |
| Monitor Content | Number of Monitoring Points | Cumulative Sedimentation (mm) |
|---|---|---|
| Family building on the east side of the foundation pit | 6 points | 9.71–9.83 |
| Bank office building and MRI room on the west side of the foundation pit | 6 points | 9.32–9.84 |
| Family building on the west side of the foundation pit | 5 points | 9.31–9.82 |
| Family building on the west side of the foundation pit | 5 points | 9.62–9.82 |
| Family building on the west side of the foundation pit | 6 points | 9.53–9.92 |
| Family building on the west side of the foundation pit | 6 points | 9.62–9.84 |
| Family building on the west side of the foundation pit | 8 points | 9.87–9.93 |
| Family building on the west side of the foundation pit | 6 points | 9.03–9.14 |
| Inpatient building on the north side of the foundation pit | 4 points | 8.82–9.16 |
| Inpatient building on the north side of the foundation pit | 6 points | 9.30–9.73 |
Disclaimer/Publisher’s Note: The statements, opinions and data contained in all publications are solely those of the individual author(s) and contributor(s) and not of MDPI and/or the editor(s). MDPI and/or the editor(s) disclaim responsibility for any injury to people or property resulting from any ideas, methods, instructions or products referred to in the content. |
© 2023 by the authors. Licensee MDPI, Basel, Switzerland. This article is an open access article distributed under the terms and conditions of the Creative Commons Attribution (CC BY) license (https://creativecommons.org/licenses/by/4.0/).
Share and Cite
Wu, J.; Ye, S.; Wang, Z.; Yang, D. Application and Automatic Monitoring and Analysis of Hybrid Support Structure in Ultra-DEEP Foundation Pit Engineering in the Lanzhou Area under Complex Environmental Conditions. Water 2023, 15, 1335. https://doi.org/10.3390/w15071335
Wu J, Ye S, Wang Z, Yang D. Application and Automatic Monitoring and Analysis of Hybrid Support Structure in Ultra-DEEP Foundation Pit Engineering in the Lanzhou Area under Complex Environmental Conditions. Water. 2023; 15(7):1335. https://doi.org/10.3390/w15071335
Chicago/Turabian StyleWu, Jian, Shuaihua Ye, Zhiquan Wang, and Dong Yang. 2023. "Application and Automatic Monitoring and Analysis of Hybrid Support Structure in Ultra-DEEP Foundation Pit Engineering in the Lanzhou Area under Complex Environmental Conditions" Water 15, no. 7: 1335. https://doi.org/10.3390/w15071335