Article

Nitrogen Removal for Low Concentration Ammonium Wastewater by Adsorption, Shortcut Simultaneous Nitrification and Denitrification Process in MBBR

1
College of Agricultural Science and Engineering, Hohai University, Nanjing 210098, China
2
Jiangsu Province Engineering Research Center for Agricultural Soil-Water Efficient Utilization, Carbon Sequestration and Emission Reduction, Hohai University, Nanjing 210098, China
3
College of Hydrology and Water Resources, Hohai University, Nanjing 210098, China
4
College of Environment, Hohai University, Nanjing 210098, China
*
Authors to whom correspondence should be addressed.
Water 2023, 15(7), 1334; https://doi.org/10.3390/w15071334
Submission received: 21 February 2023 / Revised: 20 March 2023 / Accepted: 24 March 2023 / Published: 28 March 2023
(This article belongs to the Special Issue Water Quality in Aquaculture Production)

Abstract

:
Excessive discharge of ammonia nitrogen wastewater from intensive aquaculture has worsened in recent years. Therefore, there is an urgent need to develop an effective and energy-saving denitrification technology. This study intends to adopt a moving bed biofilm reactor (MBBR) to remove ammonia nitrogen through the combination of adsorption and shortcut simultaneous nitrification and denitrification (SND). The research focuses on the operational parameters and regeneration mechanism of the MBBR adsorption-shortcut SND process. The optimal operating parameters in the adsorption stage were a hydraulic retention time of 8 h and an agitation rate of 120 r/min. For the shortcut SND stage, the ideal optimal parameters were two times alkalinity and dissolved oxygen (DO) 1.0 mg/L. Under optimal operating parameters conditions, the SND rate, TN removal rate, NH 4 + -N removal rate and nitrite accumulation rate were 89.1%, 84.0%, 94.3%, and 86.4%, respectively. The synergetic actions of ion exchange and microorganisms were the main driving force for regenerating ceramsite zeolite components. The synergistic inhibitory effect of high-concentration free ammonia and low-level DO on nitrite-oxidizing bacteria was the key to achieving stable and efficient NO 2 -N accumulation. NO 2 -N produced in shortcut nitrification entered the ceramsite through complex mass transfer, and denitrifying bacteria can reduce these NO 2 -N to N2.

1. Introduction

The phenomenon of excessive ammonia nitrogen discharge in the intensive aquaculture industry is becoming more and more serious [1]. It is critical to create a denitrification technique that is highly effective and energy-saving. The trickling filter, electrochemical nitrogen removal technology, moving bed biofilm reactor (MBBR), and biological aerated filter are often implemented in wastewater nitrogen removal [2,3,4,5]. The MBBR process has been proven to effectively address the issues associated with aerated filter backwashing, the large occupation of rotating biological contactors, the complex operation of the cleaning filter, and large energy consumption of fluidization [6,7,8]. The performance of the reactor is determined by the suspended filler in the MBBR, which provides a suitable environment for microbial growth and reproduction.
Various biocarriers have been introduced in the MBBR process to date, including plastic media, polyurethane sponge, activated carbon, naturally occurring materials, sponges, ceramsite carriers, etc. [8,9,10]. Multi-sided hollow balls and cylindrical suspension packing made of polypropylene or polyethylene both have advantages in terms of strength and stability [11]. However, they also have several drawbacks, including low filler hydrophilicity, high possibility of biofilm abscission, microenvironment instability, and limited ammonia nitrogen capacity due to a lack of microporous structure [12]. Lightweight ceramsite was similar to sponge, with a rough exterior and an extensive interior pore network. A wide range of microbial communities can grow on that kind of carrier surface and inside the pores to assemble and degrade various pollutants [13,14]. It can form a more stable aerobic zone and anoxic zone/anaerobic zone in different parts of ceramsite, thereby creating a stable microenvironment for the simultaneous nitrification and denitrification (SND) process of the whole reactor [15]. It can function effectively as an alternative for MBBR plastic filler. Zhou et al. [16] treated urban domestic wastewater using suspended ceramsite as an MBBR and achieved high SND efficiency, with an average nitrification rate and denitrification rate reaching 2.21 mg NH 4 + -N/(g MLSS·h) and 0.98 mg NO 3 -N/(g MLSS·h), respectively. If the nitrification process in SND is controlled at the nitrite nitrogen stage to achieve shortcut SND denitrification, the alkali demand in the nitrification process, as well as the carbon source and oxygen supply required for denitrification, can be reduced and the reaction time can be shortened to achieve a more efficient and energy-saving denitrification process [17]. Several approaches have been proposed to achieve long-term partial nitrification in activated sludge systems by controlling operation conditions, such as dissolved oxygen (DO), temperature, pH, free ammonia (FA), and free nitrous acid (FNA) [18,19,20]. Fundamentally, proper DO levels could suppress nitrite-oxidizing bacteria (NOB) activity escorted by maintaining ammonia-oxidizing bacteria (AOB) and ammonium-oxidizing bacteria (AnAOB) activities to prevent the build-up of NO 3 -N in systems [21]. Additionally, the environment with high DO was unfavorable for the growth of denitrifying bacteria and unable to form a subsequent anaerobic condition suitable for denitrification [22]. The pH and FA/FNA can influence microbial activity in the MBBR nitrogen removal system, including AOB, NOB, AnAOB, and heterotrophs [21]. The optimal control of FA could improve the TN removal efficiency in wastewater treatment systems [21]. Additionally, the FA concentration in the reactor can be controlled to realize the nitrification process by adjusting the NH 4 + -N concentration, pH value, and temperature [18]. Zeolite, as an ammonia nitrogen adsorption material, can generate a higher concentration of FA between the zeolite surface and the liquid phase when the adsorption equilibrium is attained, thereby inhibiting NOB on the biofilm surface. Chen et al. [23] achieved the shortcut biological nitrogen of low-concentration ammonia nitrogen wastewater through zeolite adsorption and biochemical desorption. In addition, since the concentration of ammonia nitrogen in aquaculture wastewater is low and the quality of effluent fluctuates greatly, combining the carrier adsorption and biological nitrogen removal processes can maximize their respective advantages, boost the efficiency of wastewater treatment, and optimize the entire process.
Miladinovic and Weatherley [24] used natural zeolite as filler material in the packed bed system with the goal of combining NH 4 + -N selective adsorption of zeolite and nitrification of microorganisms to synergize the removal of NH 4 + -N from wastewater. Results showed that the combined system outperformed the simple microbial denitrification in that it could better adapt to the rapid change of ammonia nitrogen concentration. However, ion exchange resin and zeolite often have densities higher than that of water (1.92~2.88 g/cm3), which does not meet the requirements of an MBBR for the lightweight carrier. Through preliminary research, our research prepared high-strength lightweight ceramsite with high porosity and large specific surface area using sediment, zeolite, and bentonite as raw materials, which has not only excellent ammonia nitrogen adsorption performance but also is suitable for the adhesion and growth of microorganisms, fulfilling the requirements of adsorption shortcut SND processes for carriers [25]. Based on functional ceramsite, the main objectives of this study were: (1) to evaluate the feasibility of the MBBR adsorption–shortcut SND process; (2) to explore the operational parameters of the adsorption–shortcut SND process. The effects of experimental parameters such as HRT, agitation rate, alkalinity, and DO were investigated to understand the denitrification performance; (3) to shed light on the mechanism of the migration, transformation, and regeneration mechanism of ammonia nitrogen in the MBBR adsorption–shortcut SND process.

2. Materials and Methods

2.1. Wastewater Composition and Carrier

The synthetic wastewater was comparable to the water quality of the Baima Lake aquaculture pond. The NH 4 + -N concentration of the wastewater was about 26.2 mg/L, COD concentration was about 100 mg/L, and pH was about 7.62. The composition of synthetic wastewater is displayed in Table 1. On the basis of our earlier findings, the functional ceramsite was used as a carrier, with zeolite, dredging sediment, and bentonite serving as composite materials [25].

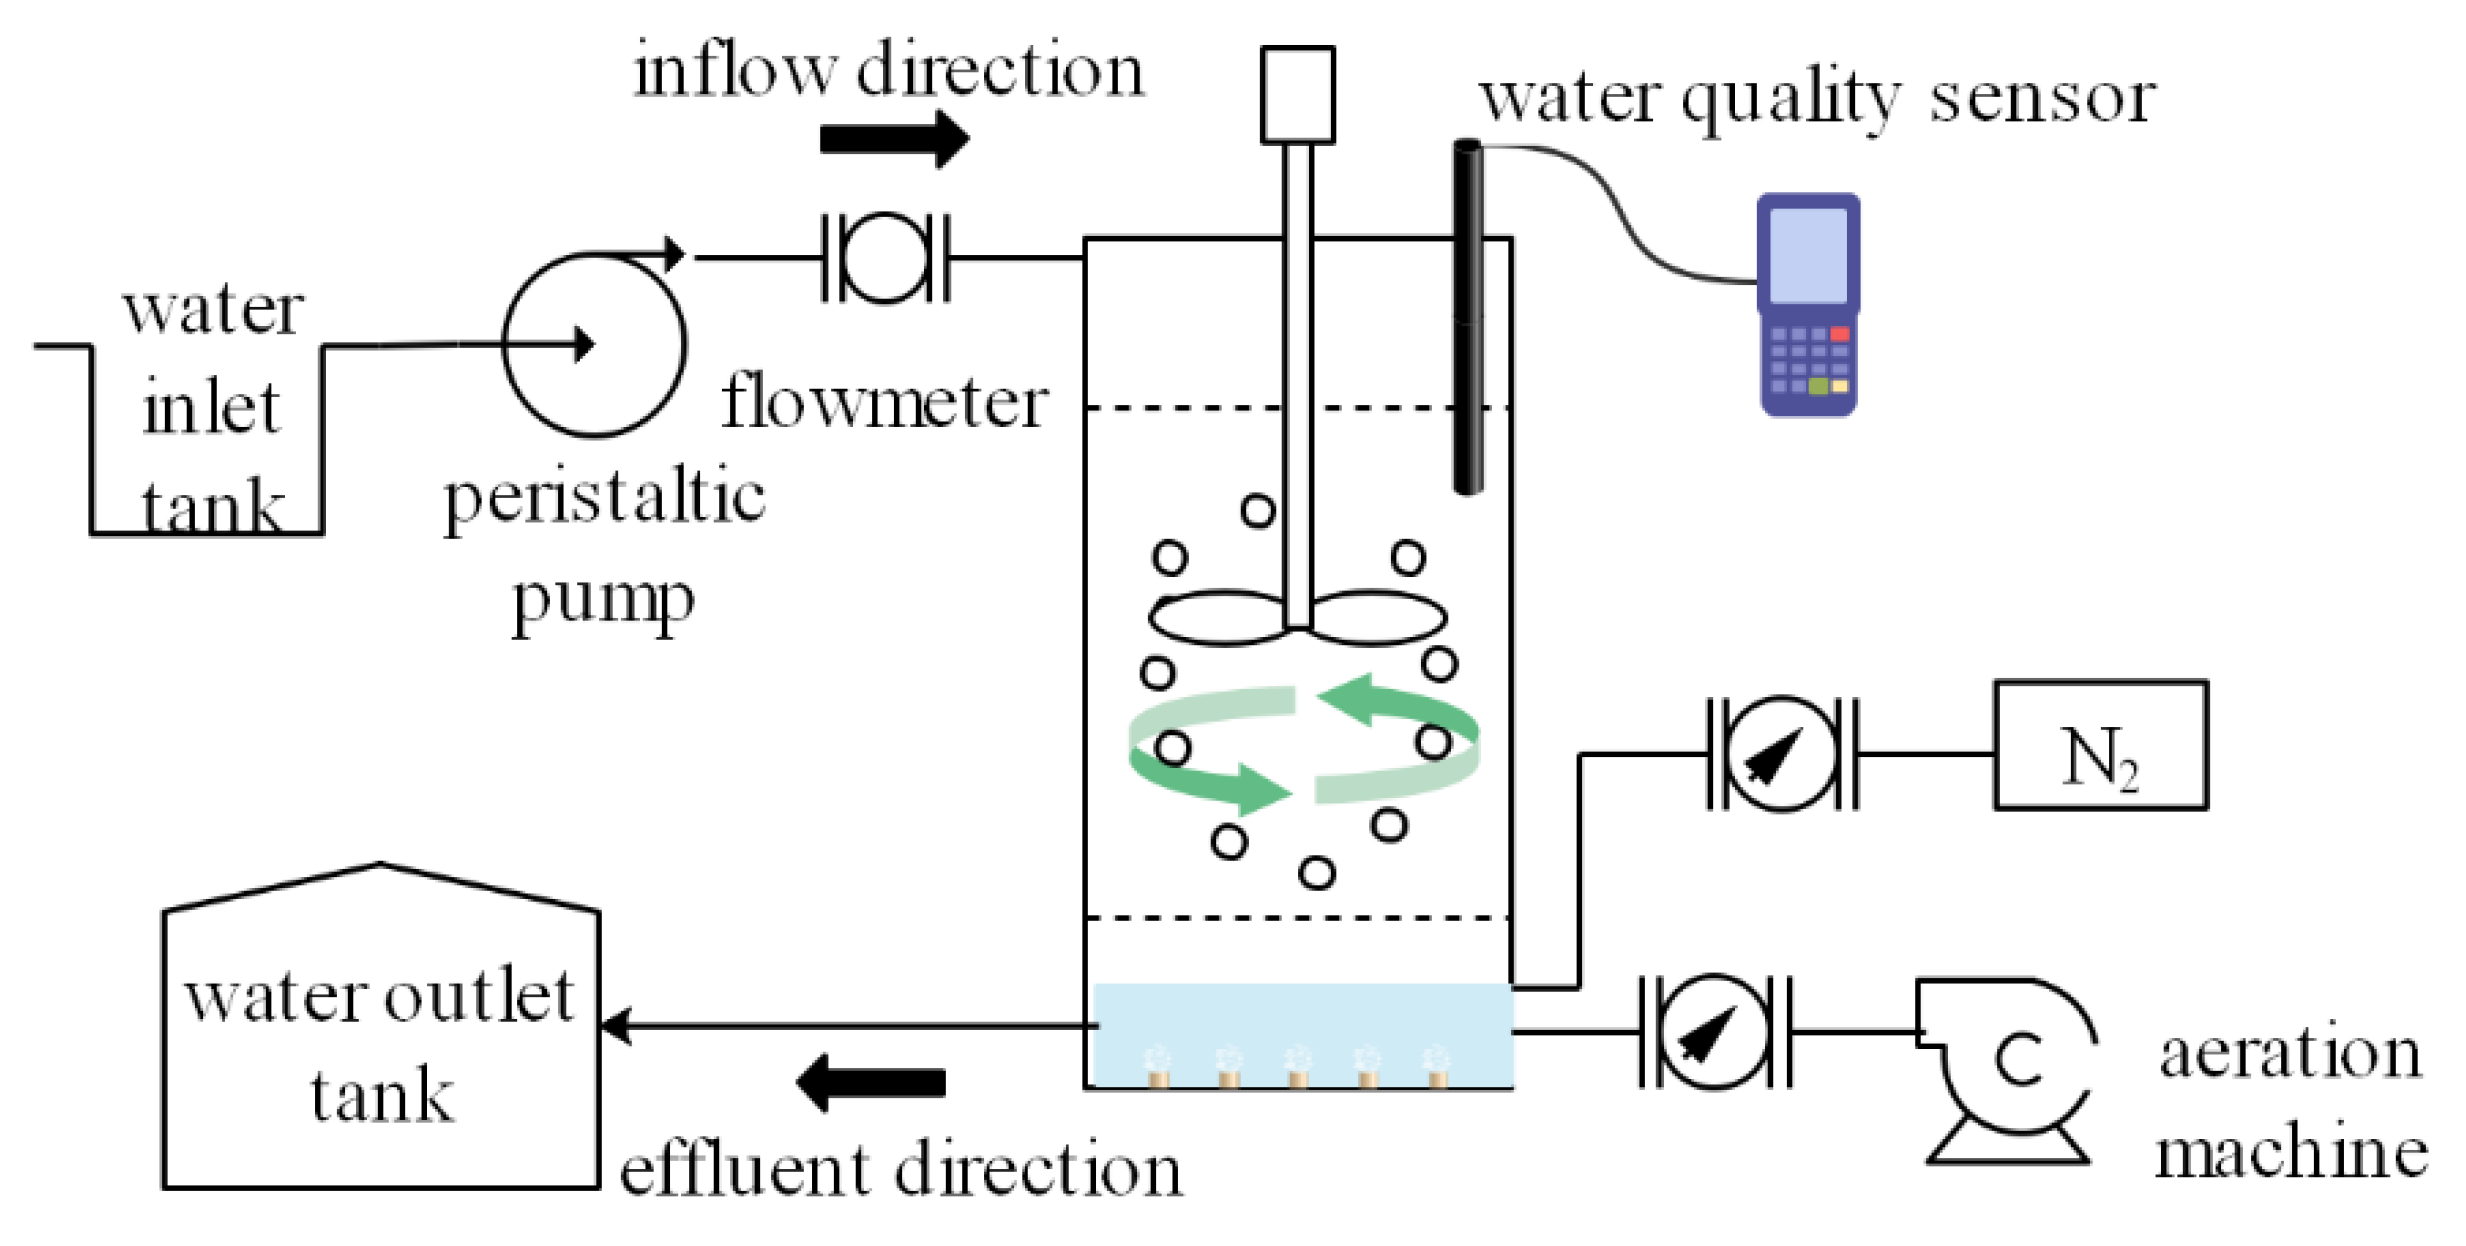
2.2. Experimental Set-Up and Operation of the MBBR

One pilot-scale MBBR with an effective volume of 6 L (diameter: 11 cm, height: 75 cm) is illustrated in Figure 1.
Suspended functional ceramsite was added in the experimental reactor and corresponded to a volume fraction of 20% (Vsupport/Vreactor). The simulated wastewater entered from the upper part of the reactor and exited at the bottom of the reactor. The water inlet was connected with a peristaltic pump, and the hydraulic residence time of the system was adjusted by controlling the inlet flow. An aerator was placed at one side of the bottom of the tank, providing adequate oxygen transfer into the synthetic wastewater, and an airflow meter monitored the airflow rate. The agitator was installed on the lid of the reactor. After removing the lid, the ceramsite can be added or taken out directly. The ceramsites were kept in suspension and continuous movement in the MBBR using mechanical mixing with an agitator. Additionally, water quality sensors were also equipped to monitor the change in water quality parameters such as DO and pH in the reactor.
The MBBR was initiated by introducing seed sludge obtained from the sewage treatment plant of Nanjing. The inoculated sludge was discharged from the reactor when the microorganisms in the sludge attached well to the surface of the carriers adequately after 24 h. During the early stages of cultivating biofilm, synthetic wastewater was added to the reactor in a sequencing-batch mode. The reactor ran on a 12 h cycle duration that included 40 min of water inflow, 9 h of aeration, 60 min of standing, and 80 min of water outflow. The DO concentration stabilized around 2.0–3.0 mg/L. The temperature was kept at 25 °C, and pH was regulated between 6.5 and 8.0. The initial biofilm appeared on the surface of functional ceramsite after 5 days of continuous operation, and the residual mud-water mixture in the reactor was completely emptied on the 6th day. Considering the instability of the biofilm at the initial stage, continuous inlet water with a smaller flow rate was used, and continuous inlet water with a larger flow rate was employed as the biofilm on the carrier thickened.

2.3. Technological Process

The MBBR adsorption-shortcut SND process can be divided into two parts: the adsorption stage and the SND denitrification and regeneration stage. To facilitate the calculation, the wastewater from the hanging membrane start-up stage was emptied before the operation of the sequence batch reactor, and then a 5% mass concentration NaCl solution was injected to soak and wash 3 to 5 times to remove the possible adsorbed ammonia nitrogen from the ceramsite zeolite component and restore the ammonia nitrogen adsorption activity of the bio-ceramsite, and finally, the artificially configured low-concentration ammonia nitrogen aquaculture wastewater (26.2 mg/L) was filled. After the adsorption achieved equilibrium, the artificially configured wastewater was continuously injected into the MBBR at different flow rates using a flow meter, and the reactor entered the adsorption stage. The adsorption stage was not aerated to reduce the effect of microbial nitrification, the carrier was fluidized using an electric stirrer, and the adsorbed effluent was discharged into the effluent tank. Referring to the primary ammonia nitrogen discharge standard in cities’ sewage treatment plant pollutant discharged standard (GB 18918-2002), 5 mg/L was chosen as the adsorption breakthrough point. When the ammonia nitrogen discharge concentration exceeded 5 mg/L, the influent and effluent ceased, and the MBBR entered the shortcut SND denitrification and regeneration stage. At this time, the reactor stirrer continued to run, and the alkalinity was controlled by adding NaHCO3; the DO level in the reactor was adjusted by controlling the aeration intensity and the amount of N2 introduced, and the C/N was changed by adding glucose, and the wastewater was discharged into the effluent tank after the process of shortcut SND denitrification and regeneration was completed, and the next cycle was started at the same time.

2.4. Experimental Design

2.4.1. Study on the Operational Performance at the MBBR Adsorption Stage

(1)
Effect of hydraulic retention time (HRT) on the treatment effect of the MBBR in the adsorption stage.
In three identical reactors, the stirrer speed was set to 90 r/min to fluidize the carriers, and the influent flow rates were controlled at 0.5, 0.75, and 1 V/h, i.e., the hydraulic retention times were 12, 8, and 6 h. The NH 4 + -N concentrations of the MBBR effluent were detected every 2 h. The effect of different HRT on the breakthrough time of the MBBR ammonia and nitrogen adsorption was investigated to determine the best HRT.
(2)
Effect of stirring speed on the adsorption of ammonia and nitrogen by ceramsite.
The HRT was set to 8 h, and the stirrer speed was controlled at 60, 90, 120, and 150 r/min, and the changes in NH 4 + -N concentration in the effluent were monitored every 2 h. The effect of different stirring speeds on the breakthrough time of the MBBR ammonia and nitrogen adsorption was investigated to determine the best stirring speed.

2.4.2. Study on the Operational Performance at the MBBR Shortcut SND Denitrification and Regeneration Stage

(1)
Effect of alkalinity dosage ratio on the MBBR shortcut SND denitrification and regeneration.
In the simultaneous process of MBBR nitrification and denitrification, the reactor pH was usually varied in the range of 6.5 to 8.5 in order to obtain the highest nitrification and denitrification activity at the same time. Under such alkaline pH conditions, the carbonate system (CO2, HCO 3 , and CO 3 2 ) existed mainly in the form of HCO 3 [26]. Therefore, NaHCO3 was chosen as the source of alkalinity for the process of the MBBR shortcut SND denitrification and regeneration in this experiment. At room temperature (20–25 °C), the C/N in the reactor was set to 4, and the DO concentration was controlled at 2 mg/L. The alkalinity dosage was regulated at 0.5, 1, 2, and 4 times the theoretical alkalinity dosage and the alkalinity dosage was instantaneously applied at 1 h intervals to examine the changes in the concentrations of different forms of nitrogen in the MBBR. The NH 4 + -N, TN, NO 3 -N, -N, and pH were monitored per hour during the tests.
(2)
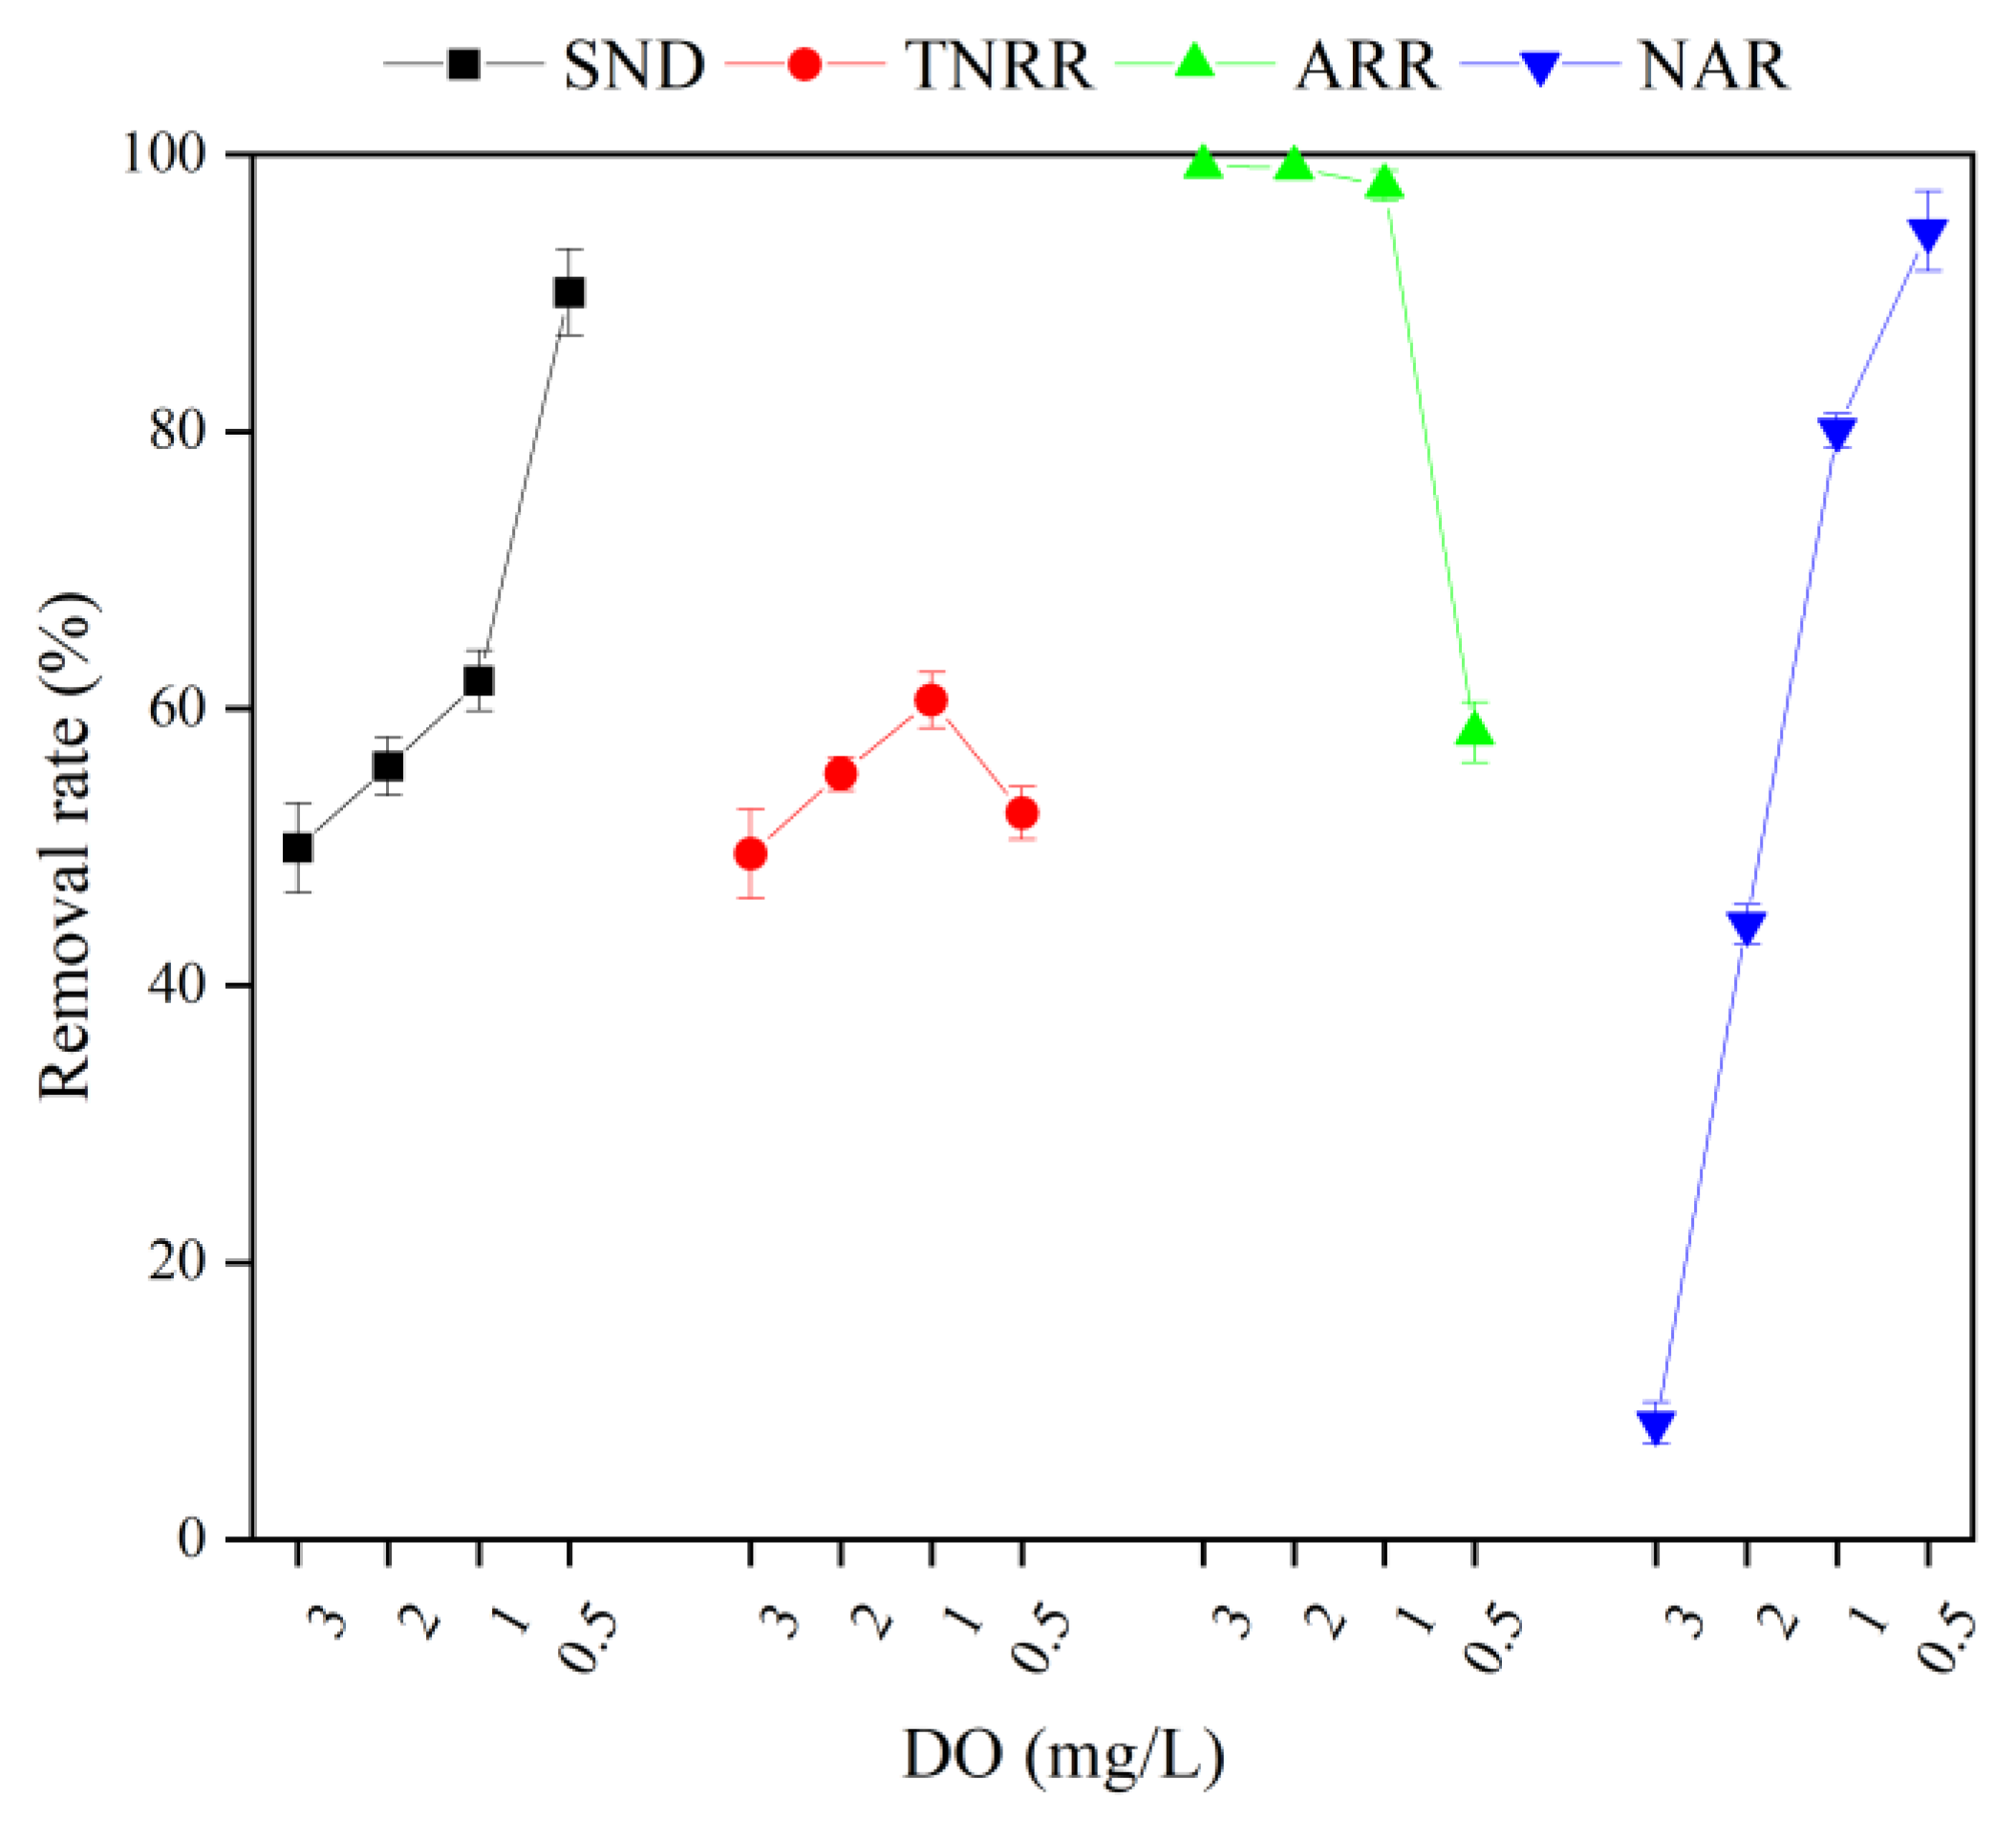
Effect of DO on the MBBR shortcut SND denitrification and regeneration.
At room temperature, the alkalinity dosage ratio was twice the theoretical dosage, C/N was controlled at 4, and the air and N2 inlet volumes were adjusted by rotameter to control the dissolved oxygen in the reactor at 3, 2, 1, and 0.5 mg/L, respectively, and the concentration changes in different forms of nitrogen in the MBBR were detected every 1 h. The NH 4 + -N, TN, NO 3 -N, -N, and DO were monitored per hour during the tests.

2.5. Water Quality Analysis Method

The effluent samples were taken in triplicate every time for the assessment of water quality parameters (mean ± SD follow). Referring to the Water and Wastewater Monitoring and Analysis Methods—Fourth Edition issued by the state environmental protection administration, the conventional water quality indicators such as NH 4 + -N, TN, NO 3 -N, NO 2 -N, COD, and pH were analyzed.

2.6. Detection and Calculation of Ceramsite Desorption Amount

The amount of bio-ceramsite was placed in a 500 mL conical flask with a stopper, which was sealed after adding 250 mL of NaCl regeneration solution with a mass concentration of 5% and shaken until complete desorption. The experiment was repeated three times. The concentration of ammonia nitrogen was measured and analyzed, and the amount of ammonia nitrogen desorbed by the bio-ceramsite was calculated. The NH 4 + -N desorbed amount per unit mass of bio-ceramsite was measured after washing the desorbed bio-ceramsite, dried in an oven at 105 °C to a constant weight, and weighed. Since the mass of packing in the MBBR system was previously known, the total amount of ammonia nitrogen desorbed in the reactor can be calculated as shown in Formula (1) and Formula (2).
  m NH 4 + - N des , bc , t = m ( NH 4 + - N ) des , bc , s m bc , s × m bc
  m NH 4 + - N des , bc = m NH 4 + - N des , bc , 0   -   m NH 4 + - N des , bc , t
where m ( NH 4 + - N ) des , bc , s is the amount of ammonia nitrogen desorbed from the sampled ceramsite at time t, mg; m bc , s is the mass of the sampled ceramsite after washing and drying at time t, g; m bc is the total mass of the reactor ceramsite, g; m ( NH 4 + - N ) des , bc , t is the total amount of ammonia nitrogen desorbed by reactor ceramsite at time t, mg; m ( NH 4 + - N ) des , bc , 0 is the total amount of ammonia nitrogen desorbed by reactor ceramsite at the initial time, mg; m ( NH 4 + - N ) des , bc is the total amount of ammonia nitrogen desorbed by reactor ceramsite, mg.

2.7. Calculation of Relevant Indicators for Each Stage

2.7.1. Adsorption Stage

(1)
Integral value of adsorption curve
  I = 0 t ( C ( NH 4 + - N ) eff ,   t -   C ( NH 4 + - N ) eff ,   0 ) dt
where I is the integral value of the adsorption curve, mg·h/L; C ( NH 4 + - N ) eff , t is the concentration of ammonia nitrogen in the effluent at time t, mg/L; C ( NH 4 + - N ) eff , 0 is the concentration of ammonia nitrogen in the effluent at the initial time, mg/L; t is the operating time of adsorption stage, h.
(2)
Accumulated ammonia nitrogen effluent
The accumulated ammonia nitrogen effluent can be calculated based on the integral value of the adsorption curve with the following formula.
  m NH 4 + - N eff = I   ×   Q
where m NH 4 + - N eff is the accumulated ammonia nitrogen effluent from the reactor, mg; Q is the flow rate, L/h.
(3)
Accumulated ammonia nitrogen influent
  V T = V + Q × t
m ( NH 4 + - N ) inf = V T   ×   C ( NH 4 + - N ) inf
where V T is the total volume of wastewater treated in the MBBR system, L; V is the reactor volume, which is the volume of wastewater added to the reactor at the initial time, 6 L; m ( NH 4 + - N ) inf is the accumulated ammonia nitrogen influent to the reactor, mg; C ( NH 4 + - N ) inf is the input ammonia nitrogen concentration, 26.2 mg/L (in N).
(4)
Ammonia volume load
  AVL = m ( NH 4 + - N ) inf V T   ×   t × 100 %
where AVL is ammonia volume load, mg/(L·h).

2.7.2. Shortcut SND Denitrification and Regeneration Stage

(1)
Theoretical alkalinity dosage
Generally speaking, in the SND process, for every 1 g NH 4 + -N oxidized by nitrifying functional bacteria in terms of CaCO3, 7.14 g of alkalinity needed to be consumed; for every 1 g NO X -N restored by denitrifying functional bacteria, only 3.57 g of alkalinity can be produced [27]. The consumption of alkalinity for the nitrification reaction needed to be supplemented by the addition of NaHCO3 during the stage of denitrification and regeneration in the reactor, and the theoretical alkalinity (ALK) can be calculated with the following formula.
ALK = 7 . 14   ×   m ( NH 4 + - N ) total - 3 . 57   ×   COD   ×   1 . 68
  m ( NH 4 + - N ) total = m ( NH 4 + - N ) ) inf - m ( NH 4 + - N ) ) eff
where ALK is the theoretical alkalinity (in terms of NaHCO3), mg; m ( NH 4 + - N ) total is the total amount of NH 4 + -N accumulated in the reactor during the adsorption stage, mg; 1.68 is the conversion factor of NaHCO3 and CaCO3 that the alkalinity produced by the addition of 1.68 g NaHCO3 is equal to that of 1 g CaCO3.
(2)
Simultaneous nitrification and denitrification rate
The SND rate can be used to express the efficiency of the shortcut SND denitrification and regeneration of functional ceramsite. Considering the minimal role of microorganisms in assimilating ammonia nitrogen to synthesize their own substances during the reaction, the formula for calculating the SND rate proposed by Subtil et al. [28] can be simplified, as shown in the following formula.
  SND = 1 - m ( NO x - - N ) pro m ( NH 4 + - N ) re × 100 %
m NH 4 + - N re = m NH 4 + - N des ,   bc + m NH 4 + - N rs ,   0 - m NH 4 + - N rs ,   t
where m ( NO x - - N ) pro is the sum of NO 2 -N and NO 3 -N produced during the reaction, mg; m ( NH 4 + - N ) re is the amount of oxidized ammonia nitrogen, mg; m ( NH 4 + - N ) re , 0 is the amount of ammonia nitrogen in the liquid phase of the reactor at the start, mg; m NH 4 + - N rs , t is the amount of ammonia nitrogen in the liquid phase of the reactor at time t, mg.
(3)
Nitrite accumulation ratio
The nitrite accumulation ratio (NAR) of the shortcut SND denitrification and regeneration process can be expressed by the following formula.
  NAR = m ( NO 2 - - N ) pro m ( NO X - - N ) pro × 100 %
where m ( NO 2 - - N ) pro is the amount of NO 2 -N produced by the simultaneous nitrification and denitrification process, mg.
(4)
Total nitrogen removal rate
The total nitrogen removal rate (TNRR) of the shortcut SND denitrification and regeneration process can be expressed by the following formula.
  TNRR = m ( NH 4 + - N ) re - m ( NO x - - N ) pro m NH 4 + - N des ,   bc + m NH 4 + - N rs ,   0 × 100 %
(5)
Ammonia removal rate
The ammonia removal rate (ARR) of the shortcut SND denitrification and regeneration process can be expressed by the formula below.
ARR = 1 - m NH 4 + - N rs ,   t m NH 4 + - N des ,   bc + m NH 4 + - N rs ,   0
(6)
Regeneration rate of bio-ceramsite
The regeneration rate η of bio-ceramsite in the shortcut SND stage can be calculated by the following formula.
  η = m ( NH 4 + - N ) des ,   bc m ( NH 4 + - N ) ads ,   bc   ×   100 %
m ( NH 4 + - N ) ads ,   bc = m ( NH 4 + - N ) inf - m ( NH 4 + - N ) eff - m NH 4 + - N rs ,   t          
where m ( NH 4 + - N ) ads , bc is the total amount of ammonia nitrogen adsorbed by the ceramsite in the biological part of the reactor during the adsorption stage, mg.
(7)
Average regeneration speed of bio-ceramsite at 12 h
The 12 h average regeneration speed s of bio-ceramsite in the shortcut SND stage can be calculated by the following formula.
s = m ( NH 4 + - N ) des ,   bc t r
where t r is the regeneration time, 12 h.
(8)
FA concentration
The concentration of FA is mainly determined by pH, temperature, and ammonia nitrogen concentration. It can be calculated by the following formula.
FA = 17 14   ×   C ( NH 4 + - N ) rs × 10 pH e 6344 273 + T + 10 pH
where C ( NH 4 + - N ) rs is NH 4 + -N concentration in the liquid phase of the reactor, mg/L; T is the temperature in the liquid phase of the reactor, °C.

2.8. Statistical Analysis

One-way ANOVA followed by Tukey’s post hoc test was used for statistical analysis. Data are presented as means ± SD (n = 3). Results were considered statistically significant when p < 0.05. All statistics were conducted in SPSS 19.0 (IBM, Akmo, NY, USA). The figures were made with Origin 2021 software (OriginLab, Northampton, MA, USA).

3. Results and Discussion

3.1. Study on the Operational Performance at the MBBR Adsorption Stage

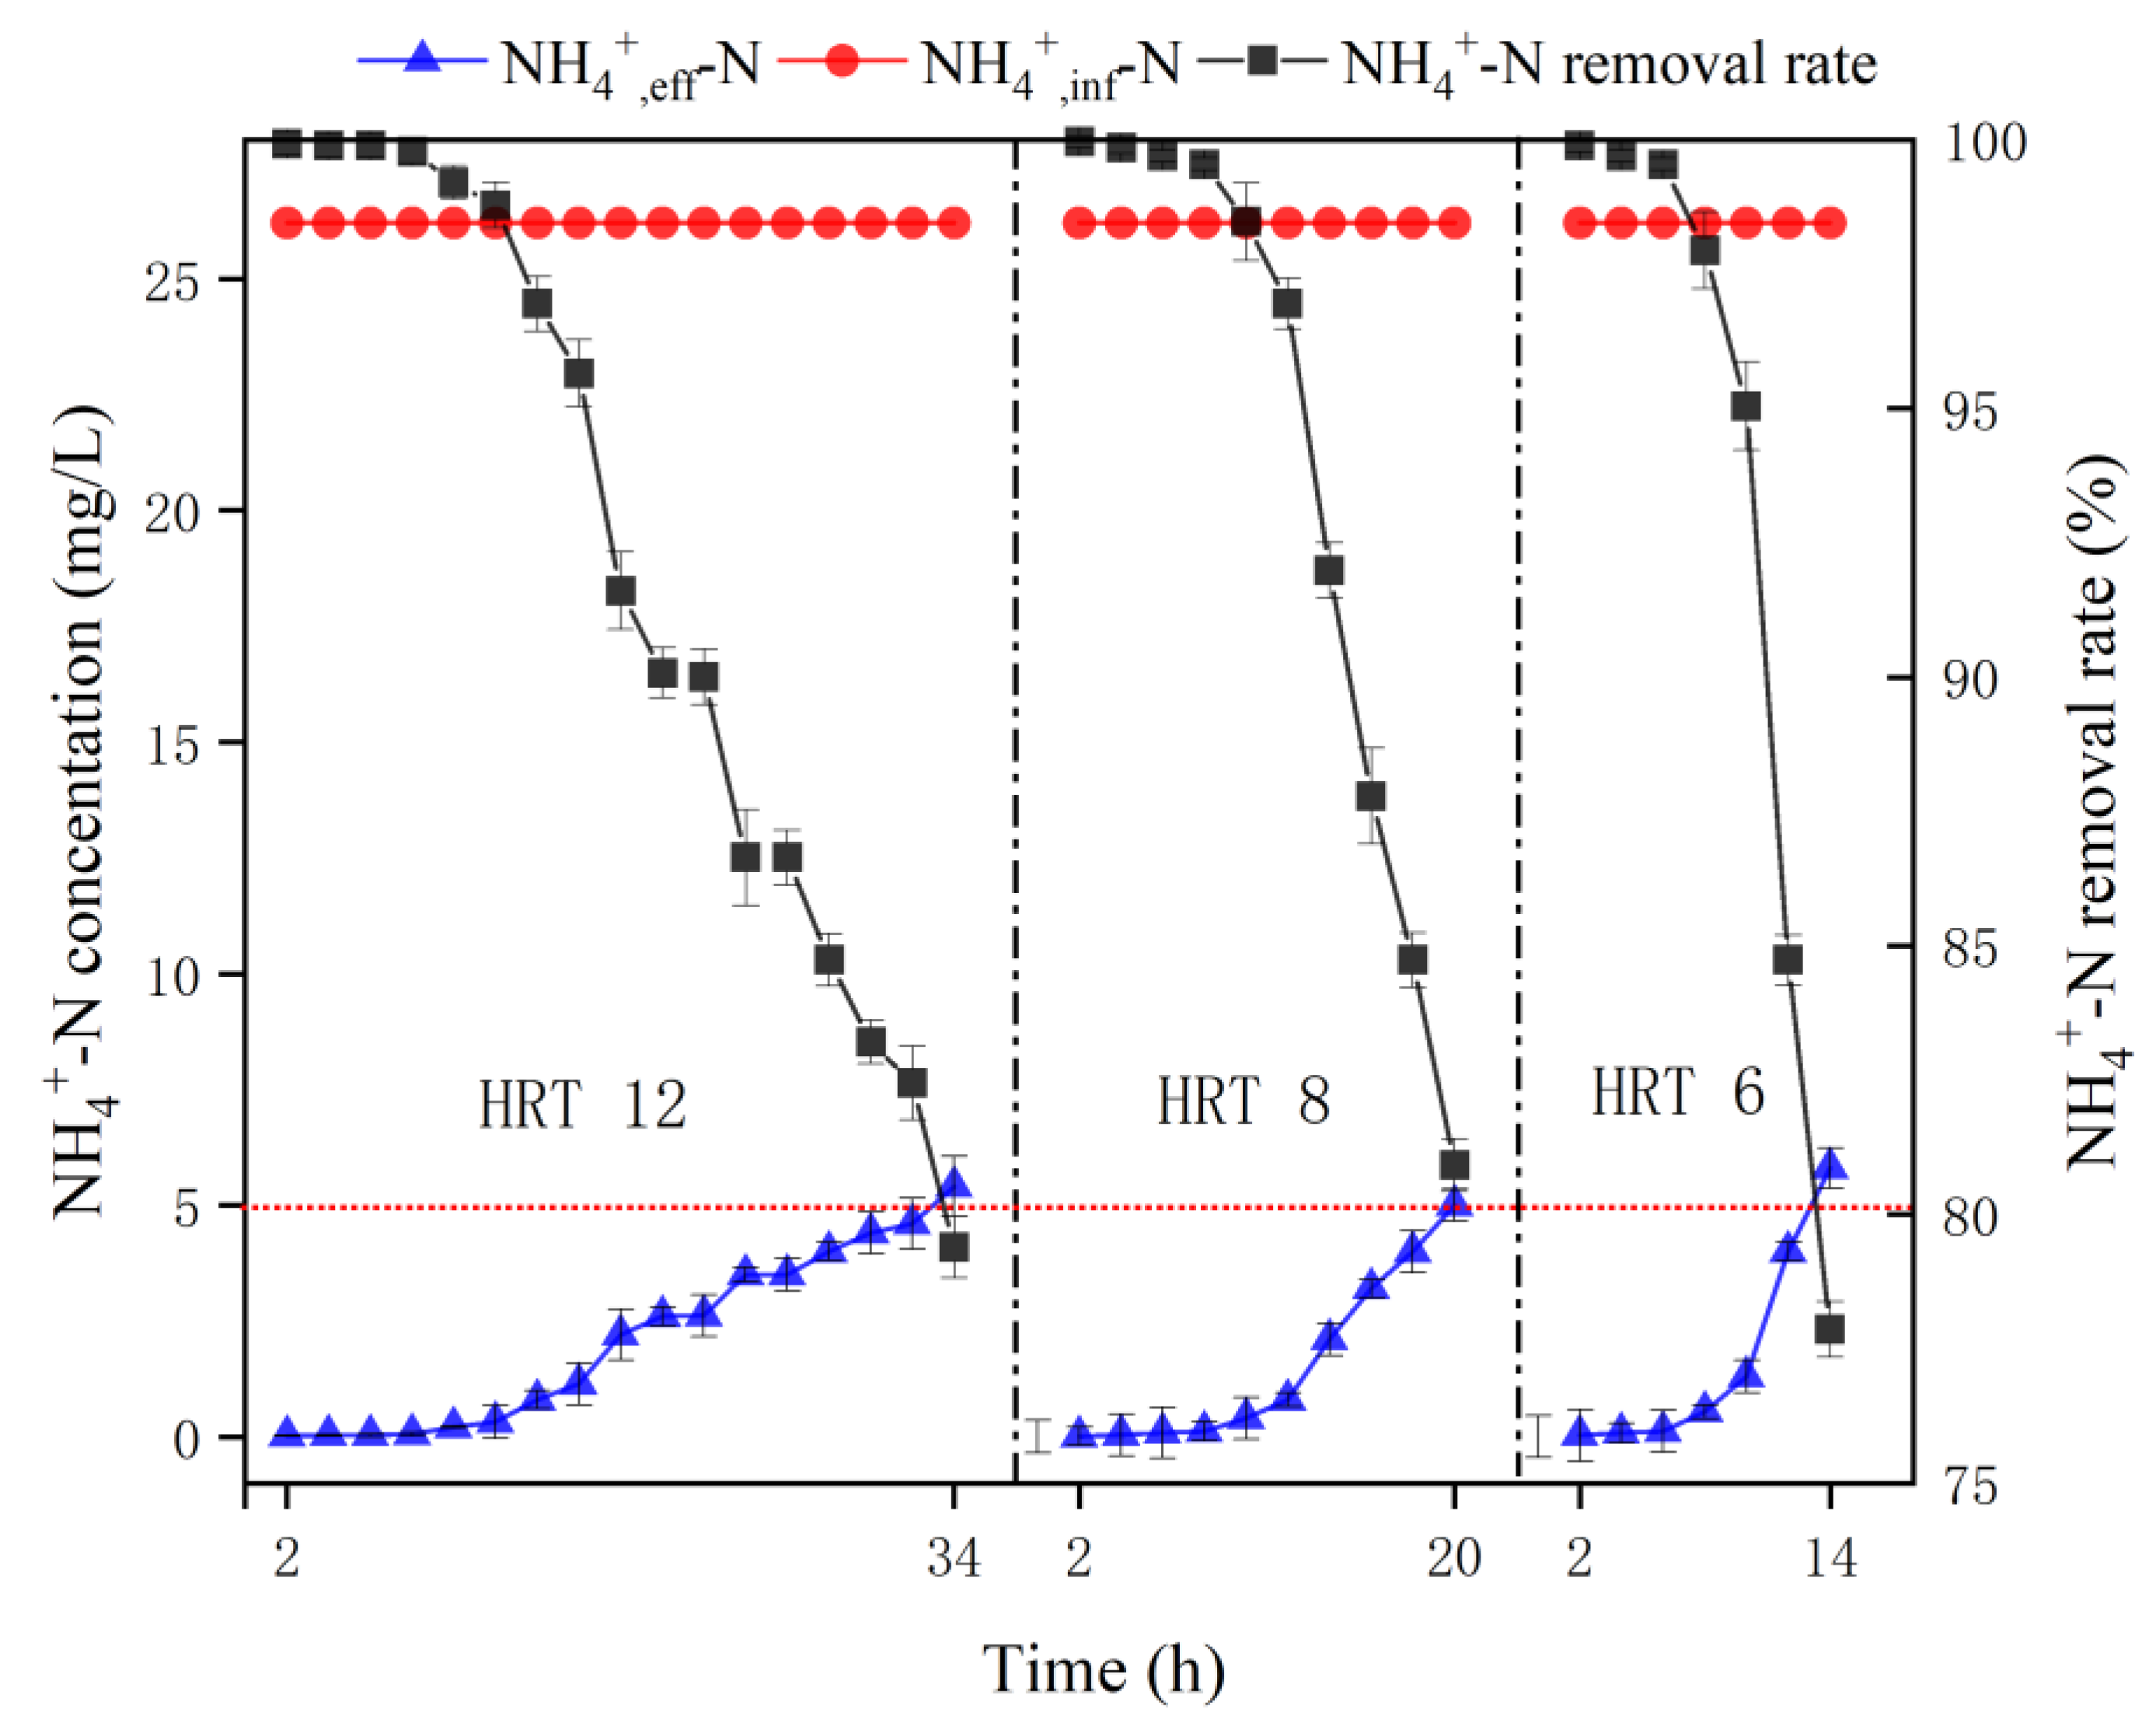
3.1.1. Effect of Hydraulic Retention Time on the Adsorption Performance of the MBBR

In the adsorption stage, the adsorption breakthrough curves of the MBBR treating NH 4 + -N wastewater with a concentration of 26.2 mg/L under different HRT conditions are shown in Figure 2. As can be seen from Figure 2, the breakthrough point for NH 4 + -N adsorption was ≤5 mg/L, and the breakthrough times were 34th, 20th, and 14th h for HRT of 12, 8, and 6 h, respectively. It can be concluded that the shorter the HRT, the shorter the adsorption breakthrough time of ammonia nitrogen, which is probably due to the fixed adsorption capacity of bio-ceramsite. The shorter the HRT, the higher the input flow rate and the larger the input ammonia nitrogen, which can exceed the ammonia nitrogen adsorption capacity of the reactor ceramsite in a short period of time.
The influent and effluent NH 4 + -N data of the whole adsorption process under different HRT conditions were collected, and the integral value of adsorption curves, accumulated NH 4 + -N effluent, accumulated NH 4 + -N influent, unit adsorption capacity of bio-ceramsite, and NH 4 + -N volume load were calculated by the relevant formulas, and the results are shown in Table 2.
It can be seen from the data that the differences in unit adsorption quantity and NH 4 + -N volume load between different HRT were significant. The longer the HRT, the larger the accumulated NH 4 + -N adsorption, implying that the longer the contact time with the wastewater, the closer the adsorption capacity of per unit bio-ceramsite is to the saturation adsorption capacity; the shorter the HRT, the larger the flow rate and the faster the packing failure. However, the efficiency of the reactor in treating ammonia nitrogen was different under different HRT conditions. The shorter the HRT, the greater the NH 4 + -N volume load, which means the stronger NH 4 + -N treatment capacity of the MBBR per unit time. Considering the effect of HRT on the unit adsorption quantity of bio-ceramsite and the NH 4 + -N volume load, the optimal HRT for the adsorption stage would be 8 h.

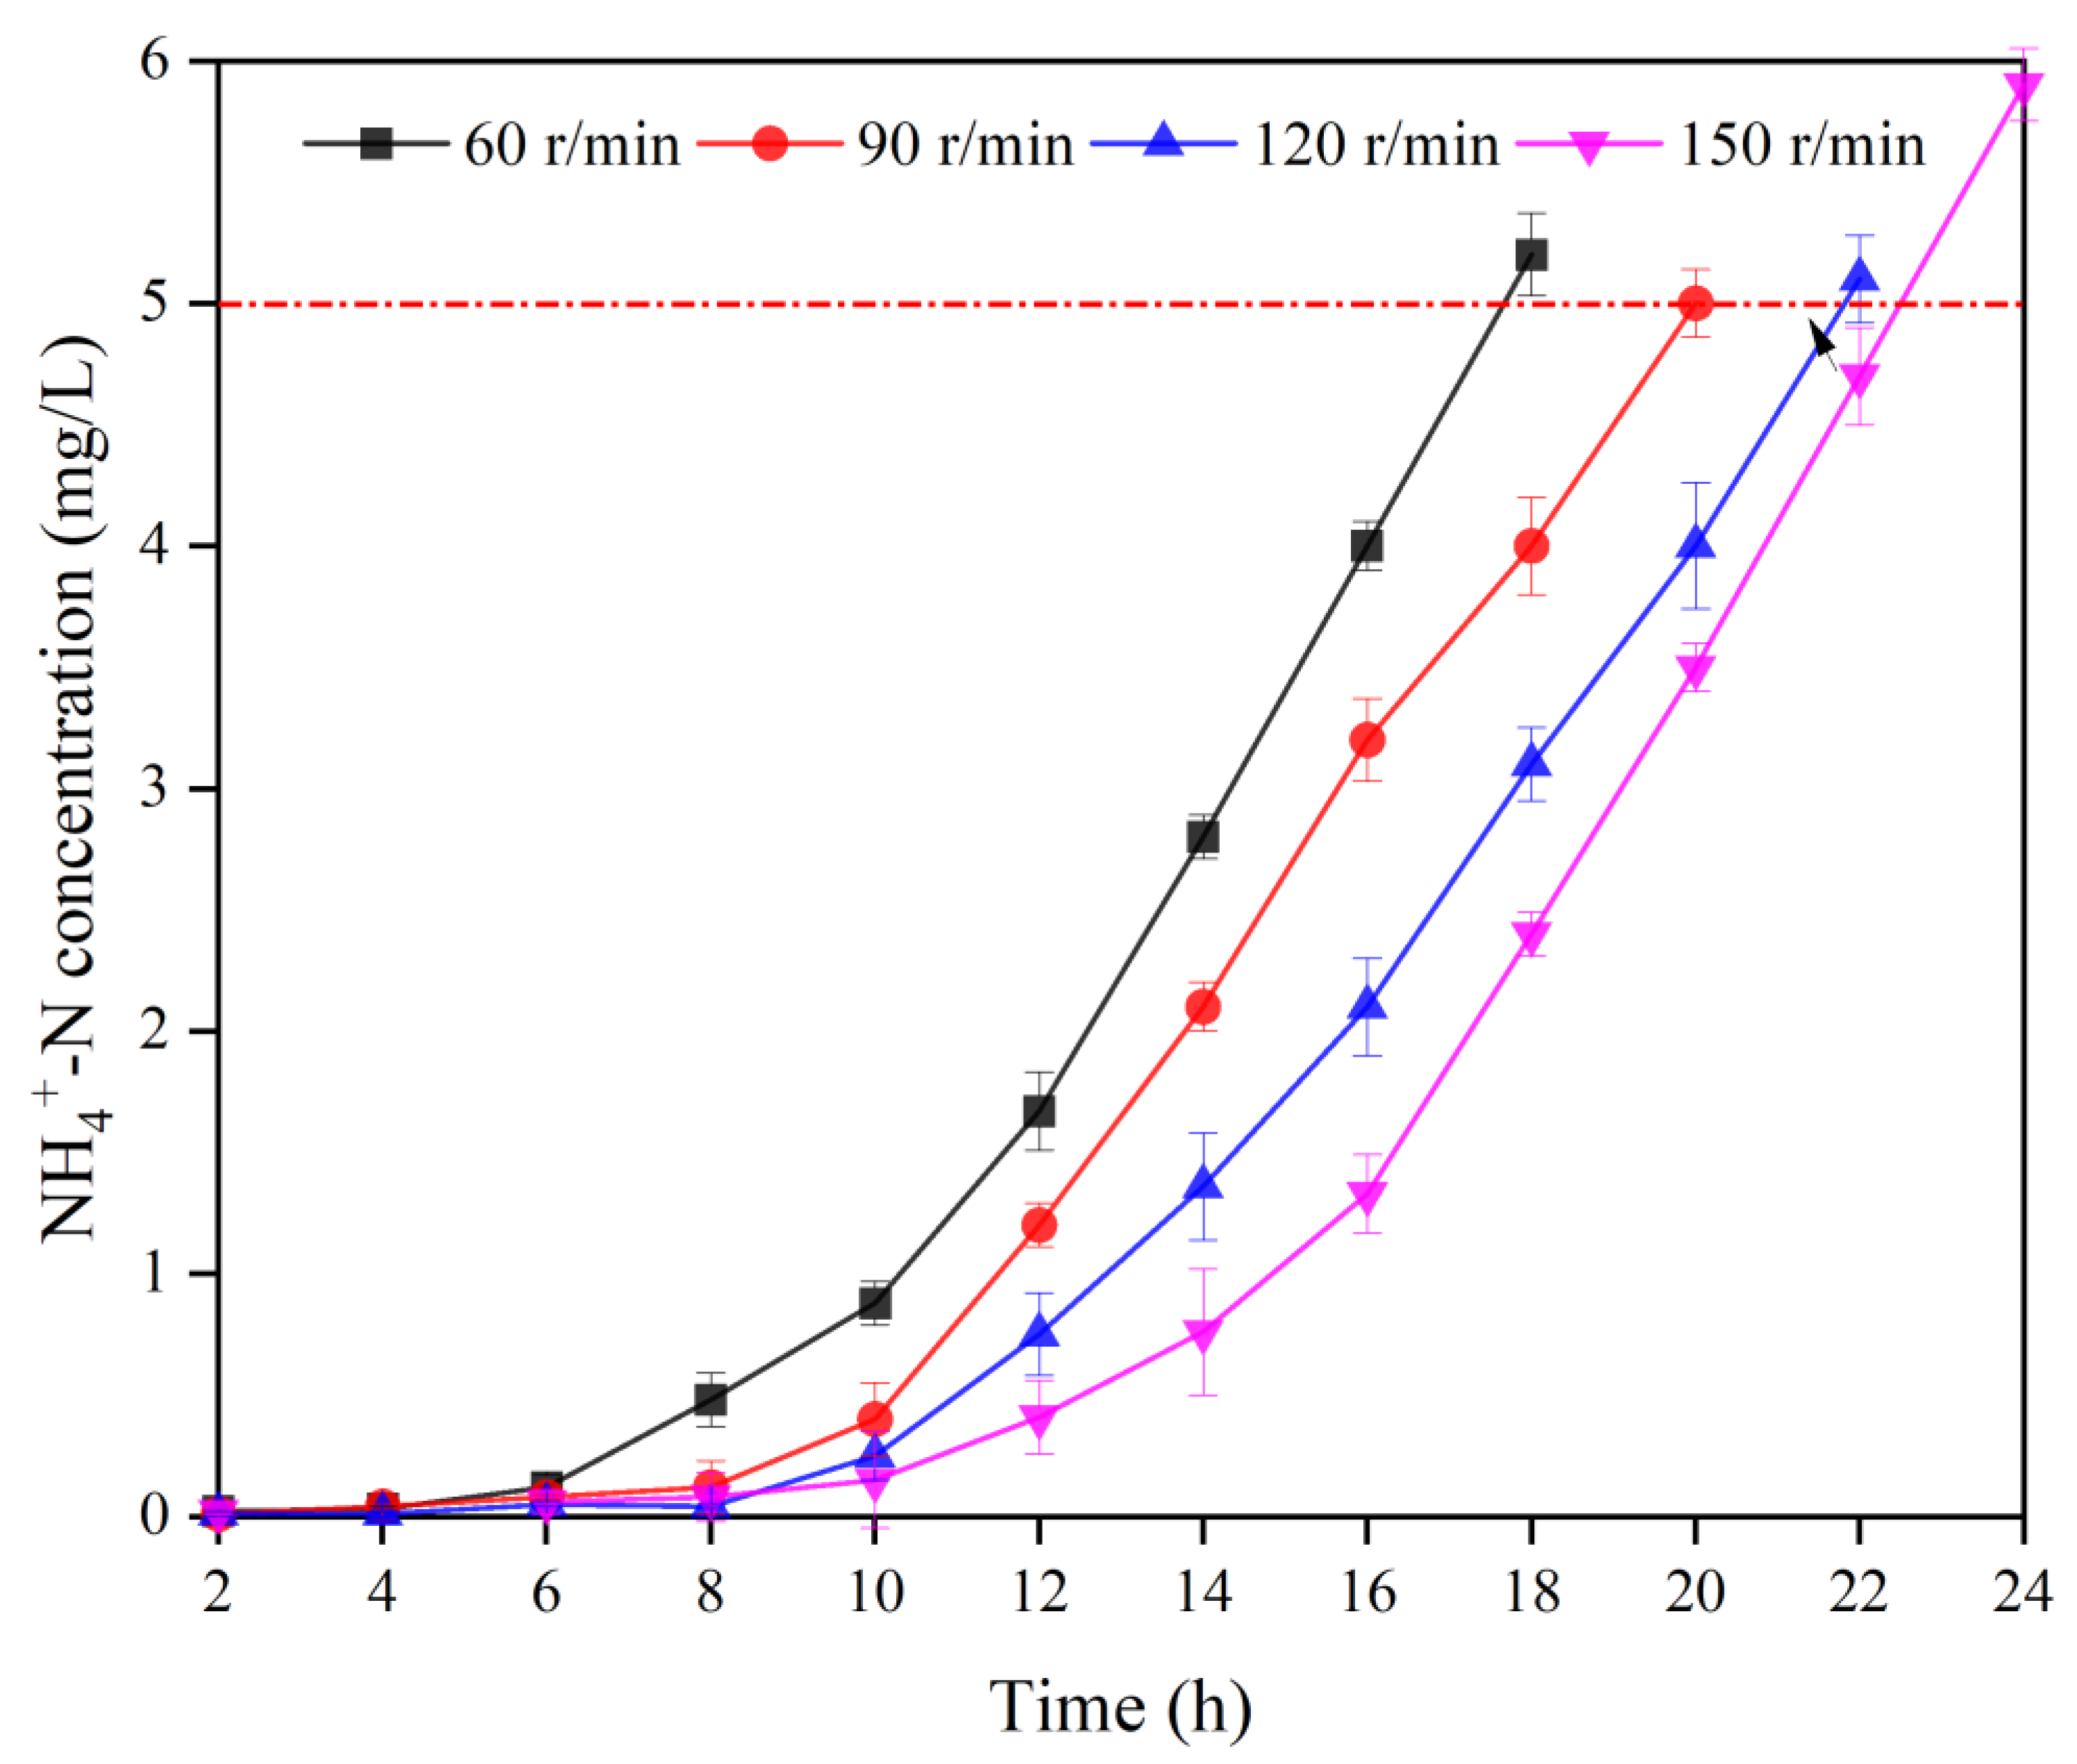
3.1.2. Effect of Stirring Speed on the Adsorption Performance of the MBBR

The adsorption breakthrough curves of NH 4 + -N wastewater at 26.2 mg/L treated with the MBBR with different stirring speeds are shown in Figure 3.
As can be seen, the concentration of ammonia nitrogen in the effluent of the MBBR was quite low in the early stage of adsorption, and it gradually increased with time. The threshold of ammonia nitrogen effluent was exceeded at the 18th, 20th, 22nd, and 24th h for each treatment, respectively. The increase in ammonia nitrogen concentration, on the one hand, was due to the gradual saturation of bio-ceramsite at the later stage of adsorption. On the other hand, the rate of ammonia nitrogen influent exceeded the rate of ammonia nitrogen adsorption by the bio-ceramsite.
The influent and effluent NH 4 + -N data of the whole adsorption process under different stirring speeds were collected, and the results are shown in Table 3.
The data in Table 3 show that the differences in unit adsorption quantity and NH 4 + -N volume load between different stirring intensities were significant. When the stirring speed increased from 60 r/min to 150 r/min, the unit adsorption quantity of bio-ceramsite in the adsorption stage of the MBBR increased from 0.9354 mg/g to 1.1546 mg/g, and the operating time of the reactor increased from 18 h to 24 h. The adsorption of NH 4 + -N by bio-ceramsite complex includes physical adsorption and chemical adsorption processes [29]. The physical adsorption was performed by the Waals force, electrostatic attraction, and intermolecular forces between NH 4 + -N and the bio-ceramsite, while the chemical adsorption was based on the ionic exchange of cations in the skeletal structure of the ceramsite zeolite component with NH 4 + in solution [30]. To achieve the ionic exchange between NH 4 + with the cations in the ceramsite zeolite component, it was necessary to pass through the biofilm layer on the surface of the ceramsite, the cavities on the ceramsite and the pore channels in the ceramsite zeolite component, etc. [31]. The biofilm wrapped on the surface of the carrier reduced the mass transfer rate of NH 4 + . Increasing the stirring speed increased the perturbation of the biofilm, which was conducive to the diffusion of NH 4 + through the biofilm into the pore channels inside the ceramsite and further promoted the intermolecular diffusion of NH 4 + in the ceramsite zeolite component, thus increasing the rate and ammonia nitrogen adsorption capacity of bio-ceramsite. However, it can be seen that after the stirring speed exceeded 120 r/min, the time of both exceeding the adsorption threshold was very close, indicating that the stirring speed of 150 r/min had a limited effect on the enhancement of ammonia nitrogen adsorption capacity of bio-ceramsite, and the violent stirring might intensify the collision between suspended ceramsite and shorten the service life of ceramsite. Therefore, it can be concluded that 120 r/min would be the optimal stirring speed.

3.2. Study on the Operational Performance at MBBR Shortcut SND Denitrification and Regeneration Stage

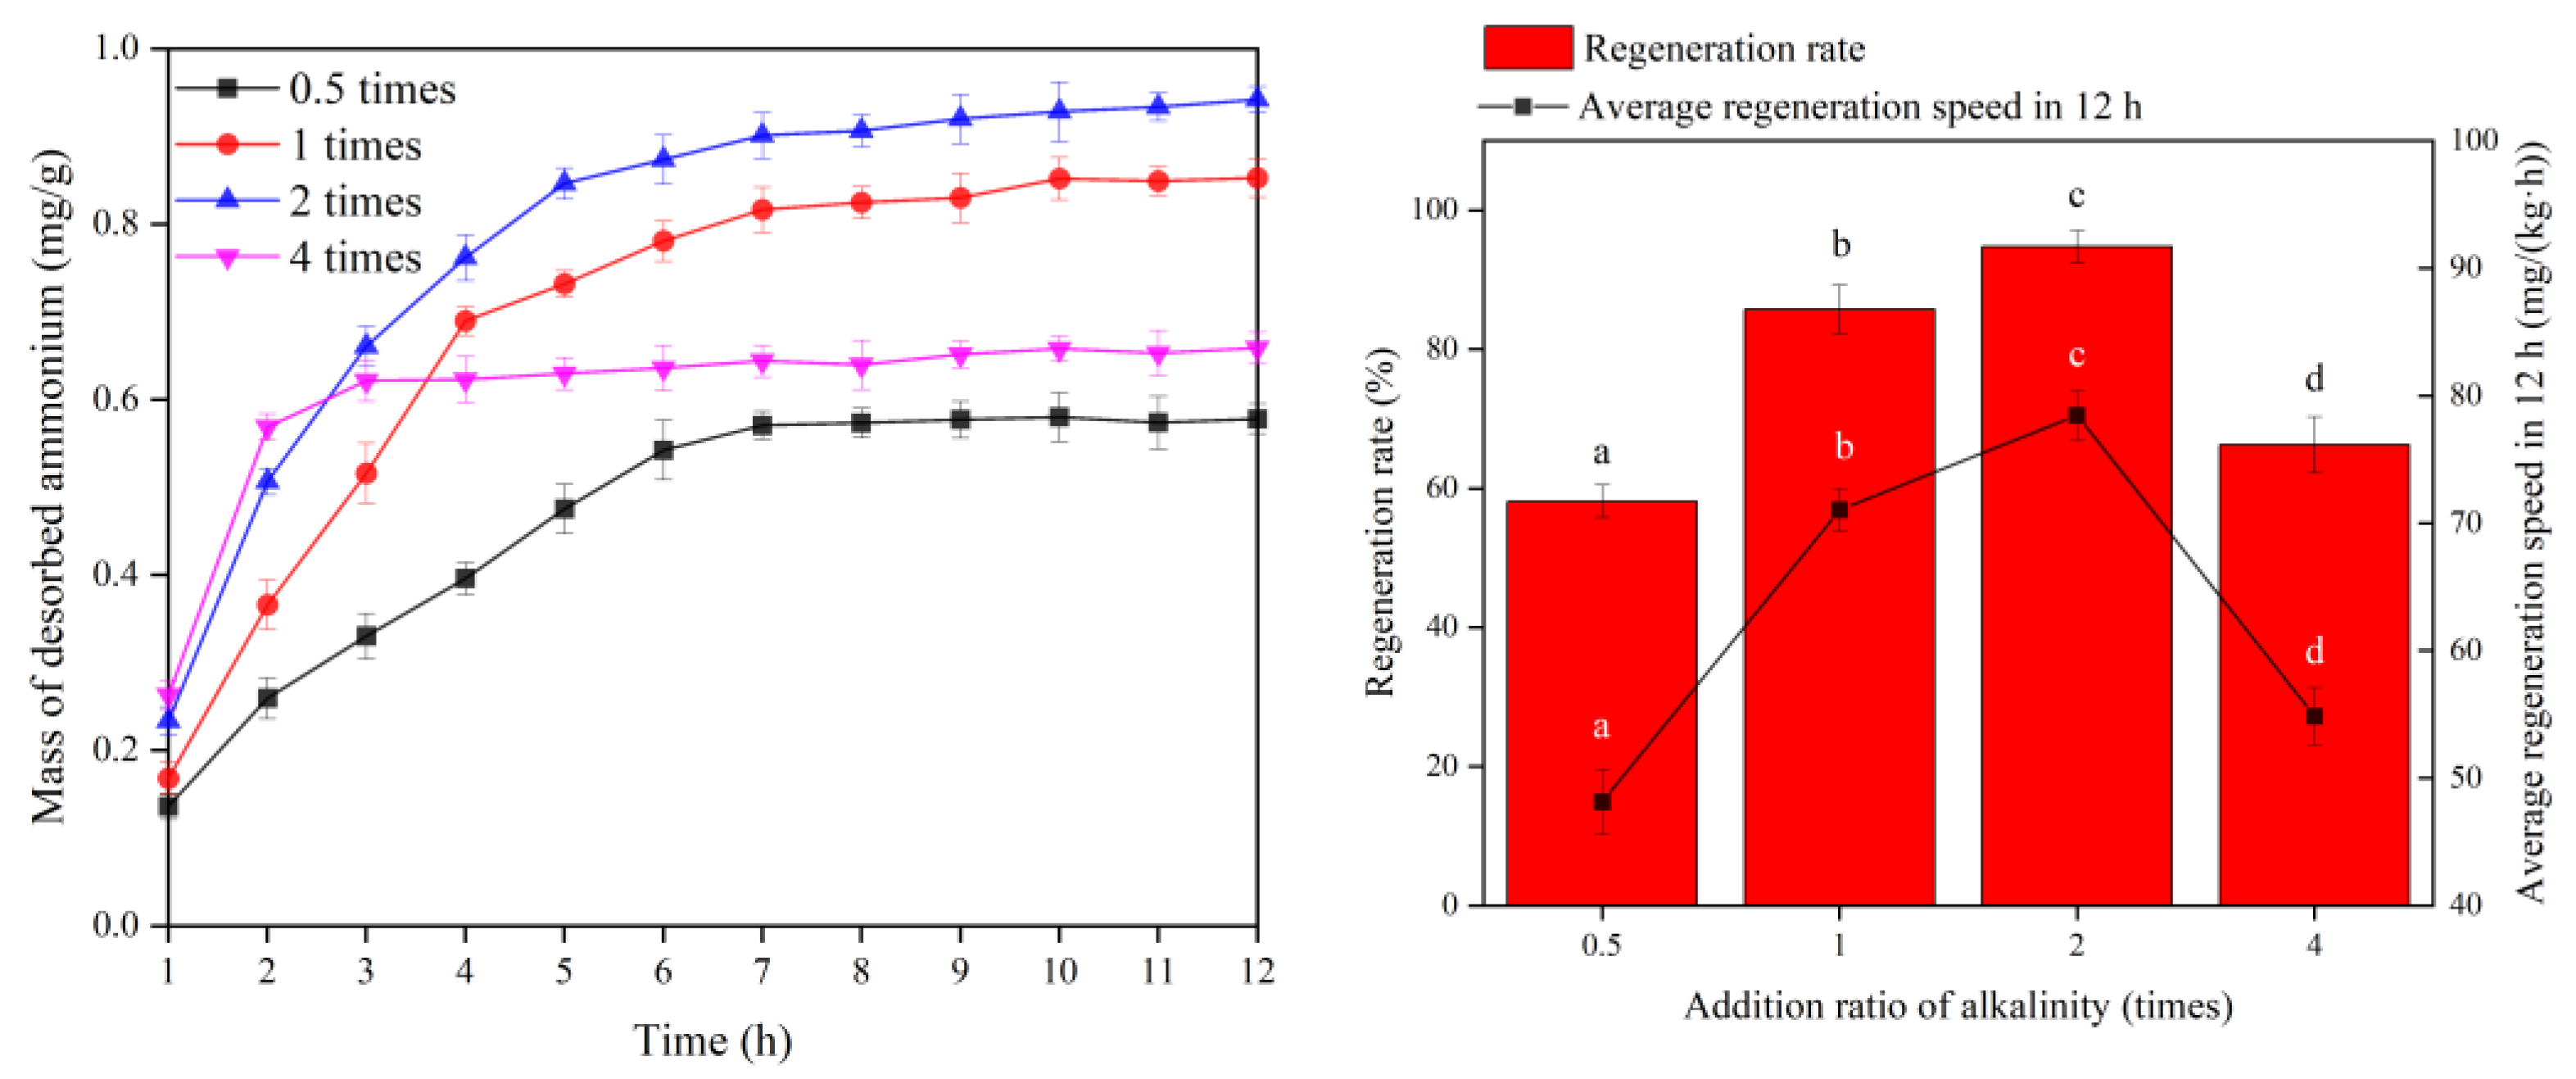
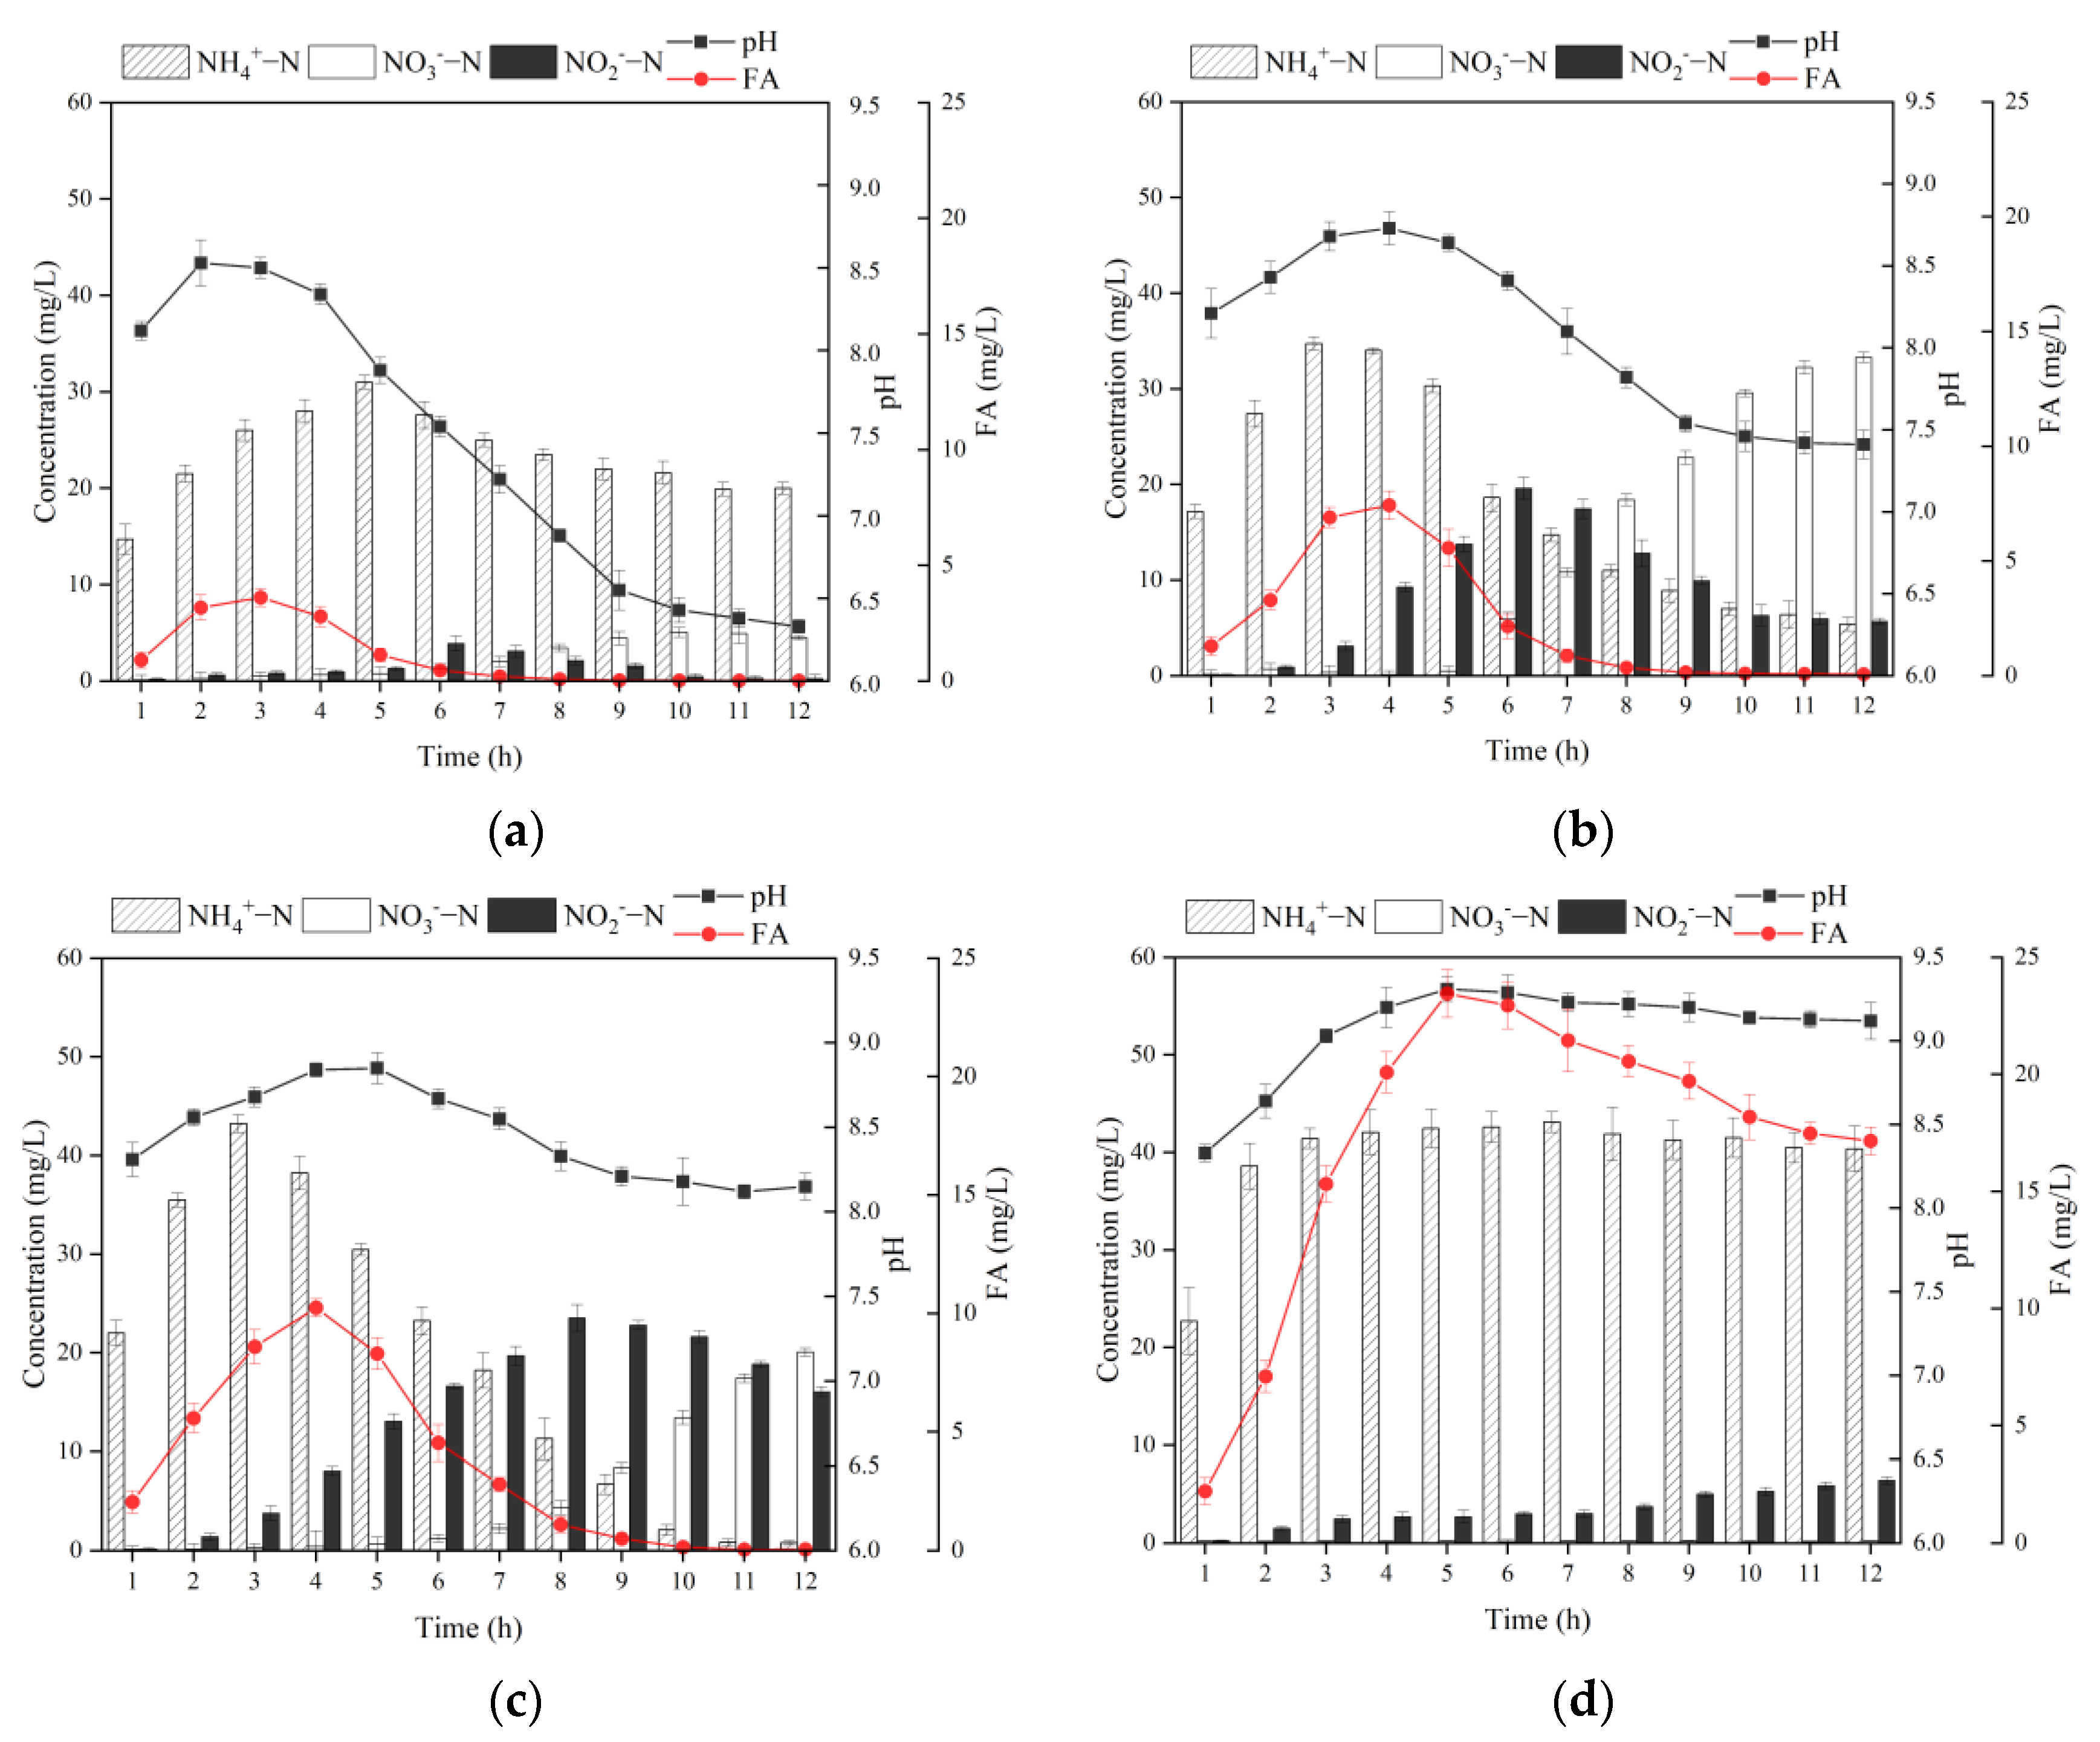
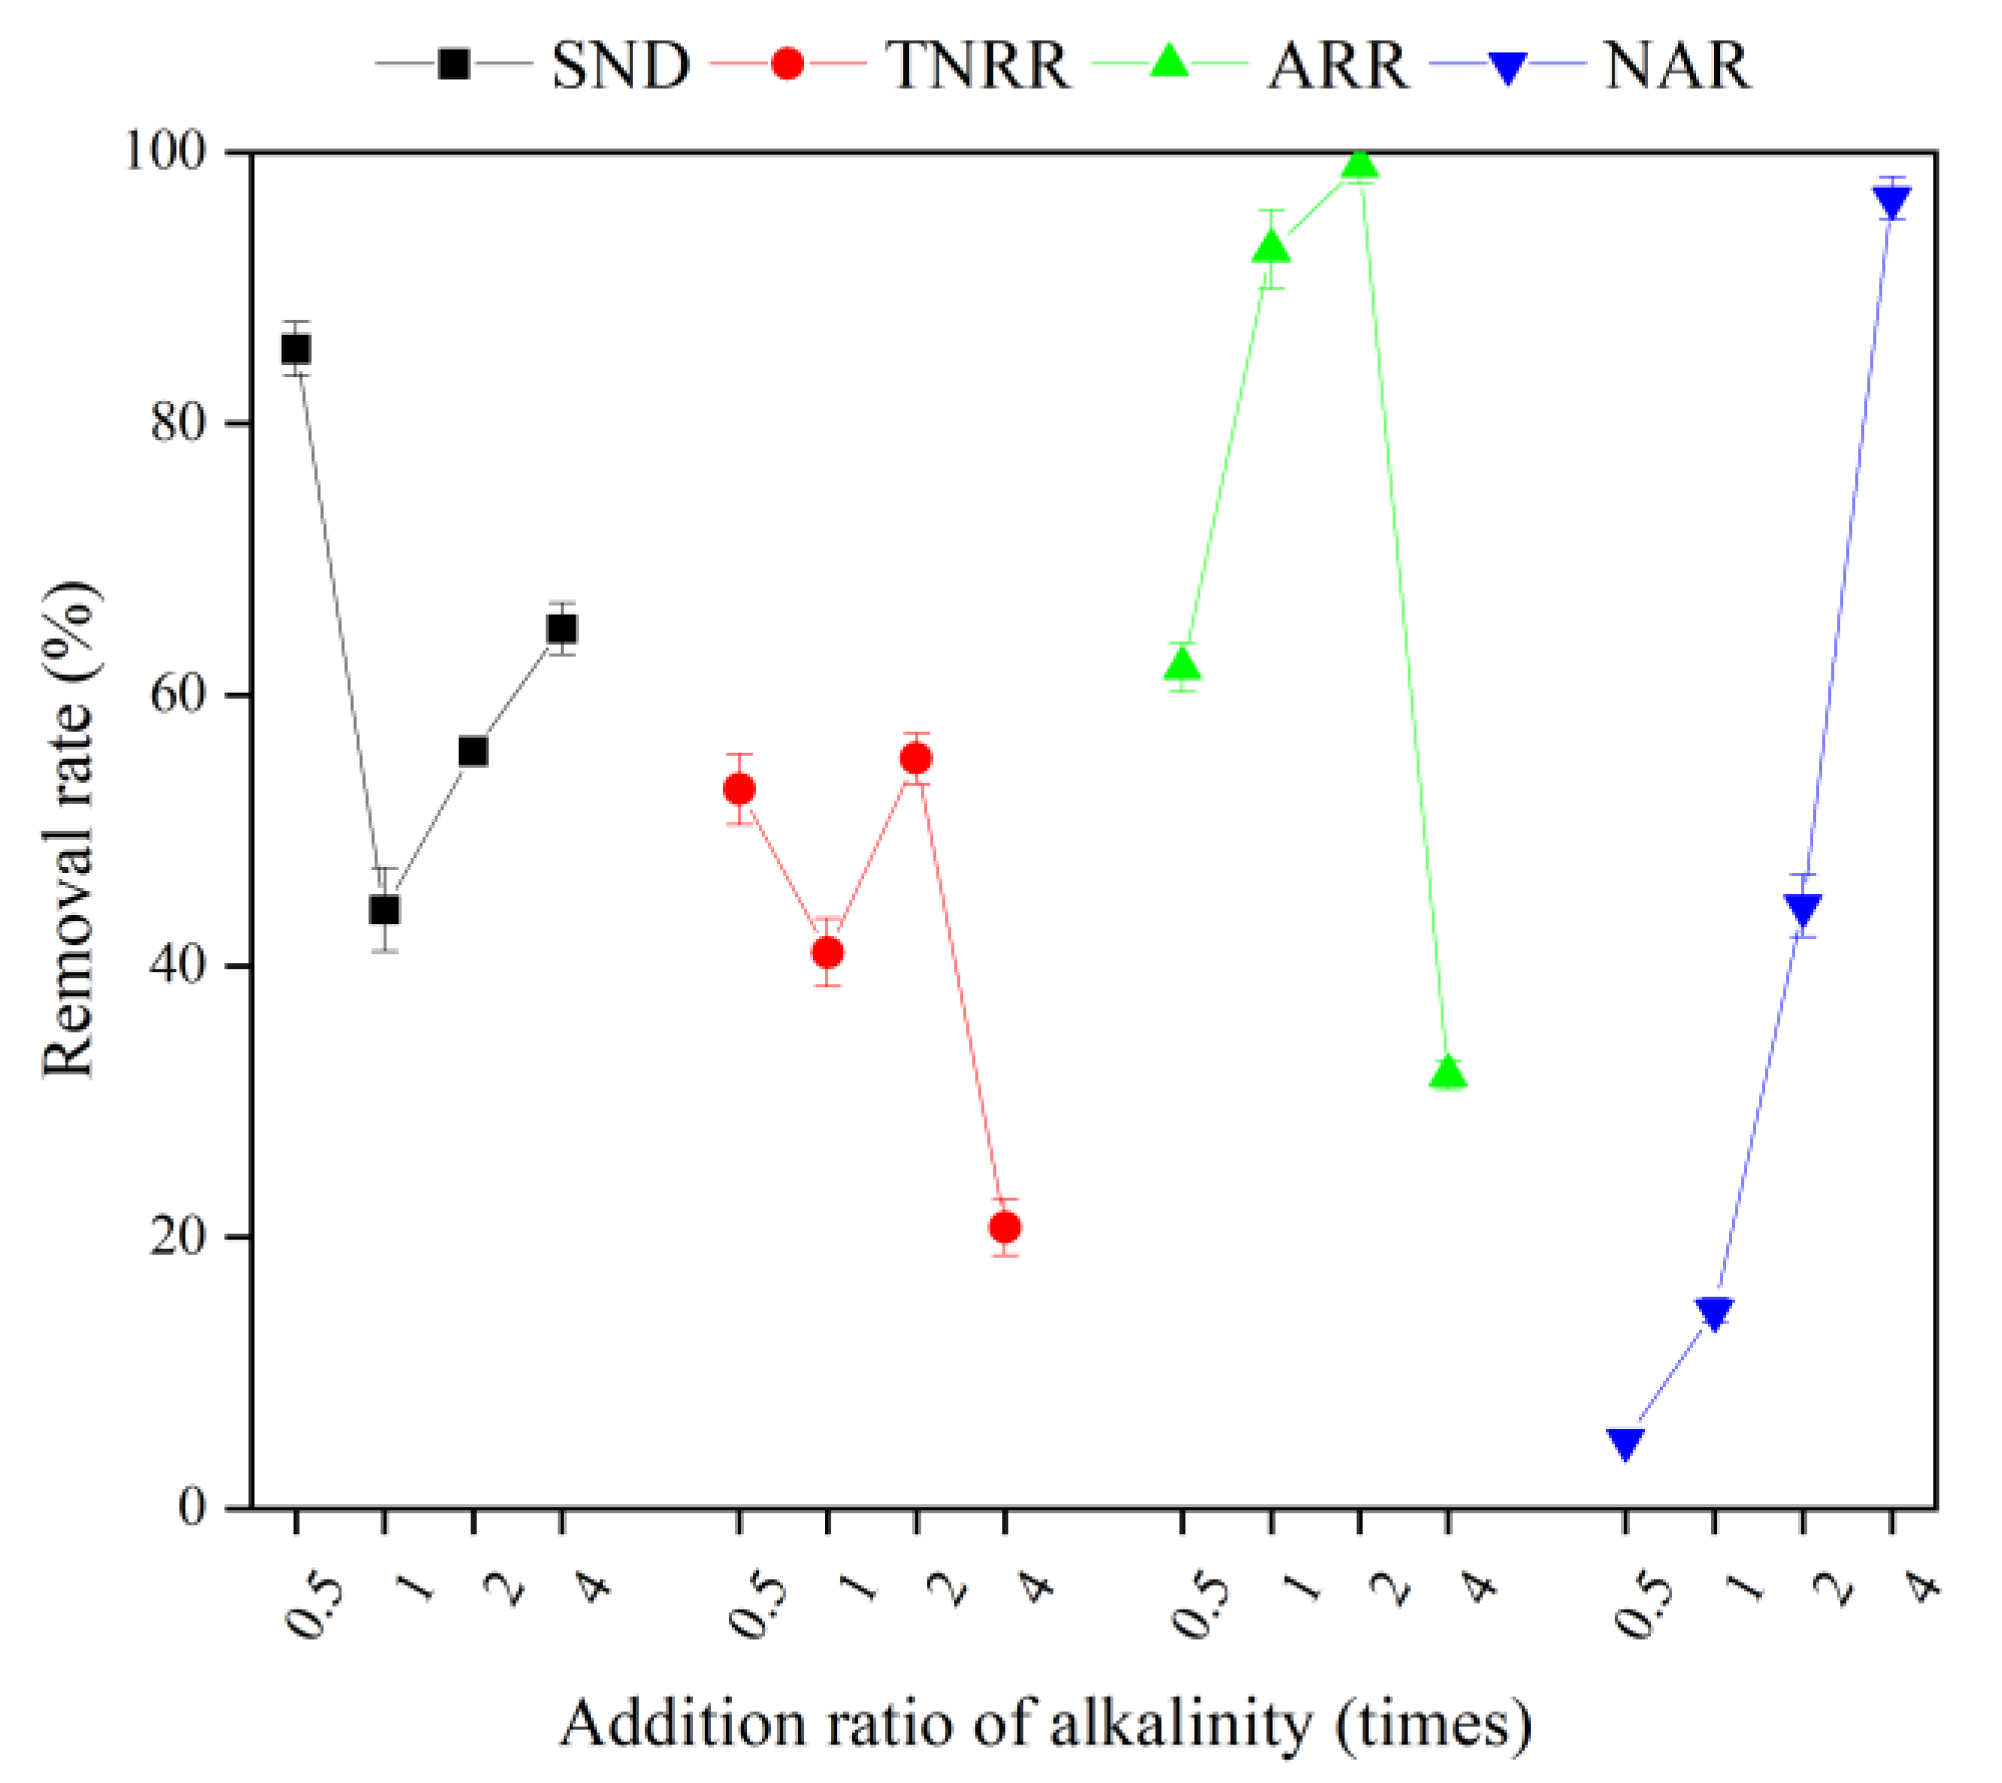
3.2.1. Effect of Alkalinity Dosage Ratio on MBBR Shortcut SND Denitrification and Regeneration

Desorption of ammonia nitrogen adsorbed on ceramsite is a prerequisite for the MBBR to proceed to the next adsorption operation. In this study, the biofilm attached to the ceramsite was used for regeneration by a shortcut SND process. In this process, NaHCO3 not only supplies the alkalinity to the nitrification reaction but also replaces the ammonia nitrogen adsorbed by the zeolite component of ceramsite via ion exchange, which acts as a chemical regeneration for the bio-ceramsite. Figure 4 shows the effect of the regeneration of bio-ceramsite with different alkalinity addition ratios.
The ammonia nitrogen desorption amount per unit ceramsite was 0.5780 mg/g at 0.5 times alkalinity, and the regeneration rate and average regeneration speed in 12 h of ceramsite were 58.1% and 48.16 mg/(kg·h), respectively. At 1 time alkalinity, the ammonia nitrogen desorption of ceramsite was 0.8527 mg/g, and the regeneration rate and average regeneration speed in 12 h of per unit ceramsite were 85.8% and 71.06 mg/(kg·h), respectively. With an alkalinity of 2 times, the ammonia nitrogen desorption per unit ceramsite was 0.9418 mg/g, and the regeneration rate and average regeneration speed in 12 h of ceramsite were 94.8% and 78.49 mg/(kg·h), respectively. The unit desorption quantity of bio-ceramsite was 0.6588 mg/g with 4 times alkalinity, and the regeneration rate and average regeneration speed in 12 h of ceramsite were 66.3% and 54.89 mg/(kg·h), respectively. The differences in regeneration rate and average regeneration speed for 12 h between different addition ratios of alkalinity were significant.
From the above results, it can be seen that different alkalinity addition ratios are closely related to the desorption of ammonia nitrogen adsorbed by ceramsite. In the range of 0.5–2 times alkalinity, the larger the alkalinity addition ratio, the faster the desorption rate of ammonia nitrogen adsorption by zeolite component in ceramsite, and the larger the desorption amount per unit of ammonia nitrogen. However, the desorption amount and rate of the regeneration process of ceramsite with 4 times alkalinity did not conform to the above rule and the desorption quantity and rate of which were only higher than 0.5 times alkalinity. After adding NaHCO3, the desorption of ammonia nitrogen adsorbed by zeolite component in ceramsite is a biochemical desorption process, according to the study of Han et al. [32]; the process can be described by the following equation.
  Z NH 4 + + NaHCO 3 ion   exchange Z Na + + NH 4 + + HCO 3 -
NH 4 + + 2 O 2 nitrification NO 3 - + 2 H + + H 2 O
  Z NH 4 + + 2 O 2 + NaHCO 3 ion   exchange   &   nitrification Z Na + + Na + + NO 3 - + 3 H 2 O + NH 4 + + CO 2
From the above equation, it can be seen that the desorption of ammonia nitrogen from ceramsite requires the presence of a certain concentration of “Na+ pump” in the liquid phase of the MBBR to displace NH 4 + . From 0.5 to 4 times of alkalinity, the concentration of Na+ in the solution gradually increases with the increase in alkalinity addition ratio, which promotes the ion exchange between Na+ in the liquid phase and NH4+ adsorbed by the zeolite component in the ceramsite. At 4 times alkalinity, the regeneration rate of the reactor pre-operation period was higher due to the larger amount of NaHCO3 input, but excessive alkalinity input would inhibit the activity of nitrifying functional bacteria, resulting in the desorbed NH 4 + -N cannot be further oxidized. In addition, the NH 4 + concentration in the liquid phase is high, which increases the mass transfer resistance of NH 4 + from the solid phase to the liquid phase, further inhibiting the desorption of ammonia nitrogen adsorbed [33]. At 0.5 times alkalinity, the concentration of Na+ in the liquid phase is relatively low, which causes the difficulty of ion exchange, so microorganisms can only use the ammonia nitrogen desorbed from the outer layer of the ceramsite; also, the alkalinity of the nitrification reaction is insufficient, which leads to the worst regeneration effect of the ceramsite [34]. Compared to other alkalinity addition ratios, the reactor with 2 times alkalinity not only has enough “Na+ pump” to exchange ions with the NH 4 + adsorbed by the ceramsite, but can also meet the alkalinity consumption of the nitrification reaction, so the reactor with 2 times alkalinity has the best regeneration effect of denitrification. Accordingly, the regeneration of bio-ceramsite is accomplished by both ion exchange and biological nitrification. The concentration of Na+ determines the initial desorption performance, while the nitrifying bacteria stimulate the further desorption of ammonia nitrogen adsorbed by bio-ceramsite in the later stage.
The trends of each form of nitrogen, pH, and FA in MBBR with different alkalinity addition ratios and the performance of shortcut SND are shown in Figure 5 and Figure 6, respectively.
It can be found from Figure 5 that the alkalinity addition ratios were closely related to the variation of each form of nitrogen in the MBBR, and there was a complex connection between the variation of these nitrogen forms and pH, as well as FA concentration. The pH of each reactor showed a trend of increasing to the maximum value first and then decreasing after a period of time. The reasons for the increase in pH at the beginning stage may be related to the following factors. On the one hand, the high concentration of organic matter at the beginning of the reaction, the number of heterotrophic bacteria is much more than that of autotrophic bacteria such as AOB and NOB, and the decomposition and metabolism of COD by heterotrophic microorganisms will produce CO2, while the constant aeration will blow off CO2, which leads to the increase in pH in the MBBR [35]. On the other hand, the alkalinity produced by denitrification in the reactor is larger than that consumed by nitrifying bacteria, which causes a further increase in pH [36]. When the alkalinity produced by denitrification, the alkalinity produced by aeration blow-off, and the alkalinity consumed by nitrification are equal, the pH of the system will reach the maximum value and remain unchanged for an extended period of time. Ultimately, the pH in the MBBR will start to decrease with the enhancement of nitrification and weakening of denitrification and the reduction of CO2 blow-off in the later stage of the reaction.
At 0.5 times alkalinity, the nitrification reaction was not complete enough. At the end of the reaction, NH 4 + -N was the primary form of nitrogen and the proportion of ammonia nitrogen reached 80.8%. The reason is that 0.5 times alkalinity is not enough to compensate for the consumption of alkalinity in the nitrification reaction, resulting in a system pH of only about 6.33 at the late stage of the reaction [37]. Moreover, the low pH denatures and inactivates the proteins related to the enzymatic reaction inside the nitrifying bacteria, which greatly reduces the efficiency of the nitrification reaction [38].
The final NH 4 + -N concentration in the reactor was 5.42 mg/L, and the final pH was 7.41 with 1 time alkalinity. The activity of nitrifying bacteria was high at this pH, and the ammonia nitrogen removal rate (ARR) reached 92.8%, and most of the ammonia nitrogen was removed. However, at the end of the reaction, the NO 2 -N and NO 3 -N concentrations were 5.69 and 33.3 mg/L, respectively, and the nitrite accumulation rate (NAR) was only 14.6%, which indicates that the NH 4 + -N was mainly removed by nitrification throughout the process with 1 time alkalinity. The ultimate SND rate and total nitrogen removal rate (TNRR) of the reactor were not high, only 44.2% and 41.0%, respectively, revealing that the denitrification reaction was hindered by the depletion of the carbon source, which led to the accumulation of the NO X -N.
At 2 times alkalinity, the final NH 4 + -N concentration in the reactor was 0.80 mg/L and the final pH was 8.14, which was optimal for the proceeding of the nitrification reaction. Meanwhile, at the end of the reaction, the ARR reached up to 99.0% at the end of the reaction. On this condition, NO 2 -N concentration was always substantially higher than that of NO 3 -N in the reactor for the first 8 h, which shows that most of the NH 4 + -N was removed by shortcut nitrification. Nonetheless, the NAR only reached 44.4% at the end of the reaction, manifesting the instability of the shortcut SND process in the reactor. Wang et al. [39] concluded that the NO 2 -N accumulation was significantly correlated with the concentration of FA in the liquid phase. As the actual substrate for the nitrification reaction, NOB was more sensitive to changes in its concentration than AOB. Anthonisen et al. [40] showed that free ammonia concentrations between 0.1 and 1 mg/L inhibited NOB activity, while free ammonia concentrations over 10 mg/L would affect AOB activity. As shown in Equation (18), when the temperature is certain, the concentration of FA is closely related to the pH and ammonia nitrogen concentration in the reactor. The larger the pH and the higher the ammonia nitrogen concentration, the higher the FA concentration. Comparing the concentration change curves of NH 4 + -N, pH, and FA in Figure 5, it can be found that a large amount of ammonia nitrogen released from the biochemical desorption process of ceramsite in the initial reaction period and the higher pH of the liquid phase are the keys to achieving high FA concentration. It can stabilize the FA concentration of the MBBR in the range of 1–10 mg/L for a longer time with 2 times alkalinity than 1 time alkalinity, and a better NO 2 -N accumulation effect was achieved in the initial reaction period. However, the inhibitory effect of FA on NOB was reversible, and the FA concentration also decreased with the concentration of NH 4 + -N concentration and pH. As a result, the inhibition of NOB becomes weaker, and the concentration of NO 3 -N increased significantly in the later stage of the reaction, ultimately resulting in the system not achieving a stable shortcut nitrification process [41]. In addition, there was NO x -N accumulation at the end of the reaction with 2 times alkalinity, which further indicated that the MBBR has a carbon source deficiency at a C/N of 4 [42]. It is noteworthy that the desorption concentration of NH 4 + -N was higher with 2 times alkalinity other than 1 time, but the SND rate and TNRR of the reactor were higher with 1 addition alkalinity under the same carbon source feeding conditions. The above results were mainly attributed to the realization of a shortcut SND process in the early stage of the MBBR, which significantly reduced the carbon source consumption and facilitated the denitrification reaction in the later stage of the reactor operation [43,44].
As for 4 times alkalinity, the final concentration of NO X -N in the reactor was quite low, while the concentration of NH 4 + -N reached up to 47.56 mg/L. The ammonia nitrogen in the reactor at this alkalinity was mainly derived from Na+ and the ion exchange of ceramsite NH 4 + adsorbed by ceramsite, while the nitrification by microorganisms was weak, with an ARR of only 30.0%. This may be due to the higher ammonia nitrogen concentration and pH in the reactor, keeping the FA maintained at a high concentration all the time, which not only inhibited the activity of NOB but also inhibited the AOB activity; thus, the whole nitrification reaction was limited. In addition, the blocked nitrification reaction further led to the lack of sufficient electron acceptors for the denitrification process, and the TNRR of the reactor was as low as 19.3%.
The aforementioned analysis shows that the proper alkalinity not only facilitated the biochemical desorption of ceramsite but also increased the FA concentration of the reactor and realized the transformation of the MBBR from complete SND to shortcut SND. The stability of the shortcut SND process is insufficient as the FA concentration decreases. In order to achieve a more stable and efficient shortcut SND process, further research on the effects of DO on the shortcut SND process of the MBBR was carried out.

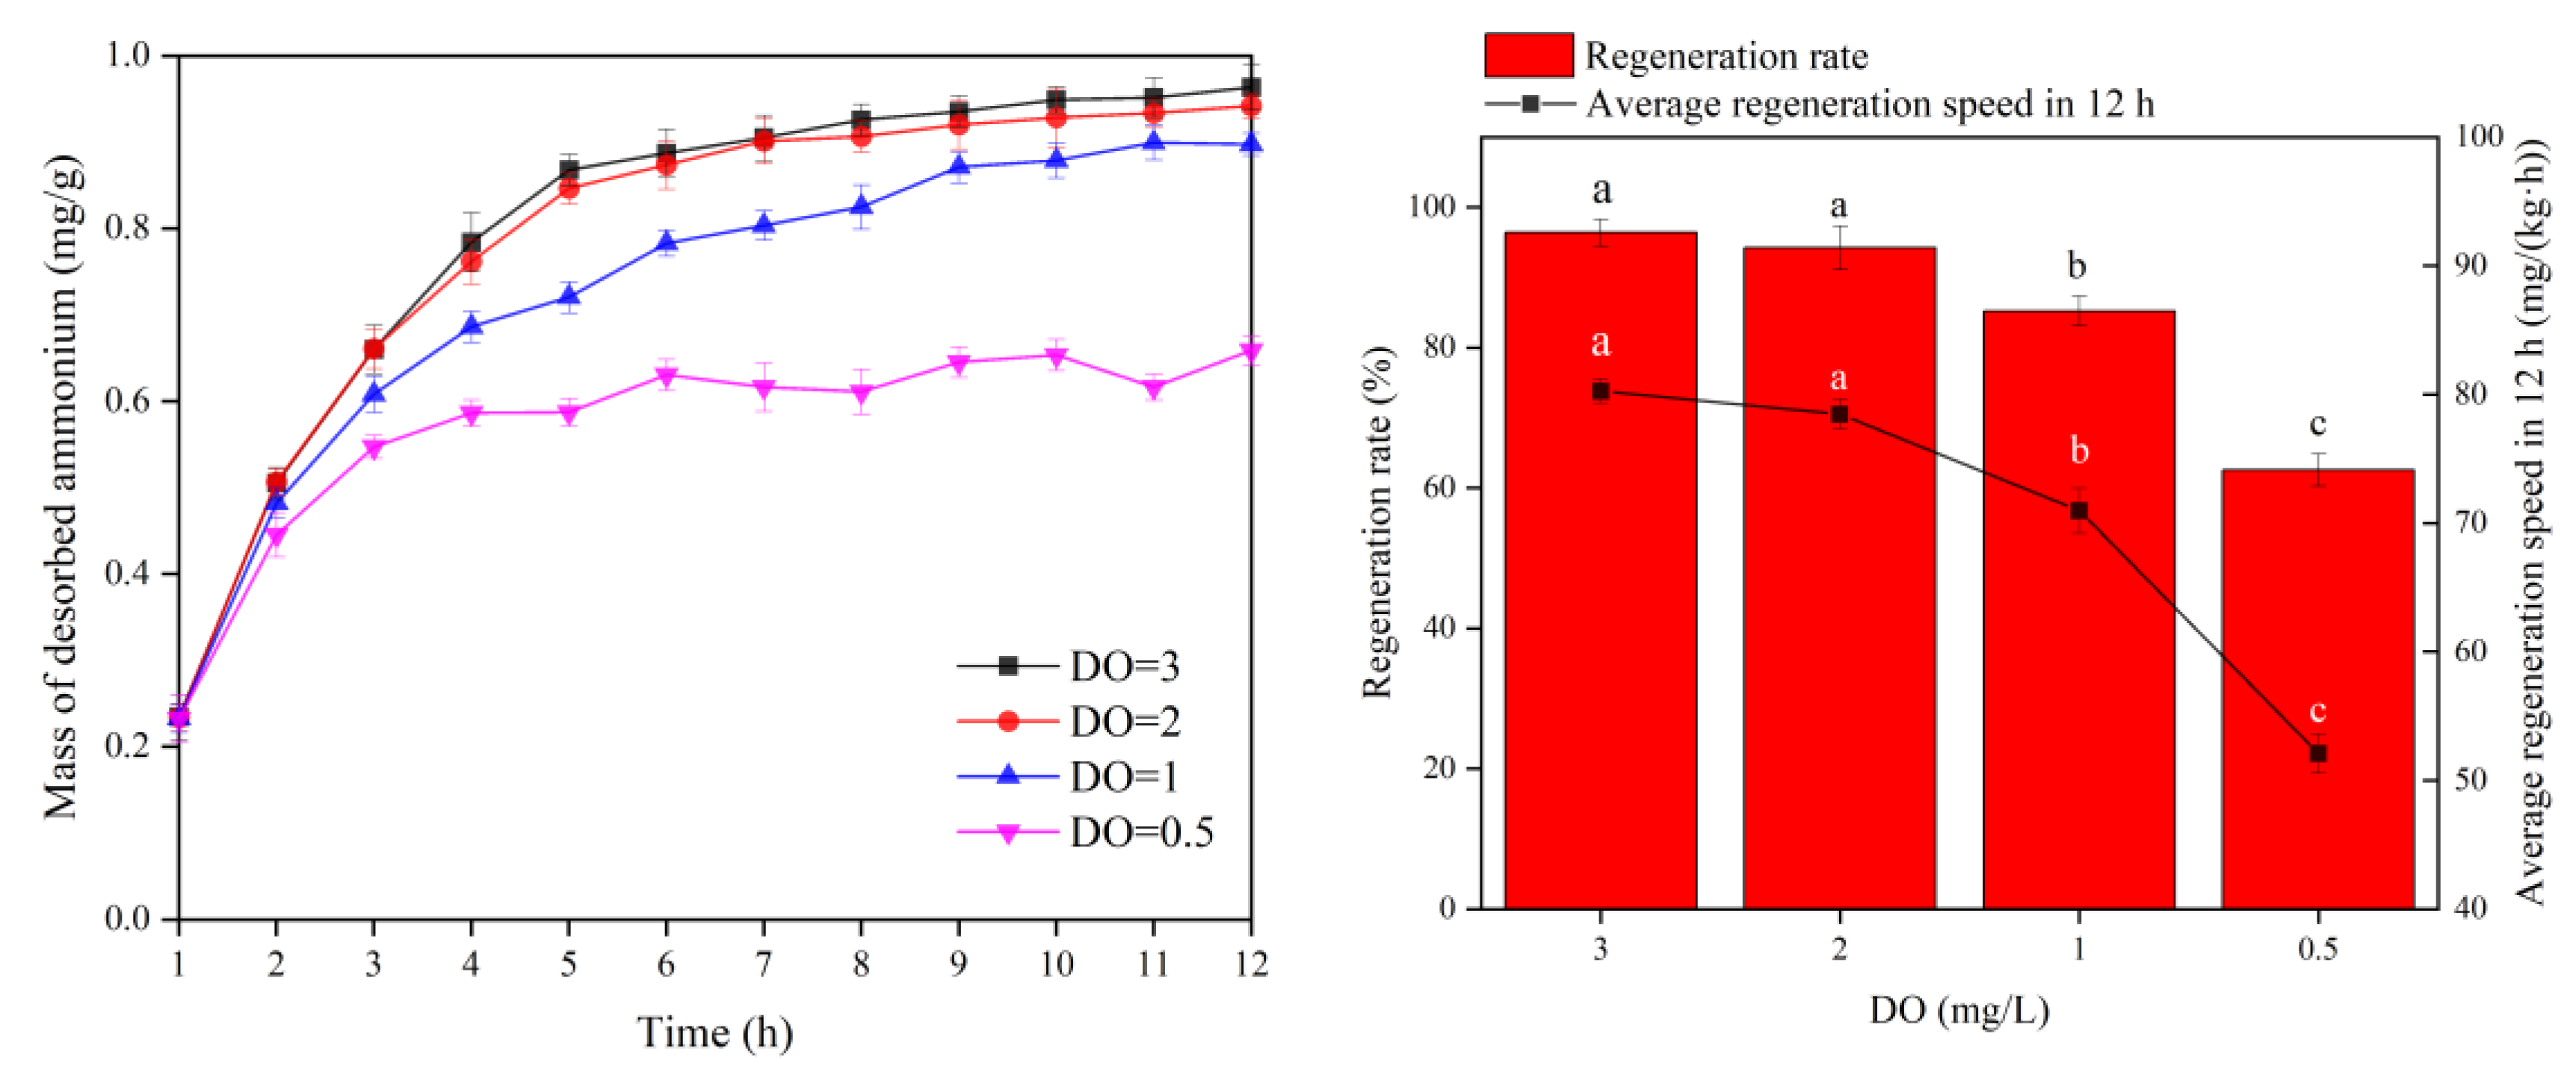
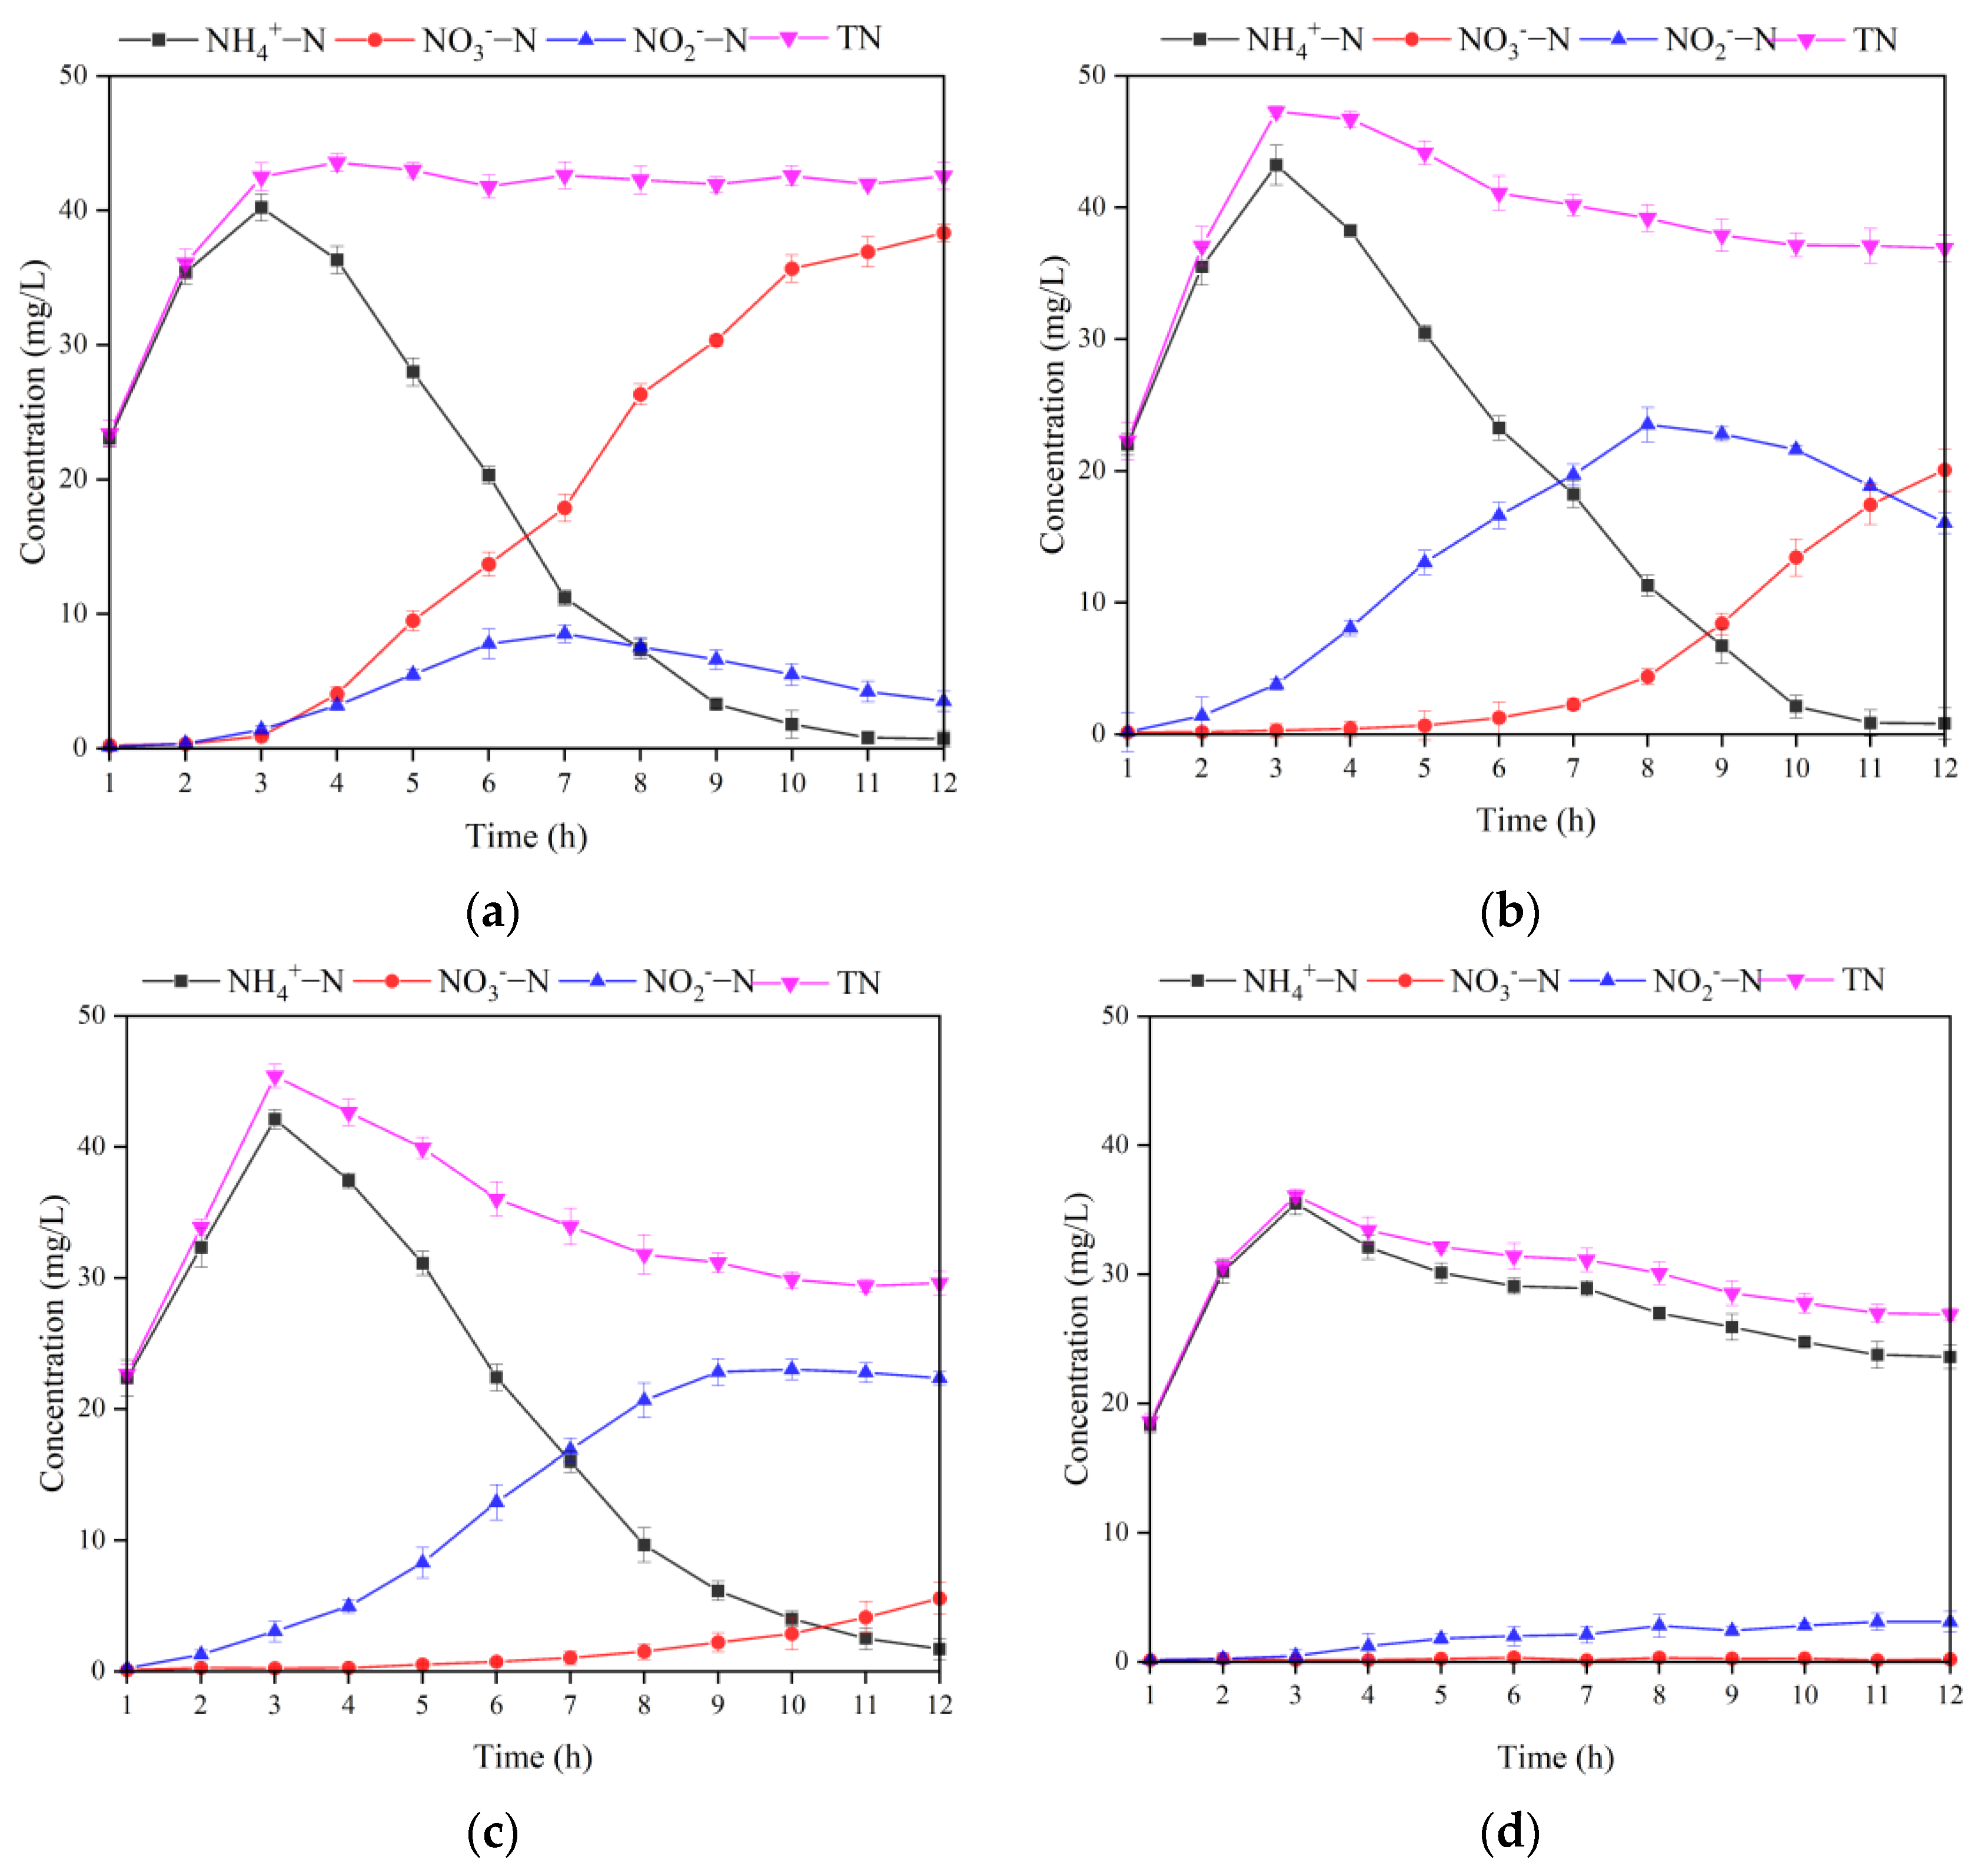
3.2.2. Effect of DO on the MBBR Shortcut SND Denitrification and Regeneration

Under the condition of 2 times alkalinity and C/N of 4, the effect of DO concentration on the denitrification of the shortcut SND system in the MBBR was investigated by decreasing the DO concentration of the reactor from 3.0 mg/L to 0.5 mg/L step-by-step. The effect of the regeneration of bio-ceramsite is shown in Figure 7.
When DO was 3 mg/L, the unit ammonia nitrogen desorption mass of ceramsite was 0.9634 mg/g, and the regeneration rate and average regeneration speed for 12 h of ceramsite were 96.4% and 80.28 mg/(kg·h), respectively. At DO of 2 mg/L, the unit ammonia nitrogen desorption rate of ceramsite was 0.9418 mg/g, and the regeneration rate and average regeneration speed for 12 h of ceramsite were 94.2% and 78.48(kg·h), respectively. When DO was 1 mg/L, the unit ammonia nitrogen desorption amount was 0.8517 mg/g, and the regeneration rate and average regeneration speed for 12 h were 85.2% and 70.98 mg/(kg·h), respectively. At DO of 0.5 mg/L, the unit ammonia nitrogen desorption amount was 0.6254 mg/g, the regeneration rate was 62.6%, and the 12 h average regeneration speed was 52.12%. The differences in regeneration rate and average regeneration speed for 12 h between 3 mg/L DO and 2 mg/L DO were not significant but significantly differed from other DO levels.
From the above results, it is clear that different DO levels are closely related to the desorption of ammonia nitrogen. The worst desorption effect was observed at DO of 0.5 mg/L, which may be related to the decrease in nitrification rate because of low DO conditions. The biological desorption of ammonia nitrogen adsorbed by ceramsite was affected by the low activity of nitrifying bacteria on the biofilm [45]. Then, with the increase in DO concentration, the nitrification rate of biofilm increased, and the regeneration effect of ceramsite was significantly enhanced. When the DO concentration exceeded 1 mg/L, the bio-regeneration rate of ceramsite was above 85%, suggesting that DO was not the speed-limiting factor of nitrification at this time.
The changing of each form of nitrogen in the MBBR at different DO levels and the performance of shortcut SND are shown in Figure 8 and Figure 9, respectively.
At a DO of 3 mg/L, the denitrification of NH 4 + -N first increased significantly to 40.21 mg/L, and then decreased rapidly to only 0.7 mg/L with an ARR of 99.2%. Under the DO conditions, most of the NO 2 -N in the MBBR was oxidized to NO 3 -N, which means the complete nitrification effect was excellent. However, at DO of 3 mg/L, the SND rate and TNRR of MBBR were only 49.9% and 29.5%, respectively. Excessive DO enhances the mass transfer driving force of O2 in the biofilm and reduces the anaerobic zone of the internal pore structure of the ceramsite [45]. When NO X -N is present simultaneously with O2, denitrifying bacteria will preferentially use O2 as an electron acceptor for aerobic metabolism, thereby inhibiting the denitrification reaction [46].
When DO is set to 2 mg/L, the MBBR achieves a better removal effect for NH 4 + -N with an ARR reaching up to 99.0%. However, the shortcut nitrification process in the MBBR achieved solely by the inhibition of high FA concentration was not stable. At the end of the reaction, the accumulated amount of NO 3 -N exceeded NO 2 -N, with a NAR of 44.4%. Notably, the decrease in DO concentration improved the activity of denitrifying bacteria in the anaerobic zone inside the ceramsite relative to the condition of 3 mg/L DO, and the SND rate and TNRR increased to 55.8% and 55.3%, respectively.
At DO of 1 mg/L, the variation trend of NH 4 + -N was similar to that at DO of 2 mg/L and 3 mg/L. At the end of the reaction, the concentration of NH 4 + -N was 1.7 mg/L and the ARR was 97.7%. However, the accumulation of NO 2 -N was much higher than that of NO 3 in the whole reaction process, and the NAR remained at 80.1% at the end of the reaction, demonstrating that the shortcut nitrification process obtained by maintaining a low DO is stable and durable. Huang and Lee [47] showed that the oxygen saturation constant for AOB was 0.2–0.4 mg/L, while that for NOB was 1.1–1.5 mg/L. When the DO is 1.0 mg/L, the difference in dissolved oxygen demand between AOB and NOB can be used to remove the vast majority of NOB from the reactor. However, due to the lack of a carbon source, even if a stable shortcut nitrification process was achieved, there were still a lot of NO x -N residues at the end of the reaction, and the SND rate and TNRR were only 62.0% and 60.6%, respectively.
When DO is 0.5 mg/L, relative to other DO levels, the concentration of NH 4 + -N desorbed out of the reactor at the early stage of the operation was relatively low and decreased slowly in the later stage. At the end of the reaction, the concentration of NH 4 + -N still reached 23.6 mg/L, and the ARR was only 58.3%. This trend of NH 4 + -N concentration may be related to the fact that the DO concentration was excessively low and severely inhibited the activity of nitrifying bacteria on the biofilm [48]. The accumulation of ammonia nitrogen caused by low DO limited the TN removal by the denitrification pathway, resulting in a low TNRR of 52.5% in the reactor. However, within the MBBR, the accumulation of NO 2 -N was much higher than that of NO 3 -N, and the NAR at the end of the reaction was as high as 94.5%. Finally, the system achieved a complete shortcut nitrification process. Furthermore, the SND rate of the MBBR reached 90.0%. The reasons are as follows. Firstly, the low DO concentration is conducive to the formation of an anaerobic zone inside the ceramsite, where denitrifying bacteria will preferentially use NO X -N for denitrification reaction; secondly, at low DO concentration, only a small portion of NH 4 + -N is oxidized to NO X N , the organic carbon source with C/N of 4 can provide sufficient electrons for the reduction of NO X -N [49].
In conclusion, DO concentration is closely related to the regeneration and denitrification effect of shortcut SND in the MBBR. Especially, the 1 mg/L DO concentration can achieve a balance relative to other DO levels. On the one hand, compared with 3 mg/L and 2 mg/L DO concentrations, 1 mg/L DO concentration contributes to improving the denitrification reaction efficiency and ensuring that most of the NOB is eluted so that the reactor stays in the shortcut nitrification stage for a long time. On the other hand, compared with the DO concentration of 0.5 mg/L, the DO concentration of 1 mg/L is beneficial to improve the activity of nitrifying bacteria on the bio-ceramsite, so as to increase the regeneration rate of ceramsite, as well as the ARR and the TNRR of the reactor.

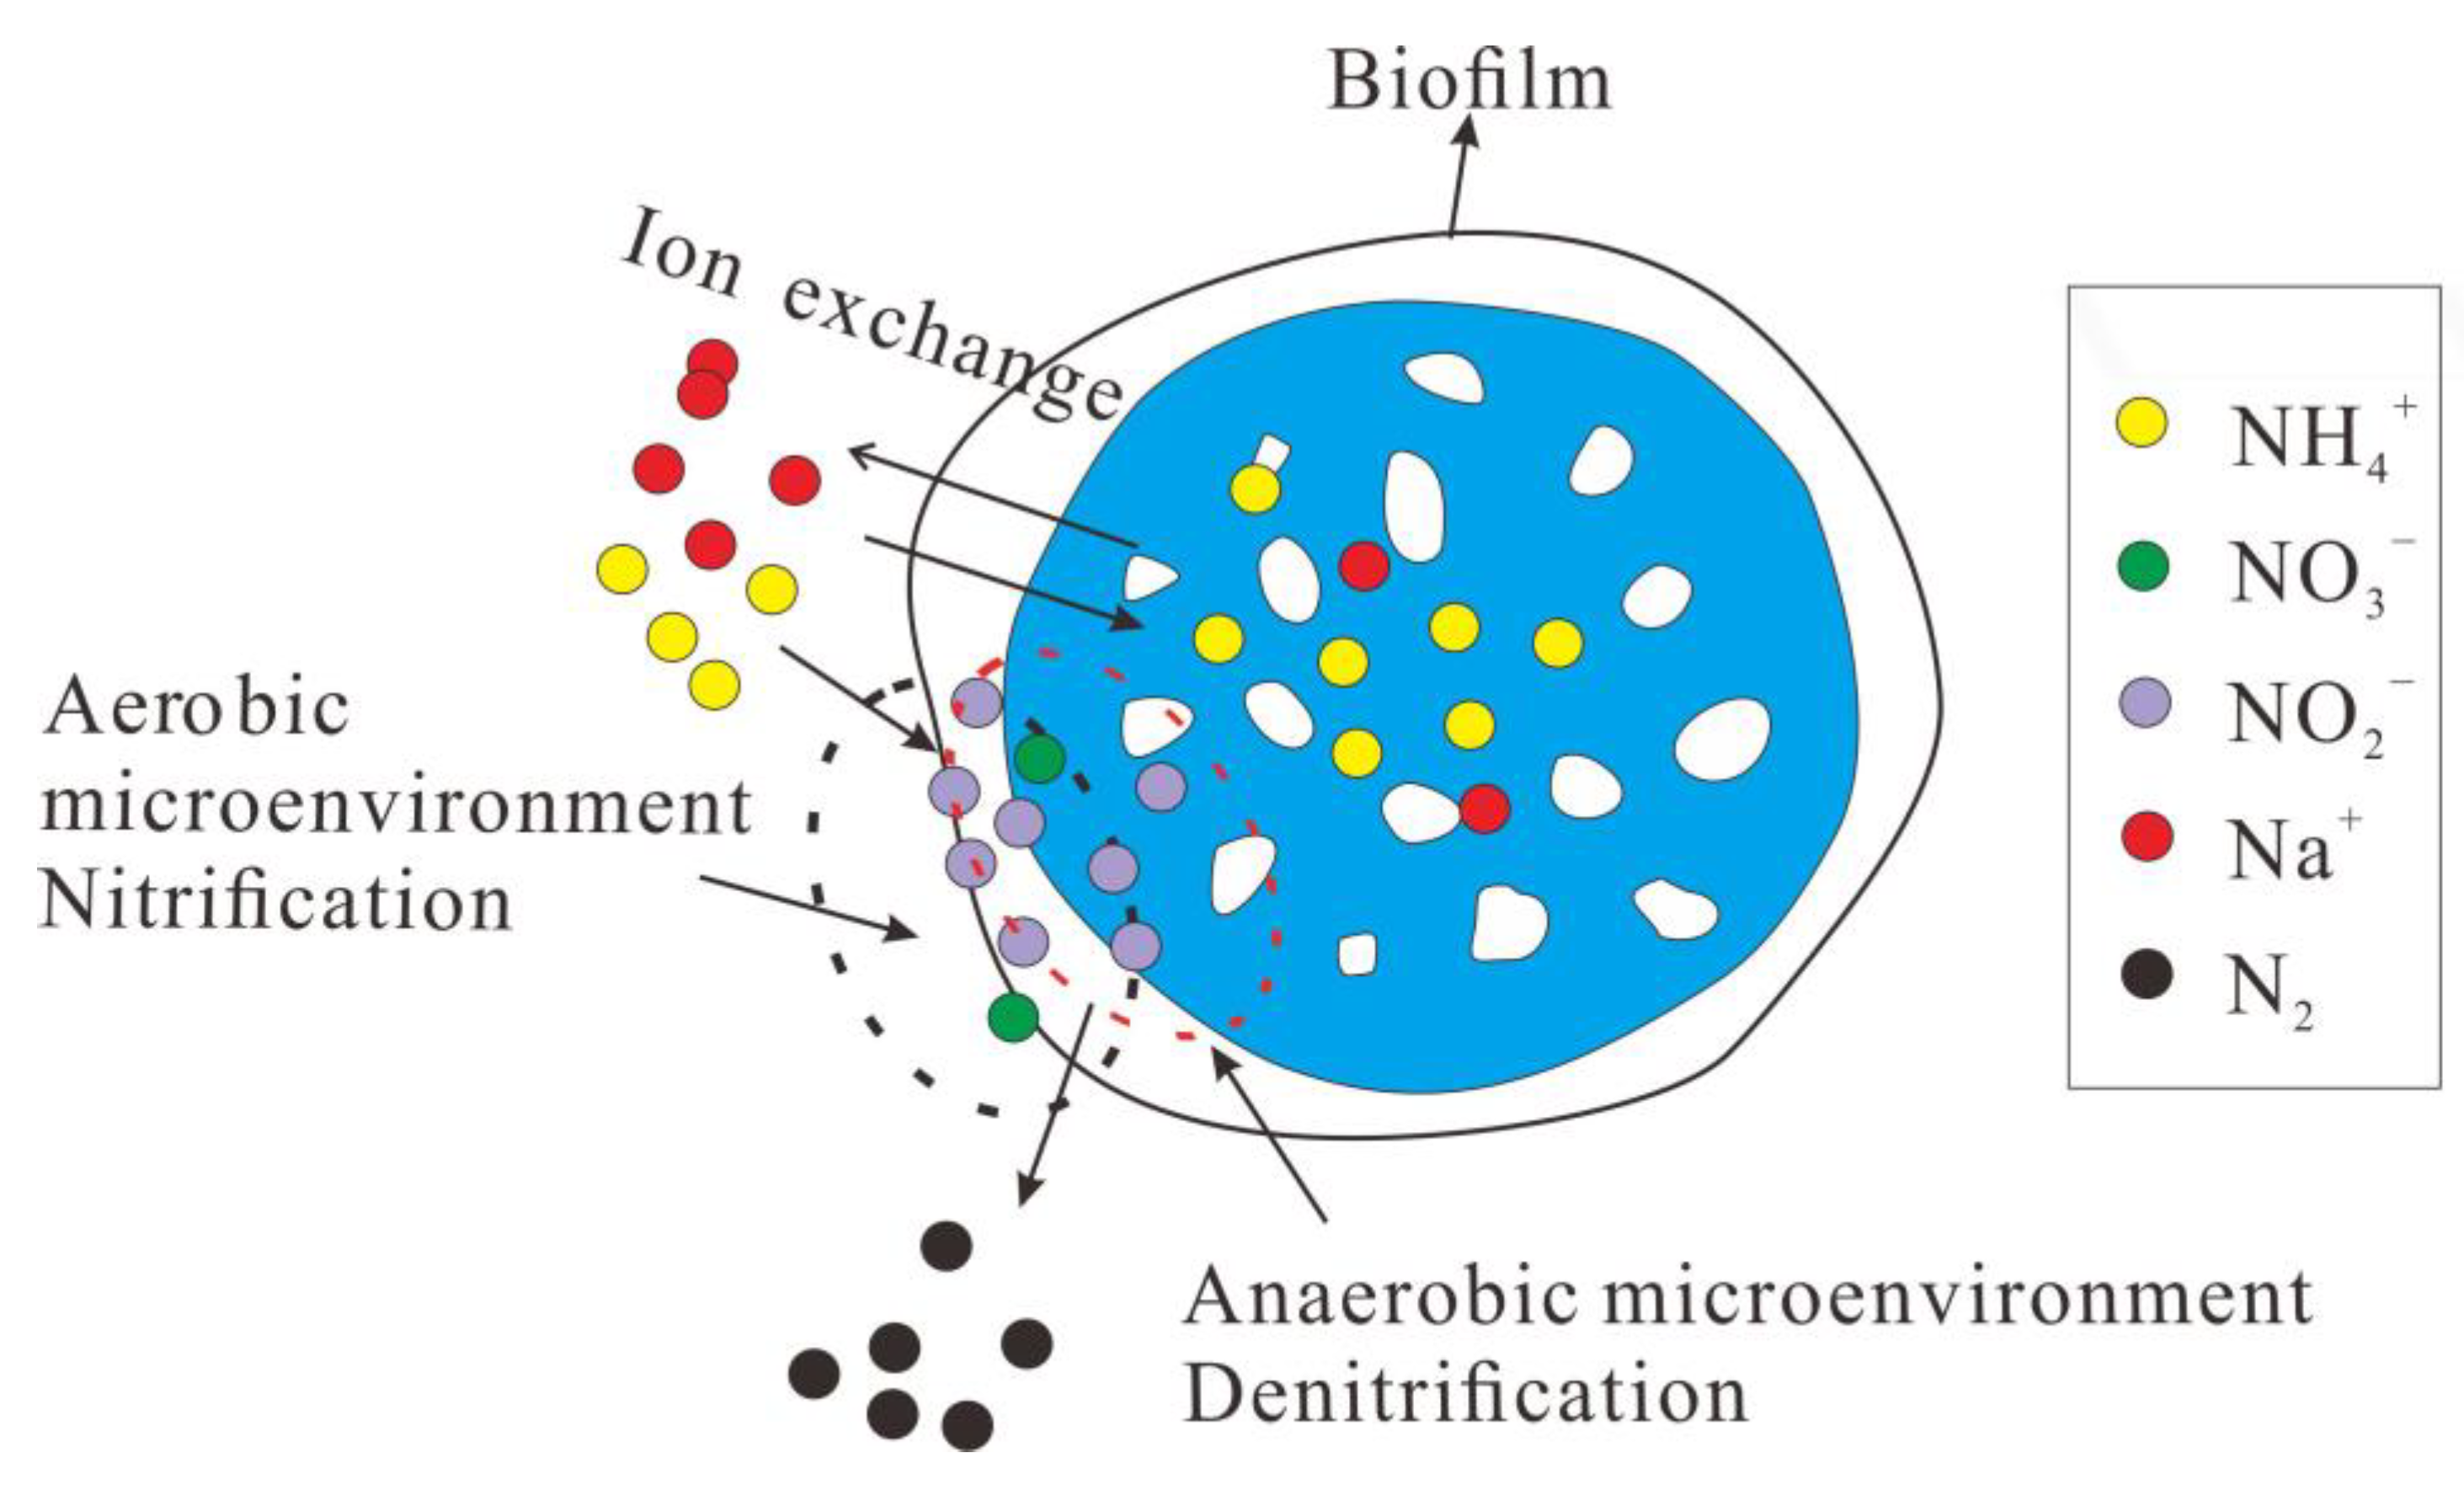
3.3. The Optimum Conditions and the Mechanism of the MBBR Adsorption-Shortcut SND Process

Through our research, we found that the optimal operating parameters in the adsorption stage were a hydraulic retention time of 8 h and an agitation rate of 120 r/min. For the shortcut SND stage, the ideal optimal parameters were 2 times alkalinity and dissolved oxygen (DO) 1.0mg/L. Under optimal operating parameter conditions, the influent TN, ammonia, nitrate, and nitrate concentration were 29.6, 1.7, 5.56, and 22.34 mg/L, respectively. The SND rate, TN removal rate, ammonia removal rate, and nitrite accumulation rate were 89.1%, 84.0%, 94.3%, and 86.4%, respectively. Compared with traditional nitrogen removal systems, the MBBR adsorption-shortcut SND process provides up to 80–90 % nitrogen removal, which significantly improves the removal efficiency of ammonia nitrogen [23]. The MBBR adsorption-shortcut SND process allows for energy savings in aeration compared with the nitrification/denitrification process, which significantly reduces the operating costs of the system [19]. The other benefit of the MBBR adsorption-shortcut SND process is that the need for carbon sources due to the nitrosation process is reduced, and less sludge is produced compared with the nitrification/denitrification process [50]. The operational cost was far less than the common nitrification/denitrification process, which showed the particular potential of the MBBR adsorption-shortcut SND process for engineering application of low-strength ammonium aquaculture wastewater.
The mechanism of denitrogenating regeneration of the MBBR adsorption-shortcut SND process is shown in Figure 10 and can be described as follows.
In the adsorption stage, the NH 4 + in the wastewater was firstly diffused to the ceramsite surface and the surface channels of the zeolite component through the biofilm. With the bio-ceramsite surface adsorption sites decreased, the adsorbate NH 4 + approached monolayer saturation on the surface of ceramsite and progressively diffused into the internal pores of the zeolite components in ceramsite to replace the metal cations. Because the deep channels of zeolite components are difficult to use, the cation exchange rate between the liquid phase and zeolite will gradually slow down.
In the shortcut SND denitrification and regeneration stage, the bio-ceramsite was not only the adsorption material but also the carrier of nitrifying bacteria and denitrifying bacteria. The shortcut SND process involving microorganisms played an important role in the desorption of ammonia nitrogen. On the one hand, the alkalinity applied by the nitrification process provided a “Na+ pump” for the desorption of adsorbed ammonia nitrogen from bio-ceramsite. Na+ in these liquid phases exchanged the NH 4 + adsorbed by ceramsite zeolite component. On the other hand, nitrifying bacteria in ceramsite biofilms simultaneously oxidized the adsorbed NH 4 + -N in the liquid phase and outer layer of the zeolite component, promoted the outward diffusion of NH 4 + -N inside the zeolite, and accelerated the desorption of NH 4 + -N. In the initial stage of denitrification and regeneration, ion exchange was the main driving force of biochemical desorption. At this time, due to the high concentration of Na+ in the liquid phase and the exchange occurring in the surface structure of the ceramsite zeolite component, the exchange rate was relatively fast, which mainly depended on the rate of Na+ crossing the biofilm [51]. In the late stage of denitrification regeneration, NH 4 + in the outer layer structure of ceramsite zeolite components were replaced by cation exchange such as Na+, and Na+ gradually diffused to the internal channels of the zeolite component. Ion exchange becomes difficult due to the decrease in Na+ concentration in the liquid phase, the increase in electrostatic repulsion, and the narrowing of zeolite component pore size in ceramsite, and the nitrification of microorganisms become the main driving force for the later denitrification and regeneration [52].
The high concentration of ammonia nitrogen caused by denitrification and regeneration and the high pH in the liquid phase is the key to realizing the inhibitory effect of high concentration FA on NOB [53]. Maintaining the concentration of FA in the range of 1–10 mg/L can maintain the nitrification reaction in the nitrosation stage [54]. However, due to the reversibility of the inhibitory effect of FA on NOB, the shortcut nitrification process will become unstable with the decrease in FA concentration [55]. In order to achieve a more stable and efficient shortcut SND process, this study took advantage of the difference in affinity between AOB and NOB for DO to achieve stable NO 2 -N accumulation and high NAR by maintaining low DO concentrations [45]. The NO 2 -N generated in the shortcut nitrification process entered the pores of the ceramsite through complex mass transfer and was reduced to N2 by the denitrification process.

4. Conclusions

This research focuses on the operational parameters and regeneration mechanism of the MBBR adsorption-shortcut SND process. In the adsorption stage, the NH 4 + -N was adsorbed to the ceramsite surface. In the regeneration stage, the adsorbed ammonia nitrogen was desorbed by the biochemical regeneration effect. The shorter the HRT, the greater the NH 4 + -N volume load. To a certain extent, agitation aggravated the diffusion of NH 4 + -N in the ceramsite zeolite component. Using 2 times alkalinity increased the concentration of FA, which realized the transition from complete SND to shortcut SND. The more stable shortcut nitrification process could be obtained by combining high-concentration FA with low-level DO. Under optimal parameter conditions, the removal of TN and NH 4 + -N was improved greatly and achieved a higher nitrate accumulation rate which significantly reduced the consumption of carbon sources. In general, the MBBR adsorption-shortcut SND process is expected to be a preferred nitrogen removal approach to treating aquaculture wastewater. However, many future studies should focus on the change in microbial communities in the shortcut SND process to clarify the microbial mechanism of nitrogen removal. The N2O/N2 production during the MBBR adsorption-shortcut SND process also should be explored.

Author Contributions

Conceptualization, L.W.; methodology, H.S.; software, L.W.; validation, N.Z.; formal analysis, L.W. and X.M.; investigation, Q.W.; resources, X.S.; data curation, L.W.; writing—original draft preparation, L.W.; writing—review and editing, X.M. and H.S.; visualiza-tion, Q.W. and Y.A.H.; supervision, X.M. and N.Z.; project administration, Y.A.H.; funding ac-quisition, X.S. and N.Z. All authors have read and agreed to the published version of the manuscript.

Funding

This study is supported by the Distinguished Postdoctoral Program of Jiangsu Province (2022ZB165), the Key Science and Technology Project of Water Resources Ministry (SKR-2022070), the National Key Research and Development Plan (2020YFD0900705), the Key Science and Technology Project for Nanjing Water Conservancy Bureau (2019-1) and the National Natural Science Foundation of China (42007018).

Data Availability Statement

The data presented in this study are available on request from the corresponding author.

Acknowledgments

The authors would like to acknowledge the help of Xiaohou Shao for the help of research guidance, and thank for Ningyuan Zhu for critical reading and improving an earlier version of this manuscript. Also, great thanks go to Qiling Wang in experimental data analysis.

Conflicts of Interest

The authors declare no conflict of interest.

References

  1. Ibrahim, L.A.; Abu-hashim, M.; Shaghaleh, H.; Elsadek, E.; Hamad, A.A.A.; Alhaj Hamoud, Y. A Comprehensive Review of the Multiple Uses of Water in Aquaculture-Integrated Agriculture Based on International and National Experiences. Water 2023, 15, 367. [Google Scholar] [CrossRef]
  2. Ramirez, M.; Gomez, J.M.; Aroca, G.; Cantero, D. Removal of ammonia by immobilized Nitrosomonas europaea in a biotrickling filter packed with polyurethane foam. Chemosphere 2009, 74, 1385–1390. [Google Scholar] [CrossRef] [PubMed]
  3. Faskol, A.S.; Racovieanu, G. Effect of DO, Alkalinity and pH on Nitrification Using Three Different Sunken Materials Types in Biological Aerated Filter BAFs. IOP Conf. Ser. Earth Environ. Sci. 2021, 664, 012079. [Google Scholar] [CrossRef]
  4. Zulkifli, M.; Abu Hasan, H.; Sheikh Abdullah, S.R.; Muhamad, M.H. A review of ammonia removal using a biofilm-based reactor and its challenges. J. Environ. Manag. 2022, 315, 115162. [Google Scholar] [CrossRef]
  5. Iovino, P.; Fenti, A.; Galoppo, S.; Najafinejad, M.S.; Chianese, S.; Musmarra, D. Electrochemical Removal of Nitrogen Compounds from a Simulated Saline Wastewater. Molecules 2023, 28, 1306. [Google Scholar] [CrossRef]
  6. Dong, Y.; Lin, H.; Zhang, X. Simultaneous ammonia nitrogen and phosphorus removal from micro-polluted water by biological aerated filters with different media. Water Air Soil Pollut. 2020, 231, 1–15. [Google Scholar] [CrossRef]
  7. He, P.; Zhang, Y.; Zhang, X.; Chen, H. Diverse zeolites derived from a circulating fluidized bed fly ash based geopolymer for the adsorption of lead ions from wastewater. J. Clean Prod. 2021, 312, 127769. [Google Scholar] [CrossRef]
  8. Xiong, J.; Zheng, Z.; Yang, X.; Jian, H.; Luo, X.; Gao, B. Mature landfill leachate treatment by the MBBR inoculated with biocarriers from a municipal wastewater treatment plant. Process Saf. Environ. Prot. 2018, 119, 304–310. [Google Scholar] [CrossRef]
  9. Chaudhary, R.; Barwal, A. To study the performance of biocarriers in moving bed biofilm reactor (MBBR) technology and kinetics of biofilm for retrofitting the existing aerobic treatment systems: A review. Rev. Env. Sci. Biotechnol. 2014, 13, 285–299. [Google Scholar]
  10. Bakr, M.H.; Nasr, M.; Ashmawy, M.; Tawfik, A. Predictive performance of auto-aerated immobilized biomass reactor treating anaerobic effluent of cardboard wastewater enriched with bronopol (2-bromo-2-nitropropan-1,3-diol) via artificial neural network. Environ. Technol. Innov. 2021, 21, 101327. [Google Scholar] [CrossRef]
  11. Arabgol, R.; Vanrolleghem, P.A.; Delatolla, R. Influence of MBBR carrier geometrical properties and biofilm thickness restraint on biofilm properties, effluent particle size distribution, settling velocity distribution, and settling behaviour. J. Environ. Sci. 2022, 122, 138–149. [Google Scholar] [CrossRef]
  12. Zhu, J.; You, H.; Li, Z.; Ding, Y.; Ma, B. Impacts of bio-carriers on the characteristics of soluble microbial products in a hybrid membrane bioreactor for treating mariculture wastewater. Sci. Total Environ. 2020, 737, 140287. [Google Scholar] [CrossRef]
  13. Nasr, M.; Attia, M.; Ezz, H.; Ibrahim, M.G. Chapter 6—Recent applications of downflow hanging sponge technology for decentralized wastewater treatment. In Cost Effective Technologies for Solid Waste and Wastewater Treatment; Kathi, S., Devipriya, S., Thamaraiselvi, K., Eds.; Elsevier: Amsterdam, The Netherlands, 2022; pp. 59–67. [Google Scholar]
  14. Ismail, S.; Nasr, M.; Abdelrazek, E.; Awad, H.M.; Zhaof, S.; Meng, F.; Tawfik, A. Techno-economic feasibility of energy-saving self-aerated sponge tower combined with up-flow anaerobic sludge blanket reactor for treatment of hazardous landfill leachate. J. Water Process. Eng. 2020, 37, 101415. [Google Scholar] [CrossRef]
  15. Dong, Z.; Lu, M.; Huang, W.; Xu, X. Treatment of oilfield wastewater in moving bed biofilm reactors using a novel suspended ceramic biocarrier. J. Hazard. Mater. 2011, 196, 123–130. [Google Scholar] [CrossRef]
  16. Zhou, A.; Jin, N.; Wei, Z.; Jiang, N.; Xiang, H. Experimental research onnitrogen removal by simultaneous nitrification and denitrificationin bio-ceramic filled MBBR. Ind. Water Wastewater 2010, 41, 30–34. [Google Scholar]
  17. Huang, W.; She, Z.; Gao, M.; Wang, Q.; Jin, C.; Zhao, Y.; Guo, L. Effect of anaerobic/aerobic duration on nitrogen removal and microbial community in a simultaneous partial nitrification and denitrification system under low salinity. Sci. Total Environ. 2019, 651, 859–870. [Google Scholar] [CrossRef]
  18. Vadivelu, V.M.; Keller, J.; Yuan, Z. Free ammonia and free nitrous acid inhibition on the anabolic and catabolic processes of Nitrosomonas and Nitrobacter. Water Sci. Technol. 2007, 56, 89–97. [Google Scholar] [CrossRef]
  19. Lai, C.; Guo, Y.; Cai, Q.; Yang, P. Enhanced nitrogen removal by simultaneous nitrification-denitrification and further denitrification (SND-DN) in a moving bed and constructed wetland (MBCW) integrated bioreactor. Chemosphere 2020, 261, 127744. [Google Scholar] [CrossRef]
  20. Yu, H.; Tian, Z.; Zuo, J.; Song, Y. Enhanced nitrite accumulation under mainstream conditions by a combination of free ammonia-based sludge treatment and low dissolved oxygen: Reactor performance and microbiome analysis. RSC Adv. 2020, 10, 2049–2059. [Google Scholar] [CrossRef] [Green Version]
  21. Al-Hazmi, H.E.; Lu, X.; Grubba, D.; Majtacz, J.; Badawi, M.; Mąkinia, J. Sustainable nitrogen removal in anammox-mediated systems: Microbial metabolic pathways, operational conditions and mathematical modelling. Sci. Total Environ. 2023, 868, 161633. [Google Scholar] [CrossRef]
  22. Chen, J.; Xie, Y.; Sun, S.; Zhang, M.; Yan, P.; Xu, F.; Tang, L.; He, S. Efficient nitrogen removal through coupling biochar with zero-valent iron by different packing modes in bioretention system. Environ. Res. 2023, 223, 115375. [Google Scholar] [CrossRef] [PubMed]
  23. Chen, J.; Wang, X.J.; Zhou, S.W.; Chen, Z.G. Effect of alkalinity on bio-zeolite regeneration in treating cold low-strength ammonium wastewater via adsorption and enhanced regeneration. Environ. Sci. Pollut. R. 2019, 26, 23–38. [Google Scholar] [CrossRef] [PubMed]
  24. Miladinovic, N.; Weatherley, L.R. Intensification of ammonia removal in a combined ion-exchange and nitrification column. Chem. Eng. J. 2008, 135, 15–24. [Google Scholar] [CrossRef]
  25. Wang, L.; Shao, Y.; Zhao, Z.; Chen, S.; Shao, X. Optimized utilization studies of dredging sediment for making water treatment ceramsite based on an extreme vertex design. J. Water Process. Eng. 2020, 38, 101603. [Google Scholar] [CrossRef]
  26. Furumai, H.; Tagui, H.; Fujita, K. Effects of pH and alkalinity on sulfur-denitrification in a biological granular filter. Water Sci. Technol. 1996, 34, 355–362. [Google Scholar] [CrossRef]
  27. Yang, X.; He, J.; Jiang, T. Effects of aeration volume and alkalinity on simultaneous nitrification and denitrification (SND) of aerobic granular sludge sequencing batch reactor. J. Biotechnol. 2008, 136, S664–S665. [Google Scholar] [CrossRef]
  28. Subtil, E.L.; Silva, M.V.; Lotto, B.A.; Moretto, M.R.D.; Mierzwa, J.C. Pilot-scale investigation on the feasibility of simultaneous nitrification and denitrification (SND) in a continuous flow single-stage membrane bioreactor. J. Water Process Eng. 2019, 32, 145–160. [Google Scholar] [CrossRef]
  29. Markou, G.; Vandamme, D.; Muylaert, K. Using natural zeolite for ammonia sorption from wastewater and as nitrogen releaser for the cultivation of Arthrospira platensis. Bioresour. Technol. 2014, 155, 373–378. [Google Scholar] [CrossRef] [Green Version]
  30. Wang, M.; Xie, R.; Chen, Y.; Pu, X.; Jiang, W.; Yao, L. A novel mesoporous zeolite-activated carbon composite as an effective adsorbent for removal of ammonia-nitrogen and methylene blue from aqueous solution. Bioresour. Technol. 2018, 268, 726–732. [Google Scholar] [CrossRef]
  31. Cao, X.; Jiang, L.; Zheng, H.; Liao, Y.; Zhang, Q.; Shen, Q.; Mao, Y.; Ji, F.; Shi, D. Constructed wetlands for rural domestic wastewater treatment: A coupling of tidal strategy, in-situ bio-regeneration of zeolite and Fe(Ⅱ)-oxygen denitrification. Bioresour. Technol. 2022, 344, 126185. [Google Scholar] [CrossRef]
  32. Han, Z.; Dong, J.; Shen, Z.; Mou, R.; Zhou, Y.; Chen, X.; Fu, X.; Yang, C. Nitrogen removal of anaerobically digested swine wastewater by pilot-scale tidal flow constructed wetland based on in-situ biological regeneration of zeolite. Chemosphere 2019, 217, 364–373. [Google Scholar] [CrossRef]
  33. Castro, C.J.; Shyu, H.Y.; Xaba, L.; Bair, R.; Yeh, D.H. Performance and onsite regeneration of natural zeolite for ammonium removal in a field-scale non-sewered sanitation system. Sci. Total Environ. 2021, 776, 145938. [Google Scholar] [CrossRef]
  34. Muscarella, S.M.; Badalucco, L.; Cano, B.; Laudicina, V.A.; Mannina, G. Ammonium adsorption, desorption and recovery by acid and alkaline treated zeolite. Bioresour. Technol. 2021, 341, 125812. [Google Scholar] [CrossRef]
  35. Liu, J.; Yuan, Y.; Li, B.; Zhang, Q.; Wu, L.; Li, X.; Peng, Y. Enhanced nitrogen and phosphorus removal from municipal wastewater in an anaerobic-aerobic-anoxic sequencing batch reactor with sludge fermentation products as carbon source. Bioresour. Technol. 2017, 244, 1158–1165. [Google Scholar] [CrossRef]
  36. Perera, M.K.; Englehardt, J.D.; Tchobanoglous, G.; Shamskhorzani, R. Control of nitrification/denitrification in an onsite two-chamber intermittently aerated membrane bioreactor with alkalinity and carbon addition: Model and experiment. Water Res. 2017, 115, 94–110. [Google Scholar] [CrossRef] [Green Version]
  37. Pan, D.; Shao, S.; Zhong, J.; Wang, M.; Wu, X. Performance and mechanism of simultaneous nitrification–denitrification and denitrifying phosphorus removal in long-term moving bed biofilm reactor (MBBR). Bioresour. Technol. 2022, 348, 126726. [Google Scholar] [CrossRef]
  38. Jiménez, E.; Giménez, J.B.; Seco, A.; Ferrer, J.; Serralta, J. Effect of pH, substrate and free nitrous acid concentrations on ammonium oxidation rate. Bioresour. Technol. 2012, 124, 12–24. [Google Scholar] [CrossRef]
  39. Wang, Z.; Zheng, M.; Xue, Y.; Xia, J.; Zhong, H.; Ni, G.; Liu, Y.; Yuan, Z.; Hu, S. Free ammonia shock treatment eliminates nitrite-oxidizing bacterial activity for mainstream biofilm nitritation process. Chem. Eng. J. 2019, 7, 666–670. [Google Scholar] [CrossRef]
  40. Anthonisen, A.C.; Loehr, R.C.; Prakasam, T.B.S.; Srinath, E.G. Inhibition of nitrification by ammonia and nitrous acid. Water Pollut. Control. Fed. 1976, 48, 10–25. [Google Scholar]
  41. Kent, T.R.; Sun, Y.W.; An, Z.H.; Bott, C.B.; Wang, Z.W. Mechanistic understanding of the NOB suppression by free ammonia inhibition in continuous flow aerobic granulation bioreactors. Environ. Int. 2019, 131, 51–63. [Google Scholar] [CrossRef]
  42. Torresi, E.; Casas, M.E.; Polesel, F.; Plósz, B.; Christensson, M.; Kai, B. Impact of external carbon dose on the removal of micropollutants using methanol and ethanol in post-denitrifying Moving Bed Biofilm Reactors. Water Res. 2017, 1, 124–136. [Google Scholar] [CrossRef] [PubMed] [Green Version]
  43. Jia, Y.; Zhou, M.; Chen, Y.; Hu, Y.; Luo, J. Insight into short-cut of simultaneous nitrification and denitrification process in moving bed biofilm reactor: Effects of carbon to nitrogen ratio. Chem. Eng. J. 2020, 400, 125905. [Google Scholar] [CrossRef]
  44. Ming, F.; Jiao, H.; Xiao, Y.; Wen, J.; Xing, Y. Study on the effects of technological factors of shortcut nitrification-denitrification simultaneous phosphorus removal. Adv. Mater. Res. 2014, 3181, 156–171. [Google Scholar]
  45. Huang, R.; Meng, T.; Liu, G.; Gao, S.; Tian, J. Simultaneous nitrification and denitrification in membrane bioreactor: Effect of dissolved oxygen. J. Environ. Manag. 2022, 323, 116183. [Google Scholar] [CrossRef] [PubMed]
  46. Wang, J.; Rong, H.; Cao, Y.; Zhang, C. Factors affecting simultaneous nitrification and denitrification (SND) in a moving bed sequencing batch reactor (MBSBR) system as revealed by microbial community structures. Bioprocess Biosyst. Eng. 2020, 12, 623–630. [Google Scholar] [CrossRef]
  47. Huang, X.W.; Lee, P.H. Shortcut nitrification/denitrification through limited-oxygen supply with two extreme COD/N-and-ammonia active landfill leachates. Chem. Eng. J. 2021, 404, 124–131. [Google Scholar] [CrossRef]
  48. Zhu, G.C.; Lu, Y.Z.; Xu, L.R. Effects of the carbon/nitrogen (C/N) ratio on a system coupling simultaneous nitrification and denitrification (SND) and denitrifying phosphorus removal (DPR). Environ. Technol. 2020, 34, 1156–1162. [Google Scholar] [CrossRef]
  49. Luan, Y.; Yin, Y.; An, Y.; Zhang, F.; Wang, X.; Zhao, F.; Xiao, Y.; Liu, C. Investigation of an intermittently-aerated moving bed biofilm reactor in rural wastewater treatment under low dissolved oxygen and C/N condition. Bioresour. Technol. 2022, 358, 127405. [Google Scholar] [CrossRef]
  50. Ashkanani, A.; Almomani, F.; Khraisheh, M.; Bhosale, R.; Tawalbeh, M.; AlJaml, K. Bio-carrier and operating temperature effect on ammonia removal from secondary wastewater effluents using moving bed biofilm reactor (MBBR). Sci. Total Environ. 2019, 693, 133425. [Google Scholar] [CrossRef]
  51. Zhang, H.; Li, A.; Zhang, W.; Shuang, C. Combination of Na-modified zeolite and anion exchange resin for advanced treatment of a high ammonia–nitrogen content municipal effluent. J. Colloid Interface Sci. 2016, 468, 128–135. [Google Scholar] [CrossRef]
  52. Song, Z.; Zhang, X.; Ngo, H.H.; Guo, W.; Song, P.; Zhang, Y.; Wen, H.; Guo, J. Zeolite powder based polyurethane sponges as biocarriers in moving bed biofilm reactor for improving nitrogen removal of municipal wastewater. Sci. Total Environ. 2019, 651, 1078–1086. [Google Scholar] [CrossRef]
  53. Singh, V.; Ormeci, B.; Mishra, S.; Hussain, A. Simultaneous partial Nitrification, ANAMMOX and denitrification (SNAD)—A review of critical operating parameters and reactor configurations. Chem. Eng. J. 2022, 433, 133677. [Google Scholar] [CrossRef]
  54. Di Capua, F.; Iannacone, F.; Sabba, F.; Esposito, G. Simultaneous nitrification–denitrification in biofilm systems for wastewater treatment: Key factors, potential routes, and engineered applications. Bioresour. Technol. 2022, 361, 127702. [Google Scholar] [CrossRef]
  55. Sun, H.; Jiang, T.; Zhang, F.; Zhang, P.; Zhang, H.; Yang, H.; Lu, J.; Ge, S.; Ma, B.; Ding, J.; et al. Understanding the effect of free ammonia on microbial nitrification mechanisms in suspended activated sludge bioreactors. Environ. Res. 2021, 200, 111737. [Google Scholar] [CrossRef]
Figure 1. Schematic diagram of the experimental facility.
Water 15 01334 g001
Figure 2. Breakthrough curve of MBBR with different HRT. Vertical bars represent ±SD of the means (n = 3).
Water 15 01334 g002
Figure 3. Breakthrough curves of MBBR with different stirring intensities. Vertical bars represent ±SD of the means (n = 3).
Water 15 01334 g003
Figure 4. Biological regeneration performance of bio-ceramsite in different alkalinity ratios. Vertical bars represent ±SD of the means (n = 3). In bar chart, the different superscript letters mean significantly different (Tukey’s post hoc test, p < 0.05).
Water 15 01334 g004
Figure 5. Changing patterns of different forms of nitrogen, pH, and FA under different alkalinity ratios in MBBR. (a) 0.5 times; (b) 1 time; (c) 2 times; (d) 4 times. Vertical bars represent ±SD of the means (n = 3).
Water 15 01334 g005
Figure 6. The performance of Short-SND with different alkalinity addition ratios in MBBR. Vertical bars represent ±SD of the means (n = 3).
Water 15 01334 g006
Figure 7. Biological regeneration performance of bio-ceramsite in different DO levels. Vertical bars represent ±SD of the means (n = 3). In bar chart, the different superscript letters mean significantly different (Tukey’s post hoc test, p < 0.05).
Water 15 01334 g007
Figure 8. Changing of different forms of nitrogen under different DO levels in MBBR. (a) 3 mg/L; (b) 2 mg/L; (c) 1 mg/L; (d) 0.5 mg/L. Vertical bars represent ±SD of the means (n = 3).
Water 15 01334 g008
Figure 9. Performance of Shortcut SND with different DO levels in MBBR. Vertical bars represent ±SD of the means (n = 3).
Water 15 01334 g009
Figure 10. Mechanism of denitrogenating regeneration of the MBBR adsorption-shortcut SND.
Water 15 01334 g010
Table 1. Component of synthetic wastewater.
Primary NutrientsTrace Elements
ComponentConcentration (mg/L)ComponentConcentration (mg/L)
NH 4 Cl 100CuSO40.005
glucose167CoCl2·6H2O0.021
NaHCO3107Na2MoO4·2H2O0.016
KH2PO410.2ZnSO4·7H2O0.041
FeSO4·7H2O2.51H3BO30.15
MgSO4·7H2O5.71MnCl·4H2O0.211
CaCl2·7H2O1.54Vitamin D0.0002
Table 2. Adsorption parameters of MBBR with different HRT.
ParametersHRT = 12 hHRT = 8 hHRT = 6 h
Influent NH 4 + -N concentration (mg/L)26.18 ± 0.1126.20 ± 0.0826.24 ± 0.12
Adsorption breakthrough time (h)342014
Adsorption breakthrough concentration (mg/L)5.40 ± 0.655.01 ± 0.345.82 ± 0.44
Integral value of adsorption curve (mg·h/L)65.4626.4917.91
Input flow rate (L/h)0.50.751
Cumulative NH 4 + -N effluent (mg)32.7319.8717.91
Cumulative NH 4 + -N influent (mg)602.14 ± 1.72550.20 ± 1.57524.80 ± 1.13
Unit adsorption quantity (mg/g)1.0910 ± 0.0023 a1.0143 ± 0.0016 b0.9566 ± 0.0011 c
NH 4 + -N volume load (mg/(L·h))0.7706 ± 0.0019 a1.3100 ± 0.0023 b1.8714 ± 0.0035 c
Note: On one line with different superscript letters means significantly different (Tukey’s post hoc test, p < 0.05).
Table 3. Adsorption parameters of the MBBR with different stirring intensities.
Parameters60 r/min90 r/min120 r/min150 r/min
Influent NH 4 + -N concentration (mg/L)26.22 ± 0.0726.19 ± 0.0826.15 ± 0.1126.16 ± 0.10
HRT (h)8888
Adsorption breakthrough time (h)18202224
Adsorption breakthrough concentration (mg/L)5.21 ± 0.175.03 ± 0.145.08 ± 0.205.89 ± 0.15
Integral value of adsorption curve (mg·h/L)25.1827.2928.4332.78
Cumulative NH 4 + -N effluent (mg)18.8920.4721.3224.59
Cumulative NH 4 + -N influent (mg)511.29 ± 1.15549.99 ± 1.46588.38 ± 2.09627.84 ± 2.07
Unit adsorption quantity (mg/g)0.9354 ± 0.0016 a1.0143 ± 0.0024 b1.0912 ± 0.0038 c1.1546 ± 0.0045 d
NH 4 + -N volume load (mg/(L·h))1.4556 ± 0.0032 a1.3100 ± 0.0028 b1.1909 ± 0.0019 c1.0917 ± 0.0015 d
Note: On one line, with different superscript letters means significantly different (Tukey’s post hoc test, p < 0.05).
Disclaimer/Publisher’s Note: The statements, opinions and data contained in all publications are solely those of the individual author(s) and contributor(s) and not of MDPI and/or the editor(s). MDPI and/or the editor(s) disclaim responsibility for any injury to people or property resulting from any ideas, methods, instructions or products referred to in the content.

