Article

Multi-Analytical Approach to Evaluate Elements and Chemical Alterations in Pteris vittata Plants Exposed to Arsenic

by
Giuseppe Capobianco
1,
Maria Luisa Antenozio
2,
Giuseppe Bonifazi
1,
Patrizia Brunetti
2,*,
Maura Cardarelli
2,
Mariangela Cestelli Guidi
3,
Lucilla Pronti
3 and
Silvia Serranti
1
1
Department of Chemical Engineering, Materials and Environment, Sapienza University of Rome, 00184 Rome, Italy
2
IBPM-CNR, c/o Department of Biology and Biotechnology “Charles Darwin”, Sapienza University of Rome, 00185 Rome, Italy
3
INFN—National Laboratory of Frascati, Via Enrico Fermi 54, 00044 Frascati, Italy
*
Author to whom correspondence should be addressed.
Water 2023, 15(7), 1333; https://doi.org/10.3390/w15071333
Submission received: 1 March 2023 / Revised: 22 March 2023 / Accepted: 26 March 2023 / Published: 28 March 2023
(This article belongs to the Special Issue Water and Soil Pollution Restoration)

Abstract

:
The aim of this study was the development of a new multi-analytical approach to evaluate chemical alterations and differences in the element content in relation to arsenic (As) in the As hyperaccumulator fern P. vittata. P. vittata plants were grown on two natural As-rich soils with either high or moderate As (750 and 58 mg/kg). Dried samples from plant tissues were then analysed by means of micro-energy dispersive X-ray fluorescence spectrometry (μ-XRF), attenuated total reflectance Fourier transform infrared spectroscopy (ATR-FTIR) and hyperspectral imaging (HSI) with a multivariate approach. The As and micro- and macronutrients content was evaluated by μ-XRF and a significant correlation between As, potassium (K), iron (Fe), calcium (Ca) and manganese (Mn) contents were found at both moderate and high As levels. The same samples were then analysed by ATR-FTIR spectroscopy and HSI (SWIR range, 1000–2500 nm). Interestingly, by FTIR analysis it was found that the main differences between the control and the As-contaminated samples are due to the intensity of the absorption band related to polysaccharides (i.e., cellulose, hemicellulose and pectin), lignin, lipid and amide groups. The same chemical alterations were detected by an HSI analysis and all the FTIR and HSI data were validated by a PCA analysis. These results suggest a possible complexation of As ions with the amide group. Moreover, the proposed μ-XRF, HSI and ATR-FTIR combining approach could be a promising strategy to monitor in-field phytoremediation approaches by directly controlling the As content in plants.

1. Introduction

Phytoremediation, i.e., the use of green plants to remove pollutants from the environment, or to render them harmless, is an efficient environmentally friendly technology which can be used to remediate a variety of organic [1] and inorganic contaminants [2]. Among the inorganic contaminants, arsenic (As) has received considerable attention in recent years due to its high toxicity to humans, animals and plants. In particular, phytoextraction, the ability of hyperaccumulator plants to sequester pollutants in the harvestable part in large quantities, without showing signs of toxicity, is a promising strategy for As remediation. The fern Pteris vittata (P. vittata) is an As hyperaccumulator able to accumulate up to 23 g/kg of As in the fronds [3,4]. This aspect is particularly effective for the remediation of soils and water contaminated by As.
Several studies have been carried out to understand the localisation and distribution of As within the tissues of P. vittata plants by means of non-destructive X-ray-based techniques, such as micro-energy dispersive X-ray fluorescence spectrometry (μ-XRF) [5], X-ray absorption spectroscopy (XAS) [6] and μ-X-ray fluorescence imaging and fluorescence computed μ-tomography [7]. According to these data, As is adsorbed by roots and moved to the fronds and fiddleheads (young fronds) where it is stored and progressively distributed from the apex to the base [5]. In fronds, As is present mainly (95 ± 1%) in its reduced form, arsenite (AsIII), which is sequestered in the vacuoles to avoid its toxicity. The AsIII concentration in the frond is highest in the blade proximal to the veins and is lowest within the veins themselves [6]. Recently, it was found that AsIII is distributed mainly in the endodermis and pericycle, while arsenate (AsV) is in the vascular bundles [7].
The possibility of integrating X-ray-based technologies with infrared-based techniques could be a winning strategy to follow phytoextraction processes in the field. In fact, a handheld µ-XRF analyser or gun could be a valid instrument to quickly analyse the As content in plants grown in the open field. In addition, infrared-based techniques could be used to follow plant growth parameters, to monitor plant health during in-field phytoremediation processes. Moreover, infrared-based techniques provide information concerning the structural components of the cells. In more detail, these techniques generate a spectrum by the vibrations of bonds within chemical functional groups that can be considered as a biochemical or metabolic “fingerprint” of the sample. In most cases, the structure of the plant biomass is already known, the absorption peaks of the molecular bonds can be found in the literature and changes in some of these absorption peaks due to the presence of any plant abiotic or biotic stress can be detected. So far, this kind of logic has been used, for example, to monitor wheat cultivars and their different responses to disease stress [8], or in olive plants to evaluate the nutritional status and eventual nutritional deficiencies [9].
It is known that As impairs plant growth as it hampers the absorption of certain nutrients (such as phosphorus, P), decreases the rate of photosynthesis and reduces the production of ATP. Furthermore, As causes damage to the structure and integrity of the cell membranes. The most harmful effect caused by As-induced stress is lipid peroxidation. This reaction takes place in both cellular and organelle membranes where in the presence of As the level of Reactive Oxygen Species (ROS) exceeds a tolerable threshold, causing in turn the production of lipid-derived cytotoxic products, which affect the normal cellular functions, forming conjugates with both DNA and proteins. Among these products, malondialdehyde (MDA) was recently used as an indicator of As-induced lipid peroxidation [10]. Singh et al. [11] observed a higher accumulation of MDA in Pteris ensiformis than in P. vittata, suggesting that P. vittata was able to produce a low level of ROS and maintain better homeostatic control, under As-induced stress. Moreover, the overproduction of ROS increases the polyunsaturated fatty acid (PUFA) and reduces the saturated fatty acid of membrane lipids and membrane fluidity, thereby increasing membrane leakage.
In Brassica napus L. [12], Panax notoginseng [13], Cynodon dactylon [14] and P. vittata [15], it was shown that As is present in the cell walls, suggesting a possible interaction with the cell wall components. The cell wall is a porous and highly dynamic layer that consists of a scaffold of cellulose fibrils embedded in a porous matrix that mainly contains pectin, hemicellulose, proteins, lignin and enzymes [16]; thus, its structure could be highly affected by environmental factors, such as toxic metals.
Recently, a correlation was found between the presence of As and the induction of the enzymatic activity that causes a remodelling of the structures of pectins and hemicelluloses. As a consequence, there is an increase in cell wall porosity, which possibly enhances its permeability, allowing the entering of As. At the same time, to reduce the uptake of As, more lignin is produced in the cell wall in order to make it more resistant [17].
To evaluate a possible interaction of As with the functional groups of the cell wall components, we identified the chemical alterations in the polysaccharides (i.e., cellulose, hemicellulose and pectin), lignin, lipid and amide groups. To reach this goal, on the same plant dried sample, an innovative “multi-analytical approach” based on the use of FTIR spectroscopy, HSI and µ-XRF was applied.

2. Materials and Methods

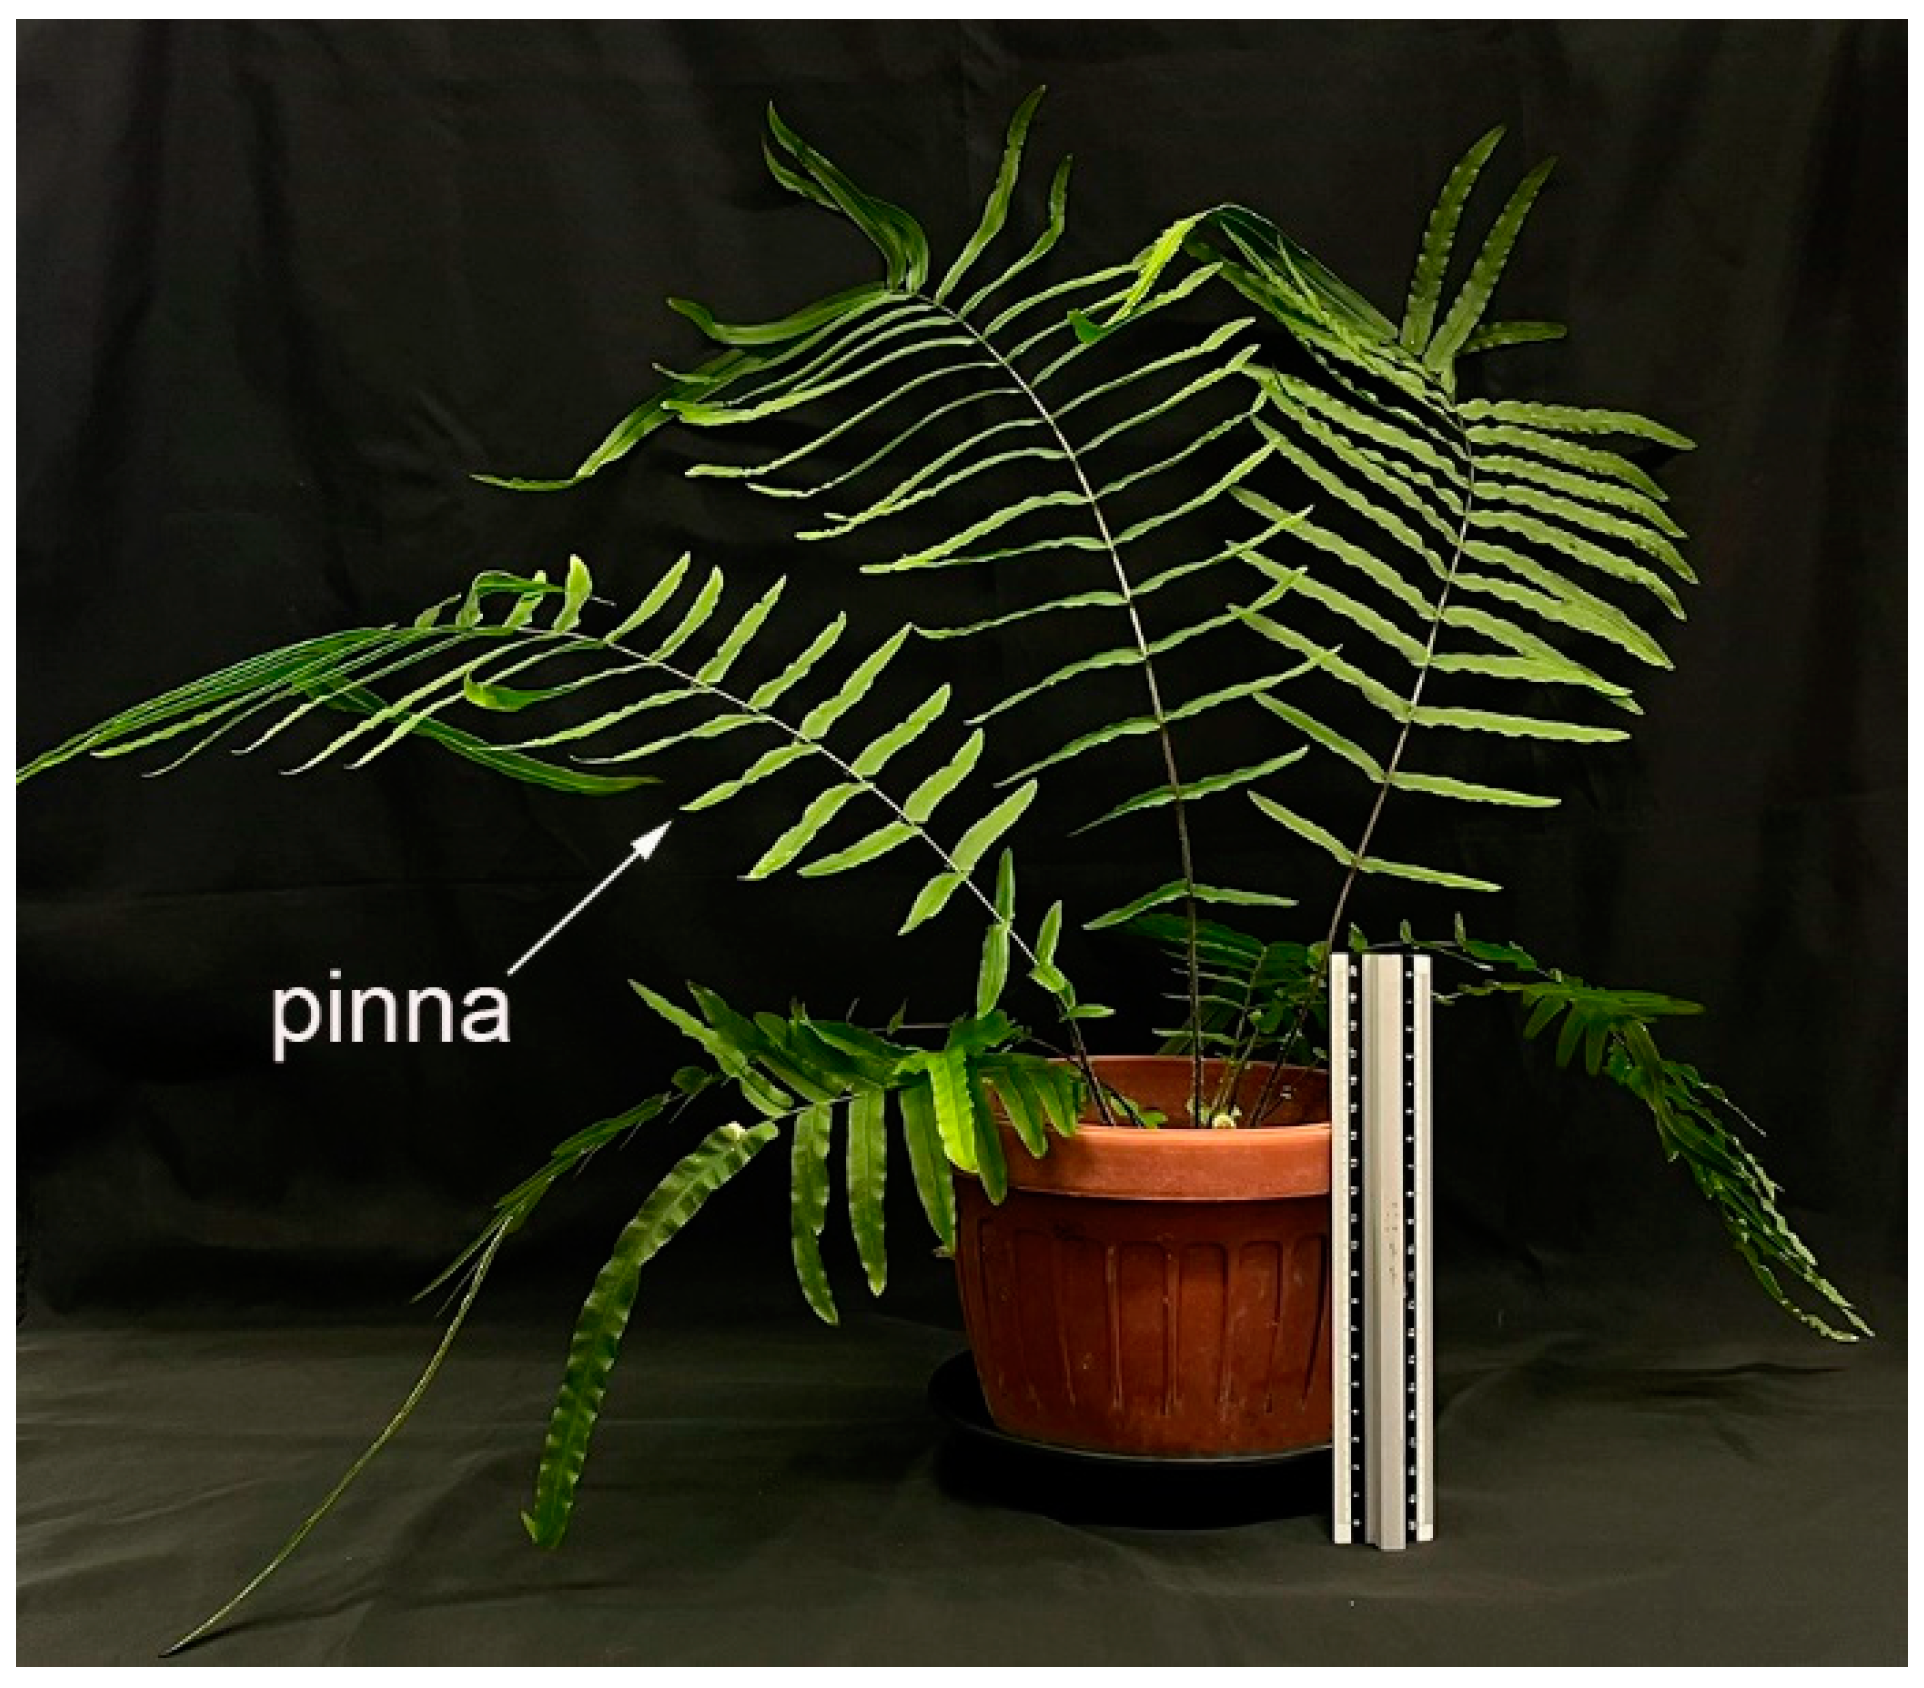
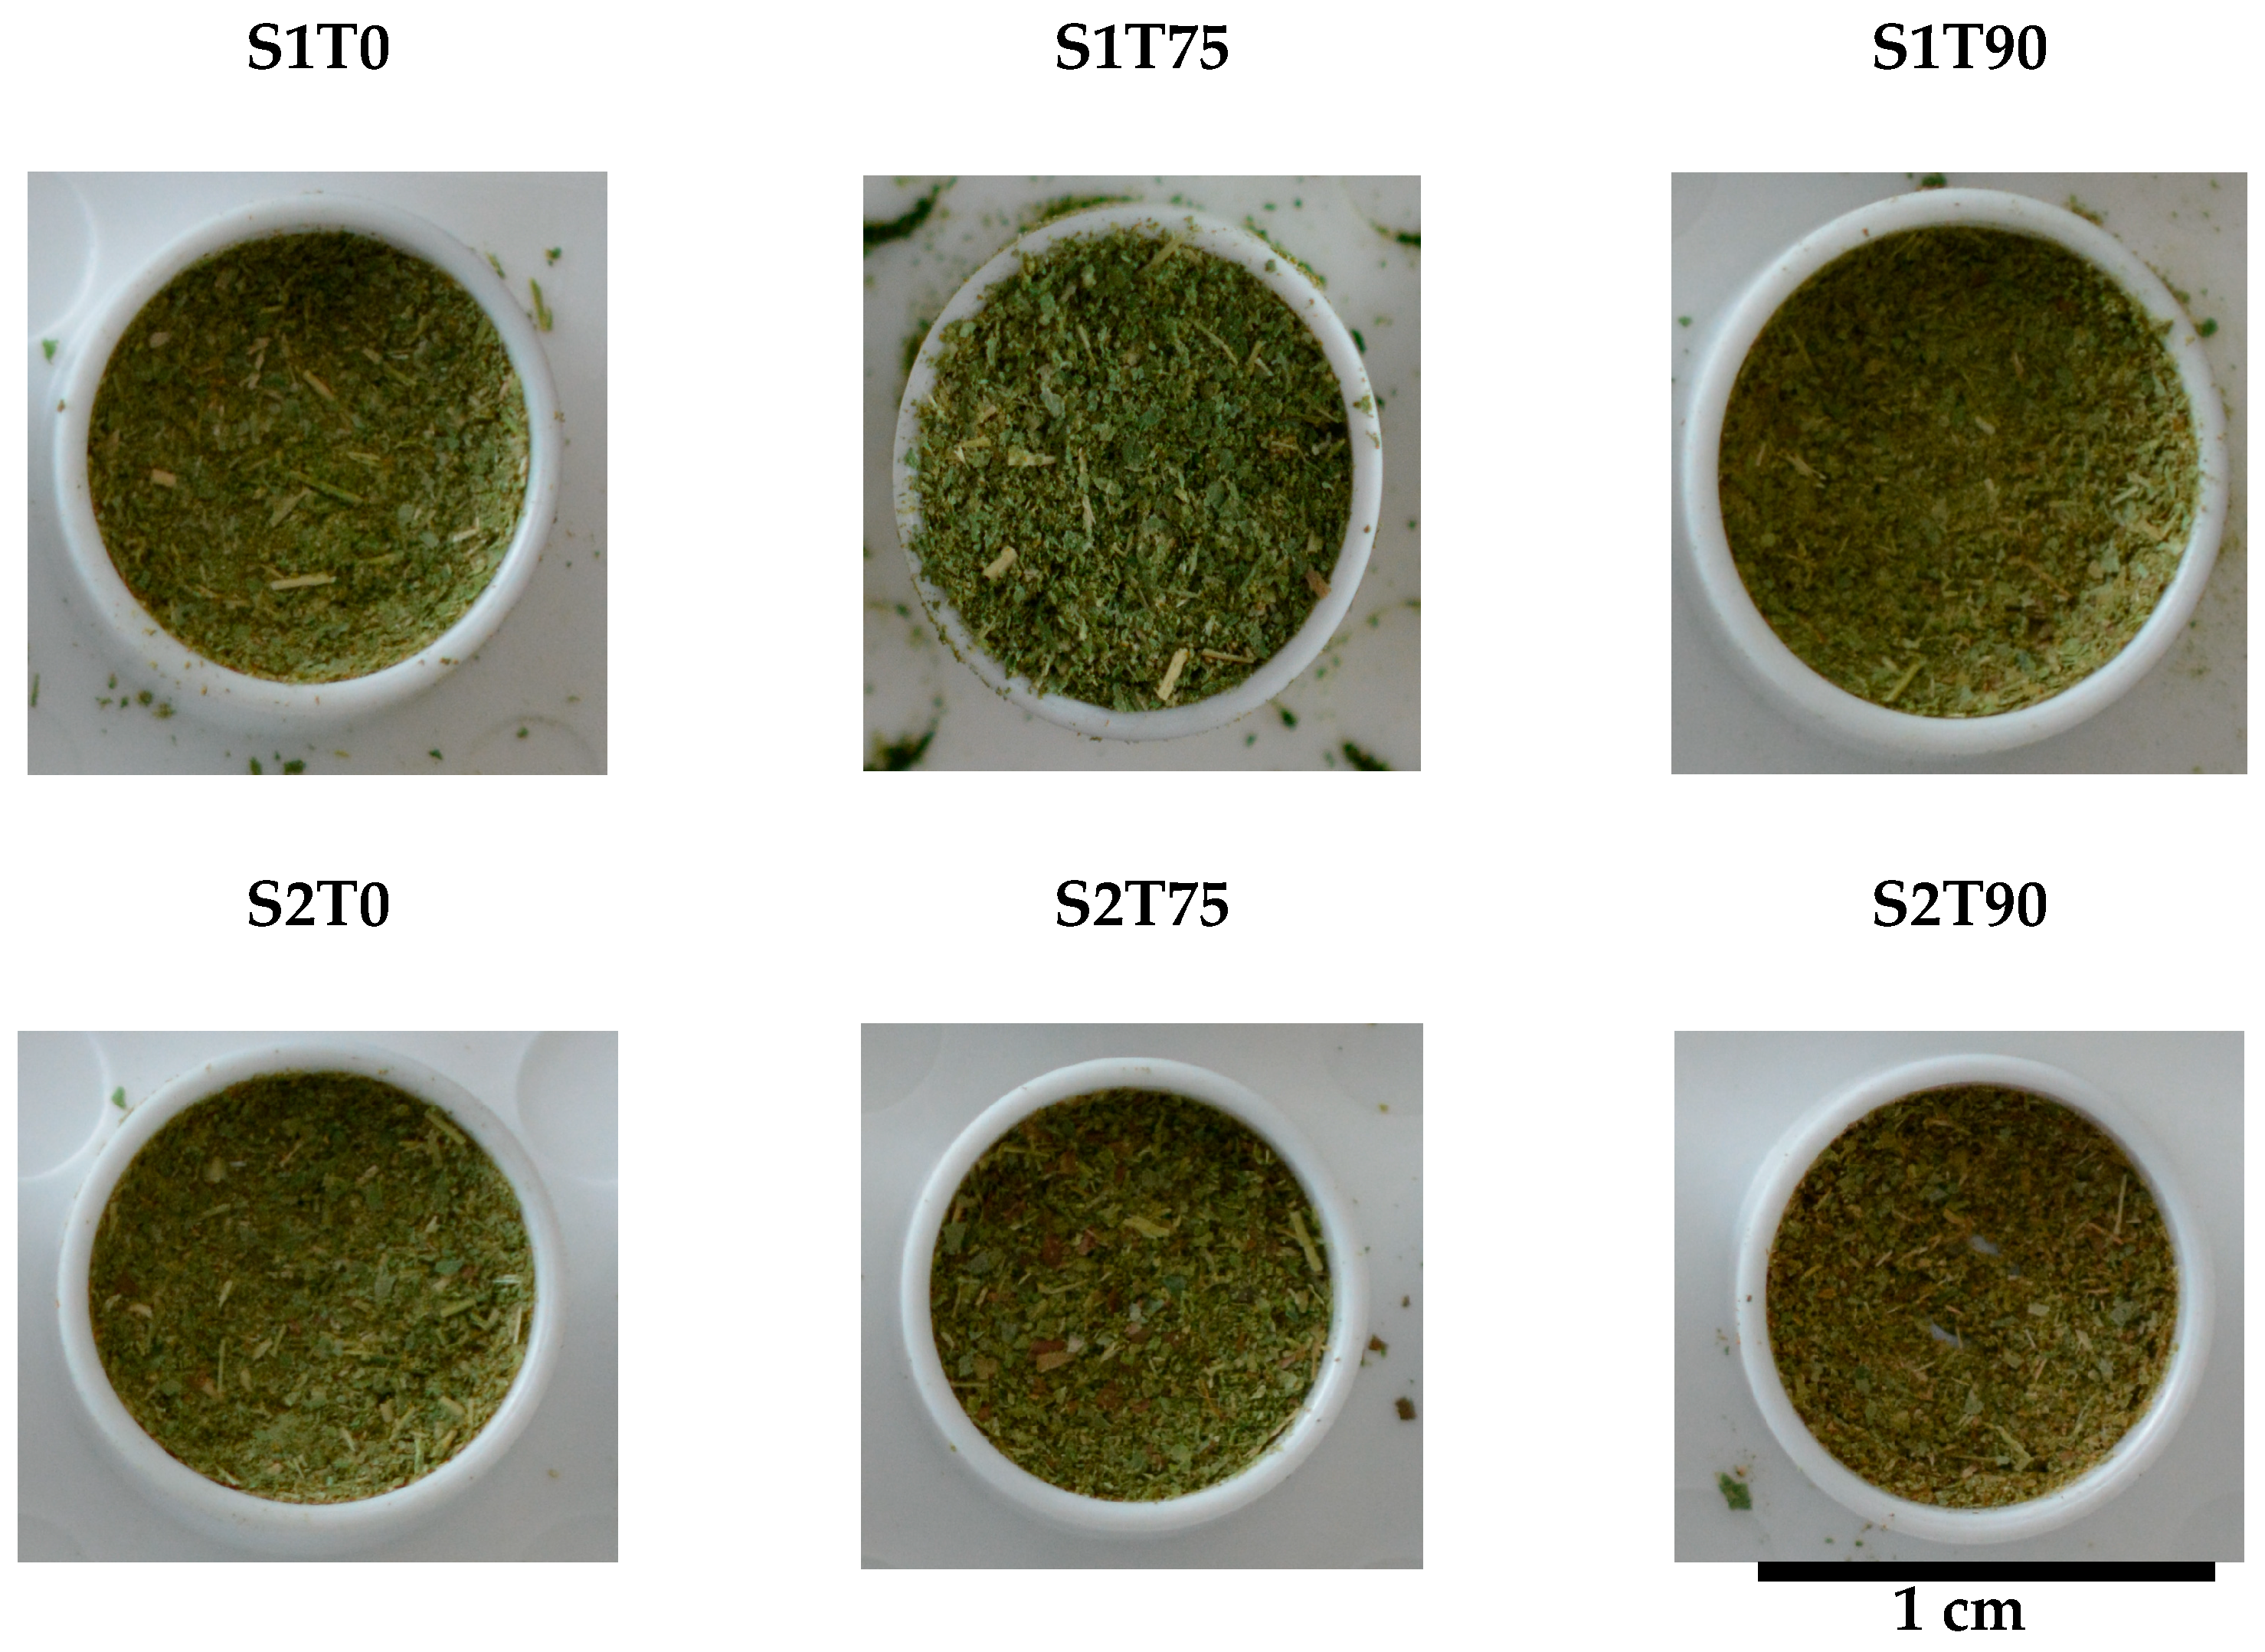
2.1. Plant Growth and Sample Preparation

The propagation and growth of ferns were performed in the greenhouse under controlled conditions as previously described [18,19]. In detail, spores from mature P. vittata fronds were resuspended in water and sown in pots with soil. After 8 weeks from spore germination, sporophytes of about 2 cm tall were moved each in a single pot (7 × 7 × 8 cm). The 6-month-old ferns with 7–8 fronds and about 30 cm tall were transferred and grown up to 90 days in pots (20 cm-diameter 14 cm-high) containing naturally As-rich soil, with two different As concentrations, Soil 1 (S1) and Soil 2 (S2), with average As concentrations of 58 mg/kg and 750 mg/kg, respectively [5,18,20] (Figure 1). S1 samples were collected from Grignano, located in the western side of Vetralla (Lazio, Italy) (42°17′51.0″ N 12°04′12.8″ E), near a source of water collection, from which As-contaminated water is filtered and distributed in the local aqueduct. S2 samples were collected near the thermal spring of Bagnaccio, in the western side of Viterbo (Lazio, Italy) (42°27′30.4″ N 12°03′55.9″ E) as indicated in Antenozio et al. [18]. Arsenic content was measured by ICP-OES (Optima 8000DV, Perkin Elmer Corp., Norwalk, CT, USA).
For micro-energy dispersive X-ray fluorescence spectrometry (μ-XRF) and attenuated total reflectance Fourier transform infrared spectroscopy (ATR-FTIR), a pinna for each frond was collected at 75 and 90 days from 4 different plants and treated as described in Capobianco et al. [20], to obtain pinna powder (Figure 2). Plant samples obtained from ferns grown on S1 or S2 As-rich soils will be called S1 or S2, respectively.

2.2. The μ-XRF Device

An M4 Tornado, Bruker® μ-XRF benchtop spectrometer (Berlin, Germany), equipped with a Rh X-ray tube with polycapillary optics and XFlash® detector, (Bruker®, Berlin, Germany), was utilised to perform the analysis. The polycapillary optic allows the focusing of tube radiation, on a spot size of ~30 μm. Spectrum energy calibration was performed daily, before each analysis batch, by using zirconium. Spectrum energy calibration was performed, before analysis using Bruker® calibration standard (Berlin, Germany). The sample chamber was evacuated to 25 mbar and, therefore, light elements can be measured. A total of 30 measurements were executed on the powder surface for each sampling day in order to evaluate the effect of sample surface heterogeneity.

2.3. The HSI Device

A Specim SISUChema XLTM analytical station, embedding with an ImSpectorTM N25E (Specim Ltd., Oulu, Finland), acting in the range of 1000 to 2500 nm, with a spectral sampling/pixel of 6.3 nm, coupled with an MCT camera (320 × 240 pixels), was used to perform HSI measurements in the SWIR (1000–2500 nm) region. The spectral resolution was 10 nm, with a 6.3 nm for pixel spectral sampling. The object-plane scanner’s chosen configuration has a field of view of 5 cm, and its pixel resolution was 150 µm. The sample was energised using SPECIM’s® diffuse line illumination equipment (Oulu, Finland). Before each scan, the scan-light is confirmed and automatically calibrated by a certified standard target of diffuse reflectance (Spectralon) also embedded in the instrument.

2.4. The FTIR Device

FTIR spectra were recorded using a Vertex 70 spectrometer (Bruker®, Berlin, Germany) using the attenuated total reflectance (ATR) accessory (diamond used as crystal). All the spectra were collected from 4000 to 400 cm−1. The spectra were acquired with 128 scans and 4 cm−1 of spectral resolution. Each measurement was performed in triplicate and five points were selected for measurement.

2.5. Principal Component Analysis (PCA) and Partial Least Square-Discriminant Analysis (PLS-DA)

Principal component analysis (PCA) [21] was applied for exploratory data analysis. PCA is a technique giving an overview of multivariate data. PCA was used to integrate the spectral variations in each collected spectrum dataset by decomposing the “processed” spectral data into a number of principal components (PCs), which are a linear combination of the original spectral data. In fact, samples are characterised by their common characteristics, which are typically analysed by the first few PCs. In fact, on the score plot of the first two or three components, samples with comparable spectral characteristics tend to group together. While samples with distinct spectral properties will be clustered in other areas of this space, samples with comparable spectra belonging to the same class of products are grouped in the same region of the score plot connected to the first two or three PCs.
Partial Least Square-Discriminant Analysis (PLS-DA) was applied to build the classification model [22]. PLS-DA is a linear classification method that combines PLS regression characteristics with classification technique discrimination power. PLS-DA is based on the PLS regression algorithm, which looks for latent variables having a maximal correlation with the Y-variables. Because the latent variables (LVs), which are a linear combination of the original variables, are used to model the relevant sources of data variability, the main benefit of PLS-DA is that it enables graphical visualisation and understanding of the various data patterns and relationships by LV scores and loadings. LVs are determined by loadings, which are the coefficients of variables in linear combinations.

2.6. Statistical and Spectral Analysis

FTIR- and HSI-derived spectral data were analysed by adopting standard chemometric methods [23,24], with the PLS_Toolbox (Version 7.8 Eigenvector Research, Inc., Wenatchee, WA, USA) running in Matlab (Version R 2021b, The Mathworks Inc., Natick, MA, USA). More in detail, the spectra preprocessing was performed as follows: raw spectra were preliminary cut, at the beginning and at the end of the investigated wavelength range, in order to eliminate unwanted effects due to lighting/background noise. The different preprocessing combinations were used for the following purposes: detrend was applied to reduce the effects of light scattering [23]; Savitzky–Golay (SG) derivative was used to emphasise detected spectral differences and to reduce noise in the analysed samples [23,25]; finally, Mean Centre (MC) was applied for data centring [26].

3. Results and Discussion

3.1. Results by µ-XRF Analyses

The P. vittata plants were grown for 75 and 90 days on two previously used soils at a moderate (S1 soil) and high (S2 soil) concentration of As [20], in order to have a significant range of As content in the plant tissues (from 1.94 mg/kg DW to 29.62 mg/kg DW). The As and micro- and macroelements concentrations were measured by µ-XRF. To analyse the level of As and essential elements in the powders from the P. vittata fronds, 30 measurements were performed on the flattened surface of the powders for each sampling point. The spectra obtained from the analysis of each sample contain the characteristic Kα of As (10.54 keV), as well as of Mg, Si, P, S, K, Ca, Mn, Fe and Zn. The semi-quantitative results obtained by deconvolution are summarised in Table 1. At time 0 As was not detectable, while at 75 and 90 days the amount of As detected is similar in both soils. As observed in our previous work [20], a positive correlation between the As and potassium (K) contents and a negative correlation between the As and iron (Fe), calcium (Ca) and manganese (Mn) contents were found at both moderate and high As levels.

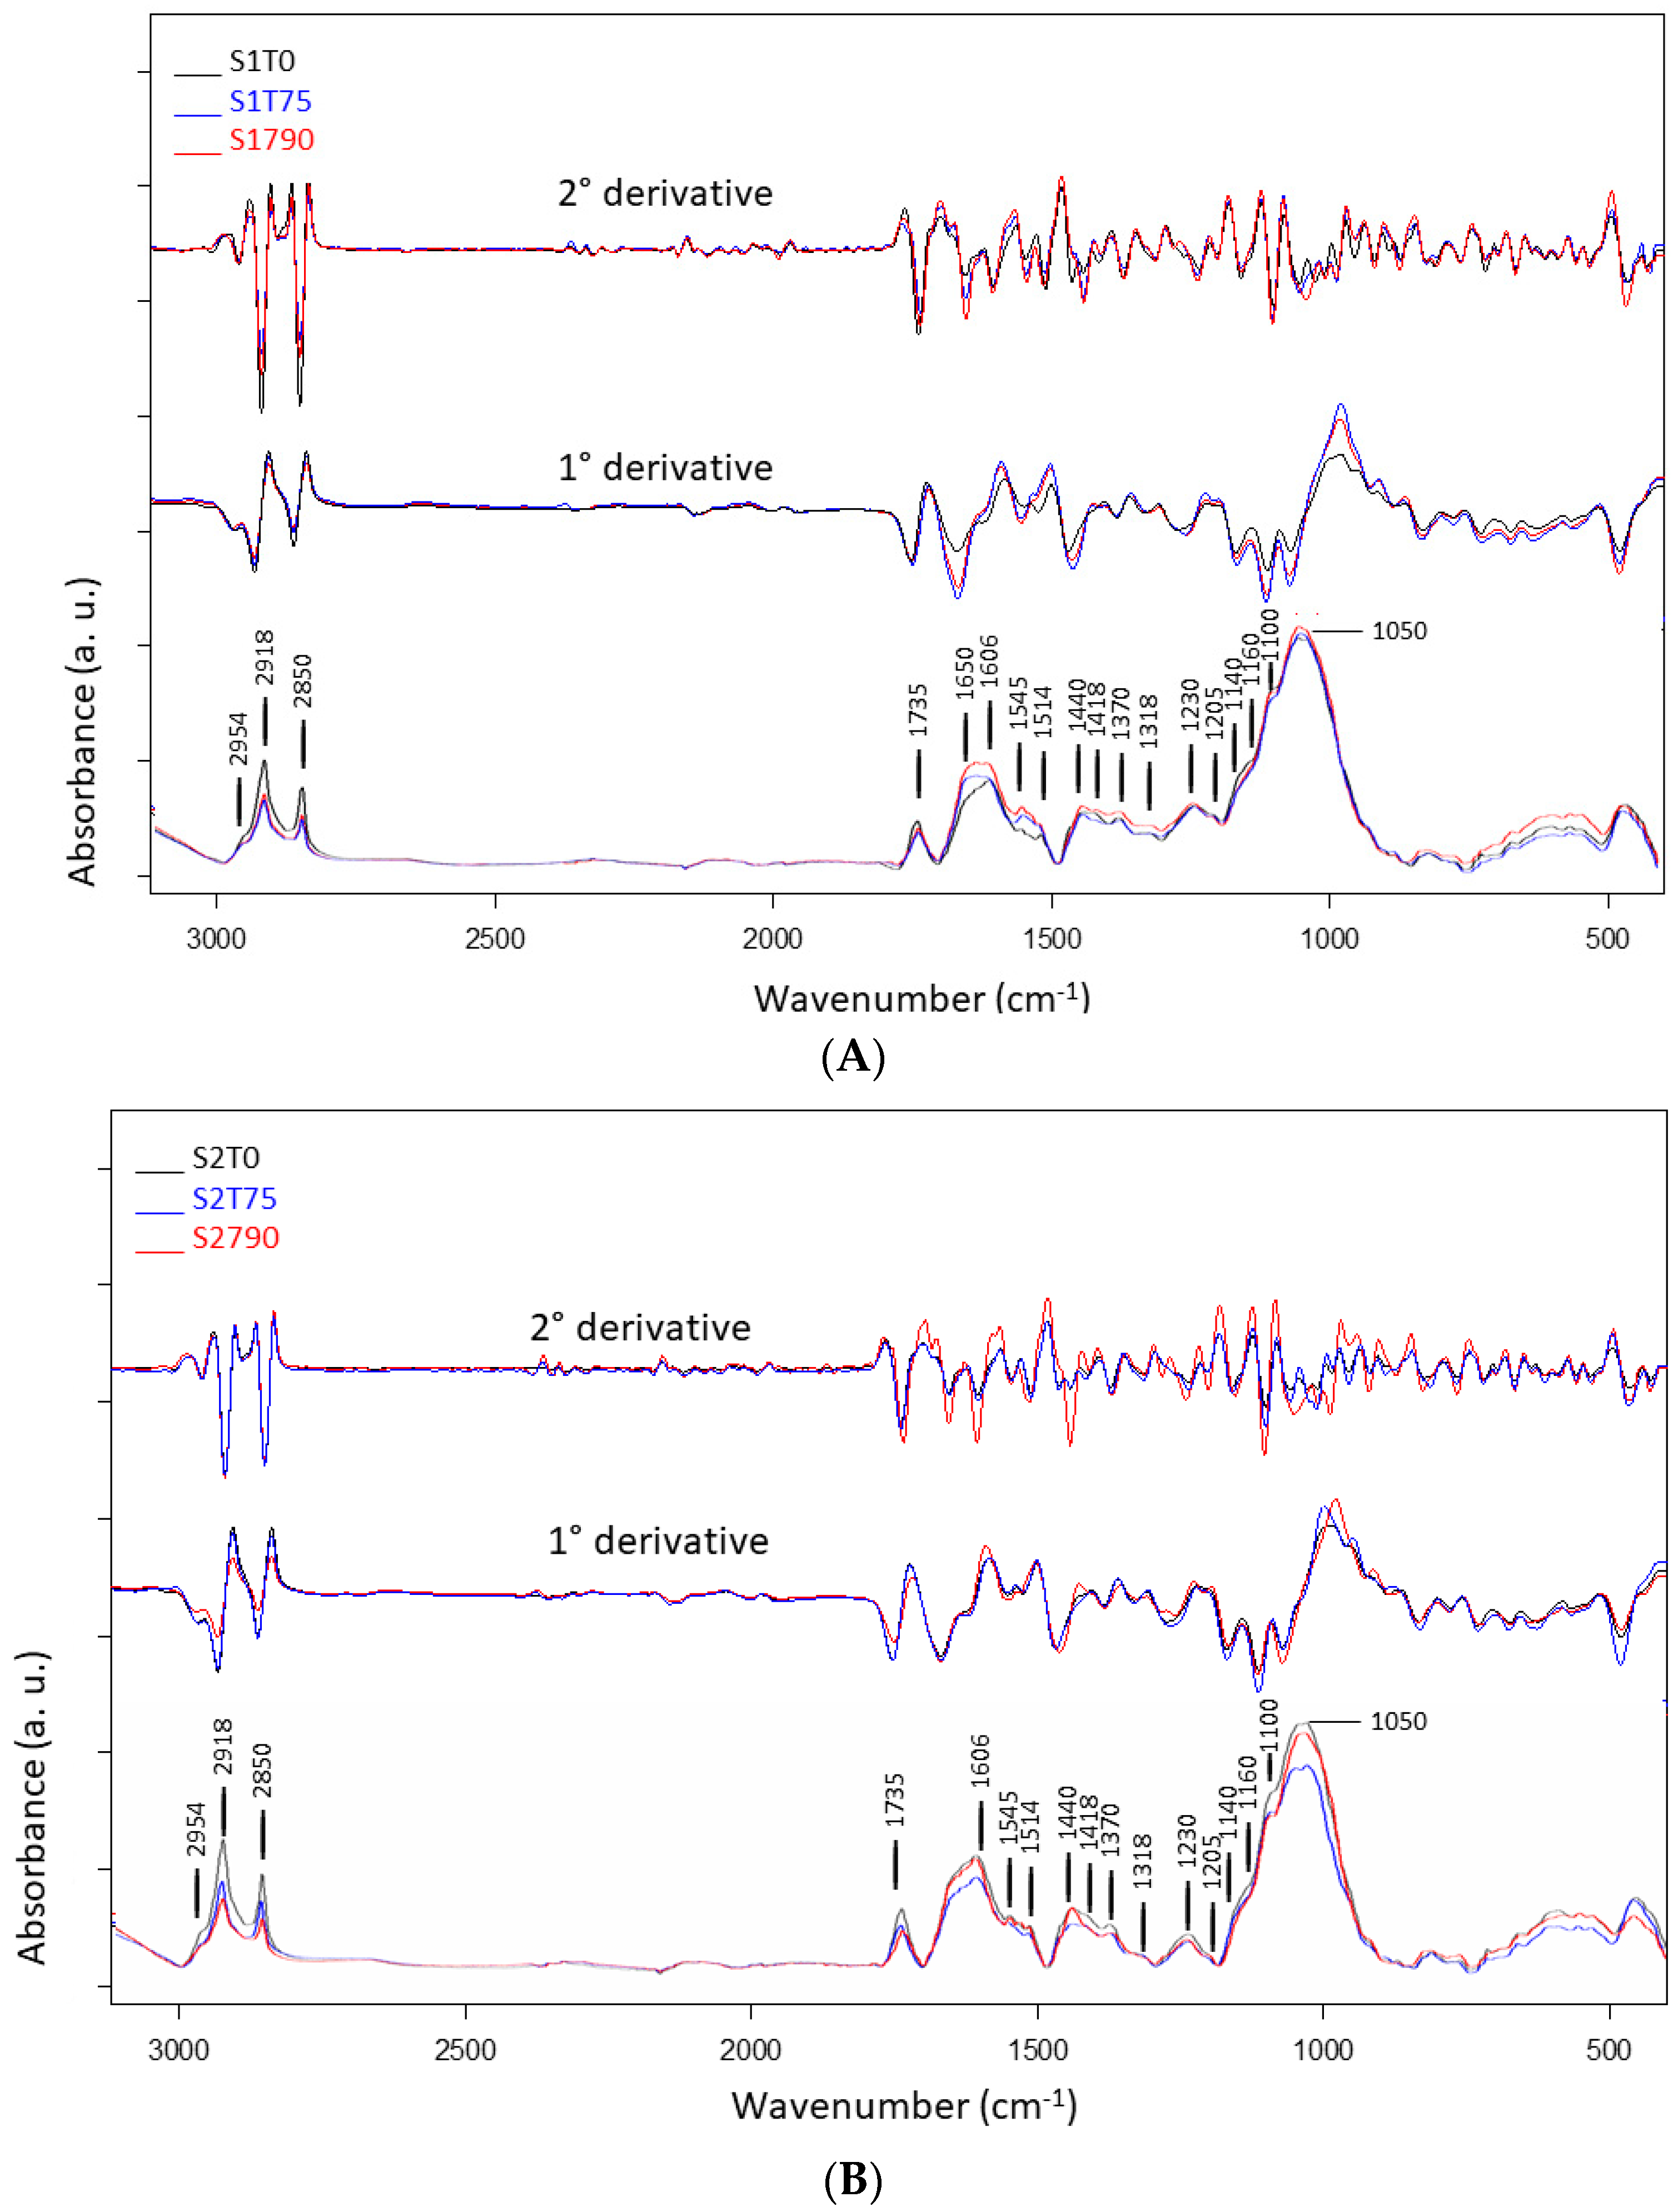
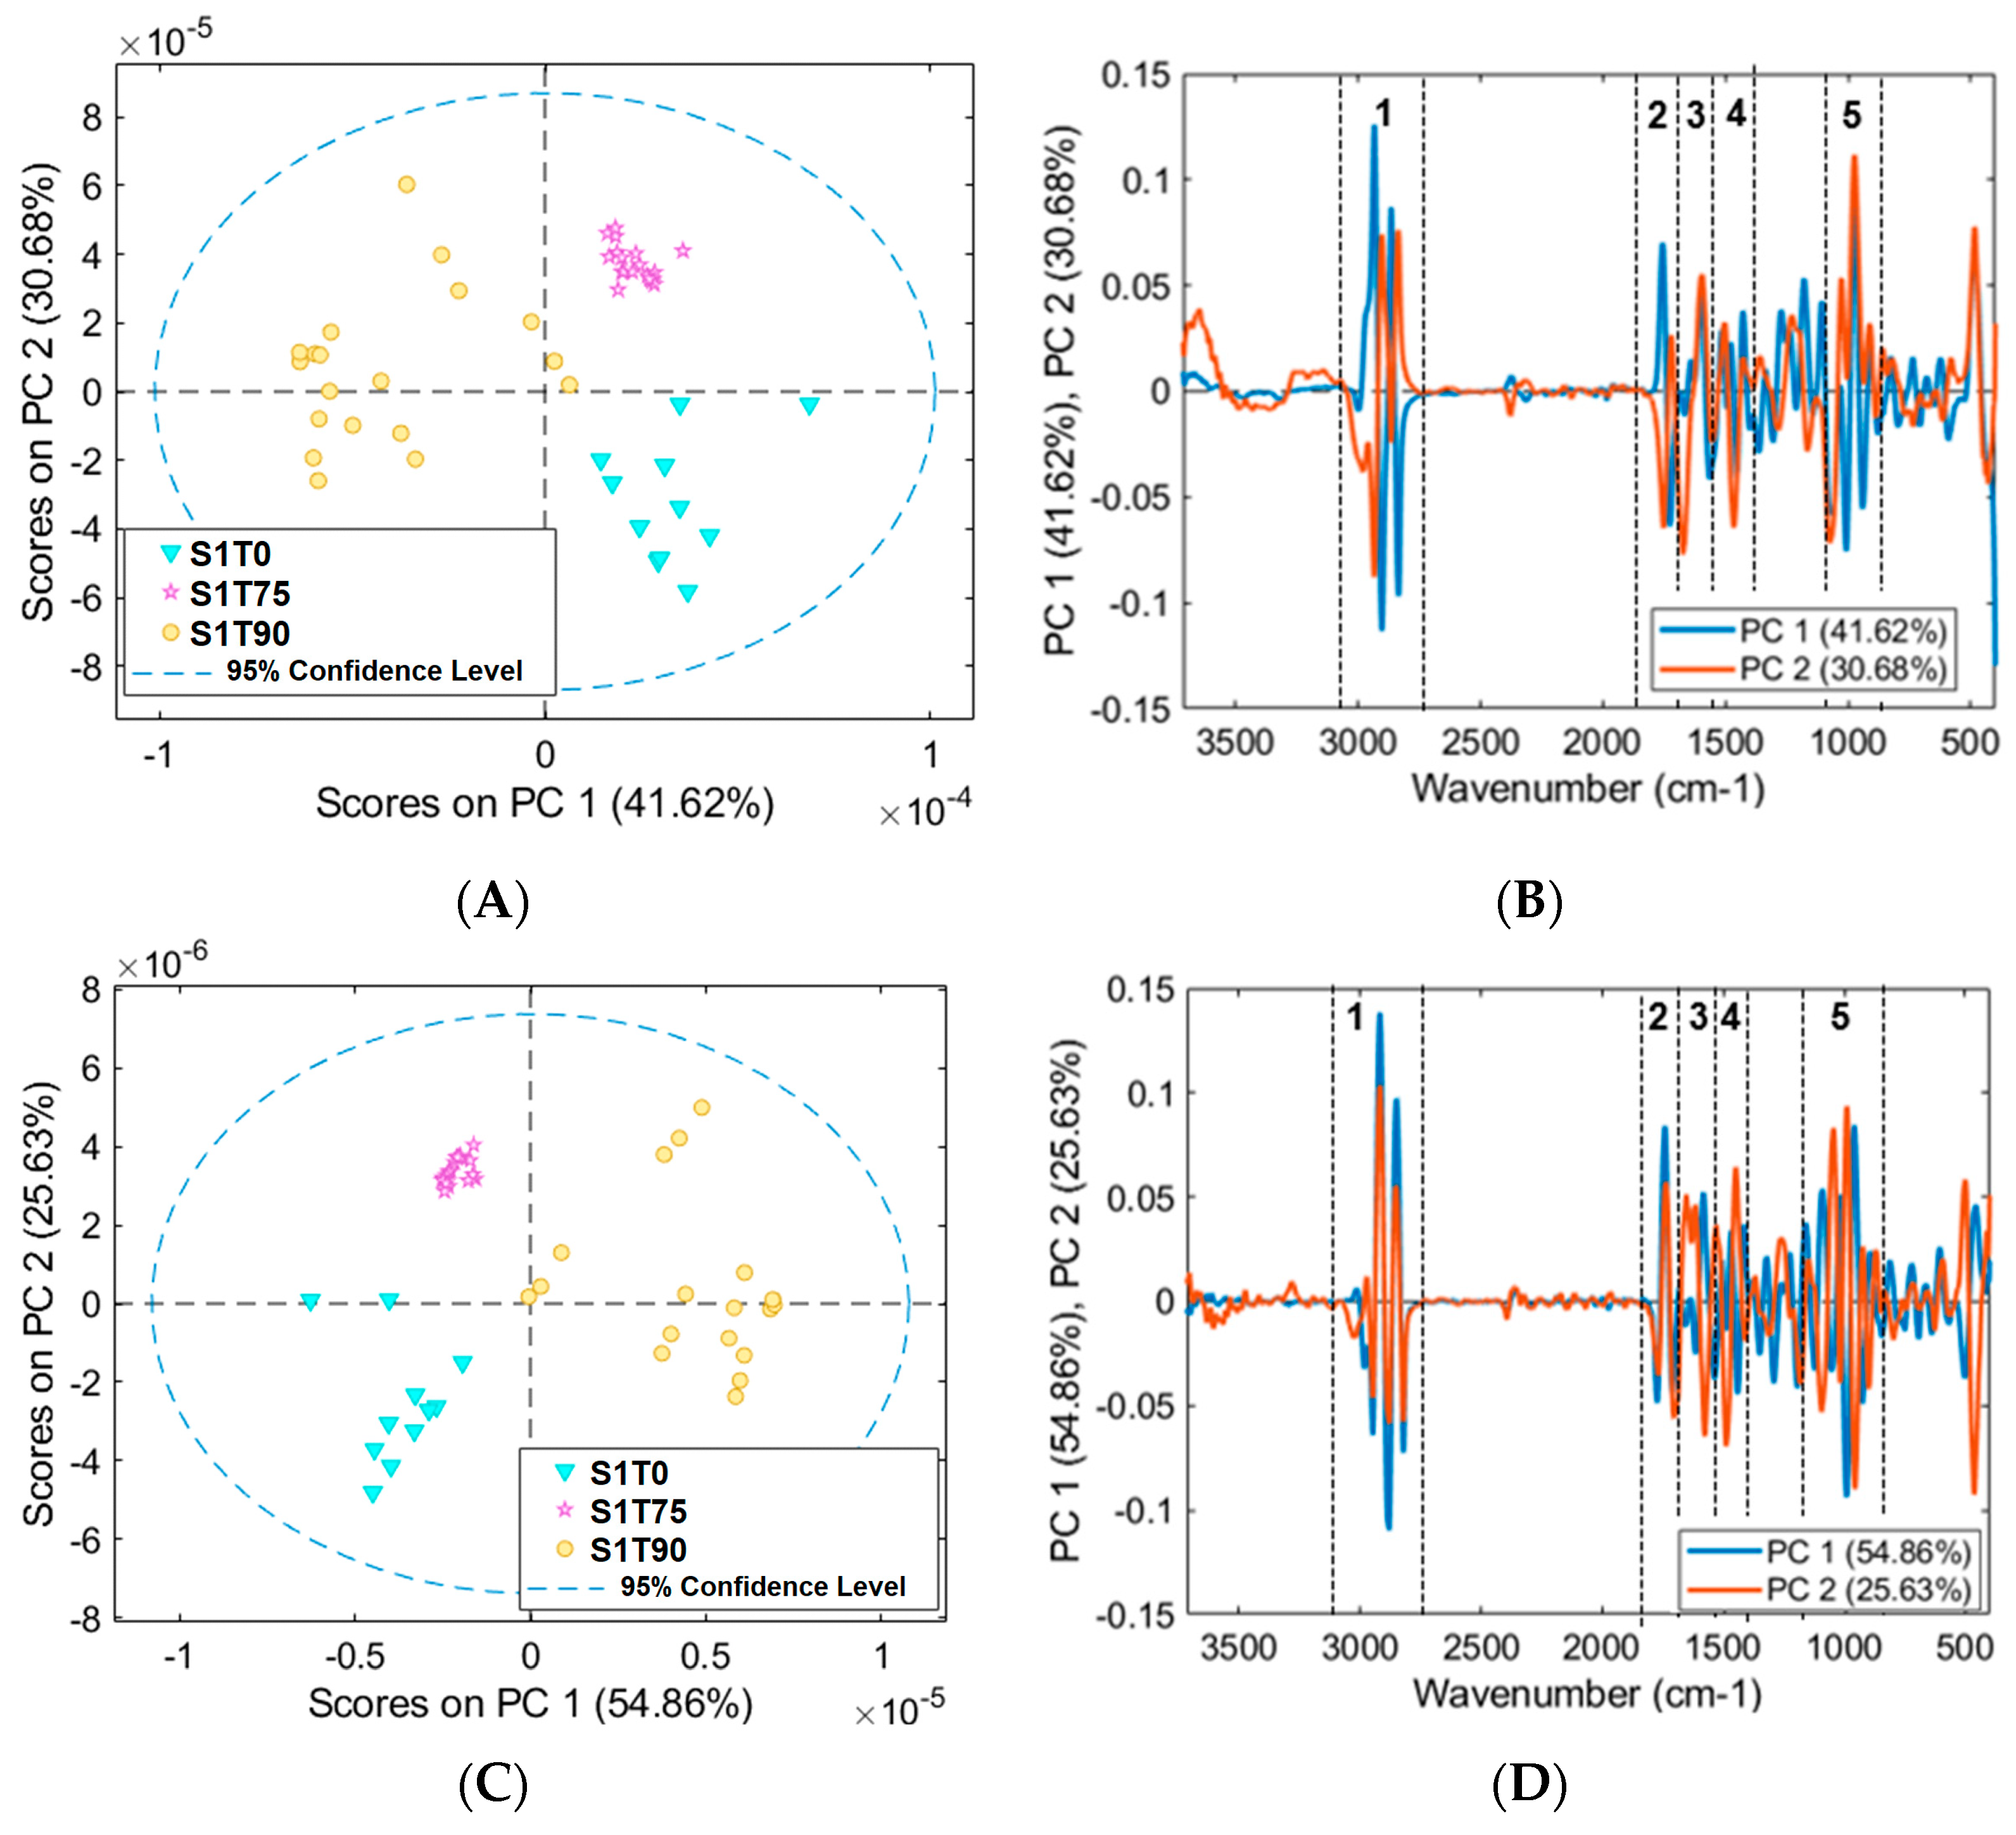
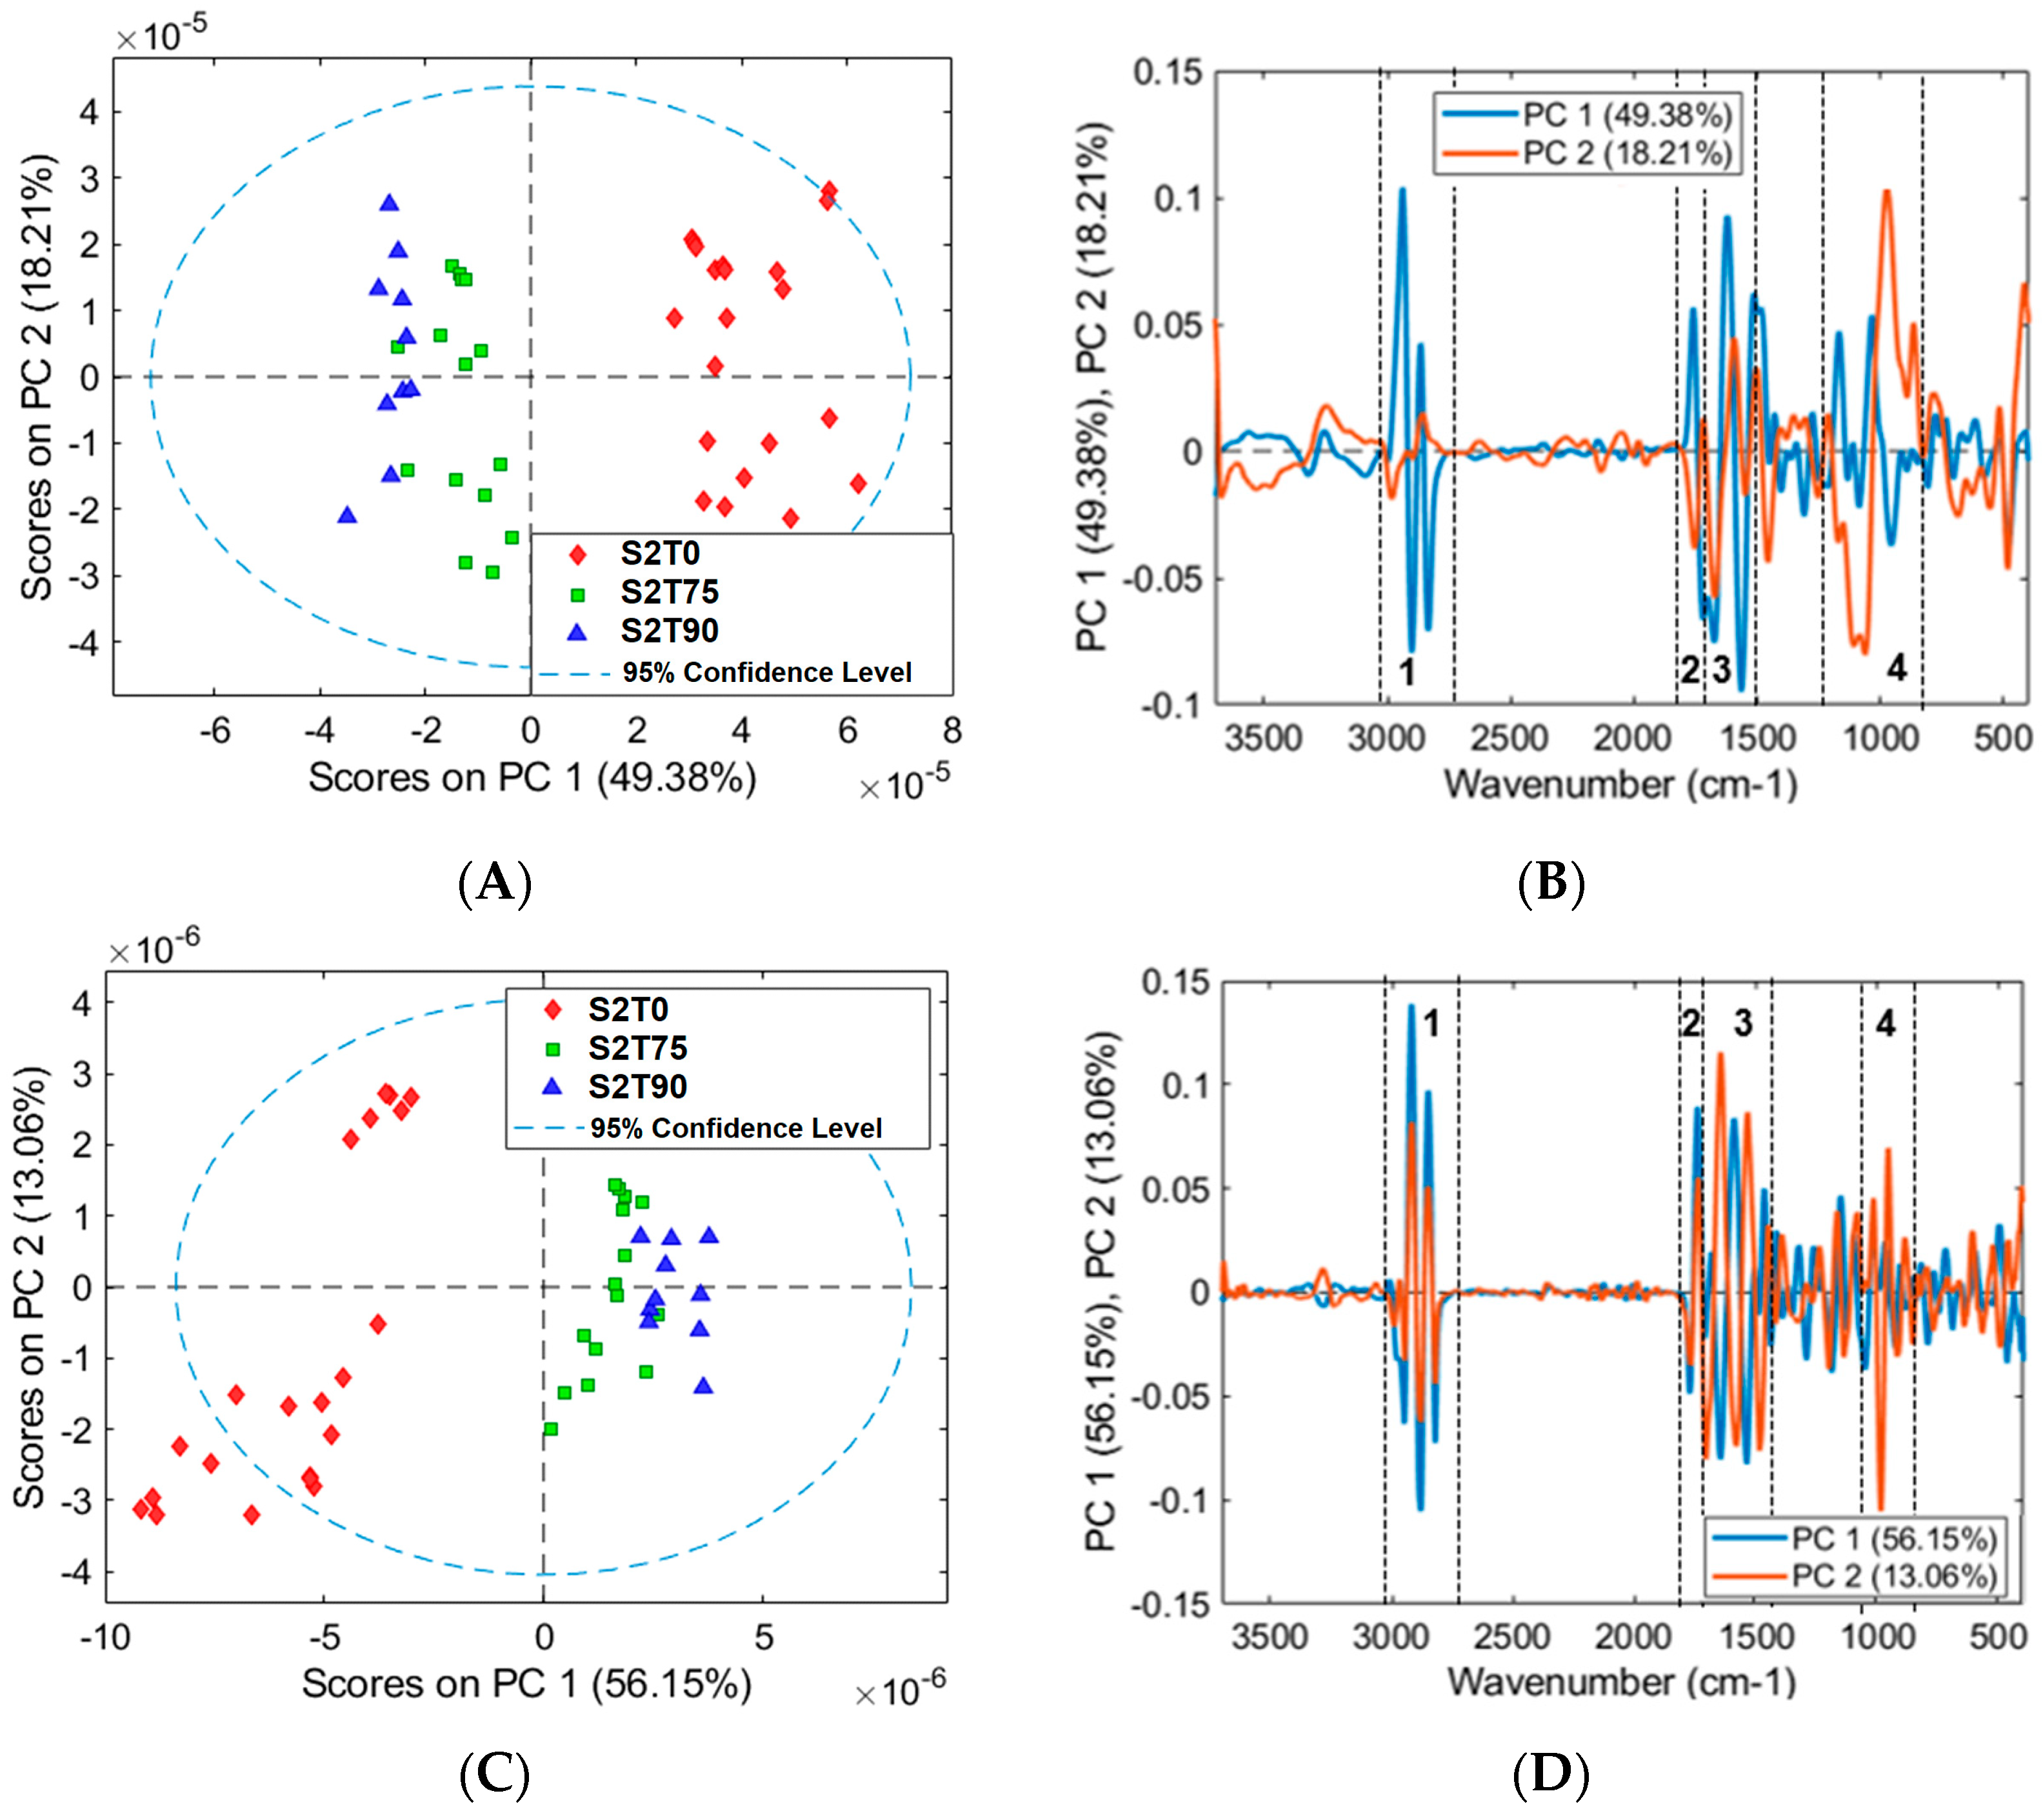
3.2. Mean Spectra and PCA Models of Samples for FTIR Analysis

In order to evaluate a possible interaction between As and the main components of the cell wall, the same samples described above were analysed by FTIR spectroscopy and the HSI technique. The plant cell wall is composed of several organic compounds among which the main classes are polysaccharide (i.e., cellulose, hemicellulose and pectin), lignin, wax and proteins [27].
The polysaccharide structures (i.e., cellulose, hemicellulose and pectin) and lignin are mainly characterised by two strong bands at 1050 and 1030 cm−1 assigned to C-O, C=C and C-C-O stretching [28]. Other absorption bands are 1240 cm−1 (C-O stretching), 1318 cm−1 (C-H bending), 1370 cm−1 (C-H deformation and bending), 1440 cm−1 (C-H bending), 1514 cm−1 (C=C-C aromatic ring stretching), 1100 cm−1 (C-O and C-C stretching) and 1160 cm−1 (C-O-C asymmetric stretching). The waxes displayed absorption bands at 2950, 2918, 2850 cm−1 due to the C-H stretching mode, and the C=O and C-C(=O)-O stretching bands at 1735 cm−1 and 1160 cm−1. The bands at 1606 and 1545 cm−1 are assigned to proteins, while the shoulder at about 1650 cm−1 is attributed to the amide I (C=O stretching mode). All the band positions and assignments are shown in Table 2. The FTIR spectra show that both the S1 and S2 samples displayed significant biochemical discrimination from the control ones, as shown in Figure 3A and 3B, respectively. The first and second derivative spectra show that the main absorption bands of the polysaccharide structures from 1140 to 1030 cm−1 change their relative intensity. Other changes involve the region of amide I and II (1700–1500 cm−1), carbonyl (1800–1700 cm−1) and lipid (3000–2800 cm−1). One of the main differences between the control and S1 and S2 samples is the absorption band at about 1640 cm−1 (appearing as a shoulder in the spectra), attributed to the presence of the amide group (N-H stretching and C=O stretching vibration) that appears more intense. The changes are probably due to the complexation of As ions with amide groups of proteins [29].
The PCA scores and loading plot of the S1 samples are shown in Figure 4 by preprocessing the first and second derivative spectra. Both PCA score plots show a good separation between S1T0, S1T75 and S1T90 (Figure 4A–C). The loading plot calculated from the first and second derivative spectra (Figure 4B–D) shows that the values of PC1 and PC2 are mainly due to the absorption around 2900, 1754, 1680, 1470 and 1075 cm−1 that correspond to the lipids, amide I, polysaccharide and lignin contents. The differences between S1T75 and S1T90, shown in both loading plots (Figure 4B–D), are linked to the spectra contribution of the lipid (2953 and 2840 cm−1) and polysaccharide content (1055 and 940 cm−1).
The PCA scores and loading plot of the S2 samples are shown in Figure 5, by performing the preprocessing of the first and second derivative spectra. Both PCA score plots show a good separation between S2T0 from S2T75 and S2T90. (Figure 5A–C). The cluster separation between S1T75 and S1T90 is very slight compared to the S1 samples. The loading plot calculated from the first and second derivative spectra (Figure 5B–D) shows that the values of PC1 and PC2 are mainly due to the absorption around 2918, 2850, 1760, 1620 and 1170 cm−1, corresponding to the lipids, amide I, polysaccharide and cellulose bands. Despite the first derivative preprocessing highlighting different spectral features from the second derivative one, the cluster separation obtained from both datasets shows similar results for both the S1 and S2 samples.
The abovementioned band vibrational variations could be related to the As interaction with the cell wall components. Our results are in agreement with what was previously shown in accumulator and hyperaccumulator plants. In accumulator plants, about 50% of As is retained in the leaf cell wall [12,13,14] to protect plants against the stress of heavy metals. Moreover, despite in hyperaccumulator plants where As was mainly found in the cytoplasmic supernatant fraction, probably due to the vacuole compartmentalisation, in P. vittata fronds it was shown that about 20% of the total As was retained in the cell wall fraction [14,15]. The cell wall contains a large amount of metal ion coordination groups, such as hydroxide, carboxyl, aldehyde, amide and phosphate, which may interact with metal ions [38,39]. It was reported that the Cu and Zn in Athyrium yokoscense and Cd in Thlaspi caerulescens, Nicotiana tabacum and Athyrium yokoscense were stored in the cell wall as ions or were bound to the structural matter, such as xylogen and cellulose [40,41].
According to our results, Huang et al. [17] showed a variation in the same stretching band signal related to the hemicellulose, pectin and lignin content in the roots of cabbage plants, with the increase in As concentration in the growth medium. The authors also showed As retention mainly in these cell wall fractions, suggesting an increase in the number of binding sites for As.

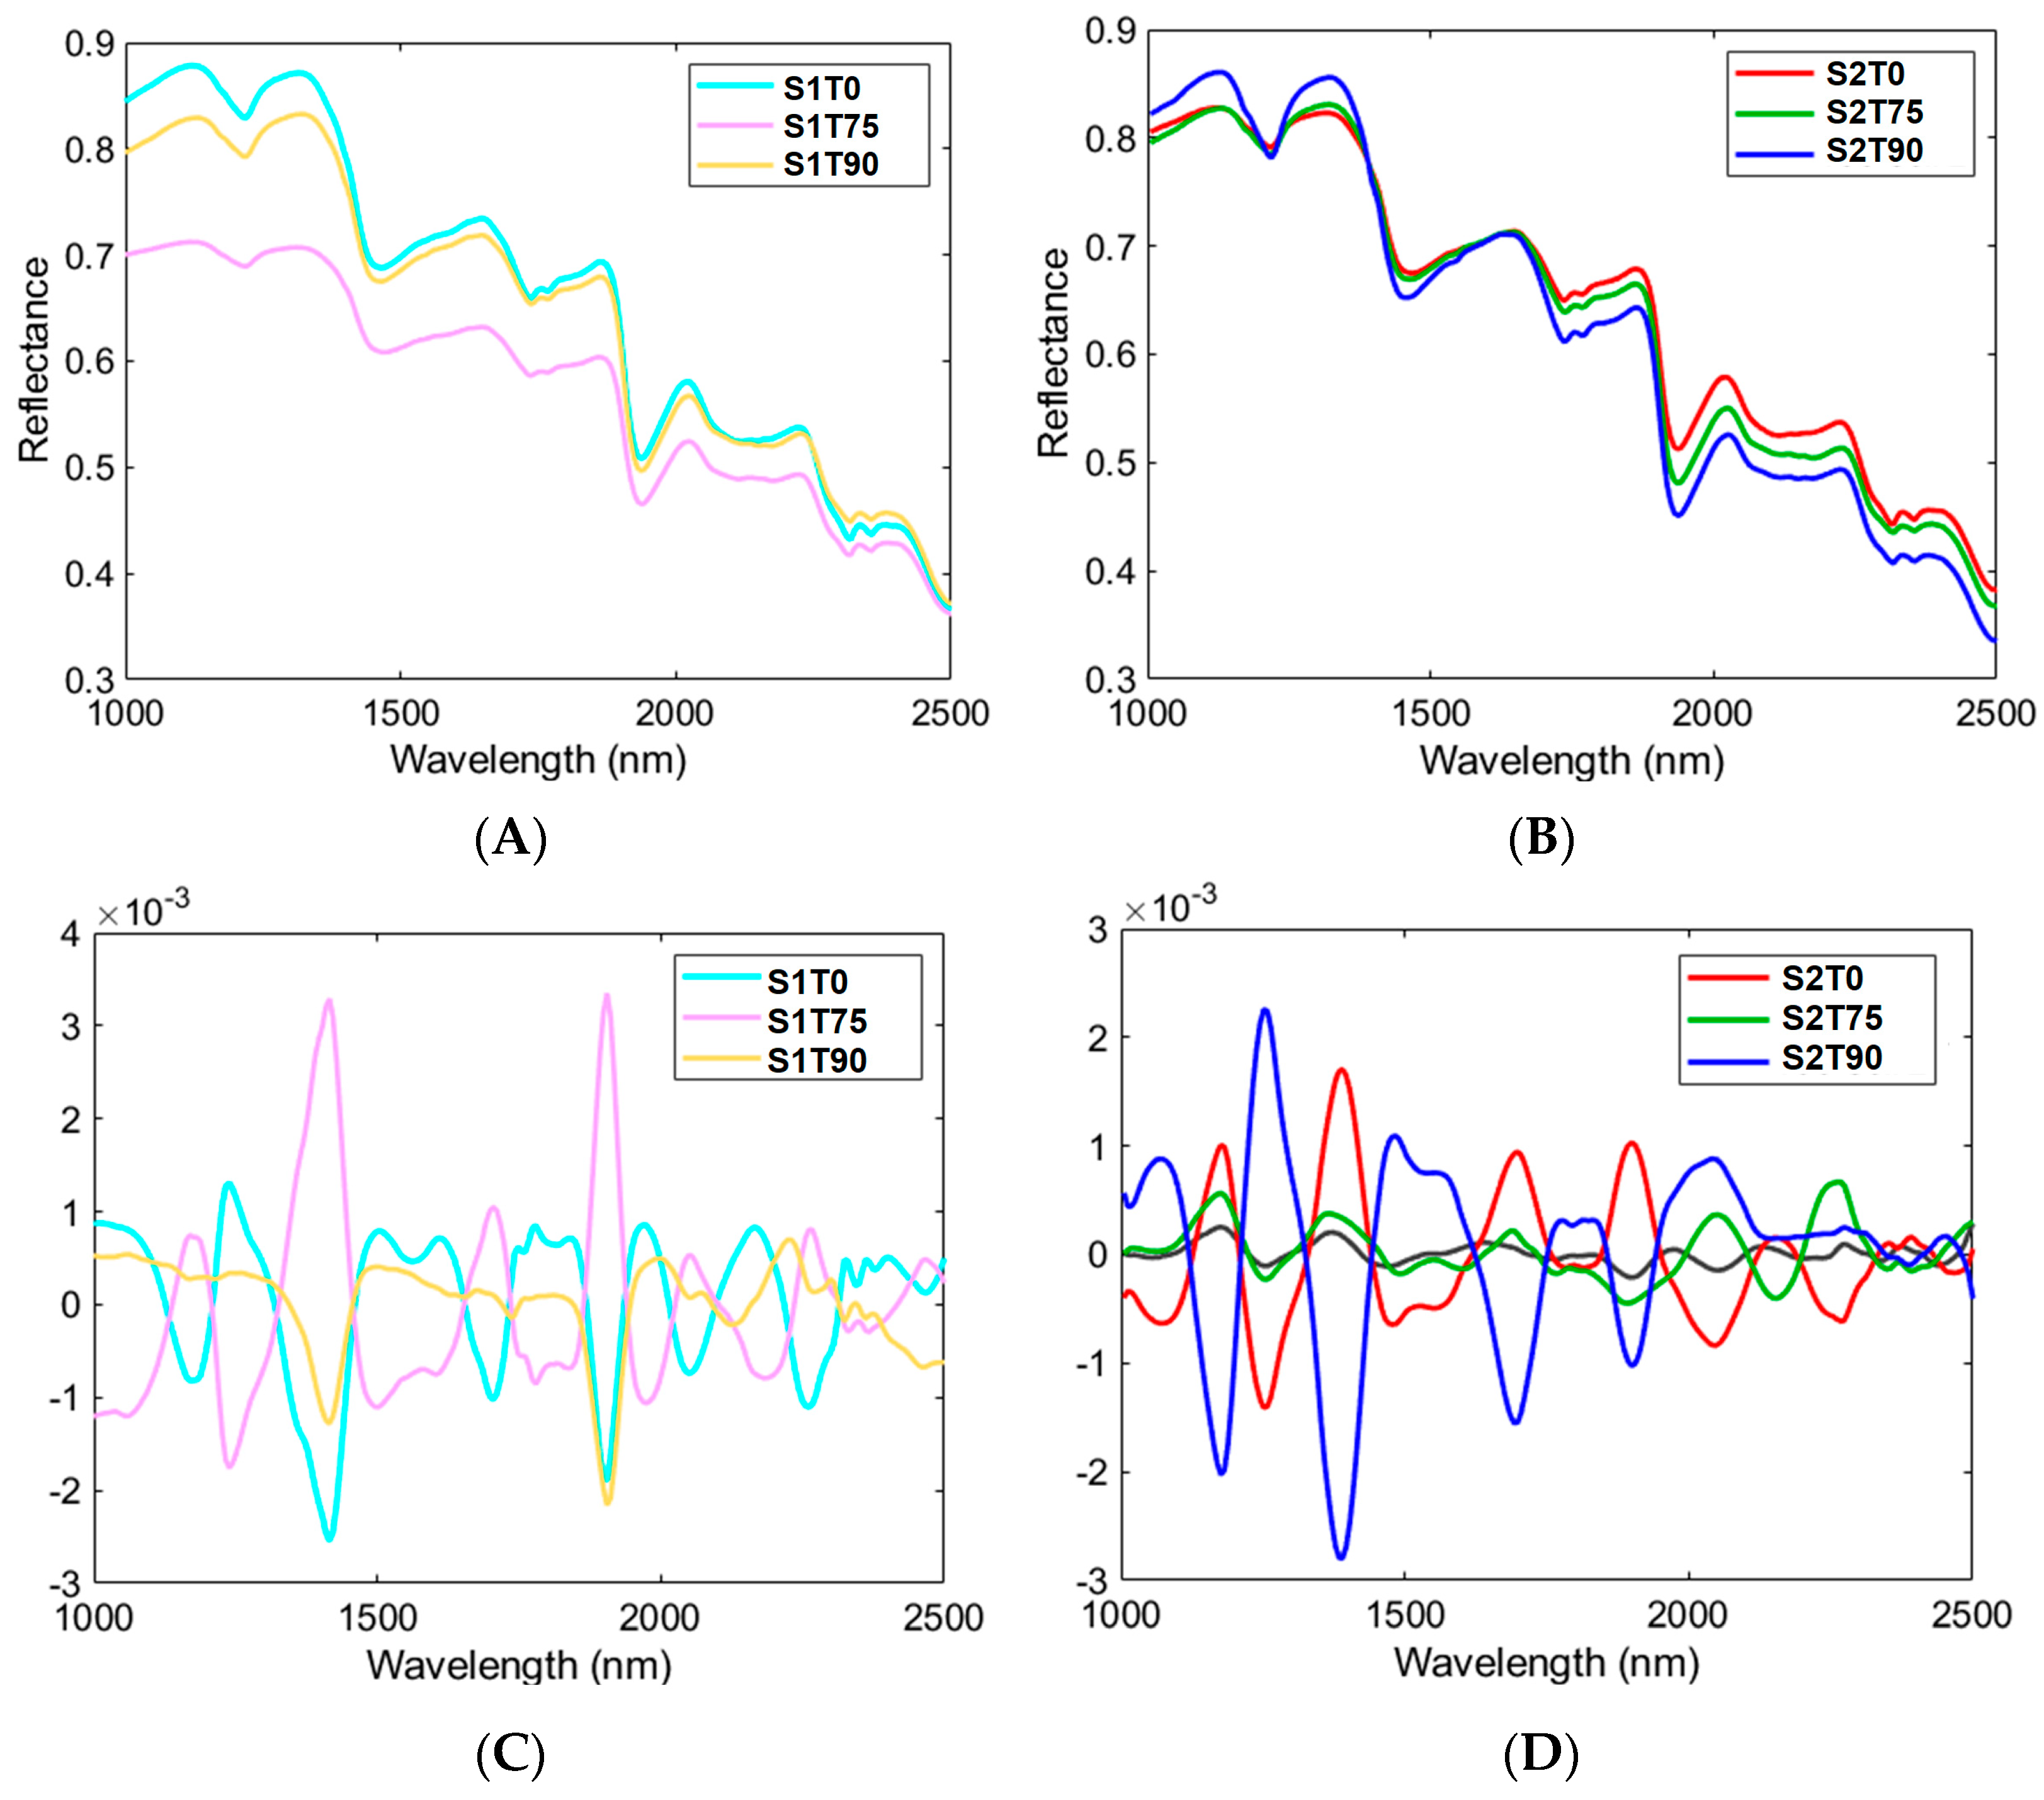
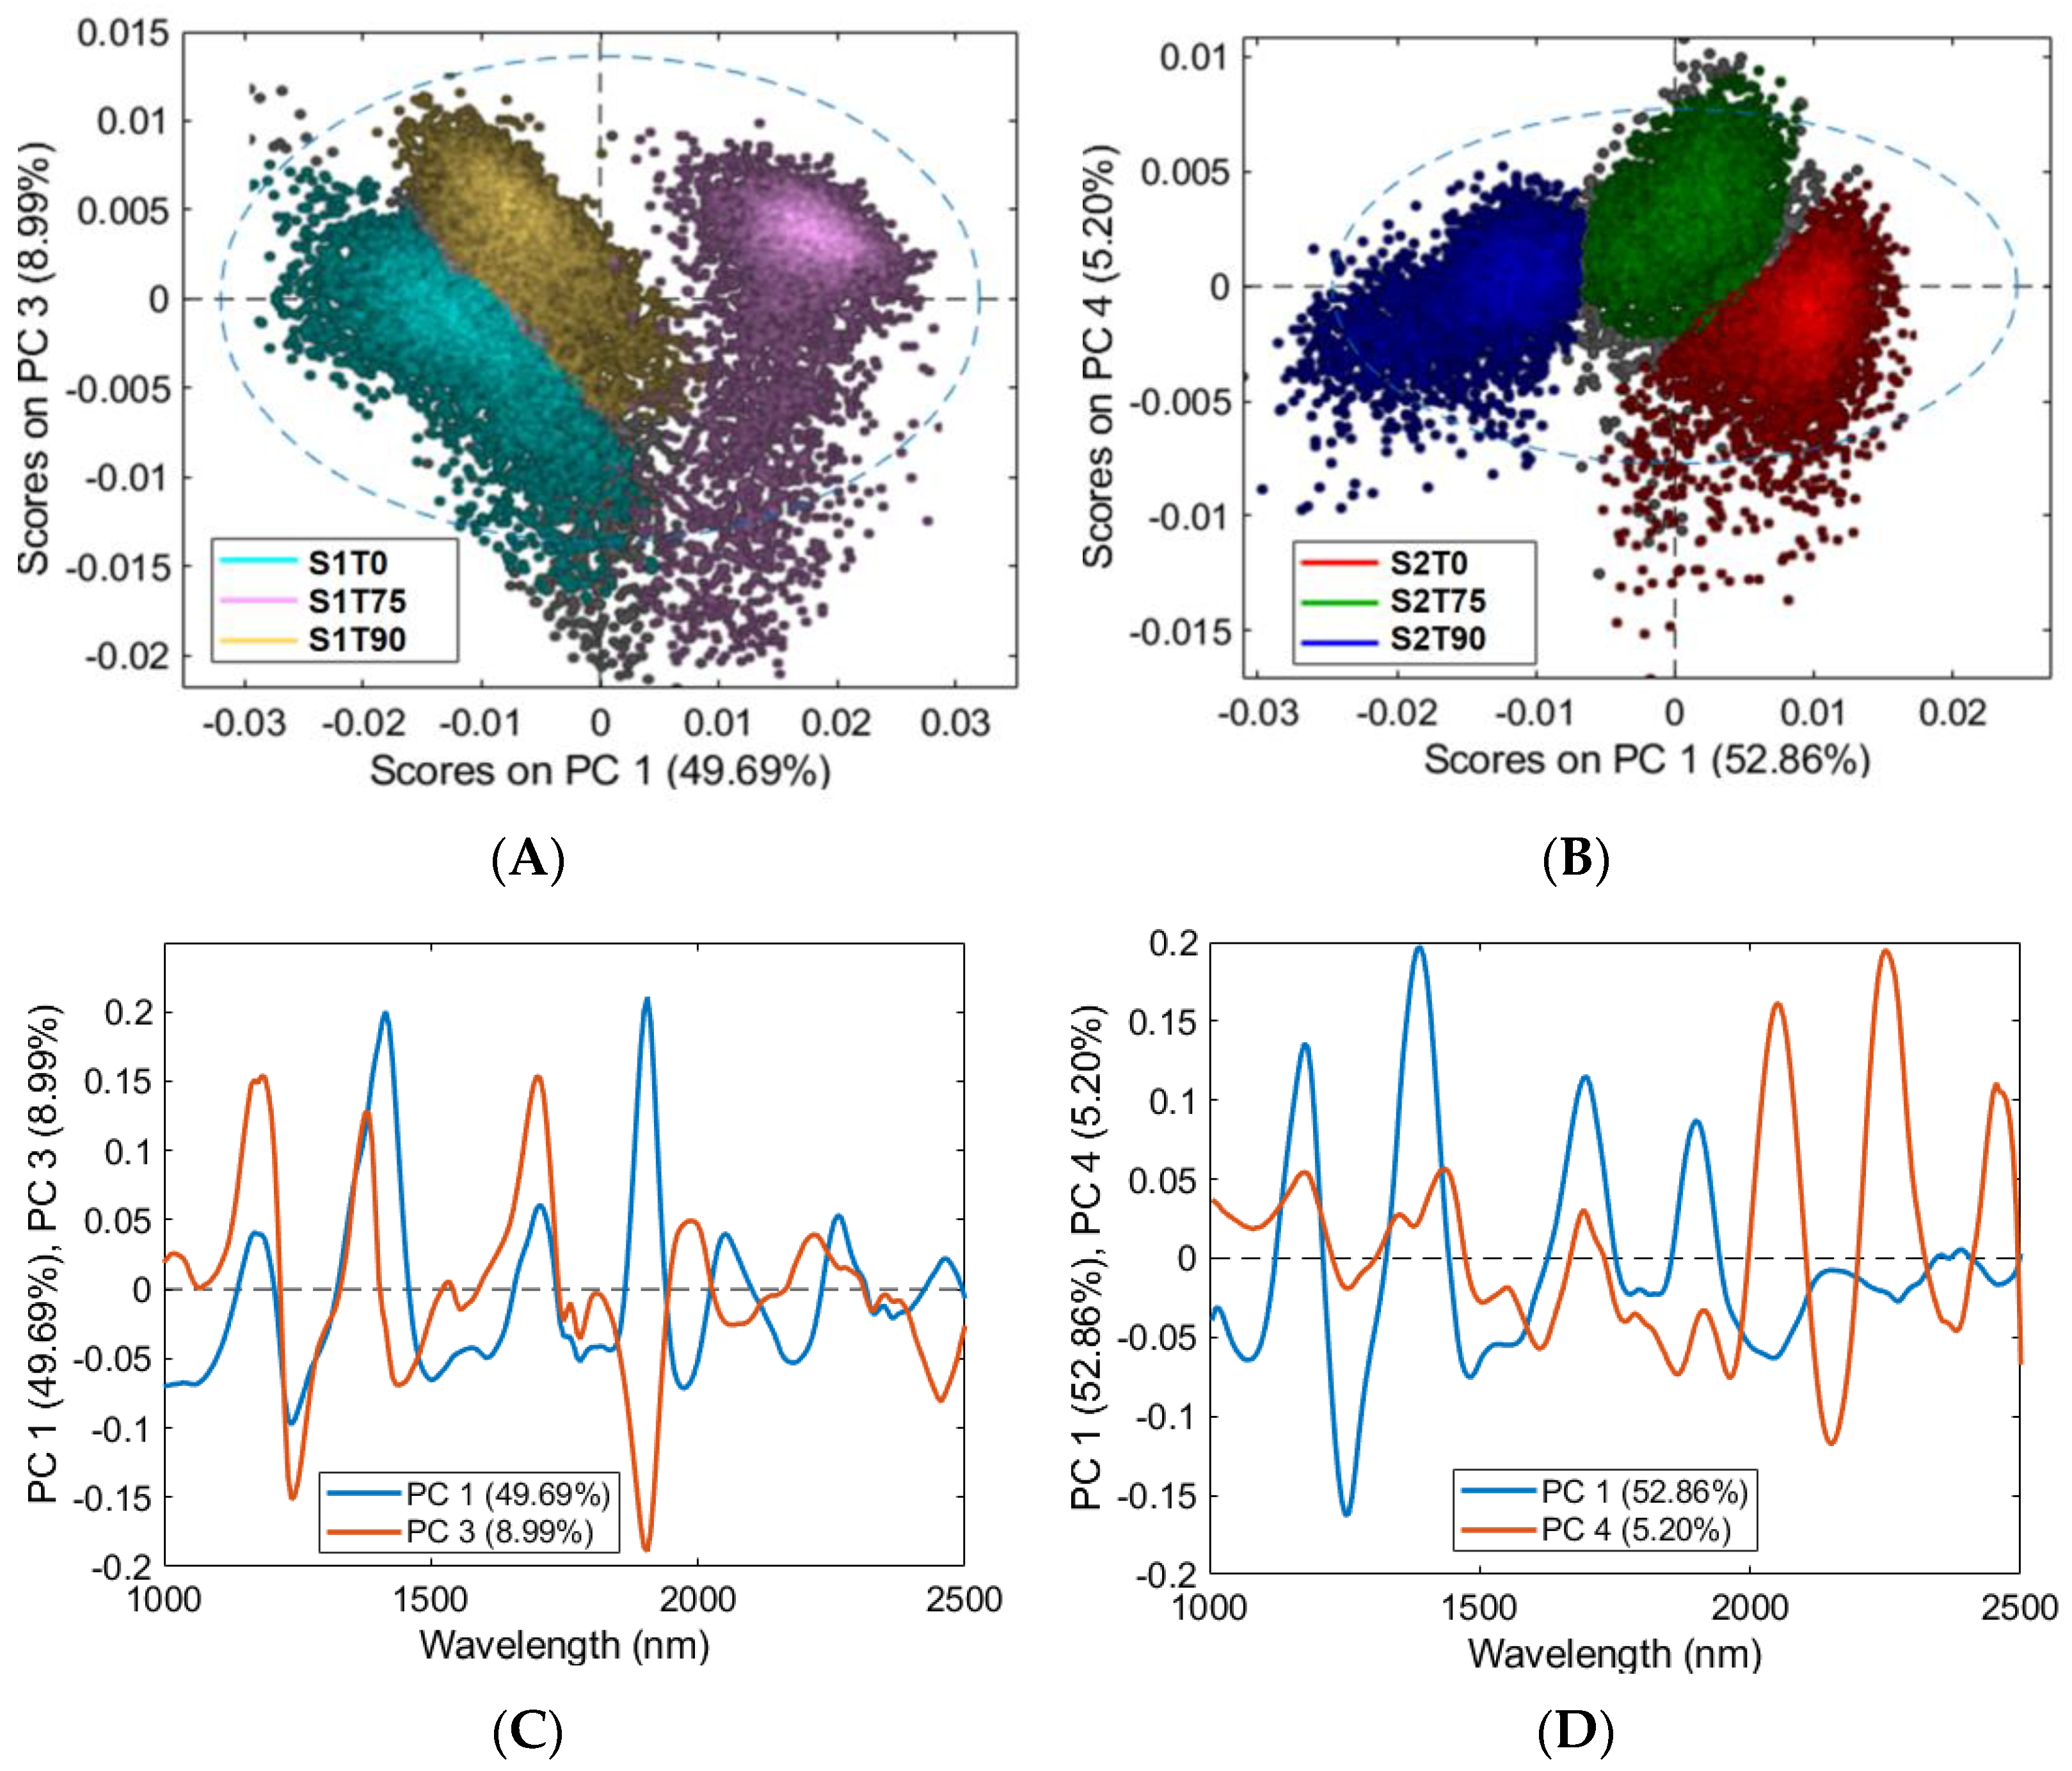
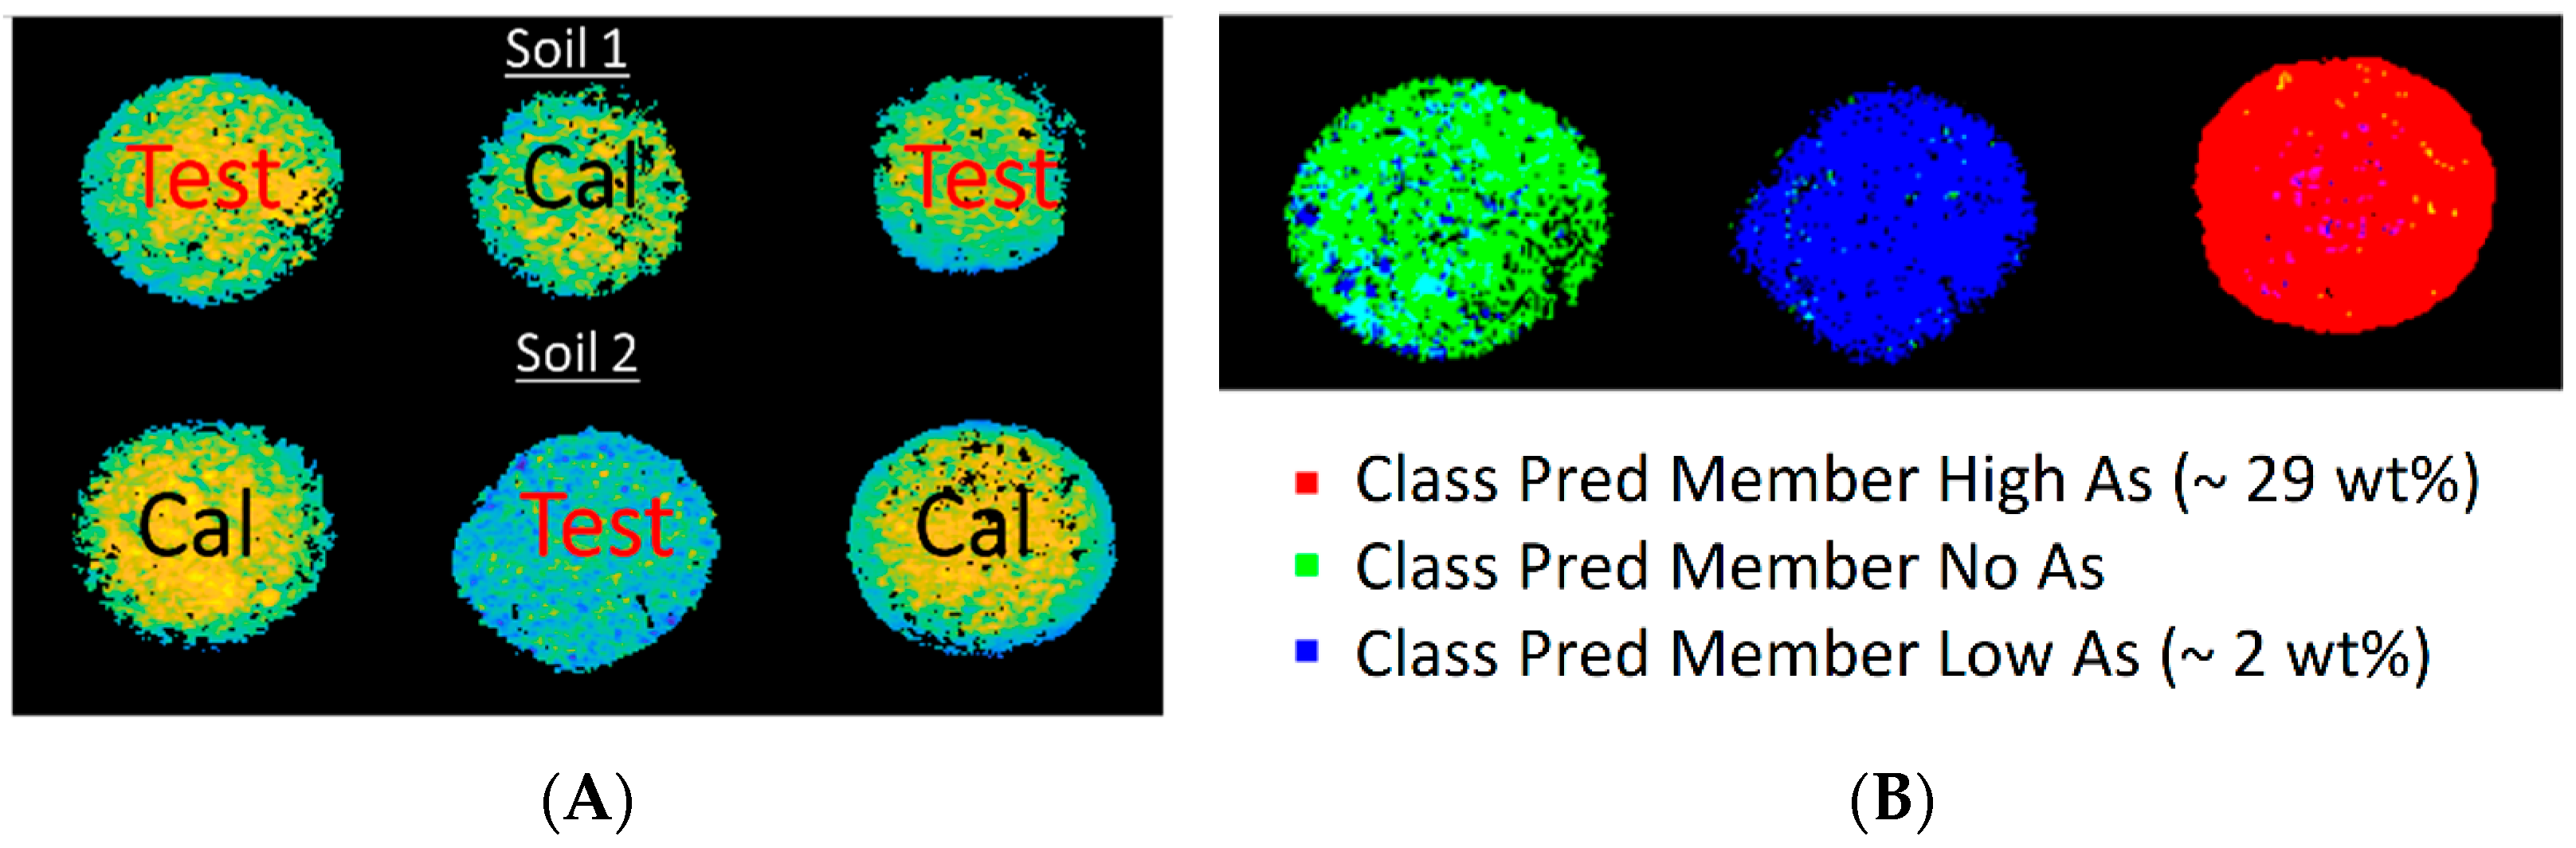
3.3. HSI Mean Spectra and PCA

Figure 6A,B show the average spectra obtained from the samples S1T0, S175, S1T90, S2T0, S2T75 and S2T90 in the SWIR range. The absorptions at 1200, 1478 and 1930 nm can be attributed to the stretching vibrations of the O-H bonds in water [42,43,44]. The 1478 nm band could be overlapped by the absorption of cellulose O-H or lignin-CH2. The weak bands at 1670 and 1730 nm can be associated to the presence of O-H groups in cellulose/lignin, and those at 2140 nm to C-H stretching, the C=O stretching combination and the C-H deformation combination of lipids. The absorptions between 2170 and 2180 nm can be associated to CONH2 and N-H/C-N/C=O due to the amide mode. Finally, the absorption at 2280 nm can be associated to the C-H stretching and CH2 deformation of polysaccharides and lignin. Finally, the absorption around 2349 nm is due to the different configurations of the C-H, C=O, C=C and COOH groups in cellulose and lignin [42,45,46]. The HSI data were preprocessed in order to emphasise the absorption bands of the polysaccharide, lipids, lignin and amide I [47]. The results obtained by using the preprocessing detrend, 1st derivative and Mean Centre are shown in Figure 6C,D. Concerning the preprocessing, the 1st derivative was applied for removing the offset difference and detrend for removing the constant effect of scattering.
Figure 7 shows the scores (A, B) and loading (C, D) plot of the PCA. The scores plots applied to the HSI data highlight a difference between the ST0 and ST75 and ST90 samples due to the chemical changes caused by As. PC1 and PC3 highlight the time changes in the SWIR spectrum for the pinna powder of the S1 samples, while PC1 and PC4 highlight the time changes in the SWIR spectrum for the pinna powder of the S2 samples. In both cases, the main changes can be detected along the first principal component (PC1) with a trend up to 90 days (Figure 7A). The first and fourth components of the S2 samples (Figure 7D) are influenced by the variability in the absorptions around 1175, 1390, 1691, 1898, 2149 and 2392 nm. This absorption detected by the loadings plot can be attributed to the presence of functional groups of polysaccharides, such as cellulose, lignin, lipids and amide I, confirming the spectral variance detected by the PCA of the FTIR data.
In order to evaluate the possibility to recognise As-contaminated tissues by HSI, the classes selected by PCA are used to build a PLS-DA classification model. The data were preprocessed as in the PCA and divided into calibration and test sets as shown in Figure 8A. Considering the amount of As detected by μ-XRF (Table 1), the samples were divided into the following classes: absence of As (No As) and low and high As (Low and High As, respectively). The samples used for the calibration were S2T0 (No As, 0 wt%), S1T75 (Low As, 2.13 wt%) and S2T90 (High As, 29.62 wt%). The samples used for the validation were S1T0 (No As, 0. wt%), S2T75 (High As, 28.56 wt%) and S1T90 (Low As, 1.94 wt%). The created model shows a good resolution for the validation of all the classes. The No As class is a little bit more confused than the Low As one due to the low spectral differences; however, they did not reduce the effectiveness of recognition (Figure 8B). The results of the confusion matrix, in terms of the sensitivity and specificity, are shown in Table 3 in the calibration, cross validation and prediction.
From Table 3, it can be noticed that the PLS-DA classifier shows good quality parametric performances with the sensitivity in Cal, CV and Pred ranging from 0.887 to 0.994 for the No As class, from 0.856 to 0.995 for the Low As class and from 0.820 to 0.919 for the High As class. The specificity values in Cal, CV and Pred range from 0.989 to 0.993 for the No As class, from 0.890 to 1.000 for the Low As class and from 0.788 to 0.876 for the High As class. Finally, the class error values show a low error in Cal, CV and Pred ranging from 0.006 to 0.062 for the No As class, from 0.003 to 0.127 for the Low As class and from 0.103 to 0.196 for the High As class.

4. Conclusions

The data obtained by the µ-XRF analysis revealed similar As content in both the S1 and S2 contaminated samples and a correlation between the As and K, Fe, Ca and Mn contents, as previously observed [20]. Interestingly, by the ATR-FTIR and HSI analyses on the same samples, it was found that the main differences between the As-contaminated samples and the control samples are due to a variation in the stretching band signal related to the polysaccharides (i.e., cellulose, hemicellulose and pectin), lignin, lipid and amide groups, which are the main components of plant cell walls. These results suggest a possible complexation/interaction of As with the hemicellulose, pectin and amides functional groups. The HSI data confirmed the results obtained by FTIR showing similar trends. In addition, thanks to the possibility of an HSI device to acquire a larger number of measures compared to the FTIR system, it was possible to develop a PLS-DA model that enabled us to recognise non-contaminated samples from those contaminated by both low and high concentrations of As.
Future work will be performed on fresh tissues to better understand the As interactions with the cell wall components.
In addition, this approach could allow the rapid assessment of As contamination in edible plants.

Author Contributions

Conceptualisation and investigation, S.S., G.B., G.C. and P.B.; methodology, G.C., L.P. and M.L.A.; validation, G.C. and S.S.; formal analysis, G.C., L.P. and M.L.A.; writing, G.C., P.B. and M.L.A.; supervision, writing, review and editing, G.B., S.S., M.C. and M.C.G. All authors have read and agreed to the published version of the manuscript.

Funding

This research received no external funding.

Data Availability Statement

Not applicable.

Acknowledgments

This study was carried out within the Agritech National Research Center and received funding from the European Union Next-GenerationEU (PIANO NAZIONALE DI RIPRESA E RESILIENZA (PNRR)—MISSIONE 4 COMPONENTE 2, INVESTIMENTO 1.4—D.D. 1032 17/06/2022, CN00000022). This manuscript reflects only the authors’ views and opinions; neither the European Union nor the European Commission can be considered responsible for them.

Conflicts of Interest

The authors declare no conflict of interest.

References

  1. Cluis, C. Junk-greedy greens: Phytoremediation as a new option for soil decontamination. BioTeach J. 2004, 2, 61–67. [Google Scholar]
  2. Vamerali, T.; Bandiera, M.; Mosca, G. Field crops for phytoremediation of metal-contaminated land. A review. Environ. Chem. Lett. 2010, 8, 1–17. [Google Scholar] [CrossRef]
  3. Ma, L.Q.; Komar, K.M.; Tu, C.; Zhang, W.; Cai, Y.; Kennelley, E.D. A fern that hyperaccumulates arsenic. Nature 2001, 409, 579. [Google Scholar] [CrossRef]
  4. Chen, T.; Wei, C.; Huang, Z.; Huang, Q.; Lu, Q.; Fan, Z. Arsenic hyperaccumulator Pteris vittata L. and its arsenic accumulation. Chin. Sci. Bull. 2002, 47, 902–905. [Google Scholar] [CrossRef]
  5. Antenozio, M.L.; Capobianco, G.; Costantino, P.; Vamerali, T.; Bonifazi, G.; Serranti, S.; Brunetti, P.; Cardarelli, M. Arsenic accumulation in Pteris vittata: Time course, distribution, and arsenic-related gene expression in fronds and whole plantlets. Environ. Pollut. 2022, 309, 119773. [Google Scholar] [CrossRef]
  6. Pickering, I.J.; Gumaelius, L.; Harris, H.H.; Prince, R.C.; Hirsch, G.; Banks, J.A.; Salt, D.E.; George, G.N. Localizing the biochemical transformations of arsenate in a hyperaccumulating fern. Environ. Sci. Technol. 2006, 40, 5010–5014. [Google Scholar] [CrossRef]
  7. van der Ent, A.; de Jonge, M.D.; Spiers, K.M.; Brueckner, D.; Montargès-Pelletier, E.; Echevarria, G.; Wan, X.M.; Lei, M.; Mak, R.; Lovett, J.H.; et al. Confocal Volumetric μXRF and Fluorescence Computed μ-Tomography Reveals Arsenic ThreeDimensional Distribution within Intact Pteris vittata Fronds. Environ. Sci. Technol. 2020, 54, 745–757. [Google Scholar] [CrossRef]
  8. Lahlali, R.; Karunakaran, C.; Wang, L.; Willick, I.; Schmidt, M.; Liu, X.; Borondics, F.; Forseille, L.; Fobert, P.R.; Tanino, K.; et al. Synchrotron based phase contrast X-ray imaging combined with FTIR spectroscopy reveals structural and biomolecular differences in spikelets play a significant role in resistance to Fusarium in wheat. BMC Plant Biol. 2015, 15, 24. [Google Scholar] [CrossRef] [Green Version]
  9. Comino, F.; Ayora-Cañada, M.J.; Aranda, V.; Díaz, A.; Domínguez-Vidal, A. Near-infrared spectroscopy and X-ray fluorescence data fusion for olive leaf analysis and crop nutritional status determination. Talanta 2018, 188, 676–684. [Google Scholar] [CrossRef]
  10. Abbas, G.; Murtaza, B.; Bibi, I.; Shahid, M.; Niazi, N.K.; Khan, M.I.; Amjad, M.; Hussain, M. Natasha Arsenic Uptake, Toxicity, Detoxification, and Speciation in Plants: Physiological, Biochemical, and Molecular Aspects. Int. J. Environ. Res. Public Health 2018, 15, 59. [Google Scholar] [CrossRef] [Green Version]
  11. Singh, N.; Ma, L.Q.; Srivastava, M.; Rathinasabapathi, B. Metabolic adaptations to arsenic-induced oxidative stress in Pteris vittata L. and Pteris ensiformis L. Plant Sci. 2006, 170, 274–282. [Google Scholar] [CrossRef]
  12. Farooq, M.A.; Gill, R.A.; Ali, B.; Wang, J.; Islam, F.; Ali, S.; Zhou, W. Subcellular distribution, modulation of antioxidant and stress-related genes response to arsenic in Brassica napus L. Ecotoxicology 2016, 25, 350–366. [Google Scholar] [CrossRef]
  13. Yan, X.L.; Lin, L.Y.; Liao, X.Y.; Zhang, W.B. Arsenic accumulation and resistance mechanism in Panax notoginseng, a traditional rare medicinal herb. Chemosphere 2012, 87, 31–36. [Google Scholar] [CrossRef]
  14. Leung, H.M.; Wu, F.Y.; Cheung, K.C.; Ye, Z.H.; Wong, M.H. Synergistic effects of arbuscular mycorrhizal fungi and phosphate rock on heavy metal uptake and accumulation by an arsenic hyperaccumulator. J. Hazard. Mater. 2010, 181, 497–507. [Google Scholar] [CrossRef]
  15. Chen, T.; Yan, X.; Liao, X.; Xiao, X.; Huang, Z.; Xie, H.; Zhai, L. Subcellular distribution and compartmentalization of arsenic in Pteris vittata L. Chin. Sci. Bull. 2005, 50, 2843–2849. [Google Scholar] [CrossRef]
  16. Taiz, L.; Zeiger, E.; Møller, I.M.; Murphy, A. Plant Physiology & Development, 6th ed.; Sinauer Associates, Inc.: Sunderland, MA, USA, 2014. [Google Scholar]
  17. Huang, W.X.; Chen, X.W.; Wu, L.; Yu, Z.S.; Gao, M.Y.; Zhao, H.M.; Mo, C.H.; Li, Y.W.; Cai, Q.Y.; Wong, M.H.; et al. Root cell wall chemistry remodelling enhanced arsenic fixation of a cabbage cultivar. J. Hazard. Mater. 2021, 420, 126165. [Google Scholar] [CrossRef]
  18. Antenozio, M.L.; Giannelli, G.; Marabottini, R.; Brunetti, P.; Allevato, E.; Marzi, D.; Capobianco, G.; Bonifazi, G.; Serranti, S.; Visioli, G.; et al. Phytoextraction efficiency of Pteris vittata grown on a naturally As-rich soil and characterization of As-resistant rhizosphere bacteria. Sci. Rep. 2021, 11, 6794. [Google Scholar] [CrossRef]
  19. Marzi, D.; Antenozio, M.L.; Vernazzaro, S.; Sette, C.; Veschetti, E.; Lucentini, L.; Daniele, G.; Brunetti, P.; Cardarelli, M. Advanced Drinking Groundwater As Phytofiltration by the Hyperaccumulating Fern Pteris vittata. Water 2021, 13, 2187. [Google Scholar] [CrossRef]
  20. Capobianco, G.; Bonifazi, G.; Serranti, S.; Marabottini, R.; Antenozio, M.L.; Cardarelli, M.; Brunetti, P.; Stazi, S.R. A Green Approach Based on Micro-X-ray Fluorescence for Arsenic, Micro- and Macronutrients Detection in Pteris vittata. Water 2022, 14, 2202. [Google Scholar] [CrossRef]
  21. Bro, R.; Smilde, A.K. Principal component analysis. Anal. Methods 2014, 6, 2812–2831. [Google Scholar] [CrossRef] [Green Version]
  22. Ballabio, D.; Consonni, V. Classification tools in chemistry. Part 1: Linear models. PLS-DA. Anal. Methods 2013, 5, 3790–3798. [Google Scholar] [CrossRef]
  23. Rinnan, Å.; Berg, F.; Engelsen, S.B. Review of the most common preprocessing techniques for near-infrared spectra. TrAC-Trends Anal. Chem. 2009, 28, 1201–1222. [Google Scholar] [CrossRef]
  24. Grahn, H.; Geladi, P.; Burger, J.H. (Eds.) Techniques and Applications of Hyperspectral Image Analysis; John Wiley & Sons: West Sussex, UK, 2007; pp. 1–15. [Google Scholar]
  25. Amigo, J.M.; Martí, I.; Gowen, A. Hyperspectral imaging and chemometrics: A perfect combination for the analysis of food structure, composition and quality. In Data Handling in Science and Technology; Elsevier: Amsterdam, The Netherlands, 2013; Volume 28, pp. 343–370. [Google Scholar]
  26. Vidal, M.; Amigo, J.M. Pre-processing of hyperspectral images. Essential steps before image analysis. Chemom. Intell. Lab. Syst. 2012, 117, 138–148. [Google Scholar] [CrossRef]
  27. Ribeiro da Luz, B. Attenuated total reflectance spectroscopy of plant leaves: A tool for ecological and botanical studies. New Phytol. 2006, 172, 305–318. [Google Scholar] [CrossRef] [PubMed]
  28. Sharma, S.; Uttam, K.N. Nondestructive and Rapid Probing of Biochemical Response of Arsenic Stress on the Leaves of Wheat Seedlings Using Attenuated Total Reflectance Fourier Transform Infrared Spectroscopy. Anal. Lett. 2019, 52, 268–287. [Google Scholar] [CrossRef]
  29. Giri, A.K.; Patel, R.K. Phytoaccumulation Potential and Toxicity of Arsenic Ions by Eichhornia Crassipes in Hydroponic System. J. Bioremediat. Biodegrad. 2012, 3, 137. [Google Scholar] [CrossRef] [Green Version]
  30. Topala, C.M.; Paunescu, A.; Soare, L.C. ATR—FTIR spectral analysis of ferns using as fingerprint for identification of fern species. Rev. Chim. 2019, 70, 875–880. [Google Scholar] [CrossRef]
  31. Garside, P.; Wyeth, P. Identification of Cellulosic Fibres by FTIR Spectroscopy—Thread and Single Fibre Analysis by Attenuated Total Reflectance. Stud. Conserv. 2003, 48, 269–275. [Google Scholar] [CrossRef] [Green Version]
  32. Topală, C.M.; Rusea, I. Analysis of leaves using ftir spectroscopy and principal component analysis discrimination of different plant samples. Curr. Trends Nat. Sci. 2018, 7, 286–291. [Google Scholar]
  33. Baruah, S.; Borgohain, J.; Sarma, K.P. Phytoremediation of arsenic by Trapa natans in a hydroponic system. Water Env. Res. 2014, 86, 422–432. [Google Scholar] [CrossRef]
  34. Heredia-Guerrero, J.A.; Benítez, J.J.; Domínguez, E.; Bayer, I.S.; Cingolani, R.; Athanassiou, A.; Heredia, A. Infrared and Raman spectroscopic features of plant cuticles: A review. Front. Plant Sci. 2014, 5, 305. [Google Scholar] [CrossRef] [Green Version]
  35. Sturchio, E.; Napolitano, P.; Beni, C.; Mecozzi, M. Evaluation of arsenic effects in Vicia faba by FTIR and FTNIR spectroscopy. Glob. Nest J. 2012, 14, 86–92. [Google Scholar] [CrossRef]
  36. Thumanu, K.; Sompong, M.; Phansak, P.; Nontapot, K.; Buensanteai, N. Use of infrared microspectroscopy to determine leaf biochemical composition of cassava in response to Bacillus subtilis CaSUT007. J. Plant Interact. 2015, 10, 270–279. [Google Scholar] [CrossRef] [Green Version]
  37. Kizewski, F.; Liu, Y.-T.; Morris, A.; Hesterberg, D. Spectroscopic Approaches for Phosphorus Speciation in Soils and Other Environmental Systems. J. Environ. Qual. 2011, 40, 751–766. [Google Scholar] [CrossRef] [PubMed]
  38. Haynes, R.J. Ion exchange properties of roots and ionic interactions within the root apoplasm: Their role in ion accumulation by plants. Bot. Rev. 1980, 46, 75–99. [Google Scholar] [CrossRef]
  39. Allen, D.L.; Jarrell, W.M. Proton and copper adsorption to maize and soybean root cell walls. Plant Physiol. 1989, 89, 823–832. [Google Scholar] [CrossRef] [Green Version]
  40. Nishizono, H.; Ichikawa, H.; Suziki, S.; Ishii, F. The role of the root cell wall in the heavy metal tolerance of Athyrium yokoscense. Plant Soil 1987, 101, 15–20. [Google Scholar] [CrossRef]
  41. Boominathan, R.; Doran, P.M. Organic acid complexation, heavy metal distribution and the effect of ATPase inhibition in hairy roots of hyperaccumulator plant species. J Biotechnol. 2003, 101, 131–146. [Google Scholar] [CrossRef]
  42. Osborne, B.G. Near-infrared spectroscopy in food analysis. In Encyclopedia of Analytical Chemistry; John Wiley & Sons, Inc.: Hoboken, NJ, USA, 2000. [Google Scholar] [CrossRef]
  43. Williams, P.; Norris, K. Near-Infrared Technology in the Agricultural and Food Industries; American Association of Cereal Chemists, Inc.: Paul, MN, USA, 1987. [Google Scholar]
  44. Curran, P.J. Remote sensing of foliar chemistry. Remote Sens. Environ. 1989, 30, 271–278. [Google Scholar] [CrossRef]
  45. Banwell, C.N. Fundamentals of Molecular Spectroscopy; McGrow Hill: Columbus, OH, USA, 1983. [Google Scholar]
  46. Barton, F.E.; Himmelsbach, D.S.; Duckworth, J.H.; Smith, M.J. Two-dimensional vibration spectroscopy: Correlation of mid-and near-infrared regions. Appl. Spectrosc. 1992, 46, 420–429. [Google Scholar] [CrossRef]
  47. Workman, J., Jr.; Weyer, L. Practical Guide to Interpretive Near-Infrared Spectroscopy, 1st ed.; CRC Press: Boca Raton, FL, USA, 2007. [Google Scholar] [CrossRef]
Figure 1. A P. vittata plant grown in naturally As-rich soil under greenhouse conditions. The arrow indicates the pinna collected for preparing pinna powder.
Water 15 01333 g001
Figure 2. Representative image of S1 and S2 samples analysed by FTIR, μ-XRF and HSI.
Water 15 01333 g002
Figure 3. (A) FTIR spectra of S1 samples: average (on the bottom), 1° derivative spectra (in the middle) and 2° derivative spectra (on the top) at T0 (black), at T75 (blue) and at T90 (red) days. (B) FTIR spectra of S2 samples: average (on the bottom), 1° derivative spectra (in the middle) and 2° derivative spectra (on the top) at T0 (black), at T75 (blue) and at T90 (red) days.
Water 15 01333 g003
Figure 4. Score (A) and loading (B) plots from first derivative spectra and score (C) and loading (D) plots from second derivative spectra of S1 samples, respectively. The numbers indicated in (B) and (D) correspond to the following spectral ranges: (1) 2950–2820 cm−1 (C-H stretching); (2) 1770–1740 cm−1 (COOH stretching/carbonyl (C=O) stretching); (3) 1680–1650 cm−1 (N-H stretching and C=O stretching of amide I); (4) 1510–1450 cm−1 (C=C-C aromatic ring stretching/C-C aromatic stretching (conjugated with C=O), asymmetric C-H bending from lipids, protein, lignin; (5) 1100–960 cm−1 (carbonyl (C=O) stretching (fatty acid)/C-O and C-C (pectin)/C-O-C symmetric stretching/C-O, C=C and C-C-O stretching of cellulose and hemicellulose).
Water 15 01333 g004
Figure 5. Score (A) and loading (B) plots from first derivative spectra and score (C) and loading (D) plots from second derivative spectra of S2 samples, respectively. The numbers indicated in (B) and (D) correspond to the following spectral ranges: (1) 2920–2820 cm−1 (C-H stretching); (2) 1740–1700 cm−1 (COOH stretching/carbonyl (C=O) stretching); (3) 1620–1550 cm−1 (N-H stretching and C=O stretching of amide I)/carbonyl (C=O) stretching, C-C aromatic stretching, NH2 group bending/C-C aromatic ring stretching phenolic compounds, N-H bending and C-N stretching of protein; (4) 1150–900 cm−1 C-C(C=O)-O stretching or C-O-C asymmetric stretching (hemicellulose) C-O bonds in the ester linkages of cutin/carbonyl (C=O) stretching (fatty acid)/C-O and C-C (pectin)/C-O-C symmetric stretching/C-O, C=C and C-C-O stretching of cellulose and hemicellulose.
Water 15 01333 g005
Figure 6. Average (A,B) raw and preprocessed (C,D) spectra of samples analysed by hyperspectral imaging (HSI) in the SWIR range.
Water 15 01333 g006
Figure 7. PC1–PC2 score plot (A,B) and loading plot (C,D) referred to the selected samples.
Water 15 01333 g007
Figure 8. (A) Scheme of the samples used for calibration (Cal) and for validation (Test). (B) Result of the PLS-DA classification model obtained from the validation set.
Water 15 01333 g008
Table 1. µ-XRF semi-quantitative measurements of powder samples obtained from dried fronds of P. vittata grown on S1 or S2 soils at 0, 75 and 90 days. Results are expressed in Normalised Weight (wt%).
S1T0
SpectrumMgSiPSKCaMnFeZnAs
Mean value0.876.271.283.4352.8331.351.432.040.500
Std. Abw.0.535.470.430.949.246.711.301.370.260
Conf. interval0.060.580.040.100.970.710.140.140.030
S2T0
SpectrumMgSiPSKCaMnFeZnAs
Mean value0.996.121.493.2656.5927.481.831.830.420
Std. Abw.0.475.170.560.787.745.960.841.110.160
Conf. interval0.050.560.060.080.840.650.090.120.020
S1T75
SpectrumMgSiPSKCaMnFeZnAs
Mean value0.2912.031.621.6554.4113.920.5013.230.212.13
Std. Abw.0.265.460.470.237.403.650.187.750.050.37
Conf. interval0.040.920.080.041.250.620.031.310.010.06
S2T75
SpectrumMgSiPSKCaMnFeZnAs
Mean value1.129.601.111.6645.7511.510.200.400.0928.56
Std. Abw.0.333.370.240.615.806.910.070.720.055.39
Conf. interval0.060.570.040.100.981.170.010.120.010.91
S1T90
SpectrumMgSiPSKCaMnFeZnAs
Mean value0.4412.541.371.7349.3517.670.5714.140.251.94
Std. Abw.0.265.160.400.466.113.680.186.030.090.56
Conf. interval0.040.870.070.081.030.620.031.020.010.09
S2T90
SpectrumMgSiPSKCaMnFeZnAs
Mean value1.2612.260.901.8637.9613.330.272.430.1129.62
Std. Abw.0.373.680.230.345.123.090.102.850.036.32
Conf. interval0.060.620.040.060.870.520.020.480.001.07
Table 2. FTIR band assignments of the control samples.
Band Position (cm−1)FTIR Band AssignmentsReferences
3300OH stretching (water), N-H stretching[27,30]
2954C-H asymmetric stretching[28,31]
2918C-H asymmetric stretching[27,28]
2850C-H symmetric stretching [27,28,31]
1735COOH stretching, carbonyl (C=O) stretching [27,28]
1650 (sh)N-H stretching and C=O stretching of amide I[32,33]
1606Carbonyl (C=O) stretching, C-C aromatic stretching, NH2 group bending[28,31,34]
1545C-C aromatic ring stretching phenolic compounds, N-H bending and C-N stretching of protein[28,34]
1514C=C-C aromatic ring stretching[28,30]
1440C-C aromatic stretching (conjugated with C=O), asymmetric C-H bending from lipids, protein, lignin[34,35,36]
1418CH asymmetric bending, O-H bending: cell wall polysaccarides, alcohols and carboxylic acids, COO− symmetric stretching vibration of non-esterified uronic acid[28,31,35,37]
1370C-H deformation and CH2 bending[28,31]
1318CH symmetric bending of cellulose[28]
1230C-O stretching from hemicelluloses and lignin, amide III (C=N and N-H stretching): mainly proteins[28,31,35,36]
1140 (sh)O-C-O asymmetric stretching, cellulose (β-1,4 glucan)[31,35]
1160 (sh)C-C(C=O)-O stretching or C-O-C asymmetric stretching (hemicellulose) C-O bonds in the ester linkages of cutin[27,28,34]
1100 (sh)Carbonyl (C=O) stretching (fatty acid)/C-O and C-C (pectin)/C-O-C symmetric stretching[27,28,34]
1050–1020C-O, C=C and C-C-O stretching of cellulose and hemicellulose[27,28,37]
Table 3. Statistics of PLS-DA for each class, in calibration, cross validation and prediction.
ClassesNo AsLow AsHigh As
Sensitivity (Cal)0.9940.9030.886
Specificity (Cal)0.9930.9310.869
Sensitivity (CV)0.9920.8560.820
Specificity (CV)0.9920.8900.788
Sensitivity (Pred)0.8870.9950.919
Specificity (Pred)0.9891.0000.876
Class, Err (Cal)0.0060.0830.123
Class, Err (CV)0.0080.1270.196
Class, Err (Pred)0.0620.0030.103
Disclaimer/Publisher’s Note: The statements, opinions and data contained in all publications are solely those of the individual author(s) and contributor(s) and not of MDPI and/or the editor(s). MDPI and/or the editor(s) disclaim responsibility for any injury to people or property resulting from any ideas, methods, instructions or products referred to in the content.

