
Freshwater Salinization Impacts the Interspecific Competition between Microcystis and Scenedesmus
1
Department of Marine Biology, College of Oceanography, Hohai University, 1 Xikang Road, Nanjing 210098, China
2
Jiangsu Province Engineering Research Center for Marine Bio-Resources Sustainable Utilization and College of Oceanography, Hohai University, Nanjing 210098, China
*
Author to whom correspondence should be addressed.
Water 2023, 15(7), 1331; https://doi.org/10.3390/w15071331
Submission received: 27 February 2023
/
Revised: 21 March 2023
/
Accepted: 23 March 2023
/
Published: 28 March 2023
(This article belongs to the Special Issue Changing Phytoplankton Communities in Aquatic Environments)
Abstract
:Freshwater salinization is a growing environmental issue caused by various anthropic or natural factors that lead to changes in water chemistry and physical conditions, affecting the survival and diversity of phytoplankton. In this study, we tested the physiological, morphological and interspecific competition of the freshwater cyanobacterium Microcystis aeruginosa and the green algae Scenedesmus obliquus to salinity stress. Results demonstrated that increasing salinity had a significant negative effect on the growth of M. aeruginosa and S. obliquus. M. aeruginosa showed a decline in growth rate with increasing salinity, while S. obliquus showed a lower growth rate under salinity stress but with no significant difference between the two salinity groups. In cocultures, S. obliquus outcompeted M. aeruginosa, and the displacement was accelerated with increasing salinity. The photosynthetic performance of both algae was affected by salinity, the presence of competitors, and the cultivation time. S. obliquus showed morphological variations under salinity stress and the presence of a competitor. The study suggests that salinity stress and competition can have a significant impact on the growth and performance of algae species. The findings of our study suggest that the salinization of freshwater can impact the interspecific interactions among phytoplankton, which play a crucial role in the functioning of freshwater ecosystems.
1. Introduction
Freshwater salinization, caused by anthropic or natural sources (e.g., climate warming, agriculture, and the use of de-icing salts), is currently an urgent global environmental issue that gradually influences biodiversity, community structure, and even ecosystem services [1,2]. According to the report of the Intergovernmental Panel on Climate Change (IPCC), the influence range and intensity of freshwater salinization are expected to be amplified under the future climate scenario [3,4]. Climate warming may enhance evaporation processes, leading to an increase in salinity in both freshwater and brackish lakes, especially in arid and semiarid climates [5]. In coastal regions, sea-level rise and over pumping of groundwater for irrigation and industry changed groundwater hydraulics and, in particular, seawater intrusion [6]. Freshwater salinization in coastal areas has been considered a result of seawater intrusion, and it is expected to occur more frequently in the coming years [7]. Various anthropogenic activities, such as agriculture creating salt-polluted surface runoff and de-icing salts used on roads, are driving the salinization of freshwater and threatening water resources [8].
The wide distribution of freshwater salinization is leading to negative consequences for the loss of species and the alteration of community assemblages of freshwater ecosystems. Species-level responses to freshwater salinization have been largely assessed at different trophic levels. Increasing salt concentrations negatively affected the growth of freshwater algae species, such as Chlorella vulgaris, C. salina, C. emersonii [9], Scenedesmus opoliensis [10]. Under the change of salinity, shifts of dominant zooplankton from large and more efficient filter-feeding cladoceran (i.e., Daphnia spp.) at low salinities to copepods and small cladoceran (i.e., Bosmina and Chydorus spp.) at higher salinities occurred [11,12]. Such a change in zooplankton communities due to the salinity increase may weaken the top-down control on phytoplankton. There is also emerging evidence that fish and macroinvertebrate communities may change along the salinity gradient [13,14]. The shift of biodiversity and community assemblages in freshwater ecosystems might be not only due to the species-dependent responses but also due to the impairment of interspecific interactions by salinization.
As one of the main primary producers of aquatic ecosystems, the change in the phytoplankton community can directly influence the structure and function of aquatic ecosystems. Interspecific competition of phytoplankton plays an important role in shaping community dynamics and determining the structure and function of aquatic ecosystems [15,16]. Competition is also one major force driving species displacement during phytoplankton succession [17]. The paradox of the plankton is an explanation for the large number of species coexisting in the same habitat [18,19]. Additionally, predation by zooplankton often removes dominant competitors, which also contributes to the phytoplankton diversity [20]. However, climate change and eutrophication interfere with the dynamic properties of aquatic ecosystems and increase the occurrence of harmful algal blooms (HABs). The cyanobacteria Microcystis aeruginosa is one of the most common HABs species in aquatic environments [21]. Microcystins produced by Microcystis and other cyanobacteria species are the most widespread cyanobacterial toxins and can bioaccumulate in common aquatic vertebrates and invertebrates, such as fish, mussels, and zooplankton [22]. Usually, high salinity and relatively low temperature are often the barriers for Microcystis blooms to expand in estuaries [23]. Recently, an increasing number of documents reported the proliferation of M. aeruginosa in brackish waters [24,25]. It could be assumed that the salt tolerance of M. aeruginosa gains during the eutrophication process contributes to the expansion of blooms. Further, the alternation of interspecific interactions like competition and predation should play an important role.
Numerous studies have been devoted to the competition between cyanobacteria and green algae, aiming to explore the mechanism of HABs formation and find the approach of biomanipulation on HABs [26,27,28]. Therefore, the aim of this study is to determine the competition between M. aeruginosa and other phytoplankton under the influence of freshwater salinization. For this purpose, two microalgae species (M. aeruginosa and Scenedesmus obliquus) were exposed to different salinity levels (0, 3, and 6) under both mono- and coculture conditions. Scenedesmus is one of the most common genera of green alga, which can be found in freshwater ecosystems all around the world, and often coexists with M. aeruginosa blooms in freshwater habitats [29]. The competition between M. aeruginosa and S. obliquus was studied to test the hypotheses: (1) physiological responses to the increase of salinity would be different for the two microalgae, (2) the increase of salinity would impact the interspecific interactions between M. aeruginosa and S. obliquus.
2. Materials and Methods
2.1. Microalgae and Salinity Adaptation
The algae Scenedesmus obliquus (FACHB-416) and a toxic strain of Microcystis aeruginosa (FACHB-905) were obtained from Freshwater Algae Culture Collection at the Institute of Hydrobiology (FACHB), Chinese Academy of Science. The algae were cultured axenically in BG-11 medium in a climate-controlled chamber at a constant temperature of 20 °C and illuminated with a 14:10 h light:dark cycle at 60 μmol photons m−2 s−1. Then algae were inoculated in fresh culture media every 3 days to maintain an exponential growth phase prior to the experiment. Two algae were cultured in 1 L Erlenmeyer flasks containing 500 mL of BG-11 medium. The salinity of the algal culture was raised every two days at an interval of one until it reached six. The measured salinities of the three target salinities (0, 3, 6) were 0.99, 3.97 and 6.98, respectively. No difference was found between different mono- or cocultures.
2.2. Experimental Protocol
All the treatments were conducted in triplicate in 250-mL Erlenmeyer flasks containing 150-mL BG-11 medium, which contained 1.5 mg L−1 NaNO3 and 0.039 mg L−1 KH2PO4. Three salinities were set to simulate freshwater salinization: zero, three, and six, according to the predictive results of salinity levels and trends across and within the seven regional river basins [30]. Algal were cultured semi-continuously in different salt conditions (0, 3, 6) to remain in exponential growth prior to the experiments, and then exponential-phase cells were inoculated into Erlenmeyer flasks at different initial algal densities.
Based on cell volume measurements, the volume of S. obliquus cells was four to six times larger than M. aeruginosa cells, so in order to maintain a relatively equal total biovolume, the cell density ratio is set as S. obliquus: M. aeruginosa = 1:5. In monocultures, the initial abundance of M. aeruginosa was 5.0 × 10⁵ cells mL−1 and S. obliquus was 1.0 × 10⁵ cells mL−1. Three cocultures with a uniform initial total biovolume were set with the following biovolume ratios, and initial cell densities were set as below: (1) 75% Ma + 25% So: M. aeruginosa was 3.75 × 10⁵ cells mL−1 and S. obliquus was 0.25 × 10⁵ cells mL−1; (2) 50% Ma + 50% So: M. aeruginosa was 2.5 × 10⁵ cells mL−1 and S. obliquus was 0.5 × 10⁵ cells mL−1; (3) 25% Ma + 75% So: M. aeruginosa was 1 × 10⁵ cells mL−1 and S. obliquus was 0.75 × 10⁵ cells mL−1. Both monoculture and coculture groups were incubated in climate-controlled chambers in 250 mL Erlenmeyer flasks at three different salinities (0, 3, and 6). The experiments were performed in triplicate. All the cultures were grown axenically in a climate-controlled chamber at a constant temperature of 20 °C, illuminated with a 14:10 h light:dark cycle at 60 μmol photons m−2 s−1 and shaken manually three times daily.
2.3. Data Analyses
Samples (2 mL) for determining abundance and morphology were taken every day under aseptic conditions and preserved by adding 2% Lugol’s iodine solution. The algal densities and the cell numbers of the different morphologies (unicells; two-, four-, and eight-cell colonies; and other forms) were counted using a hemocytometer (0.1 mm deep) under a microscope (CX23, Olympus, Tokyo, Japan) at 400× magnification. For there was no significant change in the morphology of M. aeruginosa under different conditions, and the populations were dominated by unicells and two-celled colonies, only the morphology of S. obliquus was discussed. In monocultures, the growth rate (μ, d−1) was assumed to be exponential and determined as the slope of ln cell density vs time. One-way ANOVA was used to compare the differences in growth rates at different salinities of the two algal monocultures. In the cocultures, the algal cell density versus time was fitted by the Gaussian distribution , where N0, Nt and Nmax represent the algal abundance at time zero and t, and the maximal number of algal abundances, t and tmax represent the cultural time and the time when reached Nmax, and SD was the width of the Gaussian distribution. In cocultures, the natural log of the ratio of the abundances of the two algae, , were calculated and regressed against time. The slope of the linear regression of Y(t) versus t is adopted as the competitive displacement rate. To reflect the changes of Y(t) with time, they were fitted by the Gaussian distribution: , where Y0, Ymax represent the initial Y(t), Y(t) at time t, and the maximal value of Y(t), t and t′max represent the cultural time and the time when reached Ymax, and SD′ was the width of the Gaussian distribution.
The morphology of S. obliquus is unicellular and colonies of two, four, eight and other cell colonies. At least 100 algal particles were counted for each sample, and the morphology was determined with one particle meaning one unicell or one colony. The counts were then employed for the calculation of cells per particle. The number of cells per particle (C) was calculated as follows: , where i is the cell number per particle (1, 2, 3, 4…) and ni is the number of particles in different morphs.
2.4. Chlorophyll Fluorescence Measurements
Samples (2 mL) for measuring photosynthetic efficiency were taken every other day. The photosynthetic efficiency of the algae was determined immediately with an AquaPen fluorometer (AP-C 100, PSI, Drasov, Czech Republic). The maximal efficiency of PSII photochemistry was determined as Fv/Fm, where Fm and F0 are the maximal and minimal chlorophyll fluorescence yields, respectively, of dark-adapted (15 min) algal suspensions. Three-way ANOVA tests were run to analyze the effects of salinity, initial algal composition, and incubation time on Fv/Fm of both algae, and Holm-Sidak tests were adopted for all multiple pairwise comparisons.
3. Results
3.1. Response of Algae Growth and Competition to Salinity Stress
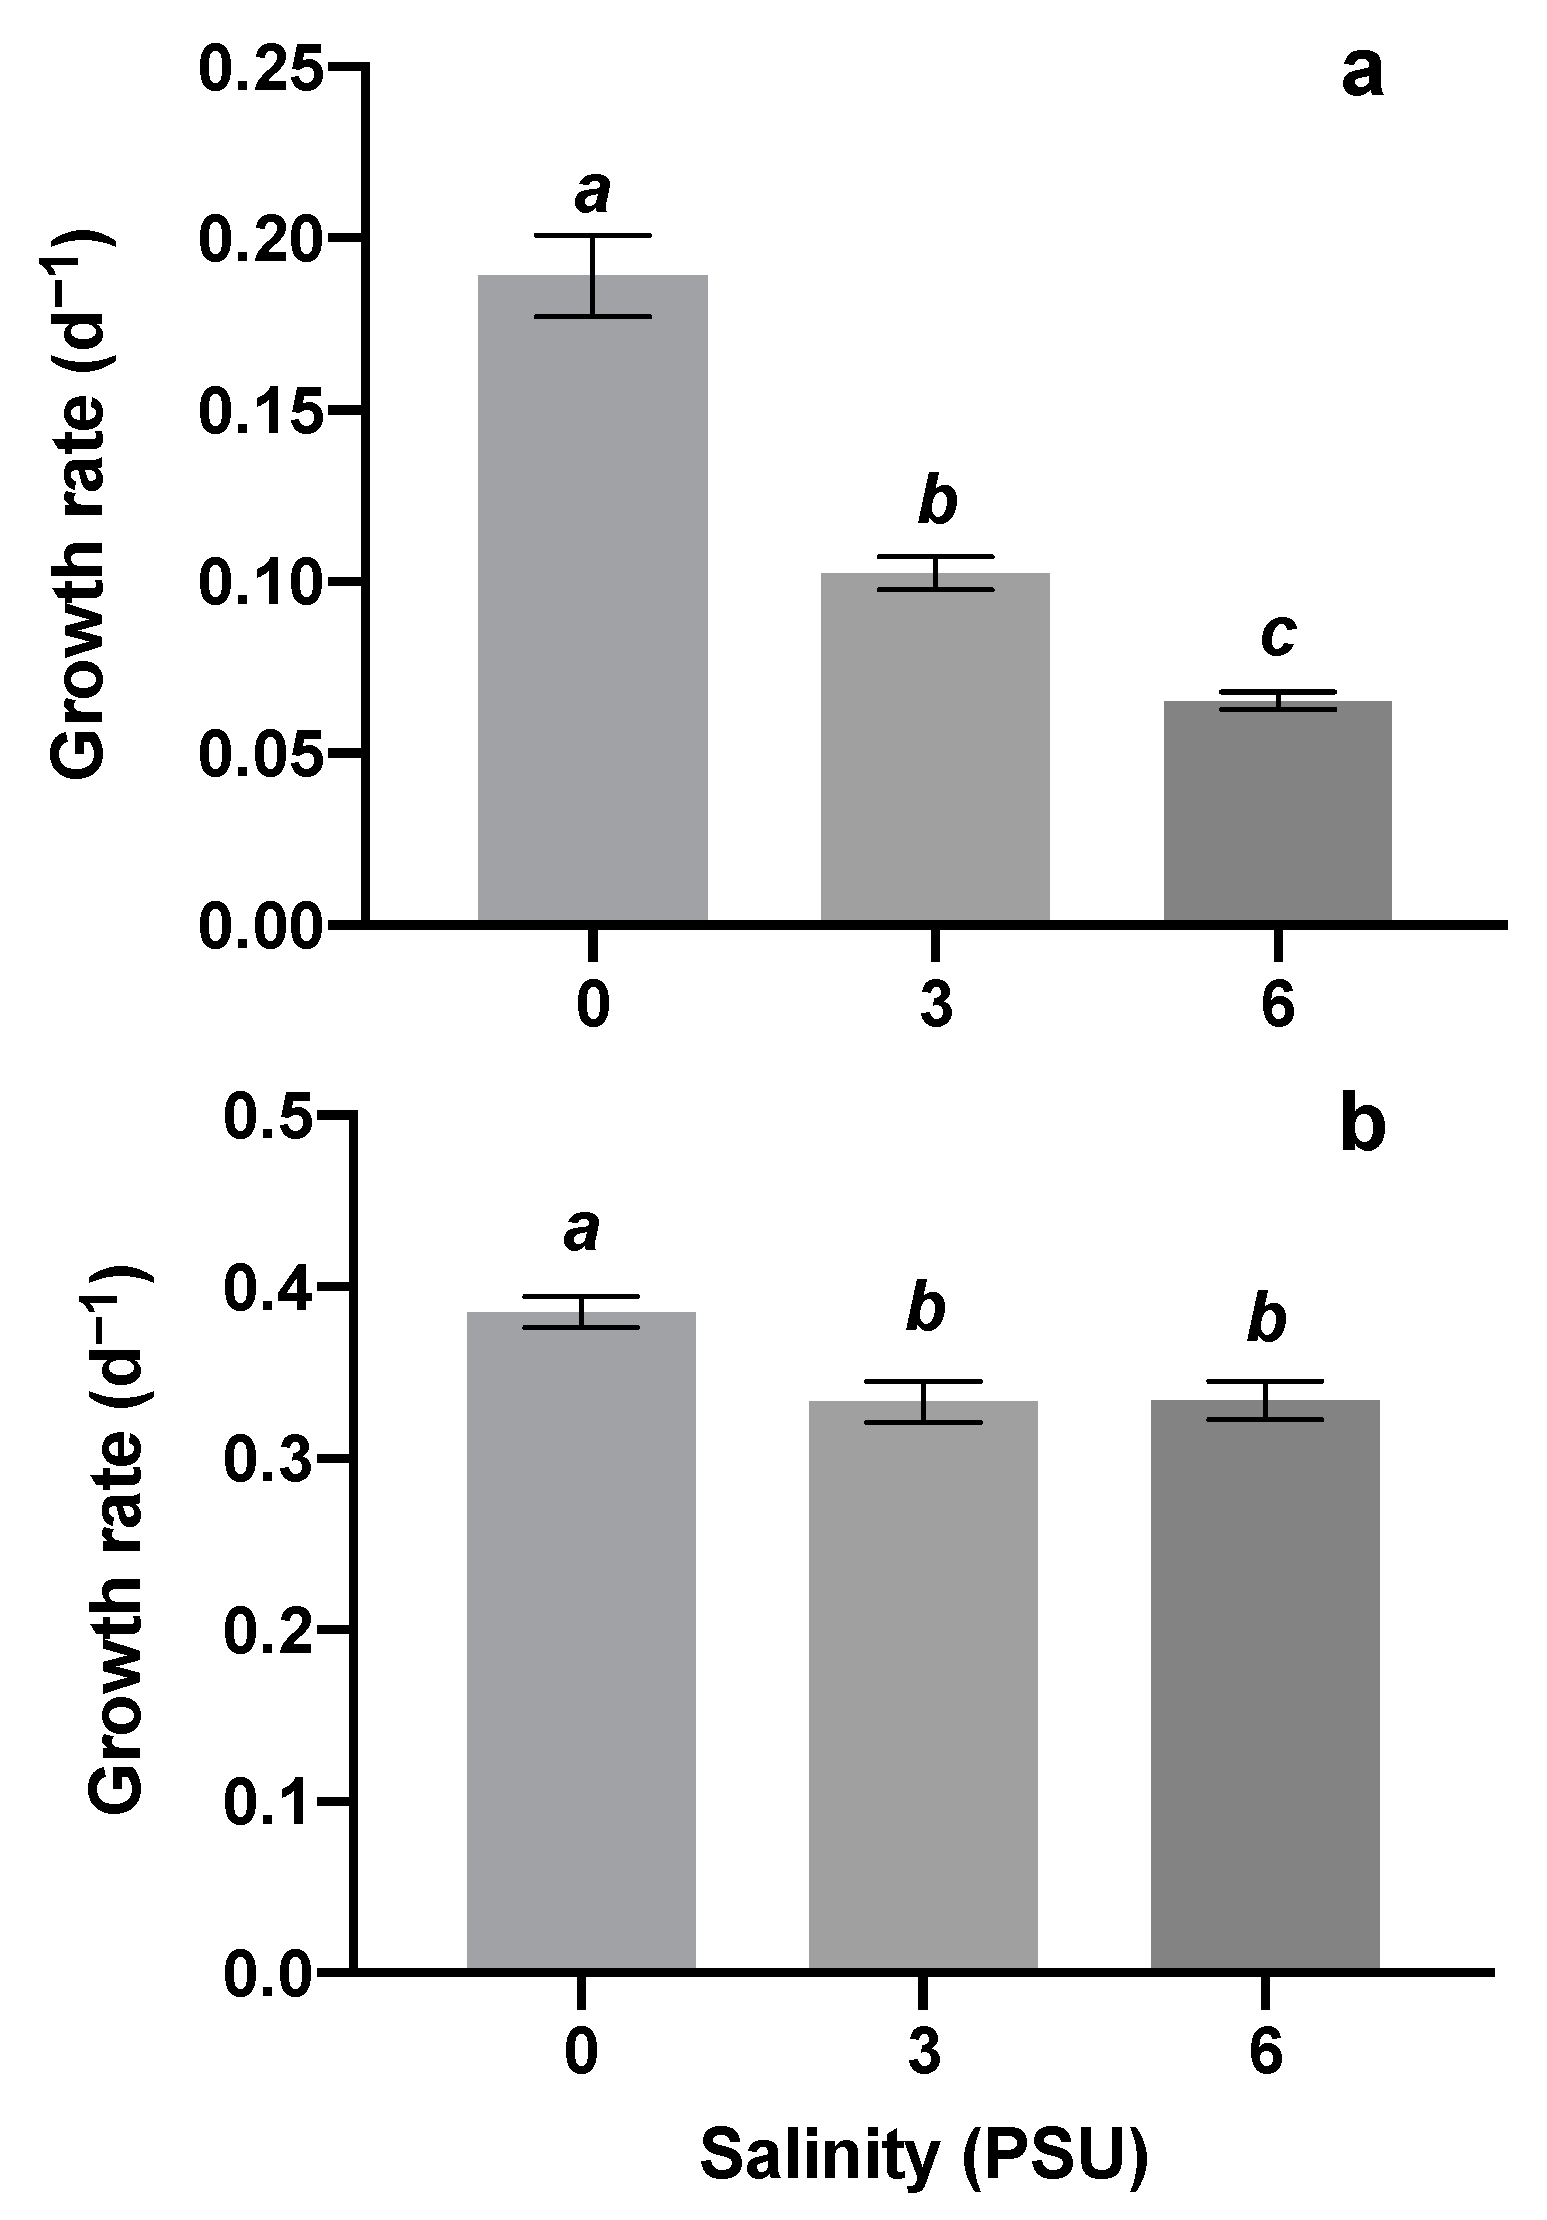
In monocultures, salinity had a significant effect on the population growth of M. aeruginosa (one-way ANOVA: F(2,6) = 71.37, p < 0.0001) and S. obliquus (F(2,6) = 7.715, p = 0.0219). The algal population growth rate of M. aeruginosa significantly decreased with increasing salinity (Figure 1a), and the growth rate of S. obliquus was significantly lower under salinity stress but had no significant difference between the two salinity groups (3, 6) (Figure 1b).
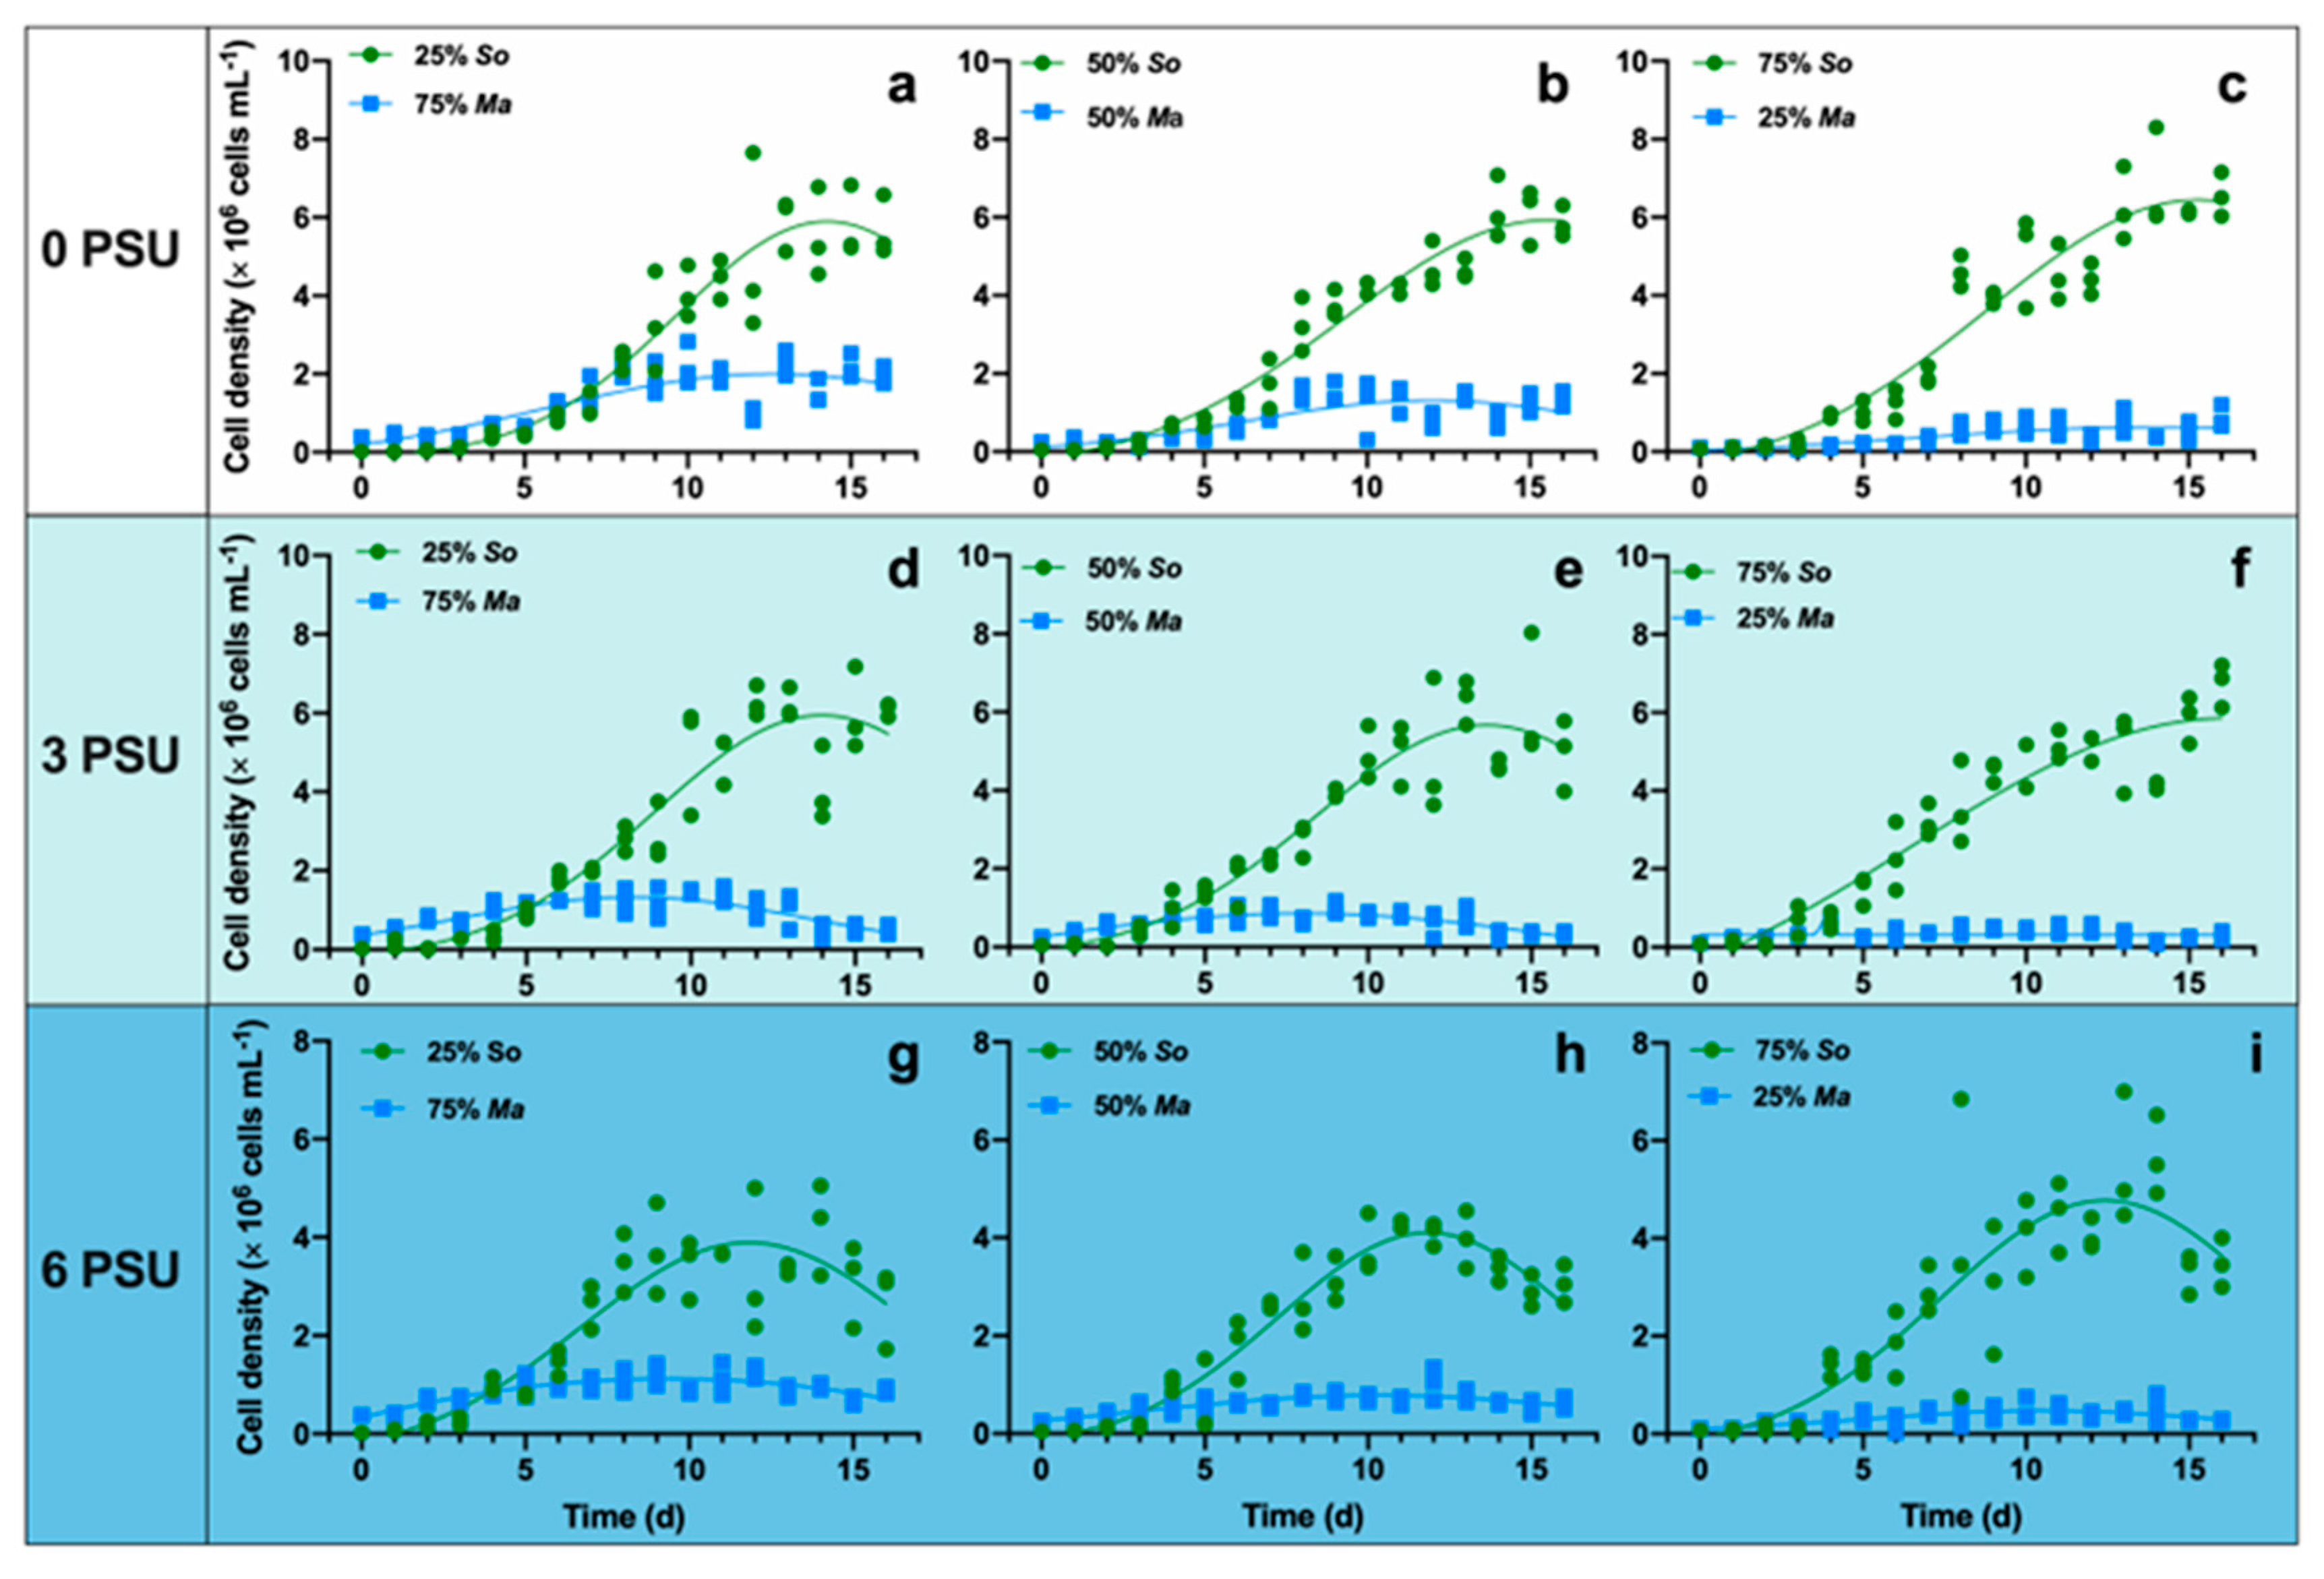
In the cocultures, S. obliquus showed a higher competitive capacity than M. aeruginosa in all treatments (Figure 2). Salinity increase caused growth inhibition of both algae, while the time to reach maximal cell density (Nmax) was slightly advanced under higher salinity conditions (Table 1). The results of two-way ANOVA tests showed a significant effect of salinity on Nmax and tmax of S. obliquus, and tmax of M. aeruginosa. The initial composition of two algal species had no effect on neither Nmax nor tmax of the two algae. Furthermore, there was no significant interaction between salinity and initial composition (Table 2). In the treatments with an initial cell density ratio of 75% Ma + 25% So, M. aeruginosa occupied dominance in the early several days. The competitive advantage of M. aeruginosa was maintained for 6.546, 5.208, and 3.989 days, respectively, in zero, three, and six (Figure 2a,d,g). When the initial density proportion of M. aeruginosa decreased to 50%, the competitive advantage could only maintain for 2.950, 3.547 and 3.289 days, respectively, in zero, three, and six (Figure 2b,e,h). However, in treatments with an initial ratio of 25% Ma + 75% So, S. obliquus occupied dominance from second day (Figure 2c,f,i).
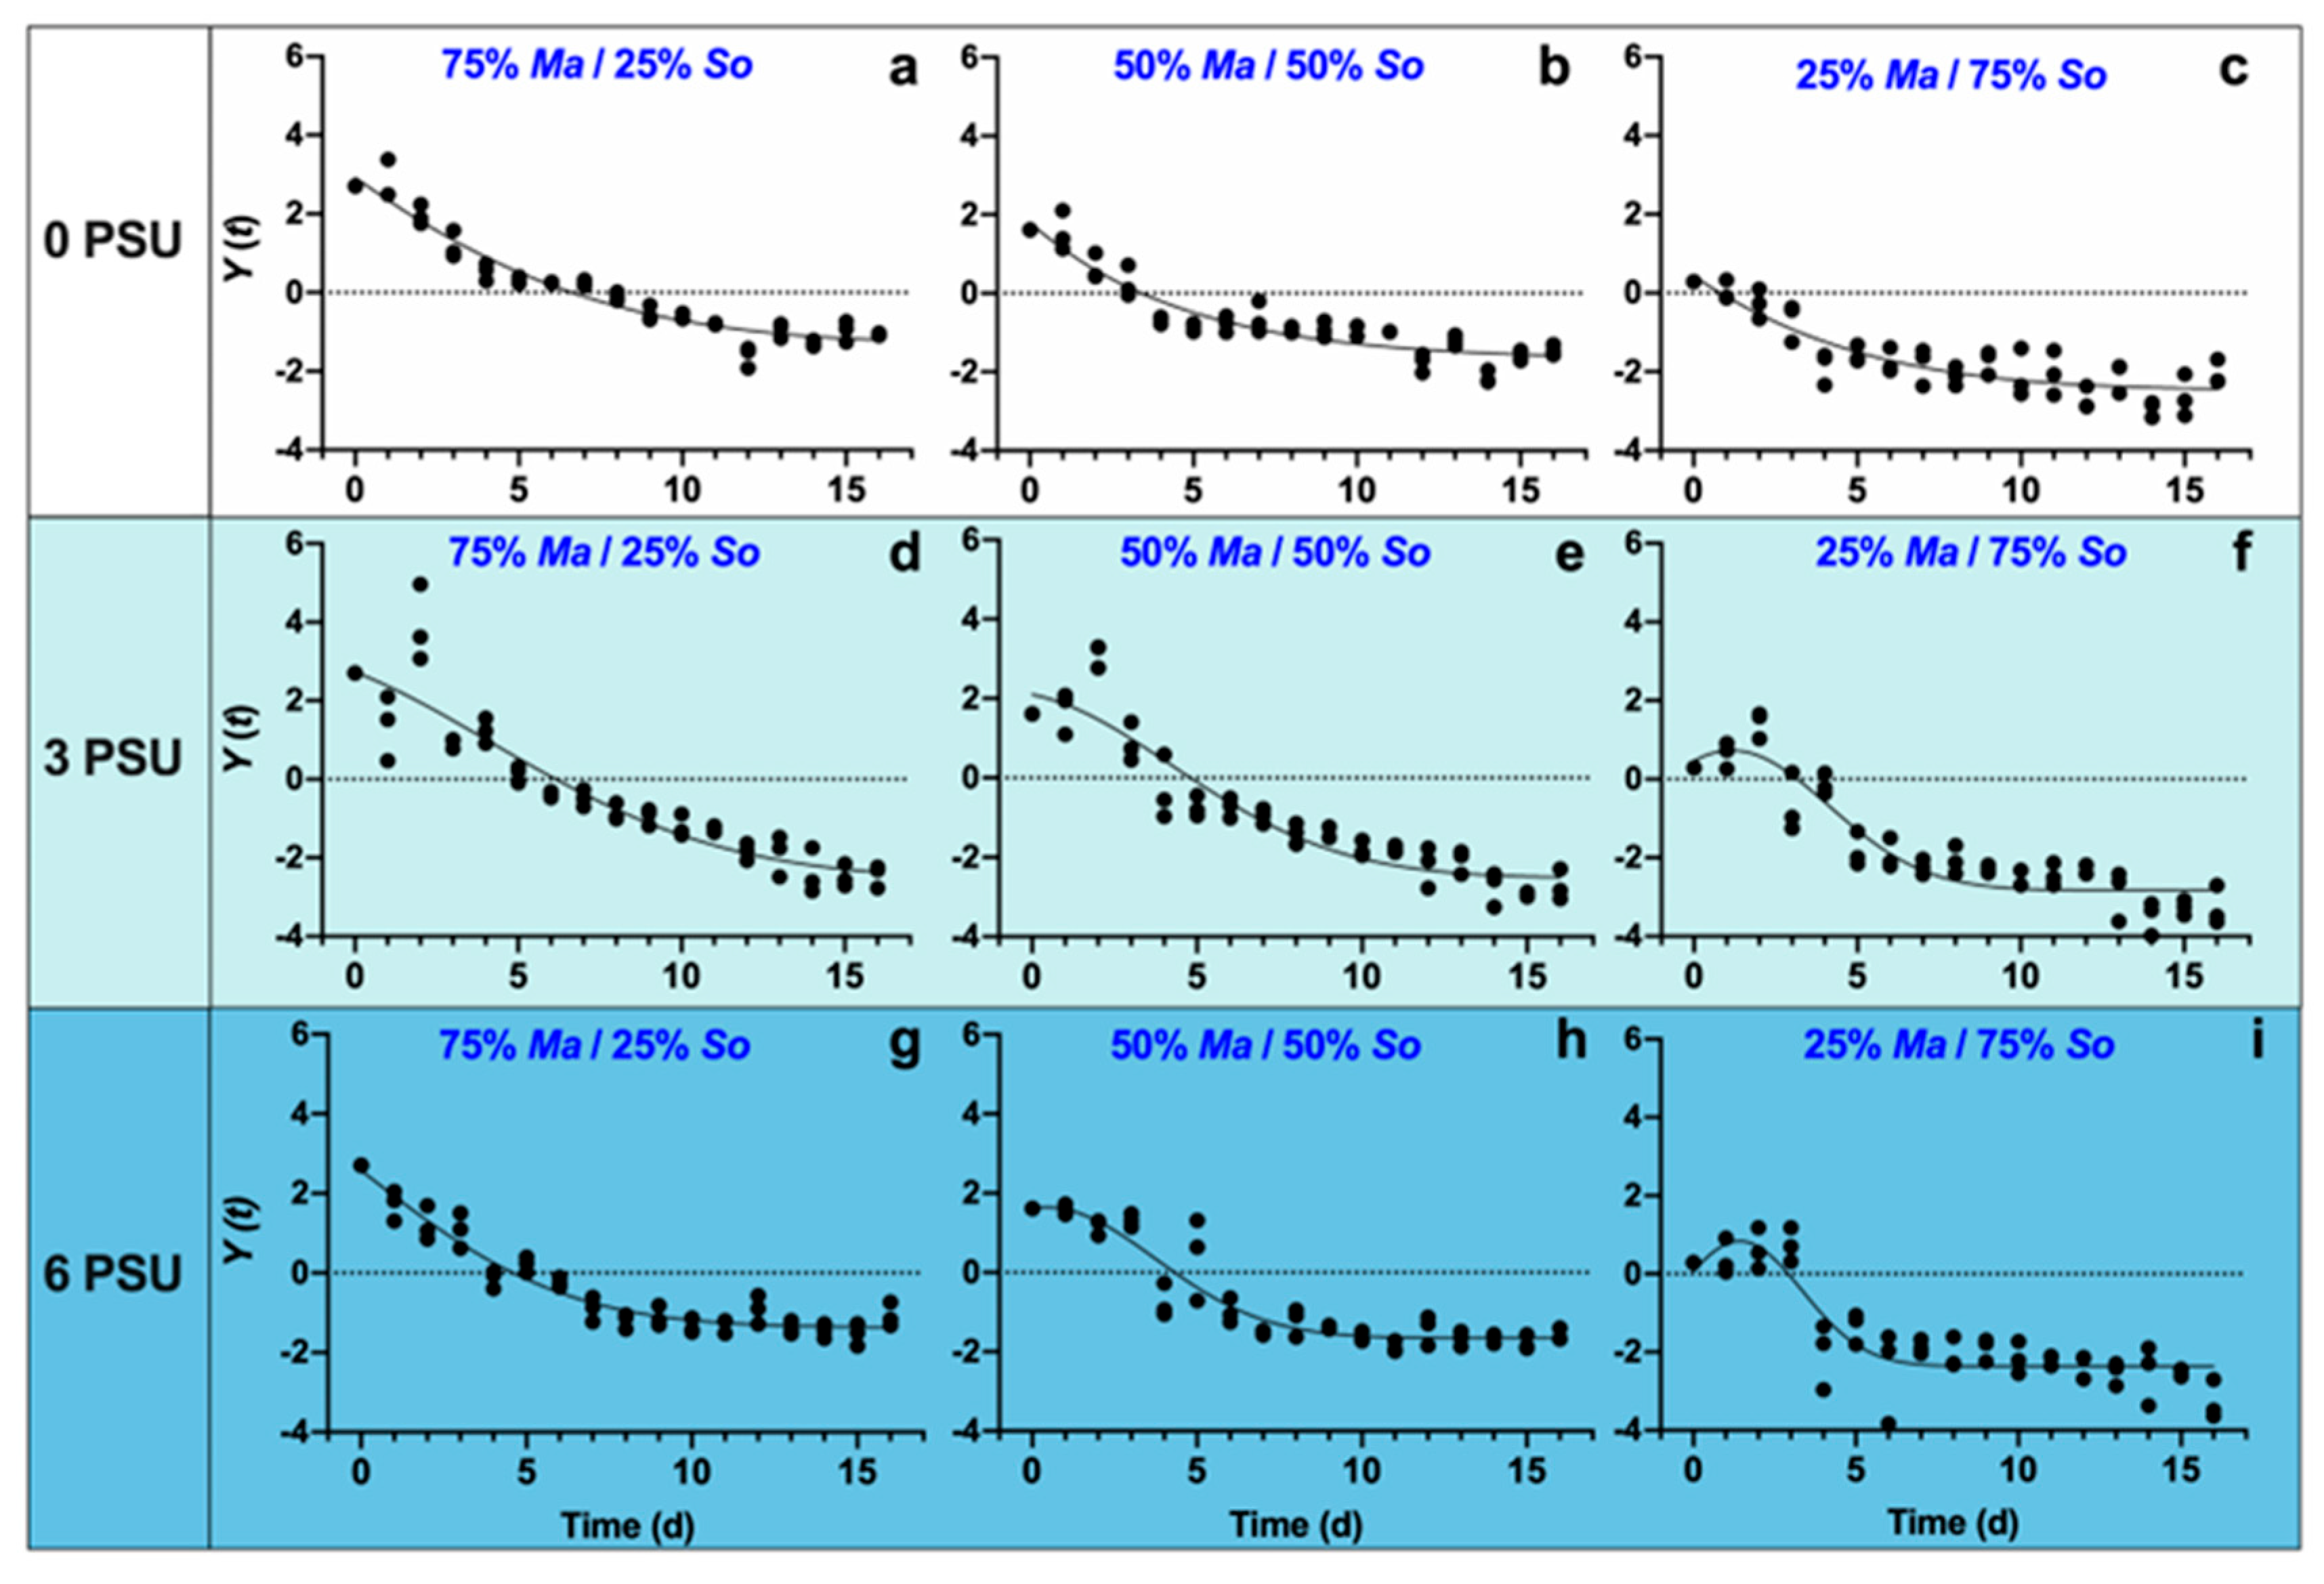
Nonlinear fitting was performed on all cocultures to compare the displacement of S. obliquus by M. aeruginosa. The value of Y(t) generally started with an increasing trend, indicating that M. aeruginosa was in domination in the cocultures at the early stage (Figure 3). Then M. aeruginosa was replaced by S. obliquus in all treatments. In addition, increasing trends in the values of Y(t) were found at the salinity of zero, regardless of the initial algal composition (Figure 3a–c). At the same salinity level, the higher the initial proportion of M. aeruginosa, the smaller the maximum, indicating a decreasing competitive advantage of S. obliquus with increasing M. aeruginosa initial algal concentration. Furthermore, the width of the Gaussian distributions (SD′) showed downward trends with both the increased salinity and the less proportion of M. aeruginosa in cocultures (Table 1, Figure 3), indicating the salinity increase would accelerate the displacement of M. aeruginosa by S. obliquus. We concluded that M. aeruginosa maintained a competitive advantage for a shorter time, making it easier for S. obliquus to emerge as superior in competition as time progressed.
3.2. Morphological Variations of S. obliquus
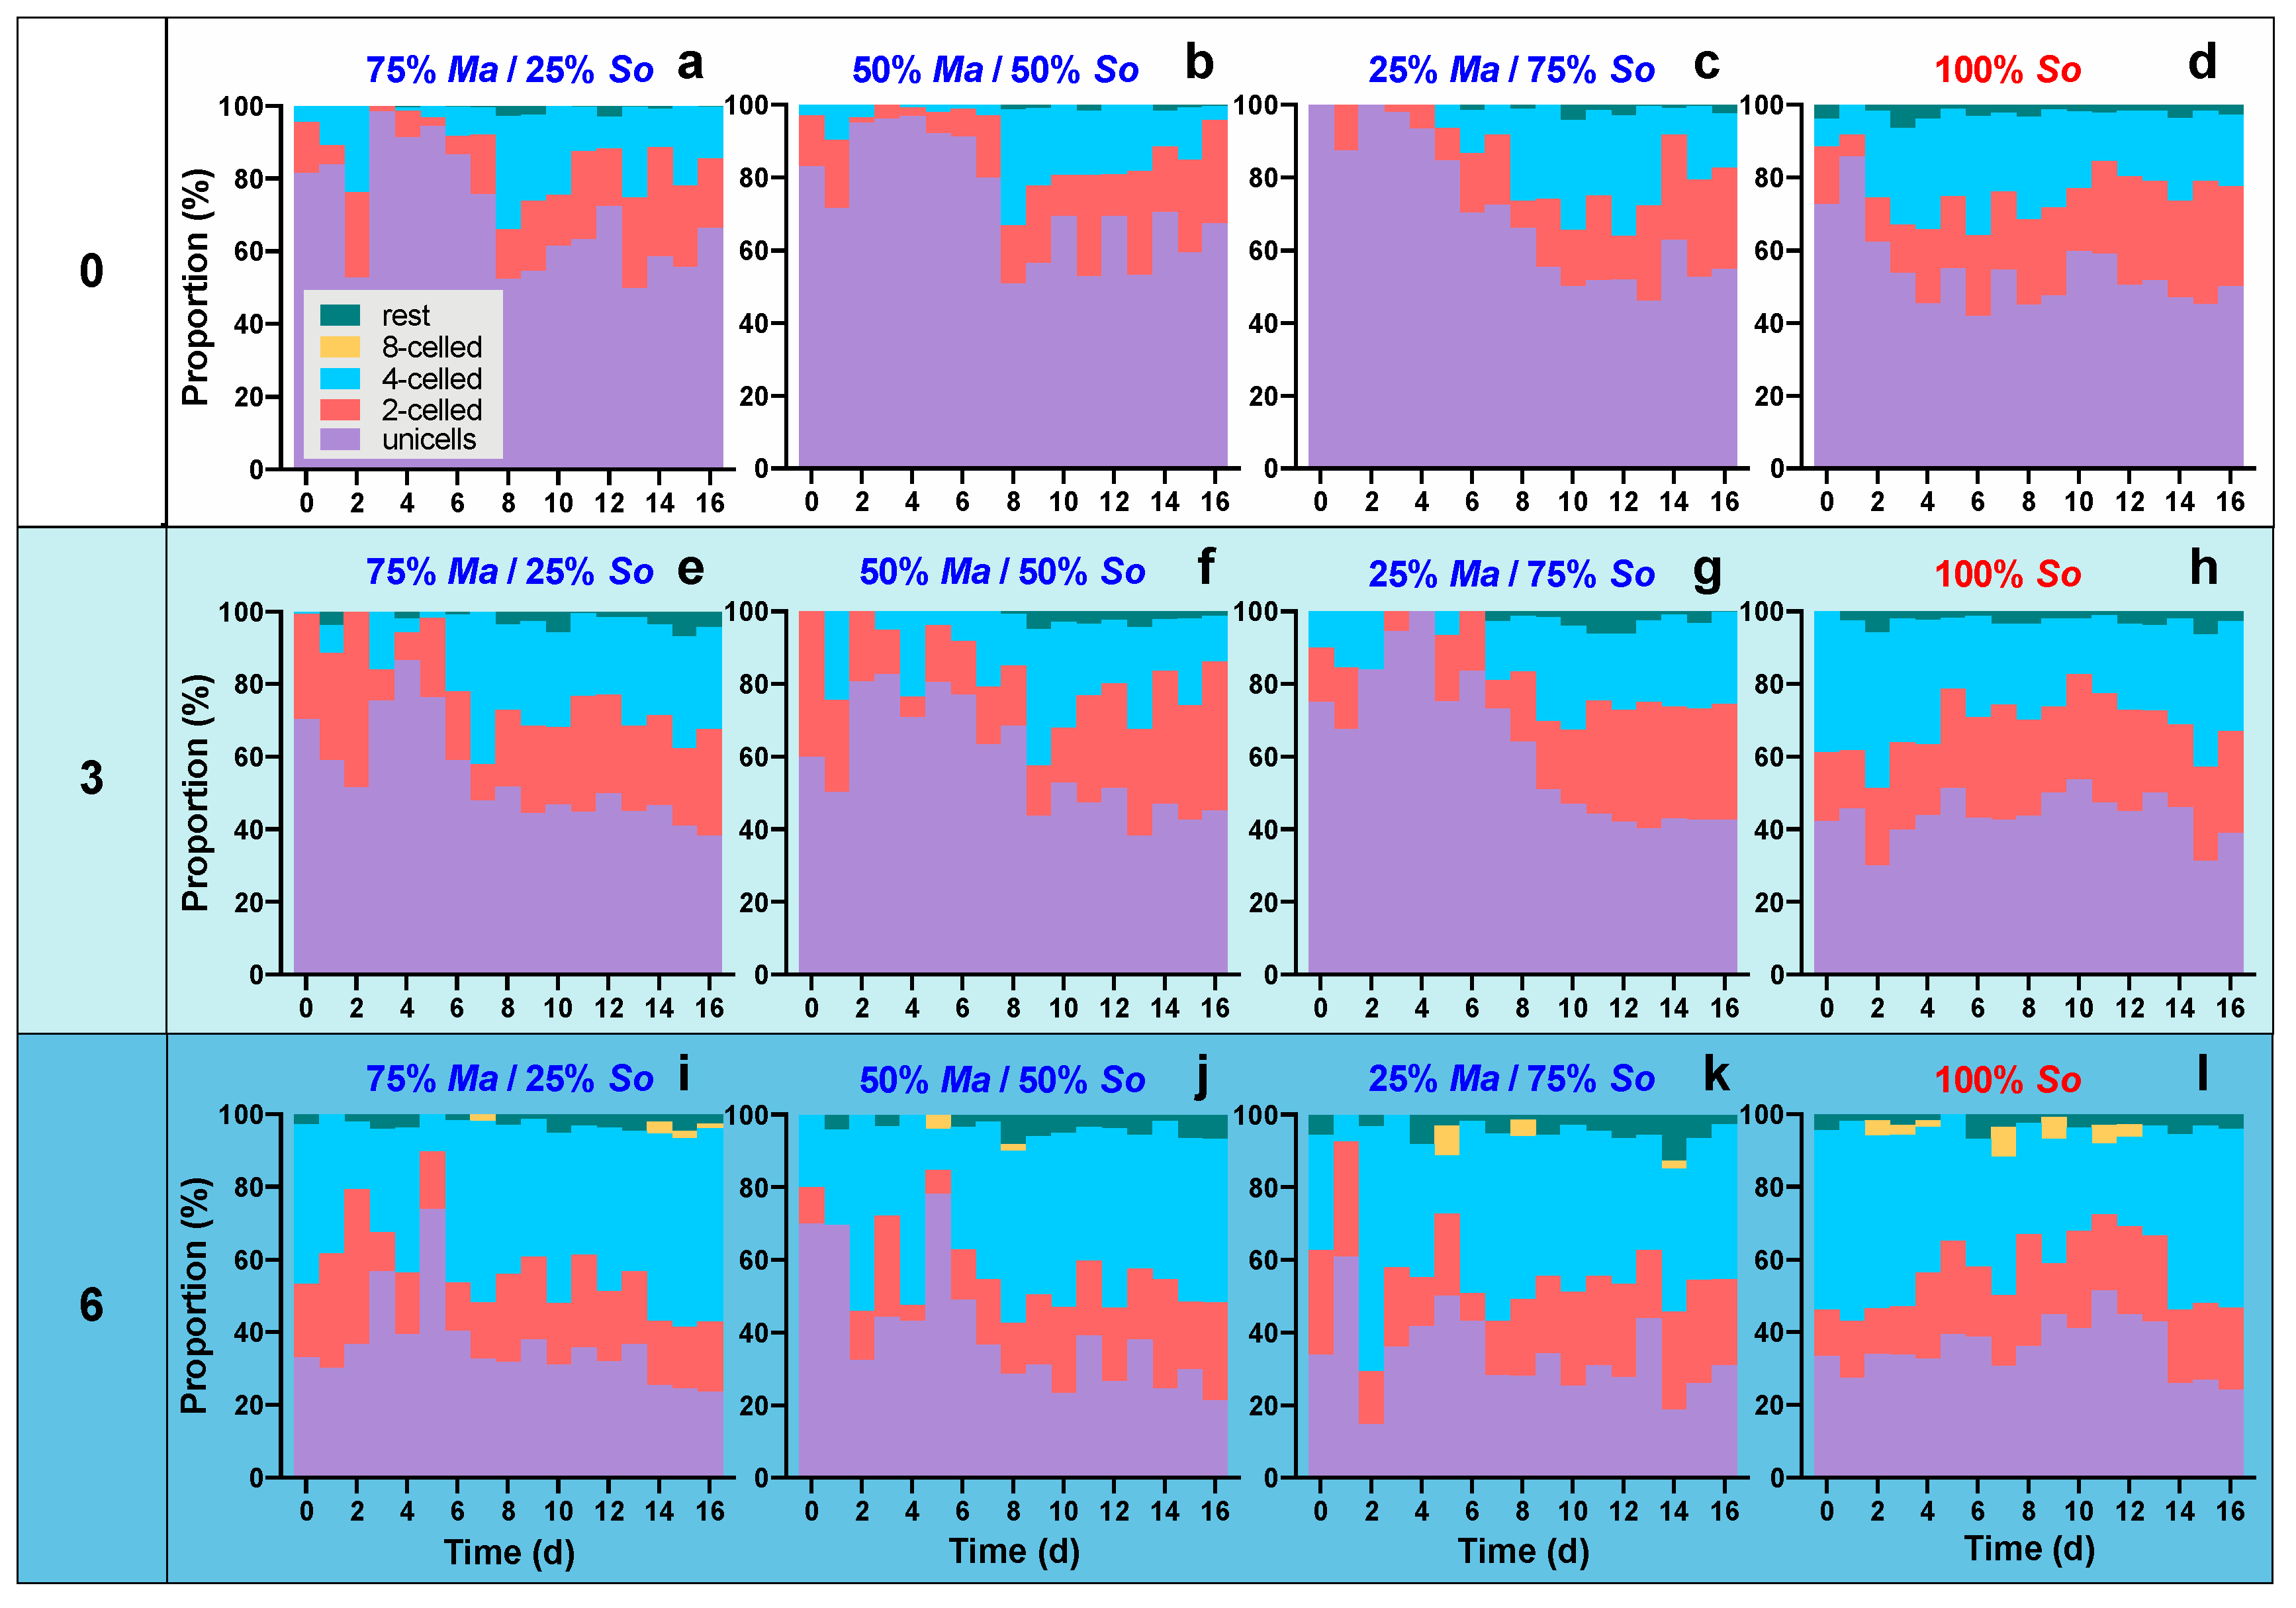
Both salinity and competition influenced the morphology of S. obliquus. In general, S. obliquus formed more colonies with increasing salinity, whereas the presence of M. aeruginosa inhibited the colony formation of S. obliquus. When the salinity was zero, S. obliquus populations were dominated by unicells (Figure 4a–d). The coexisting of M. aeruginosa caused increases in proportion to unicells: the 16-day average proportion of unicells in monoculture was about 54.5% (Figure 4d), whereas the proportions were above 70% in the three cocultures (Figure 4a–c). With increased salinity, the proportion of unicells rapidly decreased depending on the salinity. In the monocultures, the 16-day average proportion of unicells decreased to 43.9% and 35.8%, respectively, at three and six (Figure 4h,l). Higher salinity also caused increases in the proportion of 4-celled colonies (Figure 4h,l); meanwhile, 8-celled large colonies existed at six in both mono- and cocultures (Figure 4i–l). The coexistence of M. aeruginosa inhibited the formation of 4-celled and 8-celled colonies of S. obliquus at three and six, especially in the early several days (Figure 4e–g,i–k).
3.3. Photosynthetic Performance of Both Algae in Cocultures
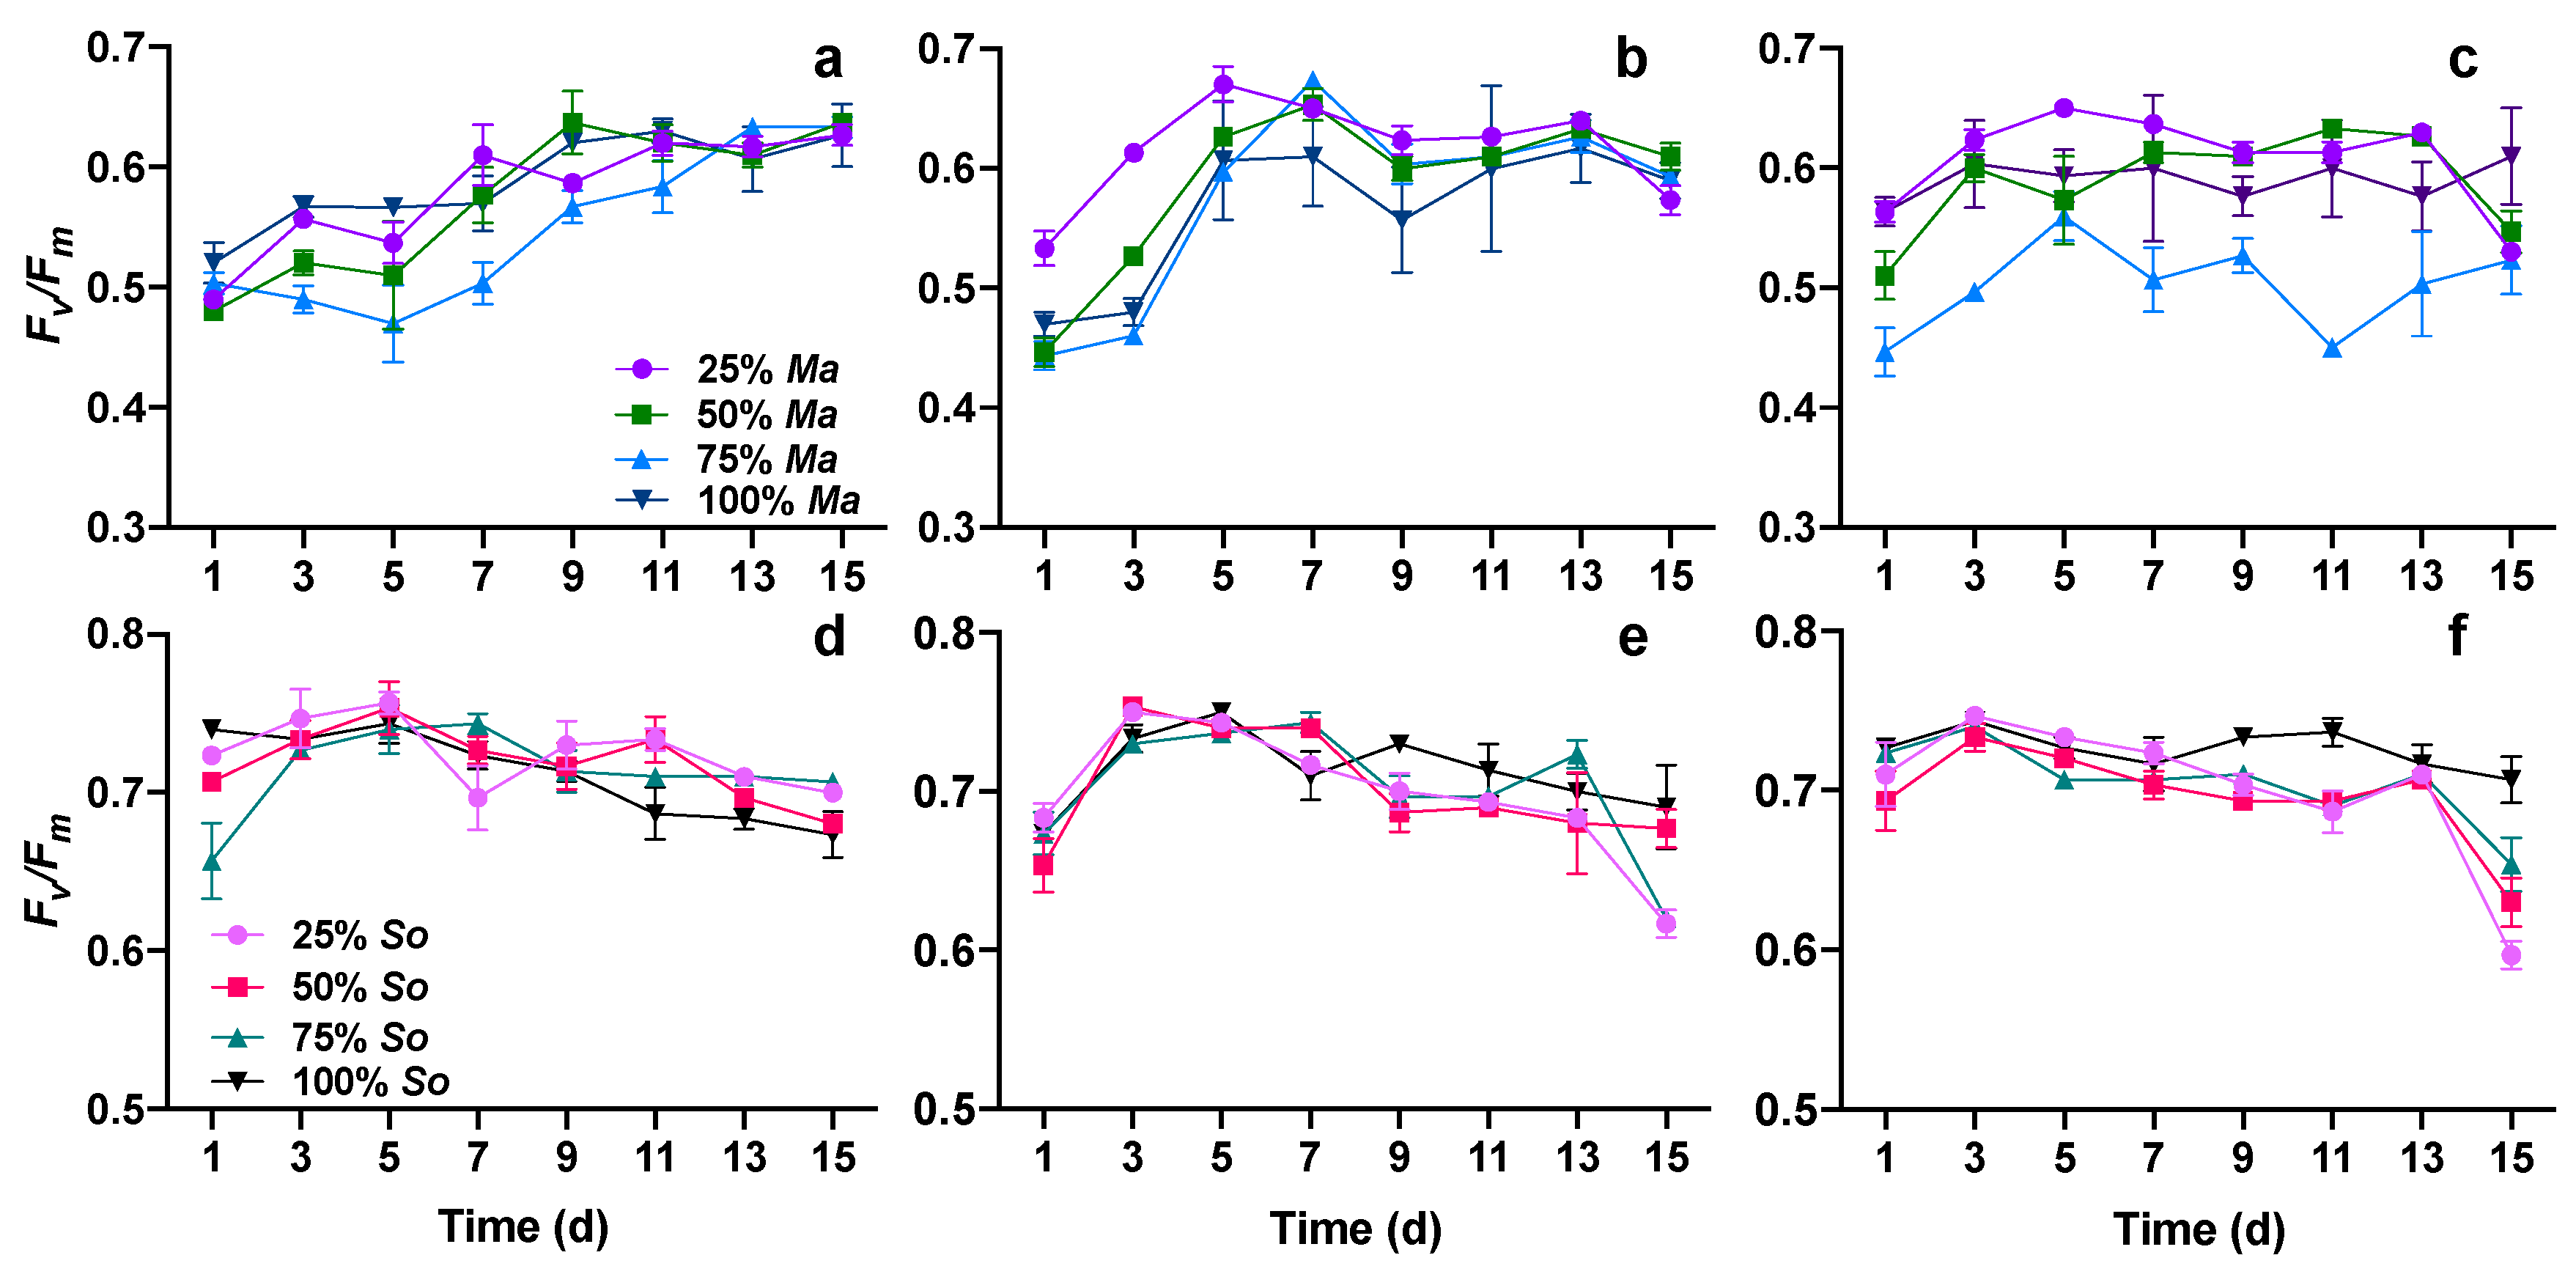
The maximal efficiency of PSII photochemistry (Fv/Fm) was significantly affected by the increase in salinity, the presence of competitors, and the incubation time for both M. aeruginosa and S. obliquus (Figure 5, Table 3). Additionally, there were statistically significant interactions on Fv/Fm of both algae between time, salinity, and initial proportion of algae. For M. aeruginosa, Fv/Fm differed significantly between the treatments of zero and three (p = 0.016), also zero and six (p = 0.006), but not significantly between the two high salinity treatments (p = 0.635). Fv/Fm increased with time when cultured at zero (Figure 5a), when at three and six, Fv/Fm increased more rapidly than at zero (Figure 5b,c). Interestingly, the treatment of 75% Ma + 25% So had the lowest Fv/Fm value in zero and six (Figure 5a,c). For S. obliquus (Figure 5d–f), similar to M. aeruginosa, Fv/Fm differed significantly between the treatments of zero and three (p < 0.001), also zero and six (p < 0.001), but not significantly between the two high salinity treatments (p = 0.230). The initial algal proportion affected Fv/Fm differently with M. aeruginosa: monoculture (100% So) differed significantly with all three cocultures, whereas Fv/Fm of the cocultures had no significant difference. Especially in the treatment of six, Fv/Fm was higher in monoculture than in cocultures (Figure 5f).
4. Discussion
This study analyzed the effect of salinity stress on the growth and competition of two algae species, M. aeruginosa and S. obliquus, in both monocultures and cocultures. Results showed that the growth rate of M. aeruginosa significantly decreased with increasing salinity, while the growth rate of S. obliquus was lower under salinity stress but had no significant difference between the two salinity groups. In cocultures, S. obliquus showed a higher competitive capacity, and an increased salinity caused growth inhibition for both algae. Additionally, the morphology of S. obliquus was influenced by both salinity and competitor.
In the present study, salinity had a negative effect on the population abundances of S. obliquus and M. aeruginosa monocultures, but S. obliquus was more tolerant to salinity than M. aeruginosa. Although there is significant variation in the salinity tolerance of freshwater microalgae, some species respond actively to frequent fluctuations in salinity [31]. Under salt stress, algal cells adapt through processes such as Na+ extrusion, accumulation and synthesis of certain solutes, and metabolic modifications like synthesizing compatible solutes, such as sugars, amino acids, and fats, which act as osmoprotectants. The differences in interspecies sensitivity to salinity were likely due to the inherent morphological and physiological aspects of each species. S. obliquus can form colonies through the attachment of daughter cells during cell division and can produce a mucilage envelope, which serves as a protective mechanism against environmental stressors, such as salinity and heavy metals toxicity [32,33]. Zhu et al. [34] reported that the presence of M. aeruginosa affected the formation of morphological defence against grazers in S. obliquus. This suggested that competition can influence the ability of organisms to defend themselves against stressors. Nevertheless, the formation of cell colonies can relieve the stress caused by elevated salinity levels, although this mechanism of defence may have an impact on algal growth, such as reducing the surface-to-volume ratio and intensifying nutrient competition among cells. Small-sized unicells have a relatively high surface-to-volume ratio, which facilitates nutrient uptake and utilization of light [35]. M. aeruginosa has been found to have weak osmotic regulating abilities because of its limited ability to synthesize compatible solutes. Even decreases in microcystin production in M. aeruginosa under high osmotic conditions have been reported in former studies [36,37], but contrary change has been found in Planktothrix agardhii [38]. Further, the relatively thin cell wall of M. aeruginosa makes it susceptible to osmotic stress. In natural waters, M. aeruginosa can often form large colonies with a mucilage sheath, which could act as a hydrated matrix and maintain a more stable osmotic environment within the colonies [39]. In our study, M. aeruginosa maintained unicellular or bicellular morphs; no mucilage sheath was synthesized during the experiment, which might cause less tolerance to high salinity.
In the present study, salinity increased competition pressure on M. aeruginosa, enabling S. obliquus to gain a competitive advantage. These findings suggest that even slight changes in salinity can significantly alter competition dynamics between microalgae species. In cocultures, M. aeruginosa had a shorter competitive advantage, and as time passed, S. obliquus was superior in competition. M. aeruginosa is a common bloom-forming phytoplankton that can coexist with Scenedesmus in temperate eutrophic lakes [40]. Song et al. [41] found M. aeruginosa can inhibit the growth of C. vulgaris by releasing allelopathic metabolites, such as linoleic acid. Qian et al. [42] reported similar results that C. pyrenoidosa was also inhibited by linoleic acid released by M. aeruginosa. Changes in environmental conditions often alter the balance of interspecific competition. Yang et al. [43] found that high temperature and pH favoured the growth of M. aeruginosa and gave it a competitive advantage over S. obliquus. Further, high temperature and low light intensity favoured M. aeruginosa and a competitive advantage over S. obliquus was found in the study of Wei et al. [44]. In our study, algae were cultured at a relatively low temperature (20 °C) for M. aeruginosa, which might be the reason for the competitive inhibition by S. obliquus. Different initial concentrations also played a role in interspecific competition. When the initial concentration of M. aeruginosa increased, the competitive advantage of S. obliquus decreased.
The widespread occurrence of freshwater salinization is leading to the alteration of community structures in freshwater ecosystems. Many studies have reported that Microcystis proliferates in brackish waters. Several factors contribute to the growth of this cyanobacteria, including nutrient enrichment (e.g., from fertilizer runoff or wastewater discharge), changes in water temperature, and altered hydrological conditions (e.g., changes in water flow). Additionally, the loss of natural predators, such as zooplankton, due to changes in the aquatic ecosystem may also play a role. Nevertheless, Microcystis is often considered a less salt-tolerant species compared to some chlorophytes, such as Scenedesmus, Chlorella, or some species of diatom [45,46]. Under increased salinity conditions, freshwater algae often experienced decreases not only in biomass and also in the content of photosynthetic pigments, including chlorophyll-a, b and carotenoid, and the reduction of overall photosynthesis efficiency. Our study investigated the maximal efficiency of the photochemistry of these two typical freshwater algae, and reduction has been found under salinity conditions. Further, the coexistence of two algae had a negative effect on Fv/Fm, especially in the treatment of six. The influence of competition on photosynthetic efficiency has also been documented, Sun et al. [47] found that ultraviolet-B (UV-B) radiation stress changed the competitive outcome of algae and that this change was related to changes in photosynthetic efficiency. Light limitation from the shading effect of the coexisting algae might be responsible for the reduction of Fv/Fm [48]. Additionally, allelopathic substances secreted by competitors could also affect photosynthesis. Hernández-Zamora et al. [49] reported the diminishment of chlorophyll-a, b of M. aeruginosa and two green algae in combined cultures. The allelopathic activity of cyanobacteria on other microalgae can vary, Zak et al. [50] found that while Anabaena variabilis had a strong inhibitory effect on C. vulgaris, Nodularia spumigena mostly stimulated its growth. Further, Different species of Scenedesmus have been found to restrict the growth of cyanobacteria through various means of exposure, including the use of conditioned water and crude extracts [51,52].
5. Conclusions
In summary, salinity stress affected the growth of M. aeruginosa and S. obliquus, with M. aeruginosa declining and S. obliquus having lower growth but no significant difference. In coculture, S. obliquus had a higher competitive capacity and displaced M. aeruginosa faster with increased salinity. The photosynthetic performance of both algae was affected by salinity, competition, and cultivation time. Additionally, S. obliquus showed morphological changes under salinity stress and competition. The findings of our study indicated the salinization of freshwater could impact the interspecific interactions among phytoplankton, which play an important role in the functioning of freshwater ecosystems.
Author Contributions
Conceptualization, T.G. and X.Z.; methodology, software, data curation, Y.L., W.X. and Y.P.; investigation, Y.L.; writing—original draft preparation, T.G. and Y.L.; writing—review and editing, X.Z.; supervision, T.G.; project administration, T.G. and Y.L.; funding acquisition, T.G. and X.Z. All authors have read and agreed to the published version of the manuscript.
Funding
This research was funded by the National Natural Science Foundation of China (32101290) and the Natural Science Foundation of Jiangsu Province (BK20210364).
Data Availability Statement
The data presented in this study are available on request from the corresponding author.
Conflicts of Interest
The authors declare no conflict of interest.
References
- Kaushal, S.S.; Likens, G.E.; Pace, M.L.; Utz, R.M.; Haq, S.; Gorman, J.; Grese, M. Freshwater salinization syndrome on a continental scale. Proc. Natl. Acad. Sci. USA 2018, 115, E574–E583. [Google Scholar] [CrossRef] [Green Version]
- Castillo, A.M.; Sharpe, D.M.; Ghalambor, C.K.; De León, L.F. Exploring the effects of salinization on trophic diversity in freshwater ecosystems: A quantitative review. Hydrobiologia 2018, 807, 1–17. [Google Scholar] [CrossRef]
- Metz, B.; Davidson, O.; Bosch, P.; Dave, R.; Meyer, L. Climate Change 2007: Mitigation of Climate Change; Intergovernmental Panel on Climate Change: Geneva, Switzerland, 2007. [Google Scholar]
- Metz, B.; Davidson, O.R.; Bosch, P.R.; Dave, R.; Meyer, L.A. (Eds.) Contribution of Working Group III to the Fourth Assessment Report of the Intergovernmental Panel on Climate Change; Cambridge University Press: Cambridge, UK, 2007; ISBN 9780521880114. [Google Scholar]
- Vidal, N.; Yu, J.; Gutierrez, M.F.; de Mello, F.T.; Tavşanoğlu, Ü.N.; Çakiroglu, A.I.; He, H.; Meerhoff, M.; Brucet, S.; Liu, Z.W.; et al. Salinity shapes food webs of lakes in semiarid climate zones: A stable isotope approach. Inland Waters 2021, 11, 476–491. [Google Scholar] [CrossRef]
- El Hamidi, L.; Larabi, A.; Faouzi, M. Numerical modeling of saltwater intrusion in the rmel-oulad ogbane coastal aquifer (Larache, Morocco) in the climate change and sea-level rise context (2040). Water 2021, 13, 2167. [Google Scholar] [CrossRef]
- El Shinawi, A.; Kuriqi, A.; Zelenakova, M.; Vranayova, Z.; Abd-Elaty, I. Land subsidence and environmental threats in coastal aquifers under sea level rise and over-pumping stress. J. Hydrol. 2022, 608, 127607. [Google Scholar] [CrossRef]
- Cunillera-Montcusí, D.; Beklioğlu, M.; Cañedo-Argüelles, M.; Jeppesen, E.; Ptacnik, R.; Amorim, C.A.; Arnott, S.E.; Berger, S.A.; Brucet, S.; Dugan, H.A.; et al. Freshwater salinisation: A research agenda for a saltier world. Trends Ecol. Evol. 2022, 37, 440–453. [Google Scholar] [CrossRef]
- Talebi, A.F.; Tabatabaei, M.; Mohtashami, S.K.; Tohidfar, M.; Moradi, F. Comparative salt stress study on intracellular ion concentration in marine and salt-adapted freshwater strains of microalgae. Not. Sci. Biol. 2013, 5, 309–315. [Google Scholar] [CrossRef] [Green Version]
- Demetriou, G.; Neonaki, C.; Navakoudis, E.; Kotzabasis, K. Salt stress impact on the molecular structure and function of the photosynthetic apparatus—The protective role of polyamines. BBA-Bioenerg. 2007, 1767, 272–280. [Google Scholar] [CrossRef] [Green Version]
- Christensen, I.; Pedersen, L.K.; Søndergaard, M.; Lauridsen, T.L.; Tserenpil, S.; Richardson, K.; Amorim, C.A.; Pacheco, J.P.; Jeppesen, E. Impact of zooplankton grazing on phytoplankton in north temperate coastal lakes: Changes along gradients in salinity and nutrients. Hydrobiologia 2022. [Google Scholar] [CrossRef]
- He, H.; Jeppesen, E.; Bruhn, D.; Yde, M.; Hansen, K.J.; Spanggaard, L.; Madsen, N.; Liu, W.; Søndergaard, M.; Lauridsen, T.L. Decadal changes in zooplankton biomass, composition and body mass in four temperate shallow brackish lakes subjected to various degrees of eutrophication. Inland Waters 2020, 10, 186–196. [Google Scholar] [CrossRef]
- Jensen, E.; Brucet, S.; Meerhoff, M.; Nathansen, L.; Jeppesen, E. Community structure and diel migration of zooplankton in brackish lakes: Role of salinity and predators. Hydrobiologia 2010, 646, 215–229. [Google Scholar] [CrossRef]
- Szöcs, E.; Coring, E.; Bäthe, J.; Schäfer, R.B. Effects of anthropogenic salinization on biological traits and community composition of stream macroinvertebrates. Sci. Total Environ. 2014, 468, 943–949. [Google Scholar] [CrossRef] [PubMed]
- Li, T.; Liu, G.; Yuan, H.; Chen, J.; Lin, X.; Li, H.; Yu, L.; Wang, C.; Li, L.; Zhuang, Y.; et al. Eukaryotic plankton community assembly and influencing factors between continental shelf and slope sites in the northern South China Sea. Environ. Res. 2023, 216, 114584. [Google Scholar] [CrossRef] [PubMed]
- Omidi, A.; Pflugmacher, S.; Kaplan, A.; Kim, Y.J.; Esterhuizen, M. Reviewing interspecies interactions as a driving force affecting the community structure in lakes via cyanotoxins. Microorganisms 2021, 9, 1583. [Google Scholar] [CrossRef] [PubMed]
- Borics, G.; Abonyi, A.; Salmaso, N.; Ptacnik, R. Freshwater phytoplankton diversity: Models, drivers and implications for ecosystem properties. Hydrobiologia 2021, 848, 53–75. [Google Scholar] [CrossRef]
- Hutchinson, G. The paradox of the plankton. Am. Nat. 1961, 95, 137–145. [Google Scholar] [CrossRef] [Green Version]
- Roy, S.; Chattopadhyay, J. Towards a resolution of ‘the paradox of the plankton’: A brief overview of the proposed mechanisms. Ecol. Complex. 2007, 4, 26–33. [Google Scholar] [CrossRef]
- Suttle, C.A.; Chan, A.M.; Cottrell, M.T. Infection of phytoplankton by viruses and reduction of primary productivity. Nature 1990, 347, 467–469. [Google Scholar] [CrossRef]
- Pal, M.; Yesankar, P.J.; Dwivedi, A.; Qureshi, A. Biotic control of harmful algal blooms (HABs): A brief review. J. Environ. Manag. 2020, 268, 110687. [Google Scholar] [CrossRef]
- Dawson, R.M. The toxicology of microcystins. Toxicon 1998, 36, 953–962. [Google Scholar] [CrossRef]
- Tonk, L.; Bosch, K.; Visser, P.M.; Huisman, J. Salt tolerance of the harmful cyanobacterium Microcystis aeruginosa. Aquat. Microb. Ecol. 2007, 46, 117–123. [Google Scholar] [CrossRef]
- Preece, E.P.; Hardy, F.J.; Moore, B.C.; Bryan, M. A review of microcystin detections in Estuarine and Marine waters: Environmental implications and human health risk. Harmful Algae 2017, 61, 31–45. [Google Scholar] [CrossRef] [Green Version]
- Tanabe, Y.; Hodoki, Y.; Sano, T.; Tada, K.; Watanabe, M.M. Adaptation of the freshwater bloom-forming cyanobacterium Microcystis aeruginosa to brackish water is driven by recent horizontal transfer of sucrose genes. Front. Microbiol. 2018, 9, 1150. [Google Scholar] [CrossRef] [Green Version]
- Takeya, K.; Kuwata, A.; Yoshida, M.; Miyazaki, T. Effect of dilution rate on competitive interactions between the cyanobacterium Microcystis novacekii and the green alga Scenedesmus quadricauda in mixed chemostat cultures. J. Plankton Res. 2004, 26, 29–35. [Google Scholar] [CrossRef]
- Ji, X.; Verspagen, J.M.; Stomp, M.; Huisman, J. Competition between cyanobacteria and green algae at low versus elevated CO2: Who will win, and why? J. Exp. Bot. 2017, 68, 3815–3828. [Google Scholar] [CrossRef] [Green Version]
- Beardall, J.; Raven, J.A. Cyanobacteria vs green algae: Which group has the edge? Environ. Dev. Sustain. 2017, 68, 3697–3699. [Google Scholar] [CrossRef] [Green Version]
- Ray, J.G.; Santhakumaran, P.; Kookal, S. Phytoplankton communities of eutrophic freshwater bodies (Kerala, India) in relation to the physicochemical water quality parameters. Environ. Dev. Sustain. 2021, 23, 259–290. [Google Scholar] [CrossRef]
- Thorslund, J.; Bierkens, M.F.P.; Oude Essink, G.H.P.; Sutanudjaja, E.H.; van Vliet, M.T.H. Common irrigation drivers of freshwater salinisation in river basins worldwide. Nat. Commun. 2021, 12, 4232. [Google Scholar] [CrossRef]
- Brown, A.F.M.; Dortch, Q.; Van Dolah, F.M.; Leighfield, T.A.; Morrison, W.; Thessen, A.E.; Steidinger, K.; Richardson, B.; Moncreiff, C.A.; Pennock, J.R. Effect of salinity on the distribution, growth, and toxicity of Karenia spp. Harmful Algae 2006, 5, 199–212. [Google Scholar] [CrossRef]
- Zhu, X.; Wang, Y.; Hou, X.; Kong, Q.; Sun, Y.; Wang, J.; Huang, Y.; Yang, Z. High temperature promotes the inhibition effect of Zn2+ on inducible defense of Scenedesmus obliquus. Chemosphere 2019, 216, 203–212. [Google Scholar] [CrossRef]
- Jia, X.; Pan, Y.; Zhu, X. Salinization and heavy metal cadmium impair growth but have contrasting effects on defensive colony formation of Scenedesmus obliquus. Sci. Total Environ. 2023, 862, 160693. [Google Scholar] [CrossRef] [PubMed]
- Zhu, X.; Wang, J.; Lu, Y.; Chen, Q.; Yang, Z. Grazer-induced morphological defense in Scenedesmus obliquus is affected by competition against Microcystis aeruginosa. Sci. Rep. 2015, 5, 12743. [Google Scholar] [CrossRef] [PubMed] [Green Version]
- Huang, Y.; Cui, G.; Li, B.; Zhu, X.; Yang, Z. Elevated atmospheric CO2 enhances grazer-induced morphological defense in the freshwater green alga Scenedesmus obliquus. Limnol. Oceanogr. 2018, 63, 1004–1014. [Google Scholar] [CrossRef]
- Martin-Luna, B.; Sevilla, E.; Bes, M.T.; Fillat, M.F.; Peleato, M.L. Variation in the synthesis of microcystin in response to osmotic stress in Microcystin aeruginosa PCC 7806. Limnetica 2015, 34, 205–2014. [Google Scholar]
- Black, K.; Yilmaz, M.; Phlips, E.J. Growth and toxin production by Microcystis aeruginosa pcc 7806 (kutzing) lemmerman at elevated salt concentrations. J. Environ. Prot. 2011, 2, 669–674. [Google Scholar] [CrossRef] [Green Version]
- Vergalli, J.; Fayolle, S.; Combes, A.; Franquet, E.; Comte, K. Persistence of microcystin production by Planktothrix agardhii (Cyanobacteria) exposed to different salinities. Phycologia 2020, 59, 24–34. [Google Scholar] [CrossRef]
- Wang, W.; Sheng, Y.; Jiang, M. Physiological and metabolic responses of Microcystis aeruginosa to a salinity gradient. Environ. Sci. Pollut. Res. 2022, 29, 13226–13237. [Google Scholar] [CrossRef]
- Helmus, M.R.; Mercado-Silva, N.; Vander Zanden, M.J. Subsidies to predators, apparent competition and the phylogenetic structure of prey communities. Oecologia 2013, 173, 997–1007. [Google Scholar] [CrossRef]
- Song, H.; Lavoie, M.; Fan, X.; Tan, H.; Liu, G.; Xu, P.; Fu, Z.; Paerl, H.; Qian, H. Allelopathic interactions of linoleic acid and nitric oxide increase the competitive ability of Microcystis aeruginosa. ISME J. 2017, 11, 1865–1876. [Google Scholar] [CrossRef] [Green Version]
- Qian, H.; Xu, J.; Lu, T.; Zhang, Q.; Qu, Q.; Yang, Z.; Pan, X. Responses of unicellular alga Chlorella pyrenoidosa to allelochemical linoleic acid. Sci. Total Environ. 2018, 625, 1415–1422. [Google Scholar] [CrossRef]
- Yang, J.; Tang, H.; Zhang, X.; Zhu, X.; Huang, Y.; Yang, Z. High temperature and pH favor Microcystis aeruginosa to outcompete Scenedesmus obliquus. Environ. Sci. Pollut. Res. 2018, 25, 4794–4802. [Google Scholar] [CrossRef]
- Wei, Y.; Liu, J.; Dai, M.; Chen, X. Competition between Microcystis aeruginosa and Scenedesmus obliquus under different temperature and light regimes. J. Environ. Manag. 2021, 286, 111809. [Google Scholar]
- von Alvensleben, N.; Magnusson, M.; Heimann, K. Salinity tolerance of four freshwater microalgal species and the effects of salinity and nutrient limitation on biochemical profiles. J. Appl. Phycol. 2016, 28, 861–876. [Google Scholar] [CrossRef]
- Yamamoto, M.; Chiba, T.; Tuji, A. Salinity responses of benthic diatoms inhabiting tidal flats. Diatom Res. 2017, 32, 243–250. [Google Scholar] [CrossRef]
- Sun, Y.; Chen, Y.; Wei, J.; Zhang, X.; Zhang, L.; Yang, Z.; Huang, Y. Ultraviolet-B radiation stress alters the competitive outcome of algae: Based on analyzing population dynamics and photosynthesis. Chemosphere 2021, 272, 129645. [Google Scholar] [CrossRef]
- Zhang, M.; Kong, F.; Xing, P.; Tan, X. Effects of Interspecific Interactions between Microcystis aeruginosa and Chlorella pyrenoidosa on Their Growth and Physiology. Int. Rev. Hydrobiol. 2007, 92, 281–290. [Google Scholar] [CrossRef]
- Hernández-Zamora, M.; Santiago-Martínez, E.; Martínez-Jerónimo, F. Toxigenic Microcystis aeruginosa (Cyanobacteria) affects the population growth of two common green microalgae: Evidence of other allelopathic metabolites different to cyanotoxins. J. Phycol. 2021, 57, 1530–1541. [Google Scholar] [CrossRef]
- Zak, A.; Musiewicz, K.; Kosakowska, A. Allelopathic activity of the Baltic cyanobacteria against microalgae. Estuar. Coast. Shelf Sci. 2012, 112, 4–10. [Google Scholar] [CrossRef]
- Sychrová, E.; Štěpánková, T.; Nováková, K.; Bláha, L.; Giesy, J.P.; Hilscherová, K. Estrogenic activity in extracts and exudates of cyanobacteria and green algae. Environ. Int. 2012, 39, 134–140. [Google Scholar] [CrossRef]
- Li, B.; Yin, Y.; Kang, L.; Feng, L.; Liu, Y.; Du, Z.; Tian, Y.; Zhang, L. A review: Application of allelochemicals in water ecological restoration—Algal inhibition. Chemosphere 2021, 267, 128869. [Google Scholar] [CrossRef]
Figure 1.
Growth rates of M. aeruginosa (a) and S. obliquus (b) in monocultures at three salinities (0, 3, 6). The values were presented as mean ± standard error. Lowercase letters in italic style represented significant differences caused by different salinities).
Figure 1.
Growth rates of M. aeruginosa (a) and S. obliquus (b) in monocultures at three salinities (0, 3, 6). The values were presented as mean ± standard error. Lowercase letters in italic style represented significant differences caused by different salinities).

Figure 2.
The increase of cell density of M. aeruginosa (blue square) and S. obliquus (green circle) over the 17-day experiment in three different salinities (0, 3, 6).
Figure 2.
The increase of cell density of M. aeruginosa (blue square) and S. obliquus (green circle) over the 17-day experiment in three different salinities (0, 3, 6).

Figure 3.
Displacement rates for M. aeruginosa against S. obliquus with different initial algal compositions at different salinities ((a,d,g): 75% Ma/25% So at 0, 3, 6; (b,e,h): 50% Ma/50% So at 0, 3, 6; (c,f,i): 25% Ma/75% So at 0, 3, 6).
Figure 3.
Displacement rates for M. aeruginosa against S. obliquus with different initial algal compositions at different salinities ((a,d,g): 75% Ma/25% So at 0, 3, 6; (b,e,h): 50% Ma/50% So at 0, 3, 6; (c,f,i): 25% Ma/75% So at 0, 3, 6).

Figure 4.
Proportions of unicells and 2-, 4- and 8-celled colonies in S. obliquus populations of monocultures and cocultures with different initial algal compositions. The “rest” group represents 3-, 5-, 6-, and 7-celled colonies.
Figure 4.
Proportions of unicells and 2-, 4- and 8-celled colonies in S. obliquus populations of monocultures and cocultures with different initial algal compositions. The “rest” group represents 3-, 5-, 6-, and 7-celled colonies.

Figure 5.
The maximal efficiency of PSII photochemistry (Fv/Fm) of M. aeruginosa and S. obliquus in monocultures and cocultures with different initial algal compositions at three salinities (0: (a,d), 3: (b,e), 6: (c,f)) on different days.
Figure 5.
The maximal efficiency of PSII photochemistry (Fv/Fm) of M. aeruginosa and S. obliquus in monocultures and cocultures with different initial algal compositions at three salinities (0: (a,d), 3: (b,e), 6: (c,f)) on different days.


Table 1.
Gaussian distribution formulae of the algal cell density versus time of both M. aeruginosa and S. obliquus in cocultures, and the formulae of competitive displacement rate against time of S. obliquus by M. aeruginosa.
Table 1.
Gaussian distribution formulae of the algal cell density versus time of both M. aeruginosa and S. obliquus in cocultures, and the formulae of competitive displacement rate against time of S. obliquus by M. aeruginosa.
| Salinity | Algae | 25% So + 75% Ma | 50% So + 50% Ma | 75% So + 25% Ma |
|---|---|---|---|---|
| 0 | Ma | R2 = 0.6799 | R2 = 0.6004 | R2 = 0.5069 |
| So | R2 = 0.9180 | R2 = 0.9543 | R2 = 0.9140 | |
| Y(t) | R2 = 0.9398 | R2 = 0.8693 | R2 = 0.8013 | |
| 3 | Ma | R2 = 0.6753 | R2 = 0.5851 | R2 = 0.1538 |
| So | R2 = 0.9041 | R2 = 0.9003 | R2 = 0.9016 | |
| Y(t) | R2 = 0.8627 | R2 = 0.8746 | R2 = 0.8574 | |
| 6 | Ma | R2 = 0.6174 | R2 = 0.5690 | R2 = 0.4568 |
| So | R2 = 0.8361 | R2 = 0.9269 | R2 = 0.7749 | |
| Y(t) | R2 = 0.9349 | R2 = 0.8829 | R2 = 0.7747 |
Table 2.
Summary of two-way ANOVAs for the effects of salinity and initial algal composition on the maximal values of algal abundance (Nmax) and the time to Nmax (tmax) of M. aeruginosa and S. obliquus.
Table 2.
Summary of two-way ANOVAs for the effects of salinity and initial algal composition on the maximal values of algal abundance (Nmax) and the time to Nmax (tmax) of M. aeruginosa and S. obliquus.
| Algae | Factors | Nmax | tmax | ||||||||
|---|---|---|---|---|---|---|---|---|---|---|---|
| SS | DF | MS | F | p Value | SS | DF | MS | F | p Value | ||
| Microcystis | Salinity | 2.014 | 2 | 1.007 | 0.1493 | 0.8624 | 173.7 | 2 | 86.85 | 19.14 | <0.0001 |
| Composition | 5.766 | 2 | 2.883 | 0.4273 | 0.6587 | 2.169 | 2 | 1.085 | 0.2391 | 0.7898 | |
| Interaction | 2.319 | 4 | 0.5799 | 0.08594 | 0.9857 | 44.16 | 4 | 11.04 | 2.434 | 0.085 | |
| Scenedesmus | Salinity | 25.62 | 2 | 12.81 | 5.596 | 0.0129 | 47.52 | 2 | 23.76 | 10.43 | 0.001 |
| Composition | 9.455 | 2 | 4.727 | 2.065 | 0.1558 | 7.698 | 2 | 3.849 | 1.689 | 0.2126 | |
| Interaction | 2.877 | 4 | 0.7193 | 0.3142 | 0.8647 | 6.962 | 4 | 1.74 | 0.7640 | 0.5623 | |
Table 3.
Summary of three-way ANOVAs for the effects of salinity, proportion, and culture time on the maximal efficiency of PSII photochemistry (Fv/Fm) of M. aeruginosa and S. obliquus.
Table 3.
Summary of three-way ANOVAs for the effects of salinity, proportion, and culture time on the maximal efficiency of PSII photochemistry (Fv/Fm) of M. aeruginosa and S. obliquus.
| Algae | Source of Variation | SS | DF | MS | F | p Value |
|---|---|---|---|---|---|---|
| Microcystis | Time | 0.437 | 7 | 0.0625 | 47.108 | <0.001 |
| Salinity | 0.0153 | 2 | 0.00765 | 5.773 | 0.004 | |
| Proportion of Ma | 0.0531 | 3 | 0.0177 | 13.341 | <0.001 | |
| Time × Salinity | 0.185 | 14 | 0.0132 | 9.973 | <0.001 | |
| Time × Proportion of Ma | 0.0773 | 21 | 0.00368 | 2.778 | <0.001 | |
| Salinity × Proportion of Ma | 0.0242 | 6 | 0.00403 | 3.043 | 0.007 | |
| Time × Salinity × Proportion of Ma | 0.0847 | 42 | 0.00202 | 1.522 | 0.031 | |
| Scenedesmus | Time | 0.152 | 7 | 0.0217 | 62.987 | <0.001 |
| Salinity | 0.00898 | 2 | 0.00449 | 13.009 | <0.001 | |
| Proportion of So | 0.00543 | 3 | 0.00181 | 5.243 | 0.002 | |
| Time × Salinity | 0.0285 | 14 | 0.00203 | 5.889 | <0.001 | |
| Time × Proportion of So | 0.0233 | 21 | 0.00111 | 3.216 | <0.001 | |
| Salinity × Proportion of So | 0.0115 | 6 | 0.00191 | 5.539 | <0.001 | |
| Time × Salinity × Proportion of So | 0.0421 | 42 | 0.001 | 2.906 | <0.001 |
Disclaimer/Publisher’s Note: The statements, opinions and data contained in all publications are solely those of the individual author(s) and contributor(s) and not of MDPI and/or the editor(s). MDPI and/or the editor(s) disclaim responsibility for any injury to people or property resulting from any ideas, methods, instructions or products referred to in the content. |
© 2023 by the authors. Licensee MDPI, Basel, Switzerland. This article is an open access article distributed under the terms and conditions of the Creative Commons Attribution (CC BY) license (https://creativecommons.org/licenses/by/4.0/).
Share and Cite
MDPI and ACS Style
Gao, T.; Li, Y.; Xue, W.; Pan, Y.; Zhu, X. Freshwater Salinization Impacts the Interspecific Competition between Microcystis and Scenedesmus. Water 2023, 15, 1331. https://doi.org/10.3390/w15071331
AMA Style
Gao T, Li Y, Xue W, Pan Y, Zhu X. Freshwater Salinization Impacts the Interspecific Competition between Microcystis and Scenedesmus. Water. 2023; 15(7):1331. https://doi.org/10.3390/w15071331
Chicago/Turabian StyleGao, Tianheng, Yinkang Li, Wenlei Xue, Yueqiang Pan, and Xuexia Zhu. 2023. "Freshwater Salinization Impacts the Interspecific Competition between Microcystis and Scenedesmus" Water 15, no. 7: 1331. https://doi.org/10.3390/w15071331
Note that from the first issue of 2016, this journal uses article numbers instead of page numbers. See further details here.