Article

Risk Assessment of Dissolved Trace Elements and Heavy Metals in the Upper Reaches of the Yangtze River, China

1
Hubei Key Laboratory of Three Gorges Project for Conservation of Fishes, Yichang 443100, China
2
Chinese Sturgeon Research Institute, China Three Gorges Corporation, Yichang 443100, China
3
Engineering Research Center for Protection and Utilization of Special Biological Resources in the Hanjiang River Basin, College of Life Sciences, Jianghan University, Wuhan 430056, China
4
Yangtze River Fisheries Research Institute, Chinese Academy of Fishery Sciences, Wuhan 430056, China
*
Authors to whom correspondence should be addressed.
Water 2023, 15(7), 1330; https://doi.org/10.3390/w15071330
Submission received: 1 March 2023 / Revised: 22 March 2023 / Accepted: 23 March 2023 / Published: 28 March 2023
(This article belongs to the Special Issue Environment and Ecosystems Research for Natural Waters)

Abstract

:
The Yangtze River Basin, one of China’s five major watersheds and a primary source of drinking water for the country, is experiencing serious environmental pollution as heavy metals are discharged into its rivers. To evaluate the water quality of the river, determined water quality parameters were compared with the maximum permissible limit values recommended by the World Health Organization and Chinese drinking water standards. Physical and chemical analyses were conducted on water samples taken from 19 locations along the river’s path. The study quantified the contents of sodium (Na), magnesium (Mg), calcium (Ca), strontium (Sr), barium (Ba), lithium (Li), cobalt (Co), copper (Cu), iron (Fe), manganese (Mn), scandium (Sc) and mercury (Hg). The results show that the average values of Mg, Sr, Co, Cu, Fe, Mn and Sc are higher than the historical background values. Moreover, through a correlation analysis it was concluded that these nutrients and trace metals have high values due to anthropogenic pollution in the study area. The computed WQI values range between 9.59 and 20.26, indicating excellent water quality in the river basin. Finally, hazard quotient (HQ) values show that exposure to the detected pollutants will have no adverse effects on human health and does not pose a potential non-carcinogenic risk.

1. Introduction

Heavy metals in the environment pose a serious threat to wildlife and human health because they are bioavailable and can be absorbed and enriched through the food web [1]. The circulation of heavy metals in the environment has been extensively studied, primarily in the atmosphere [2]. Heavy metals in the environment can come from fly ash generated by the combustion of solid fuels [3], dried granular sludge, and digested materials from agricultural biogas plants [4]. However, rivers can serve as a primary pathway for transporting these heavy metals or other pollutants to the ocean [5]. According to previous studies, rivers export 54–61 micrograms of arsenic and 0.3–5.5 micrograms of arsenic to global oceans annually [5,6]. Changes in river hydrology on a regional scale due to man-made or natural environmental changes can affect metal transport and related biogeochemical processes in land and marine environments. This impact has been shown to be significant on both regional and global scales and has global significance [7].
The quality of water resources is crucial to the stability of the ecological environment and to the healthy development of cities, especially in China. It is estimated that more than 200 million people in China still use polluted water sources [8]. The main reason for this is the low utilization rate of water resources per capita, resulting in a shortage of water resources. In such cases, residents are forced to use unsafe water sources [9]. In fact, it has been reported that there are over 700 chemical pollutants in water [10]. Among these pollutants, trace metals are one of the most dangerous due to their high toxicity and carcinogenicity [11].
As a result of a large number of investigations, researchers have concluded that the water quality in North China is significantly worse than that in South China, especially with regard to the water quality of water sources and the content of trace metals. The Liaohe River and the Huaihe River, especially the Haihe River, are seriously polluted [12]. Among trace metals, arsenic (As) is the main pollutant [13]. Approximately 1.85 million people drink water with an As content exceeding 50 μg/L. Various human activities such as mining, aquaculture and dam building can discharge trace metals into rivers, lakes and reservoirs, thus polluting the water body and affecting the water quality of nearby and downstream areas [14]. As a result of its high toxicity, a simple comparison between the concentration of trace metals in water and the guiding value is not sensitive enough to evaluate their negative impact on humans. Even if the concentration in water reaches the national standard, trace metals still pose significant health risks [13]. Health risk assessments typically employ methods recommended by the U.S. Environmental Protection Agency. In fact, there is uncertainty in the process of health risk assessments. Monte Carlo simulations can accurately evaluate health risks [15].
The Yangtze River Basin, one of China’s five major watersheds and a primary source of drinking water for the country, is experiencing serious environmental pollution as heavy metals are discharged into its rivers. Despite a large number of investigations into water quality (such as As, CD, Cu, Zn, Pb, Zn, etc.), previous studies have been limited to conventional monitoring in a single tributary, river reach or watershed [14]. There has been a comprehensive survey of volatile organic compound pollution in major river basins [16], but there is a lack of analysis of trace metal pollution.
In view of the above reasons, it is important to investigate the distribution of heavy metals, the degree of pollution and the potential ecological risk in this area. The main objectives of this study were (1) to monitor the hydrogeological characteristics of 19 sample points in the upper reaches of the Yangtze River, (2) to evaluate the physicochemical characteristics of water sources in the basin, (3) to use the WQI to evaluate river water quality and discuss the impact of each water quality parameter on the WQI value and finally (4) to calculate the HQ to evaluate the impact of pollutant exposure on human health. The research results will help reveal the presence of trace metals in China’s primary drinking water sources and aid in maintaining public health in the Yangtze River Basin.

2. Materials and Methods
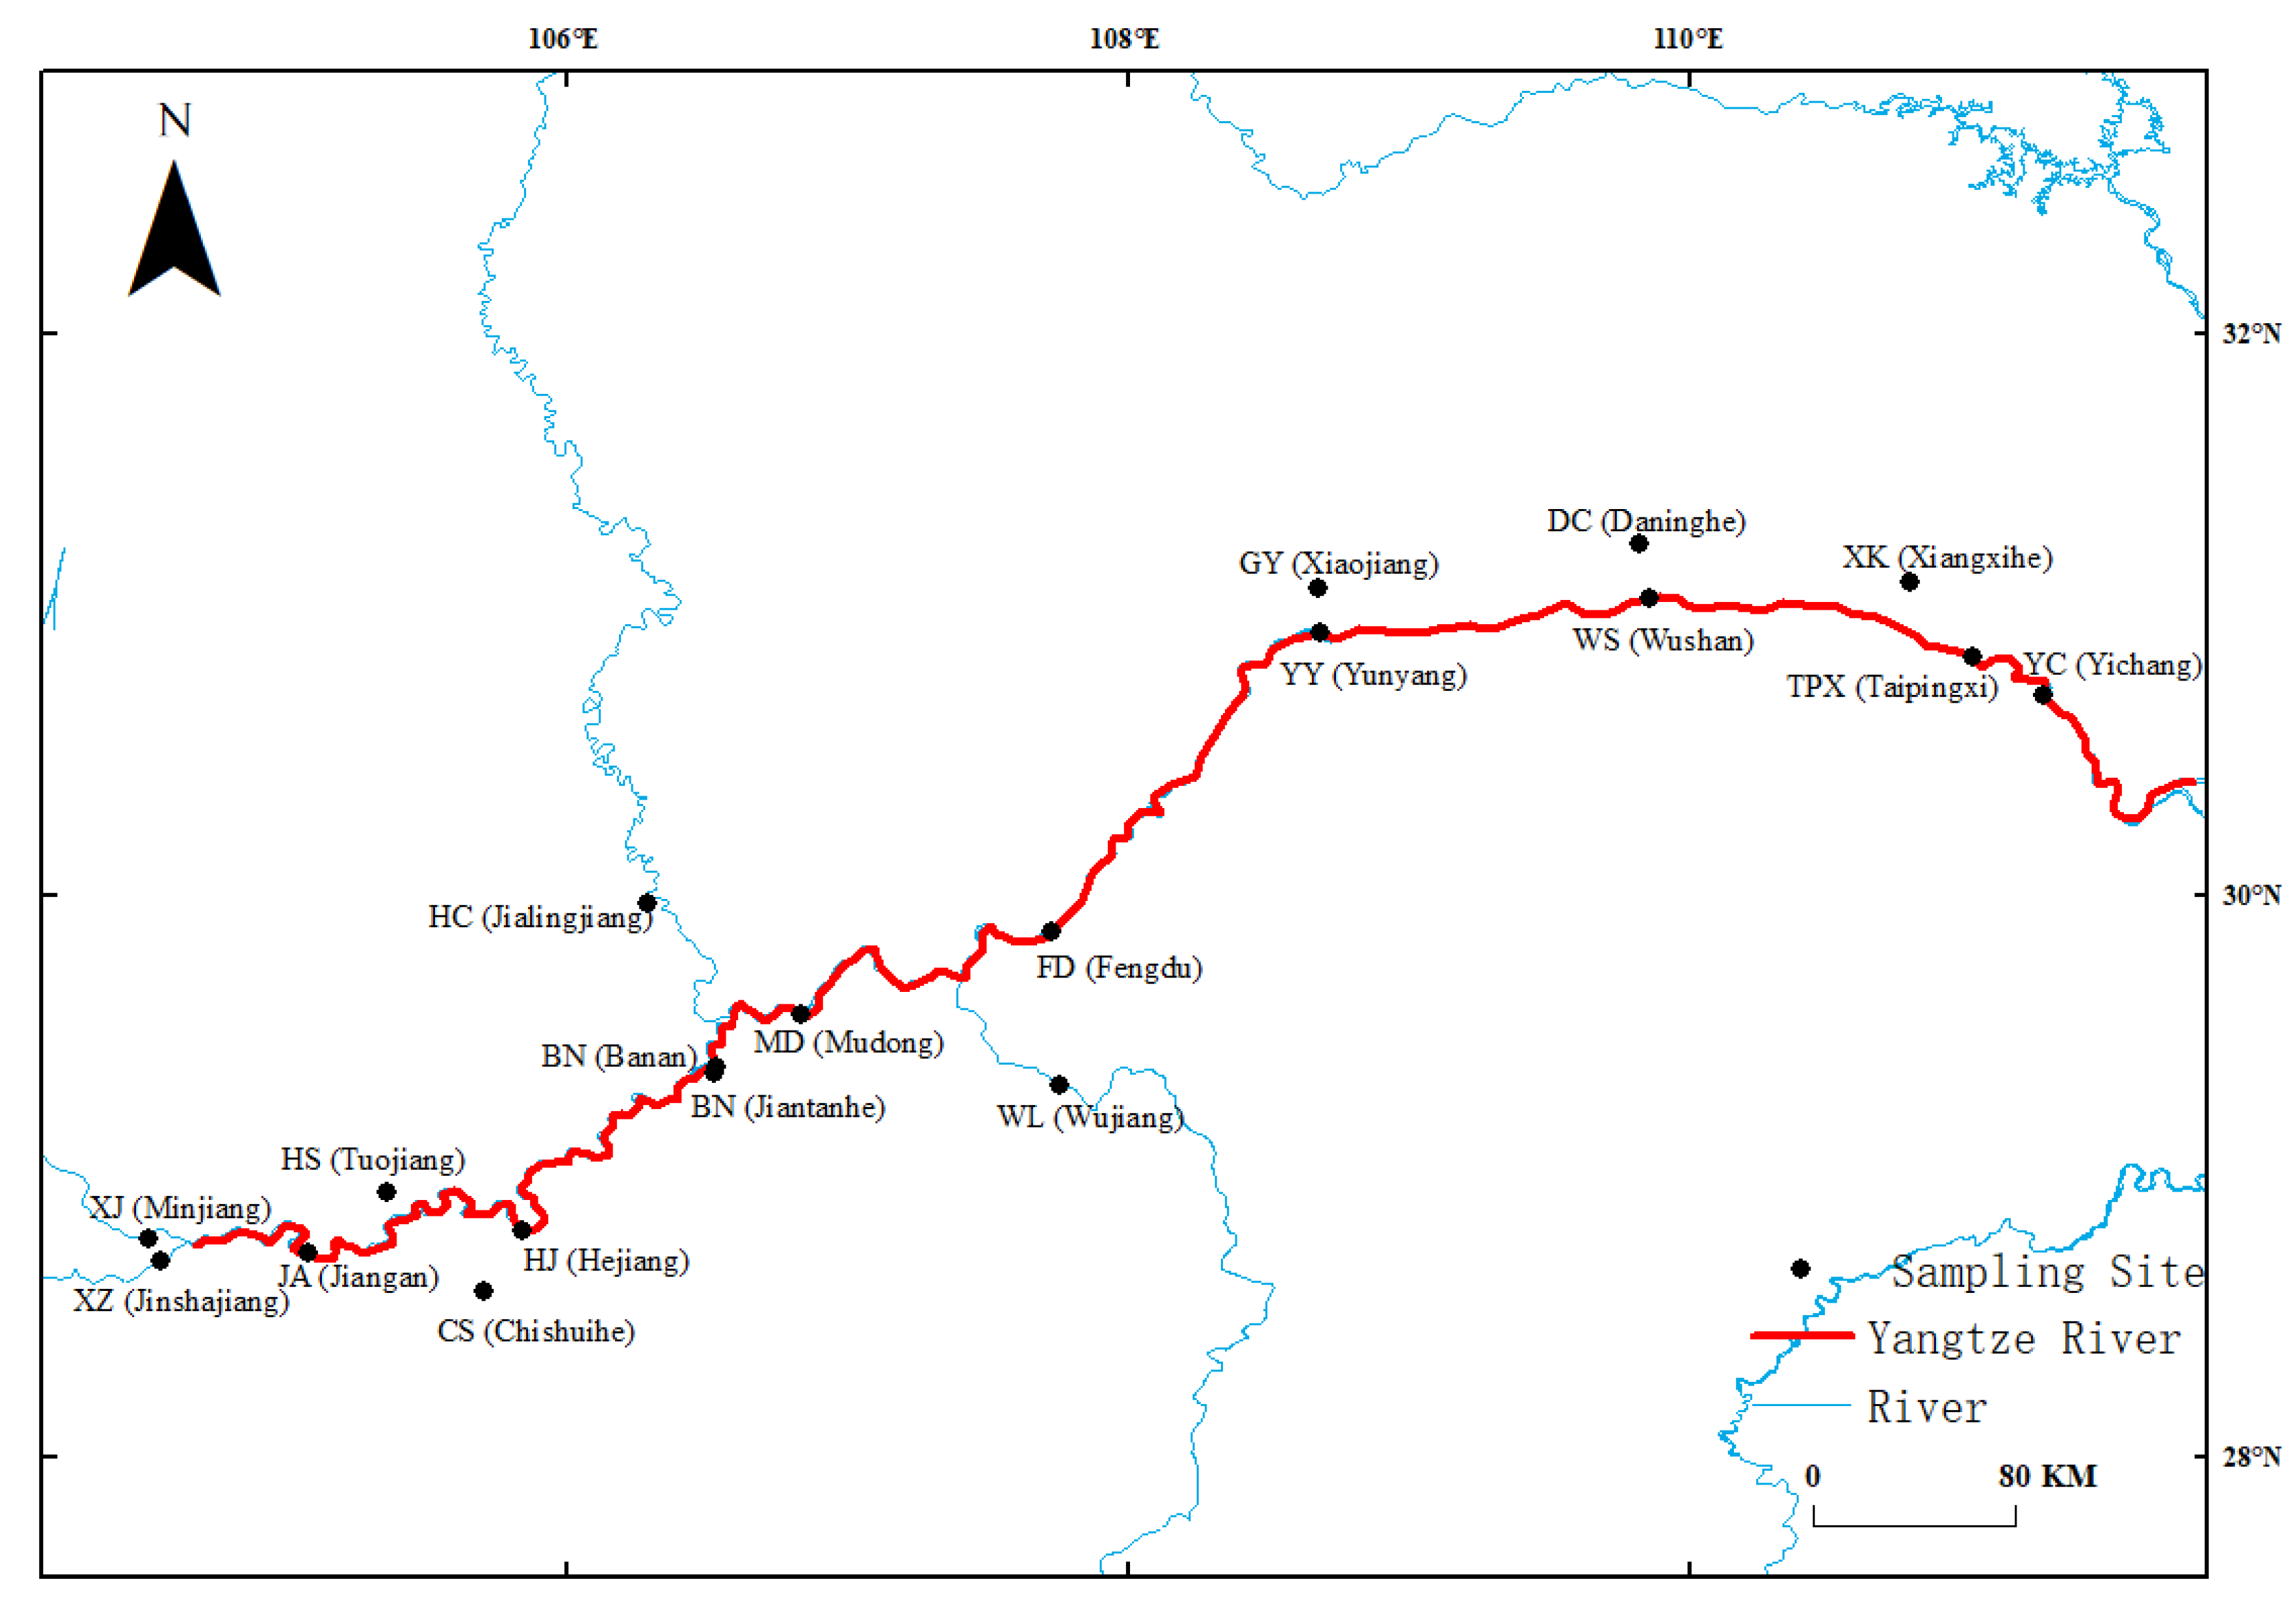
2.1. Study Area

The Yangtze River, the third longest river in the world (6400 km), originates in the Qinghai Tibet Plateau and flows through densely populated eastern China. In the past few decades, the Yangtze River Basin has become one of the most developed industrial zones in the world. However, human activities (such as agriculture, animal husbandry and mining) have aggravated heavy metal pollution and serious soil erosion in the basin [17] (Figure 1).

2.2. Sample Collection

In order to understand the content and distribution of heavy metals in the Yangtze River, samples were collected from different locations of the main stream and major tributaries along the river (Figure 1) using techniques described in previous studies [18]. Samples were taken at nine points (JA (Jiangan), HJ (Hejiang), BN (Banan), MD (Mudong), FD (Fengdu), YY (Yunyang), WS (Wushan), TPX (Taipingxi) and YC (Yichang)) in the main stream of the Yangtze River and ten points (XZ (Jinshajiang), XJ (Minjiang), HS (Tuojiang), CS (Chishuihe), BN (Jiantanhe), HC (Jialingjiang), WL (Wujiang), GY (Xiaojiang), DC (Daninghe) and XK (Xiangxihe)) in the tributaries. The samples were collected in April 2021. Before sampling, all bottles in the laboratory were soaked in 10% nitric acid (volume/volume) solution for at least 24 h and then rinsed with milli-Q water (18.2 MΩ cm). Other cleaning steps followed the methods established by the U.S. Environmental Protection Agency.
According to the literature published on other rivers [18], river water was collected from about 1 m below the water surface using pre-cleaned amber glass bottles and peristaltic pumps [18,19]. Sampling was avoided on days with precipitation [19]. The sample sites were selected in the mainstream and nearby tributaries which have no known impact from nearby point sources, such as wastewater discharge [20]. The impact of tides on estuarine sampling points was limited. At each site, three or four water samples were collected (1000 mL bottles), depending on the particle concentration in the water column. The water temperature (T, °C) and pH were determined in situ using portable electronic instruments.
In order to understand the content and distribution of heavy metals in the Yangtze River, all water samples were filtered from 300 to 1000 mL of river bulk water through cellulose nitrate membrane (Whatman, product code: 10401170) with pore size of 0.45 µm. The filtered water samples were preserved by adding 4 mL/L 11.6 M trace-metal-grade hydrochloric acid (HCl, equivalent to 0.4% of the sample volume) and stored in cool and dark conditions. The samples were transported to our laboratory in Wuhan within 24 h. The filtered water and particle samples were stored at 4 °C or frozen until analysis.

2.3. Analytical Methods

Water samples were determined by inductively coupled plasma atomic emission spectrometry (ICP-AES) (iris intrepid II XSP duo of the United States), and the analysis accuracy was better than 10%. The specific analysis method draws on previous articles [21,22]. Method validation and quality control samples were performed using standard reference materials (SRM, SPEX, certifiprep, Inc., Metuchen, NJ, USA). The elements analyzed included sodium (Na), magnesium (Mg), calcium (Ca), strontium (Sr), barium (Ba), lithium (Li), cobalt (Co), copper (Cu), iron (Fe), manganese (Mn), scandium (Sc) and mercury (Hg). Spectral pure oxide or metal elements w > 99.97% were used to prepare a mass concentration of 500 μg/mL and 1000 μg/mL of standard stock solution. According to the properties of each standard material and the content of the elements to be measured, the standard stock solution was gradually diluted. The mass concentration of each element is shown in Table 1. The standard solution medium was 2% nitric acid (STD1).
To determine the element detection limit, a sample blank solution was continuously measured 11 times and the standard deviation was calculated. Three times the standard deviation value is used as the detection limit. Eight samples were weighed in parallel, the solution was prepared and the content of the elements was measured in the sample solution and the spiked sample solution six times. The average value was taken and the recovery rate after spiking was calculated. The wavelength, detection limit, % recovery and %RSD are shown in Table 2.

2.4. Water Quality Index

The water quality index (WQI) is a ratio that reflects the comprehensive impact of different water quality variables and is considered to be a powerful tool that can comprehensively reflect the water quality of rivers [13].
The calculation is as follows:
WQI   = [ Wi × ( Ci / Si ) ] × 100
where Wi = wi/∑wi, in which wi is the weight attributed to the target element according to the relative perceived effect of the target element on human health and the importance of ingestion [23]. In this study, Σwi is 29 (Table S1), Ci represents the concentration of each trace element in each water sample and Si represents the Chinese drinking water guidelines for each trace element. Then, the calculated WQI value is divided into five categories: excellent water (WQI < 50), good water (WQI = 50–100), poor water (WQI = 100–200), extremely poor water (WQI = 200–300) and unsuitable water (WQI > 300).

2.5. Health Risk Assessment

At present, different studies use different health risk assessment methods and mathematical models, but they share the same principles [24]. In this study, the health risk assessment method recommended by the US Environmental Protection Agency was used. Direct human ingestion and skin contact (shower/bath and swimming) are generally considered the main routes of exposure [13]. Therefore, the average daily dose (ADD) for direct ingestion (ADDingestion) and skin absorption (ADDdermal) were calculated using the revised formula recommended by the US Environmental Protection Agency:
ADD ingestion = ( C w × IR × EF × ED ) / ( BW × AT )
ADD dermal   = ( C w × SA × K p × ET × EF × ED × 10 3 ) / ( BW × AT )
where ADDingestion and ADDdermal represent the average daily dose (μg/kg/day) through ingestion and skin absorption, respctively; BW is the average weight (kg); AT is the average exposure time (days); Cw is the average concentration of heavy metals in the water (μg/L); IR is the intake rate (L/day); EF is the exposure frequency (days/year); ED is the exposure duration (years); SA is the exposed skin area (cm2); ET is the exposure time (h/day); and Kp is the permeability coefficient of the skin in water (cm/h). All exposure parameters were taken from Wang et al. [25] and the U.S. Environmental Protection Agency. The parameter values are listed in Table S2.
In this study, the hazard quotient (HQ) was used to evaluate the possible non carcinogenic risk associated with trace metal intake (i.e., oral intake). The hazard index (HI), which represents potential non carcinogenic risk caused by all heavy metals, was calculated as follows:
HQ   = ADD / RfD
RfD dermal   =   RfD × ABS g  
HI   = ( HQ ing   +   HQ derm )
where RfD is the oral toxicity reference dose of a specific metal. The RfDingestion and RfDdermal values are listed in Table S2. When HQ or HI > 1, it may have adverse effects on health; however, HQ or HI < 1 indicates no adverse effects on human health.

2.6. Statistical Analysis

SPSS 22 (IBM Corp., Armonk, NY, USA) and Origin 2017 (Originlab Corp., Northampton, MA, USA) were used for basic statistical analyses, such as normality and equal variance tests of data. The results were considered significant at p < 0.01 ** and < 0.05 *.

3. Results and Discussion

Generally speaking, the regional geology of the river and the surrounding human activities can affect its hydrology and water quality [26]. In turn, hydrochemical indicators such as hydrology and water quality can reflect the changes in the basin and serve as good indicators for whether the land surrounding the river can be used. Therefore, different water types and water quality are defined in long runoff rivers. Some studies have pointed out that diffuse pollution is the main factor leading to the deterioration of river water quality [27]. In this study, to determine the water quality of the Yangtze River, samples were collected from 19 different locations along the main stream and major tributaries. The results of physical and chemical analyses of river water are shown in Table 3, with a basic statistical summary attached.

3.1. Physical and Chemical Properties and Distribution of Water Samples

The pH value of water indicates its acidity or alkalinity, which is an important parameter for drinking and irrigation water. It has a profound impact on water quality, affecting the solubility of metals and the alkalinity and hardness of water [30]. The pH value of the upper Yangtze River ranges from 7.83 to 9.24, which shows that water samples are alkaline. Generally, high pH values are determined in places which come into contact with carbonate rock. In addition, the samples collected in the dry period have higher pH values than those collected during wet periods [23]. We sampled in April, which is part of the dry season for the Yangtze River, so the pH values were high. During our sampling period, the water temperature changed in the range of 14.70–21.00 °C. The lowest temperature value was measured at WL (Wujiang) and the highest temperature value was measured at WS (Tuojiang). The conductivity (EC) of water is directly related to the concentration of its dissolved solids. In addition, pollutants can lead to high EC values in surface water. The EC value ranged from 349.40 to 671.00 μS/cm with the maximum value also found in WS (Tuojiang). A high EC value indicates a high concentration of ions and/or dissolved solids in groundwater. This also indicates local changes in aquifer systems and soil type [31]. Generally speaking, the pH value, temperature and EC value of water samples vary widely. The main reason may be the large altitude difference, because our sampling range is relatively wide and basically covers the whole upper reaches of the Yangtze River.
Dissolved oxygen (DO) determines the biological changes among aerobic or anaerobic organisms; thus, measuring the DO is very important for maintaining the aerobic treatment processes aimed at purifying domestic and industrial wastewater. The optimal value for good water quality is between 4 and 6 mg/L, which ensures healthy aquatic organisms within a body of water [23]. The dissolved oxygen (DO) values of our water samples measured on site ranged from 5.07 to 13.67 mg/L. The highest dissolved oxygen value was measured in GY (Xiaojiang). The turbidity ranged from 0.34 to 4.12 NTU, with an average of 1.64 NTU; 100% of the water samples did not exceed the recommended value of 5 NTU.
Hardness refers to the total concentration of calcium and magnesium dissolved in water. Water can be classified as soft, hard, medium hard or very hard based on its hardness. The total hardness (TH) of the Yangtze River samples analyzed ranged from 149.89 mg/L to 249.55 mg/L. The average value was 181.65 mg/L (Table S3). The classification of groundwater quality in the study area according to hardness content (Table 4) showed that 94.74% samples were hard. Ca2+ and Mg2+ are the main cations in river water. The dissolution of carbonate minerals (such as calcite, dolomite and aragonite) and carbonate cements in the formation can produce Ca. The main sources of magnesium in natural water are ferromagnetic minerals (olivine, diopside, biotite and amphibole) in igneous and metamorphic rocks and magnesium carbonate (dolomite) in sedimentary rocks [32]. The main source of magnesium in groundwater is magnesium-containing minerals in the study area, such as dolomite and magnesium sulfate minerals. Domestic hard water is undesirable because it causes metal corrosion due to scale deposition in pipes, boilers and storage tanks. It may also reduce people’s perception of water quality and may pose a threat to human health, leading to diseases such as urolithiasis, anencephalia, prenatal mortality, some types of cancer and cardiovascular disease [33].

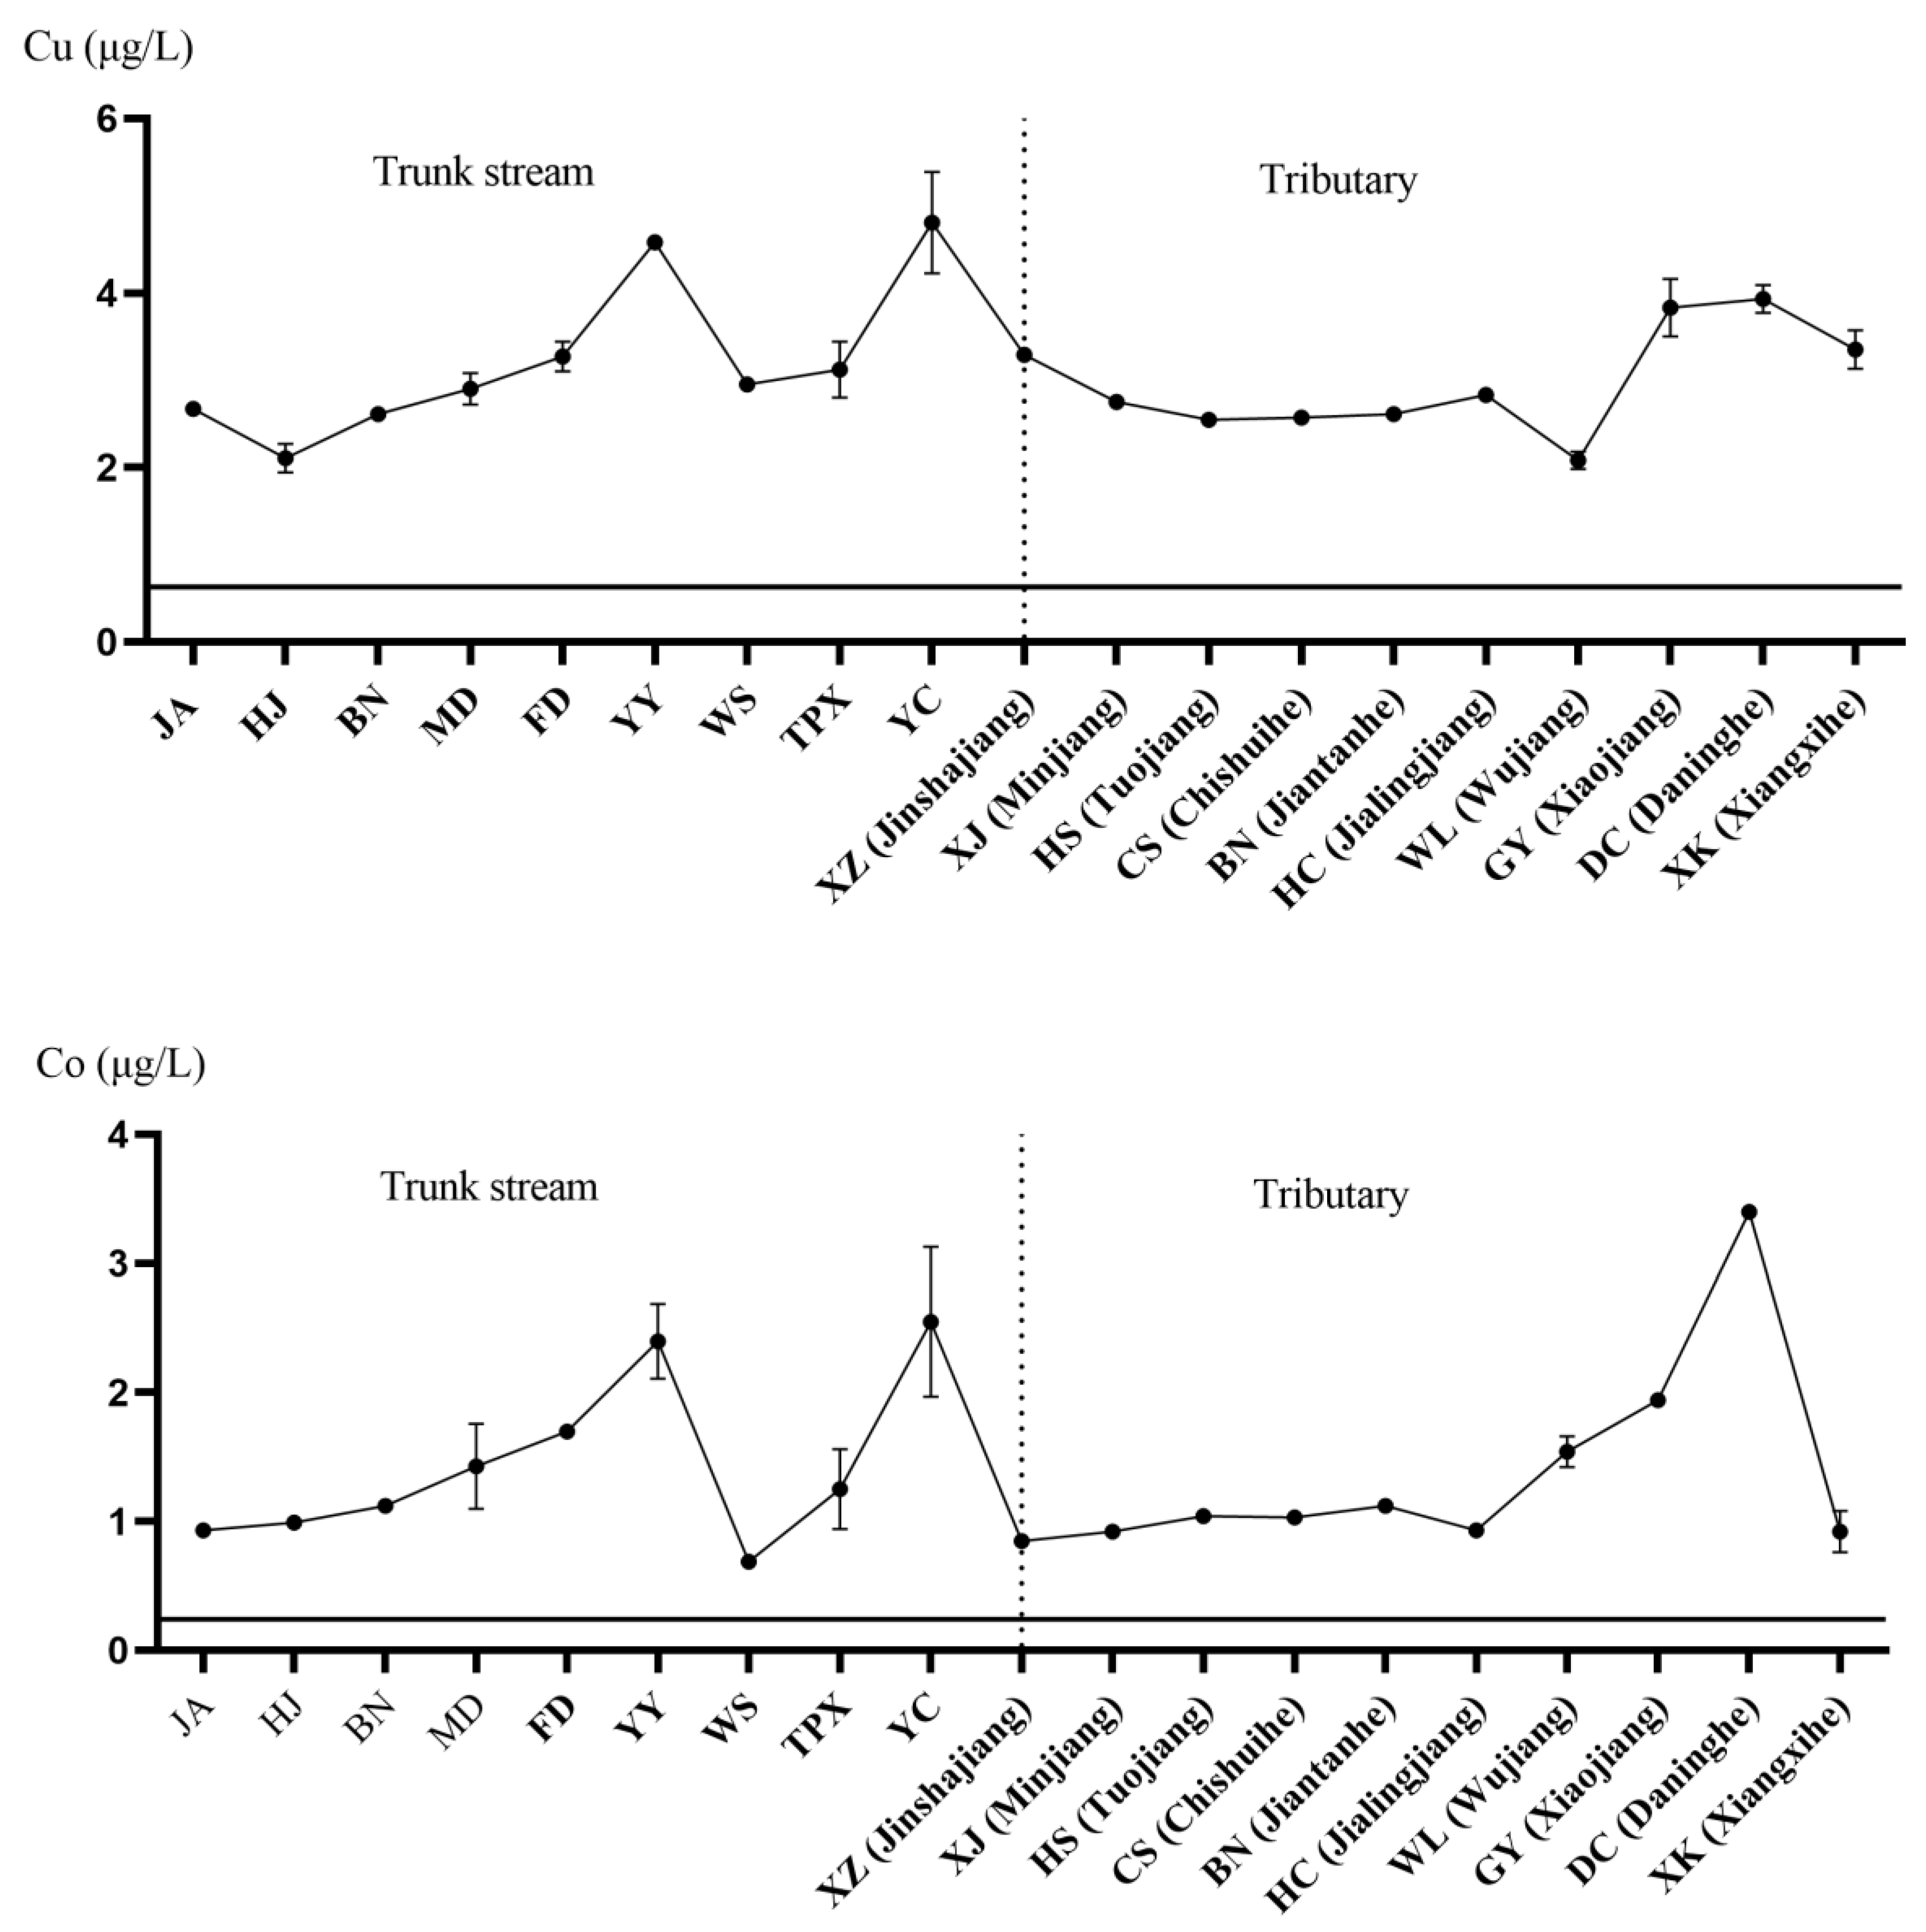
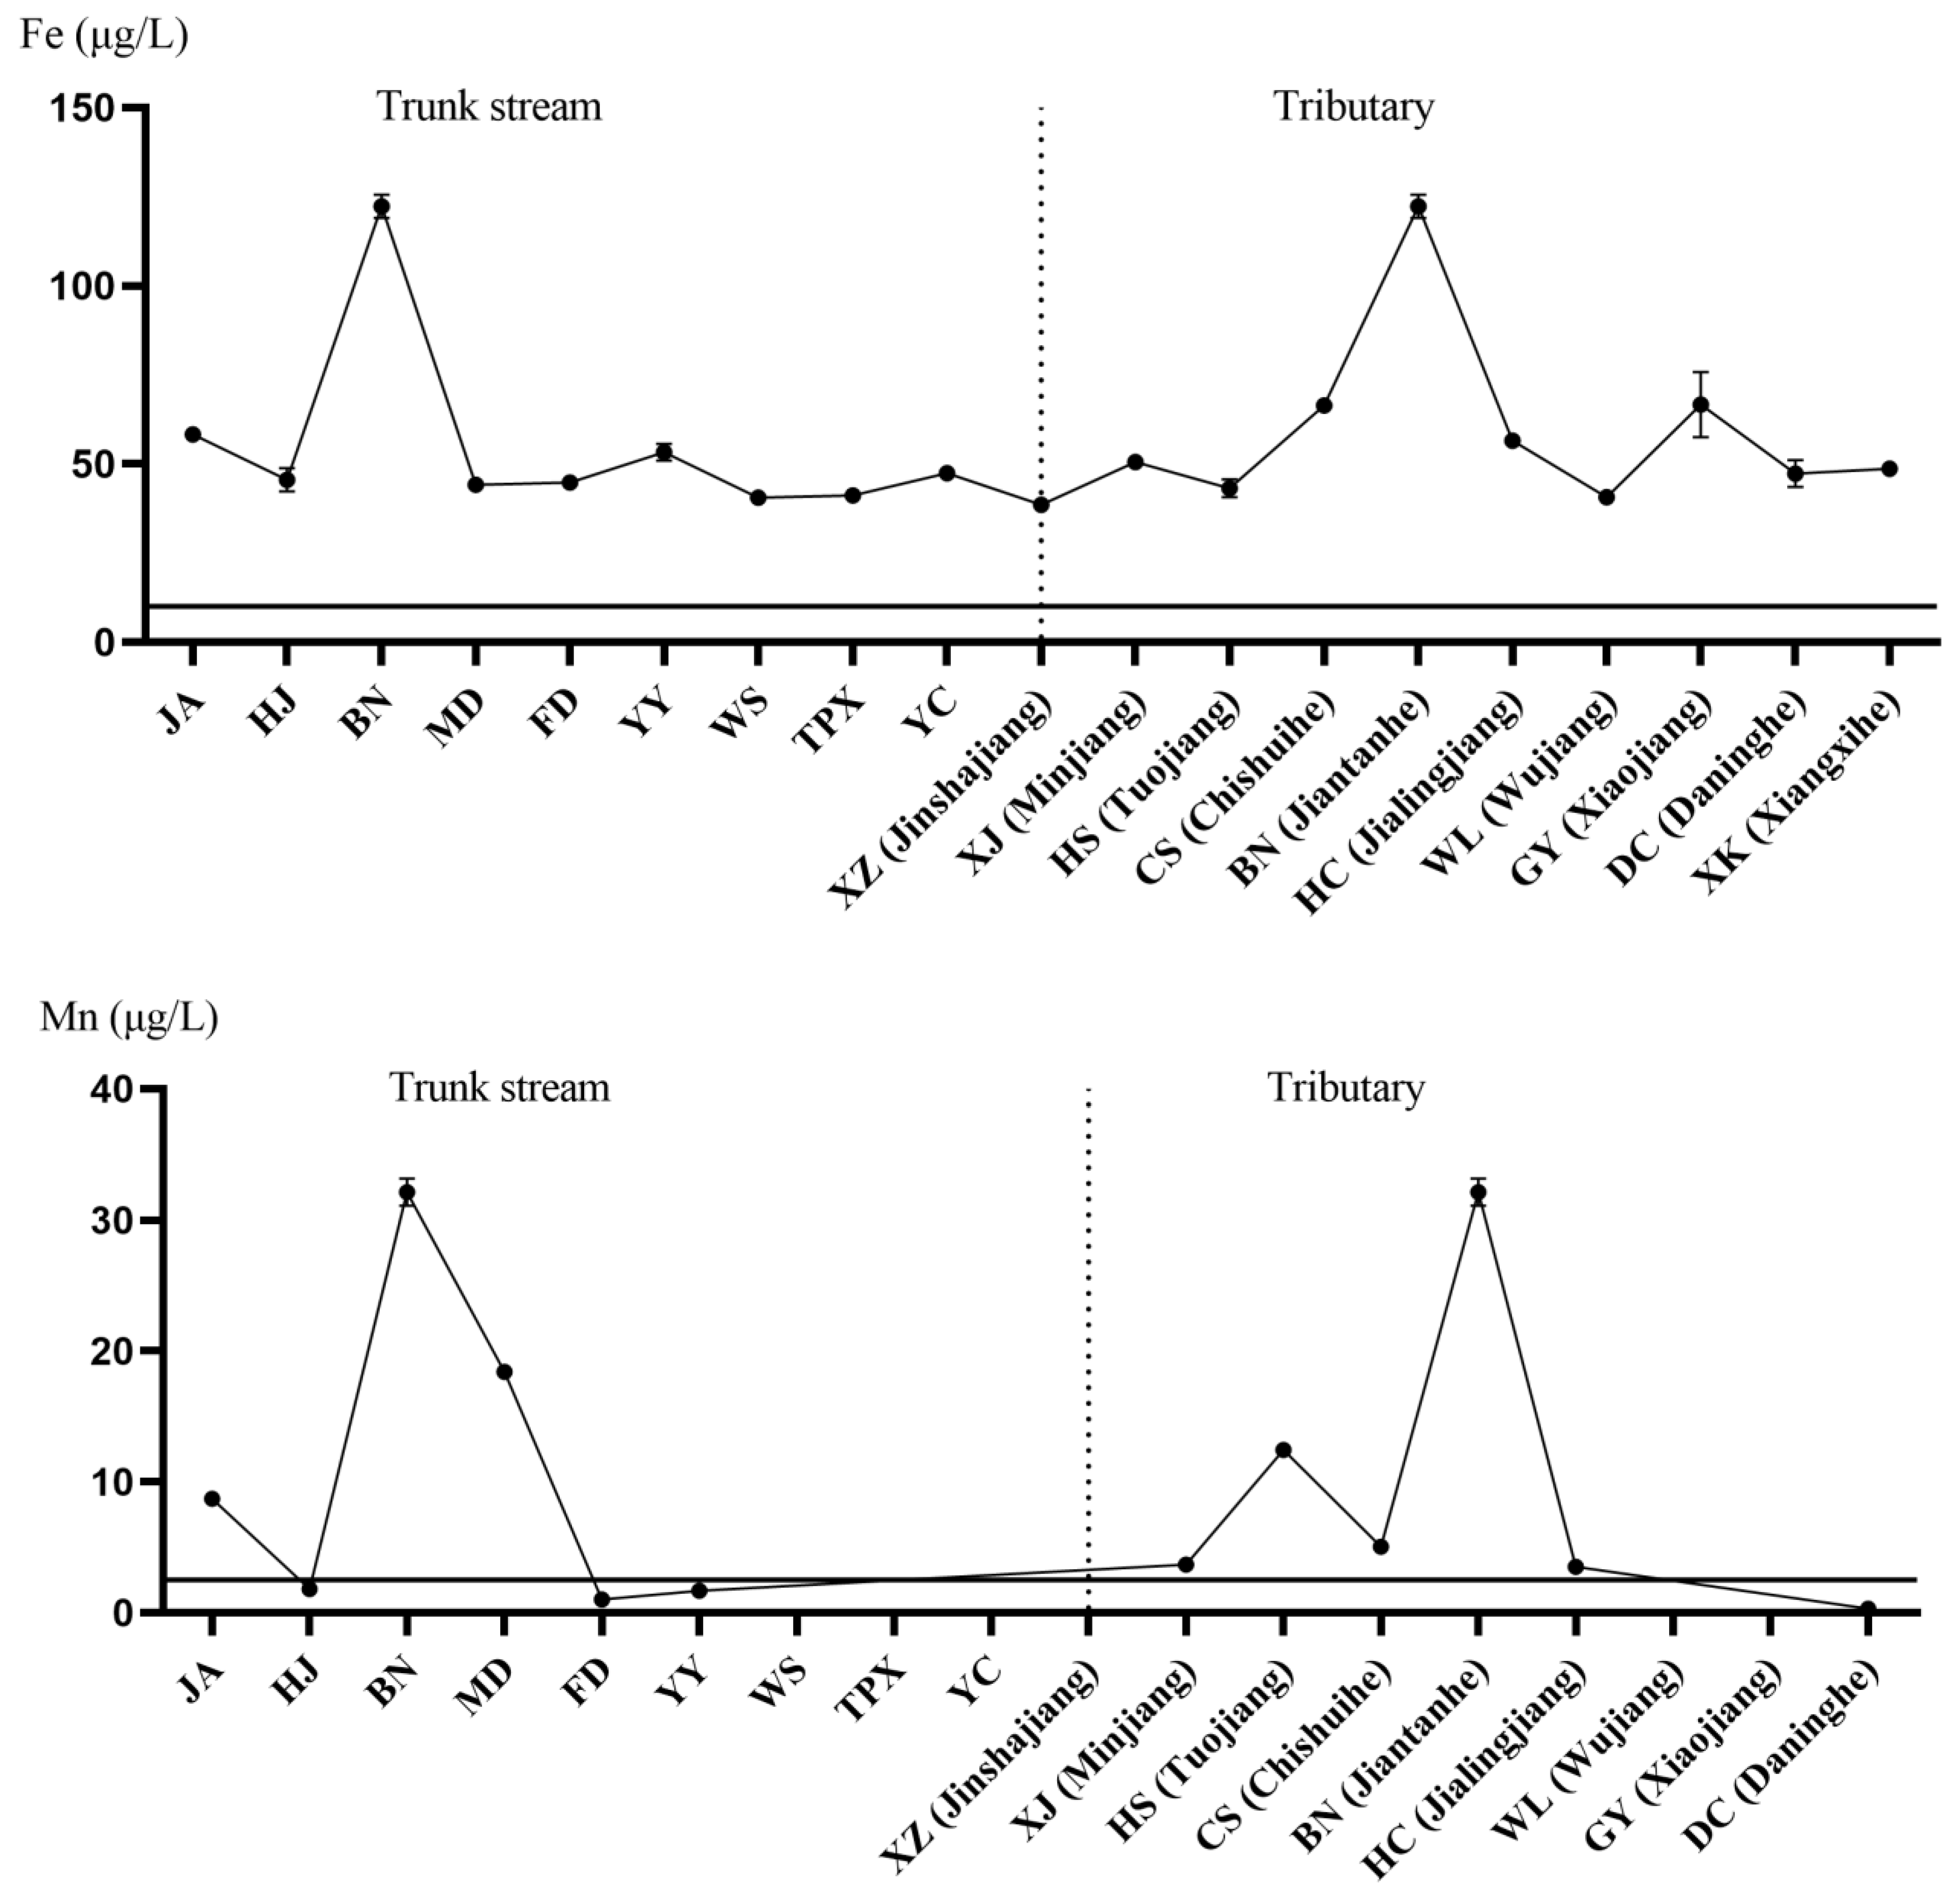
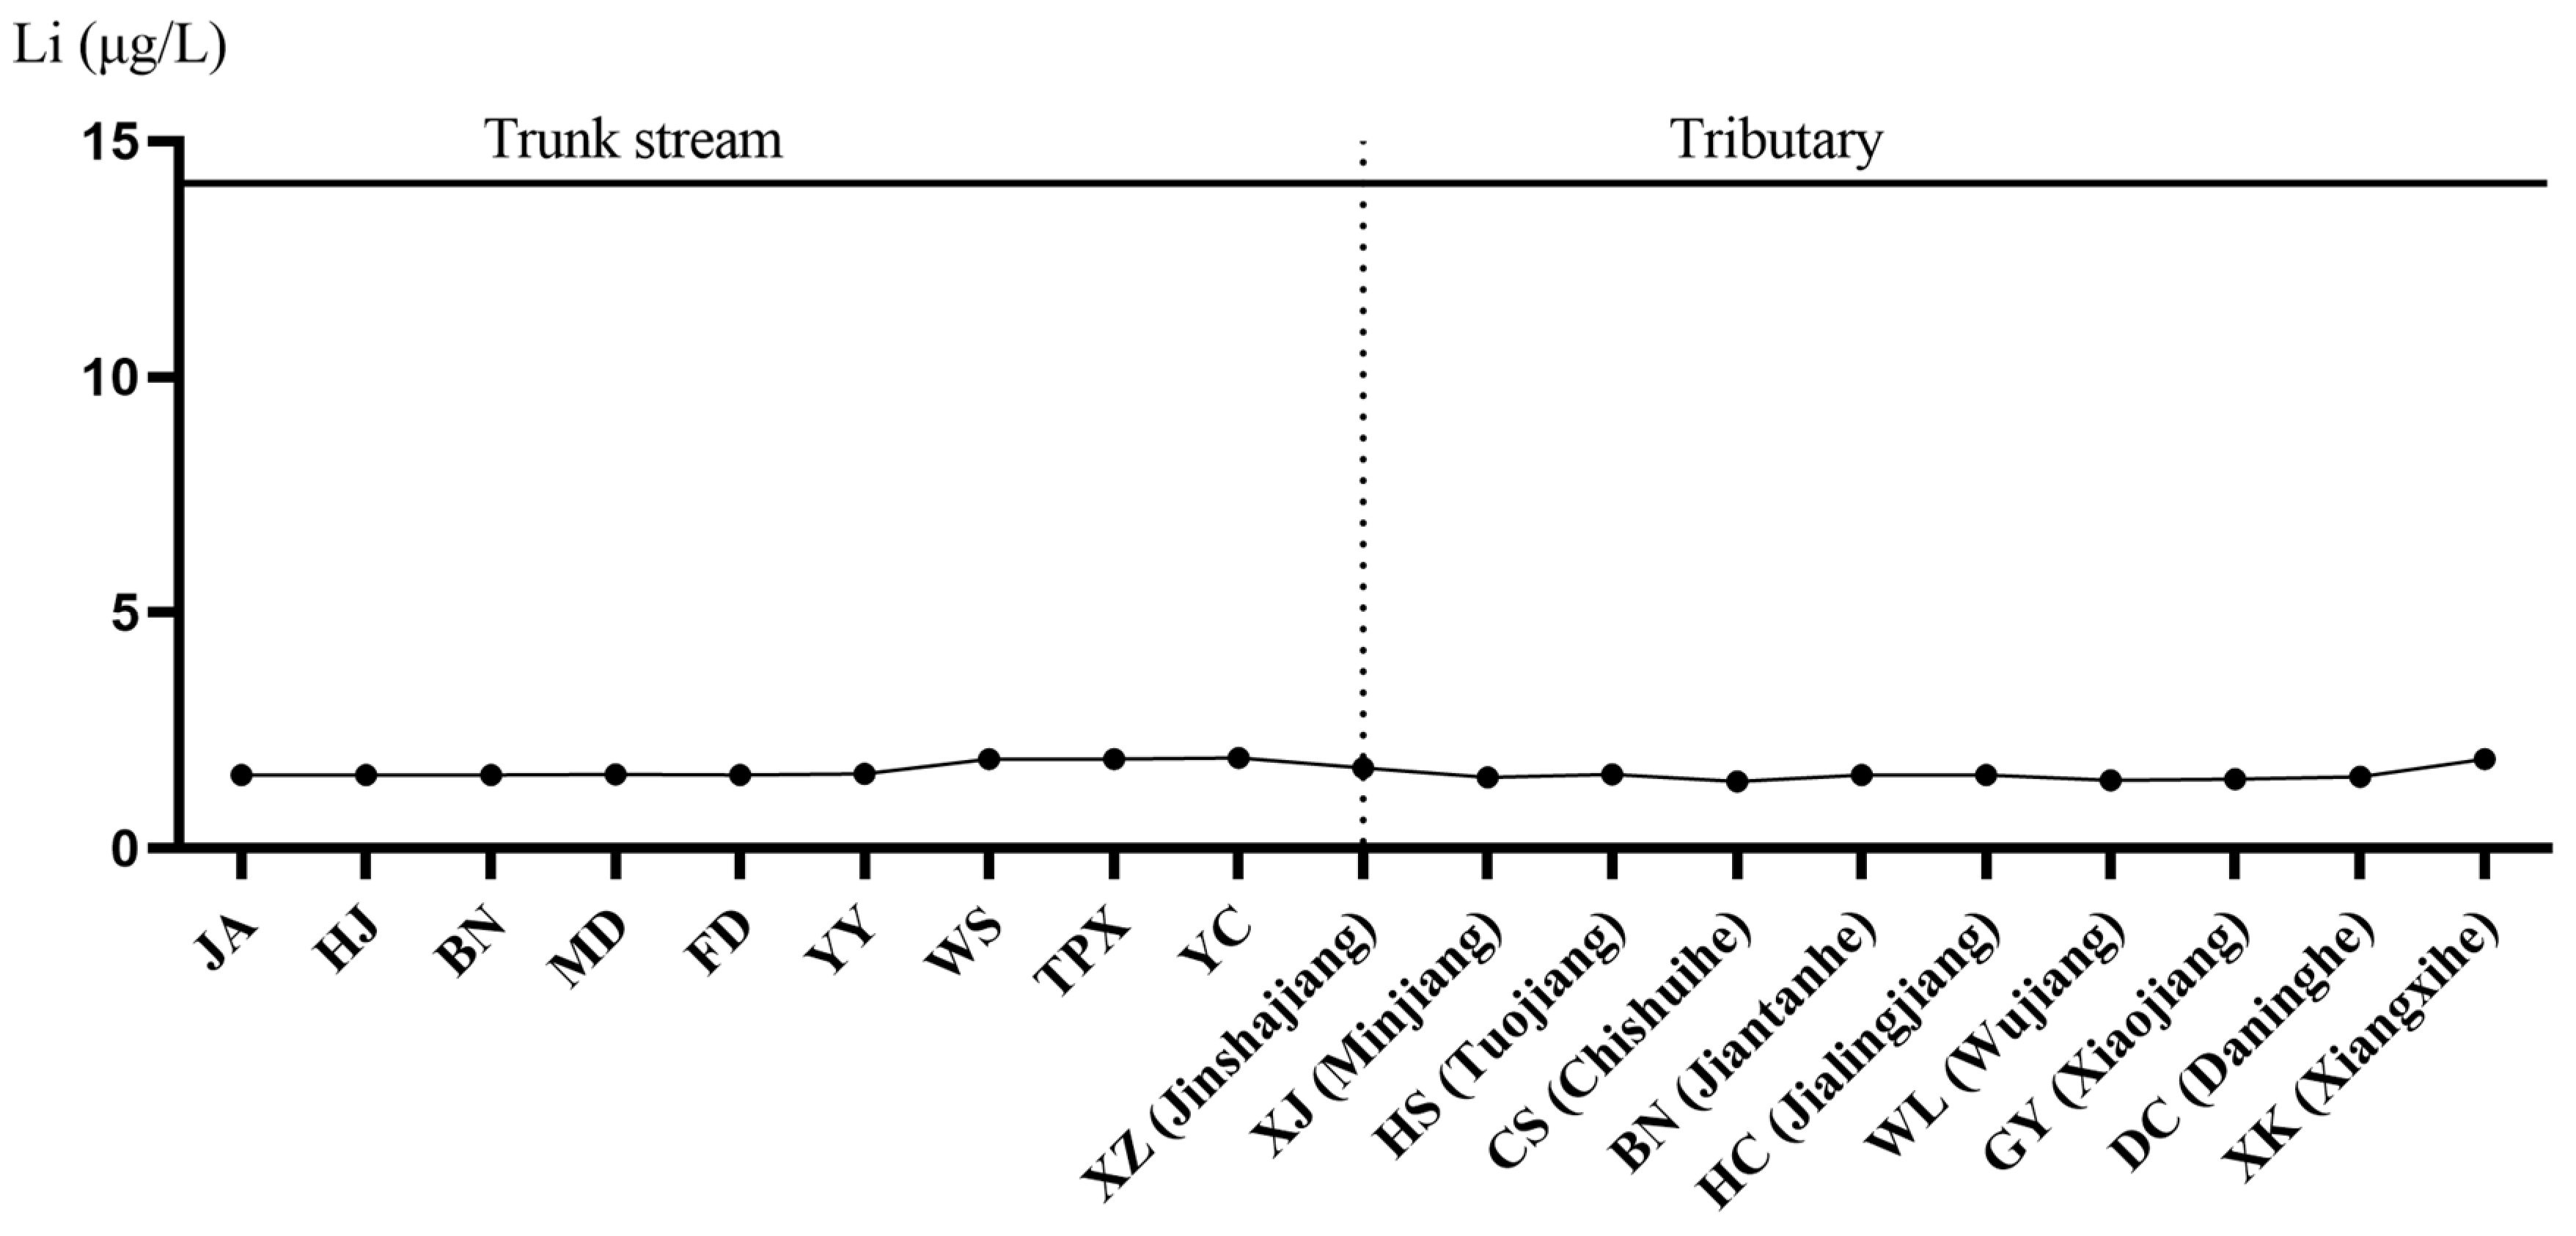
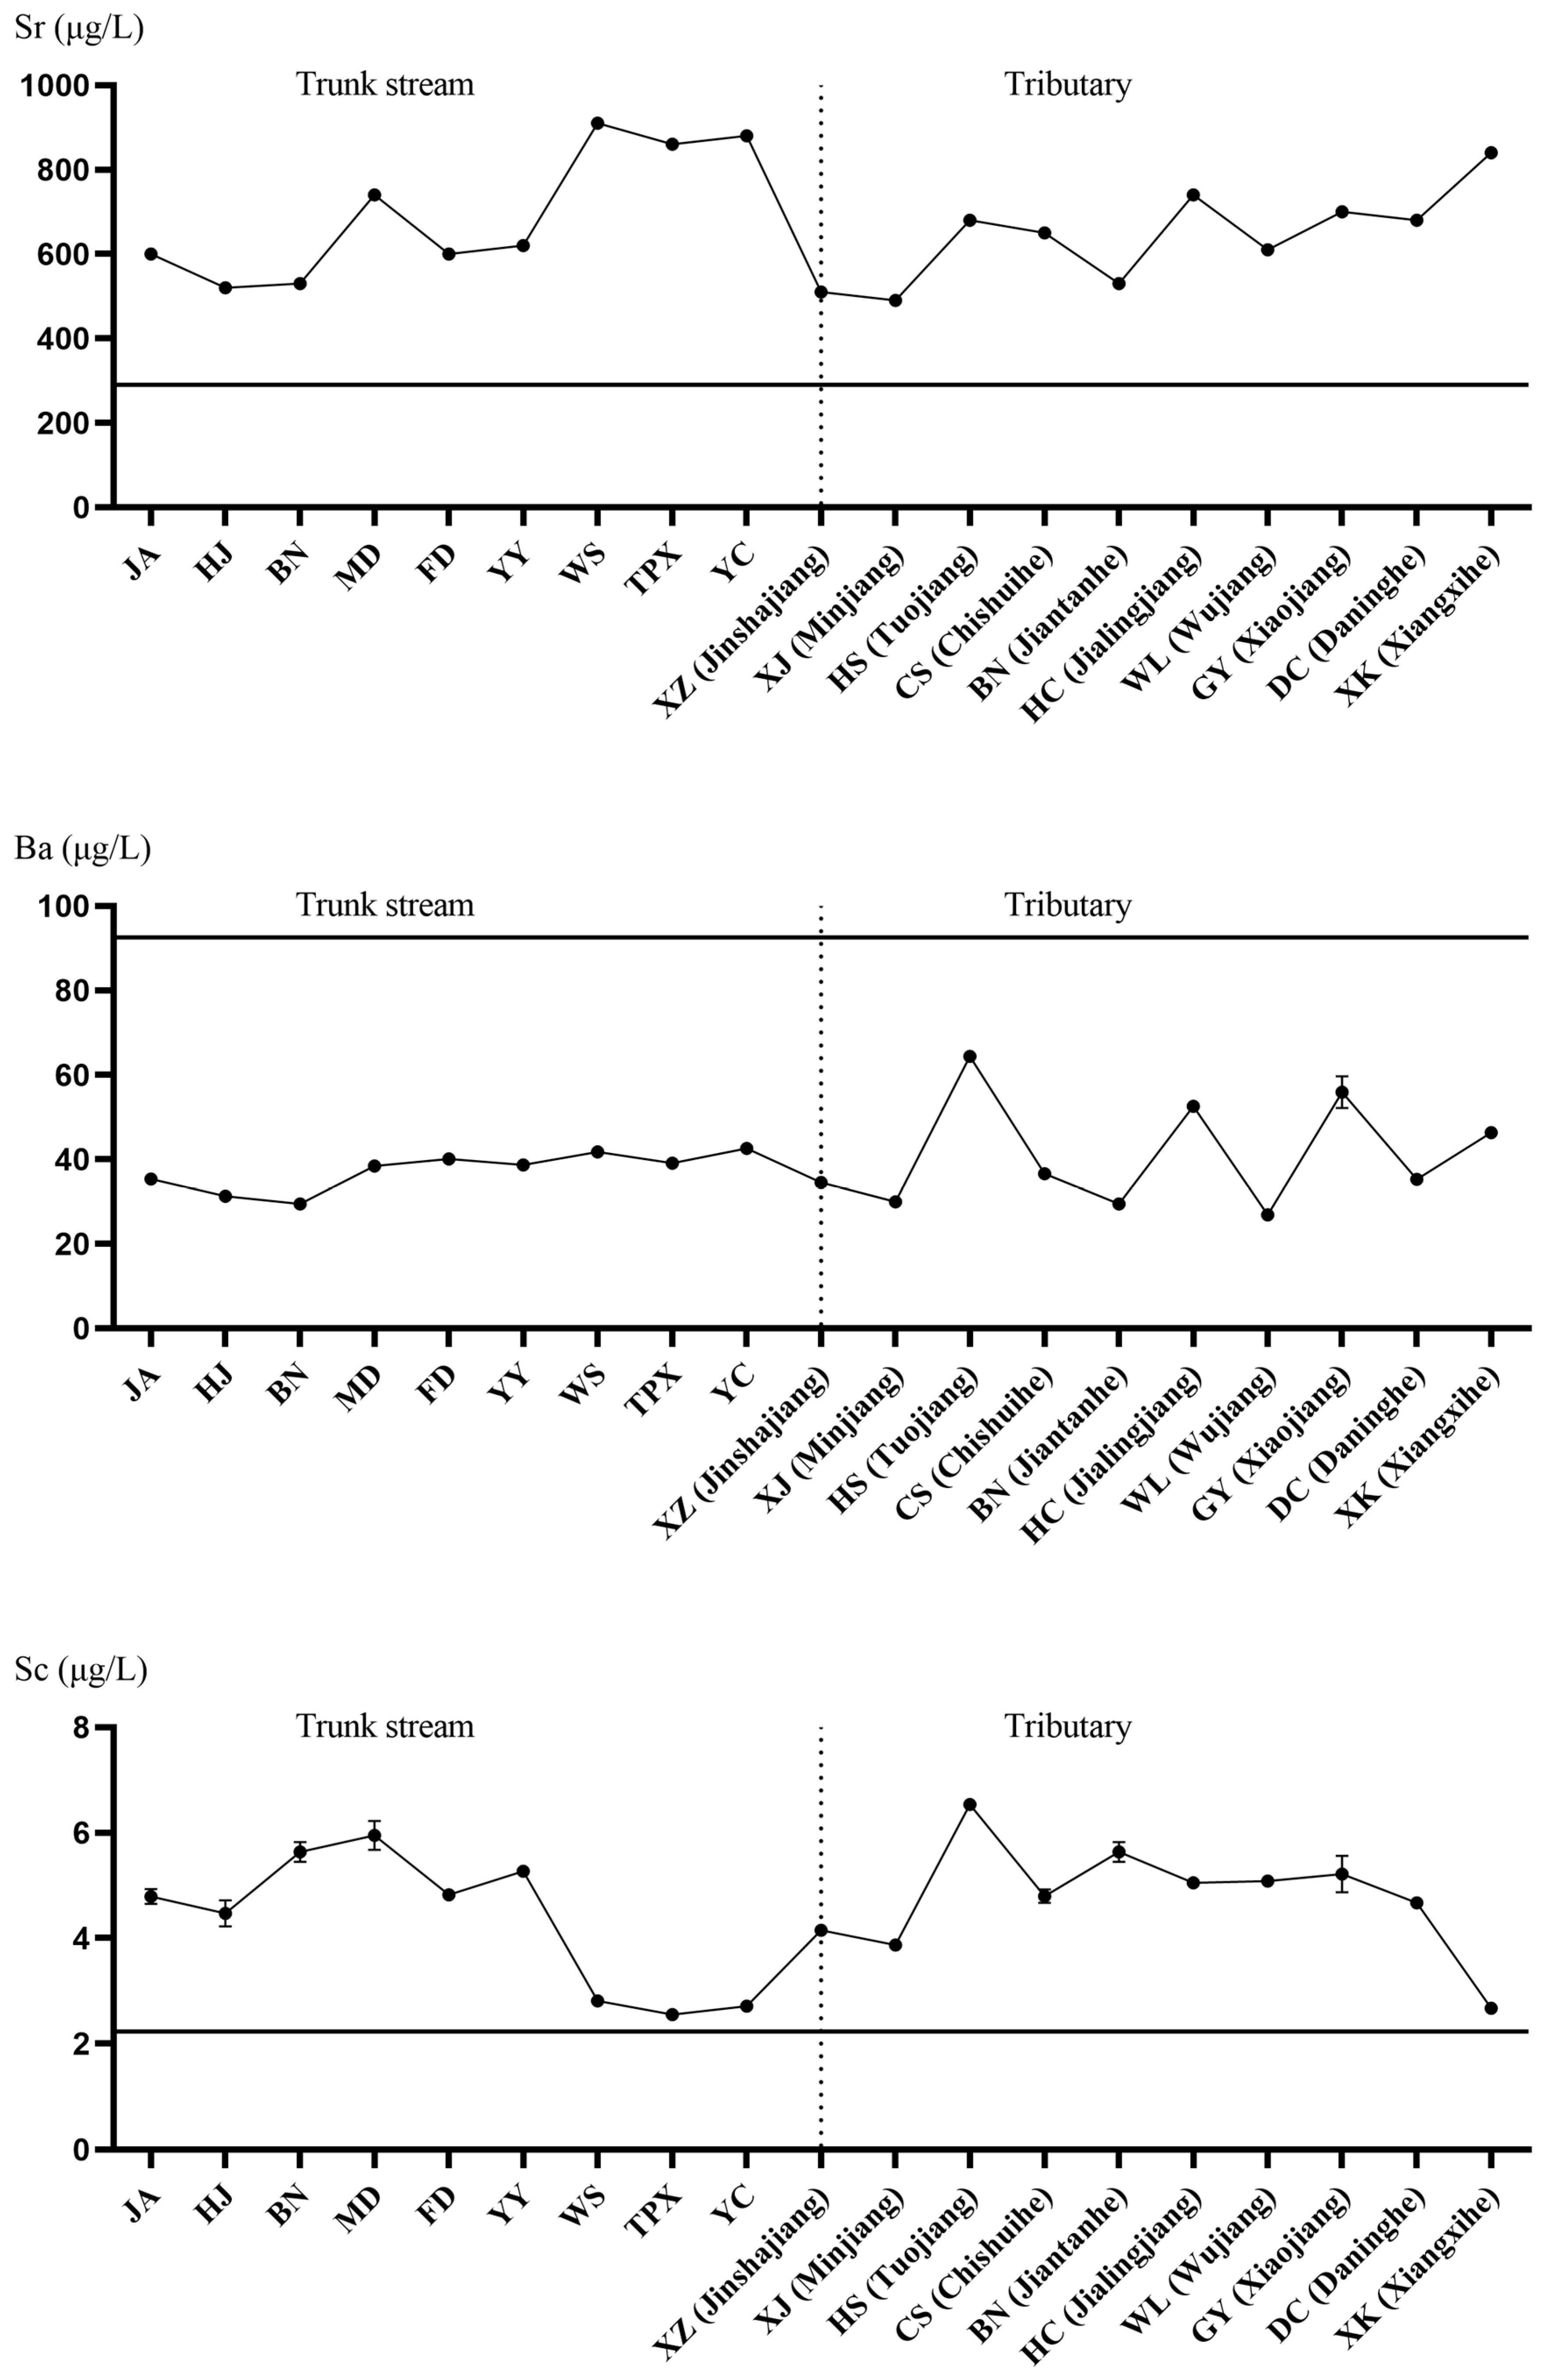
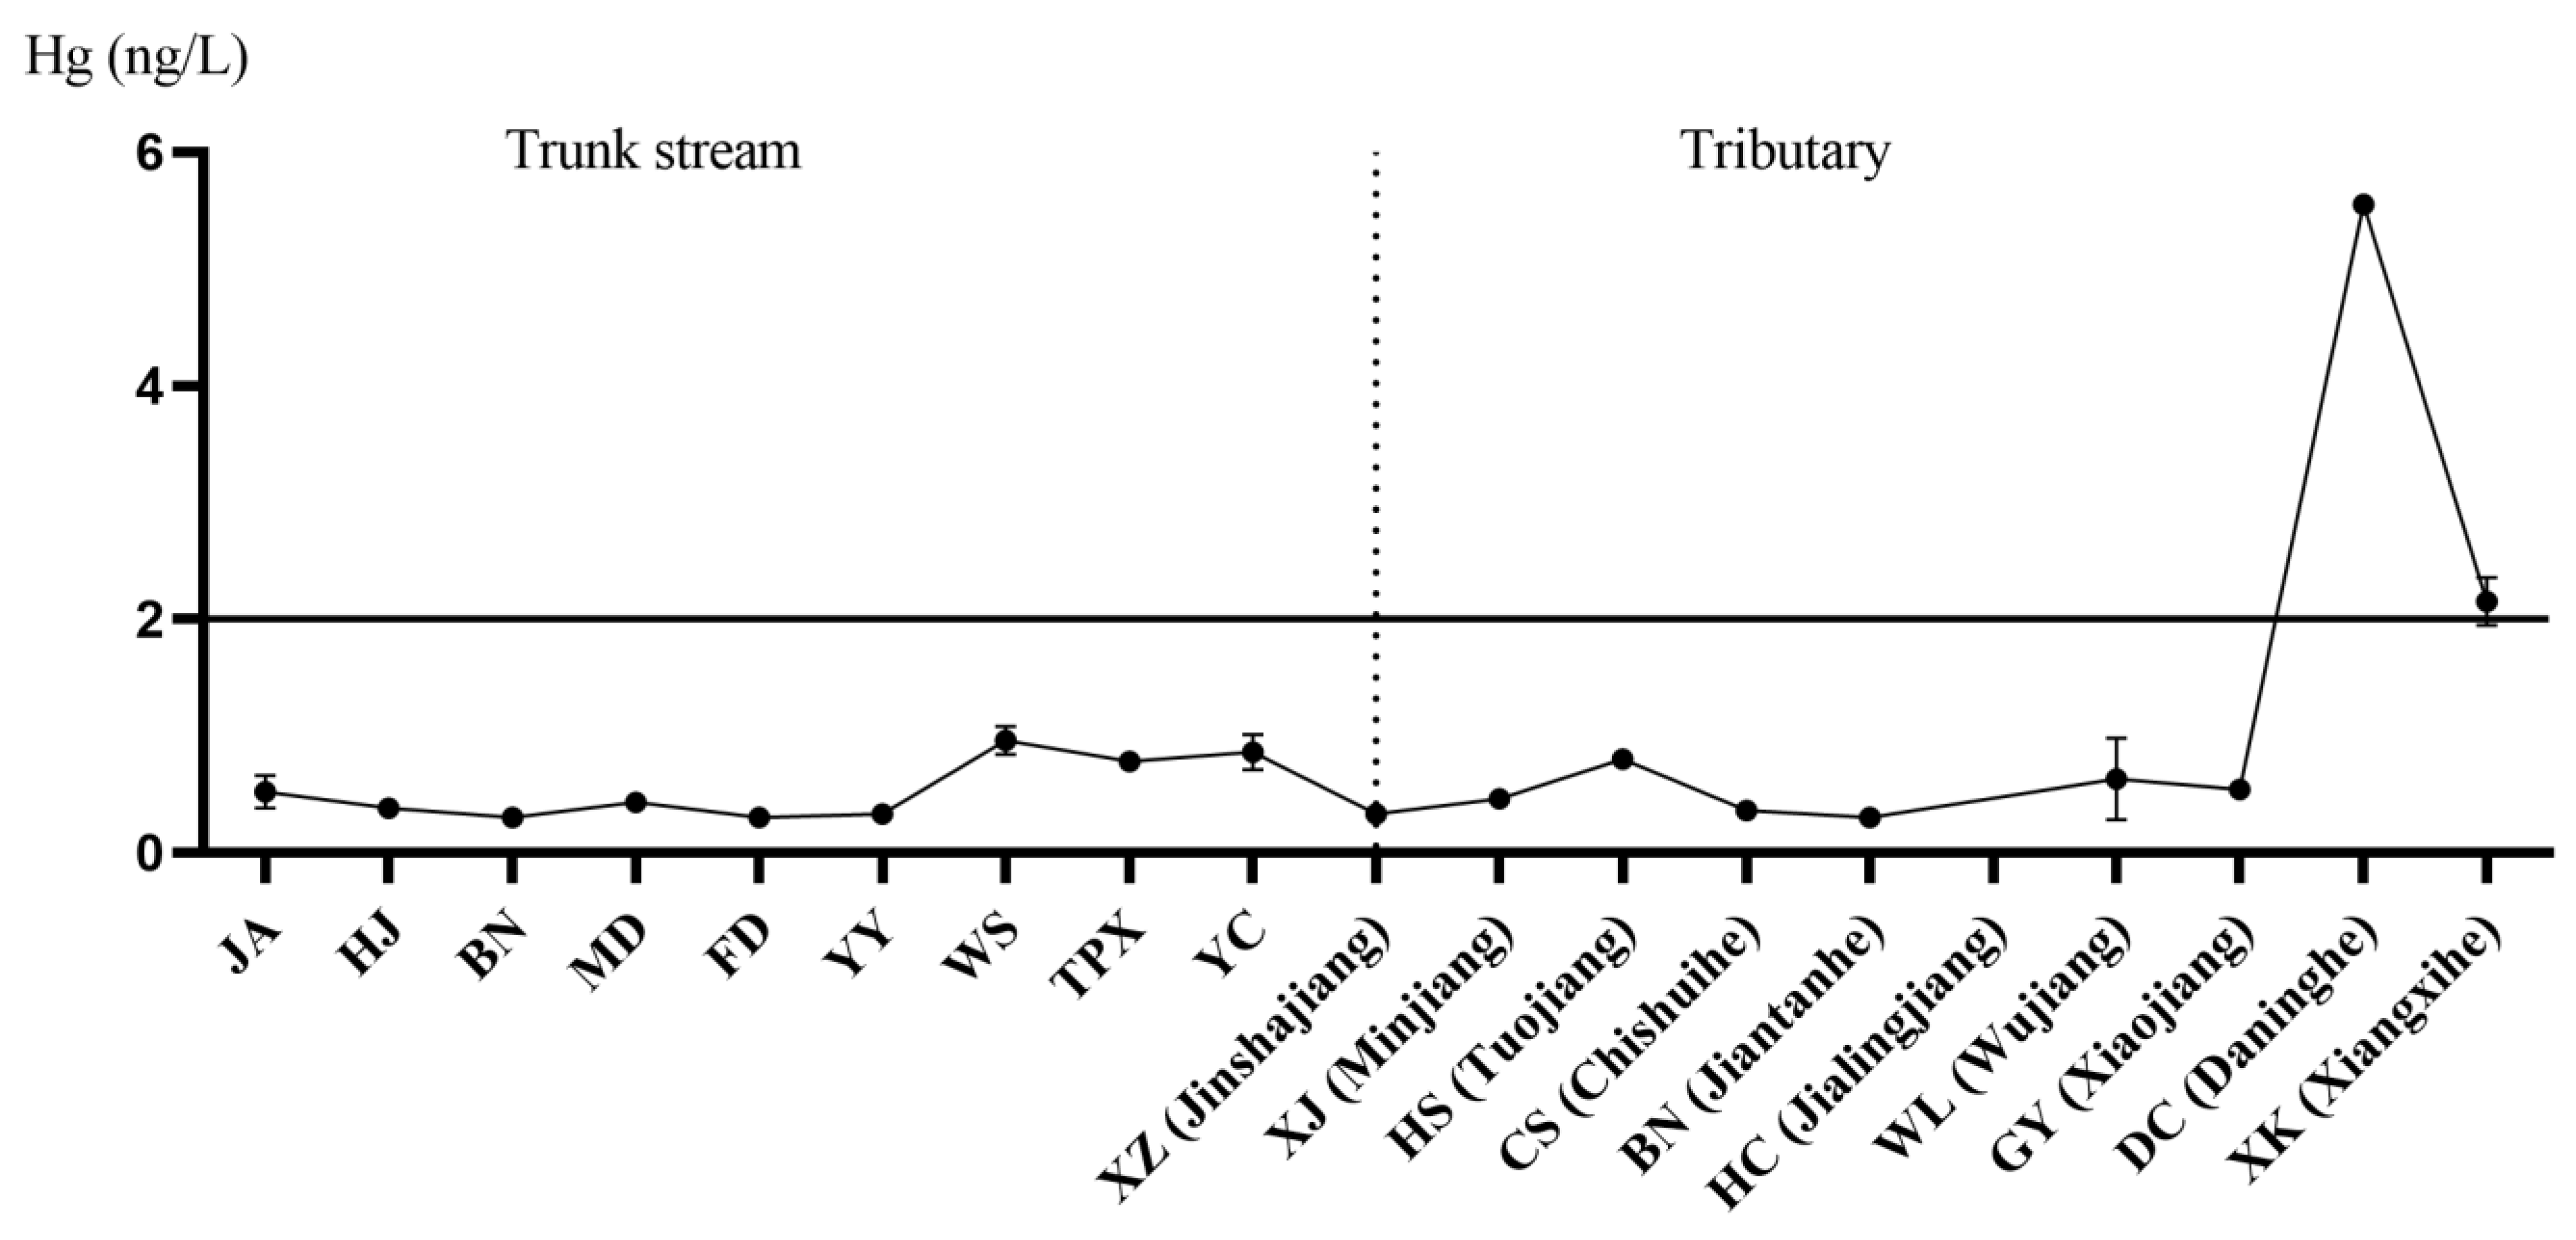
3.2. Major Trace Metals in the Yangtze River

Trace metals, derived from natural processes and related to human activities, may exist in natural surface and groundwater, such as Hg, Ba, cobalt, Sr, Cu, Fe and Mn, and are one of the important factors affecting water quality [34]. Sr, Ba, Li, Co, Cu, Fe, Mn, Sc and Hg analyses were carried out, the average value of which in water samples were determined as follows: Sr > Fe > Ba > Mn > Sc > Cu > Li > Co > Hg.
The spatial variance of the studied variables along the Yangtze River is shown in Figure 2, Figure 3, Figure 4 and Figure 5 in the form of error bar plots. As can be seen from Figure 2, the curves for Cu and Co were very similar, the high concentrations of which were all in urban areas (YY and YC), where anthropogenic activities rather than natural events are the predominant factors. The highest concentration of Fe and Mn were both measured in BN (Figure 3), also belonging to Chongqing urban area. Co is important as a indicator of aluminosilicate content in the environment and concomitant background crustal levels of metals [29]. We found that the mean concentration of Co was higher than the background values in Yangtze River [35]. In general, 100% of our samples exceeded the background values for Co, indicating the accumulation of this metal in the river. Some experts have associated increased Co concentrations in rivers with sewage effluents [36]. Concentration accumulation has also been observed in some other rivers in previous studies [28]. For example, the Co concentration in Poyang Lake has increased slightly, indicating that it has been affected by human activities. This is consistent with previous studies showing how human activities [37], such as hydraulic engineering, shipping, mining and agriculture, can affect metal concentrations [38].
Figure 4 shows that rare earth elements such as Li, Sr, Sc and Ba are stable within a hyper gene environment and may represent the whole composition of source rocks [39]. During the sampling period, the concentration of Hg ranged from 0.26 to 5.55 ng/L (Figure 5 and Table 3), which falls within the allowable limits set by both the WHO [40] and China [41].

3.3. Correlation Analysis

In this study, the results of the Pearson correlation matrix greater than 0.50 are shown in Table 5. A Pearson linear correlation matrix was generated using 17 parameters (T, DO, pH, turbidity, SAL, Na, Mg, Li, Sr, Ba, Co, Cu, Fe, Mn, Sc, Ca and Hg); the most effective water quality parameters to define any co-variation (Table 5). The obtained results indicate very strong positive correlations among pH, Na and T; turbidity, Li and Hg; SAL, Li, Sr and Sc; Na, Mg, Sc and Ca; Mg, Sr, Sc and Ca; Li, Sr and Co; Sr, Sc and Ca; Co and Cu; and Fe and Mn. Fe has very strong negative correlations with turbidity, SAL, Mg, Li, Sr and Ca. Different metals and their specific carriers form “carrier particles”, resulting in similar distribution orbits in both “laboratory” and nature [42]. Based on the above principles, the correlation coefficient between the concentration pairs of water quality parameters can show the significant correlation between nutrients and trace metals. By monitoring the trace metals and other elements in the study area, we can explore the source and activity track of trace metals in pollutants [23].

3.4. Water Quality and Health Risk Assessment

In this study, the WQI was used to evaluate the safety of water sources in the basin. The weight of parameters Mn and Hg was 5. The second highest weight of 4 was assigned to parameters of pH and Fe. The weight of Na, Mg, Ba, Ca and Cu was 2, and the minimum weight of Co was 1. Table S1 summarizes the weight (WI) of each parameter. This study refers to other research for weight definitions [23]. Mn and Hg have a significant impact on water quality, especially with regard to drinking water, while Co is considered the least important regarding water quality [43]. Trace metals from either natural or human activities may affect human health when the content reaches the level of toxic pollutants through continuous accumulation [43]. Ba, Co, Cu, Fe, Mn, pH, Hg, Na, Mg and Ca were taken into account for calculating the WQI value for each sampling location (Table S4). The analysis results from all 19 sampling points were used for quality evaluation. Furthermore, the World Health Organization [28] limits were utilized for calculations. The final WQI values of each sampling location are shown in Figure 6. The computed WQI values are between 9.59 and 20.26 of the trunk stream and between 10.05 and 25.82 for the tributary. In addition, the water quality of Yangtze River falls into the “excellent” range mainly due to the reduction in the input of municipal and industrial wastes and/or agricultural activity discharge on the banks of the river.
According to the health risk assessment model recommended by the US Environmental Protection Agency, the non-carcinogenic risks of trace metals to human health in Yangtze river were calculated. Table 6 summarizes the results for HQingestion, HQdermal and HI. We found that the HI values for adults and children fall within the safety limit (<1) (Table 6), indicating that there are no obvious health risks from water from the Yangtze River. The estimated range of HI is 0.0930 to 0.3739 for adults and 0.1502 to 0.6191 for children. These values show that the detected pollutant exposure has no adverse effects on human health and no potential non-carcinogenic risk. However, water quality issues within the middle and lower reaches of the Yangtze River appear more serious [44,45]. Therefore, we should also pay attention to the impact of human production activities such as agriculture and animal husbandry on the ecological environment of the Yangtze River.

4. Conclusions

In this study, physical and chemical analyses of water samples taken from 19 locations along the path of the Yangtze River were performed. Firstly, the results show that the average values of Mg, Sr, Co, Cu, Fe, Mn and Sc were higher than the historical background values; moreover, through correlation analyses, it is concluded that these nutrients and trace metals have high values as a result of anthropogenic pollution in the study area. Secondly, the water quality was evaluated using the water quality index (WQI). The computed WQI values were between 9.59 and 20.26; the water quality is excellent in the river basin. Finally, hazard quotient (HQ) values show that the detected pollutant exposure has no adverse effects on human health and poses no potential non-carcinogenic risk.

Supplementary Materials

The following supporting information can be downloaded at: https://www.mdpi.com/article/10.3390/w15071330/s1.

Author Contributions

Y.C. analyzed the data and wrote the article. F.X. and D.Z. collected and processed samples. H.L., X.D. and D.C. performed the research and edited the paper. W.J. and B.L. modified the paper. All authors have read and agreed to the published version of the manuscript.

Funding

This work was supported by the Research Project of China Three Gorges Corporation (2020049-ZHX), the Innovative Research Team Foundation of the Department of Education of Hubei Province, China (T2020034), and the Scientific Research Project of Jianghan University (2021kjzx006).

Data Availability Statement

The authors confirm that the data supporting the findings of this study are available within the article and its Supplementary Materials.

Conflicts of Interest

The authors declare that they have no known competing financial interests or personal relationships that could have appeared to influence the work reported in this paper.

References

  1. Cheng, S. Heavy metal pollution in China: Origin, pattern and control. Environ. Sci. Pollut. Res. 2003, 10, 192–198. [Google Scholar] [CrossRef] [PubMed]
  2. Wai, K.M.; Wu, S.; Li, X.; Jaffe, D.A.; Perry, K.D. Global atmospheric transport and source-receptor relationships for arsenic. Environ. Sci. Technol. 2016, 50, 3714–3720. [Google Scholar] [CrossRef]
  3. Szatyłowicz, E.; Krasowska, M. Assessment of heavy metals leaching from fly ashes as an indicator of their agricultural use. Desalin. Water Treat. 2020, 199, 288–296. [Google Scholar] [CrossRef]
  4. Łapińśki, D.; Wiater, J.; Szatyłowicz, E. The Content of Heavy Metals in Waste as an Indicator Determining the Possibilities of their Agricultural Use. J. Ecol. Eng. 2019, 20, 225–230. [Google Scholar] [CrossRef]
  5. Amos, H.M.; Jacob, D.J.; Kocman, D. Global biogeochemical implications of mercury discharges from rivers and sediment burial. Environ. Sci. Technol. 2014, 48, 9514–9522. [Google Scholar] [CrossRef] [PubMed] [Green Version]
  6. Outridge, P.M.; Mason, R.P.; Wang, F.; Guerrero, S. Updated global and oceanic mercury budgets for the United Nations Global Mercury Assessment 2018. Environ. Sci. Technol. 2018, 52, 11466–11477. [Google Scholar] [CrossRef] [PubMed]
  7. Regnier, P.; Friedlingstein, P.; Ciais, P.; Mackenzie, F.T.; Gruber, N.; Janssens, I.A.; Laruelle, G.G.; Lauerwald, R.; Luyssaert, S.; Andersson, A.J.; et al. Anthropogenic perturbation of the carbon fluxes from land to ocean. Nat. Geosci. 2013, 6, 597–607. [Google Scholar] [CrossRef] [Green Version]
  8. Liu, H. China’s Long March to Safe Drinking Water: China Water Risk & China dialogue. China Water Risk 2015, 44, 1–44. [Google Scholar]
  9. Jiang, Y. China’s water security: Current status, emerging challenges and future prospects. Environ. Sci. Policy 2015, 54, 106–125. [Google Scholar] [CrossRef]
  10. Ali, I. The quest for active carbon adsorbent substitutes: Inexpensive adsorbents for toxic metal ions removal from wastewater. Sep. Purif. Rev. 2010, 39, 95–171. [Google Scholar] [CrossRef]
  11. Khan, S.; Shahnaz, M.; Jehan, N.; Rehman, S.; Shah, M.T.; Din, I. Drinking water quality and human health risk in Charsadda district, Pakistan. J. Clean Prod. 2013, 60, 93–101. [Google Scholar] [CrossRef]
  12. Qu, F.; Kuyvenhoven, A.; Shi, X. Sustainable natural resource use in rural China: Recent trends and policies. China Econ. Rev. 2011, 22, 444–460. [Google Scholar] [CrossRef]
  13. Xiao, J.; Wang, L.; Deng, L.; Jin, Z. Characteristics, sources, water quality and health risk assessment of trace elements in river water and well water in the Chinese Loess Plateau. Sci. Total Environ. 2019, 650, 2004–2012. [Google Scholar] [CrossRef]
  14. Cao, S.; Duan, X.; Ma, Y.; Zhao, X.; Qin, Y.; Liu, Y.; Li, S.; Zheng, B.; Wei, F. Health benefit from decreasing exposure to heavy metals and metalloid after strict pollution control measures near a typical river basin area in China. Chemosphere 2017, 184, 866–878. [Google Scholar] [CrossRef]
  15. Qu, C.; Li, B.; Wu, H.; Wang, S.; Li, F. Probabilistic ecological risk assessment of heavy metals in sediments from China’s major aquatic bodies. Stoch. Environ. Res. Risk Assess. 2016, 30, 271–282. [Google Scholar] [CrossRef]
  16. Chen, X.; Luo, Q.; Wang, D.; Gao, J.; Wei, Z.; Wang, Z.; Zhou, H.; Mazumder, A. Simultaneous assessments of occurrence, ecological, human health, and organoleptic hazards for 77 VOCs in typical drinking water sources from 5 major river basins, China. Environ. Pollut. 2015, 206, 64–72. [Google Scholar] [CrossRef] [PubMed]
  17. Liu, M.; Zhang, Q.; Luo, Y.; Mason, R.P.; Ge, S.; He, Y.; Yu, C.; Rina, S.; Cao, H.; Wang, X.; et al. Impact of water-induced soil erosion on the terrestrial transport and atmospheric emission of mercury in China. Environ. Sci. Technol. 2018, 52, 6945–6956. [Google Scholar] [CrossRef] [PubMed]
  18. Buck, C.S.; Hammerschmidt, C.R.; Bowman, K.L.; Gill, G.A.; Landing, W.M. Flux of total mercury and methylmercury to the northern Gulf of Mexico from US estuaries. Environ. Sci. Technol. 2015, 49, 13992–13999. [Google Scholar] [CrossRef]
  19. Liu, M.; Du, P.; Yu, C.; He, Y.; Zhang, H.; Sun, X.; Lin, H.; Luo, Y.; Xie, H.; Guo, J.; et al. Increases of total mercury and methylmercury releases from municipal sewage into environment in China and implications. Environ. Sci. Technol. 2018, 52, 124–134. [Google Scholar] [CrossRef]
  20. Chen, Y.; Zang, L.; Liu, M.; Zhang, C.; Zhao, M. Ecological risk assessment of the increasing use of the neonicotinoid insecticides along the east coast of China. Environ. Int. 2019, 127, 550–557. [Google Scholar] [CrossRef]
  21. Patil, A.K.; Shrivastava, V. Analysis of metals and organics in river water by ICP-AES and GUMS techniques. Asian J. Chem. 2007, 19, 3645–3651. [Google Scholar]
  22. Harris, A.; Xanthos, S.J.; Galiotos, J.K.; Douvris, C. Investigation of the metal content of sediments around the historically polluted Potomac River basin in Washington DC, United States by inductively coupled plasma-optical emission spectroscopy (ICP-OES). Microchem. J. 2018, 142, 140–143. [Google Scholar] [CrossRef]
  23. Şener, Ş.; Şener, E.; Davraz, A. Evaluation of water quality using water quality index (WQI) method and GIS in Aksu River (SW-Turkey). Sci. Total Environ. 2017, 584, 131–144. [Google Scholar] [CrossRef] [PubMed]
  24. He, X.H.; Ma, S.H.; Li, A.D.; Pan, X.C.; Chen, Q.; Wang, J.F. Exposure assessment of various reclaimed water uses. Huan Jing Ke Xue 2006, 27, 1912–1915. [Google Scholar]
  25. Wang, J.; Liu, G.; Liu, H.; Lam, P.K.S. Multivariate statistical evaluation of dissolved trace elements and a water quality assessment in the middle reaches of Huaihe River, Anhui, China. Sci. Total Environ. 2017, 583, 421–431. [Google Scholar] [CrossRef]
  26. Yang, L.; Song, X.; Zhang, Y.; Han, D.; Zhang, B.; Long, D. Characterizing interactions between surface water and groundwater in the Jialu River basin using major ion chemistry and stable isotopes. Hydrol. Earth Syst. Sci. 2012, 16, 4265–4277. [Google Scholar] [CrossRef] [Green Version]
  27. Zhao, P.; Tang, X.; Tang, J.; Wang, C. Assessing water quality of Three Gorges Reservoir, China, over a five-year period from 2006 to 2011. Water Resour. Manag. 2013, 27, 4545–4558. [Google Scholar] [CrossRef]
  28. Yi, Y.; Yang, Z.; Zhang, S. Ecological risk assessment of heavy metals in sediment and human health risk assessment of heavy metals in fishes in the middle and lower reaches of the Yangtze River basin. Environ. Pollut. 2011, 159, 2575–2585. [Google Scholar] [CrossRef]
  29. Wang, L.; Wang, Y.; Xu, C.; An, Z.; Wang, S. Analysis and evaluation of the source of heavy metals in water of the River Changjiang. Environ. Monit. Assess 2011, 173, 301–313. [Google Scholar] [CrossRef]
  30. Osibanjo, O.; Daso, A.P.; Gbadebo, A.M. The impact of industries on surface water quality of River Ona and River Alaro in Oluyole Industrial Estate, Ibadan, Nigeria. Afr. J. Biotechnol. 2011, 10, 696–702. [Google Scholar]
  31. Kumar, V.I.D.; Singh, S.; Krishan, G.P.A. Assessment of groundwater quality of Agra District for the irrigation purpose. Curr. World Environ. 2017, 12, 61. [Google Scholar] [CrossRef] [Green Version]
  32. Singh, V.K.; Bikundia, D.S.; Sarswat, A.; Mohan, D. Groundwater quality assessment in the village of Lutfullapur Nawada, Loni, District Ghaziabad, Uttar Pradesh, India. Environ. Monit. Assess. 2012, 184, 4473–4488. [Google Scholar] [CrossRef] [PubMed]
  33. Tiwari, A.K.; Singh, A.K.; Mahato, M.K. Assessment of groundwater quality of Pratapgarh district in India for suitability of drinking purpose using water quality index (WQI) and GIS technique. Sustain. Water Resour. Manag. 2018, 4, 601–616. [Google Scholar] [CrossRef]
  34. Ikem, A.; Adisa, S. Runoff effect on eutrophic lake water quality and heavy metal distribution in recent littoral sediment. Chemosphere 2011, 82, 259–267. [Google Scholar] [CrossRef]
  35. Licheng, Z.; Kezhun, Z. Background values of trace elements in the source area of the Yangtze River. Sci. Total Environ. 1992, 125, 391–404. [Google Scholar] [CrossRef]
  36. Kaur, J.; Kaur, V.; Pakade, Y.B. A study on water quality monitoring of Buddha Nullah, Ludhiana, Punjab (India). Environ. Geochem. Health 2021, 43, 2699–2722. [Google Scholar] [CrossRef] [PubMed]
  37. Zhang, W.; Jin, X.; Di, Z. Heavy metals in surface sediments of the shallow lakes in eastern China: Their relations with environmental factors and anthropogenic activities. Environ. Sci. Pollut. Res. 2016, 23, 25364–25373. [Google Scholar] [CrossRef]
  38. Feng, L.; Hu, C.; Chen, X.; Zhao, X. Dramatic inundation changes of China’s two largest freshwater lakes linked to the Three Gorges Dam. Environ. Sci. Technol. 2013, 47, 9628–9634. [Google Scholar] [CrossRef]
  39. Fralick, P.W.; Kronberg, B.I. Geochemical discrimination of clastic sedimentary rock sources. Sediment. Geol. 1997, 113, 111–124. [Google Scholar] [CrossRef]
  40. World Health Organization. Guidelines for Drinking-Water Quality Incorporating 1st and 2nd Addenda, Volume 1, Recommendations. Available online: https://apps.who.int/iris/handle/10665/204411 (accessed on 23 November 2022).
  41. GB5749-2006; Standards for Drinking Water Quality. Ministry of Health: Beijing, China, 2007.
  42. Hakanson, L.; Jansson, M. Principles of Lake Sedimentology; Springer: Berlin, Germany, 1983. [Google Scholar]
  43. Bibi, M.H.; Ahmed, F.; Ishiga, H. Assessment of metal concentrations in lake sediments of southwest Japan based on sediment quality guidelines. Environ. Geol. 2007, 52, 625–639. [Google Scholar] [CrossRef]
  44. Fu, Y.T. Occurrence Forms, Source Characteristics and Ecological Risk Assessment of Heavy Metals in Sediments along the Yangtze River Estuary and Adjacent Waters; Shanghai Ocean University: Shanghai, China, 2022. [Google Scholar]
  45. Guo, J.; Wang, K.; Yu, Q. Analysis of heavy metal pollution characteristics and risk assessment of near-shore surface sediments in the middle reaches of the Yangtze River. J. Environ. Sci. 2021, 41, 4625–4636. [Google Scholar]
Figure 1. Sampling locations in the upper part of the Yangtze River.
Water 15 01330 g001
Figure 2. Spatial variance of Cu and Co (μg/L) concentrations in the sampling stations of the Yangtze River. The horizontal and solid lines in the figure represent the background values in historical documents. The x-axis is the sampling point. The left side of the vertical dotted line is the main stream and the right side is the tributaries of the Yangtze River. The y-axis is the element concentration.
Water 15 01330 g002
Figure 3. Spatial variance of Fe and Mn (μg/L) concentrations in the sampling stations of the Yangtze River. The horizontal and solid lines in the figure represent the background values in historical documents. The x-axis is the sampling point. The left side of the vertical dotted line is the main stream and the right side is the tributaries of the Yangtze River. The y-axis is the element concentration.
Water 15 01330 g003
Figure 4. Spatial variance of Li, Sr, Ba and Sc (μg/L) concentrations in the sampling stations of the Yangtze River. The horizontal and solid lines in the figure represent the background values in historical documents. The x-axis is the sampling point. The left side of the vertical dotted line is the main stream and the right side is the tributaries of the Yangtze River; The y-axis is the element concentration.
Water 15 01330 g004aWater 15 01330 g004b
Figure 5. Spatial variance of Hg (ng/L) concentrations in the sampling stations of the Yangtze River. The horizontal and solid lines in the figure represent the background values in historical documents. The x-axis is the sampling point. The left side of the vertical dotted line is the main stream and the right side is the tributaries of the Yangtze River. The y-axis is the element concentration.
Water 15 01330 g005
Figure 6. The final WQI value of each sampling location of the Yangtze River. The x-axis is the WQI value and the y-axis is the sampling point.
Water 15 01330 g006
Table 1. Mass concentrations of multi-element mixed standard solution.
Sample NumberNa (mg/L)Mg, Ca (mg/L)Li (μg/L)Sr (mg/L)Ba, Co, Cu, Fe, Mn (μg/L)Sc (μg/L)Hg (ng/L)
STD10000000
STD20.1110.150.10.1
STD30.5550.5100.20.5
STD4110101200.51
STD52202025012
STD655050510025
Table 2. Selected elements and corresponding wavelengths (nm), detection limits, % recovery and %RSD.
ElementsWavelengthDetection Limit (mg/L)% Recovery%RSD
Na589.60.2299.34.32
Mg285.20.9688.63.27
Ca1840.2688.63.56
Sr407.80.00791.22.63
Ba493.40.0186.52.64
Li670.80.028113.84.11
Co240.70.000184.33.89
Cu324.80.00696.21.56
Fe259.90.1490.33.62
Mn257.60.00385.42.58
Sc357.20.0006108.21.32
Hg184.90.001296.52.73
Table 3. Statistical of the physical and chemical parameters of the river water.
ParametersMinimumMaximmMeanStandard DeviationDrinking Water GuidenesHistorical Value of the Yangtze River
China aWHO b
EC (µS/cm)349.40671.00427.0870.65
PH7.839.248.220.316.5–8.5
Temperatmre (°C)14.7021.0017.691.53
DO (mg/L)5.0713.677.781.72
SAL (ppt)0.170.330.210.04
ORP143.80294.60188.6333.19
Turbidity (NTU)0.344.121.641.06
Na (mg/L)2.567.634.501.22 2007.6 [28]
Mg (mg/L)8.7817.6812.522.68 308.5 [28]
Ca (mg/L)41.1371.1752.137.927530027.9 [28]
Ba (µg/L)26.8964.4840.869.95700 92.57 [15]
Co (µg/L)0.693.401.410.6950 0.24 [29]
Cu (µg/L)2.084.813.200.79100020000.63 [29]
Fe (µg/L)38.51122.3353.8218.3730030010 [29]
Mn (µg/L)0.3189.5214.8624.201004002.53 [29]
Hg (ng/L)0.305.550.921.175062 [29]
Sc (µg/L)2.556.654.621.21 2.23 [29]
Li (µg/L)1.421.921.620.16 14.1 [15]
Sr (µg/L)489.81910.04687.67123.90 290 [15]
Notes: a Chinese State Standards (GB 5749-2006). b WHO 2006.
Table 4. Groundwater classification on the basis of total hardness (TH).
S. No.Class of GroundwaterRange of TH (mg/L)Samples
No.%
1Soft<75NilNil
2Moderately hard75–15015.26%
3Hard150–3001894.74%
4Very hard>300NilNil
Table 5. Pearson correlation coefficient matrix of analyzed variables for 19 samples.
TDOpHTurbiditySALNaMgLiSrBaCoCuFeMnScCaHg
T1.0000
DO0.12621.0000
pH0.4455 *0.82791.0000
Turbidity−0.03240.28150.25771.0000
SAL0.1474−0.20420.11060.22271.0000
Na0.4390 *−0.01560.25420.30830.7855 **1.0000
Mg0.0053−0.2491−0.00130.26610.86880.7019 **1.0000
Li−0.08540.04370.13810.4623 *0.5374 **0.40860.42161.0000
Sr−0.01510.19970.30840.40660.6972 **0.38020.5813 **0.5637 **1.0000
Ba0.31530.33150.4194−0.36800.06010.05730.03750.02100.08801.0000
Co−0.03150.13440.10440.26540.1276−0.0606−0.05010.4793 *0.26970.12841.0000
Cu−0.14900.19120.15400.14570.1137−0.11640.04450.39250.24550.31230.7306 **1.0000
Fe0.0472−0.0152−0.0659−0.5320 **−0.4703 *−0.4133−0.4648 *−0.4274 *−0.6447 **0.2882−0.1617−0.00281.0000
Mn0.16670.02600.1970−0.4270−0.2207−0.1594−0.5009−0.3253−0.41000.2223−0.2448−0.15650.5883 **1.0000
Sc0.1691−0.17550.07200.06910.7744 **0.5909 **0.7154 **−0.04080.5792 **−0.0327−0.1203−0.1226−0.3896−0.16361.0000
Ca0.0362−0.2668−0.01190.08250.90660.5446 **0.7765 **0.34330.7602 **0.08130.13450.1022−0.4680 *−0.20040.86551.0000
Hg0.28670.23210.25100.7011 **0.04750.0707−0.05640.20890.3119−0.13590.33970.1807−0.2488−0.22130.00020.00891.0000
Notes: ** p < 0.01; * p <0.05.
Table 6. Hazard quotient (HQ) and hazard index (HI) of each investigated element in the water samples.
LocationThe Main Stream of the Yangtze RiverTributaries of the Yangtze River
JAHJBNMDFDYYWSTPXYCXZXJHSCSBNHCWLGYDCXK
Child
Ba(HQing)0.020.020.020.020.020.020.020.020.020.020.020.040.020.020.030.020.030.020.03
Co(HQing)0.130.140.150.200.230.330.090.170.350.120.130.140.140.150.130.210.260.460.13
Cu(HQing)0.000.000.000.000.000.000.000.000.000.000.000.000.000.000.000.000.000.000.00
Fe(HQing)0.010.010.020.010.010.010.010.010.010.010.010.010.010.020.010.010.010.010.01
Mn(HQing)0.020.000.070.040.000.000.000.000.000.000.010.030.010.070.010.000.000.000.00
Hg(HQing)0.000.000.000.000.000.000.000.000.000.000.000.000.000.000.000.000.000.000.00
Ba(HQderm)0.000.000.000.000.000.000.000.000.000.000.000.000.000.000.000.000.000.000.00
Co(HQderm)0.000.000.000.000.000.010.000.000.010.000.000.000.000.000.000.000.010.010.00
Cu(HQderm)0.000.000.000.000.000.000.000.000.000.000.000.000.000.000.000.000.000.000.00
Fe(HQderm)0.000.000.000.000.000.000.000.000.000.000.000.000.000.000.000.000.000.000.00
Mn(HQderm)0.000.000.020.010.000.000.000.000.000.000.000.010.000.020.000.000.000.000.00
Hg(HQderm)0.010.010.010.010.010.010.020.020.020.010.010.020.010.010.000.010.010.110.04
HI0.200.180.280.290.280.380.150.220.410.160.180.240.200.280.180.250.330.620.21
Adult
Ba(HQing)0.010.010.010.020.020.020.020.020.020.010.010.030.010.010.020.010.020.010.02
Co(HQing)0.080.090.100.130.160.220.060.110.230.080.080.090.090.100.080.140.180.310.08
Cu(HQing)0.000.000.000.000.000.000.000.000.000.000.000.000.000.000.000.000.000.000.00
Fe(HQing)0.010.000.010.000.000.000.000.000.000.000.000.000.010.010.010.000.010.000.00
Mn(HQing)0.010.000.040.030.000.000.000.000.000.000.010.020.010.040.000.000.000.000.00
Hg(HQing)0.000.000.000.000.000.000.000.000.000.000.000.000.000.000.000.000.000.000.00
Ba(HQderm)0.000.000.000.000.000.000.000.000.000.000.000.000.000.000.000.000.000.000.00
Co(HQderm)0.000.000.000.000.000.000.000.000.000.000.000.000.000.000.000.000.000.000.00
Cu(HQderm)0.000.000.000.000.000.000.000.000.000.000.000.000.000.000.000.000.000.000.00
Fe(HQderm)0.000.000.000.000.000.000.000.000.000.000.000.000.000.000.000.000.000.000.00
Mn(HQderm)0.000.000.010.000.000.000.000.000.000.000.000.000.000.010.000.000.000.000.00
Hg(HQderm)0.000.000.000.000.000.000.010.010.010.000.000.010.000.000.000.000.000.040.01
HI0.120.120.180.190.180.250.090.140.270.100.110.150.130.180.120.160.210.370.13
Disclaimer/Publisher’s Note: The statements, opinions and data contained in all publications are solely those of the individual author(s) and contributor(s) and not of MDPI and/or the editor(s). MDPI and/or the editor(s) disclaim responsibility for any injury to people or property resulting from any ideas, methods, instructions or products referred to in the content.

