
Forecasting the Failure Time of an Expansive Soil Slope Using Digital Image Correlation under Rainfall Infiltration Conditions
Abstract
:Highlights
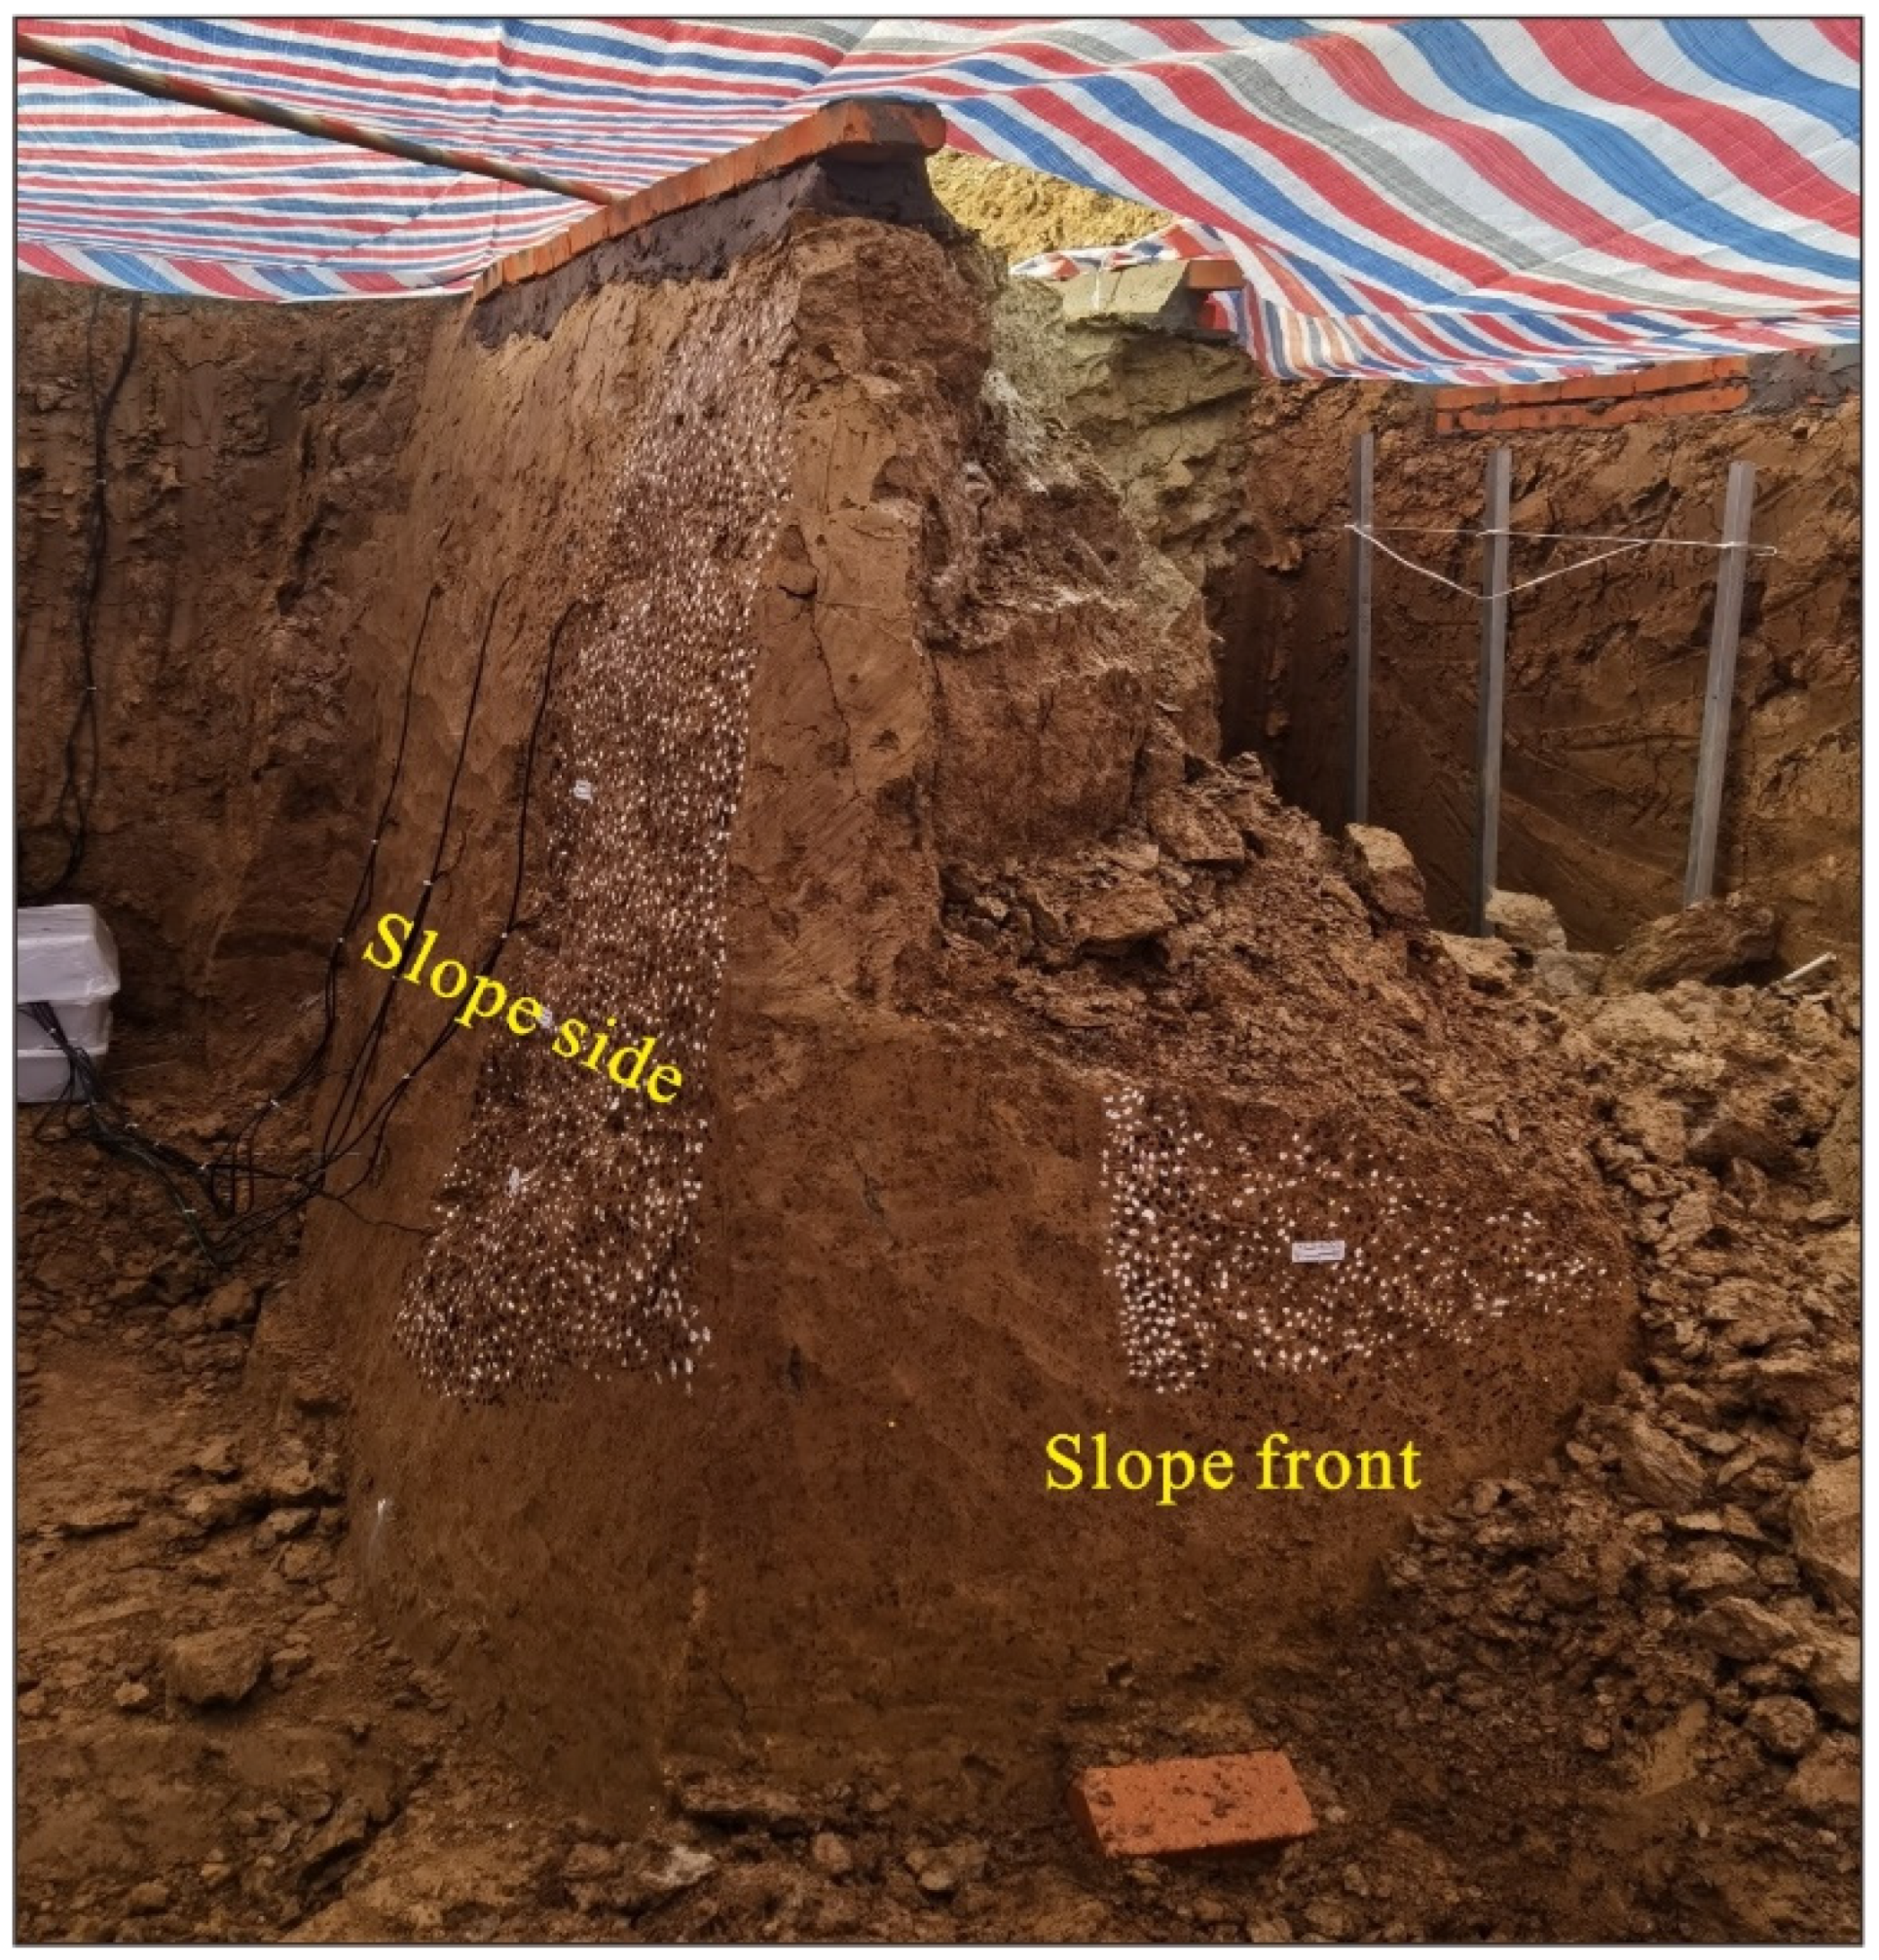
- Digital image correlation (DIC) method was applied to monitor the slope surface deformation and crack development.
- Deformation and failure processes of the expansive soil slope had an obvious crack control effect.
- The SLO method should be preferentially used to forecast the failure of expansive soil slopes with “step-like” displacement.
- The main findings are helpful for forecasting expansive soil landslides and providing guidance for controlling landslide hazards in expansive soil areas.
Abstract
1. Introduction
2. Method
2.1. DIC Method
2.2. Landslide Forecast Model Based on Surface Displacement
2.2.1. INV Model
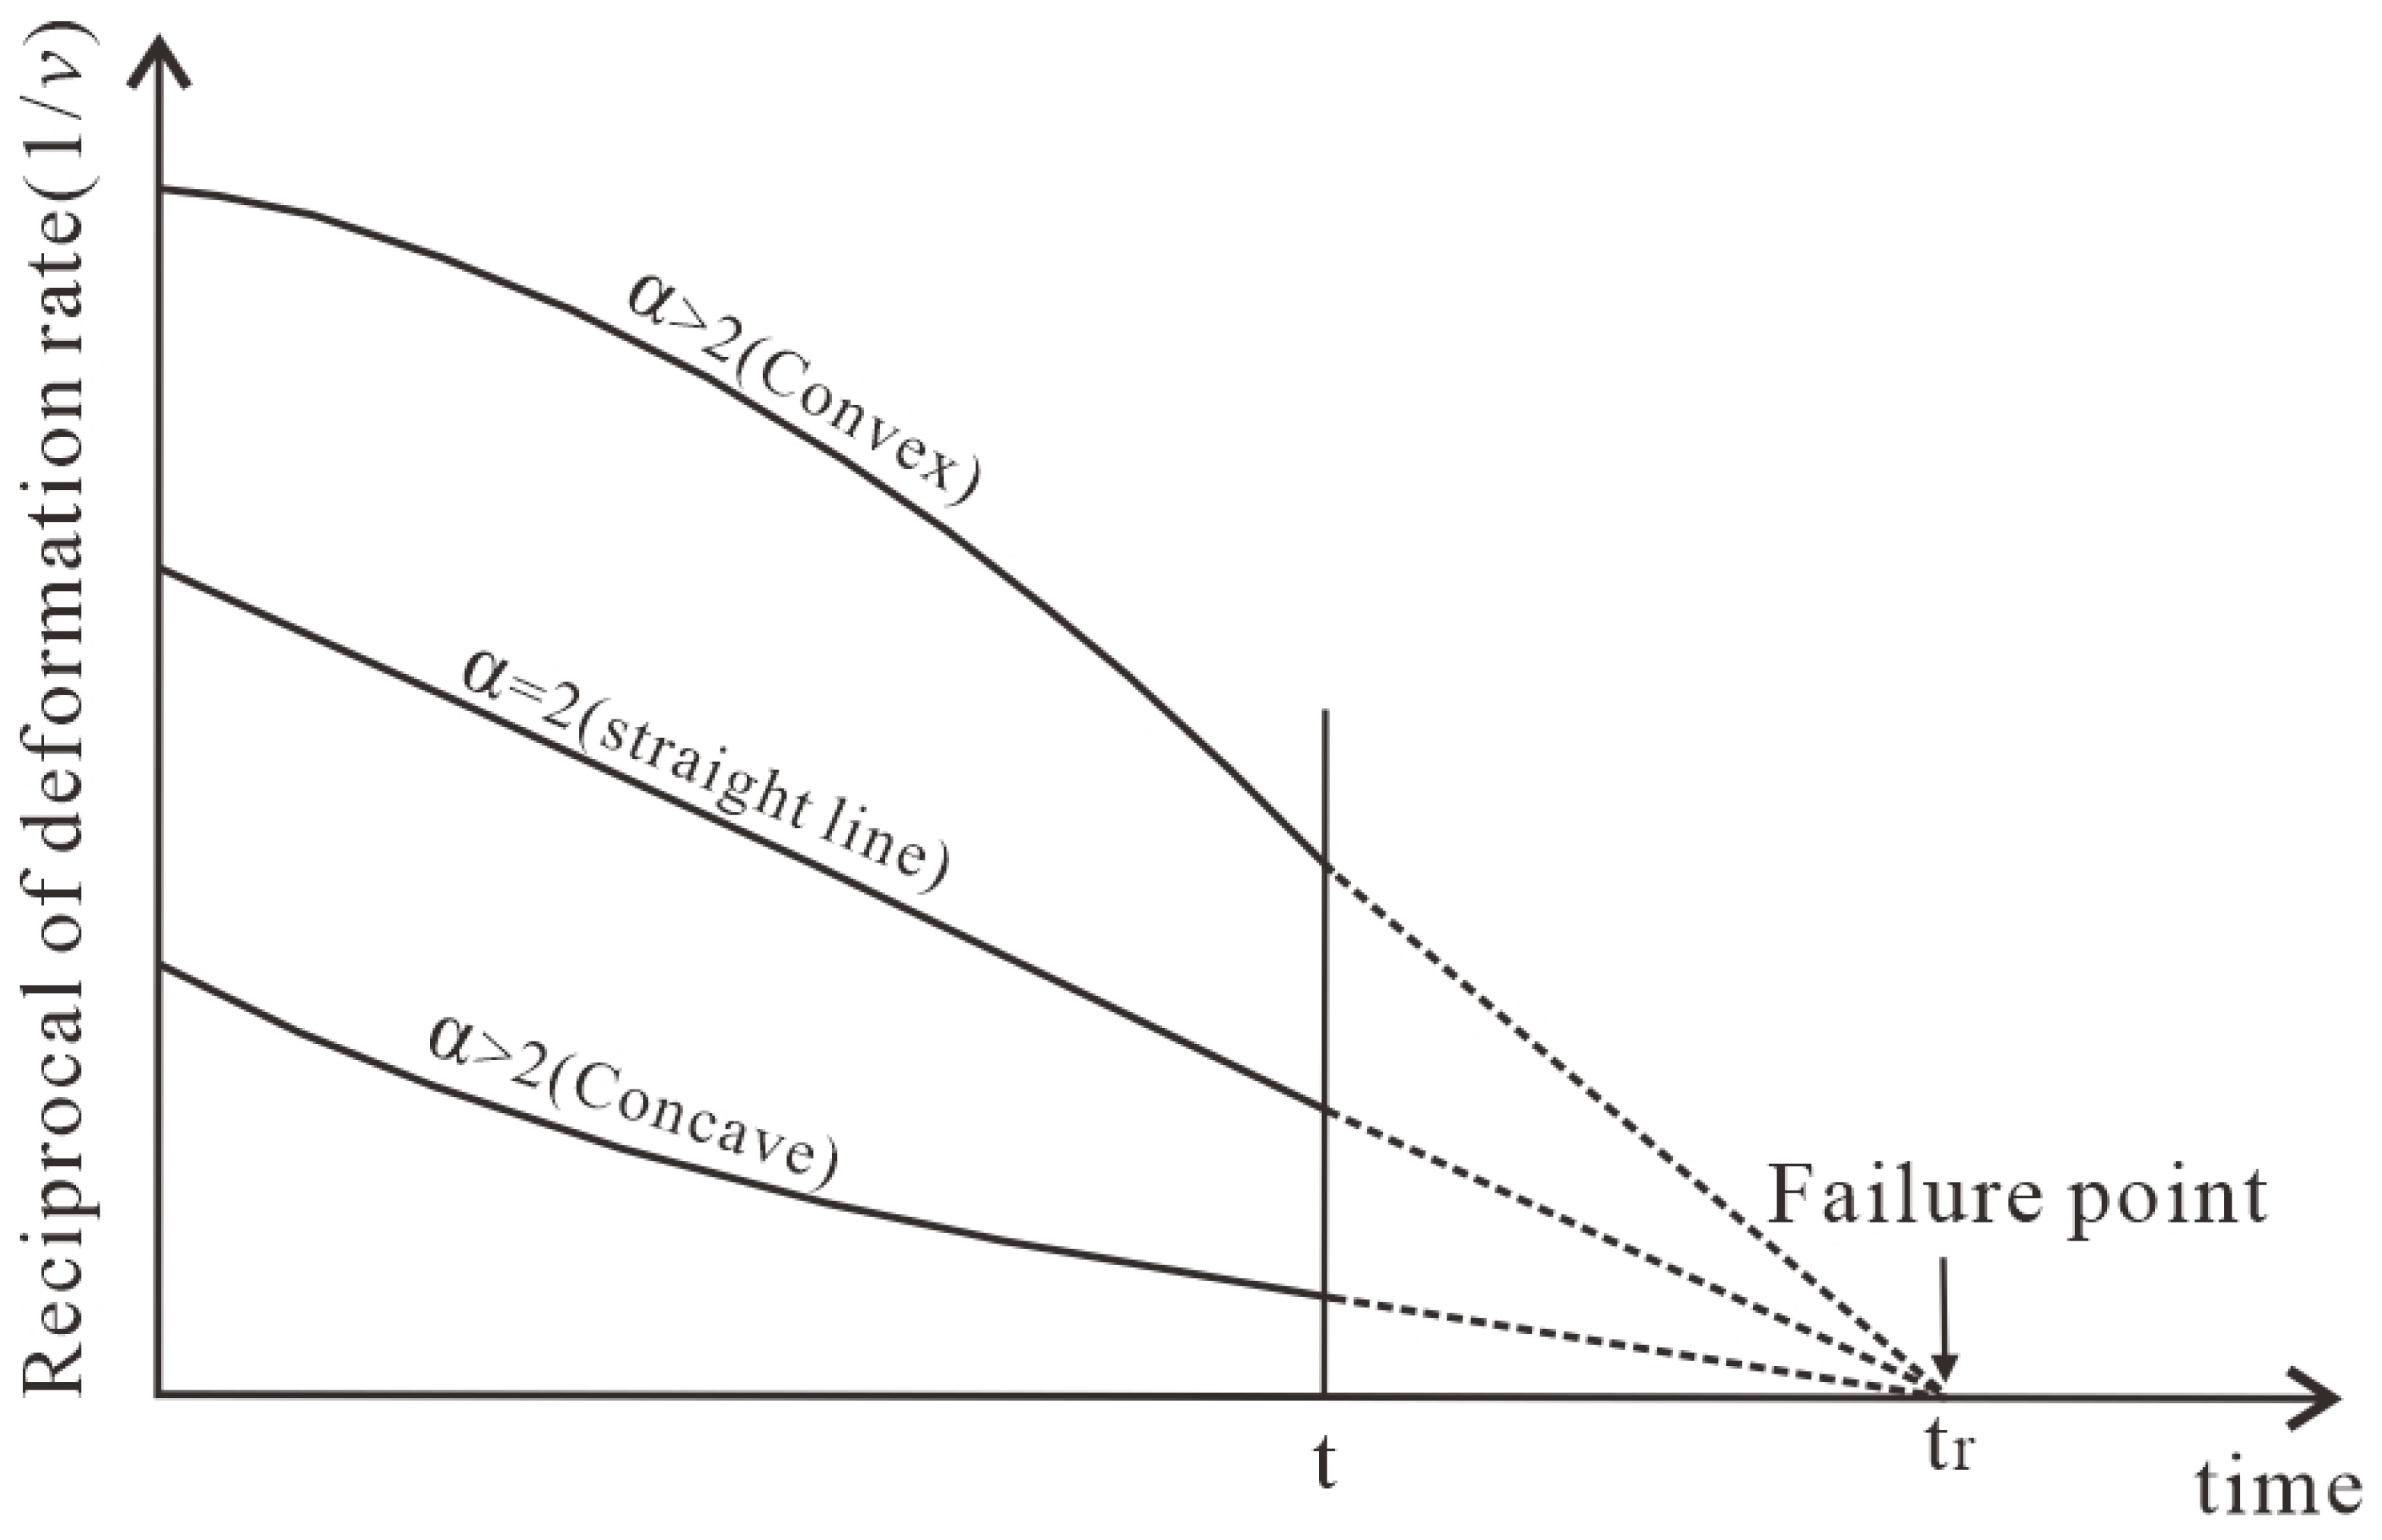
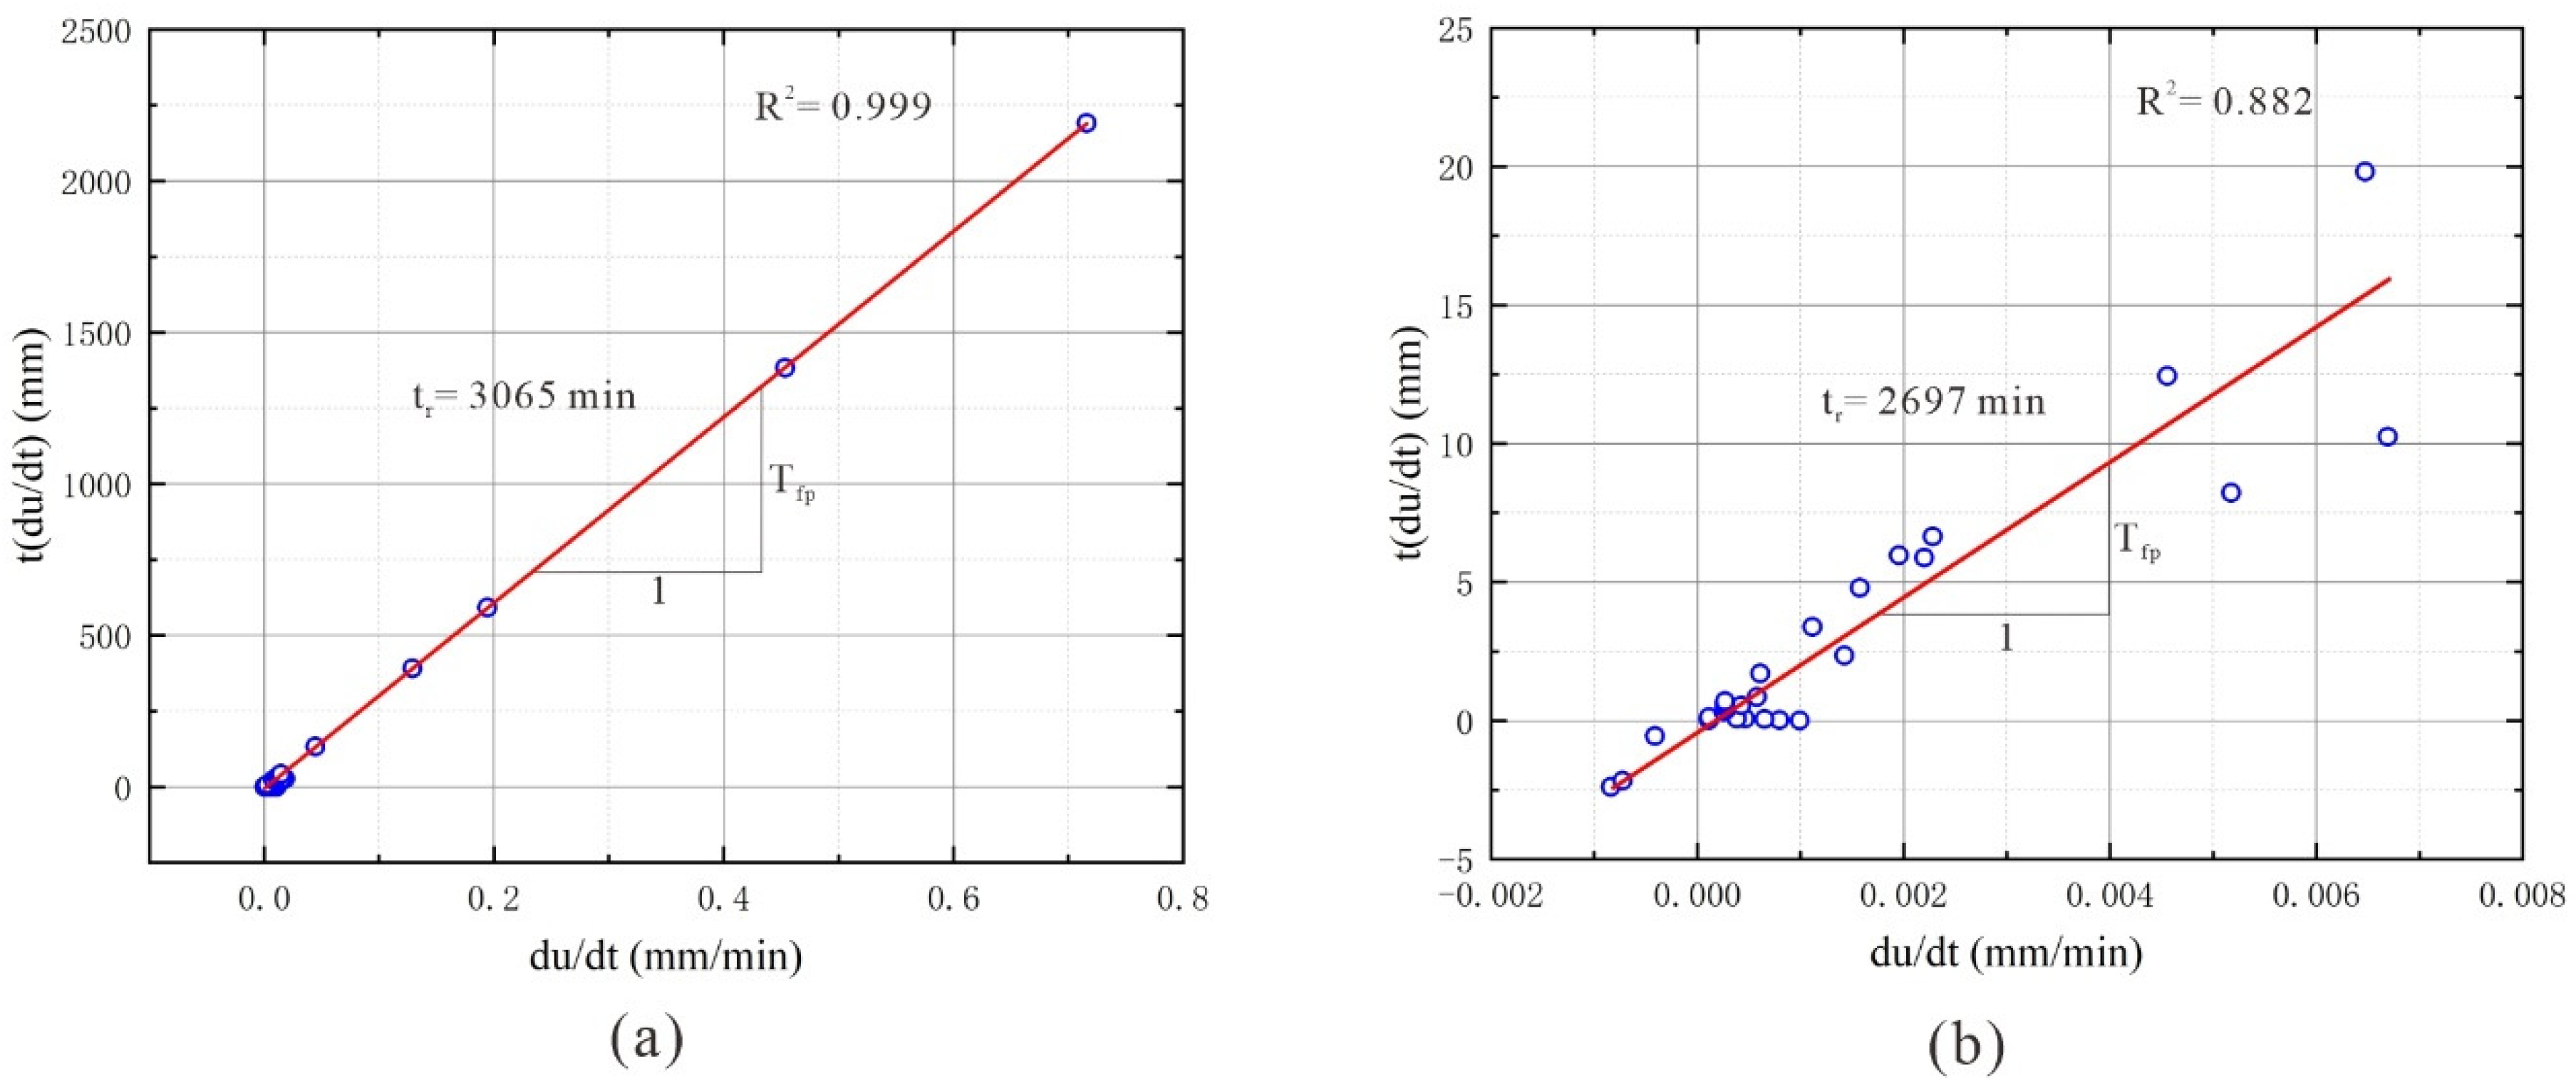
2.2.2. SLO Model
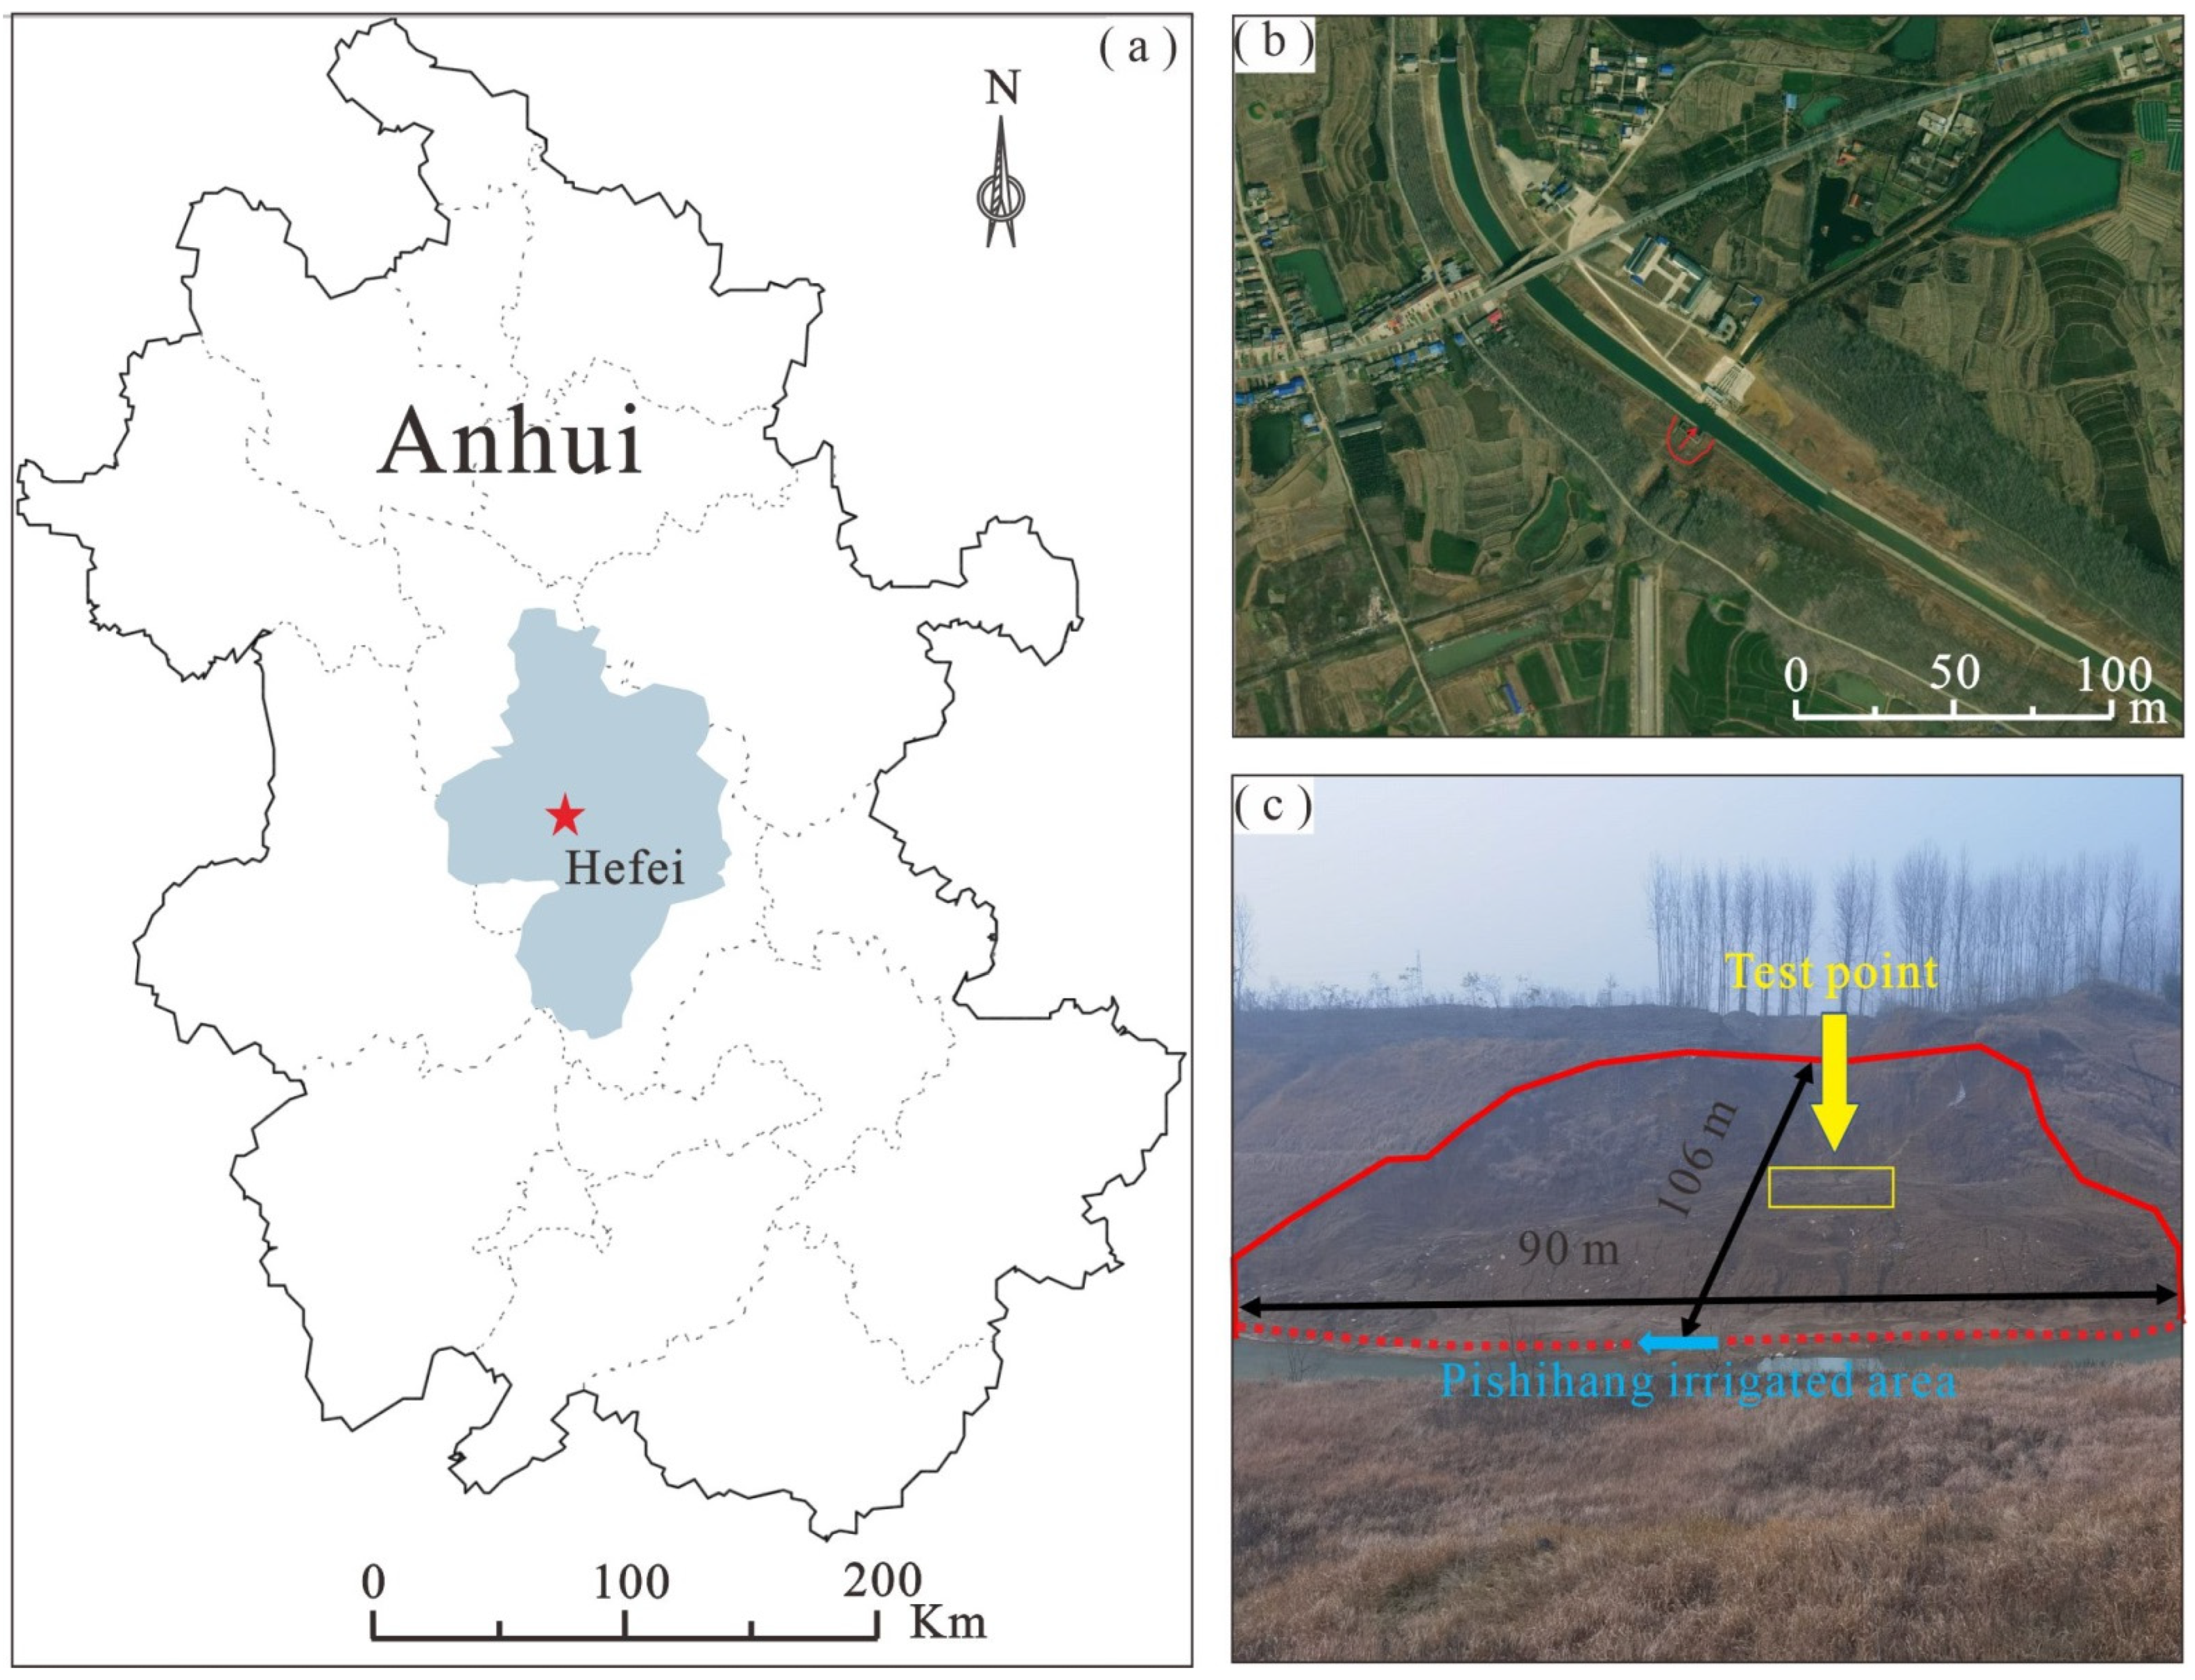
2.3. Overview of the Study Area
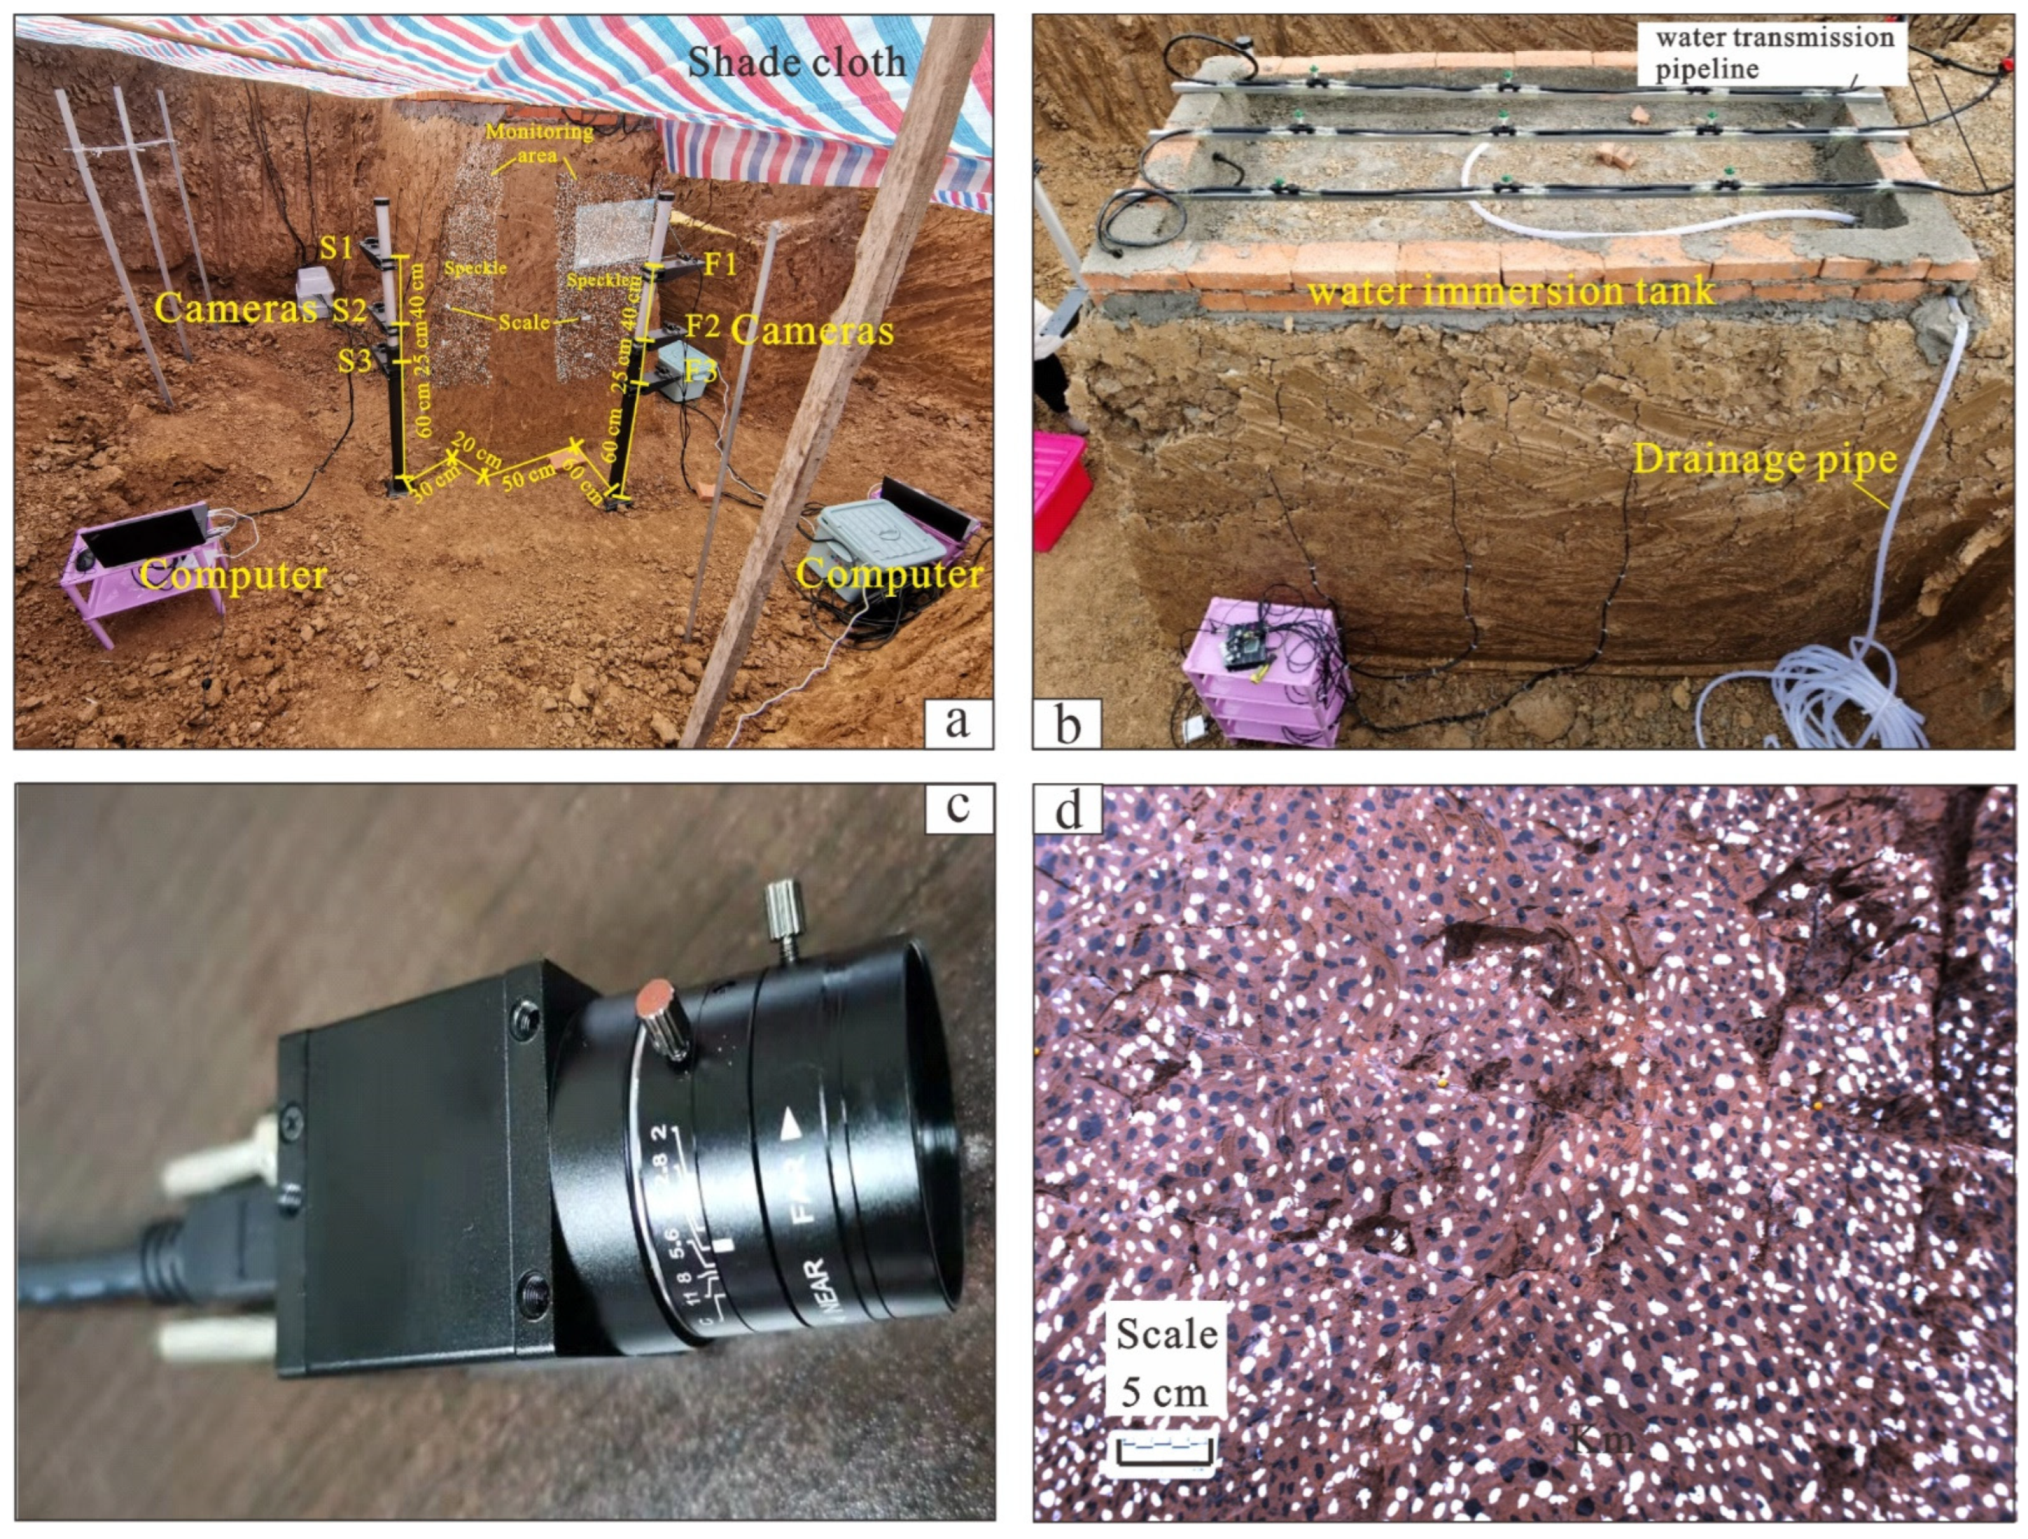
2.4. Testing Equipment
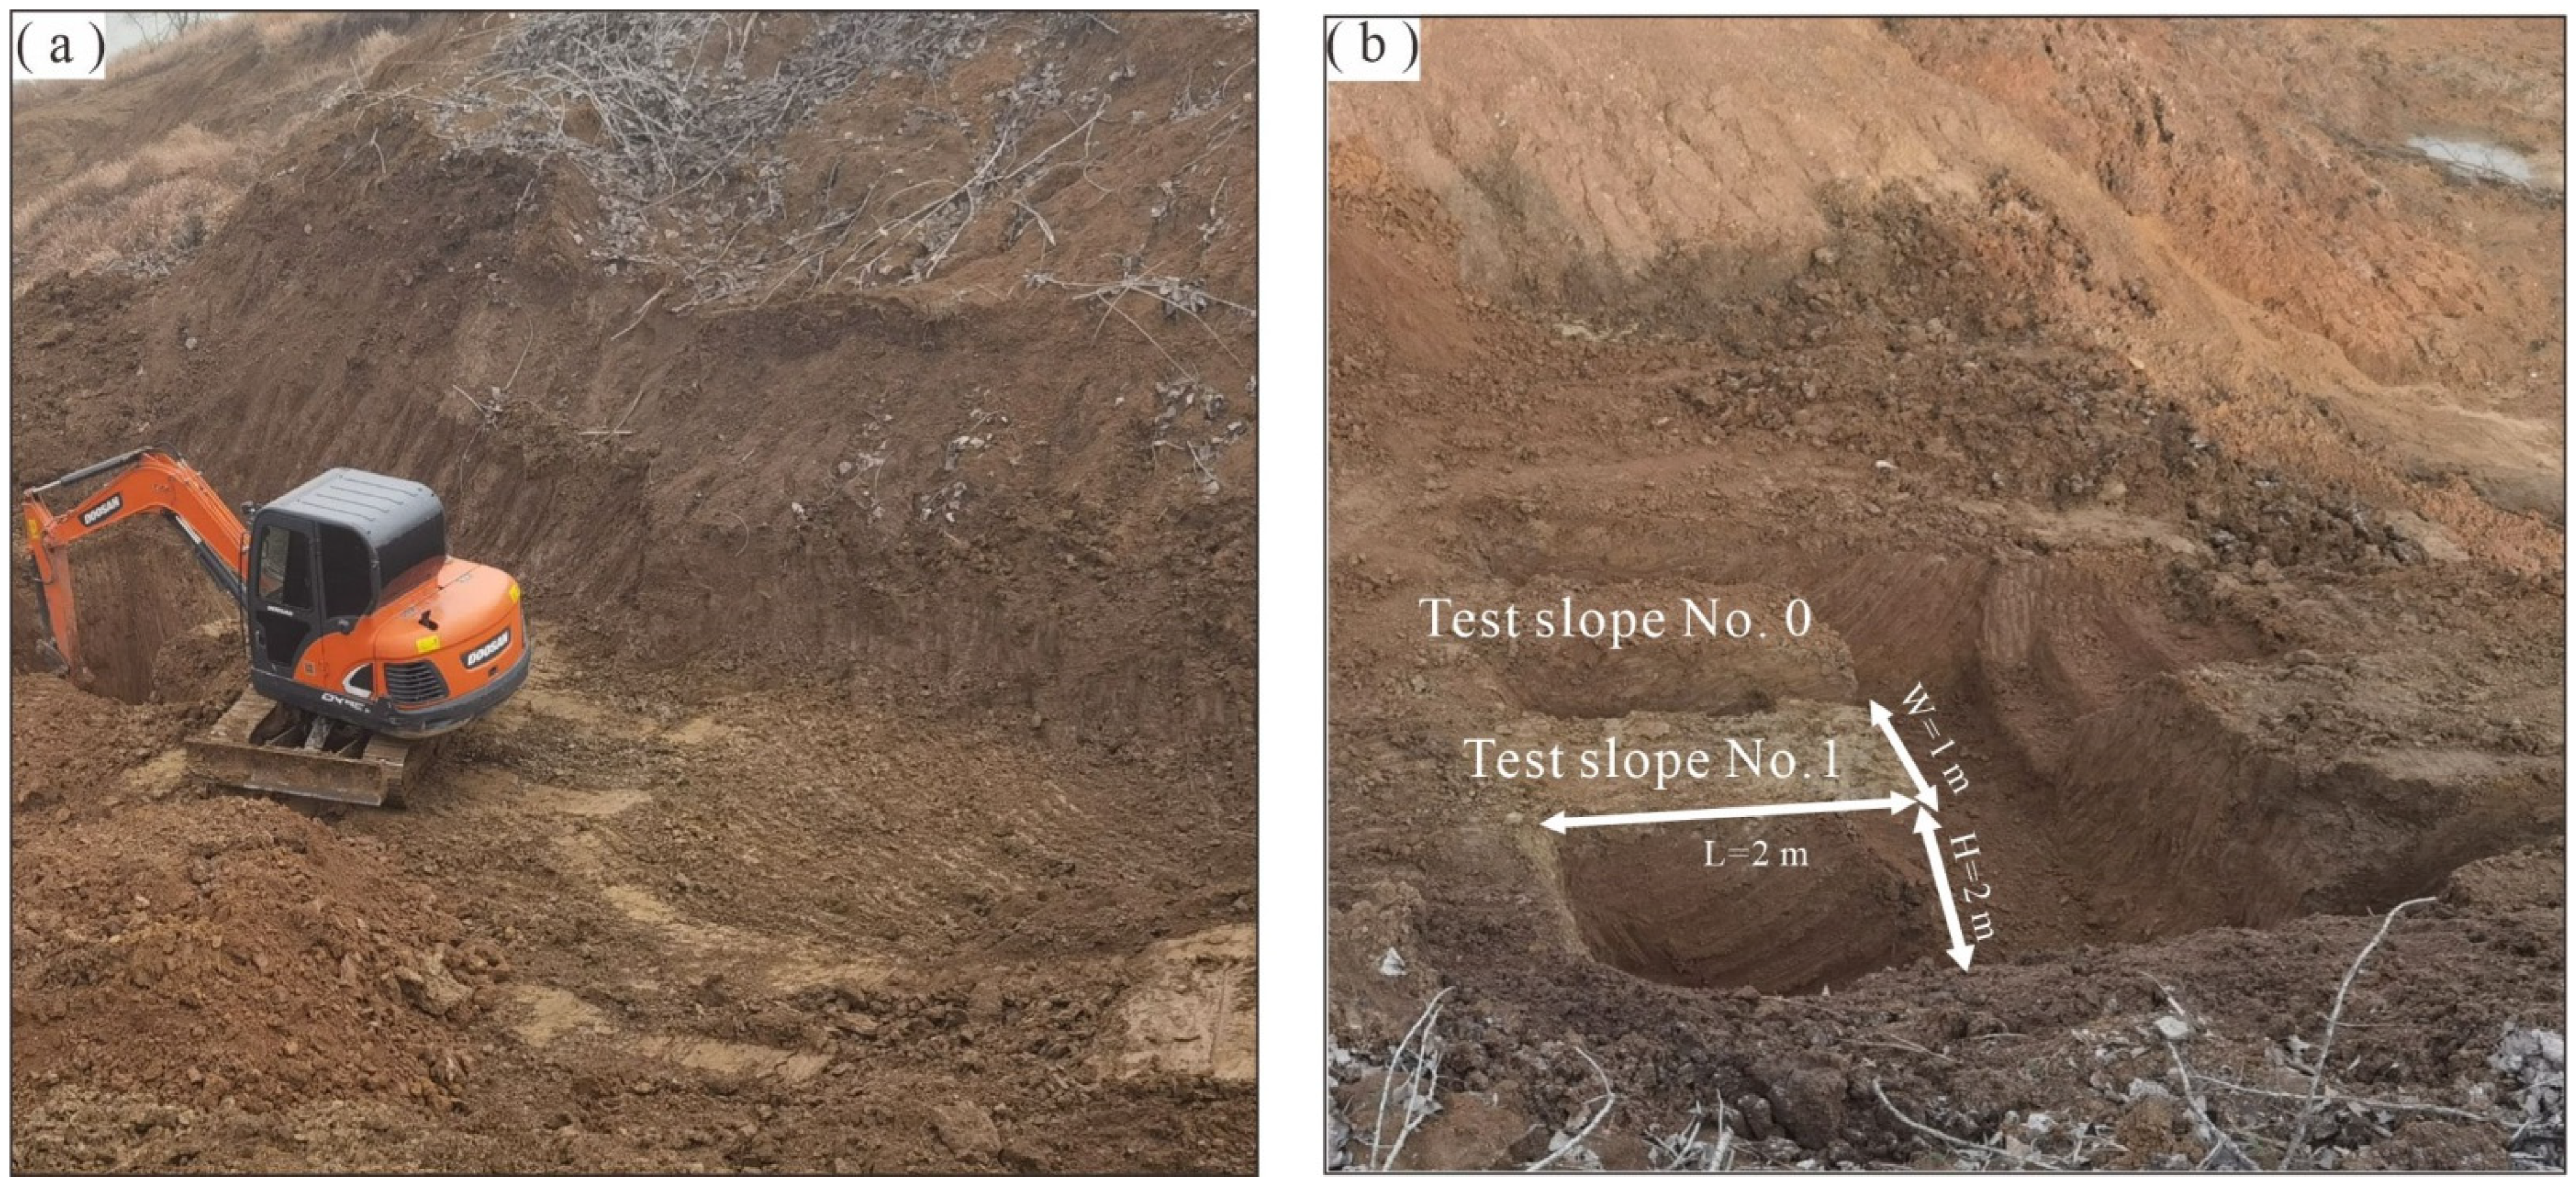
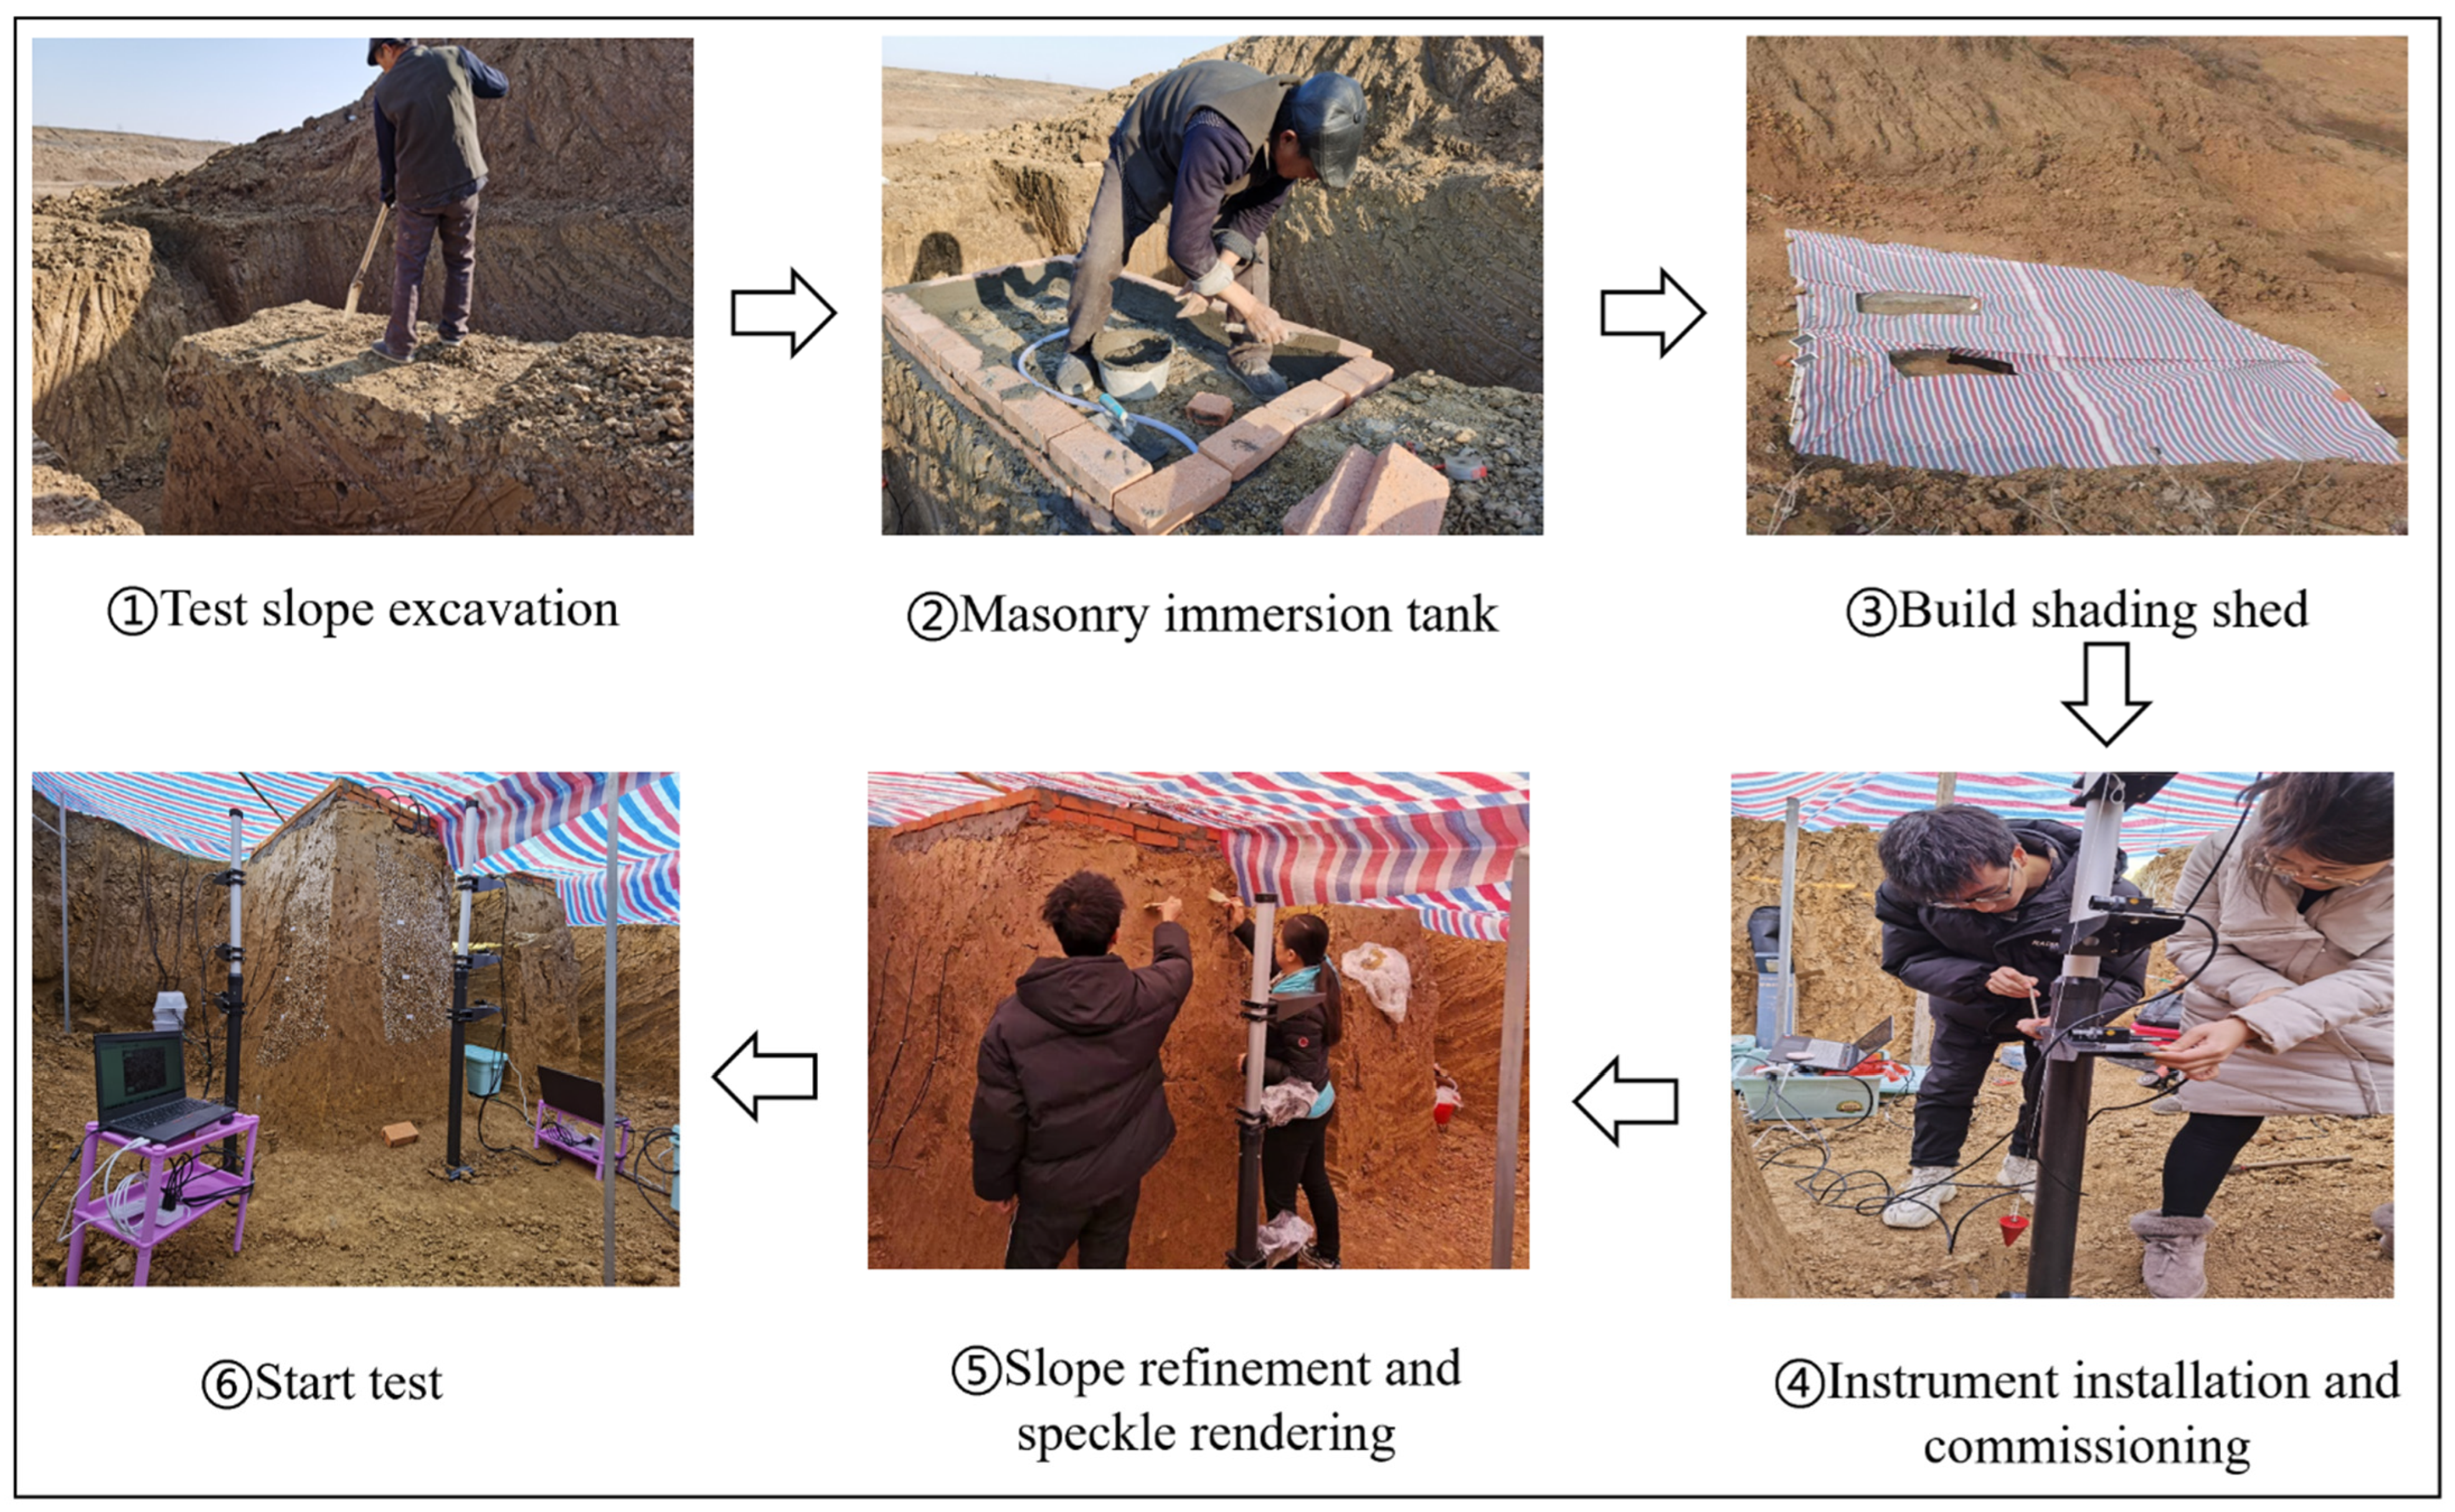
2.5. Test Scheme and Process
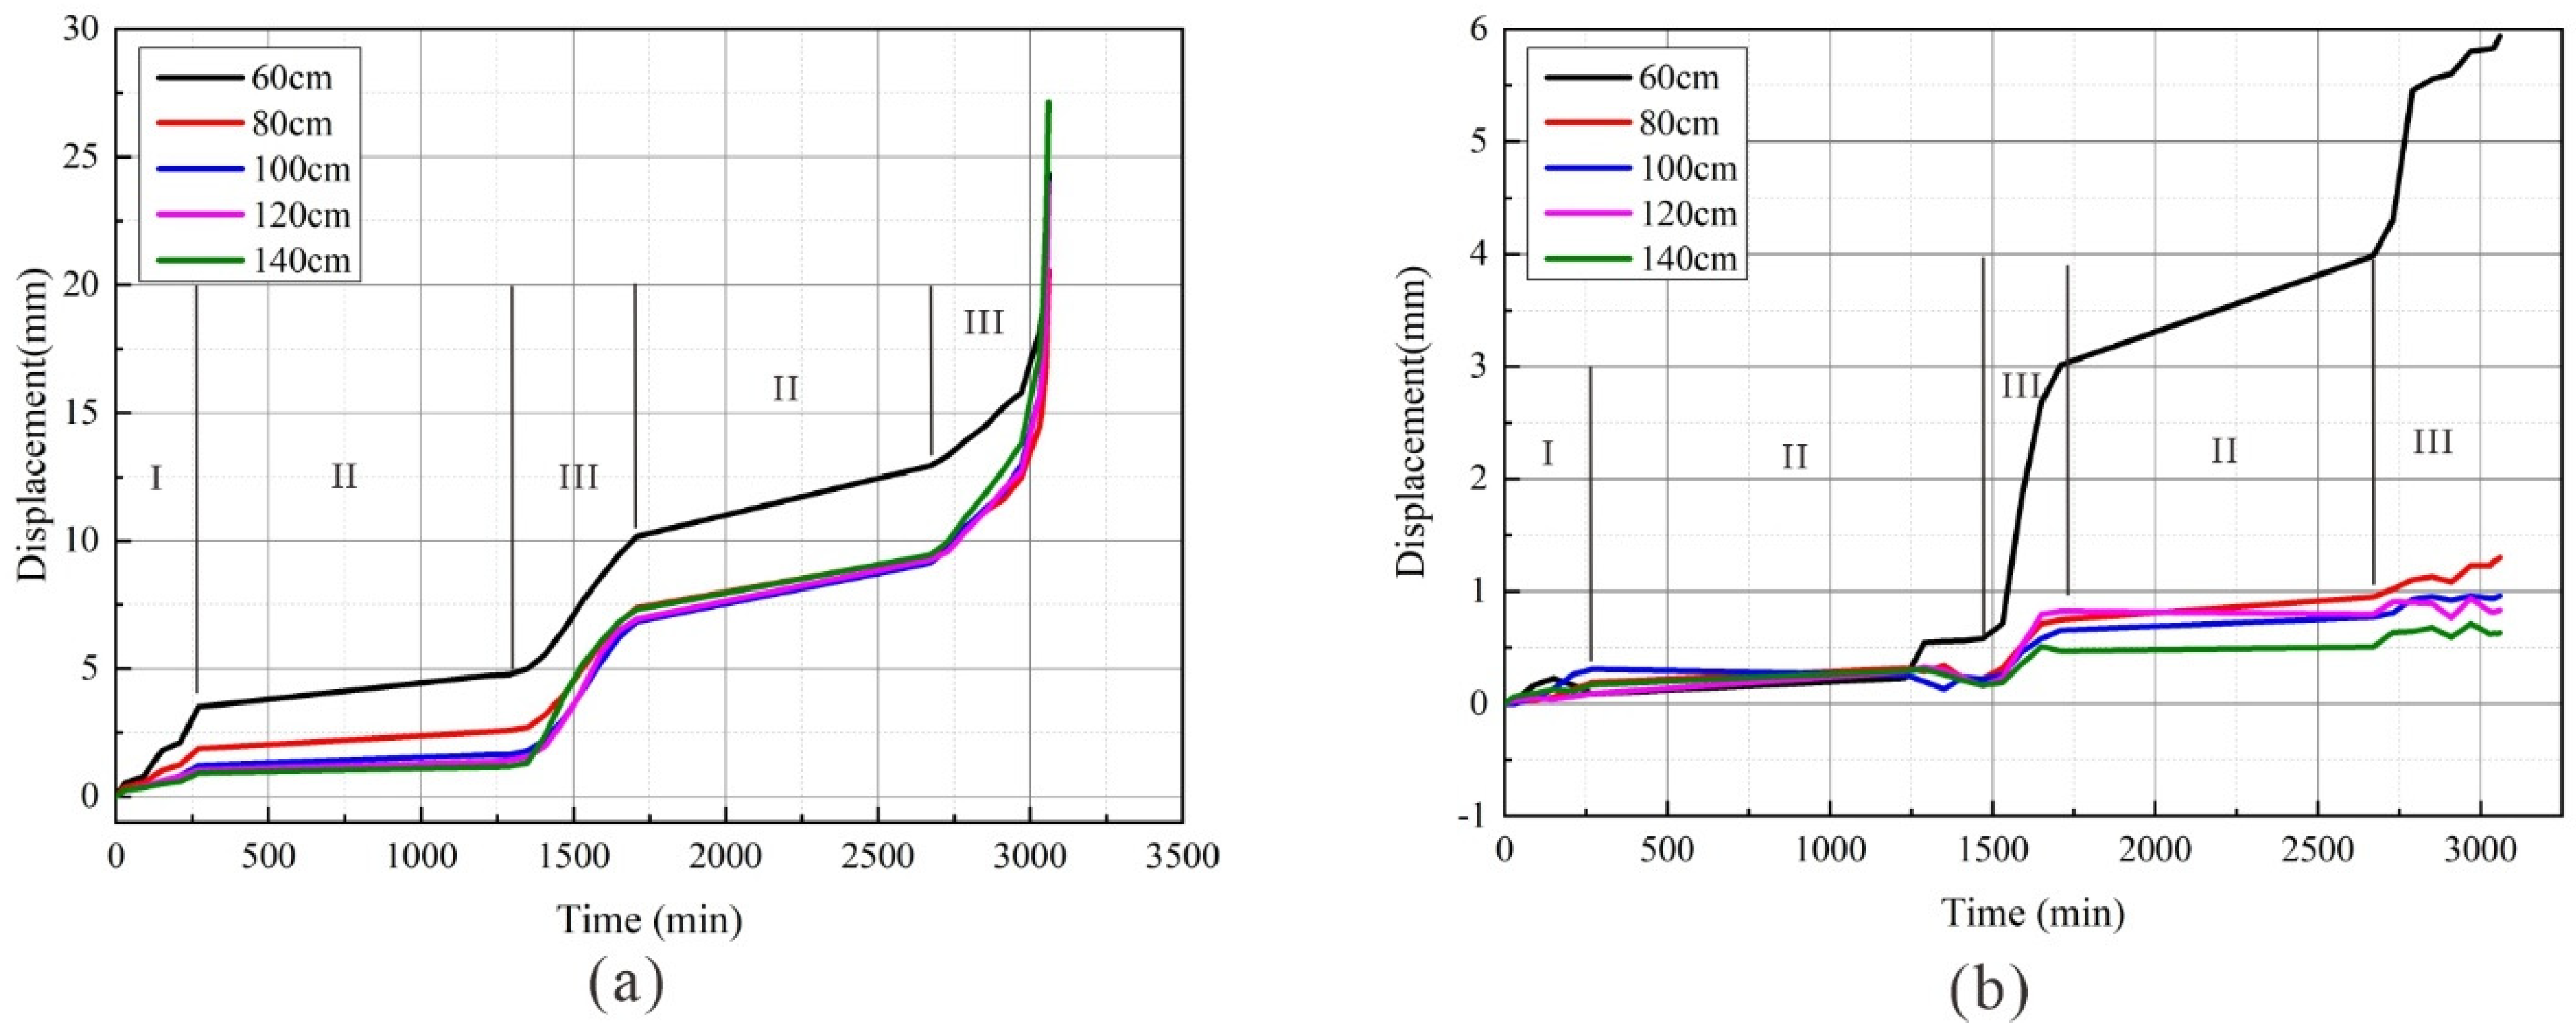
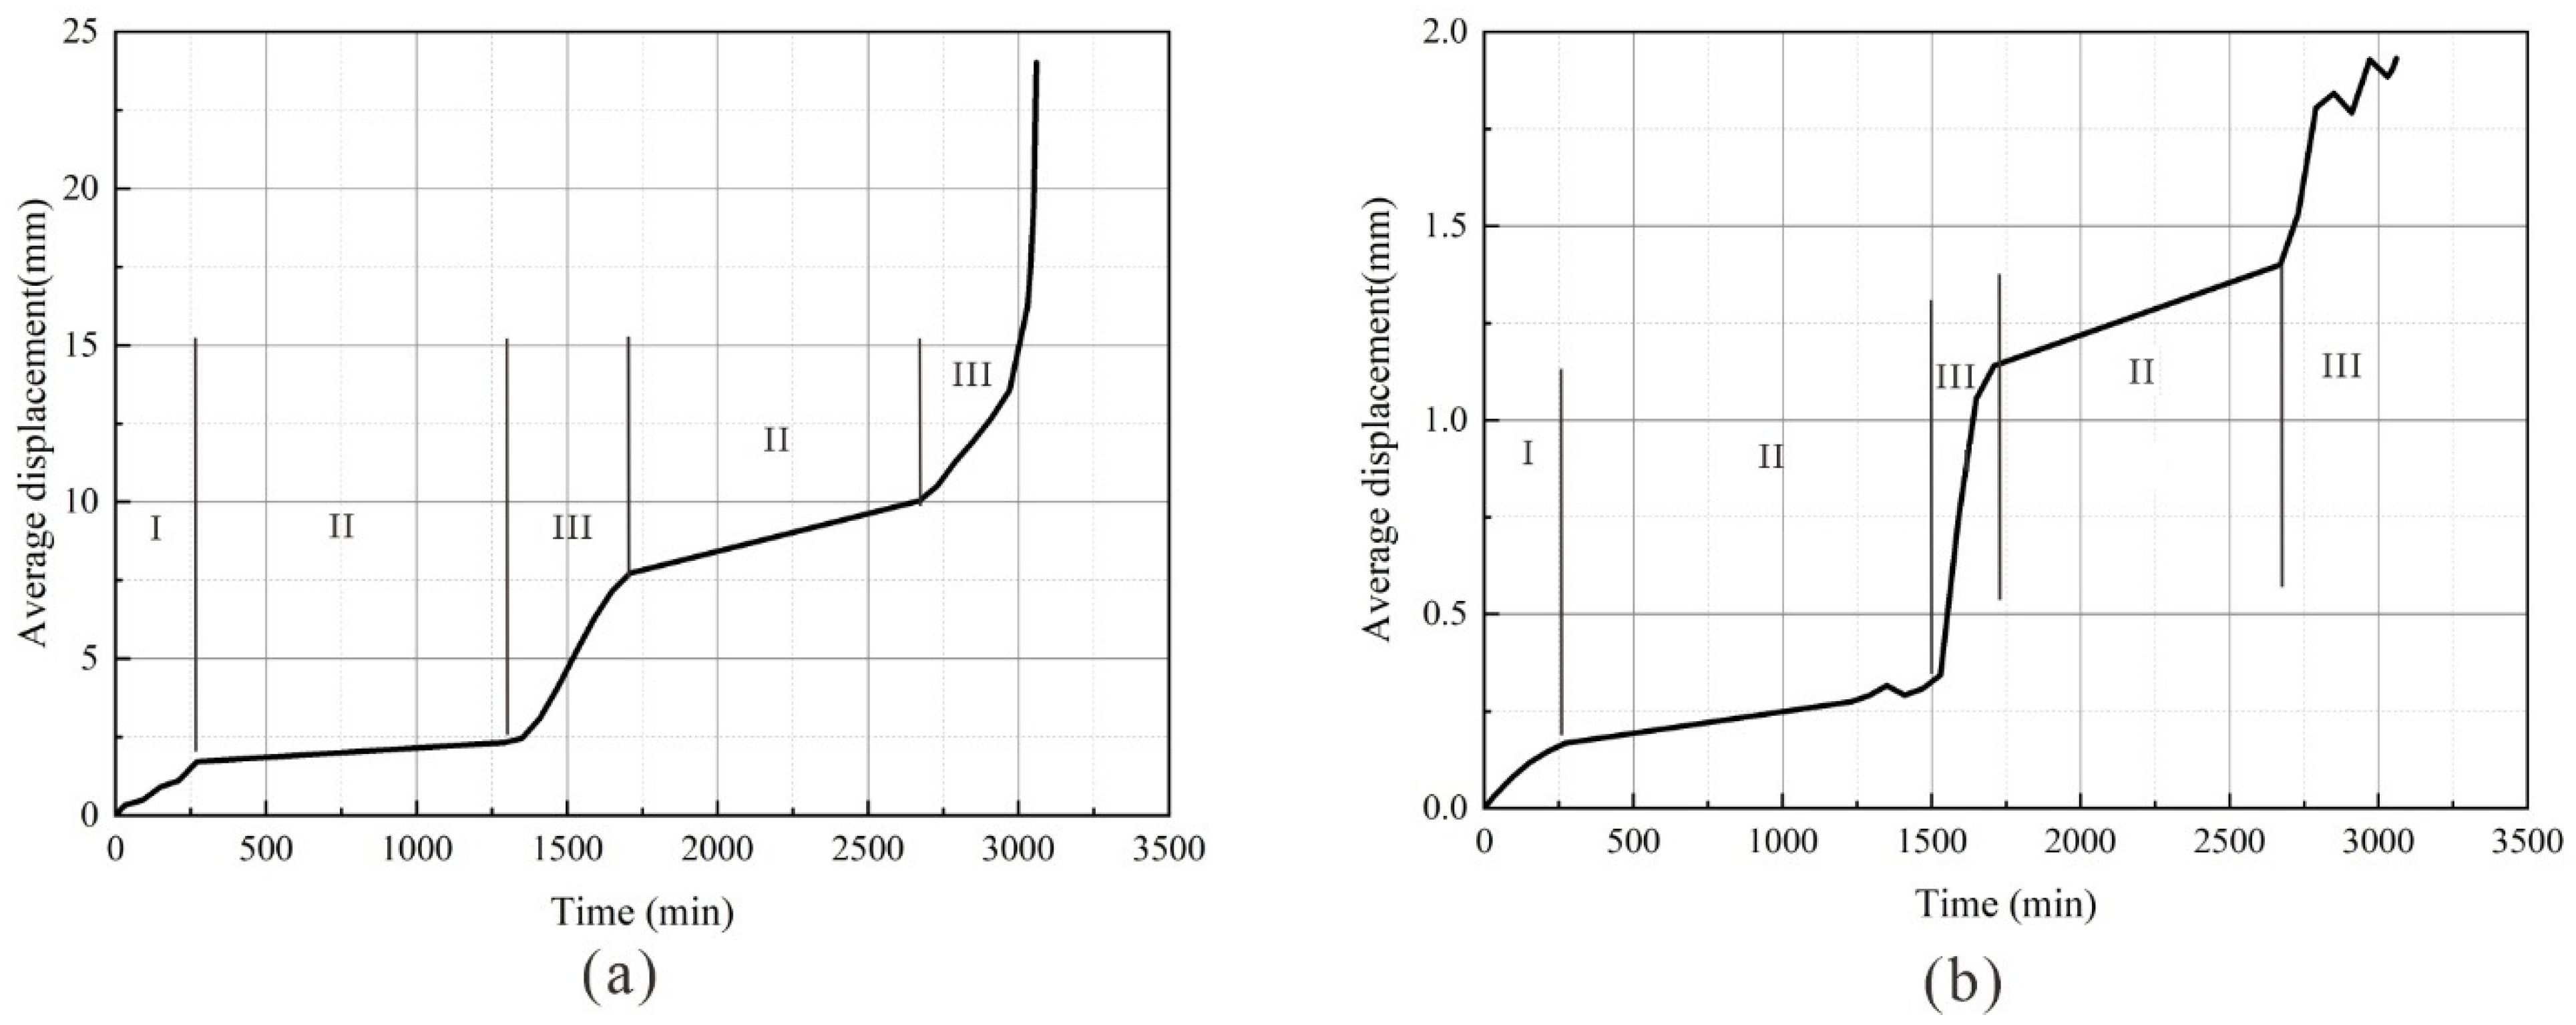
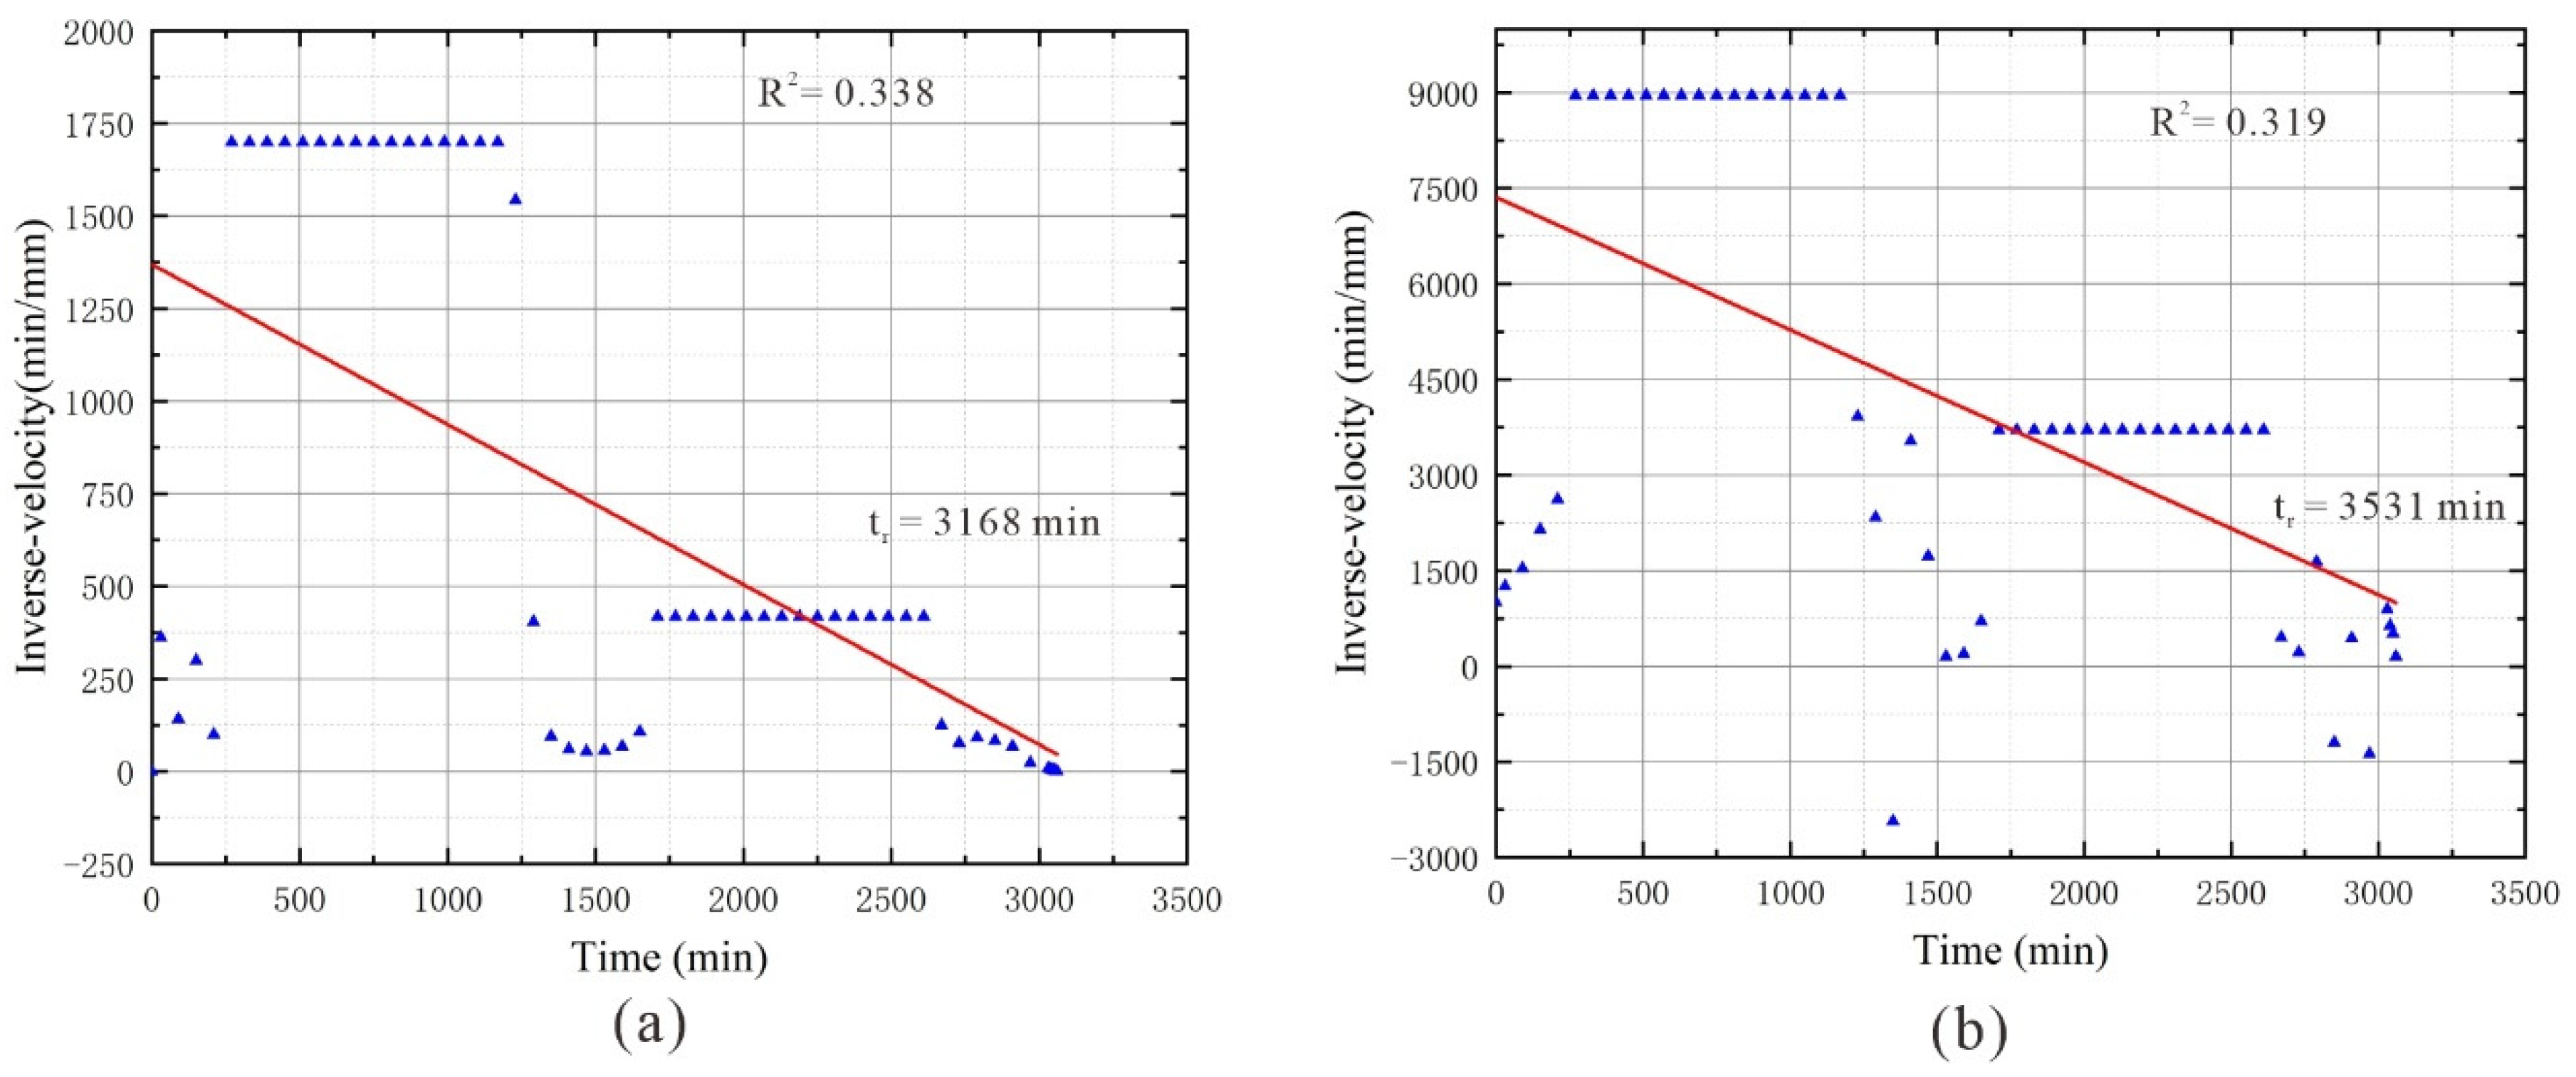
3. Results
4. Discussion
5. Conclusions
Author Contributions
Funding
Data Availability Statement
Acknowledgments
Conflicts of Interest
References
- Ikeagwuani, C.C.; Nwonu, D.C. Emerging trends in expansive soil stabilisation: A review. J. Rock Mech. Geotech. Eng. 2019, 11, 423–440. [Google Scholar] [CrossRef]
- Steinberg, M. Expansive soils and the geomembrane remedy. In Advances in Unsaturated Geotechnics; ASCE: Reston, VA, USA, 2000; pp. 456–466. [Google Scholar]
- Bilir, M.E.; Sarıgül, G. Stability assessment of Terzili tunnel in swelling rock mass. Arab. J. Geosci. 2021, 14, 965. [Google Scholar] [CrossRef]
- Leng, T.; Tang, C.; Xu, D.; Li, Y.; Zhang, Y.; Wang, K.; Shi, B. Advance on the engineering geological characteristics of expansive soil. J. Eng. Geol. 2018, 26, 112–128. [Google Scholar] [CrossRef]
- Joshi, R.; Katti, R. Lateral pressure development under surcharges. In Proceedings of the Expansive Soils, Denver, CO, USA, 1 March 2011; pp. 227–241. [Google Scholar]
- Lin, B.; Cerato, A.B. Prediction of expansive soil swelling based on four micro-scale properties. Bull. Eng. Geol. Environ. 2012, 71, 71–78. [Google Scholar] [CrossRef]
- Preston, S.; Griffiths, B.; Young, I. An investigation into sources of soil crack heterogeneity using fractal geometry. Eur. J. Soil Sci. 1997, 48, 31–37. [Google Scholar] [CrossRef]
- Vogel, H.-J.; Hoffmann, H.; Roth, K. Studies of crack dynamics in clay soil: I. Experimental methods, results, and morphological quantification. Geoderma 2005, 125, 203–211. [Google Scholar] [CrossRef]
- Bao, C. Behavior of unsaturated soil and stability of expansive soil slope. Chin. J. Geotech. Eng. 2004, 26, 1–15. [Google Scholar]
- Cheng, Y.; Cheng, Z.; Zhang, Y. Centrifugal model tests on expansive soil slope under rainfall. Chin. J. Geotech. Eng. 2011, 33, 409–414. [Google Scholar]
- Kassiff, G.; Alpan, I. A Slope Failure in Swelling Clay. Can. Geotech. J. 1973, 10, 531–536. [Google Scholar] [CrossRef]
- Zhan, L.-t.; Ng, W.-w.C.; Bao, C.-G.; Gong, B.-W. Artificial rainfall infiltration tests on a well-instrumented unsaturated expansive soil slope. Rock Soil Mech. 2003, 24, 151–158. [Google Scholar]
- Dai, Z.; Chen, S.; Li, J. Physical model test of seepage and deformation characteristics of shallow expansive soil slope. Bull. Eng. Geol. Environ. 2020, 79, 4063–4078. [Google Scholar] [CrossRef]
- Galeandro, A.; Doglioni, A.; Simeone, V.; Šimůnek, J. Analysis of infiltration processes into fractured and swelling soils as triggering factors of landslides. Environ. Earth Sci. 2014, 71, 2911–2923. [Google Scholar] [CrossRef] [Green Version]
- George, A.M.; Chakraborty, S.; Das, J.T.; Pedarla, A.; Puppala, A.J. Understanding shallow slope failures on expansive soil embankments in north Texas using unsaturated soil property framework. In PanAm Unsaturated Soils 2017; ASCE: Reston, VA, USA, 2017; pp. 206–216. [Google Scholar] [CrossRef]
- Khan, M.S.; Hossain, S.; Ahmed, A.; Faysal, M. Investigation of a shallow slope failure on expansive clay in Texas. Eng. Geol. 2017, 219, 118–129. [Google Scholar] [CrossRef]
- Yang, Z.; Lv, J.; Shi, W.; Zhang, Q.; Lu, Z.; Zhang, Y.; Ling, X. Model Test Study on Stability Factors of Expansive Soil Slopes with Different Initial Slope Ratios under Freeze-Thaw Conditions. Appl. Sci. 2021, 11, 8480. [Google Scholar] [CrossRef]
- Yang, Z.; Zhang, L.; Ling, X.; Li, G.; Tu, Z.; Shi, W. Experimental study on the dynamic behavior of expansive soil in slopes under freeze-thaw cycles. Cold Reg. Sci. Technol. 2019, 163, 27–33. [Google Scholar] [CrossRef]
- Pei, P.; Zhao, Y.; Ni, P.; Mei, G. A protective measure for expansive soil slopes based on moisture content control. Eng. Geol. 2020, 269, 105527. [Google Scholar] [CrossRef]
- Xie, C.; Ni, P.; Xu, M.; Mei, G.; Zhao, Y. Combined measure of geometry optimization and vegetation for expansive soil slopes. Comput. Geotech. 2020, 123, 103588. [Google Scholar] [CrossRef]
- Reddy, P.S.; Mohanty, B.; Rao, B.H. Investigations for Chemical Parameters Effect on Swelling Characteristics of Expansive Soils. KSCE J. Civ. Eng. 2021, 25, 4088–4105. [Google Scholar] [CrossRef]
- Toksöz Hozatlıoğlu, D.; Yılmaz, I. Shallow mixing and column performances of lime, fly ash and gypsum on the stabilization of swelling soils. Eng. Geol. 2021, 280, 105931. [Google Scholar] [CrossRef]
- Zheng, S.; Yao, H.; Ge, X. Analysis of saturated and unsaturated seepage of cracked expansive soil. Rock Soil Mech. 2007, 28, 281–285. [Google Scholar] [CrossRef]
- Kaiyu, R.; Xin, Y.; Xiaoming, Z.; Zhenkai, Z.; Lingjing, L. Study of landslide failure prediction based on TS-InSAR, GPS and image offset monitoring. Chin. J. Rock Mech. Eng. 2020, 39, 3421–3431. [Google Scholar] [CrossRef]
- Saito, M. Forecasting time of slope failure by tertiary creep. In Proceedings of the 7th International Conference on Soil Mechanics and Foundation Engineering, Mexico City, Mexico, 1 January 1969; pp. 677–683. [Google Scholar]
- Fukuzono, T. A method for predicting the failure time of a sandy soil slope using the inverse number of velocity. In Proceedings of the 23rd Meeting of Japan Landslide Society, Tokyo, Japan, 2 July 1984; pp. 80–81. [Google Scholar]
- Mufundirwa, A.; Fujii, Y.; Kodama, J. A new practical method for prediction of geomechanical failure-time. Int. J. Rock Mech. Min. Sci. 2010, 47, 1079–1090. [Google Scholar] [CrossRef] [Green Version]
- Miao, F.; Wu, Y.; Xie, Y.; Li, Y. Prediction of landslide displacement with step-like behavior based on multialgorithm optimization and a support vector regression model. Landslides 2018, 15, 475–488. [Google Scholar] [CrossRef]
- Peters, W.; Ranson, W. Digital Imaging Techniques In Experimental Stress Analysis. Opt. Eng. 1982, 21, 213427. [Google Scholar] [CrossRef]
- Feng, T.; Liu, X.; Scaioni, M.; Lin, X.; Li, R. Real-time landslide monitoring using close-range stereo image sequences analysis. In Proceedings of the 2012 International Conference on Systems and Informatics (ICSAI2012), Yantai, China, 19–20 May 2012; pp. 249–253. [Google Scholar]
- Liu, W.-C.; Huang, W.-C. Close range digital photogrammetry applied to topography and landslide measurements. ISPRS Int. Arch. Photogramm. Remote Sens. Spat. Inf. Sci. 2016, XLI-B5, 875–880. [Google Scholar] [CrossRef] [Green Version]
- Travelletti, J.; Delacourt, C.; Allemand, P.; Malet, J.P.; Schmittbuhl, J.; Toussaint, R.; Bastard, M. Correlation of multi-temporal ground-based optical images for landslide monitoring: Application, potential and limitations. ISPRS J. Photogramm. Remote Sens. 2012, 70, 39–55. [Google Scholar] [CrossRef] [Green Version]
- Sharafisafa, M.; Aliabadian, Z.; Shen, L. Crack initiation and failure development in bimrocks using digital image correlation under dynamic load. Theor. Appl. Fract. Mech. 2020, 109, 102688. [Google Scholar] [CrossRef]
- Zhao, Y.; Wang, H.; Zhang, Q.; Xie, Y.; Yang, J. A study of landslide deformation field with digital correlation method. Chin. Sci. Bull. 2016, 61, 3163–3171. [Google Scholar] [CrossRef] [Green Version]
- Fukuzono, T. A new method for predicting the failure time of a slope. In Proceedings of the 4th International Conference and Field Workshop on Landslide, Tokyo, Japan, 23–31 August 1985; pp. 145–150. [Google Scholar]
- Jiming, Y.; Hongri, Z.; Lin, C.; Yongfu, X. Analysis of crack morphology evolution law of expansive soil slope based on digital image correlation technology. J. Cent. South Univ. 2022, 53, 225–238. [Google Scholar]
- Xu, Q.; Yuan, Y.; Zeng, Y.; Hack, R. Some new pre-warning criteria for creep slope failure. Sci. China Technol. Sci. 2011, 54, 210–220. [Google Scholar] [CrossRef]
- Baer, J.; Kent, T.; Anderson, S. Image analysis and fractal geometry to characterize soil desiccation cracks. Geoderma 2009, 154, 153–163. [Google Scholar] [CrossRef]
- Peng, X.; Horn, R.; Peth, S.; Smucker, A. Quantification of soil shrinkage in 2D by digital image processing of soil surface. Soil Tillage Res. 2006, 91, 173–180. [Google Scholar] [CrossRef]
- Chen, G.; Tang, P.; Huang, R.; Wang, D.; Lin, Z.; Huang, D. Critical tension crack depth in rockslides that conform to the three-section mechanism. Landslides 2021, 18, 79–88. [Google Scholar] [CrossRef]


Disclaimer/Publisher’s Note: The statements, opinions and data contained in all publications are solely those of the individual author(s) and contributor(s) and not of MDPI and/or the editor(s). MDPI and/or the editor(s) disclaim responsibility for any injury to people or property resulting from any ideas, methods, instructions or products referred to in the content. |
© 2023 by the authors. Licensee MDPI, Basel, Switzerland. This article is an open access article distributed under the terms and conditions of the Creative Commons Attribution (CC BY) license (https://creativecommons.org/licenses/by/4.0/).
Share and Cite
Wei, X.; Gao, W.; Hu, R.; Gao, W.; Qiu, Y.; Li, Y. Forecasting the Failure Time of an Expansive Soil Slope Using Digital Image Correlation under Rainfall Infiltration Conditions. Water 2023, 15, 1328. https://doi.org/10.3390/w15071328
Wei X, Gao W, Hu R, Gao W, Qiu Y, Li Y. Forecasting the Failure Time of an Expansive Soil Slope Using Digital Image Correlation under Rainfall Infiltration Conditions. Water. 2023; 15(7):1328. https://doi.org/10.3390/w15071328
Chicago/Turabian StyleWei, Xueyun, Wenwei Gao, Ruilin Hu, Wei Gao, Yidi Qiu, and Yong Li. 2023. "Forecasting the Failure Time of an Expansive Soil Slope Using Digital Image Correlation under Rainfall Infiltration Conditions" Water 15, no. 7: 1328. https://doi.org/10.3390/w15071328