
A Pixel-Scale Measurement Method of Soil Moisture Using Ground-Penetrating Radar

Abstract
:1. Introduction
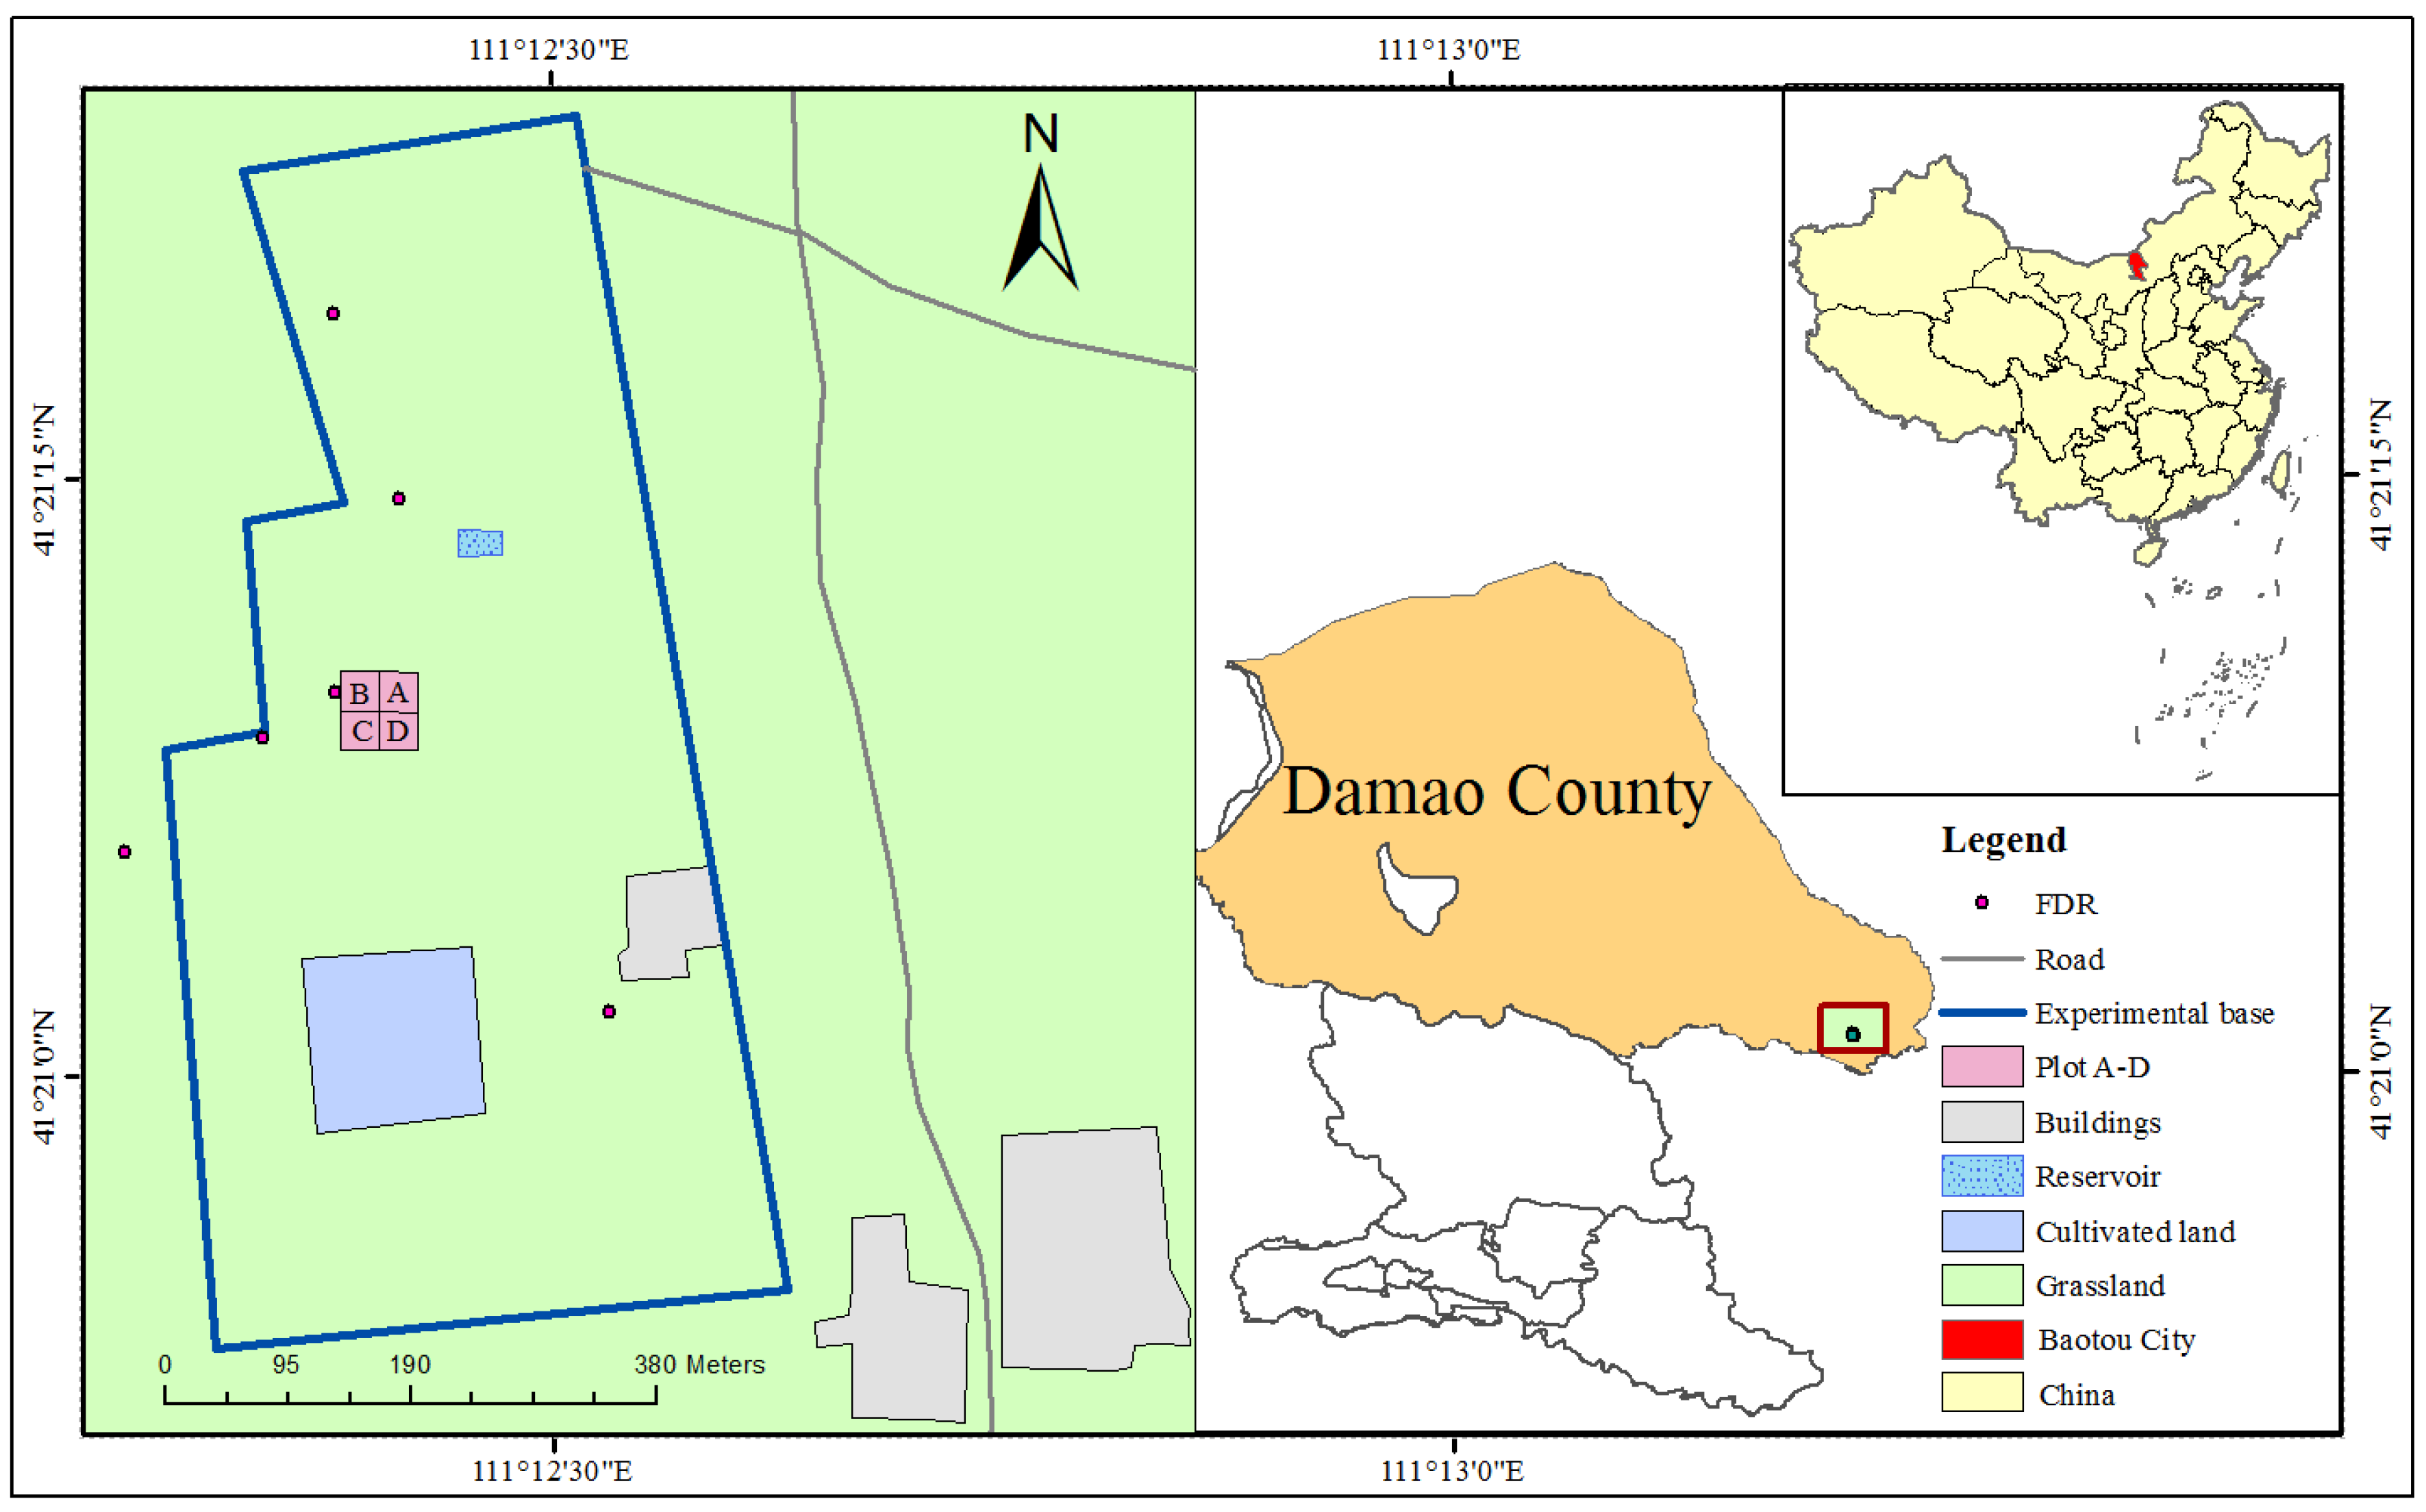
2. Study Area
3. Methodology
- According to the experiment design, GPR and the gravimetric method were both used to measure the soil moisture of four 30 × 30 m2 plots.
- Based on the measuring results, a random combination method was applied to analyze the influence of a different number and sampling design of GPR survey lines on the measurement accuracy at pixel scale. Then, the necessary number and appropriate sampling design were obtained, resulting in a pixel-scale measurement method of soil moisture by GPR.
- The random combination method and the statistical sampling were used to determine the necessary sampling sizes of point measurements by gravimetric method under different accuracy requirements, respectively. Additionally, the pixel-scale measurement method by GPR and the sampling method by point measurements were compared.
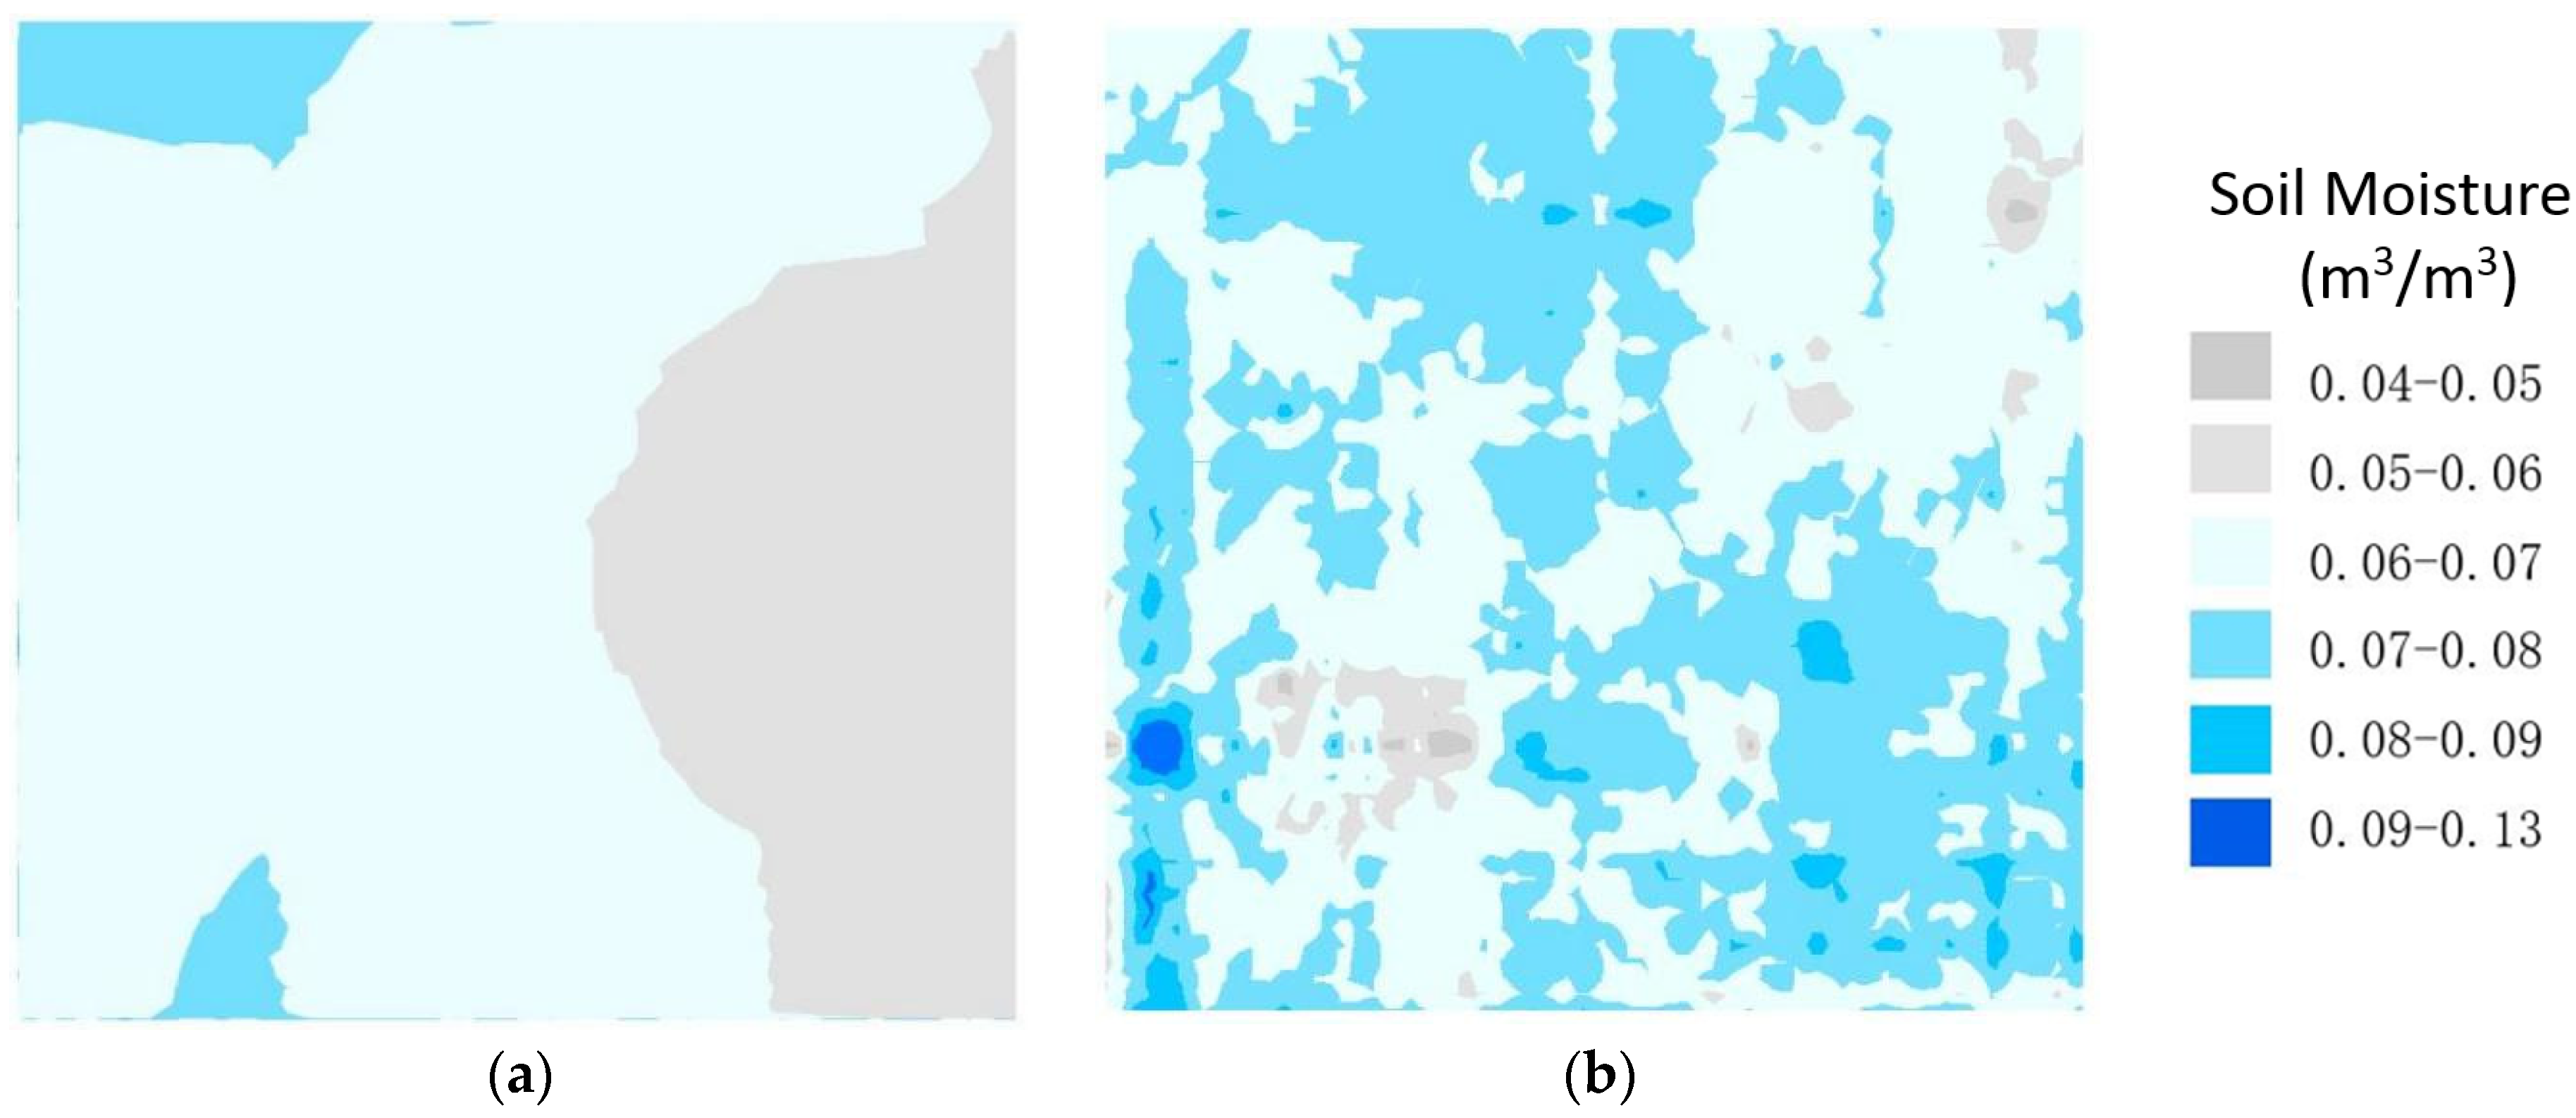
- The soil moisture by remote sensing in the study area was retrieved by Landsat 8 data, obtaining the soil moisture of Plots A–D. The pixel-scale measurement method by GPR and the sampling method by point measurements were used to validate the remote sensing soil moisture in four plots, and the validation effects were analyzed, respectively.
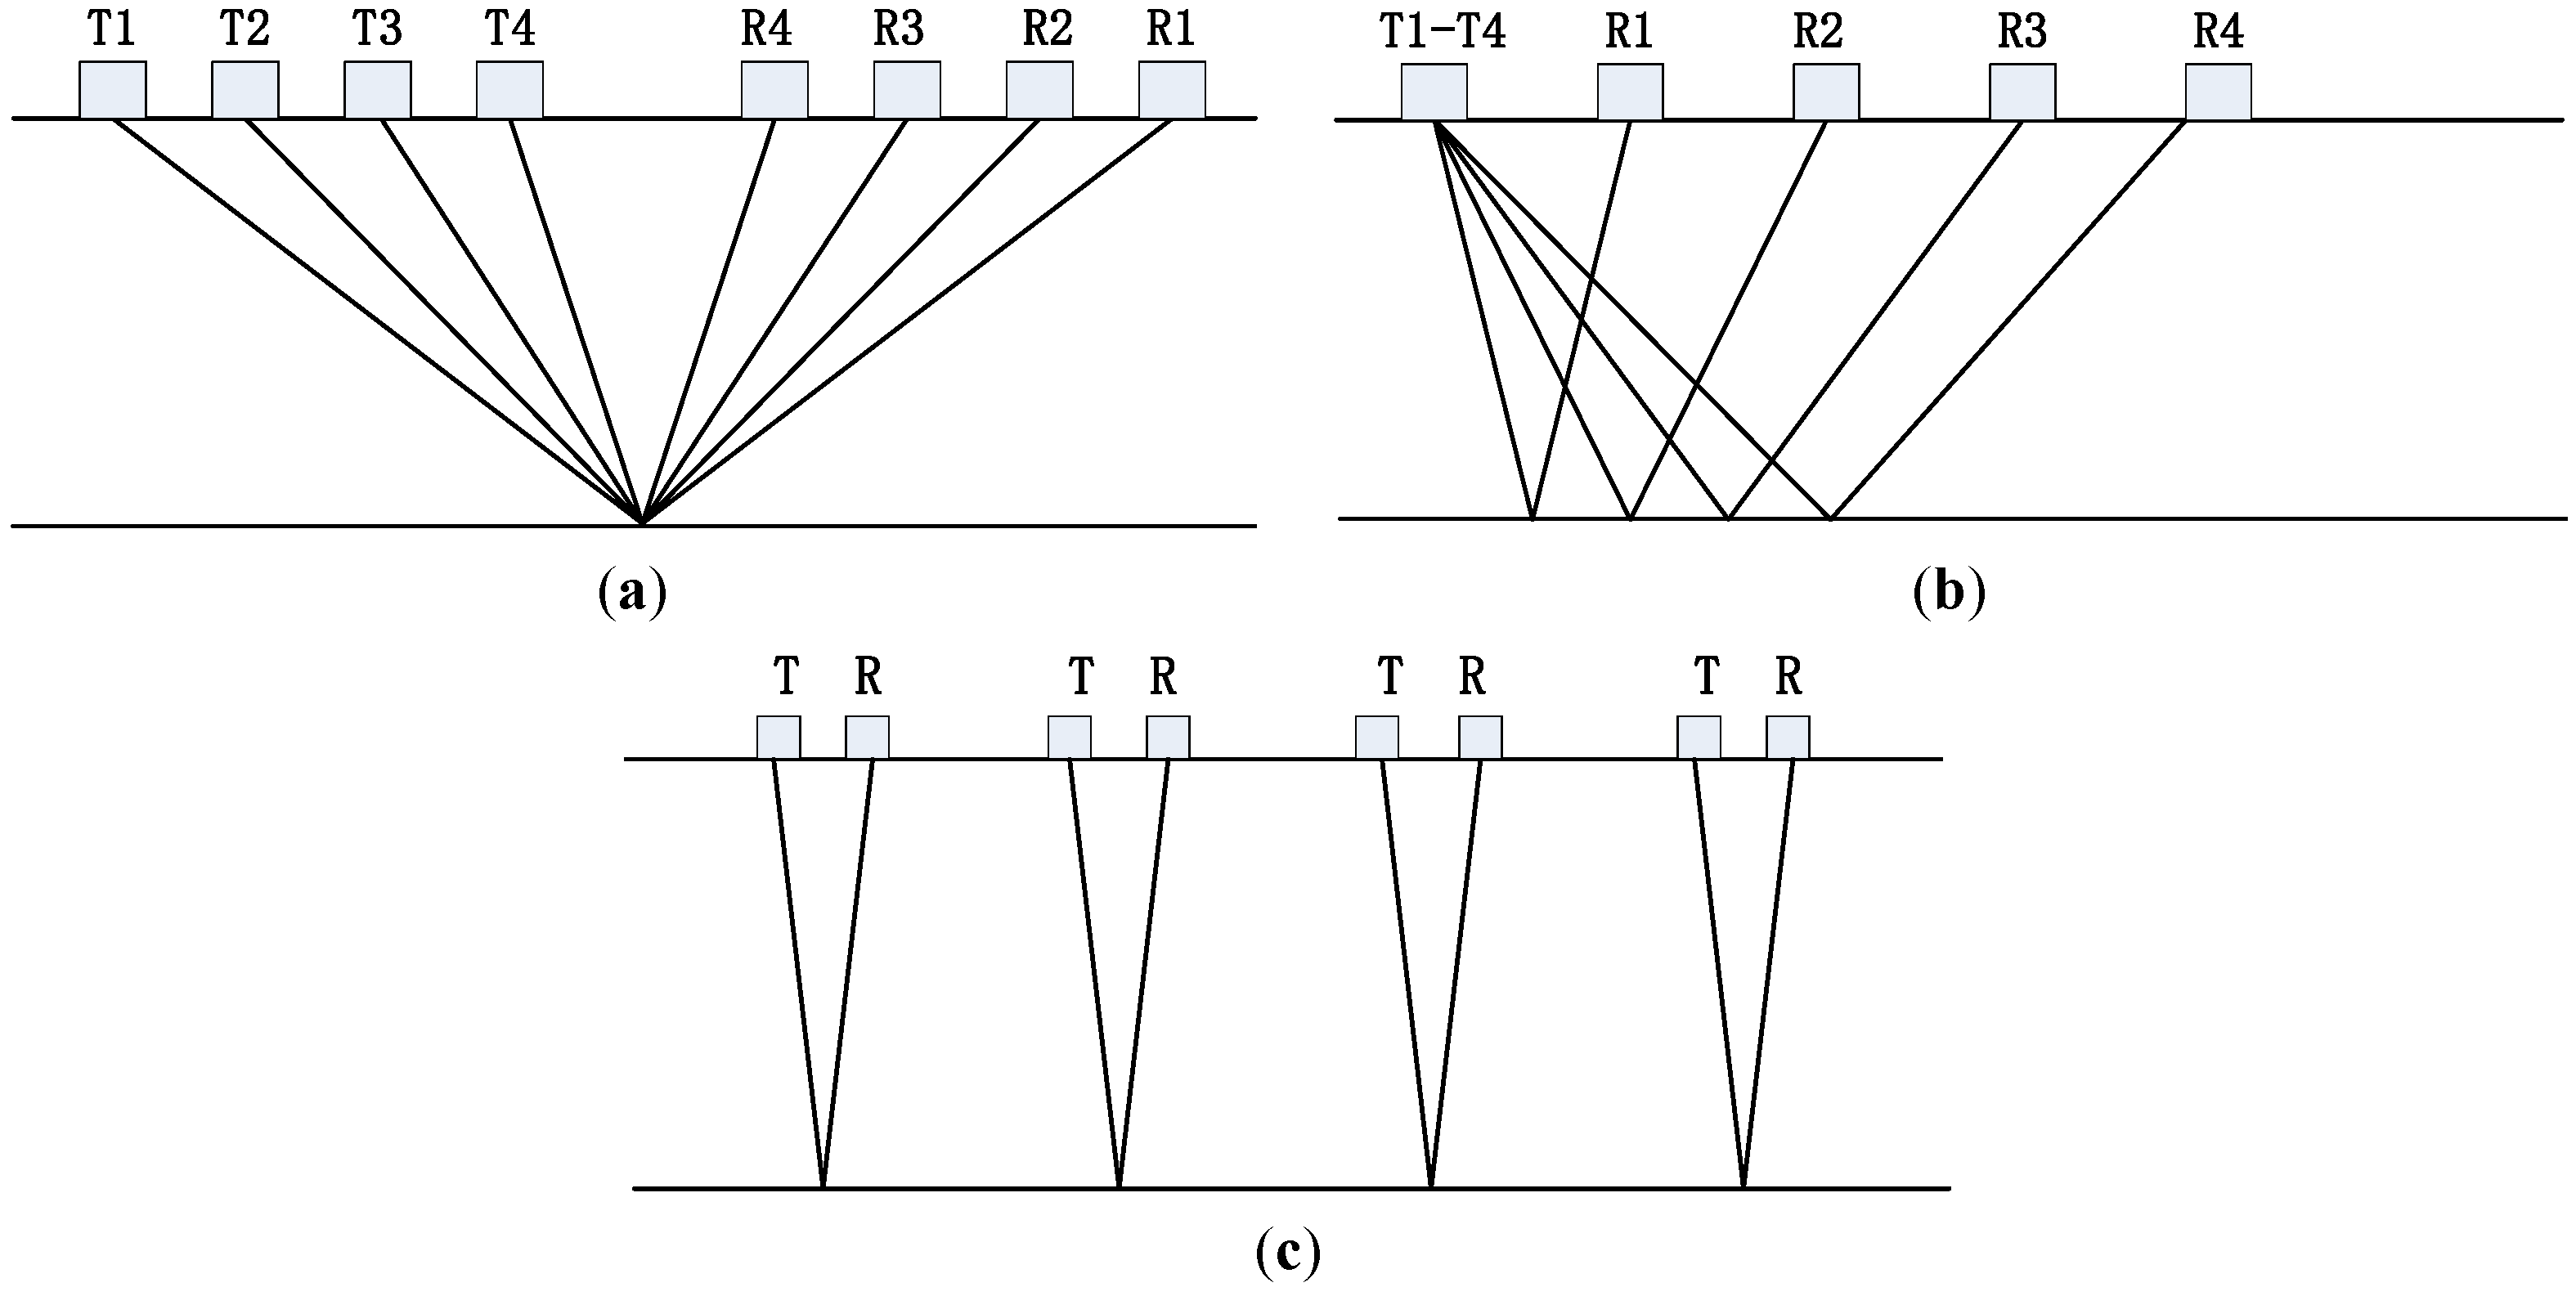
3.1. GPR Theory
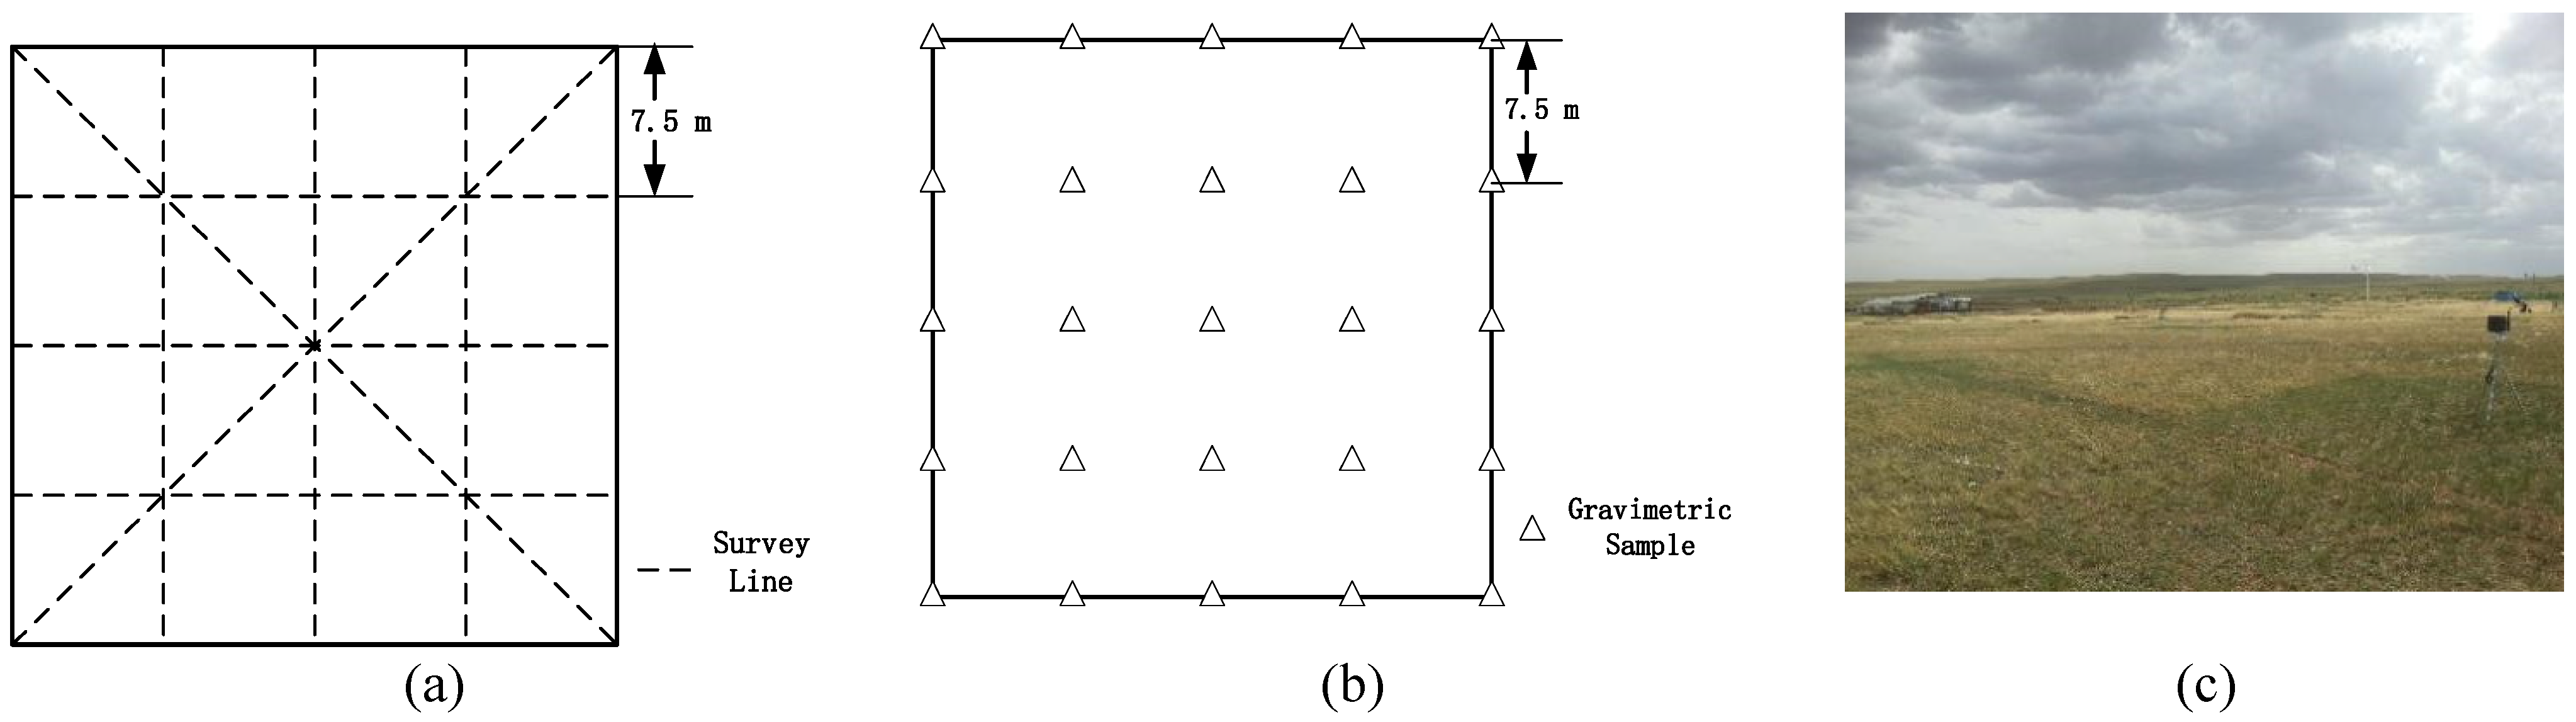
3.2. Experiment Design
3.3. Statistical Sampling
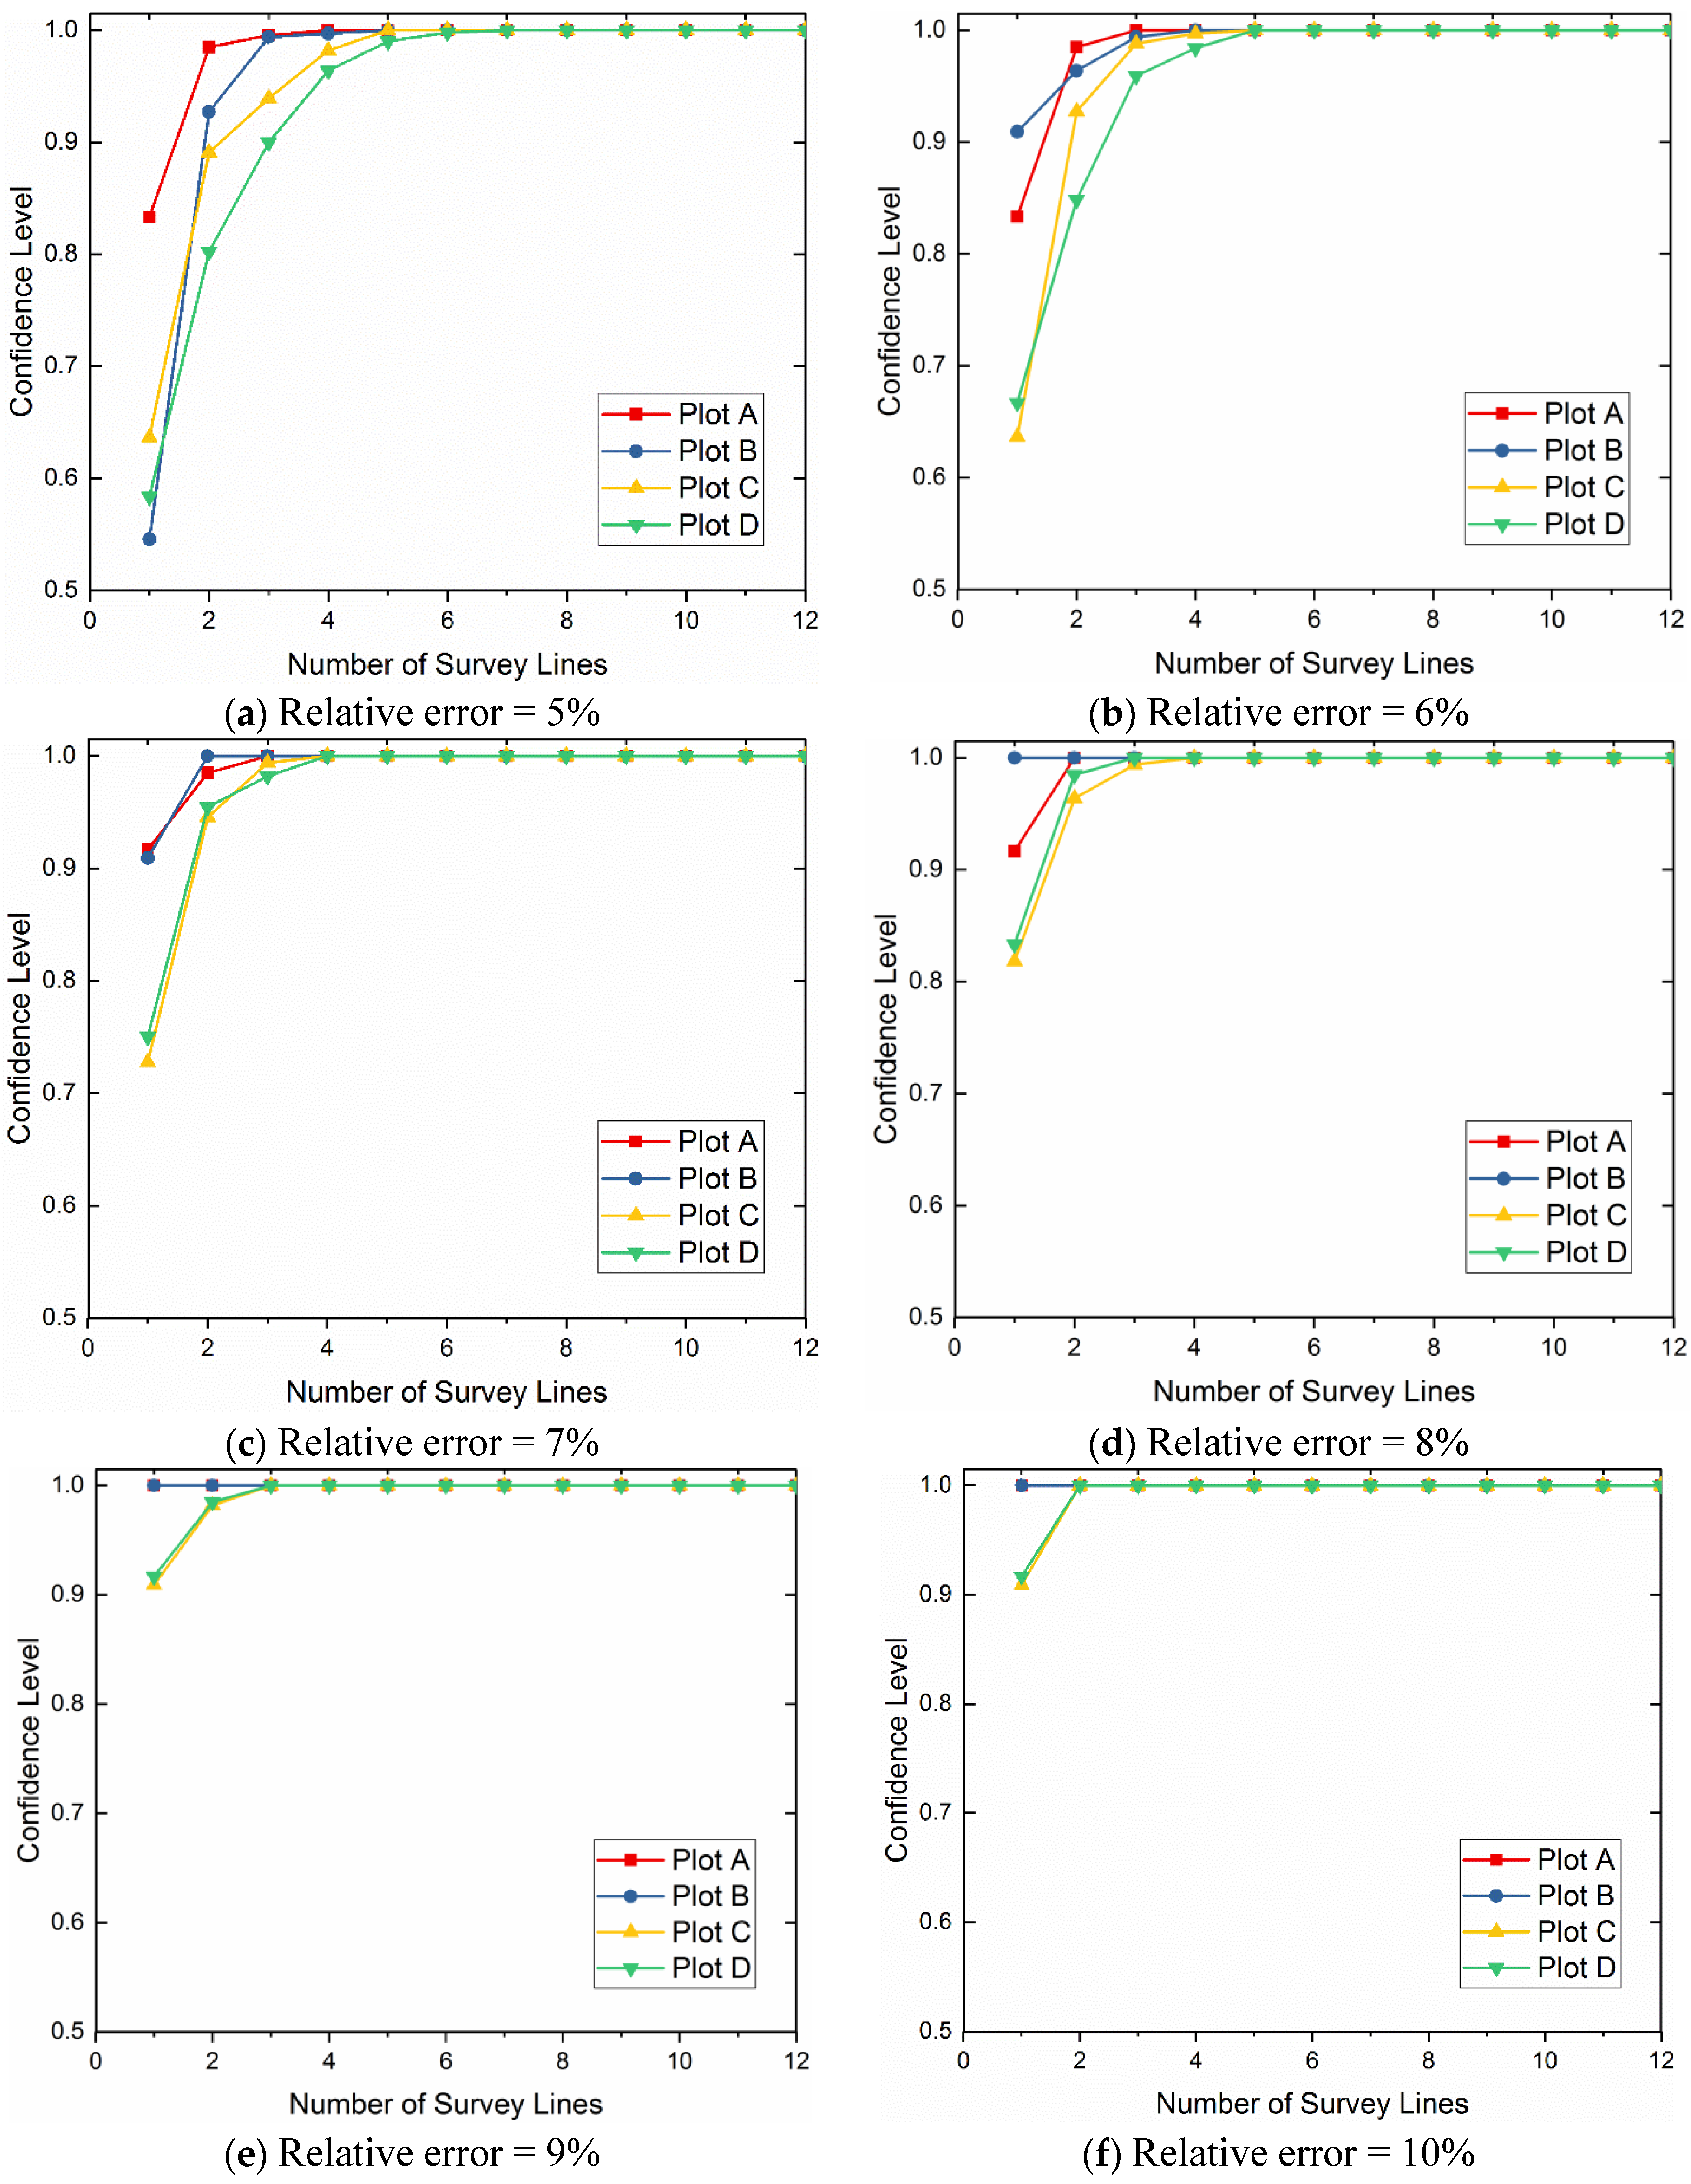
3.4. Random Combination Method
- Select m samples randomly from n samples (m = 1, 2, 3,…, n), and repeat times to cover all the combinations each time.
- Calculate the mean of m samples obtained by each selection, and obtain mean values in total.
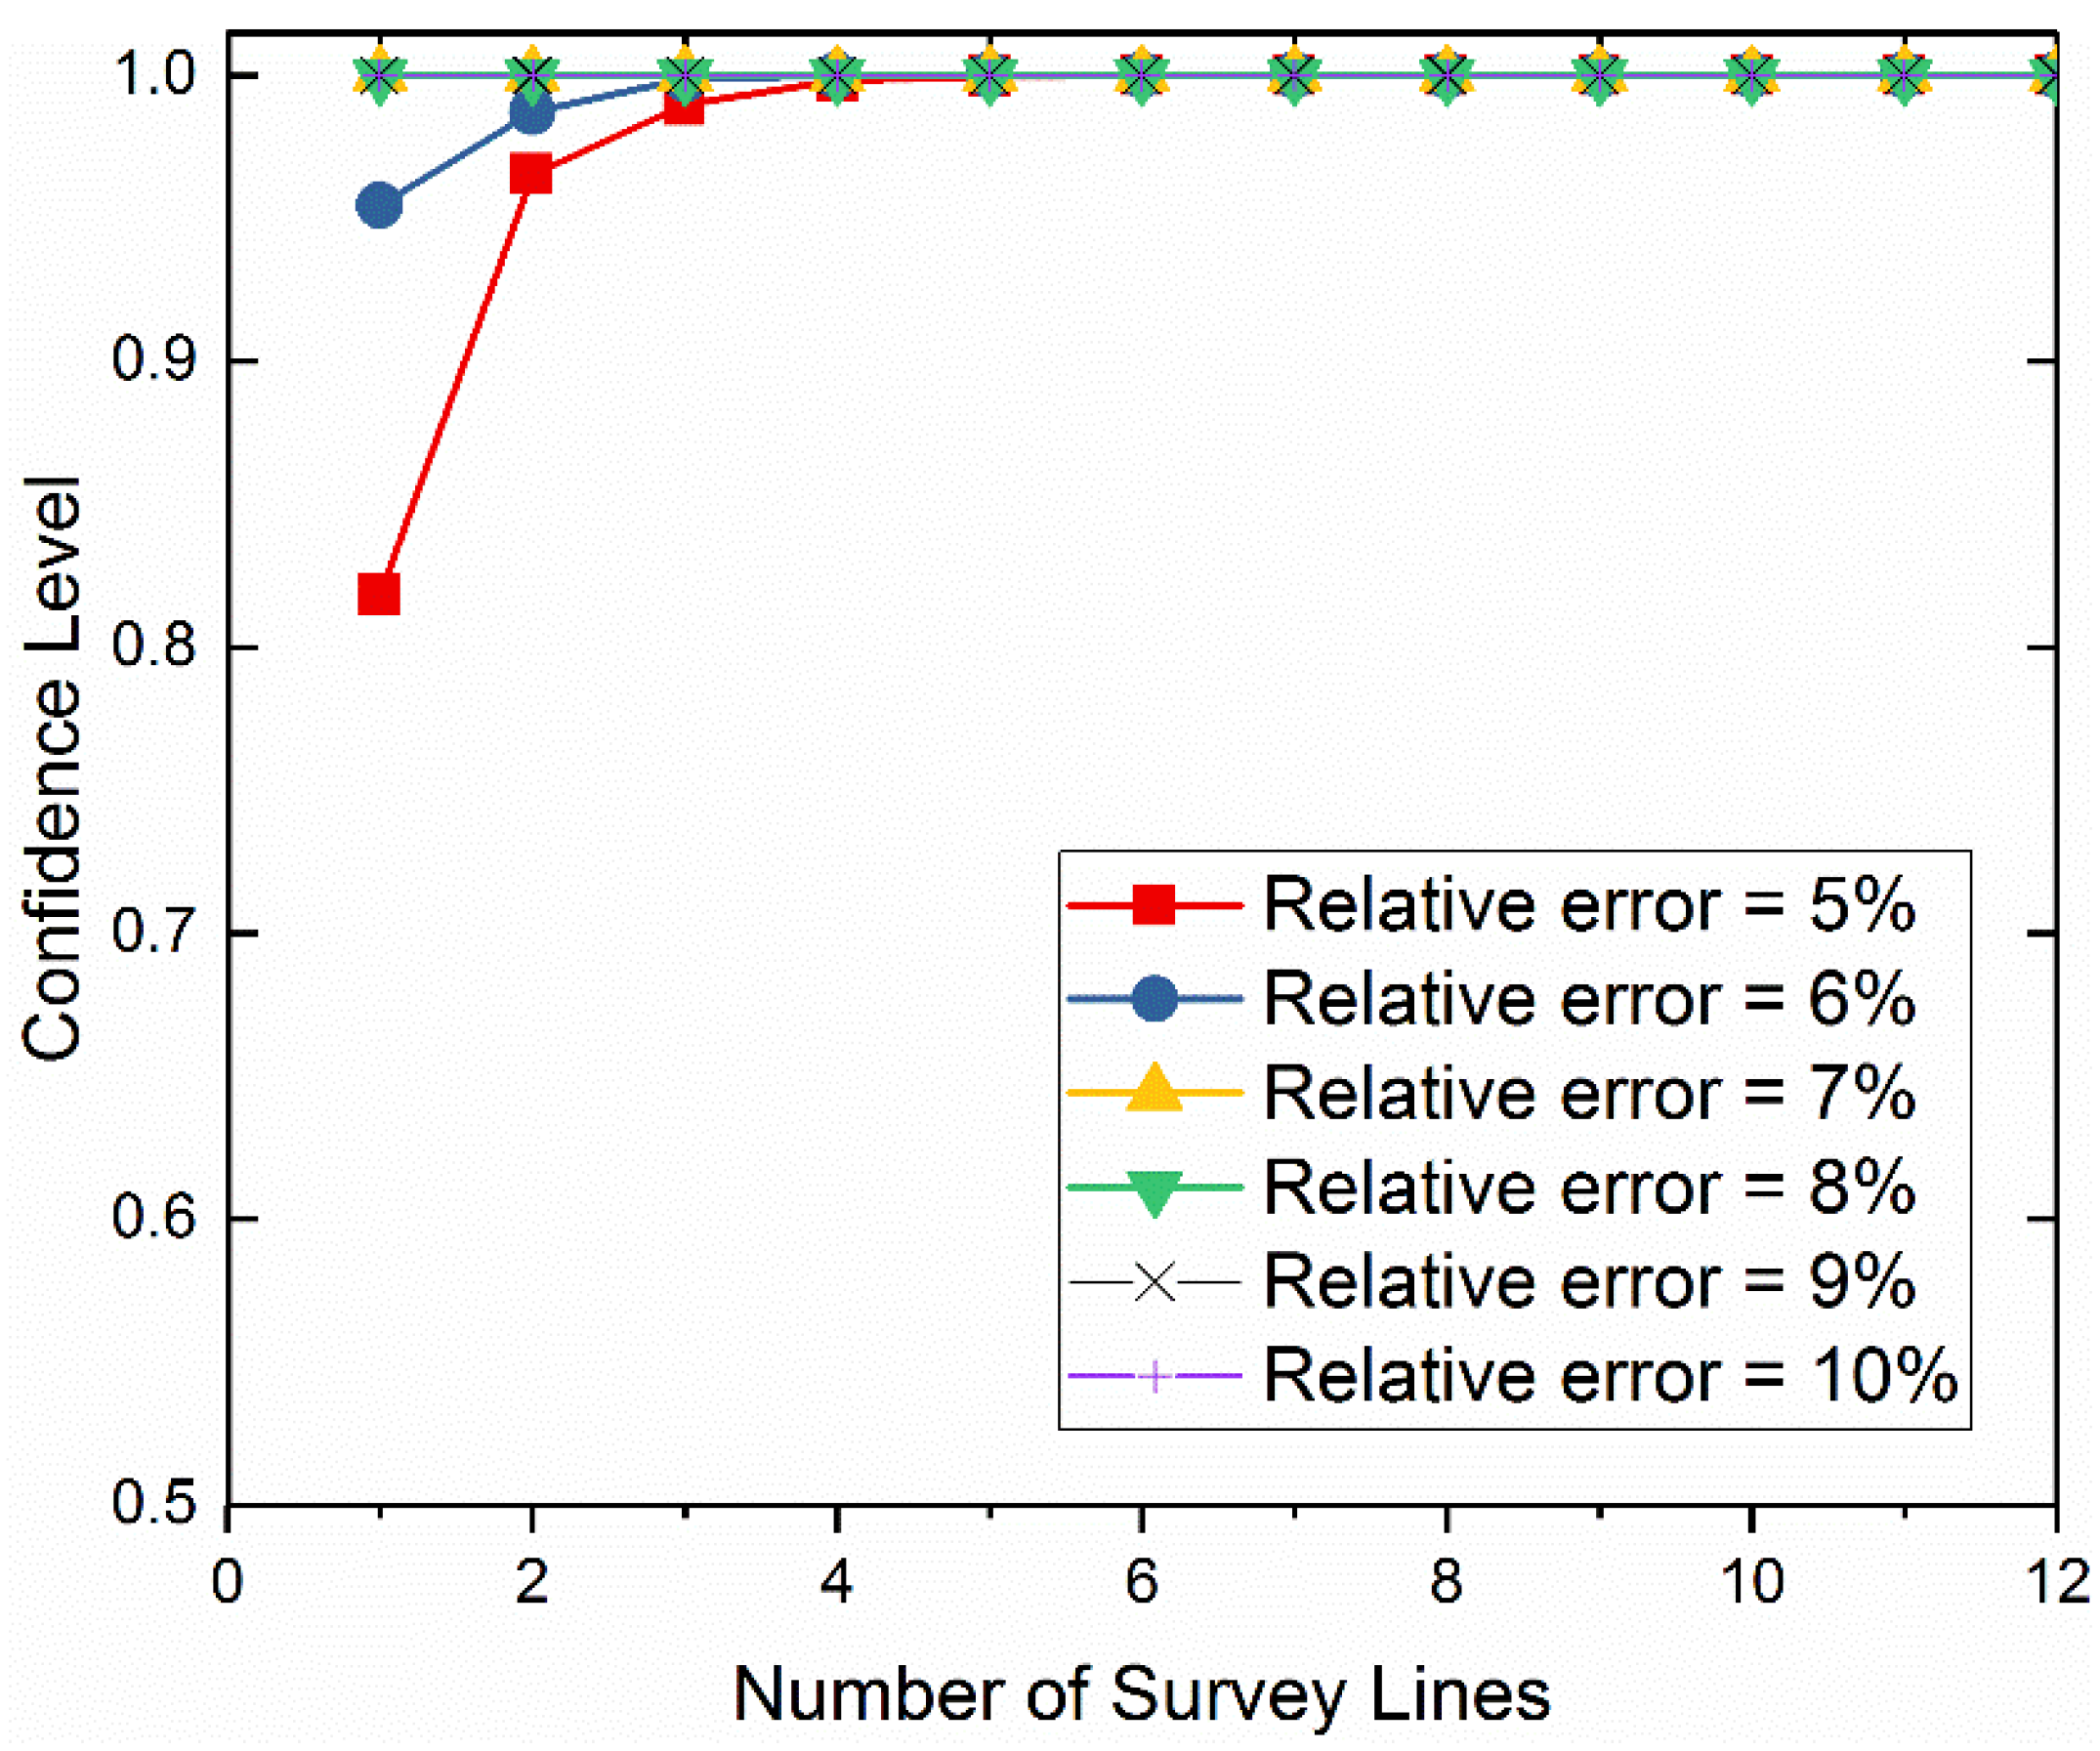
- Calculate the relative error between the mean and the mean of all n measured samples, and analyze the confidence level within 5%, 6%, 7%, 8%, 9%, and 10%.
- Plot the relationship between the confidence level and m to determine the necessary sampling size corresponding to a given confidence level (95% or 90%) when the relative error ranges from 5% to 10%, respectively.
3.5. Remote Sensing Soil Moisture by Landsat 8
4. Results
4.1. The Necessary Number of GPR Survey Lines for Pixel-Scale Soil Moisture
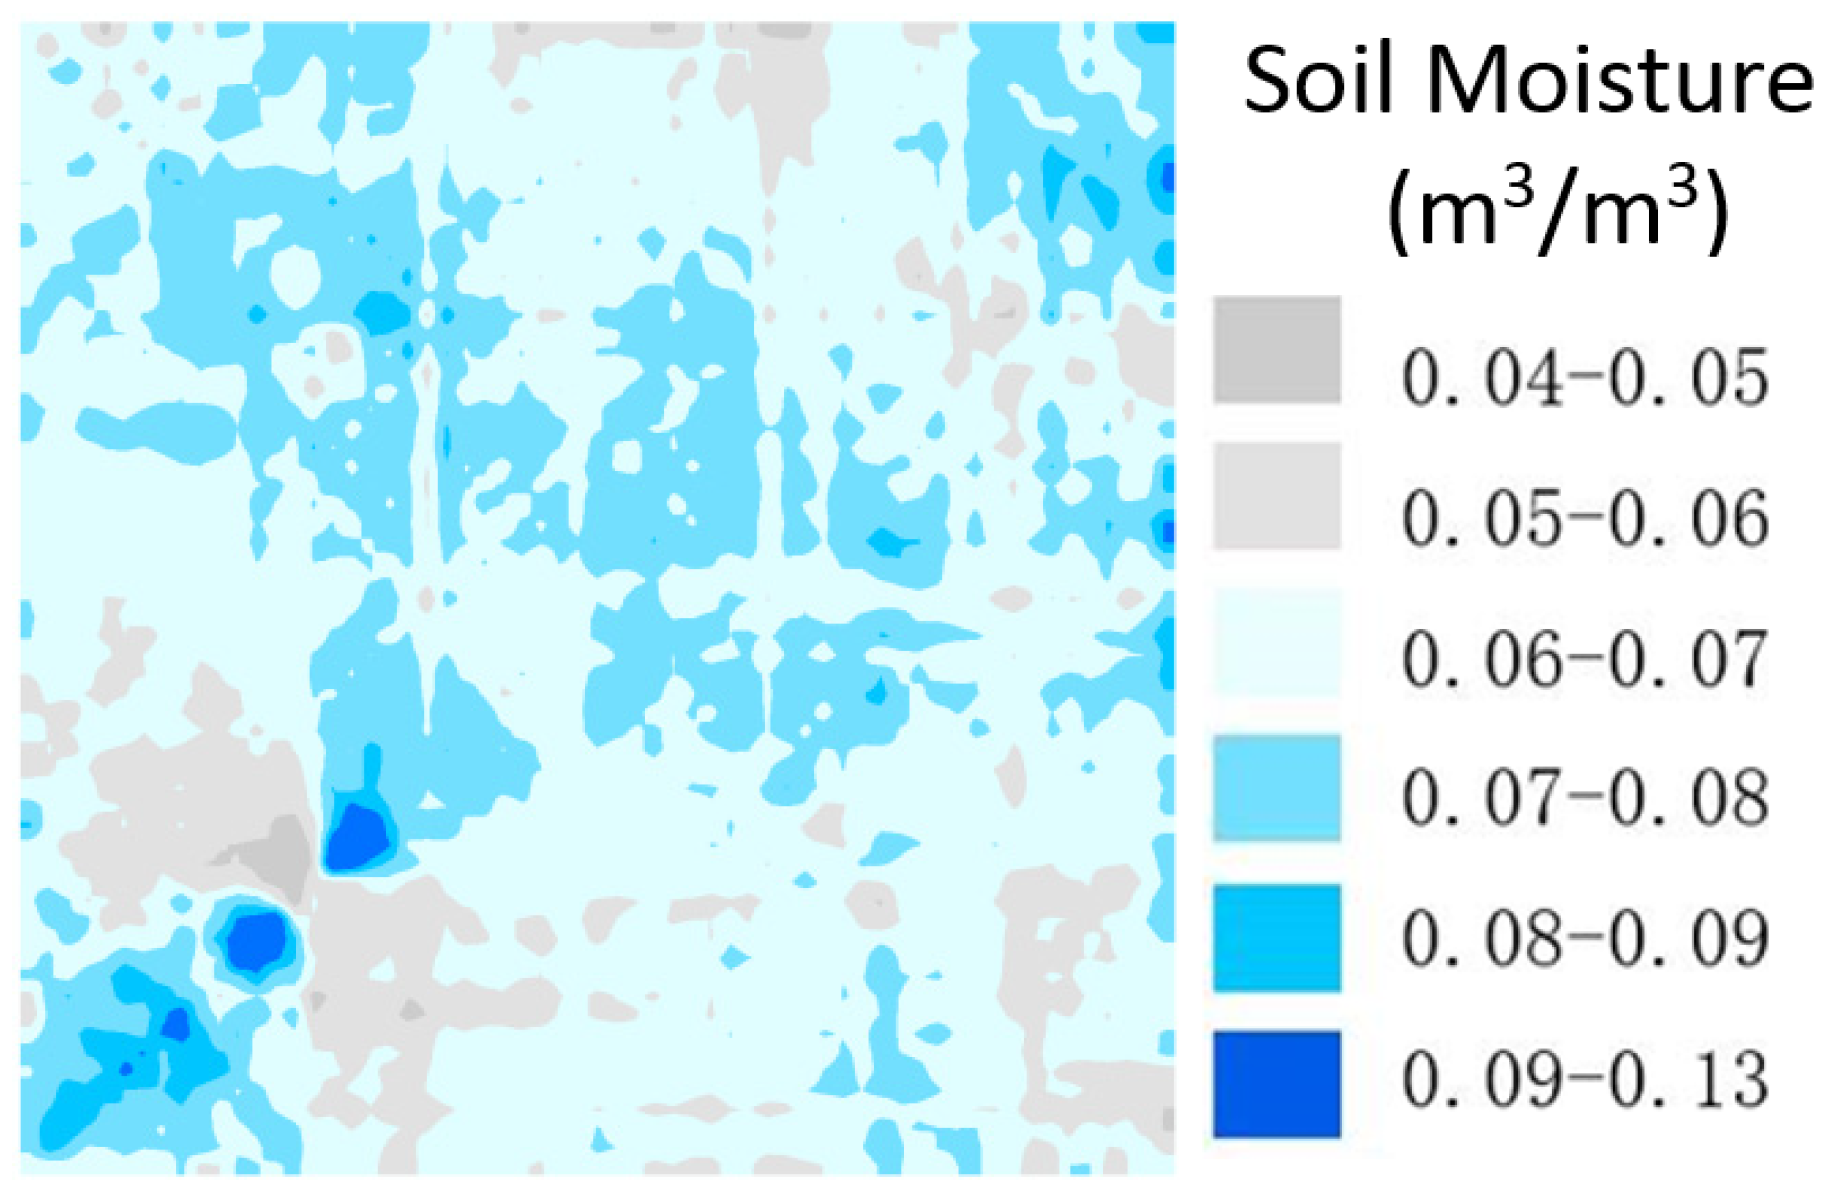
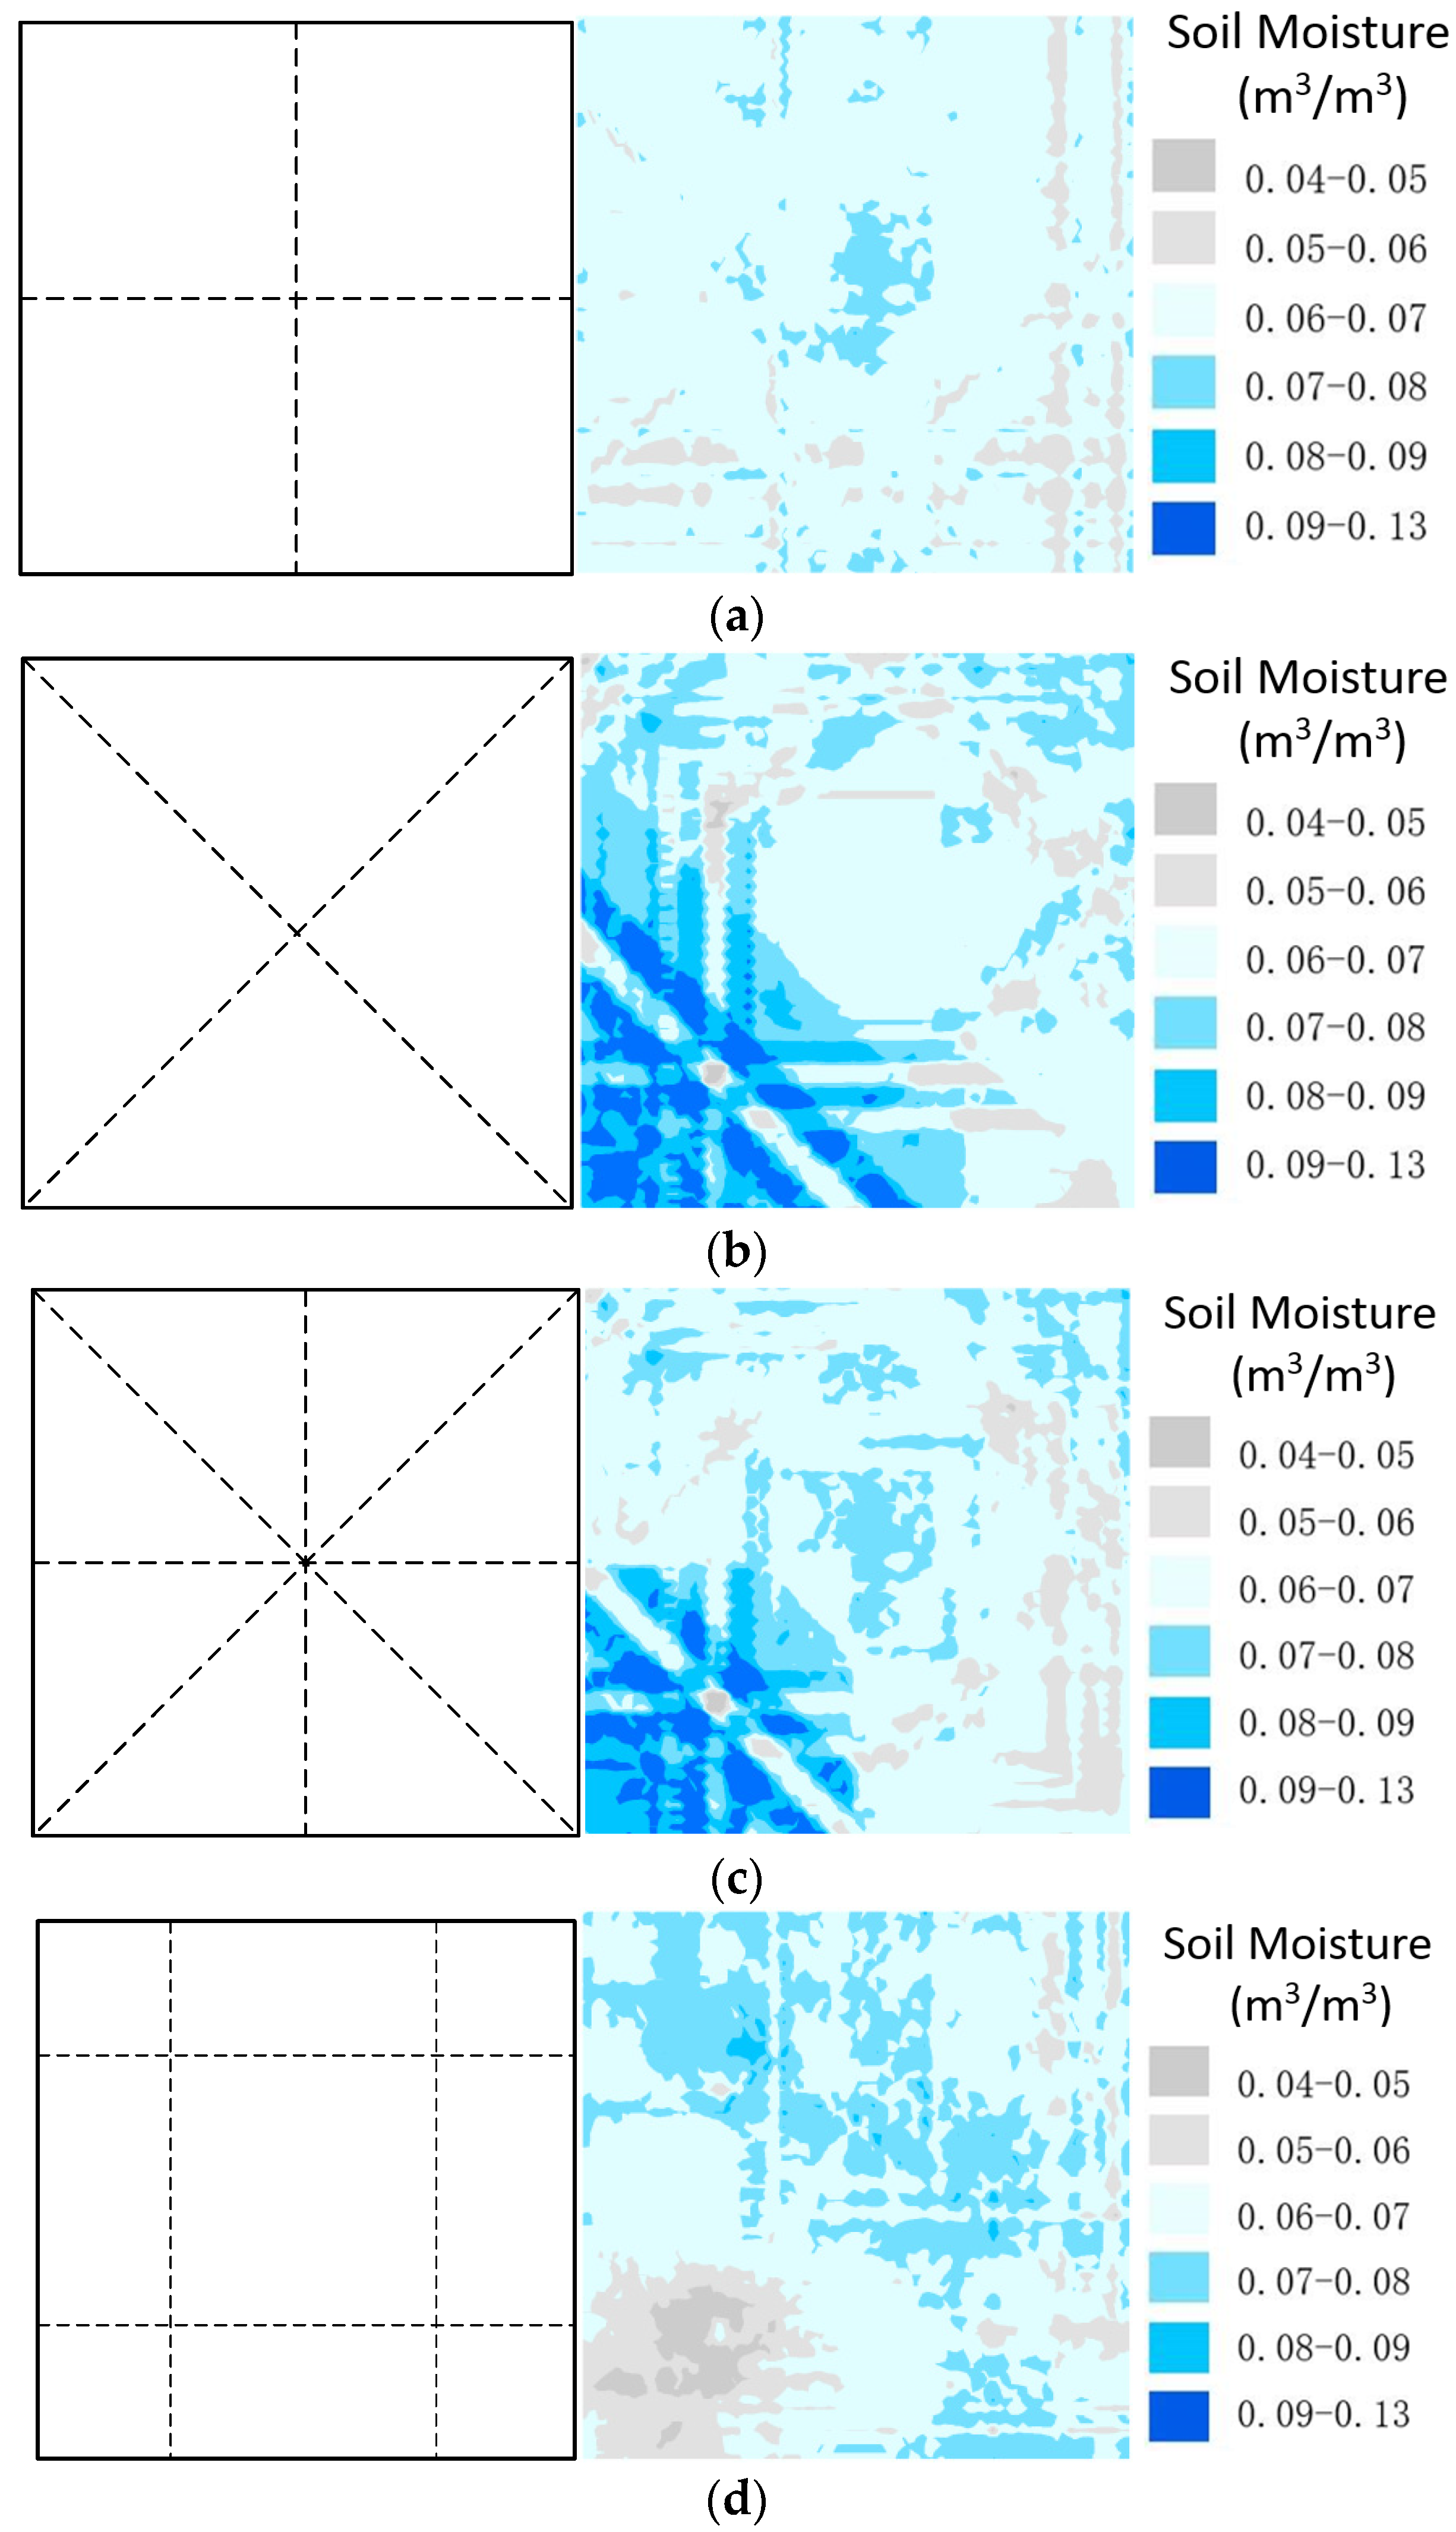
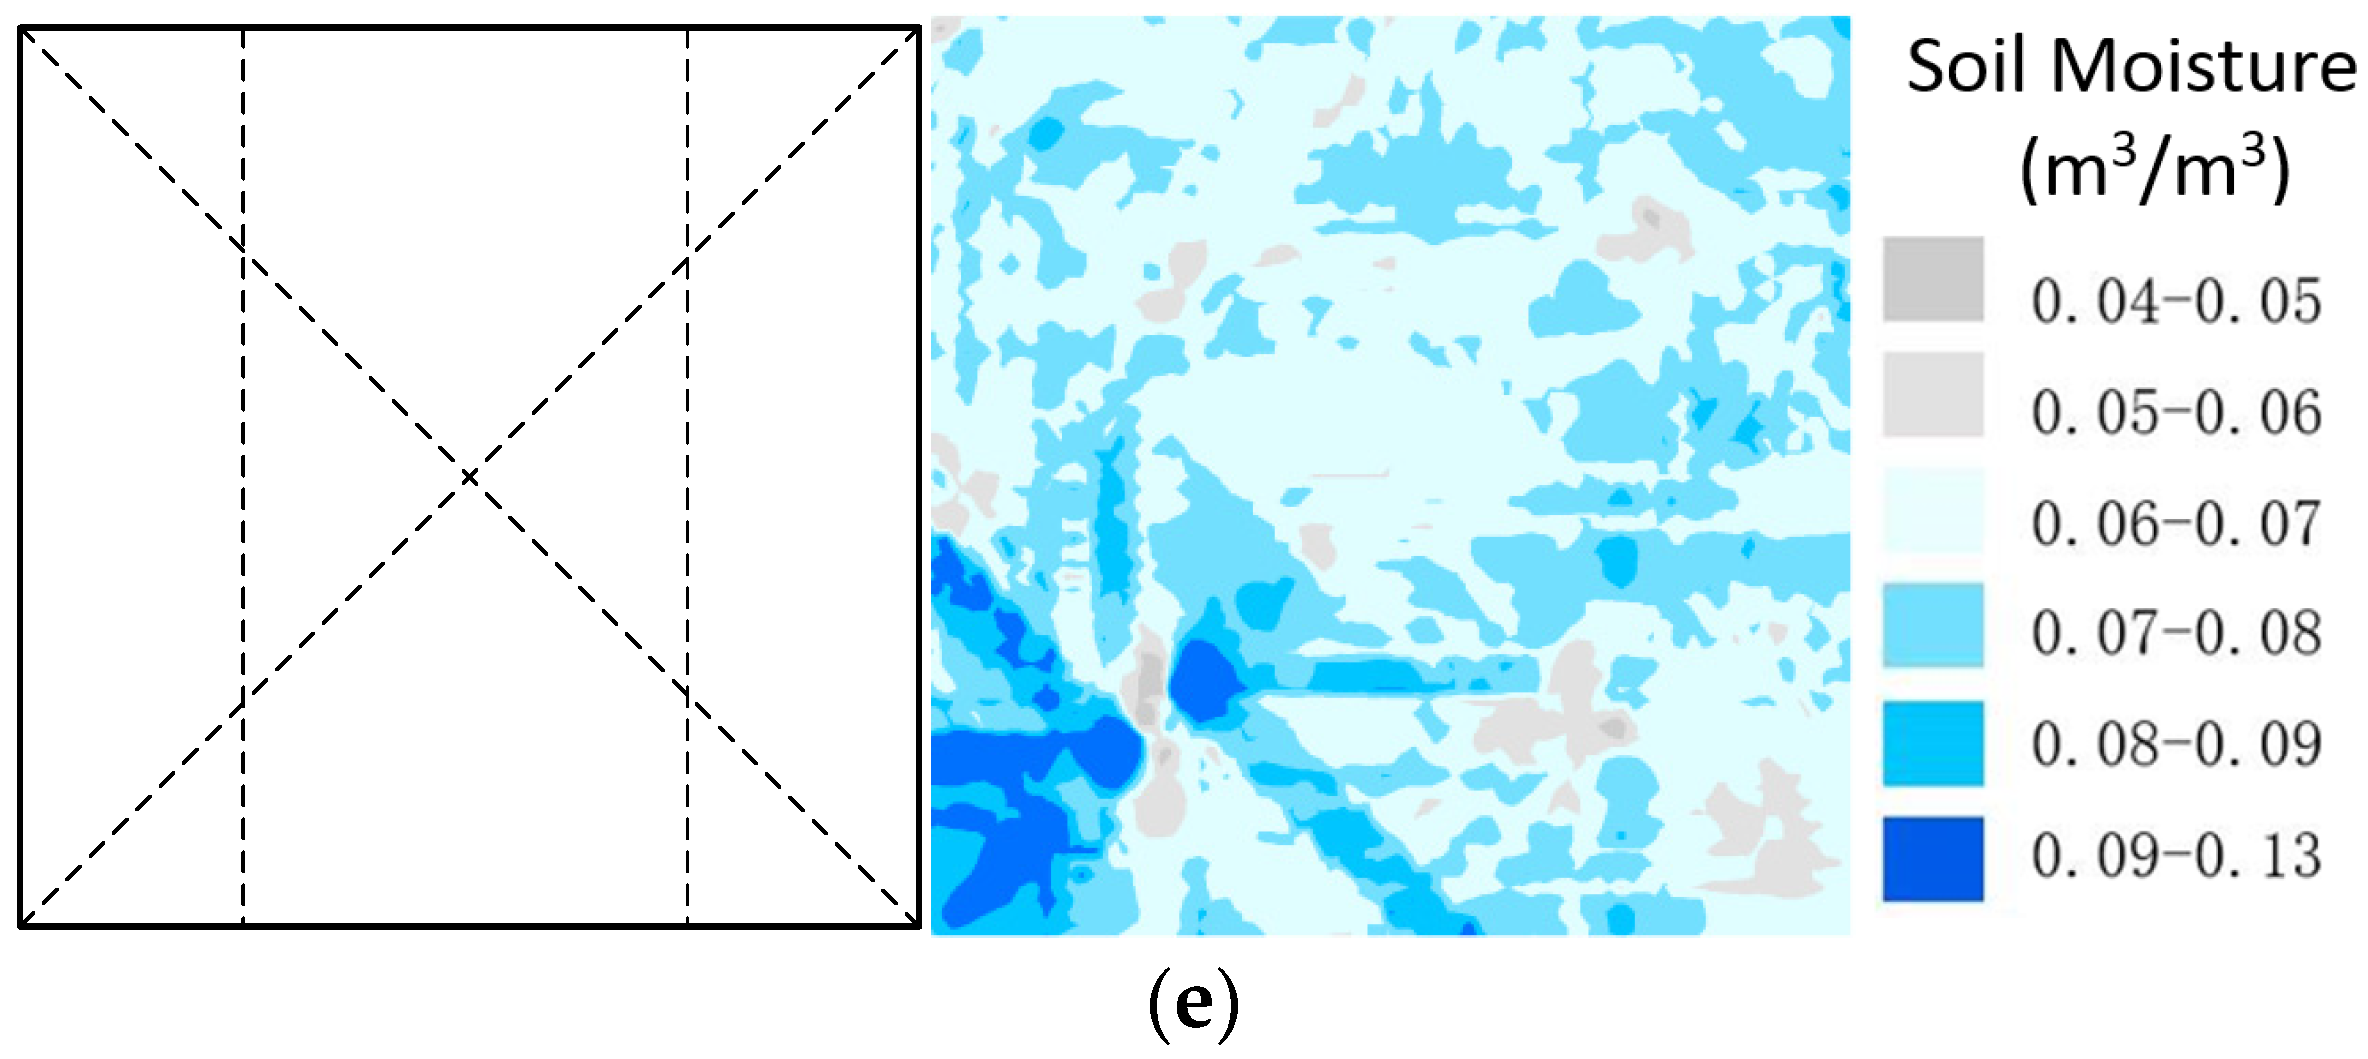
4.2. The Sampling Design of GPR Survey Lines for Pixel-Scale Soil Moisture
4.3. Pixel-Scale Measurement Method by GPR and Sampling Method by Point Measurements
4.4. Ground Validation Comparison of Remote Sensing Soil Moisture
5. Conclusions
Author Contributions
Funding
Data Availability Statement
Acknowledgments
Conflicts of Interest
Abbreviations
| GPR | Ground-penetrating radar |
| FO | Fixed offset |
| ET | Evapotranspiration |
| TDR | Time domain reflectometry |
| LULC | Land use and land cover |
| CMP | Common-midpoint |
| WARR | Wide angle reflection and refraction |
| NDVI | Normalized difference vegetation index |
| LST | Land surface temperature |
| VSWI | Vegetation supply water index |
| FDR | Frequency domain reflectometry |
| ESTARFM | Enhanced spatial and temporal adaptive reflectance fusion model |
References
- Pal, M.; Maity, R. Development of a spatially-varying statistical soil moisture profile model by coupling memory and forcing using hydrologic soil groups. J. Hydrol. 2019, 570, 141–155. [Google Scholar] [CrossRef]
- Park, S.; Im, J.; Park, S.; Rhee, J. Drought monitoring using high resolution soil moisture through multi-sensor satellite data fusion over the Korean peninsula. Agric. For. Meteorol. 2017, 237–238, 257–269. [Google Scholar] [CrossRef]
- Champagne, C.; Mcnairn, H.; Berg, A.A. Monitoring agricultural soil moisture extremes in Canada using passive microwave remote sensing. Remote Sens. Environ. 2011, 115, 2434–2444. [Google Scholar] [CrossRef]
- Maity, R.; Sharma, A.; Nagesh Kumar, D.; Chanda, D. Characterizing drought using the reliability-resilience-vulnerability concept, special issue on Data Driven Approaches to Droughts. J. Hydrol. Eng. ASCE 2013, 18, 859–869. [Google Scholar] [CrossRef]
- Padhee, S.K.; Nikam, B.R.; Dutta, S.; Aggarwal, S.P. Using satellite-based soil moisture to detect and monitor spatiotemporal traces of agricultural drought over Bundelkhand region of India. GISci. Remote Sens. 2017, 54, 144–166. [Google Scholar] [CrossRef]
- Engman, E.T. Applications of microwave remote sensing of soil moisture for water resources and agriculture. Remote Sens. Environ. 1991, 35, 213–226. [Google Scholar] [CrossRef]
- Keshavarz, M.R.; Vazifedoust, M.; Alizadeh, A. Drought monitoring using a soil wetness deficit index (SWDI) derived from MODIS satellite data. Agric. Water Manag. 2014, 132, 37–45. [Google Scholar] [CrossRef]
- Thiruvengadam, P.; Rao, Y.S. Spatio-temporal variation of soil moisture and drought monitoring using passive microwave remote sensing. In Proceedings of the 2016 IEEE International Geoscience and Remote Sensing Symposium, Beijing, China, 10–15 July 2016; IEEE: Piscataway, NJ, USA, 2016. [Google Scholar] [CrossRef]
- Van Overmeeren, R.A.; Sariowan, S.V.; Gehrels, J.C. Ground penetrating radar for determining volumetric soil water content; results of comparative measurements at two test sites. J. Hydrol. 1997, 197, 316–338. [Google Scholar] [CrossRef]
- Bolten, J.D.; Crow, W.T.; Zhan, X.; Jackson, T.J.; Reynolds, C.A. Evaluating the utility of remotely sensed soil moisture retrievals for operational agricultural drought monitoring. IEEE J. Sel. Top. Appl. Earth Obs. Remote Sens. 2010, 3, 57–66. [Google Scholar] [CrossRef] [Green Version]
- Pal, M.; Maity, R.; Suman, M.; Das, S.K.; Patel, P.; Srivastava, H.S. Satellite based Probabilistic Assessment of Soil Moisture using C-band Quad-polarized RISAT 1 data. IEEE Trans. Geosci. Remote Sens. 2017, 55, 1351–1362. [Google Scholar] [CrossRef]
- Lu, Y.; Song, W.; Lu, J.; Su, Z.; Liu, H.; Tan, Y.; Han, J. Soil water measurement by ground penetrating radar and its scale features, South-to-North Water Diversion Project. Water Sci. Technol. 2017, 15, 37–44. [Google Scholar] [CrossRef]
- Yu, W.; Zhang, Y.; Chen, L.; Zheng, S. Soil moisture estimation based on TVDI and meteorological factors. Geospat. Inf. 2015, 13, 137–139. [Google Scholar]
- Gilbert, R.O. Statistical Methods for Environmental Pollution Monitoring; Van Nostrand Reinhold Company, Inc.: New York, NY, USA, 1987; pp. 26–54. [Google Scholar] [CrossRef]
- Kamgar, A.; Hopmans, J.W.; Wallender, W.W.; Wendroth, O. Plot size and sample number for neutron probe measurements in small field trials. Soil Sci. 1993, 156, 213–224. [Google Scholar] [CrossRef]
- Sastre, J.; Vidal, M.; Rauret, G.; Sauras, T. A soil sampling strategy for mapping trace element concentrations in a test area. Sci. Total Environ. 2010, 264, 141–152. [Google Scholar] [CrossRef] [PubMed]
- Wang, C.; Zuo, Q.; Zhang, R. Estimating the necessary sampling size of surface soil moisture at different scales using a random combination method. J. Hydrol. 2008, 352, 309–321. [Google Scholar] [CrossRef]
- Zhang, R. Applied Geostatistics in Environmental Science; Science Press USA Inc.: Monmouth Junction, NJ, USA, 2005; pp. 91–92. [Google Scholar]
- Huisman, J.A.; Snepvangers, J.J.J.C.; Bouten, W.; Heuvelink, G.B.M. Mapping spatial variation in surface soil water content: Comparison of ground-penetrating radar and time domain reflectometry. J. Hydrol. 2002, 269, 194–207. [Google Scholar] [CrossRef]
- Huisman, J.A.; Sperl, C.; Bouten, W.; Verstraten, J.M. Soil water content measurements at different scales: Accuracy of time domain reflectometry and ground-penetrating radar. J. Hydrol. 2001, 254, 48–58. [Google Scholar] [CrossRef]
- Illawathure, C.; Parkin, G.; Lambot, S.; Galagedara, L. Evaluating soil moisture estimation from ground-penetrating radar hyperbola fitting with respect to a systematic time-domain reflectometry data collection in a boreal podzolic agricultural field. Hydrol. Process. 2020, 34, 1428–1445. [Google Scholar] [CrossRef]
- Klotzsche, A.; Jonard, F.; Looms, M.C.; van der Kruk, J.; Huisman, J.A. Measuring soil water content with ground penetrating radar: A decade of progress. Vadose Zone J. 2018, 17, 180052. [Google Scholar] [CrossRef] [Green Version]
- Galagedara, L.W.; Parkin, G.W.; Redman, J.D.; von Bertoldi, P.; Endres, A.L. Field studies of the GPR ground wave method for estimating soil water content during irrigation and drainage. J. Hydrol. 2005, 245, 182–197. [Google Scholar] [CrossRef]
- Hubbard, S.; Grote, K.; Rubin, Y. Mapping the volumetric soil water content of a California vineyard using high-frequency GPR ground wave data. Lead. Edge 2002, 21, 552–559. [Google Scholar] [CrossRef]
- Grote, K.; Hubbard, S.; Rubin, Y. Field-scale estimation of volumetric water content using ground-penetrating radar ground wave techniques. Water Resour. Res. 2003, 39, 1321–1335. [Google Scholar] [CrossRef] [Green Version]
- Lunt, I.A.; Hubbard, S.S.; Rubin, Y. Soil moisture content estimation using ground-penetrating radar reflection data. J. Hydrol. 2005, 307, 254–269. [Google Scholar] [CrossRef]
- Steelman, C.M.; Endres, A.L.; Jones, J.P. High-resolution ground-penetrating radar monitoring of soil moisture dynamics: Field results, interpretation, and comparison with unsaturated flow model. Water Resour. Res. 2012, 48, W09538. [Google Scholar] [CrossRef]
- Liu, X.; Cui, X.; Guo, L.; Chen, J.; Li, W.; Yang, D.; Cao, X.; Chen, X.; Liu, Q.; Lin, H. Non-invasive estimation of root zone soil moisture from coarse root reflections in ground-penetrating radar images. Plant Soil 2019, 436, 623–639. [Google Scholar] [CrossRef]
- Minet, J.; Bogaert, P.; Vanclooster, M.; Lambot, S. Validation of ground penetrating radar full-waveform inversion for field scale soil moisture mapping. J. Hydrol. 2012, 424–425, 112–123. [Google Scholar] [CrossRef] [Green Version]
- Qin, Y.; Chen, X.; Zhou, K.; Klenk, P.; Roth, K.; Sun, L. Ground-penetrating radar for monitoring the distribution of near-surface soil water content in the Gurbantunggut Desert. Environ. Earth Sci. 2013, 70, 2883–2893. [Google Scholar] [CrossRef]
- Weihermüller, L.; Huisman, J.A.; Lambot, S.; Herbst, M.; Vereecken, H. Mapping the spatial variation of soil water content at the field scale with different ground penetrating radar techniques. J. Hydrol. 2007, 340, 205–216. [Google Scholar] [CrossRef] [Green Version]
- Lu, Y.; Song, W.; Lu, J.; Wang, X.; Tan, Y. An Examination of Soil Moisture Estimation Using Ground Penetrating Radar in Desert Steppe. Water 2017, 9, 521. [Google Scholar] [CrossRef] [Green Version]
- Topp, G.C.; Davis, J.L.; Annan, A.P. Electromagnetic determination of soil water content: Measurements in coaxial transmission lines. Water Resour. Res. 1980, 16, 574–582. [Google Scholar] [CrossRef] [Green Version]
- Liu, Y.; James, I.; Klaus, H. High-resolution velocity estimation from surface-based common-offset GPR reflection data. Geophys. J. Int. 2022, 230, 131–144. [Google Scholar] [CrossRef]
- Galagedara, L.W.; Redman, J.D.; Parkin, G.W.; Annan, A.P.; Endres, A.L. Numerical modeling of GPR to determine the direct ground wave sampling depth. Vadose Zone J. 2005, 4, 1096–1106. [Google Scholar] [CrossRef]
- Davis, J.L.; Annan, A.P. Ground penetrating radar for high resolution mapping of soil and rock stratigraphy. Geophys. Prospect. 1989, 37, 531–551. [Google Scholar] [CrossRef]
- Steelman, C.M.; Endres, A.L. An examination of direct ground wave soil moisture monitoring over an annual cycle of soil conditions. Water Resour. Res. 2010, 46, W11533. [Google Scholar] [CrossRef]
- Du, S. Determination of Water Content in the Subsurface with the Ground Wave of Ground Penetrating Radar; Ludwig-Maximilians-Universitat: München, Germany, 1996. [Google Scholar]
- Sperl, C. Erfassung der Raum-Zeitlichen Variation des Boden-Wassergehaltes in Einem Agrarokosystem mit dem Ground-Penetrating Radar. Ph.D. Thesis, Technische Universitat, München, Germany, 1999; p. 182. [Google Scholar]
- Petersen, R.G.; Calvin, L.D. Sampling. In Methods of Soil Analysis. Part 1. Physical and Mineralogical Methods. Agronomy Monographs No. 9, 2nd ed.; Klute, C.A., Ed.; American Society of Agronomy Inc.: Madison, WI, USA, 1986; pp. 33–51. [Google Scholar]
- Carlson, T.N.; Gillies, R.R.; Perry, E.M. A method to make use of thermal infrared temperature and NDVI measurements to infer surf ace soil water content and fractional vegetation cover. Remote Sens. Rev. 1994, 9, 161–173. [Google Scholar] [CrossRef]
- Du, C.; Ren, H.; Qin, Q.; Meng, J.; Zhao, S. A practical split-window algorithm for estimating land surface temperature from Landsat 8 data. Remote Sens. 2015, 7, 647–665. [Google Scholar] [CrossRef] [Green Version]
- Ren, H.; Du, C.; Liu, R.; Qin, Q.; Yan, G.; Li, Z.; Meng, J. Atmospheric water vapor retrieval from Landsat 8 thermal infrared images. J. Geophys. Res. Atmos. 2015, 120, 1723–1738. [Google Scholar] [CrossRef]
- Li, H.; Lin, Z.; Liu, S. Application of Kriging Technique in estimating soil moisture in China. Geogr. Res. 2001, 20, 446–452. [Google Scholar] [CrossRef]


| RMSE (m3/m3) | |||||
|---|---|---|---|---|---|
| Shape Ⅰ | Shape Ⅱ | Shape Ⅲ | Shape Ⅳ | Shape Ⅴ | |
| Plot A | 0.0083 | 0.0086 | 0.0066 | 0.0066 | 0.0067 |
| Plot B | 0.0076 | 0.0079 | 0.0063 | 0.0063 | 0.0065 |
| Plot C | 0.0078 | 0.0072 | 0.0059 | 0.007 | 0.0069 |
| Plot D | 0.0077 | 0.0138 | 0.0119 | 0.0087 | 0.0097 |
| Average | 0.0079 | 0.0094 | 0.0077 | 0.0072 | 0.0075 |
| Confidence Level | Relative Error | Number of Sampling Points | |||||||
|---|---|---|---|---|---|---|---|---|---|
| Plot A | Plot B | Plot C | Plot D | ||||||
| S | R | S | R | S | R | S | R | ||
| 90% | 5% | 16 | 16 | 11 | 10 | 15 | 16 | 15 | 15 |
| 10% | 8 | 8 | 5 | 4 | 8 | 8 | 7 | 7 | |
| 95% | 5% | 18 | 18 | 13 | 12 | 17 | 18 | 17 | 17 |
| 10% | 10 | 10 | 6 | 5 | 10 | 9 | 10 | 9 | |
| Plot | Soil Moisture Measurements (m3/m3) | ||||||
|---|---|---|---|---|---|---|---|
| Gravimetric Measurements (25 Samples/Plot) | Number of Survey Lines | ||||||
| 1 | 2 | 4 | 8 | 10 | 12 | ||
| A | 0.069 | 0.064 | 0.071 | 0.071 | 0.070 | 0.070 | 0.071 |
| B | 0.058 | 0.055 | 0.060 | 0.063 | 0.060 | 0.061 | 0.061 |
| C | 0.066 | 0.061 | 0.070 | 0.069 | 0.068 | 0.067 | 0.068 |
| D | 0.071 | 0.060 | 0.066 | 0.066 | 0.065 | 0.066 | 0.065 |
| 60 × 60 m2 | 0.064 (by 25 samples) 0.066 (by 81 samples) | 0.062 | 0.066 | 0.068 | 0.066 | 0.065 | 0.066 |
| Remote Sensing Soil Moisture (m3/m3) | Validation Results by Point Measurements (Relative Error) | ||||||
|---|---|---|---|---|---|---|---|
| 1 Point | 5 Points | 10 Points | 15 Points | 20 Points | 25 Points | ||
| Plot A | 0.037 | 9.93–58.21% | 19.61–54.36% | 29.31–51.49% | 34.55–51.49% | 38.61–46.40% | 46.38% |
| Plot B | 0.047 | 3.90–37.10% | 2.62–29.08% | 6.74–26.16% | 10.91–23.69% | 14.27–20.78% | 18.97% |
| Plot C | 0.043 | 7.40–49.62% | 8.78–46.85% | 18.40–42.50% | 23.22–39.20% | 27.33–36.40% | 34.85% |
| Plot D | 0.046 | 11.20.–51.83% | 11.65–46.29% | 20.54–42.58% | 24.39–36.70% | 28.43–36.70% | 35.21% |
| 1 point | 5 points | 10 points | 15 points | 20 points | 25 points | ||
| RMSE of four plots (m3/m3) | 0.0036– 0.0438 | 0.0059– 0.0365 | 0.0110–0.0316 | 0.0142– 0.0284 | 0.0173– 0.0250 | 0.0240 | |
| Remote Sensing Soil Moisture (m3/m3) | Validation Results by GPR Survey Lines (Relative Error) | ||||
|---|---|---|---|---|---|
| 2 Lines | 4 Lines | 8 Lines | 12 Lines | ||
| Plot A | 0.037 | 47.60% | 47.89% | 47.14% | 47.89% |
| Plot B | 0.047 | 21.77% | 25.40% | 21.67% | 22.95% |
| Plot C | 0.043 | 38.71% | 37.68% | 36.76% | 36.76% |
| Plot D | 0.046 | 30.17% | 30.30% | 29.23% | 29.23% |
| 2 lines | 4 lines | 8 lines | 12 lines | ||
| RMSE of four plots (m3/m3) | 0.0247 | 0.0249 | 0.0237 | 0.0242 | |
Disclaimer/Publisher’s Note: The statements, opinions and data contained in all publications are solely those of the individual author(s) and contributor(s) and not of MDPI and/or the editor(s). MDPI and/or the editor(s) disclaim responsibility for any injury to people or property resulting from any ideas, methods, instructions or products referred to in the content. |
© 2023 by the authors. Licensee MDPI, Basel, Switzerland. This article is an open access article distributed under the terms and conditions of the Creative Commons Attribution (CC BY) license (https://creativecommons.org/licenses/by/4.0/).
Share and Cite
Song, W.; Lu, Y.; Wang, Y.; Lu, J.; Shi, H. A Pixel-Scale Measurement Method of Soil Moisture Using Ground-Penetrating Radar. Water 2023, 15, 1318. https://doi.org/10.3390/w15071318
Song W, Lu Y, Wang Y, Lu J, Shi H. A Pixel-Scale Measurement Method of Soil Moisture Using Ground-Penetrating Radar. Water. 2023; 15(7):1318. https://doi.org/10.3390/w15071318
Chicago/Turabian StyleSong, Wenlong, Yizhu Lu, Yu Wang, Jingxuan Lu, and Haixian Shi. 2023. "A Pixel-Scale Measurement Method of Soil Moisture Using Ground-Penetrating Radar" Water 15, no. 7: 1318. https://doi.org/10.3390/w15071318