
Dripping Rainfall Simulators for Soil Research—Performance Review

 , , , and
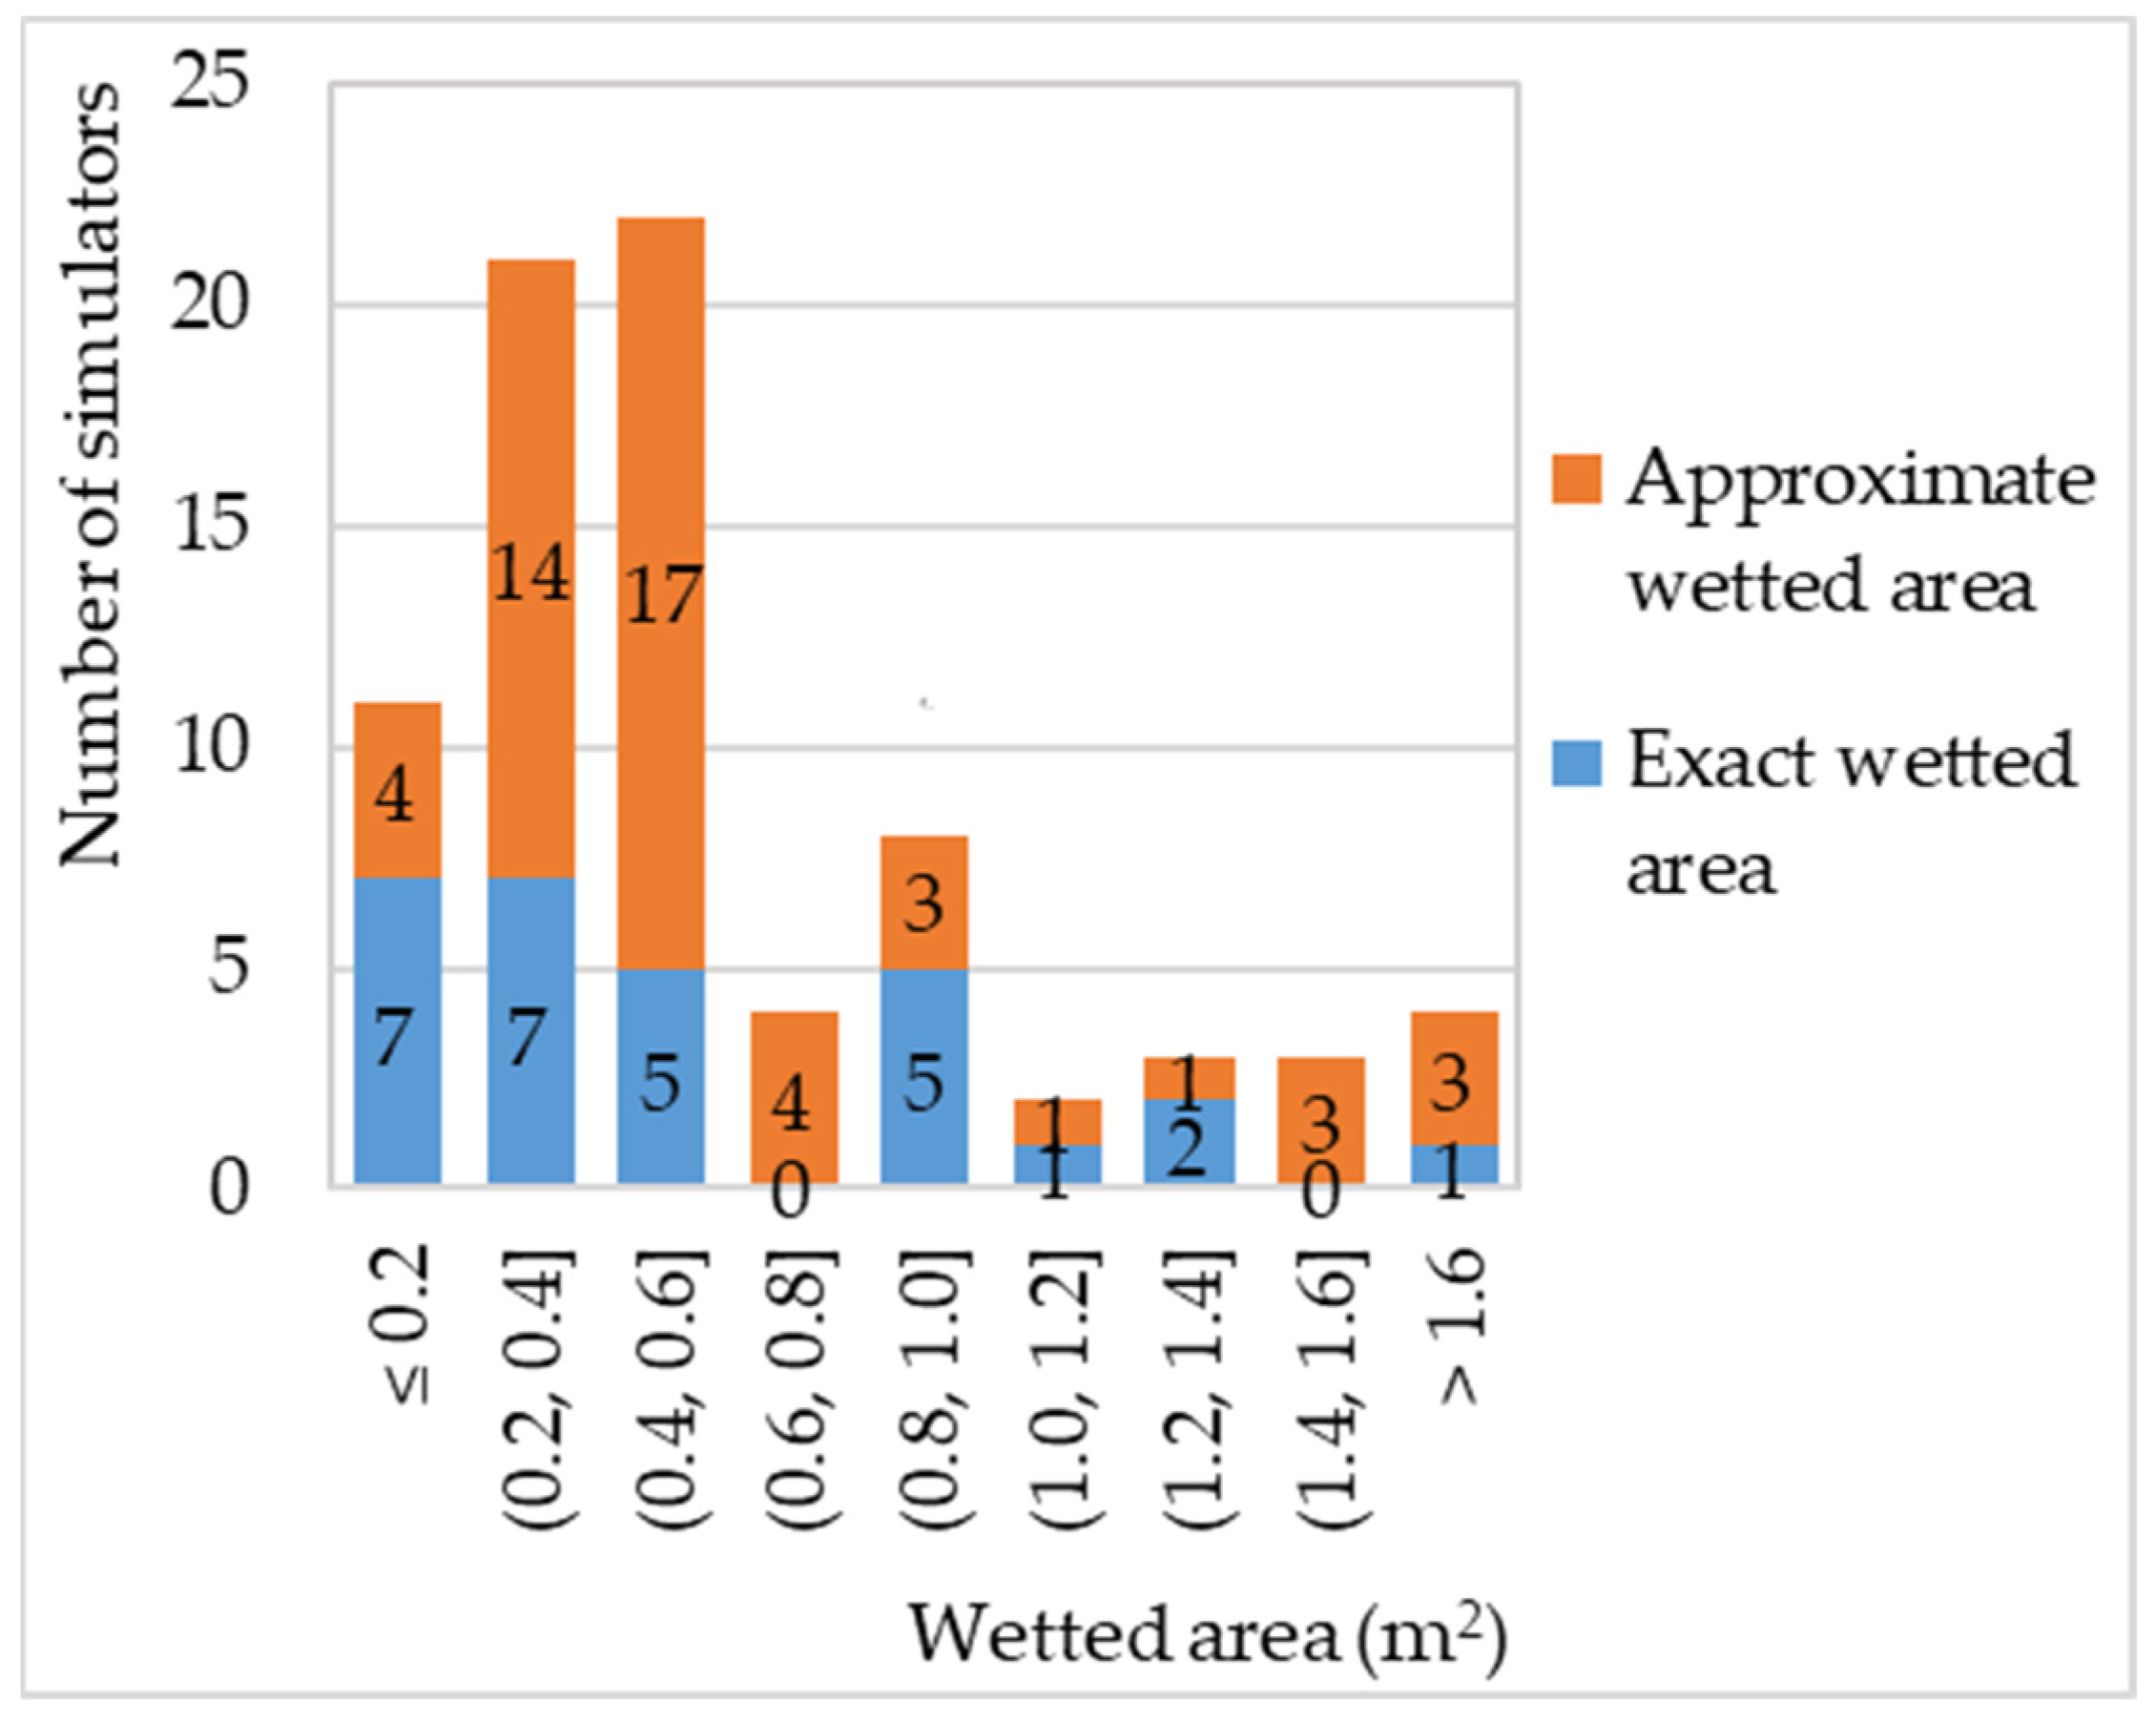
Abstract
:1. Introduction
2. Materials and Methods
3. Results and Discussion
3.1. Wetted Area
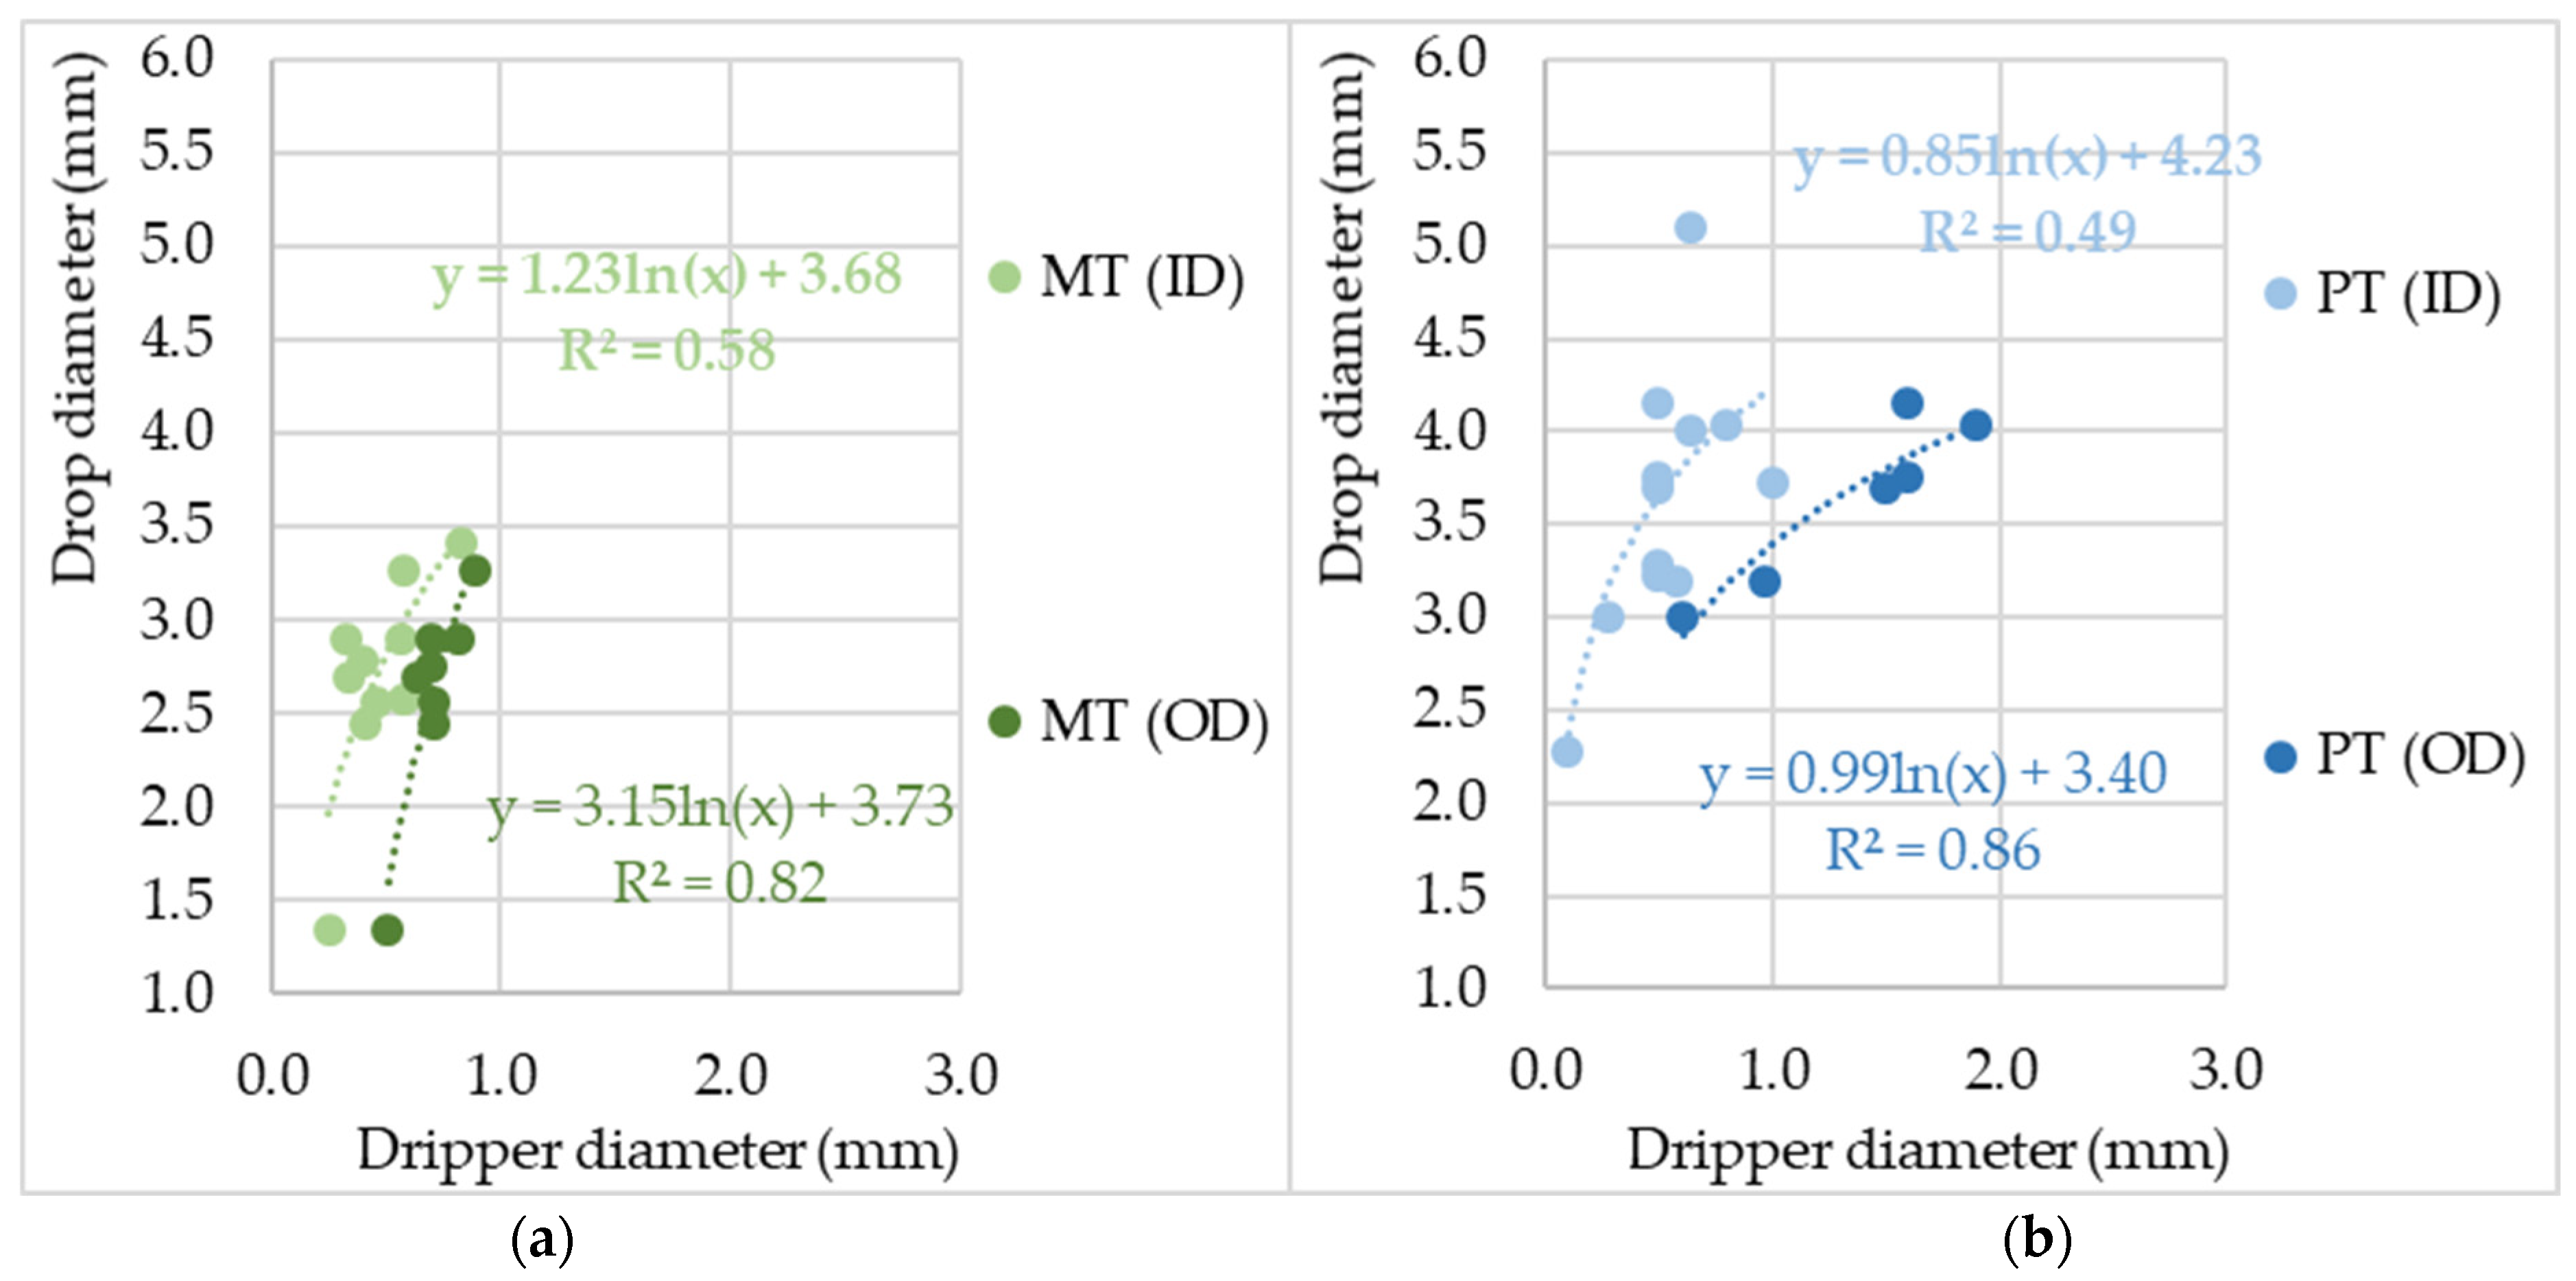
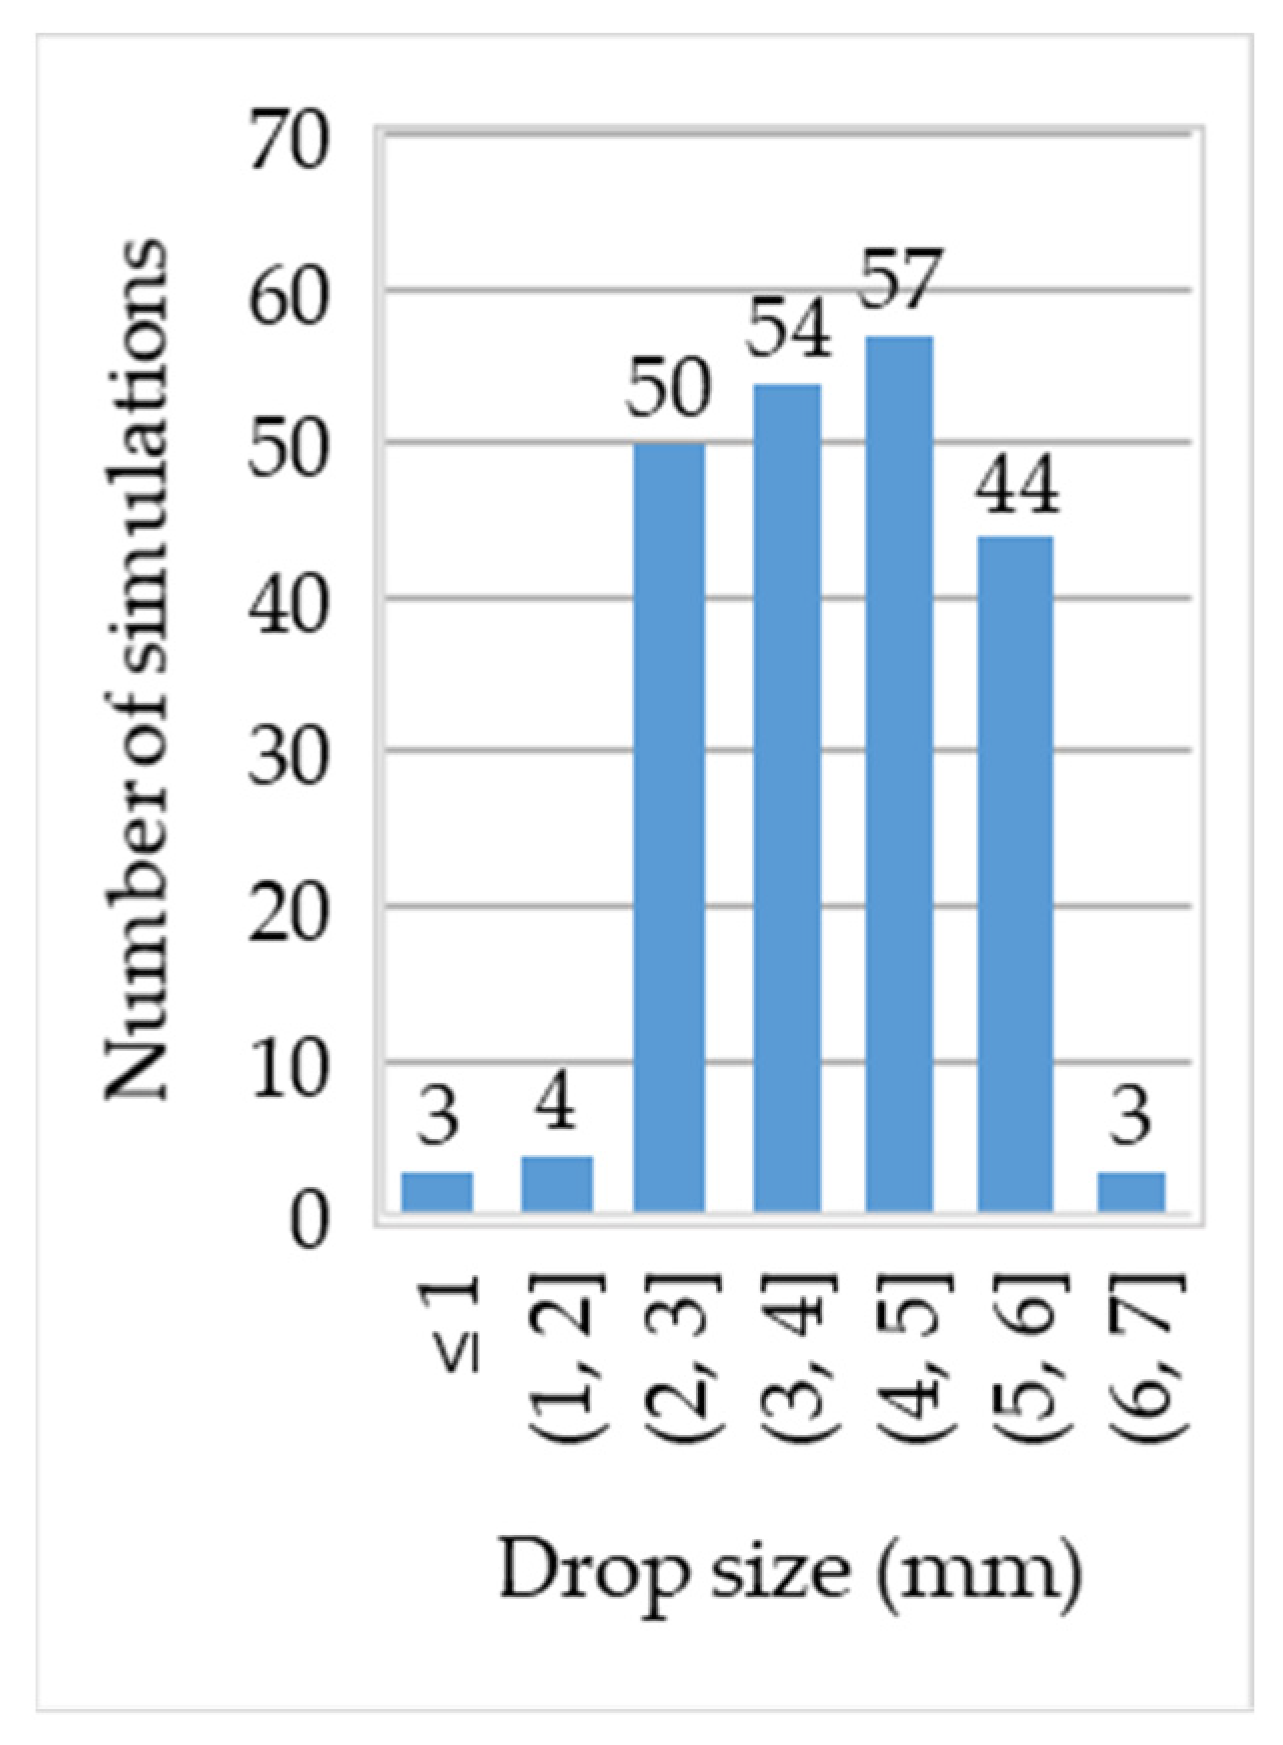
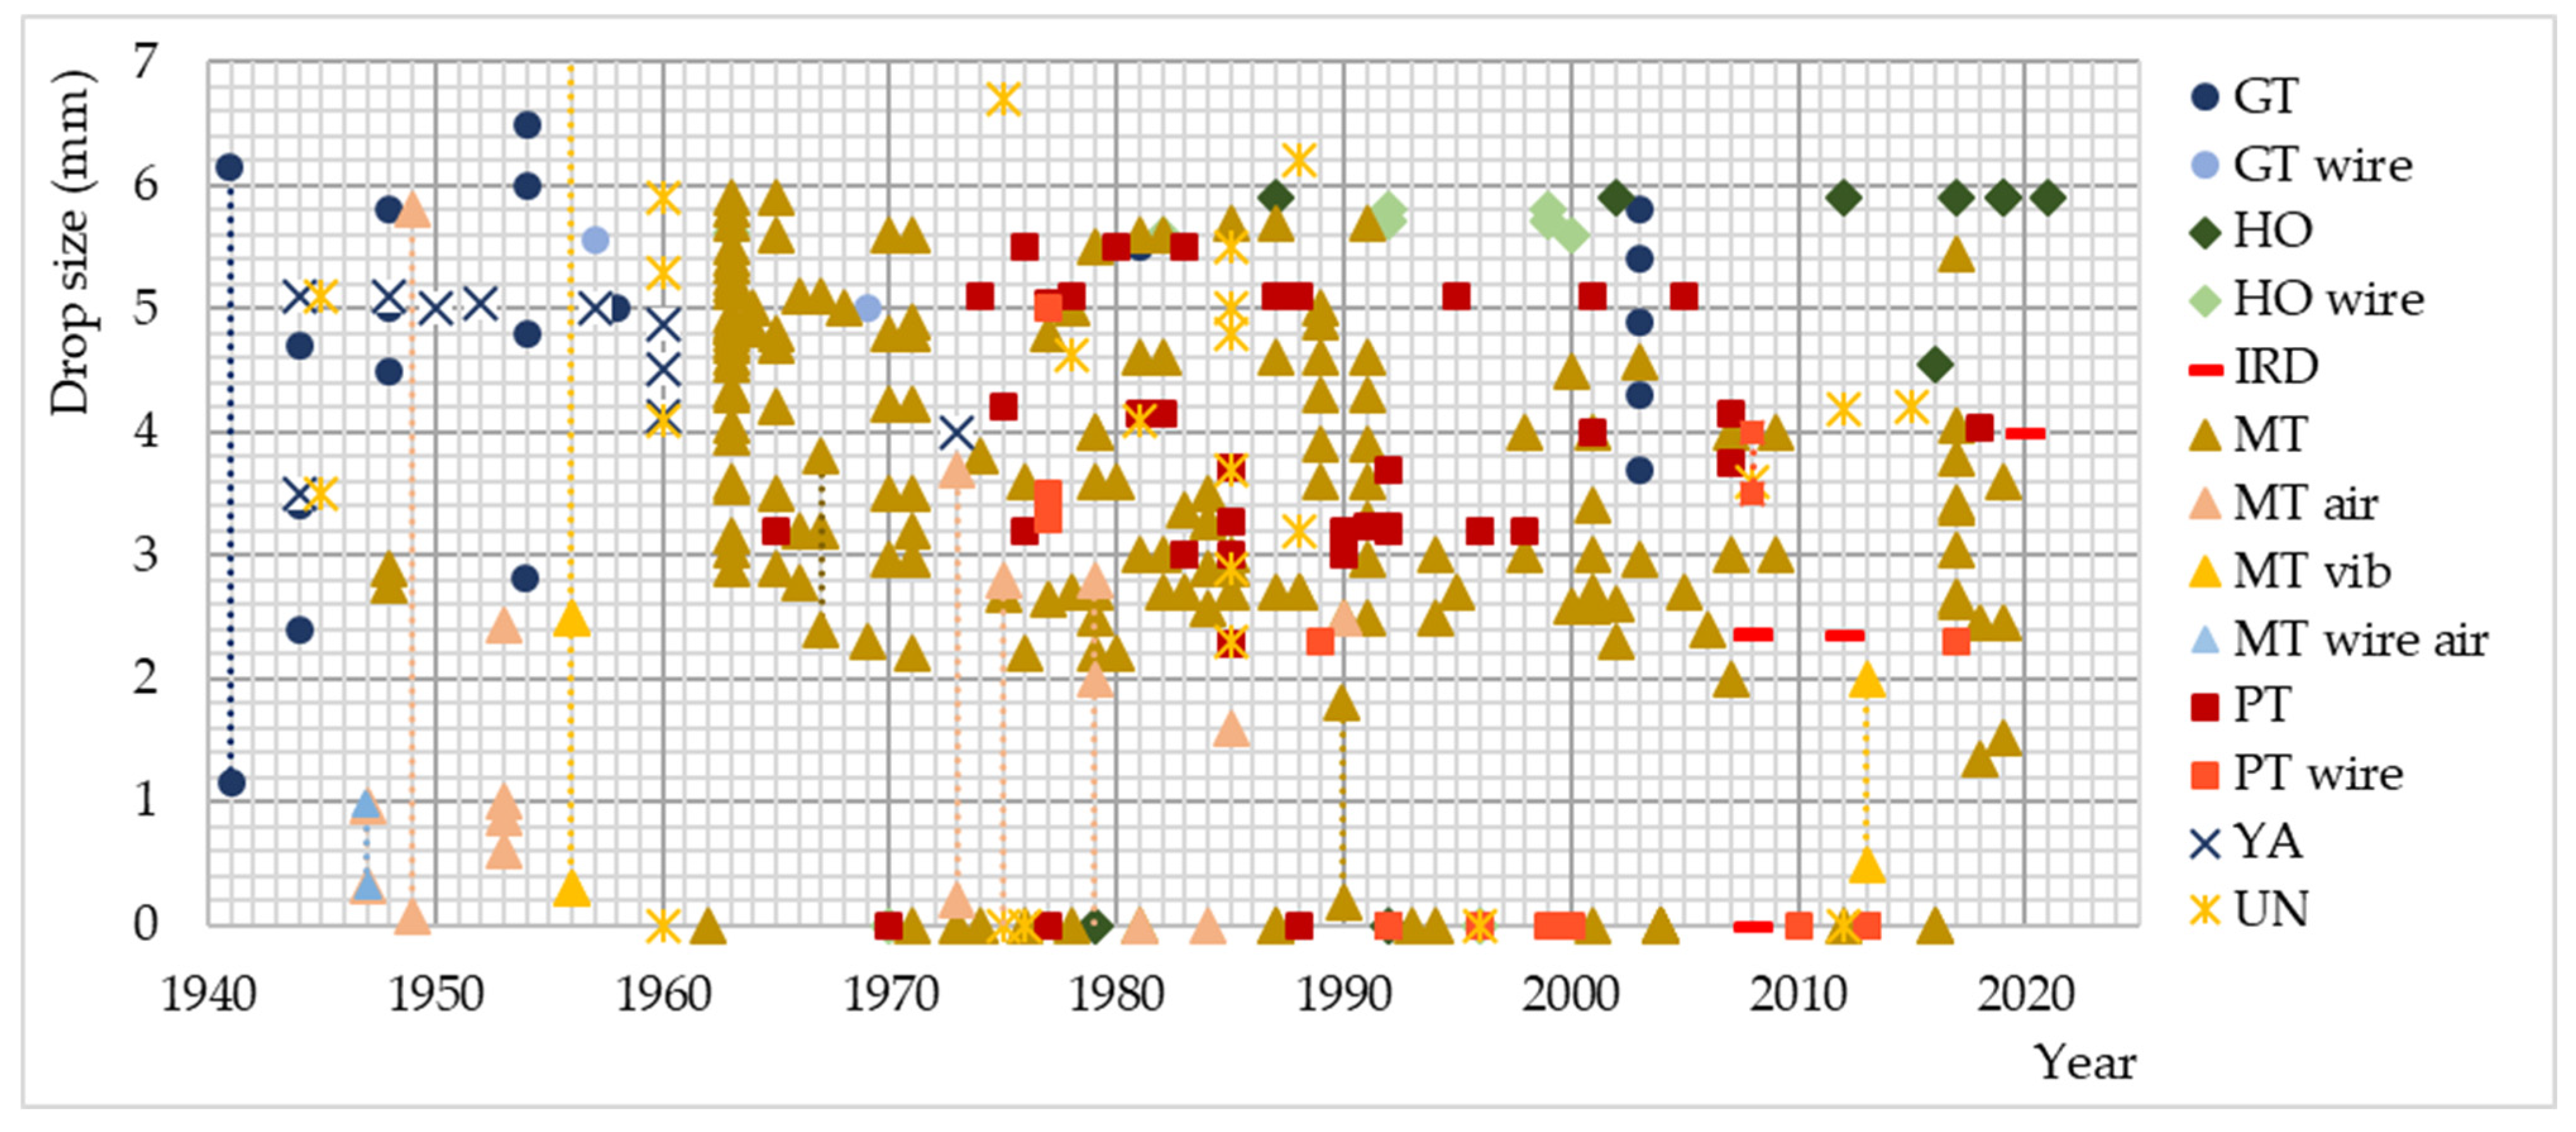
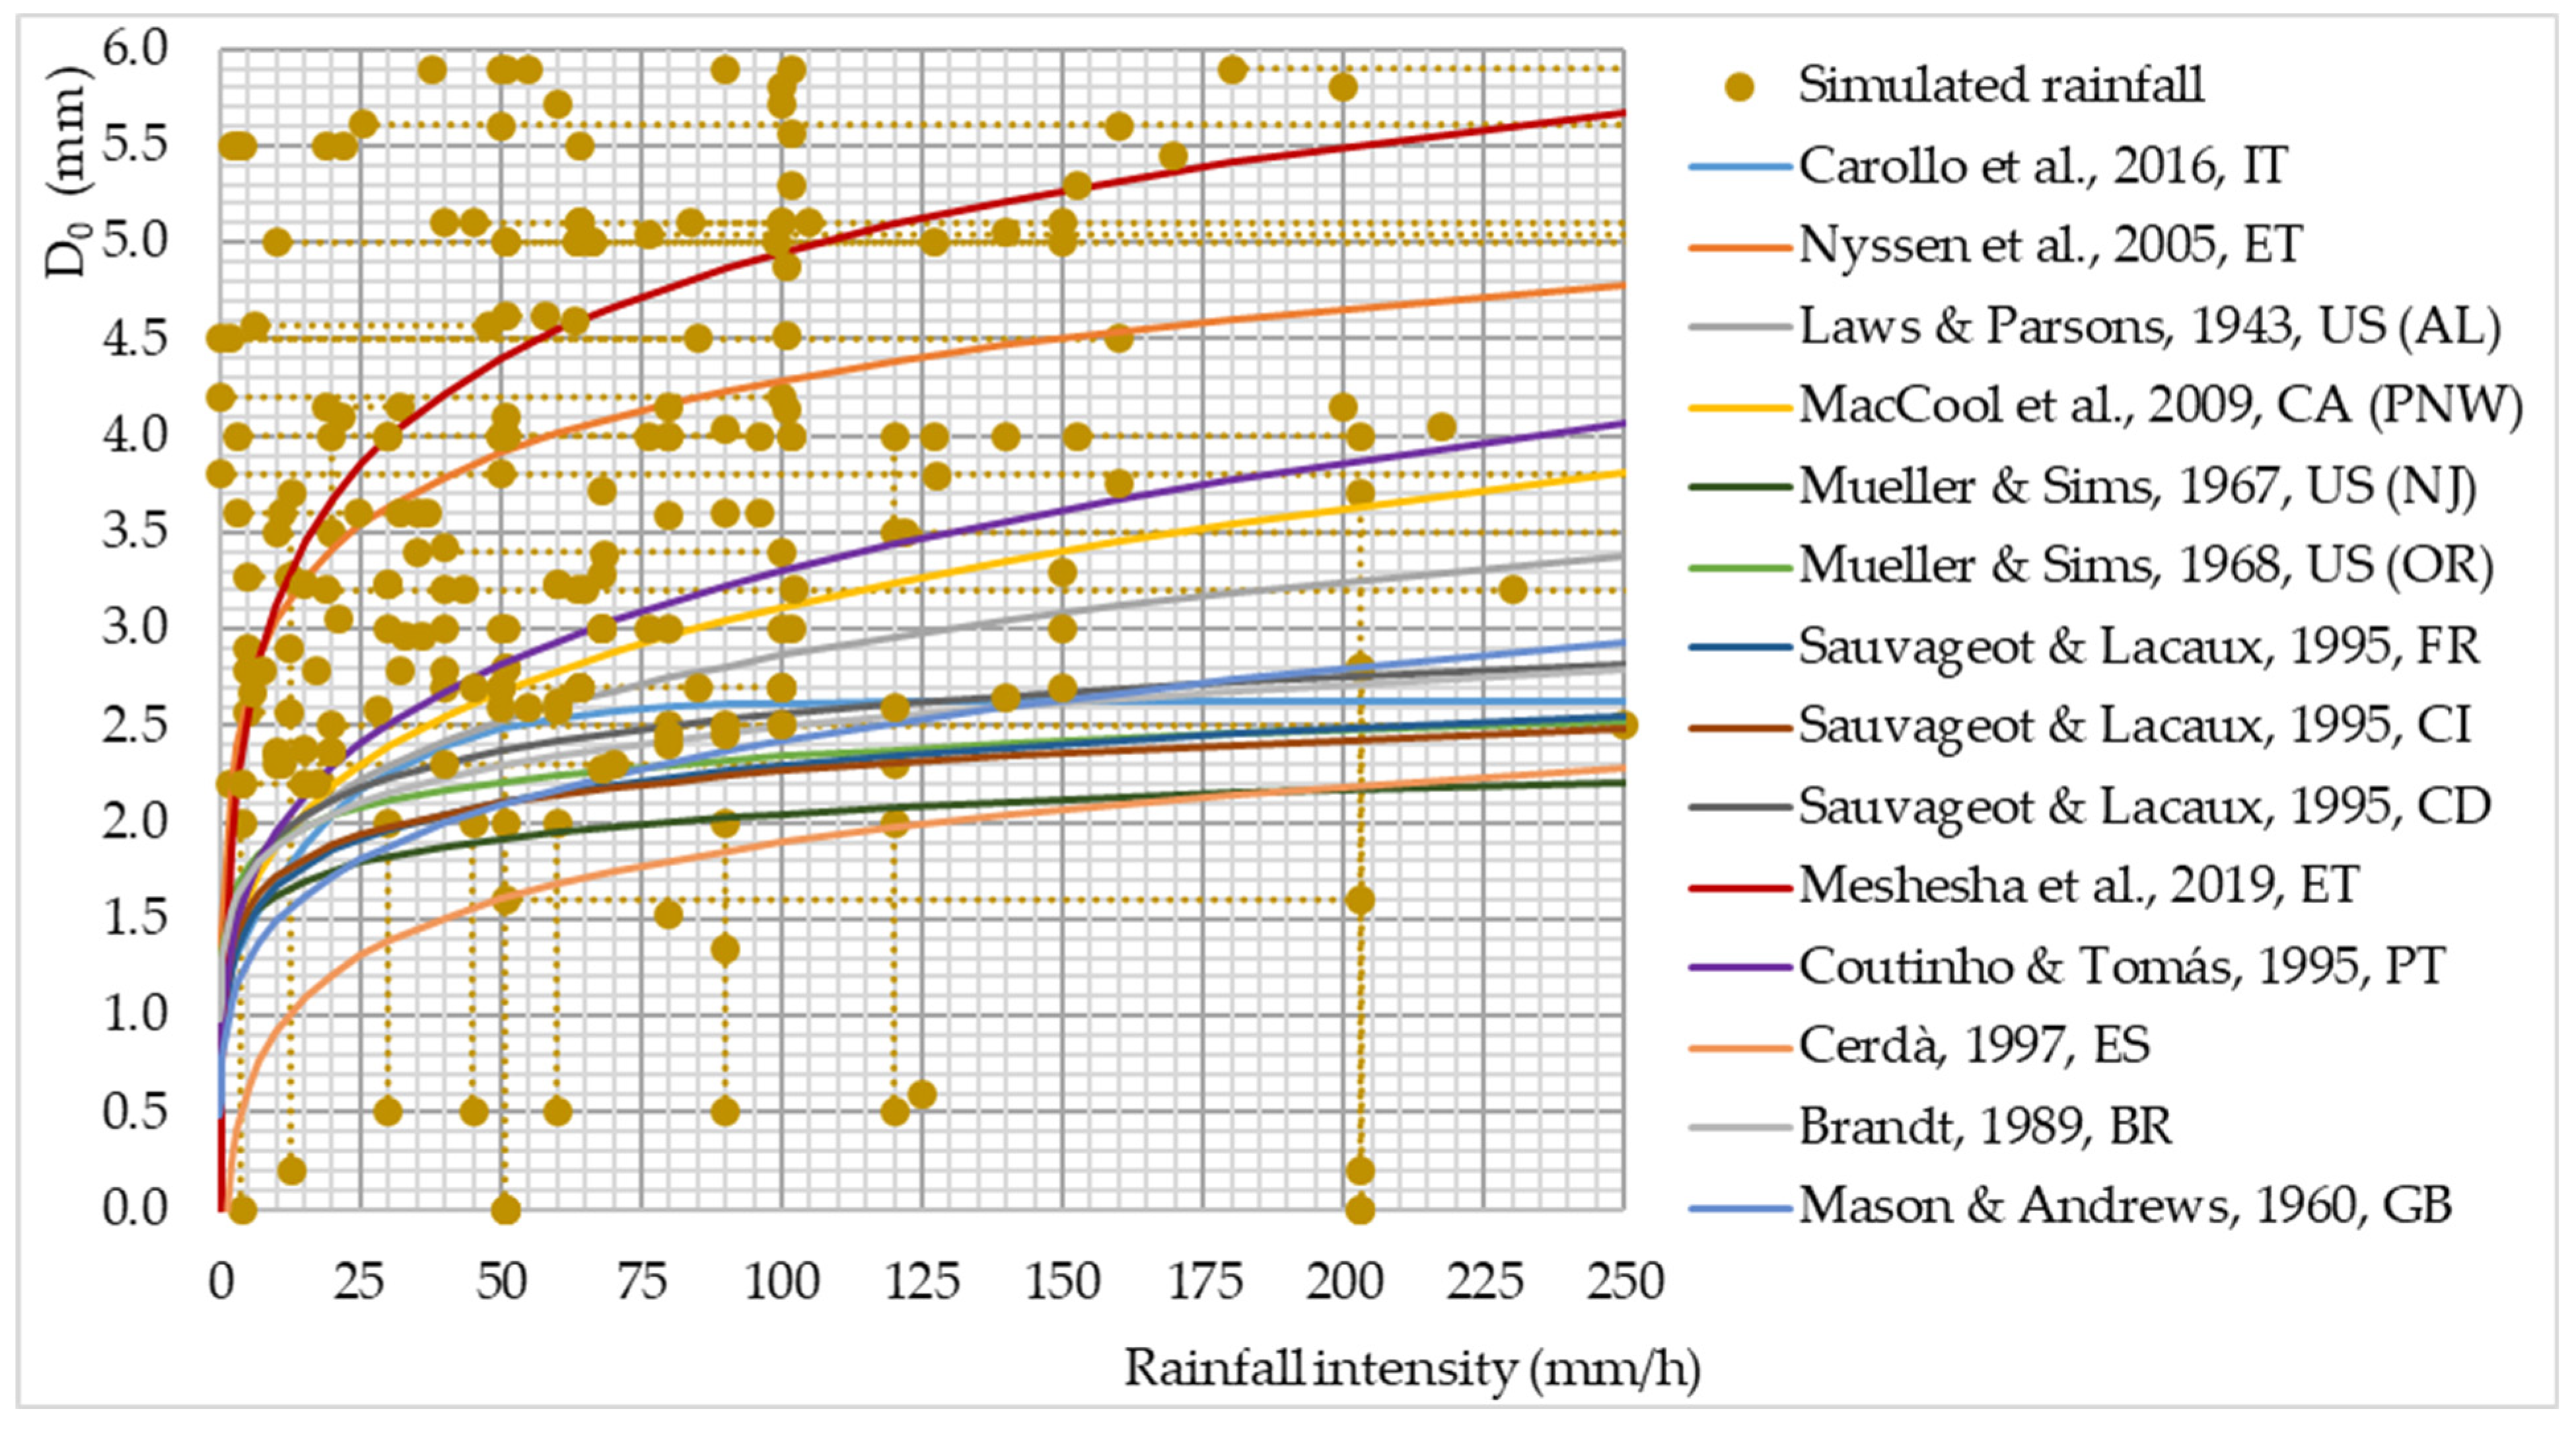
3.2. Drop Size
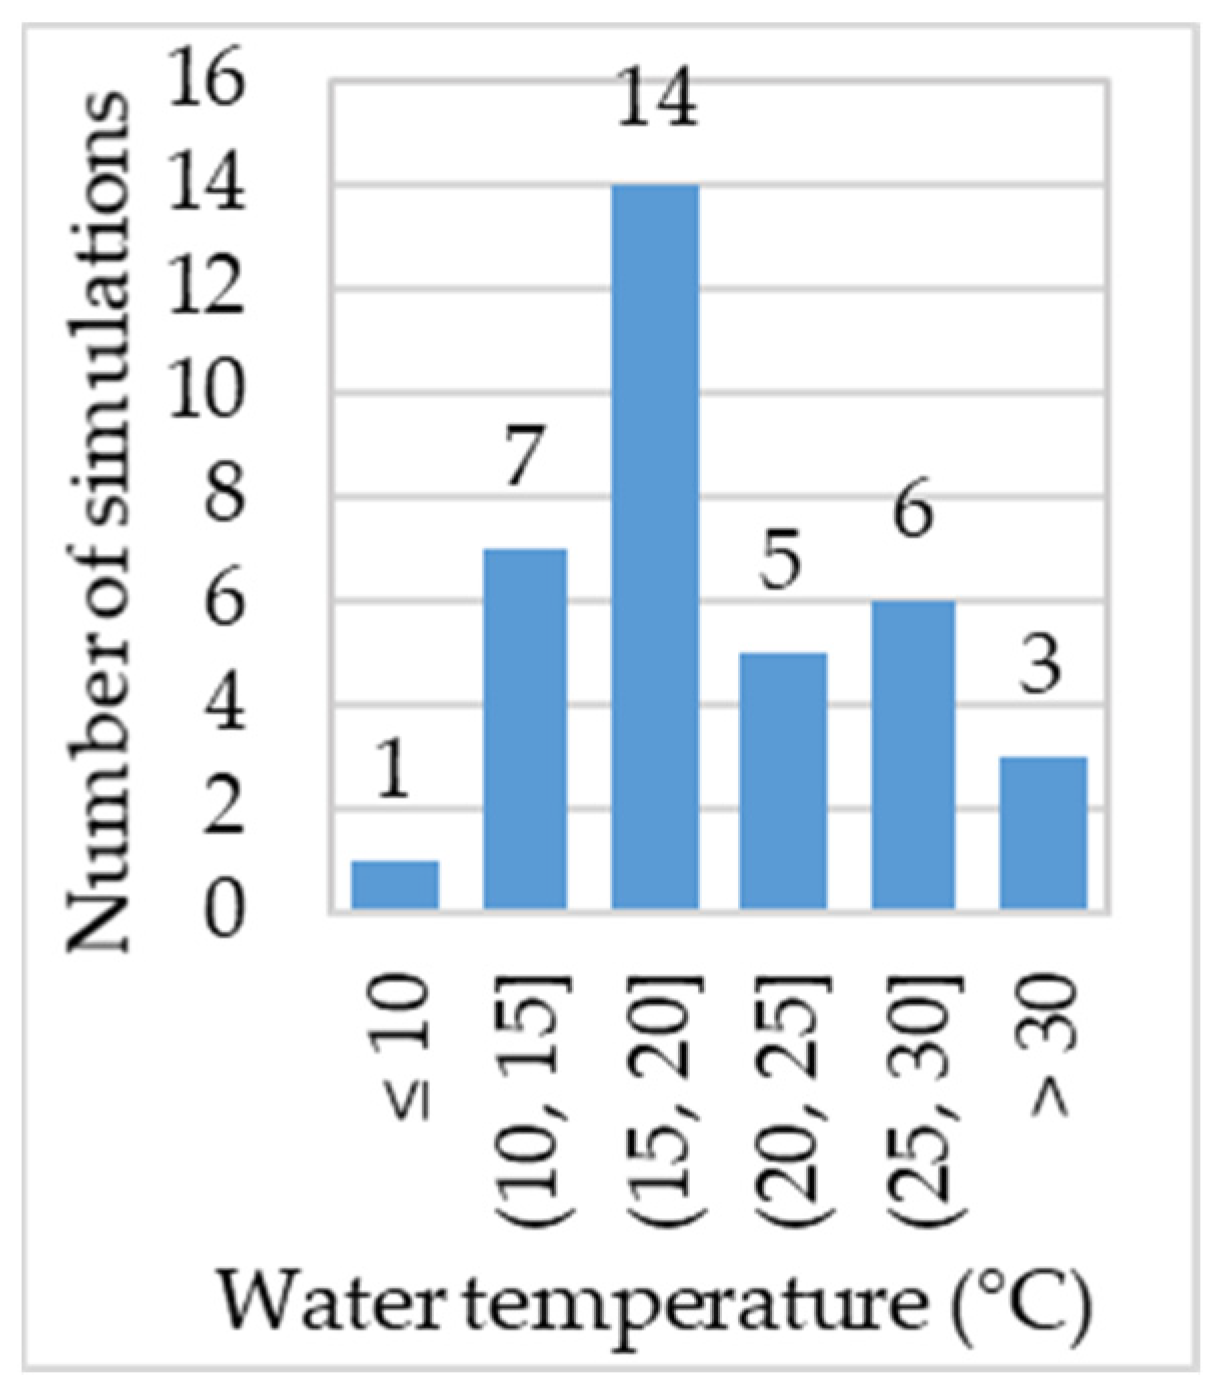
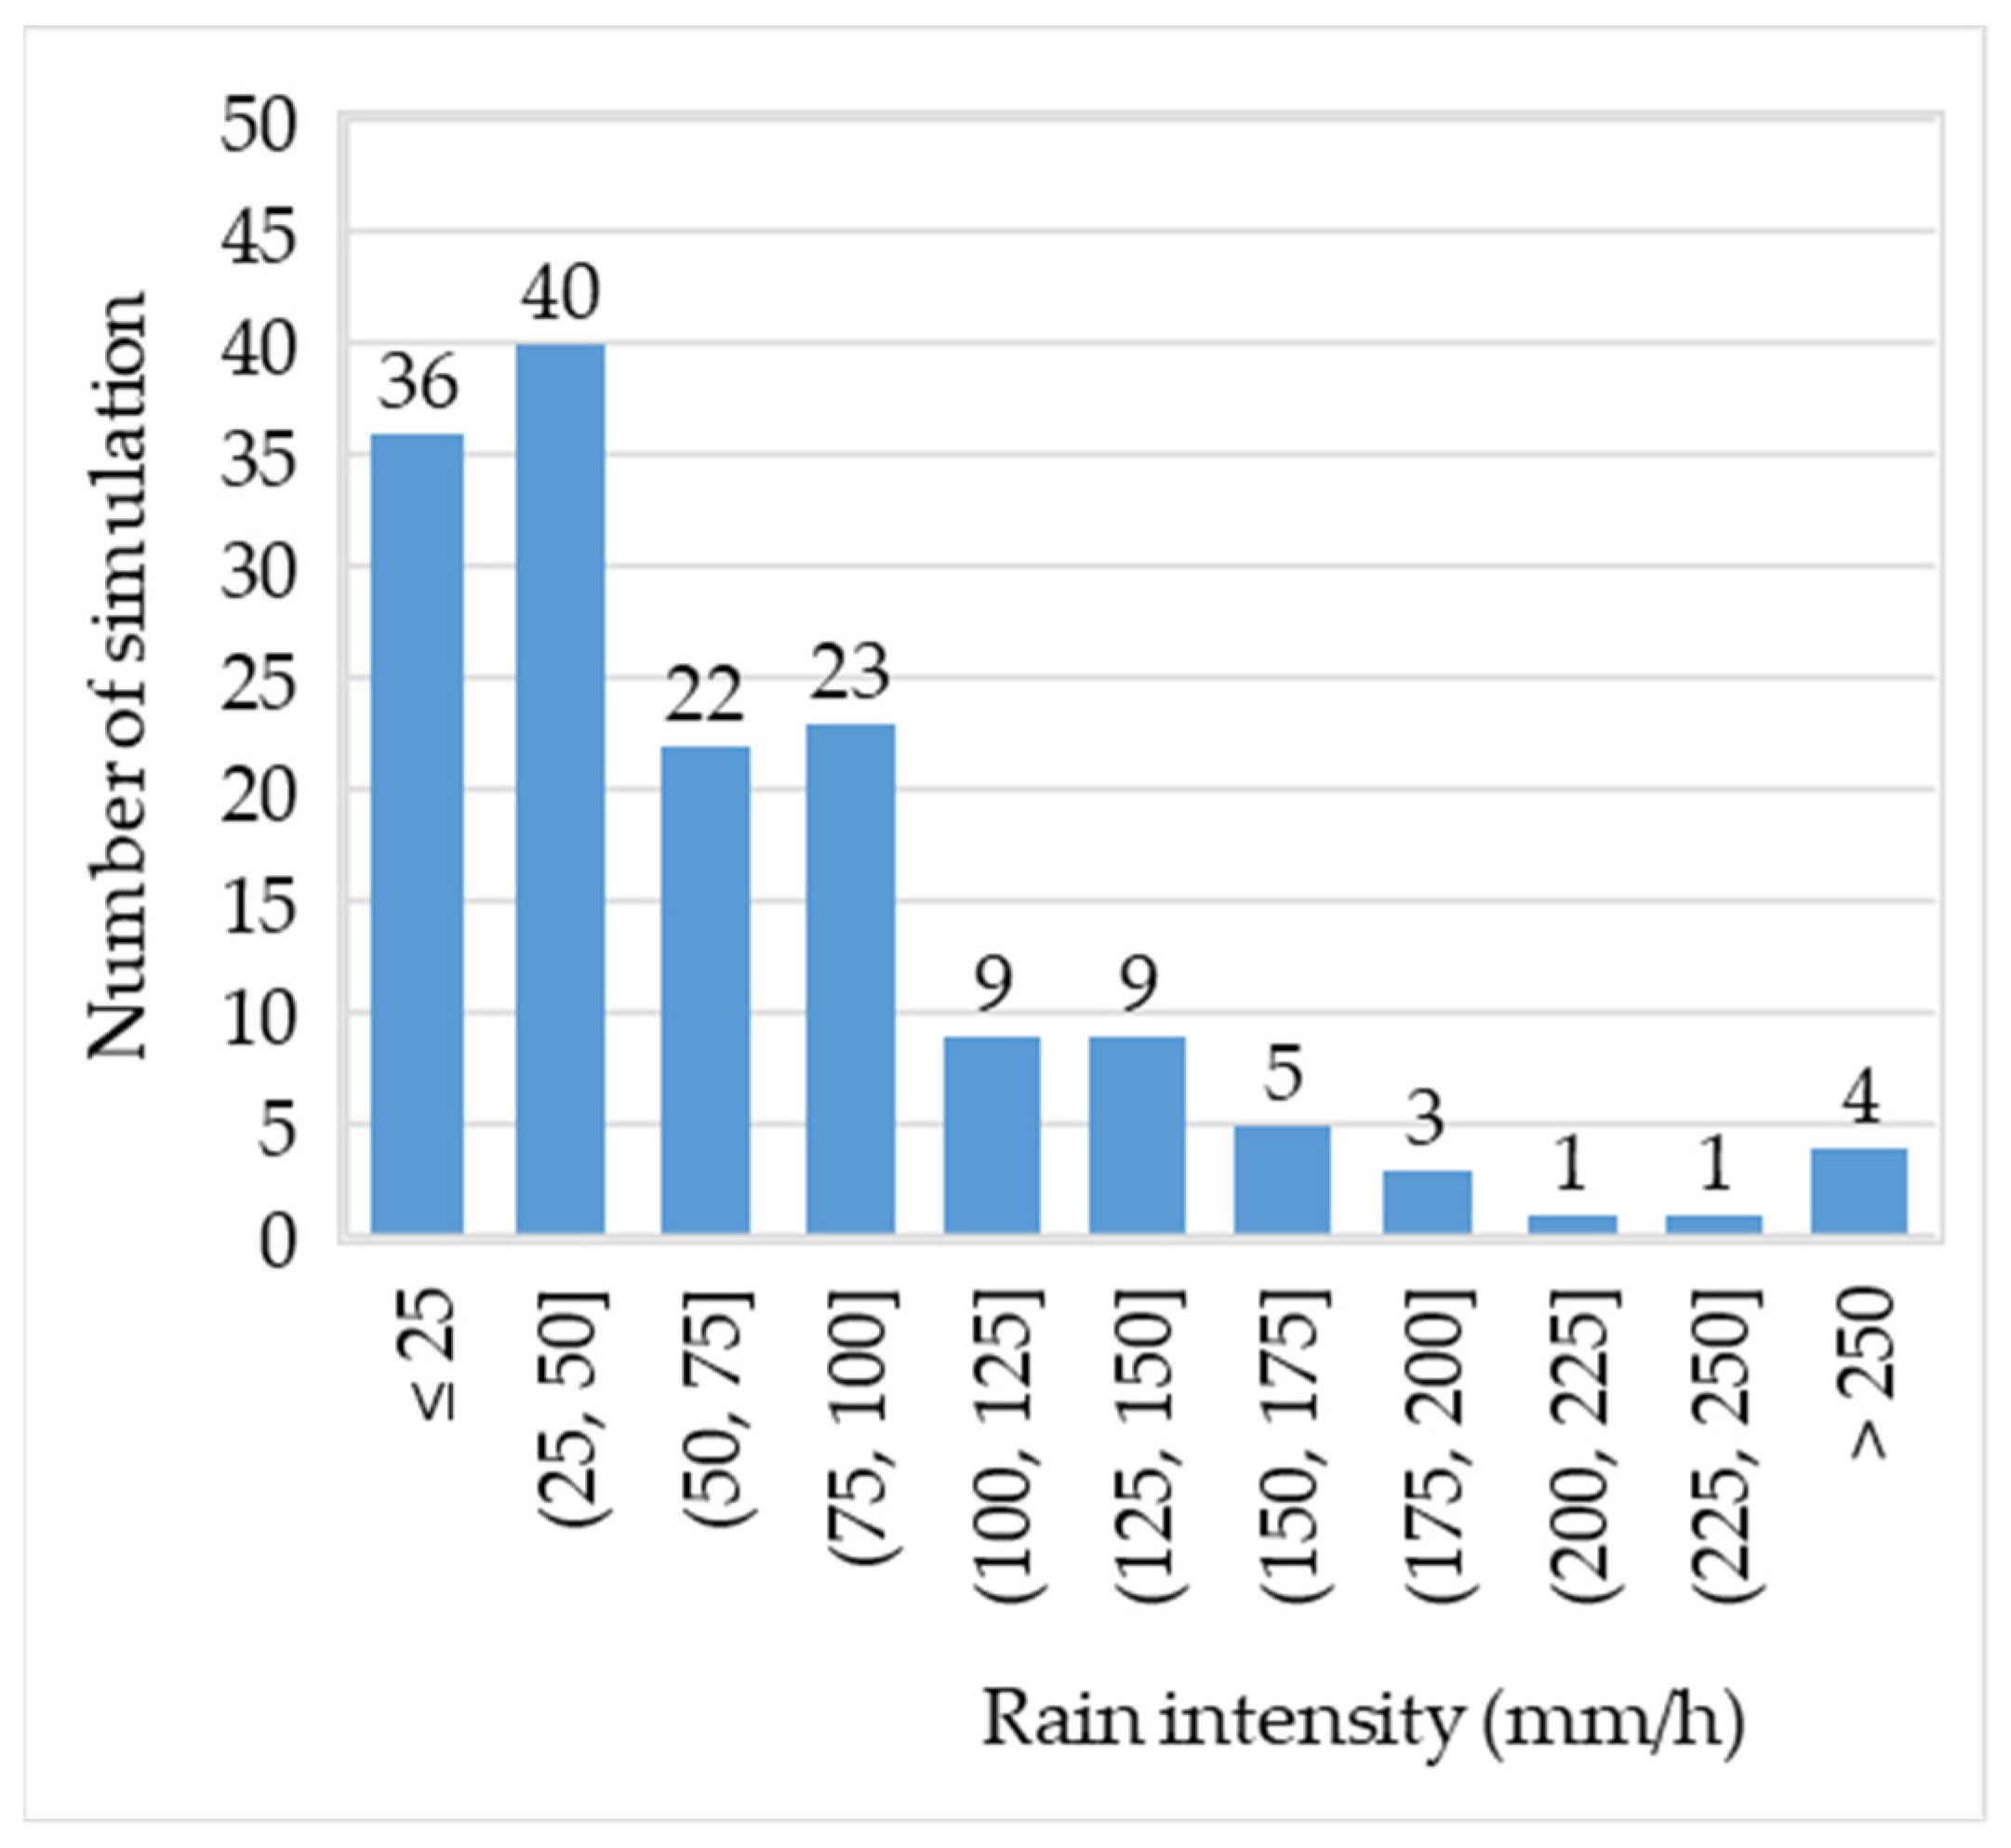
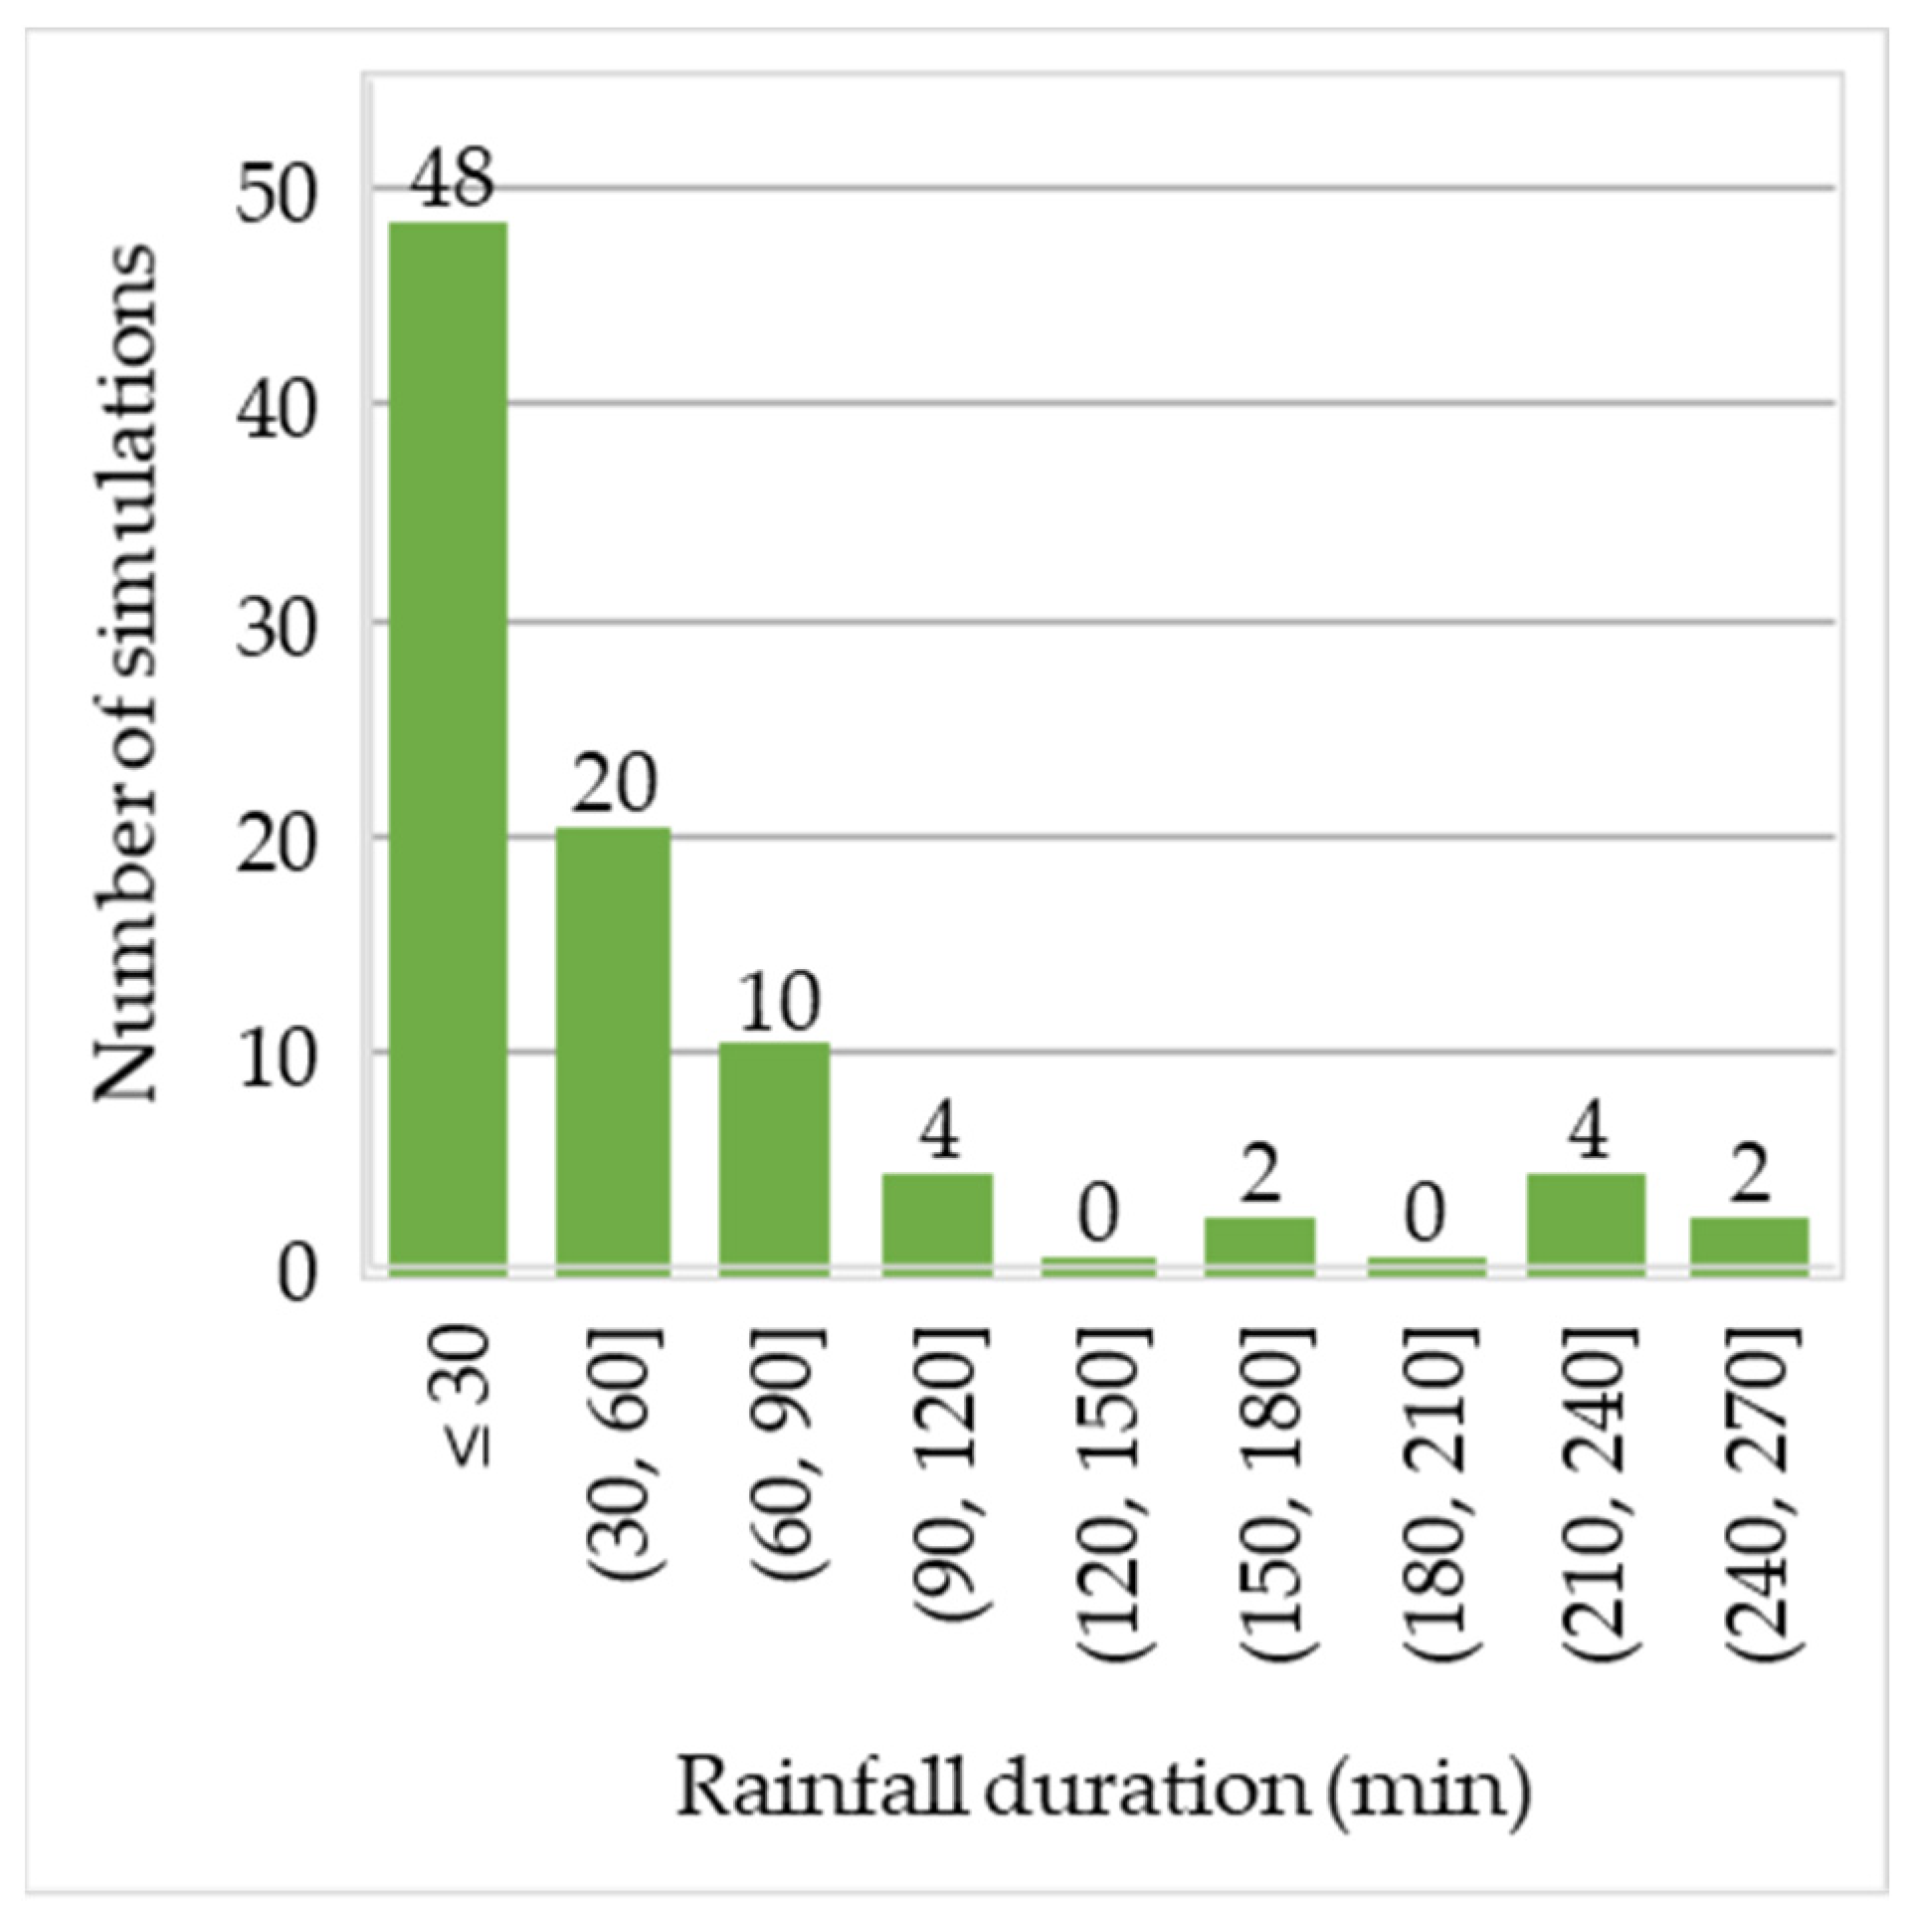
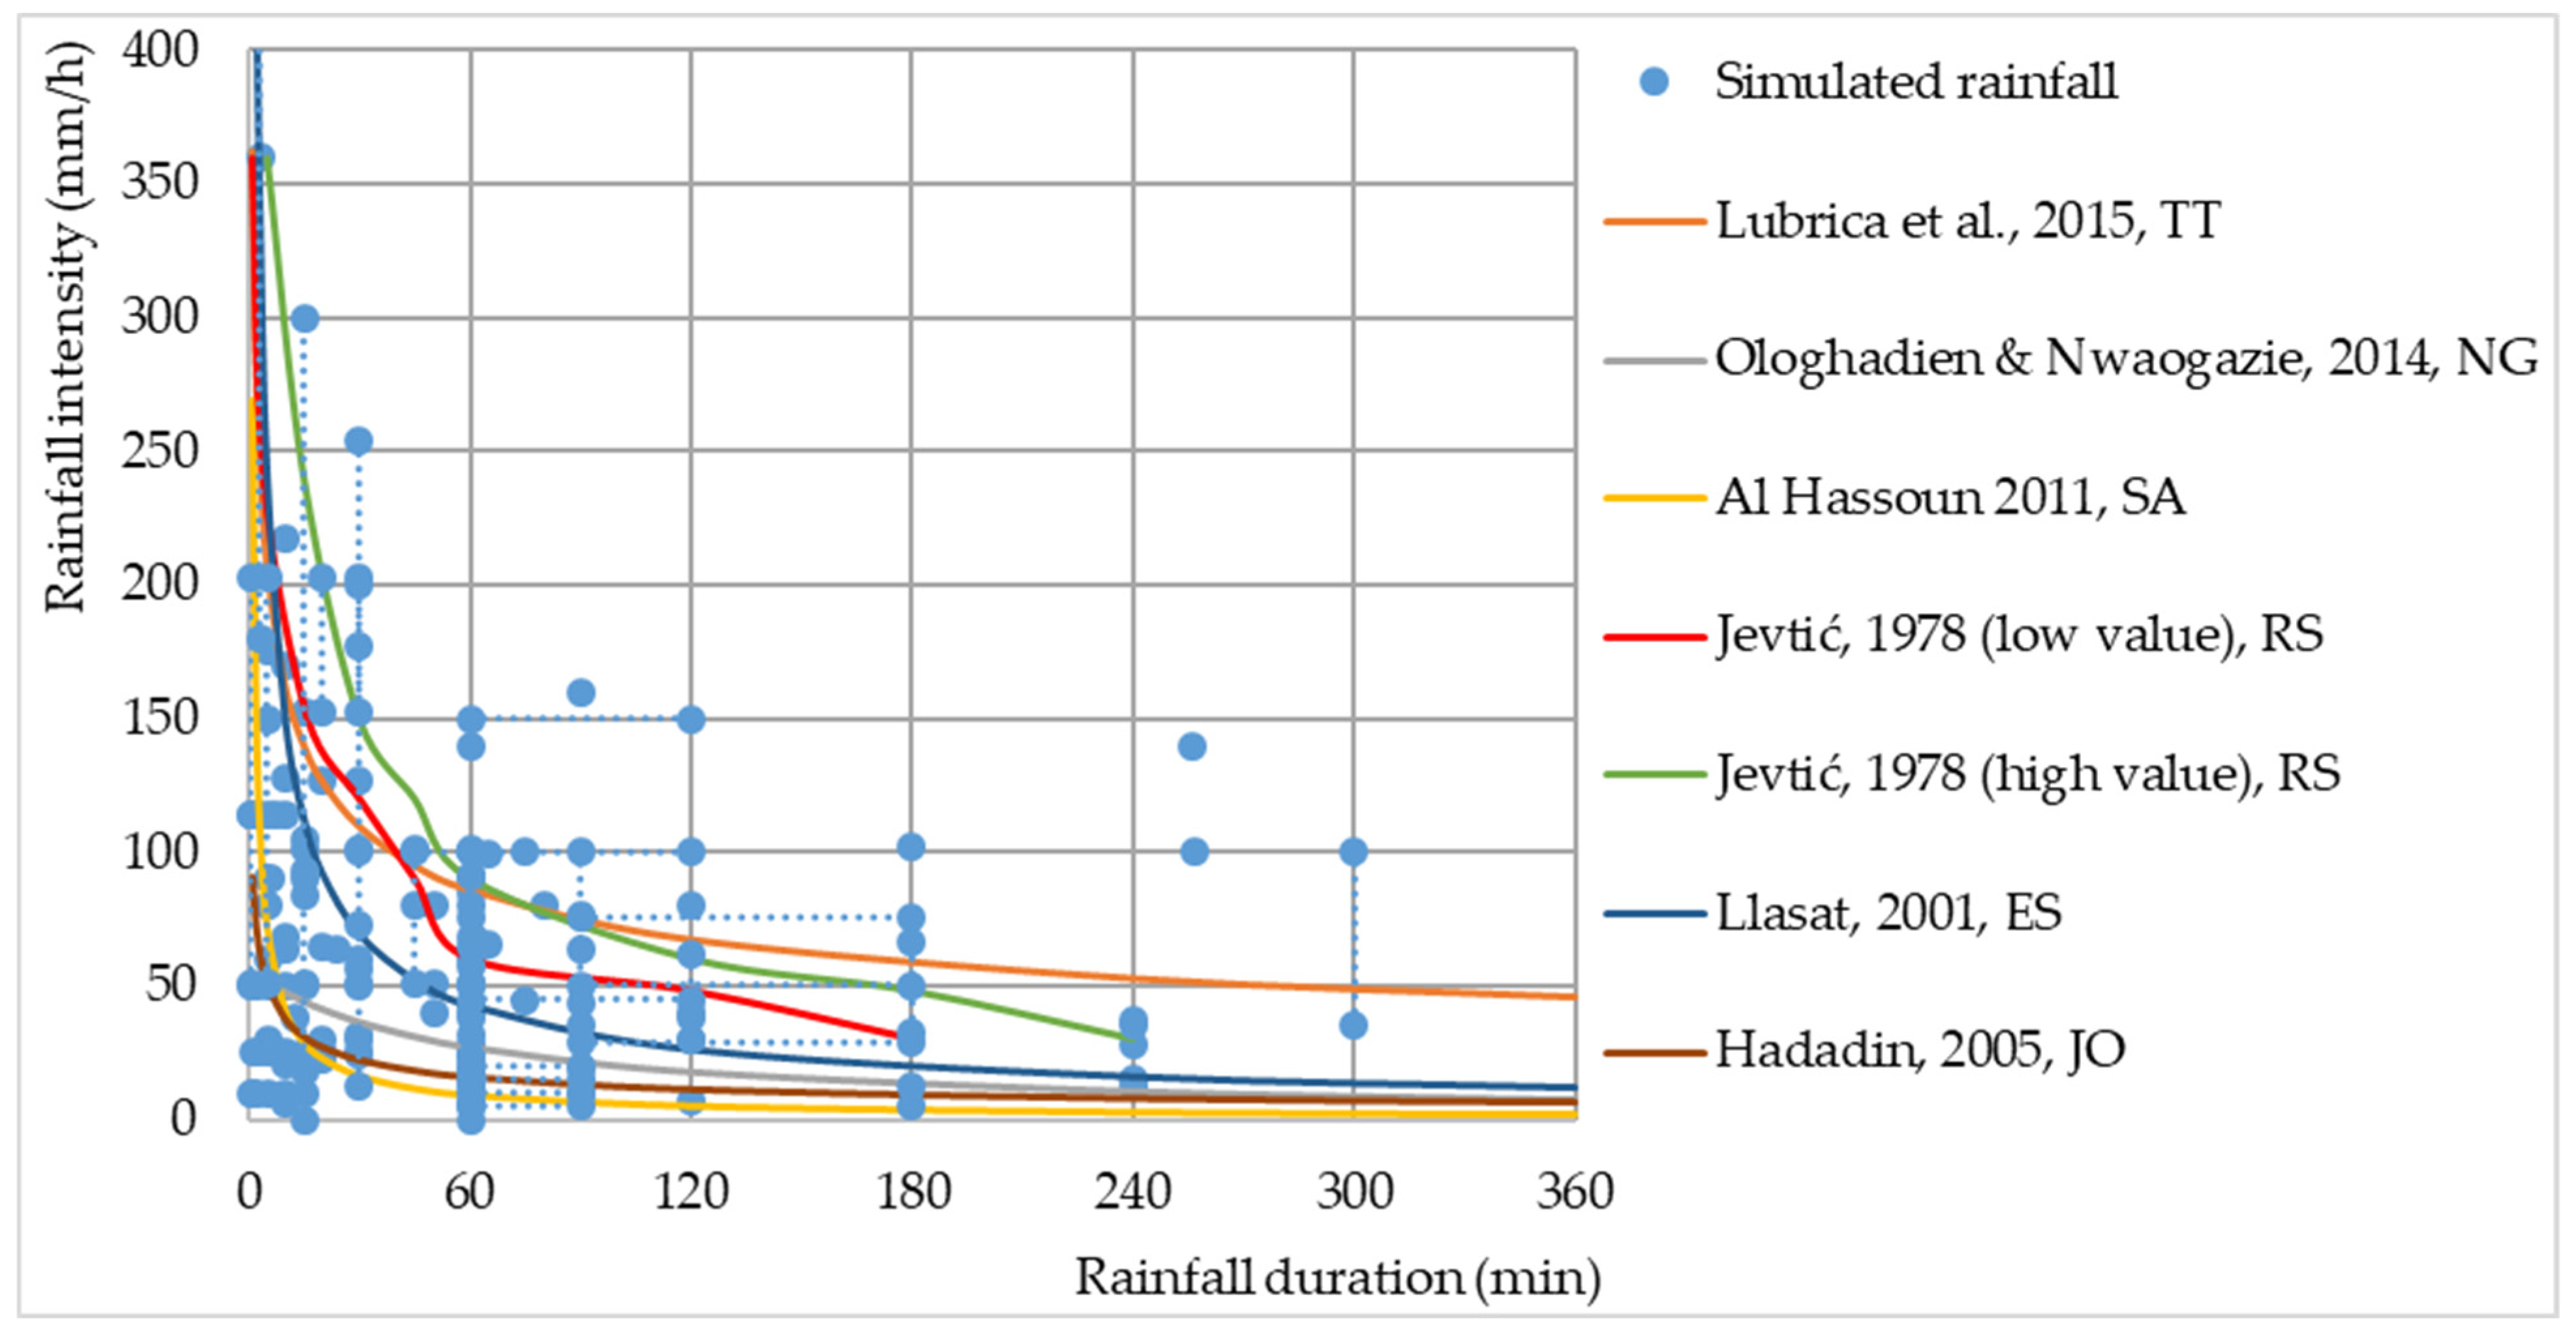
3.3. Rainfall Intensity and Duration
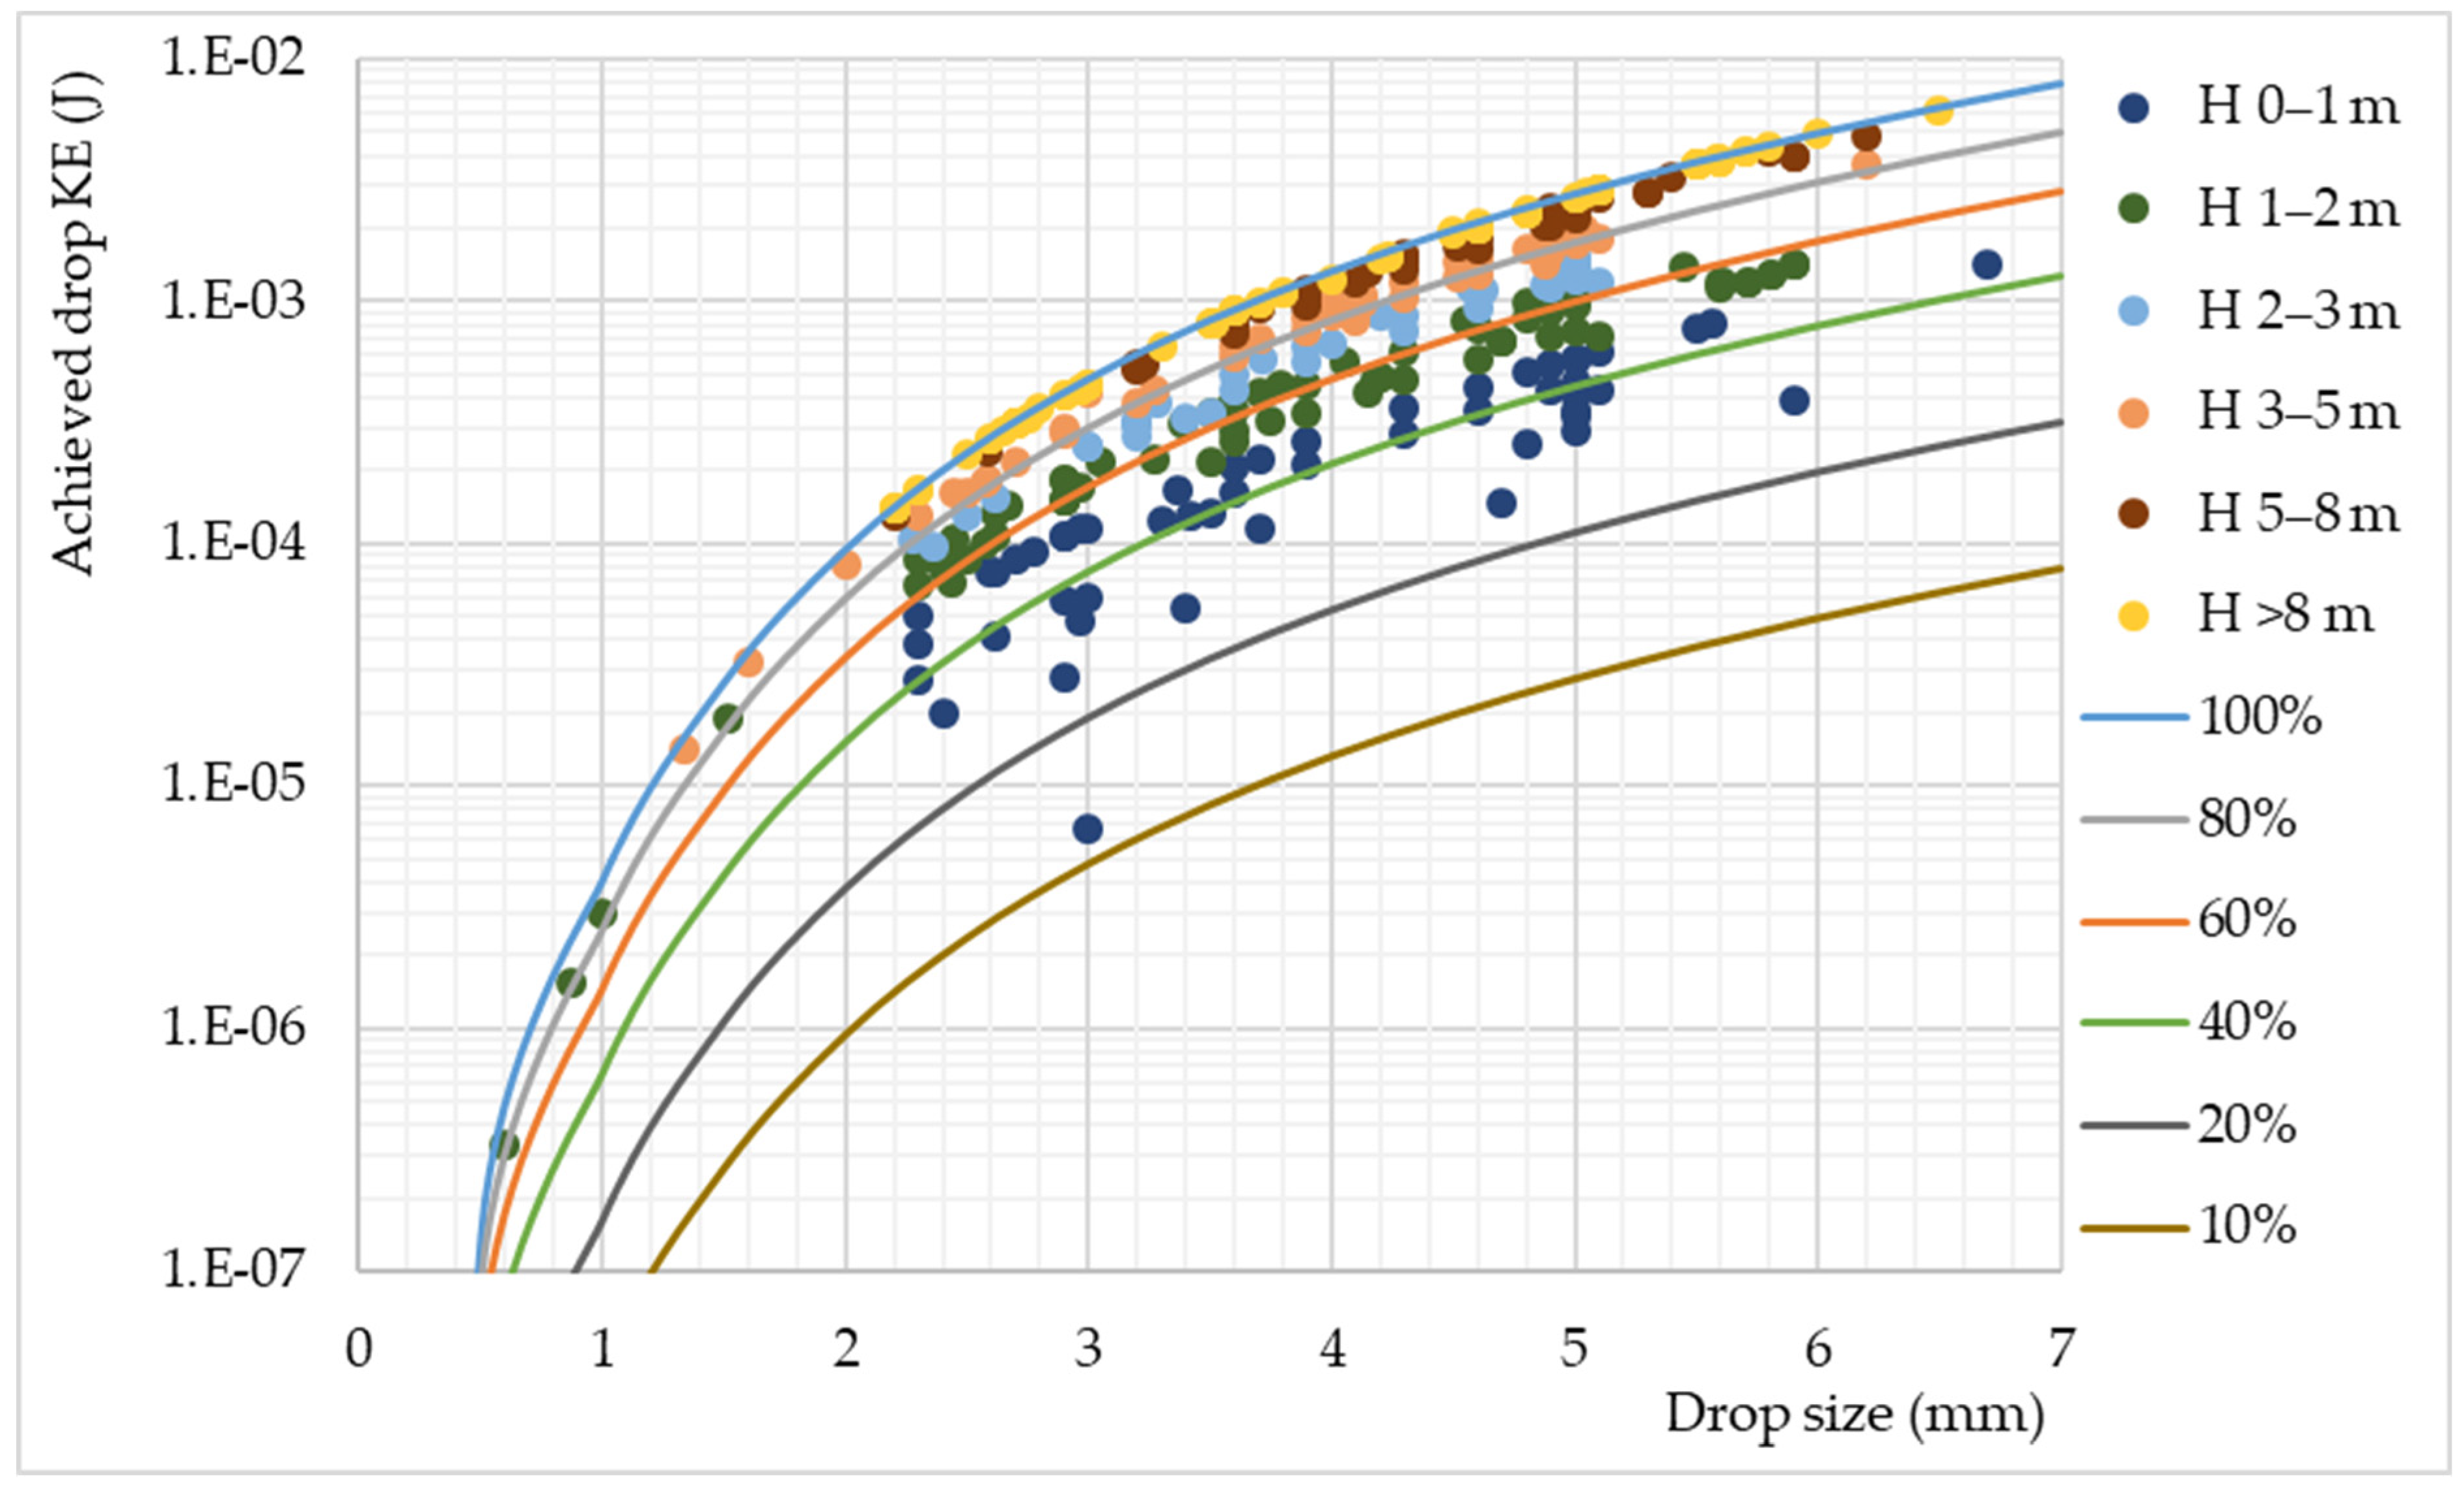
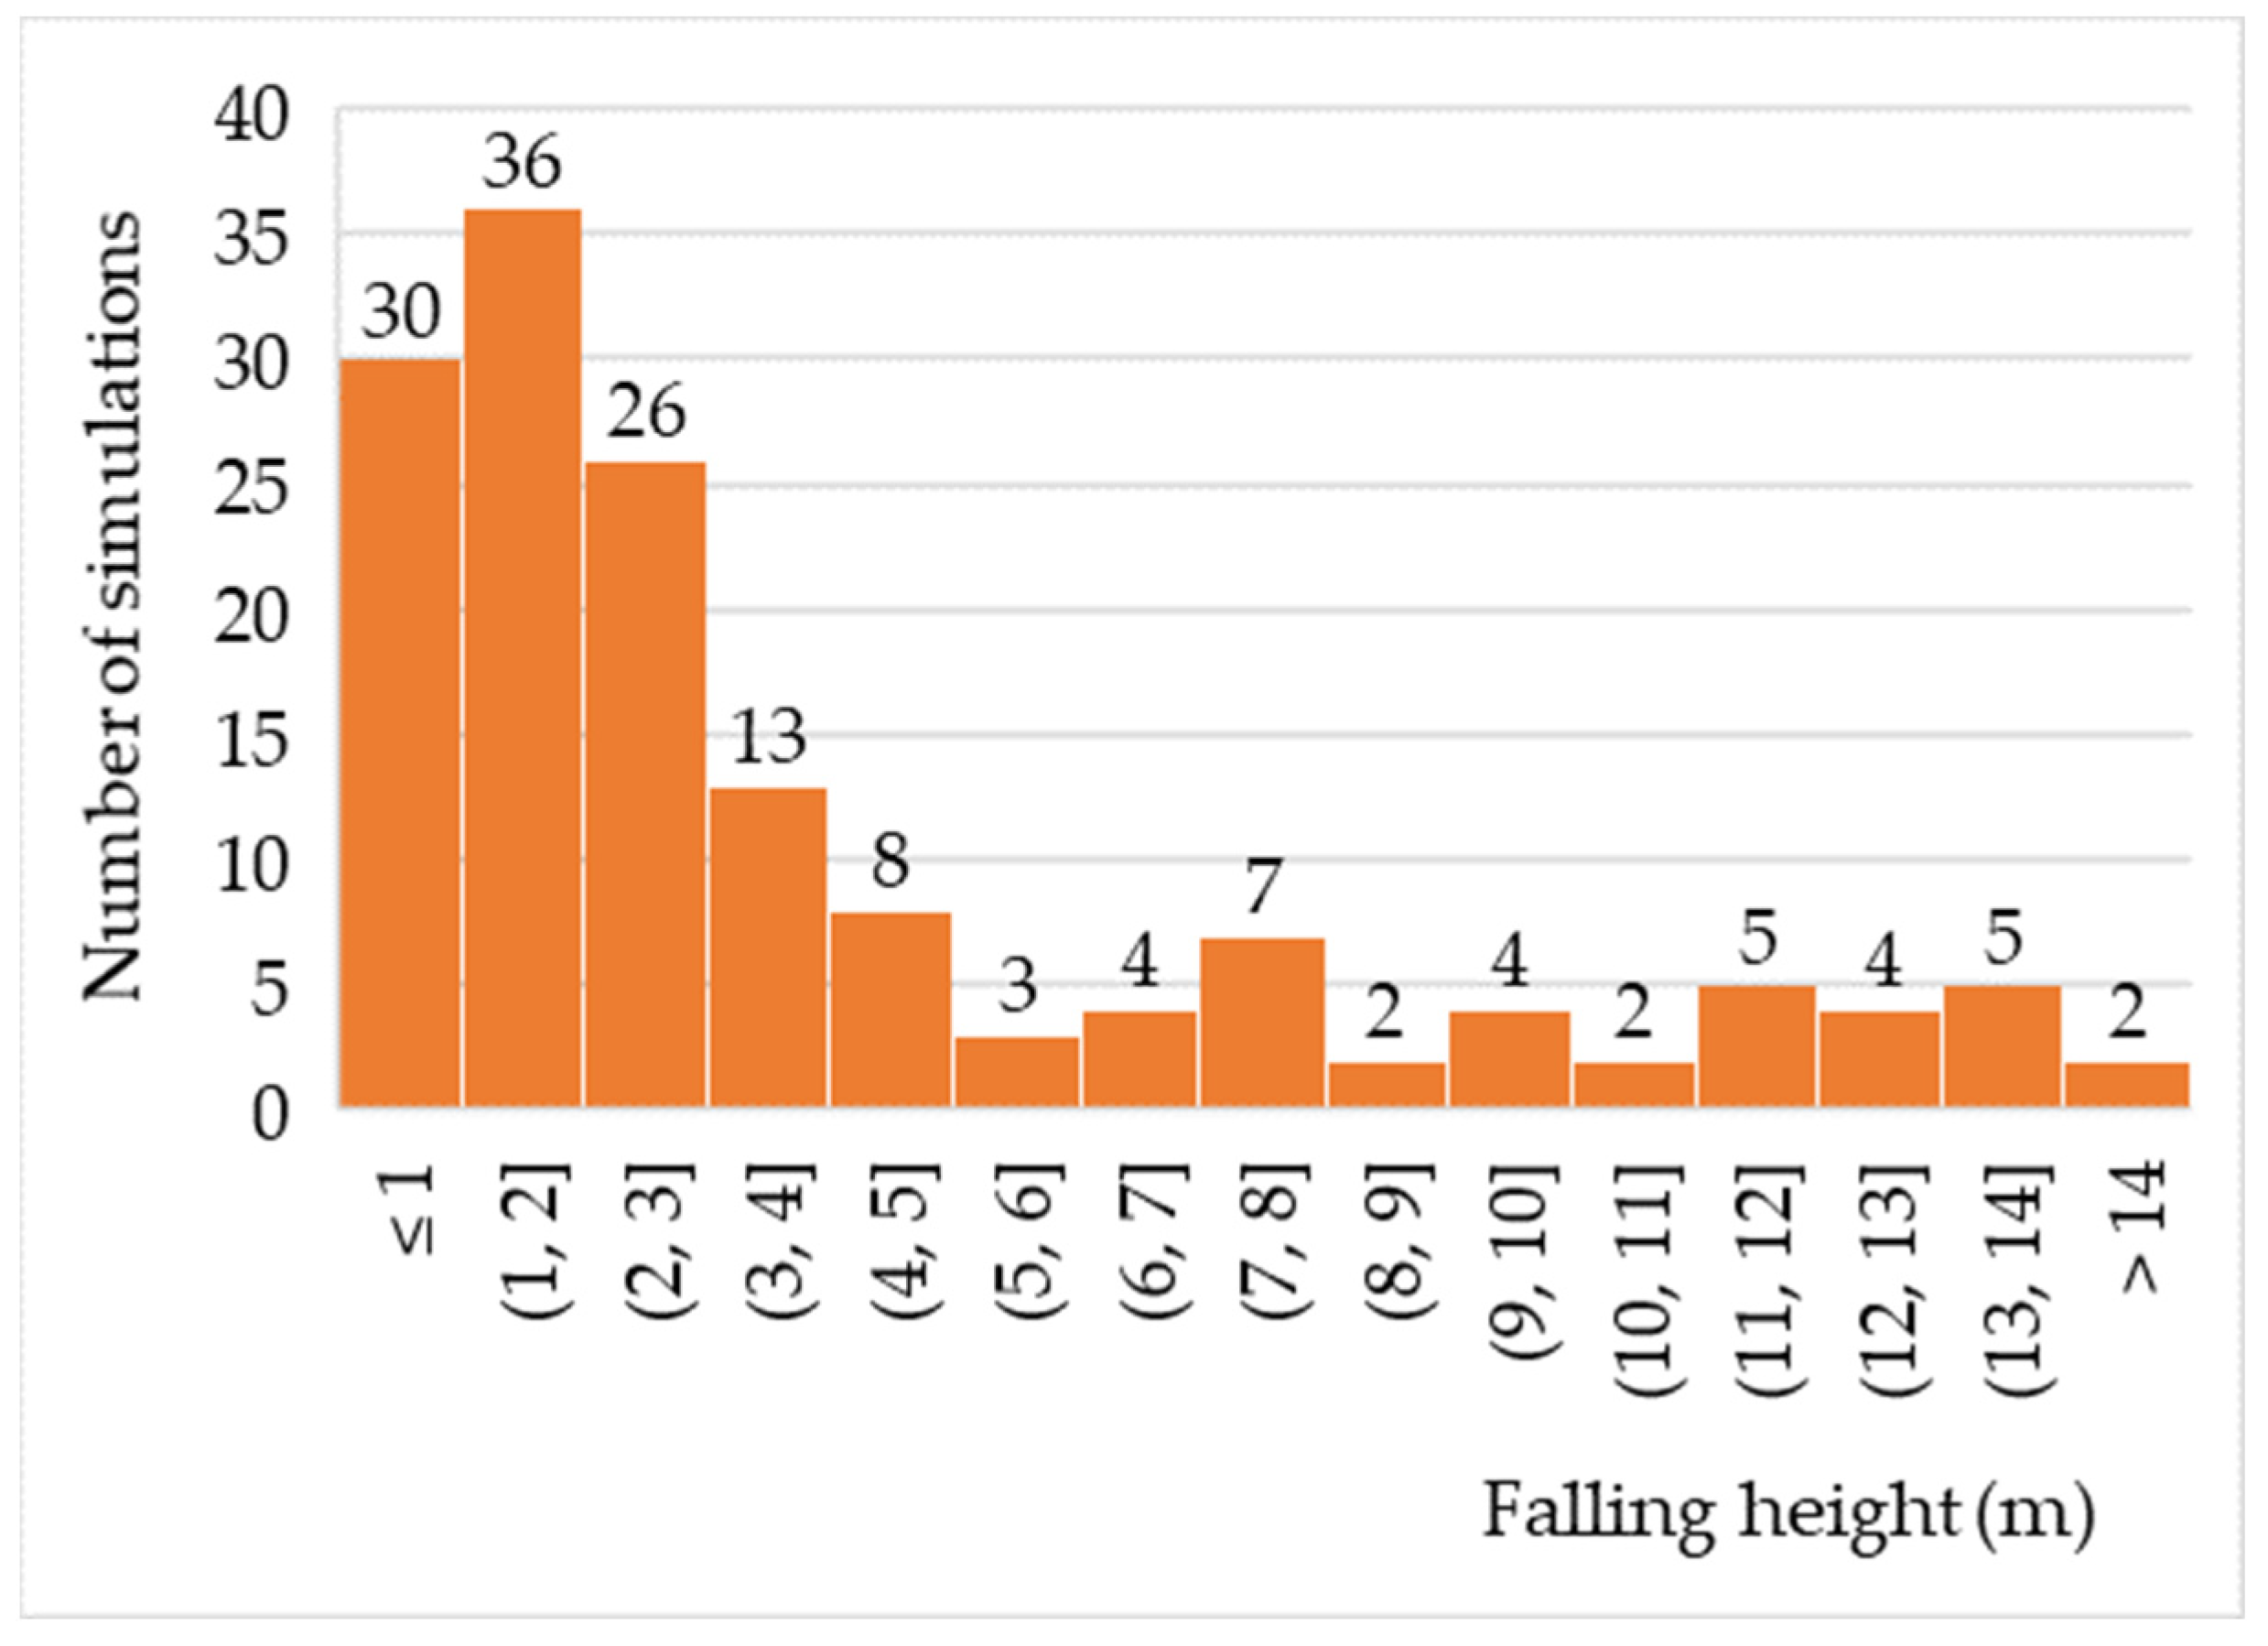
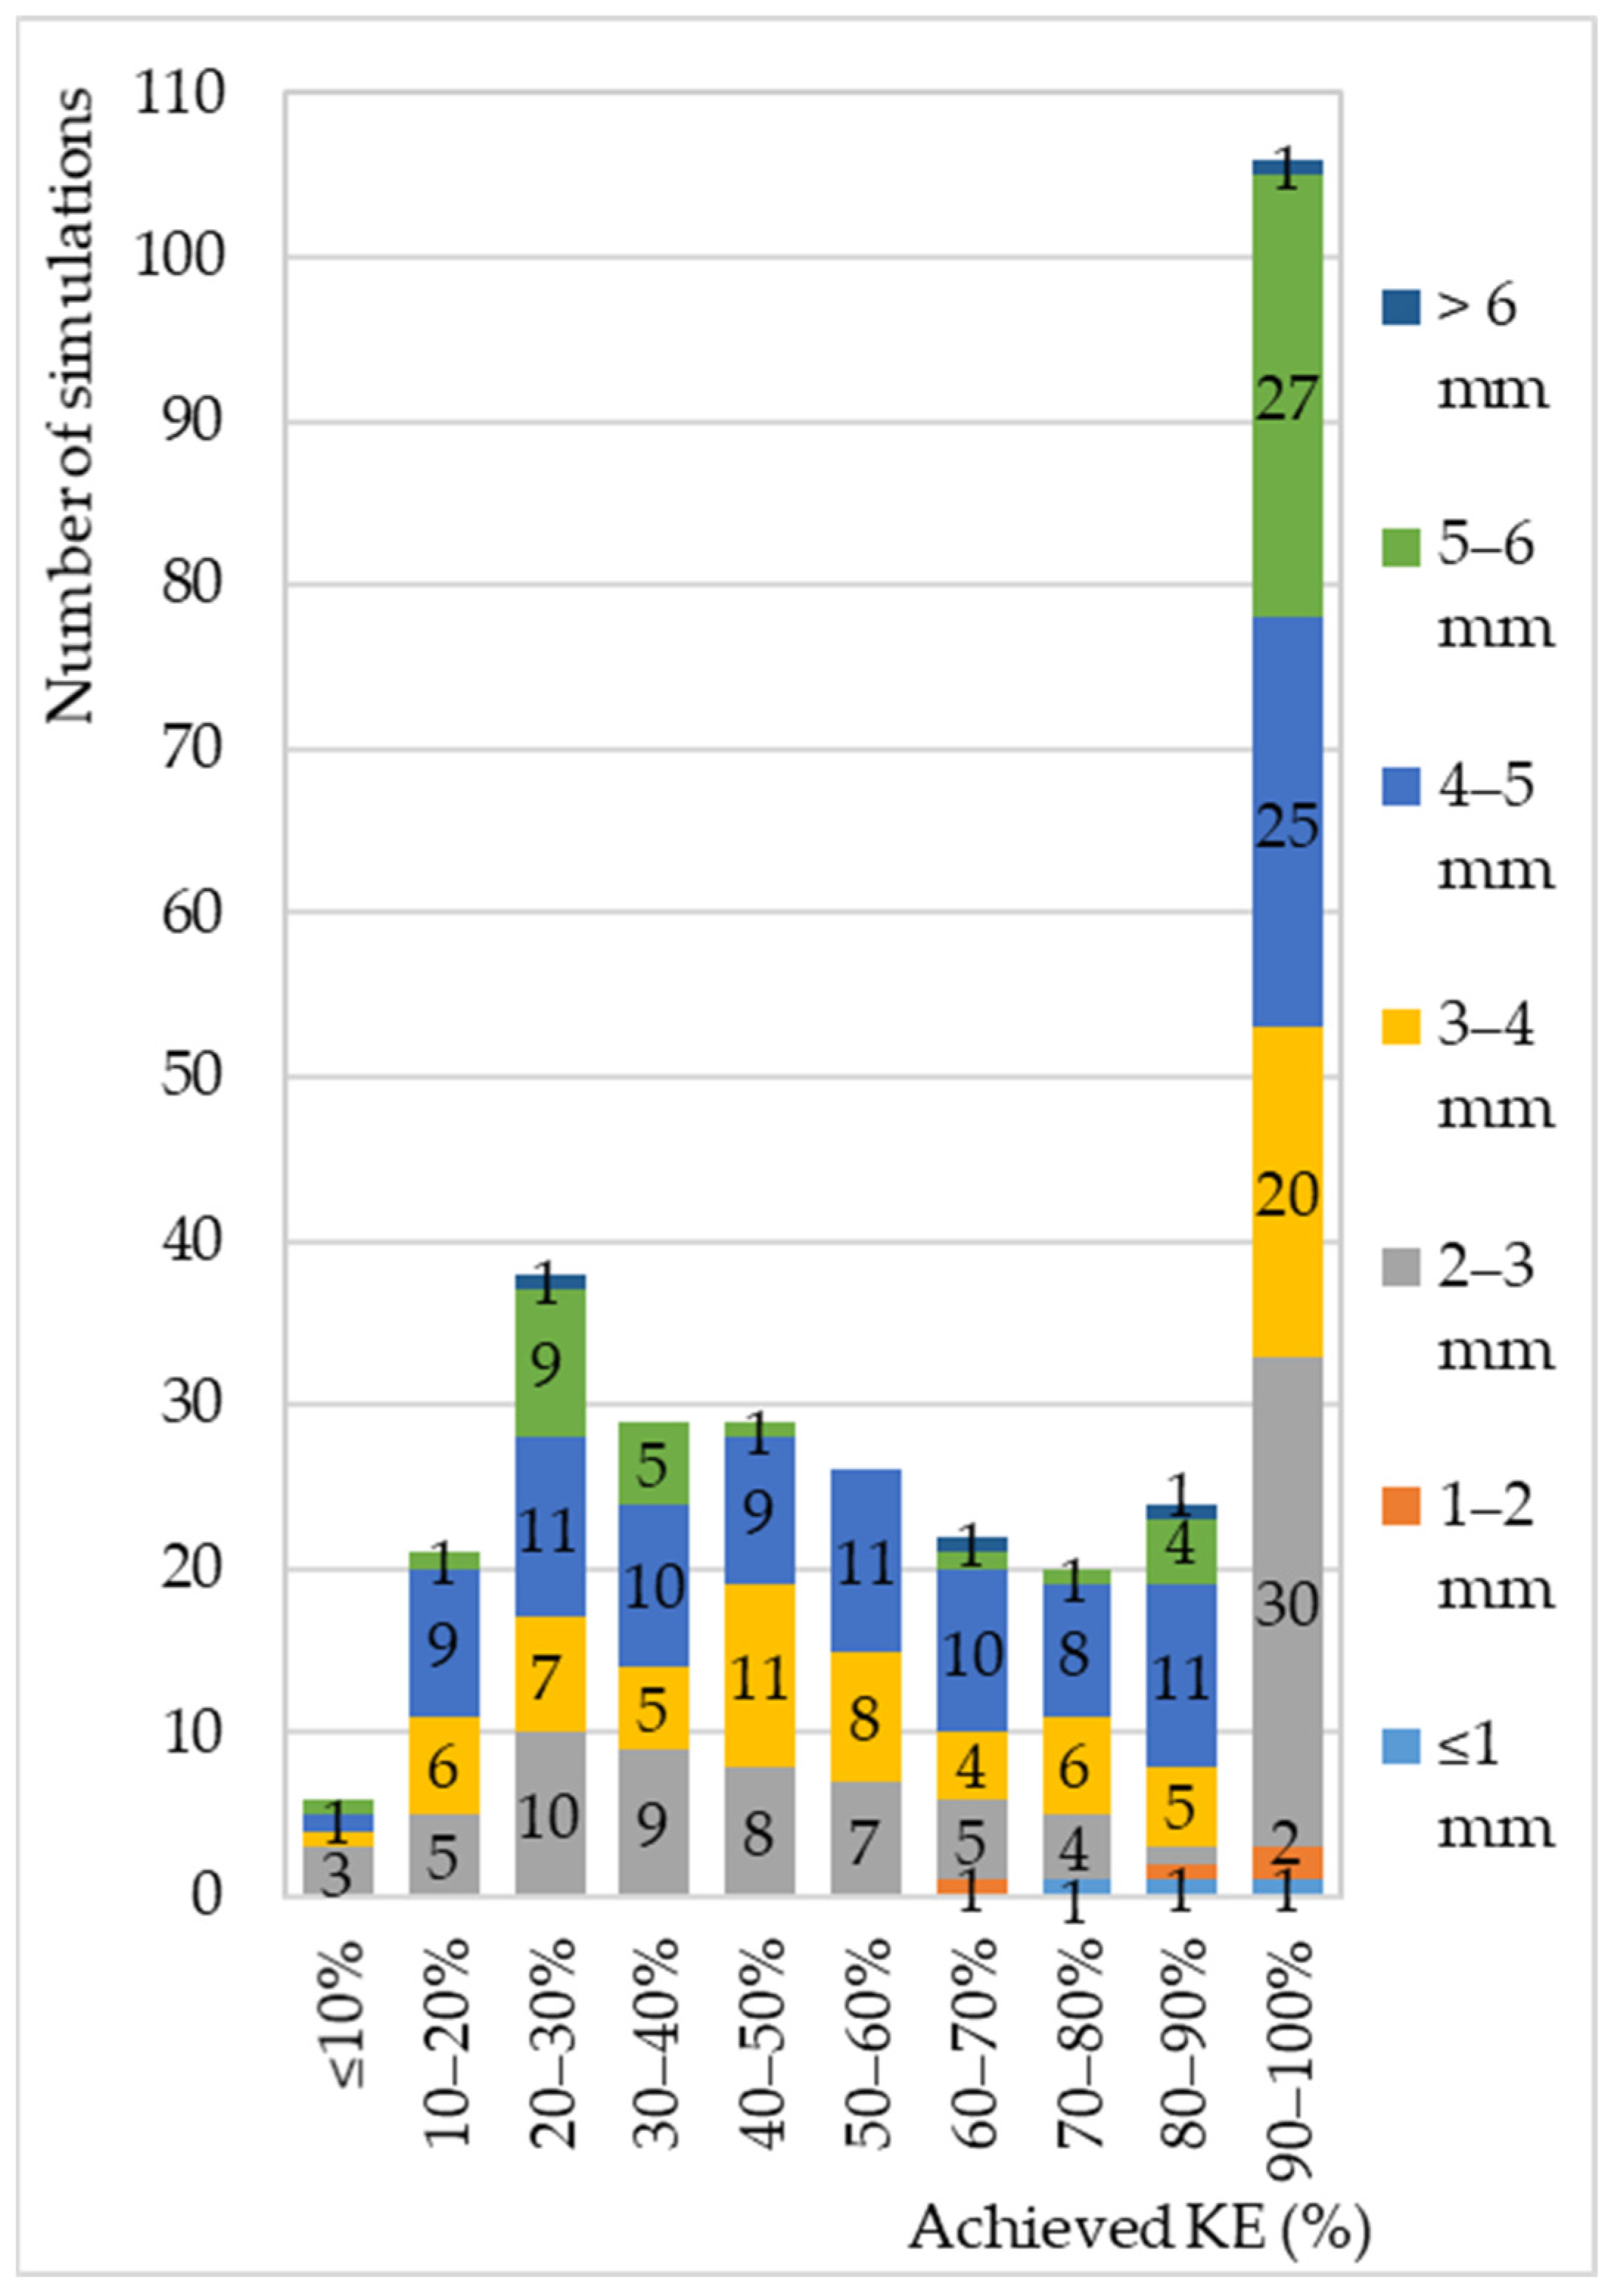
3.4. Kinetic Energy (KE)
4. Conclusions
Supplementary Materials
Author Contributions
Funding
Data Availability Statement
Acknowledgments
Conflicts of Interest
References
- Bryan, R.B. An Improved Rainfall Simulator for Use in Erosion Research. Can. J. Earth Sci. 1970, 7, 1552–1561. [Google Scholar] [CrossRef]
- Ogunye, F.O.; Boussabaine, H. Development of a Rainfall Test Rig as an Aid in Soil Block Weathering Assessment. Constr. Build. Mater. 2002, 16, 173–180. [Google Scholar] [CrossRef]
- Alves Sobrinho, T.; Gómez-Macpherson, H.; Gómez, J.A. A Portable Integrated Rainfall and Overland Flow Simulator. Soil Use Manag. 2008, 24, 163–170. [Google Scholar] [CrossRef]
- Gabrić, O. Eksperimentalno Istraživanje Procesa Na Slivu: Padavine, Oticaj I Erozija Tla; University of Novi Sad: Subotica, Serbia, 2014. [Google Scholar]
- Živanović, N.; Rončević, V.; Spasić, M.; Ćorluka, S.; Polovina, S. Construction and Calibration of a Portable Rain Simulator Designed for the in Situ Research of Soil Resistance to Erosion. Soil Water Res. 2022, 17, 158–169. [Google Scholar] [CrossRef]
- Te Chow, V.; Harbaugh, T.E. Raindrop Production for Laboratory Watershed Experimentation. J. Geophys. Res. 1965, 70, 6111–6119. [Google Scholar] [CrossRef]
- Meeuwig, R.O. Infiltration and Water Repellency in Granitic Soils. In Intermountain Forest & Range Experiment Station; US Department of Agriculture, Forest Service: Ogden, UT, USA, 1971; volume 111. [Google Scholar]
- Battany, M.C.; Grismer, M.E. Development of a Portable Field Rainfall Simulator for Use in Hillside Vineyard Runoff and Erosion Studies. Hydrol. Process. 2000, 14, 1119–1129. [Google Scholar] [CrossRef]
- Naves, J.; Anta, J.; Suárez, J.; Puertas, J. Hydraulic, Wash-off and Sediment Transport Experiments in a Full-Scale Urban Drainage Physical Model. Sci. Data 2020, 7, 44. [Google Scholar] [CrossRef] [Green Version]
- De Ploey, J.; Moeyersons, J. Runoff Creep of Coarse Debris: Experimental Data and Some Field Observations. Catena 1975, 2, 275–288. [Google Scholar] [CrossRef]
- Imeson, A.C. A Simple Field-Portable Rainfall Simulator for Difficult Terrain. Earth Surf. Process. 1977, 2, 431–436. [Google Scholar] [CrossRef]
- Bowyer-Bower, T.A.S.; Burt, T.P. Rainfall Simulators for Investigating Soil Response to Rainfall. Soil Technol. 1989, 2, 1–16. [Google Scholar] [CrossRef]
- Wan, Y.; El-Swaify, S.A. Characterizing Interrill Sediment Size by Partitioning Splash and Wash Processes. Soil Sci. Soc. Am. J. 1998, 62, 430–437. [Google Scholar] [CrossRef]
- Watanabe, H.; Grismer, M.E. Diazinon Transport through Inter-Row Vegetative Filter Strips: Micro-Ecosystem Modeling. J. Hydrol. 2001, 247, 183–199. [Google Scholar] [CrossRef]
- Böker, J.; Zanzinger, H.; Bastian, M.; Németh, E.; Eppel, J. Surface Erosion Control Investigations for a Test Field on a Steep Embankment of German Autobahn A3. In Proceedings of the EuroGeo5, Valencia, Spain, 16–19 September 2012. [Google Scholar]
- Flanagan, D.C.; Foster, G.R.; Moldenhauer, W.C. Storm pattern effect on infiltration, runoff, and erosion. Trans. ASAE 1988, 31, 414–420. [Google Scholar] [CrossRef]
- Römkens, M.J.; Helming, K.; Prasad, S.N. Soil erosion under different rainfall intensities, surface roughness, and soil water regimes. Catena 2002, 46, 103–123. [Google Scholar] [CrossRef]
- Ran, Q.; Su, D.; Li, P.; He, Z. Experimental Study of the Impact of Rainfall Characteristics on Runoff Generation and Soil Erosion. J. Hydrol. 2012, 424–425, 99–111. [Google Scholar] [CrossRef]
- Mohamadi, M.A.; Kavian, A. Effects of rainfall patterns on runoff and soil erosion in field plots. Int. Soil Water Conserv. Res. 2015, 3, 273–281. [Google Scholar] [CrossRef] [Green Version]
- Caracciolo, C.; Napoli, M.; Porcù, F.; Prodi, F.; Dietrich, S.; Zanchi, C.; Orlandini, S. Raindrop size distribution and soil erosion. J. Irrig. Drain. Eng. 2012, 138, 461–469. [Google Scholar] [CrossRef]
- Carollo, F.G.; Ferro, V.; Serio, M.A. Estimating Rainfall Erosivity by Aggregated Drop Size Distributions. Hydrol. Process. 2016, 30, 2119–2128. [Google Scholar] [CrossRef]
- Yakubu, M.L.; Yusop, Z.; Fulazzaky, M.A. The Influence of Rain Intensity on Raindrop Diameter and the Kinetics of Tropical Rainfall: Case Study of Skudai, Malaysia. Hydrol. Sci. J. 2016, 61, 944–951. [Google Scholar] [CrossRef] [Green Version]
- Jevtić, L.J. Hidrologija Bujičnih Tokova; Šumarski Fakultet Univerziteta u Beogradu: Belgrade, Serbia, 1978. [Google Scholar]
- Bisal, F. The Effect of Raindrop Size and Impact Velocity on Sand-Splash. Can. J. Soil Sci. 1960, 40, 242–245. [Google Scholar] [CrossRef] [Green Version]
- Bubenzer, G.D.; Jones, B.A. Drop Size and Impact Velocity Effects on the Detachment of Soils Under Simulated Rainfall. Trans. ASAE 1971, 14, 625–628. [Google Scholar]
- Helming, K. Wind speed effects on rain erosivity. In Proceedings of the Sustaining the global farm-Selected papers from the 10th International Soil Conservation Organization Meeting, West Lafayette, IN, USA, 24–29 May 1999; pp. 771–776. [Google Scholar]
- Erpul, G.; Norton, L.D.; Gabriels, D. The effect of wind on raindrop impact and rainsplash detachment. Trans. ASAE 2003, 46, 51. [Google Scholar] [CrossRef]
- Mineo, C.; Ridolfi, E.; Moccia, B.; Russo, F.; Napolitano, F. Assessment of rainfall kinetic-energy-intensity relationships. Water 2019, 11, 1994. [Google Scholar] [CrossRef] [Green Version]
- Sanchez-Moreno, J.F.; Mannaerts, C.M.; Jetten, V.; Löffler-Mang, M. Rainfall kinetic energy-intensity and rainfall momentum-intensity relationships for Cape Verde. J. Hydrol. 2012, 454–455, 131–140. [Google Scholar] [CrossRef]
- Akinola, A.I.; Wynn-Thompson, T.; Olgun, C.G.; Mostaghimi, S.; Eick, M.J. Fluvial erosion rate of cohesive streambanks is directly related to the difference in soil and water temperatures. J. Environ. Qual. 2019, 48, 1741–1748. [Google Scholar] [CrossRef] [Green Version]
- Forti, M.C.; Melfi, A.J.; Astolfo, R.; Fostier, A.H. Rainfall chemistry composition in two ecosystems in the northeastern Brazilian Amazon (Amapá State). J. Geophys. Res. Atmos. 2000, 105, 28895–28905. [Google Scholar] [CrossRef] [Green Version]
- Rončević, V.; Živanović, N.; Ristić, R.; van Boxel, J.H.; Kašanin-Grubin, M. Dripping Rainfall Simulators for Soil Research—Design Review. Water 2022, 14, 3309. [Google Scholar] [CrossRef]
- Ries, J.B.; Iserloh, T. Rainfall Simulation: Methods, Research Questions and Challenges. In Proceedings of the EGU General Assembly, Vienna, Austria, 22–27 April 2012; p. 13866. [Google Scholar]
- Yakubu, M.L.; Yusop, Z. Adaptability of Rainfall Simulators as a Research Tool on Urban Sealed Surfaces—A Review. Hydrol. Sci. J. 2017, 62, 996–1012. [Google Scholar] [CrossRef]
- Meyer, L.D.; Harmon, W.C. Multiple-Intensity Rainfall Simulator for Erosion Research on Row Sideslopes. Trans. ASAE 1979, 22, 0100–0103. [Google Scholar] [CrossRef]
- Dunkerley, D.L. Intra-Storm Evaporation as a Component of Canopy Interception Loss in Dryland Shrubs: Observations from Fowlers Gap, Australia. Hydrol. Process. 2008, 22, 1985–1995. [Google Scholar] [CrossRef]
- McCalla, T.M. Water-Drop Method of Determining Stability of Soil Structure. Soil Sci. 1944, 58, 117–122. [Google Scholar] [CrossRef]
- Gunn, R.; Kinzer, G.D. The Terminal Velocity of Fall for Water Droplets in Stagnant Air. J. Meteorol. 1949, 6, 243–248. [Google Scholar] [CrossRef]
- Bruce-Okine, E.; Lal, R. Soil Erodibility as Determined by Raindrop Technique. Soil Sci. 1975, 119, 149–157. [Google Scholar] [CrossRef]
- Cousen, S.M.; Farres, P.J. The Role of Moisture Content in the Stability of Soil Aggregates from a Temperate Silty Soil to Raindrop Impact. Catena 1984, 11, 313–320. [Google Scholar] [CrossRef]
- Sharma, P.P.; Gupta, S.C. Sand Detachment by Single Raindrops of Varying Kinetic Energy and Momentum. Soil Sci. Soc. Am. J. 1989, 53, 1005–1010. [Google Scholar] [CrossRef]
- Mouzai, L.; Bouhadef, M. Water Drop Erosivity: Effects on Soil Splash. J. Hydraul. Res. 2003, 41, 61–68. [Google Scholar] [CrossRef]
- Meyer, L.D. Simulation of Rainfall for Soil Erosion Research. Trans. ASAE 1965, 8, 0063–0065. [Google Scholar] [CrossRef]
- McQueen, I.S. Development of a Hand Portable Rainfall-Simulator Infiltrometer. Geological Survey; United States Department of the Interior: Washington, DC, USA, 1963; Volume 482.
- Steinhardt, R.; Hillel, D. A Portable Low-Intensity Rain Simulator for Field and Laboratory Use. Soil Sci. Soc. Am. J. 1966, 30, 661–663. [Google Scholar] [CrossRef]
- Hall, M.J. A Critique of Methods of Simulating Rainfall. Water Resour. Res. 1970, 6, 1104–1114. [Google Scholar] [CrossRef]
- Onstad, C.A.; Radke, J.K.; Young, R.A. Outdoor Portable Rainfall Erosion Laboratory. In Erosion and Sediment Transport Measurement: Symposium IAHS Publication; International Association of Hydrological Sciences: Wallingford, UK, 1981; Volume 133. [Google Scholar]
- Moore, I.D.; Hirschi, M.C.; Barfield, B.J. Kentucky Rainfall Simulator. Trans. ASAE 1983, 26, 1085–1089. [Google Scholar] [CrossRef]
- Joel, A.; Messing, I. Infiltration Rate and Hydraulic Conductivity Measured with Rainfall simulator and Disc Permeameter on Sloping Arid Land. Arid. Land Res. Manage. 2001, 15, 371–384. [Google Scholar] [CrossRef]
- Clarke, M.A.; Walsh, R.P.D. A Portable Rainfall Simulator for Field Assessment of Splash and Slopewash in Remote Locations. Earth Surf. Process. 2007, 32, 2052–2069. [Google Scholar] [CrossRef]
- Parr, J.F.; Bertrand, A.R. Water Infiltration into Soils. Adv. Agron. 1960, 12, 311–363. [Google Scholar]
- Mutchler, C.K.; Hermsmeier, L.F. A Review of Rainfall Simulators. Trans. ASAE 1965, 8, 0067–0068. [Google Scholar] [CrossRef]
- Amerman, C.R. Proceedings of the Rainfall Simulator Workshop. Agricultural Research (Western Region); Science and Education Administration, U.S. Department of Agriculture: Oakland, CA, USA, 1979; Volume 10, p. 94612.
- Cerdá, A. Rainfall Drop Size Distribution in the Western Mediterranean Basin, València, Spain. CATENA 1997, 30, 169–182. [Google Scholar] [CrossRef]
- Ngasoh, F.G.; Mbajiorgu, C.C.; Kamai, M.B.; Okoro, G.O. A Revisit of Rainfall Simulator as a Potential Tool for Hydrological Research. In Agrometeorology; IntechOpen: London, UK, 2020. [Google Scholar]
- Iserloh, T.; Ries, J.B.; Arnáez, J.; Boix-Fayos, C.; Butzen, V.; Cerdà, A.; Echeverría, M.T.; Fernández-Gálvez, J.; Fister, W.; Geißler, C.; et al. European Small Portable Rainfall Simulators: A Comparison of Rainfall Characteristics. CATENA 2013, 110, 100–112. [Google Scholar] [CrossRef] [Green Version]
- Van Boxel, J.H. Numerical Model for the Fall Speed of Rain Drops in a Rain Fall Simulator. In Proceedings of the Workshop on Wind and Water Erosion, Ghent, Belgium, 17–18 November 1997; pp. 77–85. [Google Scholar]
- Malekuti, A.; Gifford, G.F. Natural Vegetation as a Source of Diffuse Salt within the Colorado River Basin. J. Am. Water Resour. Assoc. 1978, 14, 195–205. [Google Scholar] [CrossRef]
- Kamphorst, A. A Small Rainfall Simulator for the Determination of Soil Erodibility. Neth. J. Agric. Sci. 1987, 35, 407–415. [Google Scholar] [CrossRef]
- Harden, C.P.; Mathews, L. Rainfall Response of Degraded Soil Following Reforestation in the Copper Basin, Tennessee, USA. Environ. Manag. 2000, 26, 163–174. [Google Scholar] [CrossRef]
- Iserloh, T.; Pegoraro, D.; Schlösser, A.; Thesing, H.; Seeger, M.; Ries, J.B. Rainfall Simulation Experiments: Influence of Water Temperature, Water Quality and Plot Design on Soil Erosion and Runoff. In Proceedings of the EGU General Assembly, Vienna, Austria, 12–17 April 2015. [Google Scholar]
- Green, T.; Houk, D.F. The Mixing of Rain with Near-Surface Water. J. Fluid Mech. 1979, 90, 569. [Google Scholar] [CrossRef]
- Agassi, M.; Bloem, D.; Ben-Hur, M. Effect of Drop Energy and Soil and Water Chemistry on Infiltration and Erosion. Water Resour. Res. 1994, 30, 1187–1193. [Google Scholar] [CrossRef]
- Xiao, H.; Liu, G.; Abd-Elbasit, M.A.M.; Zhang, X.C.; Liu, P.L.; Zheng, F.L.; Zhang, J.Q.; Hu, F.N. Effects of Slaking and Mechanical Breakdown on Disaggregation and Splash Erosion: Effects of Splash Erosion on Aggregate Breakdown. Eur. J. Soil Sci. 2017, 68, 797–805. [Google Scholar] [CrossRef]
- Rončević, V.; Živanović, N.; Boxel, J.H.V.; Iserloh, T.; Antić, N. Measuring the Size of Pendant Water Drop Generated by Hypodermic Needles for Construction of Rainfall Simulator for Soil Research. Water 2023. manuscript in preparation. [Google Scholar]
- Boucher, E.A.; Evans, M.J.B. Pendent Drop Profiles and Related Capillary Phenomena. Proc. R. Soc. London. A. Math. Phys. Sci. 1975, 346, 349–374. [Google Scholar] [CrossRef]
- Mutchler, C.K.; Moldenhauer, W.C. Applicator for Laboratory Rainfall Simulator. Trans. ASAE 1963, 6, 0220–0222. [Google Scholar] [CrossRef]
- Harkins, W.D.; Brown, F.E. The Determination of Surface Tension (Free Surface Energy), and the Weight of Falling Drops: The Surface Tension of Water and Benzene by the Capillary Height Method. J. Am. Chem. Soc. 1919, 41, 499–524. [Google Scholar] [CrossRef]
- Henderson, D.C.; Micale, F.J. Dynamic Surface Tension Measurement with the Drop Mass Technique. J. Colloid Interface Sci. 1993, 158, 289–294. [Google Scholar] [CrossRef]
- Xu, Y. Dynamic Interfacial Tension between Bitumen and Aqueous Sodium Hydroxide Solutions. Energy Fuels 1995, 9, 148–154. [Google Scholar] [CrossRef]
- Pu, B.; Chen, D. A Study of the Measurement of Surface and Interfacial Tension by the Maximum Liquid Drop Volume Method. J. Colloid Interface Sci. 2001, 235, 265–272. [Google Scholar] [CrossRef]
- Lee, B.-B.; Ravindra, P.; Chan, E.-S. A Critical Review: Surface and Interfacial Tension Measurement by the Drop Weight Method. Chem. Eng. Commun. 2008, 195, 889–924. [Google Scholar] [CrossRef]
- Hozawa, M.; Tsukada, T.; Imaishi, N.; Fujinwa, K. Effect of Wettability on Static Drop Formation from a Hole in Horizontal Flat Plate. J. Chem. Eng. Jpn. 1981, 14, 358–364. [Google Scholar] [CrossRef] [Green Version]
- Miller, R.; Schano, K.-H.; Hofmann, A. Hydrodynamic Effects in Measurements with the Drop Volume Technique at Small Drop Times 1. Surface Tensions of Pure Liquids and Mixtures. Colloids Surf. A: Physicochem. Eng. Asp. 1994, 92, 189–196. [Google Scholar] [CrossRef]
- Garandet, J.P.; Vinet, B.; Gros, P. Considerations on the Pendant Drop Method: A New Look at Tate’s Law and Harkins’ Correction Factor. J. Colloid Interface Sci. 1994, 165, 351–354. [Google Scholar] [CrossRef]
- Portuguez, E.; Alzina, A.; Michaud, P.; Oudjedi, M.; Smith, A. Evolution of a Water Pendant Droplet: Effect of Temperature and Relative Humidity. Nat. Sci. 2017, 9, 1–20. [Google Scholar] [CrossRef] [Green Version]
- Barry, P.V.; Turco, R.F.; Stott, D.E.; Bradford, J.M. Organic Polymers’ Effect on Soil Shear Strength and Detachment by Single Raindrops. Soil Sci. Soc. Am. J. 1991, 55, 799–804. [Google Scholar] [CrossRef]
- Bissonnais, Y.L.; Singer, M.J. Crusting, Runoff, and Erosion Response to Soil Water Content and Successive Rainfalls. Soil Sci. Soc. Am. J. 1992, 56, 1898–1903. [Google Scholar] [CrossRef]
- Black, P.E. Runoff from Watershed Models. Water Resour. Res. 1970, 6, 465–477. [Google Scholar] [CrossRef]
- Houk, D.; Green, T. A Note on Surface Waves Due to Rain. J. Geophys. Res. 1976, 81, 4482–4484. [Google Scholar] [CrossRef]
- Moss, A.J.; Green, T.W. Erosive Effects of the Large Water Drops (Gravity Drops) That Fall from Plants. Soil Res. 1987, 25, 9. [Google Scholar] [CrossRef]
- Robinson, D.A.; Naghizadeh, R. The Impact of Cultivation Practice and Wheelings on Runoff Generation and Soil Erosion on the South Downs: Some Experimental Results Using Simulated Rainfall. Soil Use Manag. 1992, 8, 151–156. [Google Scholar] [CrossRef]
- Ao, C.; Yang, P.; Zeng, W.; Chen, W.; Xu, Y.; Xu, H.; Zha, Y.; Wu, J.; Huang, J. Impact of Raindrop Diameter and Polyacrylamide Application on Runoff, Soil and Nitrogen Loss via Raindrop Splashing. Geoderma 2019, 353, 372–381. [Google Scholar] [CrossRef]
- Wang, L.; Fang, N.F.; Yue, Z.J.; Shi, Z.H.; Hua, L. Raindrop Size and Flow Depth Control Sediment Sorting in Shallow Flows on Steep Slopes. Water Resour. Res. 2018, 54, 9978–9995. [Google Scholar] [CrossRef]
- Walker, P.H.; Hutka, J.; Moss, A.J.; Kinnell, P.I.A. Use of a Versatile Experimental System for Soil Erosion Studies. Soil Sci. Soc. Am. J. 1977, 41, 610–612. [Google Scholar] [CrossRef]
- Riezebos, H.T.; Epema, G.F. Drop Shape and Erosivity Part II: Splash Detachment, Transport and Erosivity Indices. Earth Surf. Process. 1985, 10, 69–74. [Google Scholar] [CrossRef]
- Moss, A.J. Effects of Flow Velocity Variation on Rain Driven Transportation and the Role of Rain Impact in the Movement of Solids. Soil Res. 1988, 26, 443. [Google Scholar] [CrossRef]
- Chevone, B.I.; Yang, Y.S.; Winner, W.E.; Storks-Cotter, I.; Long, S.J. A Rainfall Simulator for Laboratory Use in Acidic Precipitation Studies. J. Air Pollut. Control Assoc. 1984, 34, 355–359. [Google Scholar] [CrossRef]
- Abu-Zreig, M. Control of Rainfall-Induced Soil Erosion with Various Types of Polyacrylamide (8 pp). J. Soils Sediments 2006, 6, 137–144. [Google Scholar] [CrossRef]
- Magarvey, R.H.; Taylor, B.W. Apparatus for the Production of Large Water Drops. Rev. Sci. Instrum. 1956, 27, 944–947. [Google Scholar] [CrossRef]
- Brakensiek, D.L.; Rawls, W.J.; Hamon, W.R. Application of an Infiltrometer System for Describing Infiltration into Soils. Trans. ASAE 1979, 22, 320–325. [Google Scholar] [CrossRef]
- Bhardwaj, A.; Singh, R. Development of a Portable Rainfall Simulator Infiltrometer for Infiltration, Runoff and Erosion Studies. Agric. Water Manag. 1992, 22, 235–248. [Google Scholar] [CrossRef]
- Thompson, A.L.; Ghidey, F.; Regmi, T.P. Raindrop Energy Effects on Chemical and Sediment Transport. Trans. ASAE 2001, 44, 835. [Google Scholar] [CrossRef]
- Cerdà, A.; Ibáñez, S.; Calvo, A. Design and Operation of a Small and Portable Rainfall Simulator for Rugged Terrain. Soil Technol. 1997, 11, 163–170. [Google Scholar] [CrossRef]
- Ristić, R.; Malošević, D. Hidrologija Bujičnih Tokova; Univerzitet u Beogradu, Šumarski Fakultet: Belgrade Serbia, 2011. [Google Scholar]
- Pruppacher, H.R.; Klett, J.D. Microphysics of Clouds and Precipitation. Nature 2012, 284, 88. [Google Scholar] [CrossRef]
- Blanchard, D.C. The Behavior of Water Drops at Terminal Velocity in Air. Trans. Am. Geophys. Union 1950, 31, 836. [Google Scholar] [CrossRef]
- Hudson, N.W. Soil Conservation; Scientific Publishers: New Delhi, India, 2015. [Google Scholar]
- Brandt, C.J. The Size Distribution of Throughfall Drops under Vegetation Canopies. CATENA 1989, 16, 507–524. [Google Scholar] [CrossRef]
- Coutinho, M.A.; Tomás, P.P. Characterization of Raindrop Size Distributions at the Vale Formoso Experimental Erosion Center. CATENA 1995, 25, 187–197. [Google Scholar] [CrossRef]
- Nyssen, J.; Vandenreyken, H.; Poesen, J.; Moeyersons, J.; Deckers, J.; Haile, M.; Salles, C.; Govers, G. Rainfall Erosivity and Variability in the Northern Ethiopian Highlands. J. Hydrol. 2005, 311, 172–187. [Google Scholar] [CrossRef]
- Meshesha, D.T.; Tsunekawa, A.; Haregeweyn, N. Influence of Raindrop Size on Rainfall Intensity, Kinetic Energy, and Erosivity in a Sub-Humid Tropical Area: A Case Study in the Northern Highlands of Ethiopia. Theor. Appl. Climatol. 2019, 136, 1221–1231. [Google Scholar] [CrossRef]
- Carter, C.E.; Greer, J.D.; Braud, H.J.; Floyd, J.M. Raindrop Characteristics in South Central United States. Trans. ASAE 1974, 17, 1033–1037. [Google Scholar] [CrossRef]
- Laws, J.O. Measurements of the Fall-Velocity of Water -Drops and Raindrops. Trans. Am. Geophys. Union 1941, 22, 709. [Google Scholar] [CrossRef]
- Reichard, D.L. A System for Producing Various Sizes, Numbers, and Frequencies of Uniform-Size Drops. Trans. ASAE 1990, 33, 1767–1770. [Google Scholar] [CrossRef]
- Macklin, W.C.; Hobbs, P.V. Subsurface Phenomena and the Splashing of Drops on Shallow Liquids. Science 1969, 166, 107–108. [Google Scholar] [CrossRef] [PubMed]
- Rose, C.W. Soil Detachment Caused by Rainfall. Soil Sci. 1960, 89, 28–35. [Google Scholar] [CrossRef]
- Roth, C.H.; Meyer, B.; Frede, H.-G. A Portable Rainfall Simulator for Studying Factors Affecting Runoff, Infiltration and Soil Loss. Catena 1985, 12, 79–85. [Google Scholar] [CrossRef]
- Thompson, A.L.; James, L.G. Water Droplet Impact and Its Effect on Infiltration. Trans. ASAE 1985, 28, 1506–1510. [Google Scholar] [CrossRef]
- Regmi, T.P.; Thompson, A.L. Rainfall Simulator for Laboratory Studies. Appl. Eng. Agric. 2000, 16, 641–647. [Google Scholar] [CrossRef]
- Brandt, C.J. Simulation of the Size Distribution and Erosivity of Raindrops and Throughfall Drops. Earth Surf. Process. Landf. 1990, 15, 687–698. [Google Scholar] [CrossRef]
- Carollo, F.G.; Ferro, V.; Serio, M.A. Predicting Rainfall Erosivity by Momentum and Kinetic Energy in Mediterranean Environment. J. Hydrol. 2018, 560, 173–183. [Google Scholar] [CrossRef]
- Laws, J.O.; Parsons, D.A. The Relation of Raindrop-Size to Intensity. Trans. Am. Geophys. Union 1943, 24, 452. [Google Scholar] [CrossRef]
- Atlas, D. OPTICAL EXTINCTION by RAINFALL. J. Meteorol. 1953, 10, 486–488. [Google Scholar] [CrossRef]
- Zanchi, C.; Torri, D. Evaluation of Rainfall Energy in Central Italy. Assessment of Erosion; John Wiley and Sons Ltd.: Hoboken, NJ, USA, 1980; pp. 133–142. [Google Scholar]
- Jayawardena, A.W.; Rezaur, R.B. Drop Size Distribution and Kinetic Energy Load of Rainstorms in Hong Kong. Hydrol. Process. 2000, 14, 1069–1082. [Google Scholar] [CrossRef]
- Kinnell, P.I.A. Rainfall Intensity-Kinetic Energy Relationships for Soil Loss Prediction1. Soil Sci. Soc. Am. J. 1981, 45, 153. [Google Scholar] [CrossRef]
- Rosewell, C.J. Rainfall Kinetic Energy in Eastern Australia. J. Clim. Appl. Meteorol. 1986, 25, 1695–1701. [Google Scholar] [CrossRef]
- Brown, L.C.; Foster, G.R. Storm Erosivity Using Idealized Intensity Distributions. Trans. ASAE 1987, 30, 0379–0386. [Google Scholar] [CrossRef]
- Carollo, F.G.; Ferro, V.; Serio, M.A. Reliability of Rainfall Kinetic Power-Intensity Relationships. Hydrol. Process. 2017, 31, 1293–1300. [Google Scholar] [CrossRef]
- Hudson, N.W. The Influence of Rainfall on the Mechanics of Soil Erosion: With Particular Reference to Southern Rhodesia; University of Cape Town: Cape Town, South Africa, 1965. [Google Scholar]
- Assouline, S.; Mualem, Y. The Similarity of Regional Rainfall: A Dimensionless Model of Drop Size Distribution. Trans. ASAE 1989, 32, 1216–1222. [Google Scholar] [CrossRef]
- Van Dijk, A.I.J.M.; Bruijnzeel, L.A.; Rosewell, C.J. Rainfall Intensity-Kinetic Energy Relationships: A Critical Literature Appraisal. J. Hydrol. 2002, 261, 1–23. [Google Scholar] [CrossRef]
- Mueller, E.A.; Sims, A.L. Raindrop Distributions at Island Beach, New Jersey; Atmospheric Sciences Laboratory, US Army Electronics Command: Fort Monmouth, NJ, USA, 1967.
- Mueller, E.A.; Sims, A.L. Raindrop Distributions at Corvallis, Oregon; US Army Electronics Command: Fort Monmouth, NJ, USA, 1968.
- Mason, B.J.; Andrews, J.B. Drop-Size Distributions from Various Types of Rain. Q. J. R. Meteorol. Soc. 1960, 86, 346–353. [Google Scholar] [CrossRef]
- Sauvageot, H.; Lacaux, J.-P. The Shape of Averaged Drop Size Distributions. J. Atmos. Sci. 1995, 52, 1070–1083. [Google Scholar] [CrossRef]
- McCool, D.K.; Williams, J.D.; Morse, J.R. Raindrop Characteristics in the Pacific Northwest. In Proceedings of the ASABE Annual International Meeting, Reno, NV, USA, 21–14 June 2009. [Google Scholar]
- Llasat, M.-C. An Objective Classification of Rainfall Events on the Basis of Their Convective Features: Application to Rainfall Intensity in the Northeast of Spain. Int. J. Climatol. 2001, 21, 1385–1400. [Google Scholar] [CrossRef]
- Hadadin, A.N. Rainfall Intensity-Duration-Frequency Relationship in the Mujib Basin in Jordan. J. Appl. Sci. 2005, 5, 1777–1784. [Google Scholar] [CrossRef] [Green Version]
- AlHassoun, S.A. Developing an Empirical Formulae to Estimate Rainfall Intensity in Riyadh Region. J. King Saud Univ.-Eng. Sci. 2011, 23, 81–88. [Google Scholar] [CrossRef] [Green Version]
- Ologhadien, I.; Nwaogazie, I.L. Rainfall Intensity-Duration-Frequency Models for Selected Cities in Southern Nigeria. Stand. Sci. Res. Essays 2014, 2, 509–515. [Google Scholar]
- Lubrica, N.V.; Villanueva, J.R.; Daligdig, J.; Telino, G.; Puyongan, M.D.; Jimenez, V.; Aguilar, A.; delos Reyes, W. Revisiting the Adequacy of the Existing Drainage System Using the Rational Method and Geographic Information System. Tangkoyob UC Res. J. 2015, 9, 5–17. [Google Scholar]
- Best, A.C. The Size Distribution of Raindrops. Q. J. R. Meteorol. Soc. 1950, 76, 16–36. [Google Scholar] [CrossRef]
- Beard, K.V.; Pruppacher, H.R. A Determination of the Terminal Velocity and Drag of Small Water Drops by Means of a Wind Tunnel. J. Atmos. Sci. 1969, 26, 1066–1072. [Google Scholar] [CrossRef]
- Uplinger, W.G. A New Formula for Raindrop Terminal Velocity. In Proceedings of the 20th Conference on Radar Meteorology, Boston, MA, USA, 30 November–3 December 1981; pp. 389–391. [Google Scholar]
- Adams, J.E.; Kirkham, D.; Nielsen, D.R. A Portable Rainfall-Simulator Infiltrometer and Physical Measurements of Soil in Place. Soil Sci. Soc. Am. J. 1957, 21, 473–477. [Google Scholar] [CrossRef]
- Ahuja, L.R. Modeling Soluble Chemical Transfer to Runoff with Rainfall Impact as a Diffusion Process. Soil Sci. Soc. Am. J. 1990, 54, 312–321. [Google Scholar] [CrossRef]
- Ahuja, L.R.; Lehman, O.R. The Extent and Nature of Rainfall—Soil Interaction in the Release of Soluble Chemicals to Runoff. J. Environ. Qual. 1983, 12, 34–40. [Google Scholar] [CrossRef]
- Ahuja, L.R.; Lehman, O.R.; Sharpley, A.N. Bromide and Phosphate in Runoff Water from Shaped and Cloddy Soil Surfaces. Soil Sci. Soc. Am. J. 1983, 47, 746–748. [Google Scholar] [CrossRef]
- Andersen, C.T.; Foster, I.D.L.; Pratt, C.J. The Role of Urban Surfaces (Permeable Pavements) in Regulating Drainage and Evaporation: Development of a Laboratory Simulation Experiment. Hydrol. Process. 1999, 13, 597–609. [Google Scholar] [CrossRef]
- Aston, A.R. Rainfall Interception by Eight Small Trees. J. Hydrol. 1979, 42, 383–396. [Google Scholar] [CrossRef]
- Barnes, O.K.; Costel, G. A Mobile Infiltrometer 1. Agron. J. 1957, 49, 105–107. [Google Scholar] [CrossRef]
- Blackburn, W.H. Simulated Rainfall Studies of Selected Plant Communities and Soils in Five Rangeland Watersheds of Nevada. Ph.D. Thesis, University of Nevada, Reno, NV, USA, 1973. [Google Scholar]
- Blackburn, W.H.; Meeuwig, R.O.; Skau, C.M. A Mobile Infiltrometer for Use on Rangeland. J. Range Manag. 1974, 27, 322. [Google Scholar] [CrossRef]
- Boers, T.M.; van Deurzen, F.J.M.P.; Eppink, L.A.A.J.; Ruytenberg, R.E. Comparison of Infiltration Rates Measured with an Infiltrometer, a Rainulator and a Permeameter for Erosion Research in SE Nigeria. Soil Technol. 1992, 5, 13–26. [Google Scholar] [CrossRef]
- Carrà, B.G.; Bombino, G.; Denisi, P.; Plaza-Àlvarez, P.A.; Lucas-Borja, M.E.; Zema, D.A. Water Infiltration after Prescribed Fire and Soil Mulching with Fern in Mediterranean Forests. Hydrology 2021, 8, 95. [Google Scholar] [CrossRef]
- Cerdà, A.; García-Fayos, P. The Influence of Seed Size and Shape on Their Removal by Water Erosion. Catena 2002, 48, 293–301. [Google Scholar] [CrossRef]
- Commandeur, P.R. Soil Erosion Studies Using Rainfall Simulation on Forest Harvested Areas in British Columbia. In Proceedings of the International Symposium on Erosion, Debris Flows and Environment in Mountain Regions, Chengdu, China, 5–9 July 1992; IAHS Publication: Oxfordshire, UK, 1992; pp. 21–23. [Google Scholar]
- Corona, R.; Wilson, T.; D’Adderio, L.P.; Porcù, F.; Montaldo, N.; Albertson, J. On the Estimation of Surface Runoff through a New Plot Scale Rainfall Simulator in Sardinia, Italy. Procedia Environ. Sci. 2013, 19, 875–884. [Google Scholar] [CrossRef]
- Danacova, M. The Impact of Slope Gradients on the Generation of Surface Runoff in Laboratory Conditions. In Proceedings of the 17th International Multidisciplinary Scientific GeoConference SGEM2017, Water Resources, Forest, Marine and Ocean Ecosystems, Vienna, Austria, 27–29 November 2017. [Google Scholar]
- Dalgleish, H.Y.; Foster, I.D.L. 137Cs Losses from a Loamy Surface Water Gleyed Soil (Inceptisol); a Laboratory Simulation Experiment. Catena 1996, 26, 227–245. [Google Scholar] [CrossRef]
- De Ploey, J. A Stemflow Equation for Grasses and Similar Vegetation. Catena 1982, 9, 139–152. [Google Scholar] [CrossRef]
- De Ploey, J.; Mücher, H.J. A Consistency Index and Rainwash Mechanisms on Belgian Loamy Soils. Earth Surf. Process. 1981, 6, 319–330. [Google Scholar] [CrossRef]
- Dimoyiannis, D.G.; Valmis, S.; Vyrlas, P. A Rainfall Simulation Study of Erosion of Some Calcareous Soils. Glob. Nest 2001, 3, 179–183. [Google Scholar]
- Dunkerley, D. Effects of Rainfall Intensity Fluctuations on Infiltration and Runoff: Rainfall Simulation on Dryland Soils, Fowlers Gap, Australia: Rainfall Intensity Fluctuations in Fowlers Gap. Hydrol. Process. 2012, 26, 2211–2224. [Google Scholar] [CrossRef]
- Ekern, P.C., Jr.; Muckenhirn, R.J. Water Drop Impact as a Force in Transporting Sand. Soil Sci. Soc. Am. J. 1948, 12, 441–444. [Google Scholar] [CrossRef] [Green Version]
- Ellison, W.D.; Pomerene, W.H. A Rainfall Applicator. Agric. Eng. 1944, 25, 220. [Google Scholar]
- Epstein, E.; Grant, W.J. TB22: Design, Construction and Calibration of a Laboratory Rainfall Simulator. Technical Bulletins of the Maine Agricultural & Forest Experiment Station. 1966. Available online: https://core.ac.uk/download/pdf/217132135.pdf (accessed on 17 January 2023).
- Farres, P.J. The Dynamics of Rainsplash Erosion and the Role of Soil Aggregate Stability. Catena 1987, 14, 119–130. [Google Scholar] [CrossRef]
- Fernández-Gálvez, J.; Barahona, E.; Mingorance, M.D. Measurement of Infiltration in Small Field Plots by a Portable Rainfall Simulator: Application to Trace-Element Mobility. Water Air Soil Pollut. 2008, 191, 257–264. [Google Scholar] [CrossRef]
- Foley, J.L.; Silburn, D.M. Hydraulic Properties of Rain Impact Surface Seals on Three Clay Soils-Influence of Raindrop Impact Frequency and Rainfall Intensity during Steady State. Soil Res. 2002, 40, 1069–1083. [Google Scholar] [CrossRef]
- Foster, I.D.L.; Fullen, M.A.; Brandsma, R.T.; Chapman, A.S. Drip-Screen Rainfall Simulators for Hydro-and Pedo-Geomorphological Research: The Coventry Experience. Earth Surf. Process. Landf. 2000, 25, 691–707. [Google Scholar] [CrossRef]
- Freebairn, D.M.; Gupta, S.C. Microrelief, Rainfall and Cover Effects on Infiltration. Soil Tillage Res. 1990, 16, 307–327. [Google Scholar] [CrossRef]
- Fu, Y.; Li, G.-L.; Zheng, T.-H.; Li, B.-Q.; Zhang, T. Splash Detachment and Transport of Loess Aggregate Fragments by Raindrop Action. Catena 2017, 150, 154–160. [Google Scholar] [CrossRef]
- Gabriels, D.; De Boodt, M. Erosion Reduction Factors for Chemically Treated Soils: A Laboratory Experiment. In SSSA Special Publications; Soil Science Society of America: Madison, WI, USA, 1975; pp. 95–102. [Google Scholar]
- Gabriels, D.; Moldenhauer, W.C. Size Distribution of Eroded Material from Simulated Rainfall: Effect over a Range of Texture. Soil Sci. Soc. Am. J. 1978, 42, 954–958. [Google Scholar] [CrossRef]
- Gao, B.; Todd Walter, M.; Steenhuis, T.S.; Hogarth, W.L.; Parlange, J.-Y. Rainfall Induced Chemical Transport from Soil to Runoff: Theory and Experiments. J. Hydrol. 2004, 295, 291–304. [Google Scholar] [CrossRef]
- Gao, B.; Walter, M.T.; Steenhuis, T.S.; Parlange, J.-Y.; Nakano, K.; Rose, C.W.; Hogarth, W.L. Investigating Ponding Depth and Soil Detachability for a Mechanistic Erosion Model Using a Simple Experiment. J. Hydrol. 2003, 277, 116–124. [Google Scholar] [CrossRef]
- Gao, B.; Walter, M.T.; Steenhuis, T.S.; Parlange, J.-Y.; Richards, B.K.; Hogarth, W.L.; Rose, C.W. Investigating Raindrop Effects on Transport of Sediment and Non-Sorbed Chemicals from Soil to Surface Runoff. J. Hydrol. 2005, 308, 313–320. [Google Scholar] [CrossRef]
- Goodman, L.J. Erosion Control in Engineering Works. Agric. Eng. 1952, 33, 155–157. [Google Scholar]
- Guerrant, D.G.; Miller, W.W.; Mahannah, C.N.; Narayanan, R. Infiltration Evaluation of Four Mechanical Rainfall Simulation Techniques in Sierra Nevada Watersheds 1. Jawra J. Am. Water Resour. Assoc. 1990, 26, 127–134. [Google Scholar] [CrossRef]
- Guerrant, D.G.; Miller, W.W.; Mahannah, C.N.; Narayanan, R. Site—Specific Erosivity Evaluation of a Sierra Nevada Forested Watershed Soil. J. Environ. Qual. 1991, 20, 396–402. [Google Scholar] [CrossRef]
- Healy, M.G.; Fenton, O.; Cummins, E.; Clarke, R.; Peyton, D.; Fleming, G.; Wall, D.; Morrison, L.; Cormican, M. Health and Water Quality Impacts Arising from Land Spreading of Biosolids. Environ. Prot. Agency Res. Rep. 2017, 200. [Google Scholar] [CrossRef]
- Heathwaite, A.L.; Johnes, P.J. Contribution of Nitrogen Species and Phosphorus Fractions to Stream Water Quality in Agricultural Catchments. Hydrol. Process. 1996, 10, 971–983. [Google Scholar] [CrossRef]
- Heilig, A.; DeBruyn, D.; Walter, M.T.; Rose, C.W.; Parlange, J.-Y.; Steenhuis, T.S.; Sander, G.C.; Hairsine, P.B.; Hogarth, W.L.; Walker, L.P. Testing a Mechanistic Soil Erosion Model with a Simple Experiment. J. Hydrol. 2006, 317, 171–172. [Google Scholar] [CrossRef]
- Herwitz, S.R. Interception Storage Capacities of Tropical Rainforest Canopy Trees. J. Hydrol. 1985, 77, 237–252. [Google Scholar] [CrossRef]
- Hignett, C.T.; Gusli, S.; Cass, A.; Besz, W. An Automated Laboratory Rainfall Simulation System with Controlled Rainfall Intensity, Raindrop Energy and Soil Drainage. Soil Technol. 1995, 8, 31–42. [Google Scholar] [CrossRef]
- Hlavčová, K.; Danáčová, M.; Kohnová, S.; Szolgay, J.; Valent, P.; Výleta, R. Estimating the Effectiveness of Crop Management on Reducing Flood Risk and Sediment Transport on Hilly Agricultural Land—A Myjava Case Study, Slovakia. Catena 2019, 172, 678–690. [Google Scholar] [CrossRef]
- Huang, J.; Wu, P.; Zhao, X. Effects of Rainfall Intensity, Underlying Surface and Slope Gradient on Soil Infiltration under Simulated Rainfall Experiments. Catena 2013, 104, 93–102. [Google Scholar] [CrossRef]
- Jeppson, R.W.; Rawls, W.J.; Hamon, W.R.; Schreiber, D.L. Use of Axisymmetric Infiltration Model and Field Data to Determine Hydraulic Properties of Soils. Water Resour. Res. 1975, 11, 127–138. [Google Scholar] [CrossRef]
- Kinnell, P.I.A. Laboratory Studies on the Effect of Drop Size on Splash Erosion. J. Agric. Eng. Res. 1982, 27, 431–439. [Google Scholar] [CrossRef]
- Kinnell, P.I.A. Particle Travel Distances and Bed and Sediment Compositions Associated with Rain-Impacted Flows. Earth Surf. Process. 2001, 26, 749–758. [Google Scholar] [CrossRef]
- Kinnell, P.I.A. Sediment Transport by Medium to Large Drops Impacting Flows at Subterminal Velocity. Soil Sci. Soc. Am. J. 2005, 69, 902–905. [Google Scholar] [CrossRef]
- Kinnell, P.I.A. Splash Erosion: Some Observations on the Splash-Cup Technique. Soil Sci. Soc. Am. J. 1974, 38, 657–660. [Google Scholar] [CrossRef]
- Kinnell, P.I.A. The Influence of Flow Discharge on Sediment Concentrations in Raindrop Induced Flow Transport. Soil Res. 1988, 26, 575. [Google Scholar] [CrossRef]
- Levin, J.; Ben-Hur, M.; Gal, M.; Levy, G.J. Rain Energy and Soil Amendments Effects on Infiltration and Erosion of Three Different Soil Types. Soil Res. 1991, 29, 455. [Google Scholar] [CrossRef]
- Lu, J.-Y.; Chen, J.-Y.; Chang, F.-H.; Lu, T.-F. Characteristics of Shallow Rain-Impacted Flow over Smooth Bed. J. Hydraul. Eng. 1998, 124, 1242–1252. [Google Scholar] [CrossRef]
- Lu, J.-Y.; Chen, J.-Y.; Hong, J.-H.; Lu, T.-F.; Liu, C.-S. Turbulence Intensities of Shallow Rain-Impacted Flow over Rough Bed. J. Hydraul. Eng. 2001, 127, 881–886. [Google Scholar] [CrossRef]
- Lu, J.-Y.; Lee, J.-J.; Lu, T.-F.; Hong, J.-H. Experimental Study of Extreme Shear Stress for Shallow Flow under Simulated Rainfall. Hydrol. Process. 2009, 23, 1660–1667. [Google Scholar] [CrossRef]
- Maore, J.M.; Mihara, M. Development of Portable Artificial Rainfall Simulator for Evaluating Sustainable Farming in Kenya. Int. J. Environ. Rural. Dev. 2017, 8, 27–33. [Google Scholar]
- Mcintyre, D.S. Permeability Measurements of Soil Crusts Formed by Raindrop Impact. Soil Sci. 1958, 85, 185–189. [Google Scholar] [CrossRef]
- Mcintyre, D.S. Soil Splash and the Formation of Surface Crusts by Raindrop Impact. Soil Sci. 1958, 85, 261–266. [Google Scholar] [CrossRef]
- Mohanty, S.; Singh, R. Determination of Soil Hydrologic Properties under Simulated Rainfall Condition. Agric. Water Manag. 1996, 29, 267–281. [Google Scholar] [CrossRef]
- Mohr, C.; Anton, H. Design and Application of a Drip-Type Rainfall Simulator Adapted to Steep Topography and Low Intensity-Rainfall Characteristics in the Coastal Range of Southern Chile. EGU General Assembly Conference Abstracts. 2010. Available online: https://meetingorganizer.copernicus.org/EGU2010/EGU2010-7350-1.pdfc (accessed on 17 January 2023).
- Mohr, C.H.; Coppus, R.; Iroumé, A.; Huber, A.; Bronstert, A. Runoff Generation and Soil Erosion Processes after Clear Cutting: Runoff and Erosion After Clear Cutting. J. Geophys. Res. Earth Surf. 2013, 118, 814–831. [Google Scholar] [CrossRef]
- Moldenhauer, W.C.; Kemper, W.D. Interdependence of Water Drop Energy and Clod Size on Infiltration and Clod Stability. Soil Sci. Soc. Am. J. 1969, 33, 297–301. [Google Scholar] [CrossRef]
- Moldenhauer, W.C.; Koswara, J. Effect of Initial Clod Size on Characteristics of Splash and Wash Erosion1. Soil Sci. Soc. Am. J. 1968, 32, 875. [Google Scholar] [CrossRef]
- Moldenhauer, W.C.; Long, D.C. Influence of Rainfall Energy on Soil Loss and Infiltration Rates: I. Effect over a Range of Texture. Soil Sci. Soc. Am. J. 1964, 28, 813–817. [Google Scholar] [CrossRef]
- Moore, D.C.; Singer, M.J. Crust Formation Effects on Soil Erosion Processes. Soil Sci. Soc. Am. J. 1990, 54, 1117–1123. [Google Scholar] [CrossRef]
- Moss, A.J.; Green, P. Movement of Solids in Air and Water by Raindrop Impact. Effects of Drop-Size and Water-Depth Variations. Soil Res. 1983, 21, 257. [Google Scholar] [CrossRef]
- Moss, A.J.; Walker, P.H.; Hutka, J. Raindrop-Stimulated Transportation in Shallow Water Flows: An Experimental Study. Sediment. Geol. 1979, 22, 165–184. [Google Scholar] [CrossRef]
- Munn, J.R.; Huntington, G.L. A Portable Rainfall Simulator for Erodibility and Infiltration Measurements on Rugged Terrain. Soil Sci. Soc. Am. J. 1976, 40, 622–624. [Google Scholar] [CrossRef]
- Nampulá, J.L.C.; Lara, C.M.G.; Medinilla, E.E.; Herrera, R.G.; Toledo, P.V.; Sánchez, R.A.V. Diseño y Calibración de Un Simulador Automático de Lluvia. Espac. I+D Innovación Más Desarro. 2016, 5, 23–37. [Google Scholar] [CrossRef]
- Naslas, G.D.; Miller, W.W.; Gifford, G.F.; Fernandez, G.C.J. Effects of Soil Type, Plot Condition, and Slope on Runoff and Interrill Erosion of Two Soils in the Lake Tahoe Basin 1. Jawra J. Am. Water Resour. Assoc. 1994, 30, 319–328. [Google Scholar] [CrossRef]
- Naves, J.; Anta, J.; Suárez, J.; Puertas, J. Development and Calibration of a New Dripper-Based Rainfall Simulator for Large-Scale Sediment Wash-off Studies. Water 2020, 12, 152. [Google Scholar] [CrossRef] [Green Version]
- Norton, L.D. Micromorphological Study of Surface Seals Developed under Simulated Rainfall. Geoderma 1987, 40, 127–140. [Google Scholar] [CrossRef]
- Osborn, B. Measuring Soil Splash and Protective Value of Cover on Range Land: Methods and Equipment Used in Range Cover Evaluations in Texas and Oklahoma; US Department of Agriculture, Soil Conservation Service: Washington, DC, USA, 1949.
- Parlak, M. Determination of Soil Erosion over Different L and Uses by Mini Rainfall Simulator. J. Food Agric. Environ. 2012, 10, 929–933. [Google Scholar]
- Rasbash, D.J. The Production of Water Spray of Uniform Drop Size by a Battery of Hypodermic Needles. J. Sci. Instrum. 1953, 30, 189–192. [Google Scholar] [CrossRef]
- Riezebos, T.H.; Seyhan, E. Essential Conditions of Rainfall Simulation for Laboratory Water Erosion Experiments. Earth Surf. Process. 1977, 2, 185–190. [Google Scholar] [CrossRef]
- Römkens, M.J.M.; Glenn, L.F.; Nelson, D.W.; Roth, C.B. A Laboratory Rainfall Simulator for Infiltration and Soil Detachment Studies1. Soil Sci. Soc. Am. J. 1975, 39, 158. [Google Scholar] [CrossRef]
- Roth, C.H.; Joschko, M. A Note on the Reduction of Runoff from Crusted Soils by Earthworm Burrows and Artificial Channels. Z. Pflanzenernaehr. Bodenkd. 1991, 154, 101–105. [Google Scholar] [CrossRef]
- Schultz, J.P.; Jarrett, A.R.; Hoover, J.R. Detachment and Splash of a Cohesive Soil by Rainfall. Trans. ASAE 1985, 28, 1878–1884. [Google Scholar] [CrossRef]
- Selby, M.J. Design of a Hand-Portable Rainfall-Simulating Infiltrometer, with Trial Results from the Otutira Catchment. J. Hydrol. 1970, 9, 117–132. [Google Scholar]
- Shainberg, I.; Mamedov, A.I.; Levy, G.J. Role of Wetting Rate and Rain Energy in Seal Formation and Erosion 1. Soil Sci. 2003, 168, 54–62. [Google Scholar] [CrossRef]
- Singh, R.; Panigrahy, N.; Philip, G. Modified Rainfall Simulator Infiltrometer for Infiltration, Runoff and Erosion Studies. Agric. Water Manag. 1999, 41, 167–175. [Google Scholar] [CrossRef]
- Summer, R.M. Field and Laboratory Studies on Alpine Soil Erodibility, Southern Rocky Mountains, Colorado. Earth Surf. Process. 2007, 7, 253–266. [Google Scholar] [CrossRef]
- Sutherland, R.A.; Wan, Y.; Ziegler, A.D.; Lee, C.-T.; El-Swaify, S.A. Splash and Wash Dynamics: An Experimental Investigation Using an Oxisol. Geoderma 1996, 69, 85–103. [Google Scholar] [CrossRef]
- Terry, J.P.; Shakesby, R.A. Soil Hydrophobicity Effects on Rainsplash: Simulated Rainfall and Photographic Evidence. Earth Surf. Process. 1993, 18, 519–525. [Google Scholar] [CrossRef]
- Thurow, T.L.; Blackburn, W.H.; Warren, S.D.; Taylor, C.A. Rainfall Interception by Midgrass, Shortgrass, and Live Oak Mottes. J. Range Manag. 1987, 40, 455. [Google Scholar] [CrossRef]
- Tricker, A.S. The Design of a Portable Rainfall Simulator Infiltrometer. J. Hydrol. 1979, 41, 143–147. [Google Scholar] [CrossRef]
- Vahabi, J.; Nikkami, D. Assessing Dominant Factors Affecting Soil Erosion Using a Portable Rainfall Simulator. Int. J. Sediment Res. 2008, 23, 376–386. [Google Scholar] [CrossRef]
- Walker, P.H.; Kinnell, P.I.A.; Green, P. Transport of a Noncohesive Sandy Mixture in Rainfall and Runoff Experiments. Soil Sci. Soc. Am. J. 1978, 42, 793–801. [Google Scholar] [CrossRef]
- Wan, Y.; El-Swaify, S.A.; Sutherland, R.A. Partitioning Interrill Splash and Wash Dynamics: A Novel Laboratory Approach. Soil Technol. 1996, 9, 55–69. [Google Scholar] [CrossRef]
- West, N.E.; Gifford, G.F. Rainfall Interception by Cool-Desert Shrubs. J. Range Manag. 1976, 29, 171. [Google Scholar] [CrossRef]
- Wierda, A.; Veen, A.W.L. A Rainfall Simulator Study of Infiltration into Arable Soils. Agric. Water Manag. 1992, 21, 119–135. [Google Scholar] [CrossRef]
- Will, G.L. Infiltration under a Rainfall Simulator. Master’s Thesis, Oregon State University, Corvallis, OR, USA, 1973. [Google Scholar]
- Wilson, J.P.; Seney, J.P. Erosional Impact of Hikers, Horses, Motorcycles, and off-Road Bicycles on Mountain Trails in Montana. Mt. Res. Dev. 1994, 14, 77–88. [Google Scholar] [CrossRef]
- Wood, M.K.; Blackburn, W.H. Grazing Systems: Their Influence on Infiltration Rates in the Rolling Plains of Texas. J. Range Manag. 1981, 34, 331. [Google Scholar] [CrossRef]
- Woodburn, R. The Effect of Structural Condition on Soil Detachment by Raindrop Impact. Agric. Eng. 1948, 29, 154–156. [Google Scholar]
- Yamamoto, T.; Anderson, H.W. Splash Erosion Related to Soil Erodibility Indexes and Other Forest Soil Properties in Hawaii. Water Resour. Res. 1973, 9, 336–345. [Google Scholar] [CrossRef]
- Young, R.A. A Method of Measuring Aggregate Stability under Waterdrop Impact. Trans. ASAE 1984, 27, 1351–1354. [Google Scholar] [CrossRef]
- Al-Durrah, M.; Bradford, J.M. New Methods of Studying Soil Detachment Due to Waterdrop Impact. Soil Sci. Soc. Am. J. 1981, 45, 949–953. [Google Scholar] [CrossRef]
- Al-Durrah, M.M.; Bradford, J.M. Parameters for Describing Soil Detachment Due to Single Waterdrop Impact. Soil Sci. Soc. Am. J. 1982, 46, 836–840. [Google Scholar] [CrossRef]
- Al-Durrah, M.M.; Bradford, J.M. The Mechanism of Raindrop Splash on Soil Surfaces. Soil Sci. Soc. Am. J. 1982, 46, 1086–1090. [Google Scholar] [CrossRef]
- Bergsma, E.; Valenzuela, C.R. Drop Testing Aggregate Stability of Some Soils near Merida, Spain. Earth Surf. Process. 1981, 6, 309–318. [Google Scholar] [CrossRef]
- Cruse, R.M.; Larson, W.E. Effect of Soil Shear Strength on Soil Detachment Due to Raindrop Impact1. Soil Sci. Soc. Am. J. 1977, 41, 777. [Google Scholar] [CrossRef]
- Farres, P.J.; Cousen, S.M. An Improved Method of Aggregate Stability Measurement. Earth Surf. Process. 1985, 10, 321–329. [Google Scholar] [CrossRef]
- Francis, P.B.; Cruse, R.M. Soil Water Matric Potential Effects on Aggregate Stability. Soil Sci. Soc. Am. J. 1983, 47, 578–581. [Google Scholar] [CrossRef]
- Furbish, D.J.; Hamner, K.K.; Schmeeckle, M.; Borosund, M.N.; Mudd, S.M. Rain Splash of Dry Sand Revealed by High-Speed Imaging and Sticky Paper Splash Targets. J. Geophys. Res. 2007, 112. [Google Scholar] [CrossRef]
- Ghadir, H.; Payne, D. The Formation and Characteristics of Splash Following Raindrop Impact on Soil. J. Soil Sci. 1988, 39, 563–575. [Google Scholar] [CrossRef]
- Hobbs, P.V.; Osheroff, T. Splashing of Drops on Shallow Liquids. Science 1967, 158, 1184–1186. [Google Scholar] [CrossRef]
- Lane, W.R. A Microburette for Producing Small Liquid Drops of Known Size. J. Sci. Instrum. 1947, 24, 98–101. [Google Scholar] [CrossRef]
- Magono, C. On the Shape of Water Drops Falling in Stagnant Air. J. Meteorol. 1954, 11, 77–79. [Google Scholar] [CrossRef]
- Mutchler, C.K. Using the Drift of Waterdrops during Fall for Rainfall Simulator Design. J. Geophys. Res. 1965, 70, 3899–3902. [Google Scholar] [CrossRef]
- Mutchler, C.K.; Hansen, L.M. Splash of a Waterdrop at Terminal Velocity. Science 1970, 169, 1311–1312. [Google Scholar] [CrossRef]
- Mutchler, C.K.; Larson, C.L. Splash Amounts from Waterdrop Impact on a Smooth Surface. Water Resour. Res. 1971, 7, 195–200. [Google Scholar] [CrossRef]
- Nearing, M.A.; Bradford, J.M. Single Waterdrop Splash Detachment and Mechanical Properties of Soils. Soil Sci. Soc. Am. J. 1985, 49, 547–552. [Google Scholar] [CrossRef]
- Palmer, R.S. The Influence of a Thin Water Layer on Waterdrop Impact Forces. Int. Assoc. Sci. Hydrol. Publ. 1963, 65, 141–148. [Google Scholar]
- Palmer, R.S. An Apparatus for Forming Waterdrops; U.S. Department of Agriculture: Washington, DC, USA, 1962; Volume 61.
- Palmer, R.S. Waterdrop Impact Forces. Trans. ASAE 1965, 8, 69–70. [Google Scholar] [CrossRef]
- Ryan, R.T. The Behavior of Large, Low-Surface-Tension Water Drops Falling at Terminal Velocity in Air. J. Appl. Meteorol. 1976, 15, 157–165. [Google Scholar] [CrossRef]
- Ryżak, M.; Bieganowski, A. Using the Image Analysis Method for Describing Soil Detachment by a Single Water Drop Impact. Sensors 2012, 12, 11527–11543. [Google Scholar] [CrossRef] [Green Version]
- Ryżak, M.; Bieganowski, A.; Polakowski, C. Effect of Soil Moisture Content on the Splash Phenomenon Reproducibility. PLoS ONE 2015, 10, e0119269. [Google Scholar] [CrossRef] [Green Version]
- Savat, J. Work Done by Splash: Laboratory Experiments. Earth Surf. Process. 1981, 6, 275–283. [Google Scholar] [CrossRef]
- Sharma, P.P.; Gupta, S.C.; Rawls, W.J. Soil Detachment by Single Raindrops of Varying Kinetic Energy. Soil Sci. Soc. Am. J. 1991, 55, 301. [Google Scholar] [CrossRef]
- Yu, C.-K.; Hsieh, P.-R.; Yuter, S.E.; Cheng, L.-W.; Tsai, C.-L.; Lin, C.-Y.; Chen, Y. Measuring Droplet Fall Speed with a High-Speed Camera: Indoor Accuracy and Potential Outdoor Applications. Atmos. Meas. Tech. 2016, 9, 1755–1766. [Google Scholar] [CrossRef] [Green Version]
- Israelsen, C.E.; Israelsen, E.K.; Fletcher, J.E.; Fifield, J.S.; Canfield, R.V. Erosion Control Product Testing. 1979. Available online: https://digitalcommons.usu.edu/water_rep/367/ (accessed on 12 October 2022).
- Roth, C.H.; Helming, K. Dynamics of Surface Sealing, Runoff Formation and Interrill Soil Loss as Related to Rainfall Intensity, Microrelief and Slope. Z. Für Pflanz. Und Bodenkd. 1992, 155, 209–216. [Google Scholar] [CrossRef]
- Bombino, G.; Denisi, P.; Gómez, J.; Zema, D. Water Infiltration and Surface Runoff in Steep Clayey Soils of Olive Groves underDifferent Management Practices. Water 2019, 11, 240. [Google Scholar] [CrossRef] [Green Version]


Disclaimer/Publisher’s Note: The statements, opinions and data contained in all publications are solely those of the individual author(s) and contributor(s) and not of MDPI and/or the editor(s). MDPI and/or the editor(s) disclaim responsibility for any injury to people or property resulting from any ideas, methods, instructions or products referred to in the content. |
© 2023 by the authors. Licensee MDPI, Basel, Switzerland. This article is an open access article distributed under the terms and conditions of the Creative Commons Attribution (CC BY) license (https://creativecommons.org/licenses/by/4.0/).
Share and Cite
Rončević, V.; Živanović, N.; van Boxel, J.H.; Iserloh, T.; Štrbac, S. Dripping Rainfall Simulators for Soil Research—Performance Review. Water 2023, 15, 1314. https://doi.org/10.3390/w15071314
Rončević V, Živanović N, van Boxel JH, Iserloh T, Štrbac S. Dripping Rainfall Simulators for Soil Research—Performance Review. Water. 2023; 15(7):1314. https://doi.org/10.3390/w15071314
Chicago/Turabian StyleRončević, Vukašin, Nikola Živanović, John H. van Boxel, Thomas Iserloh, and Snežana Štrbac. 2023. "Dripping Rainfall Simulators for Soil Research—Performance Review" Water 15, no. 7: 1314. https://doi.org/10.3390/w15071314