

Defining Heat in Place for the Discovered Geothermal Brine Reservoirs in the Croatian Part of Pannonian Basin

Abstract
:1. Introduction
Geothermal Exploration and Production in Croatia
2. Methods
2.1. Gringarten Method
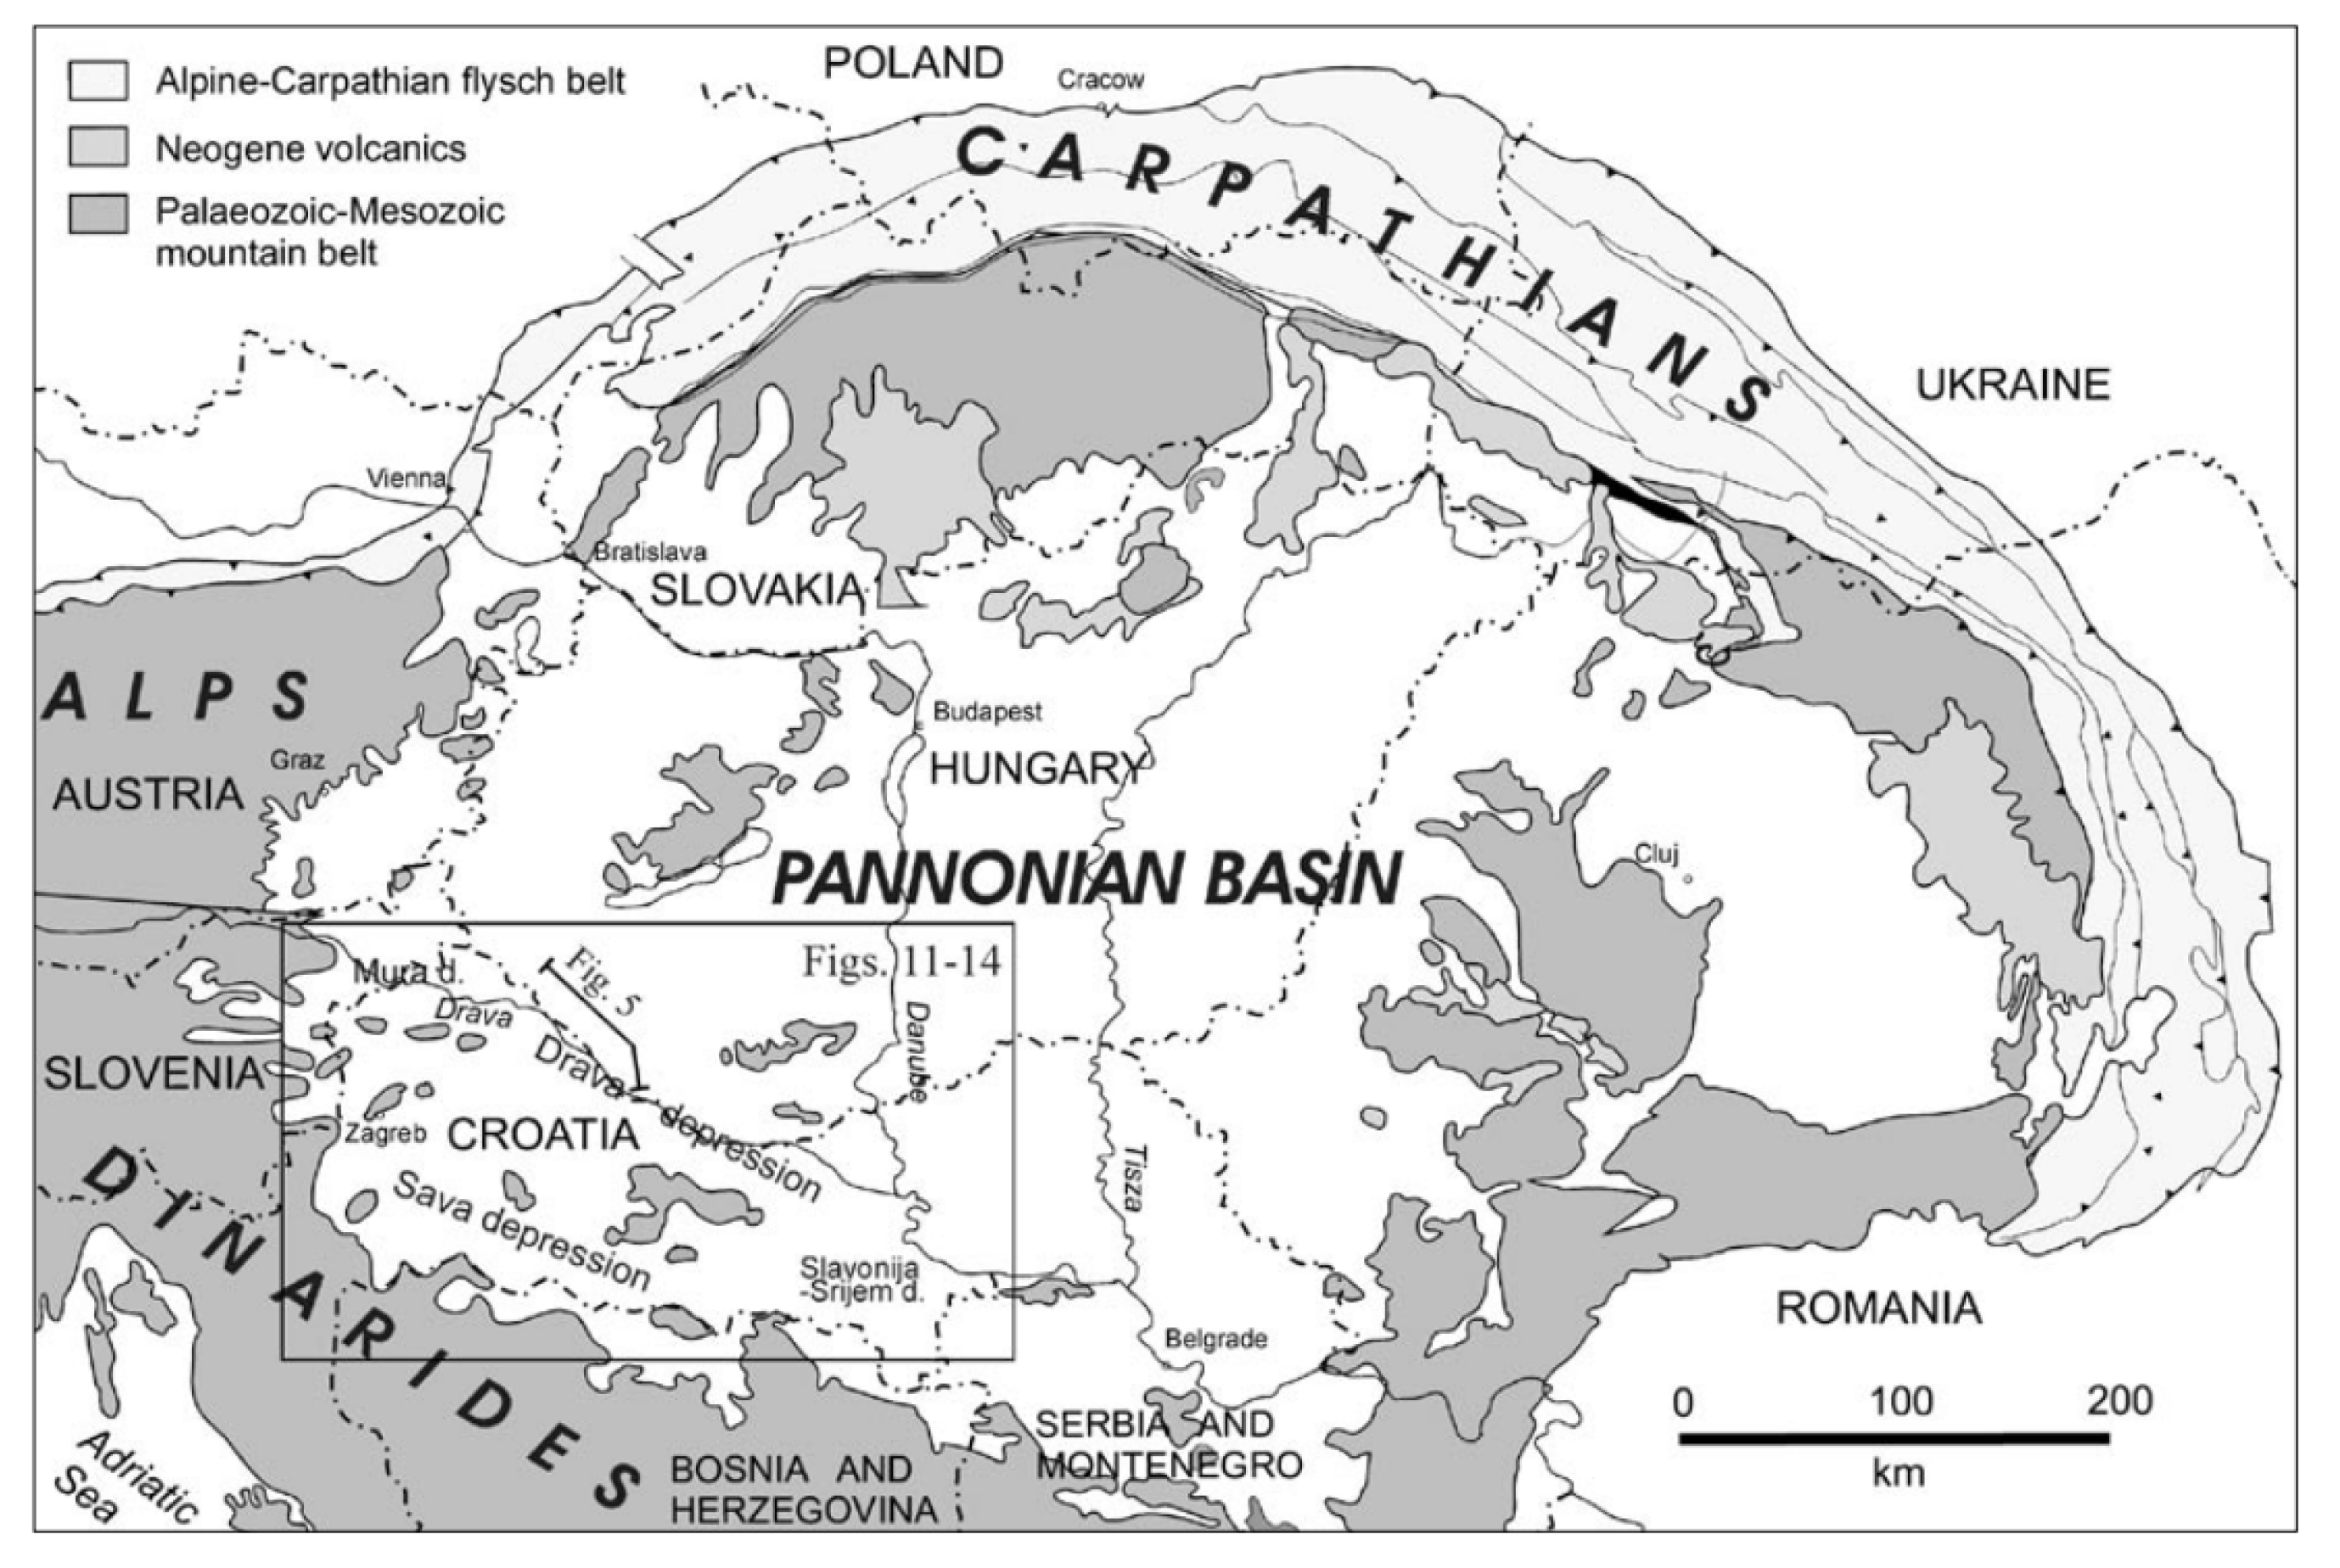
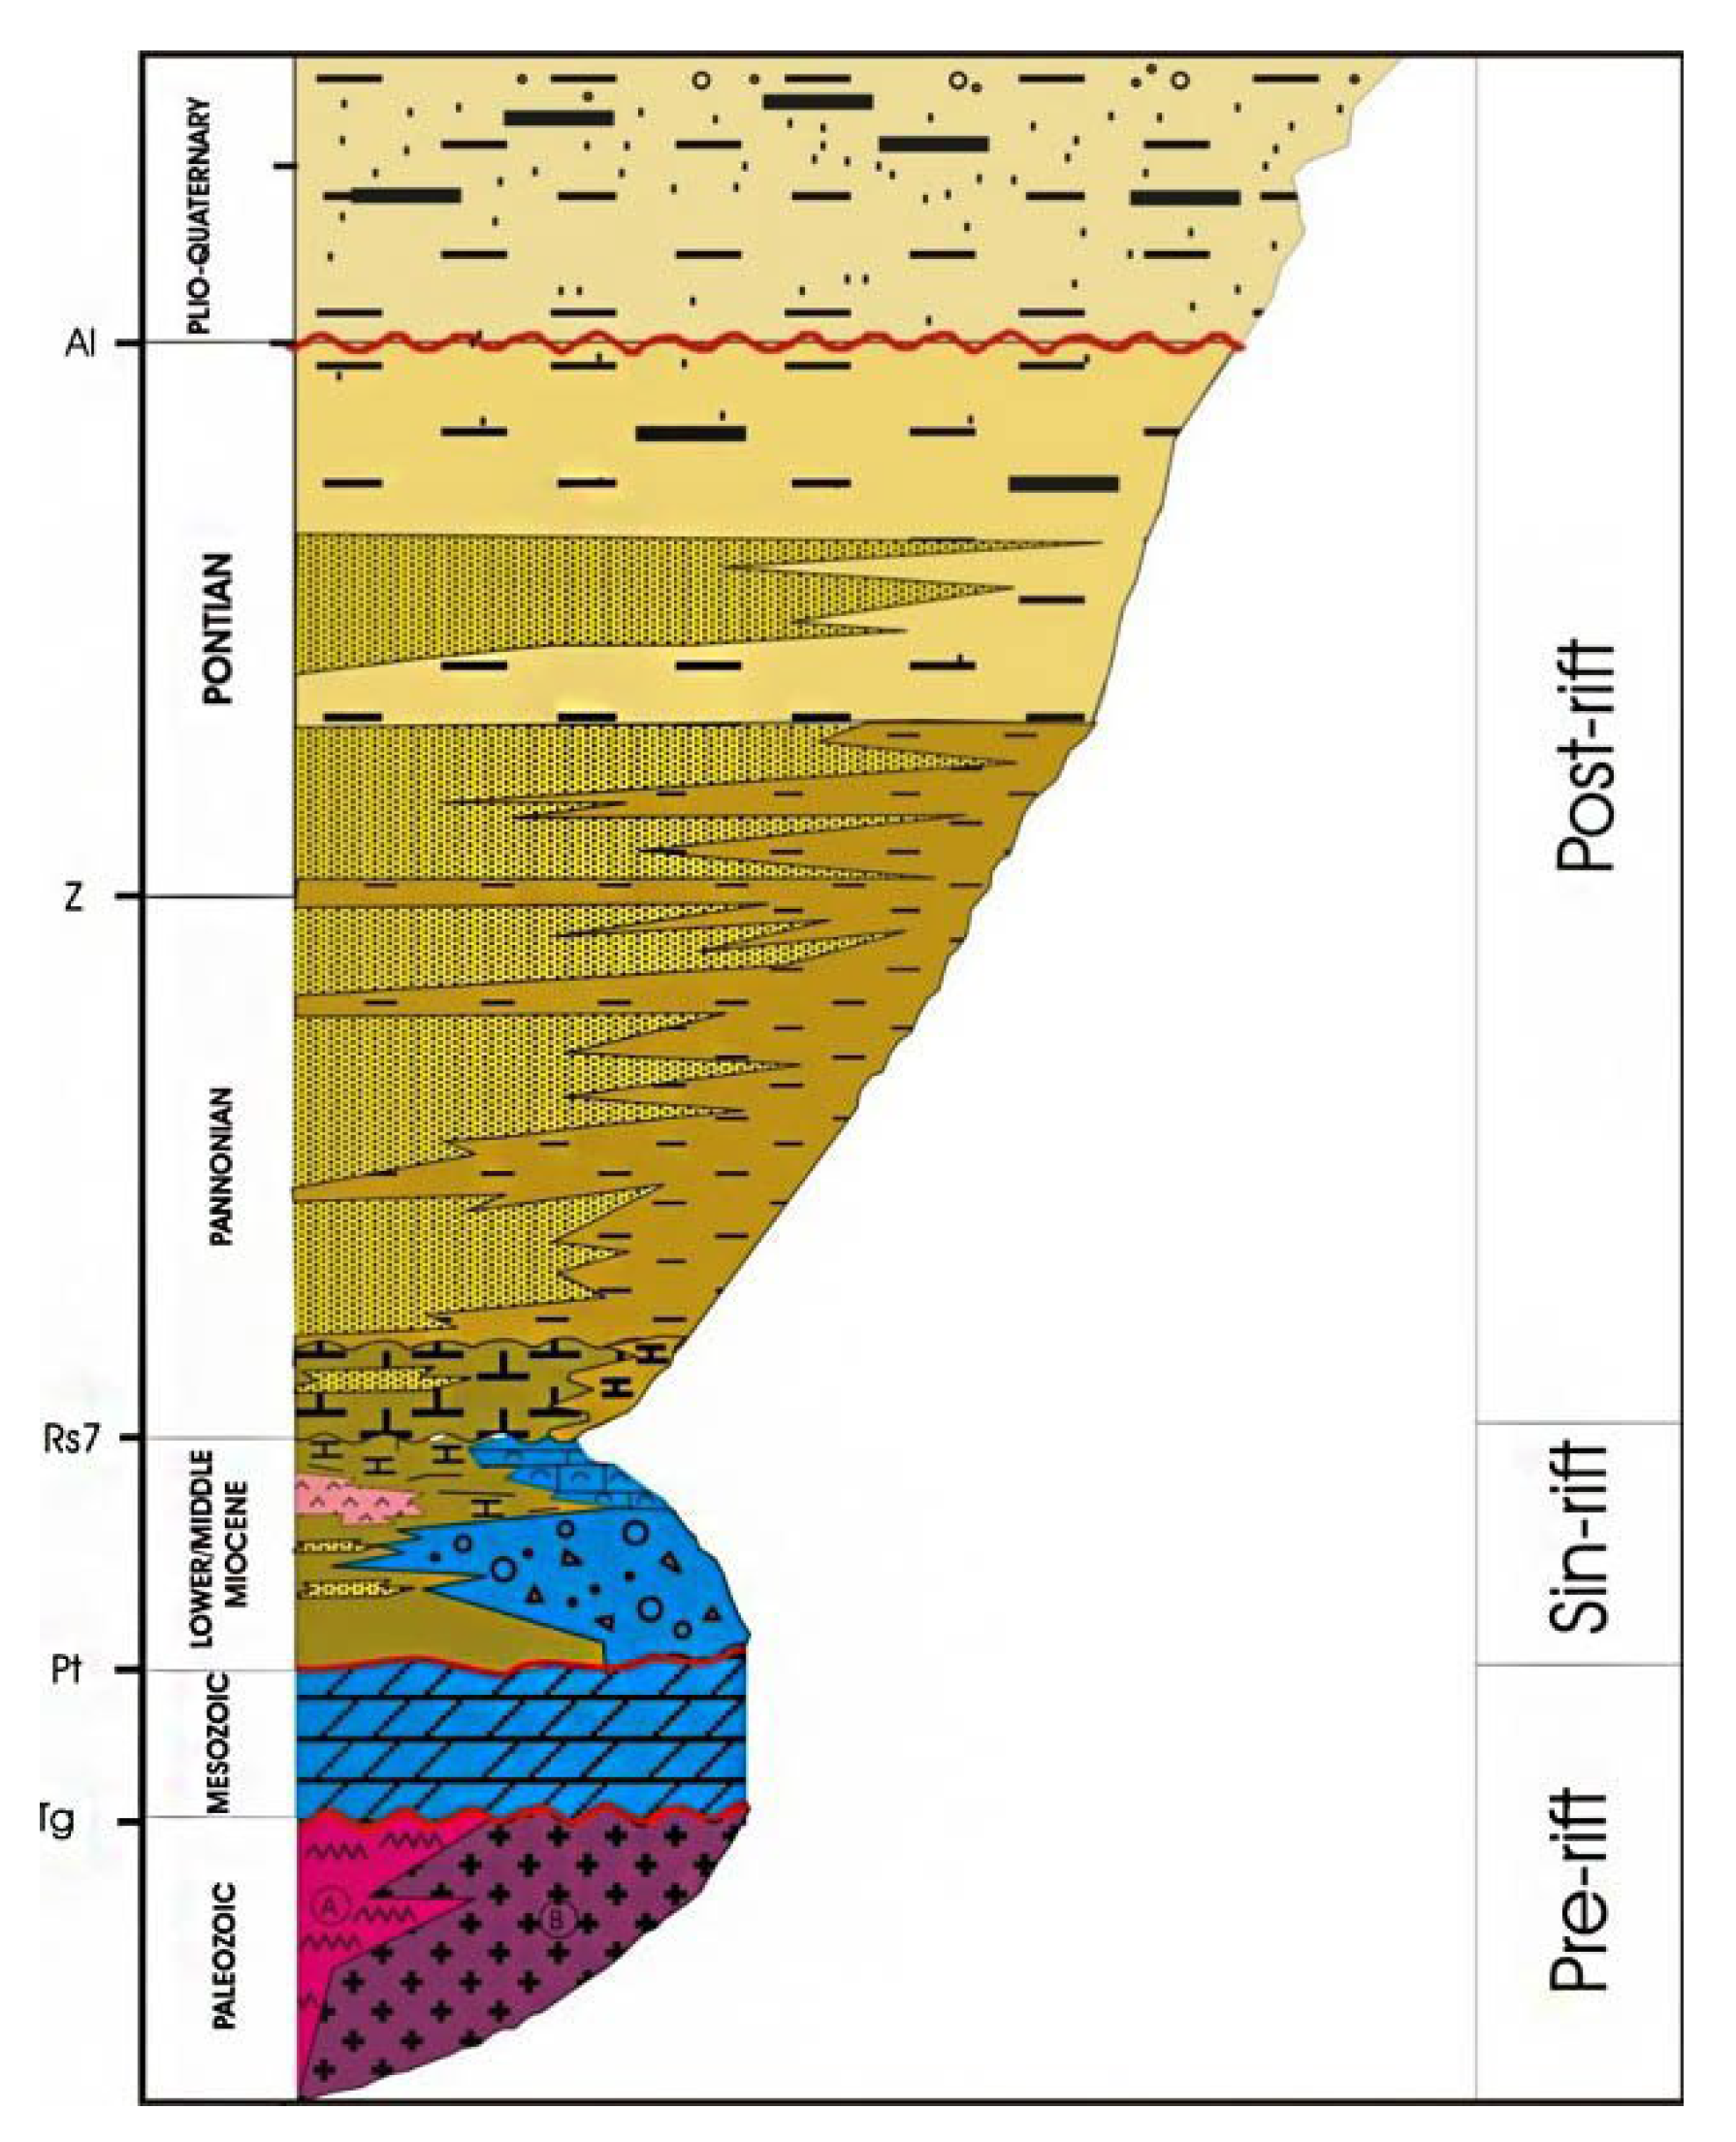
2.2. Geological Settings of the Study Area

2.3. Drill Stem Test
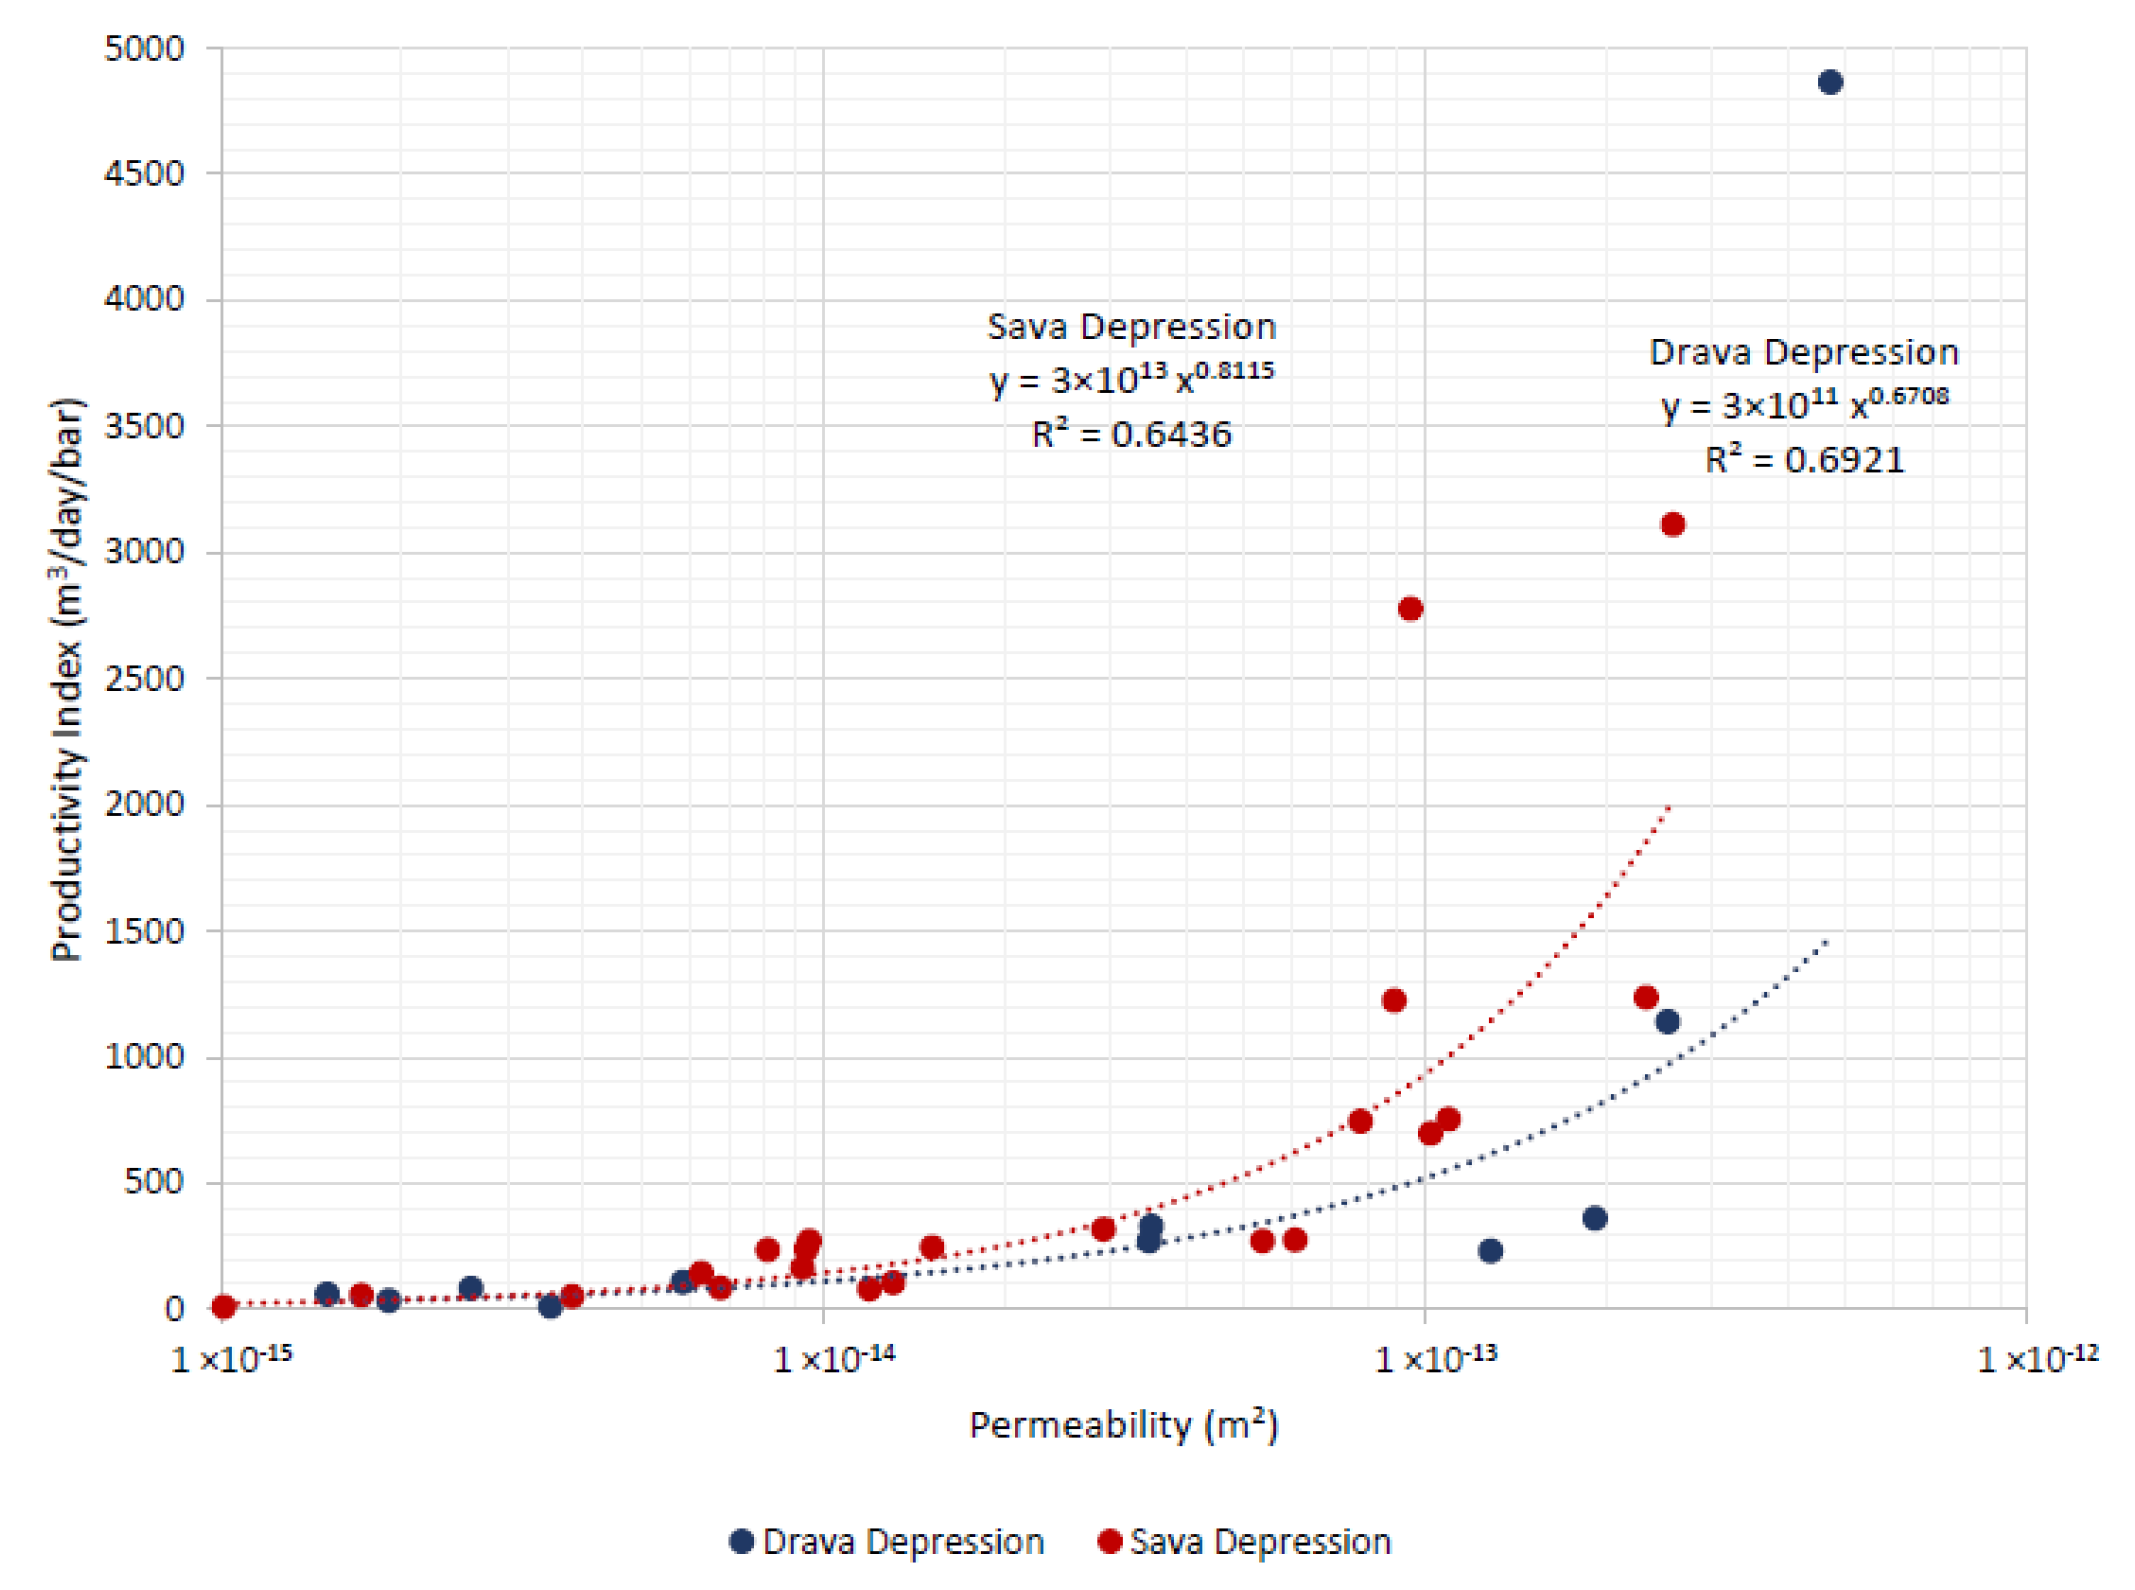
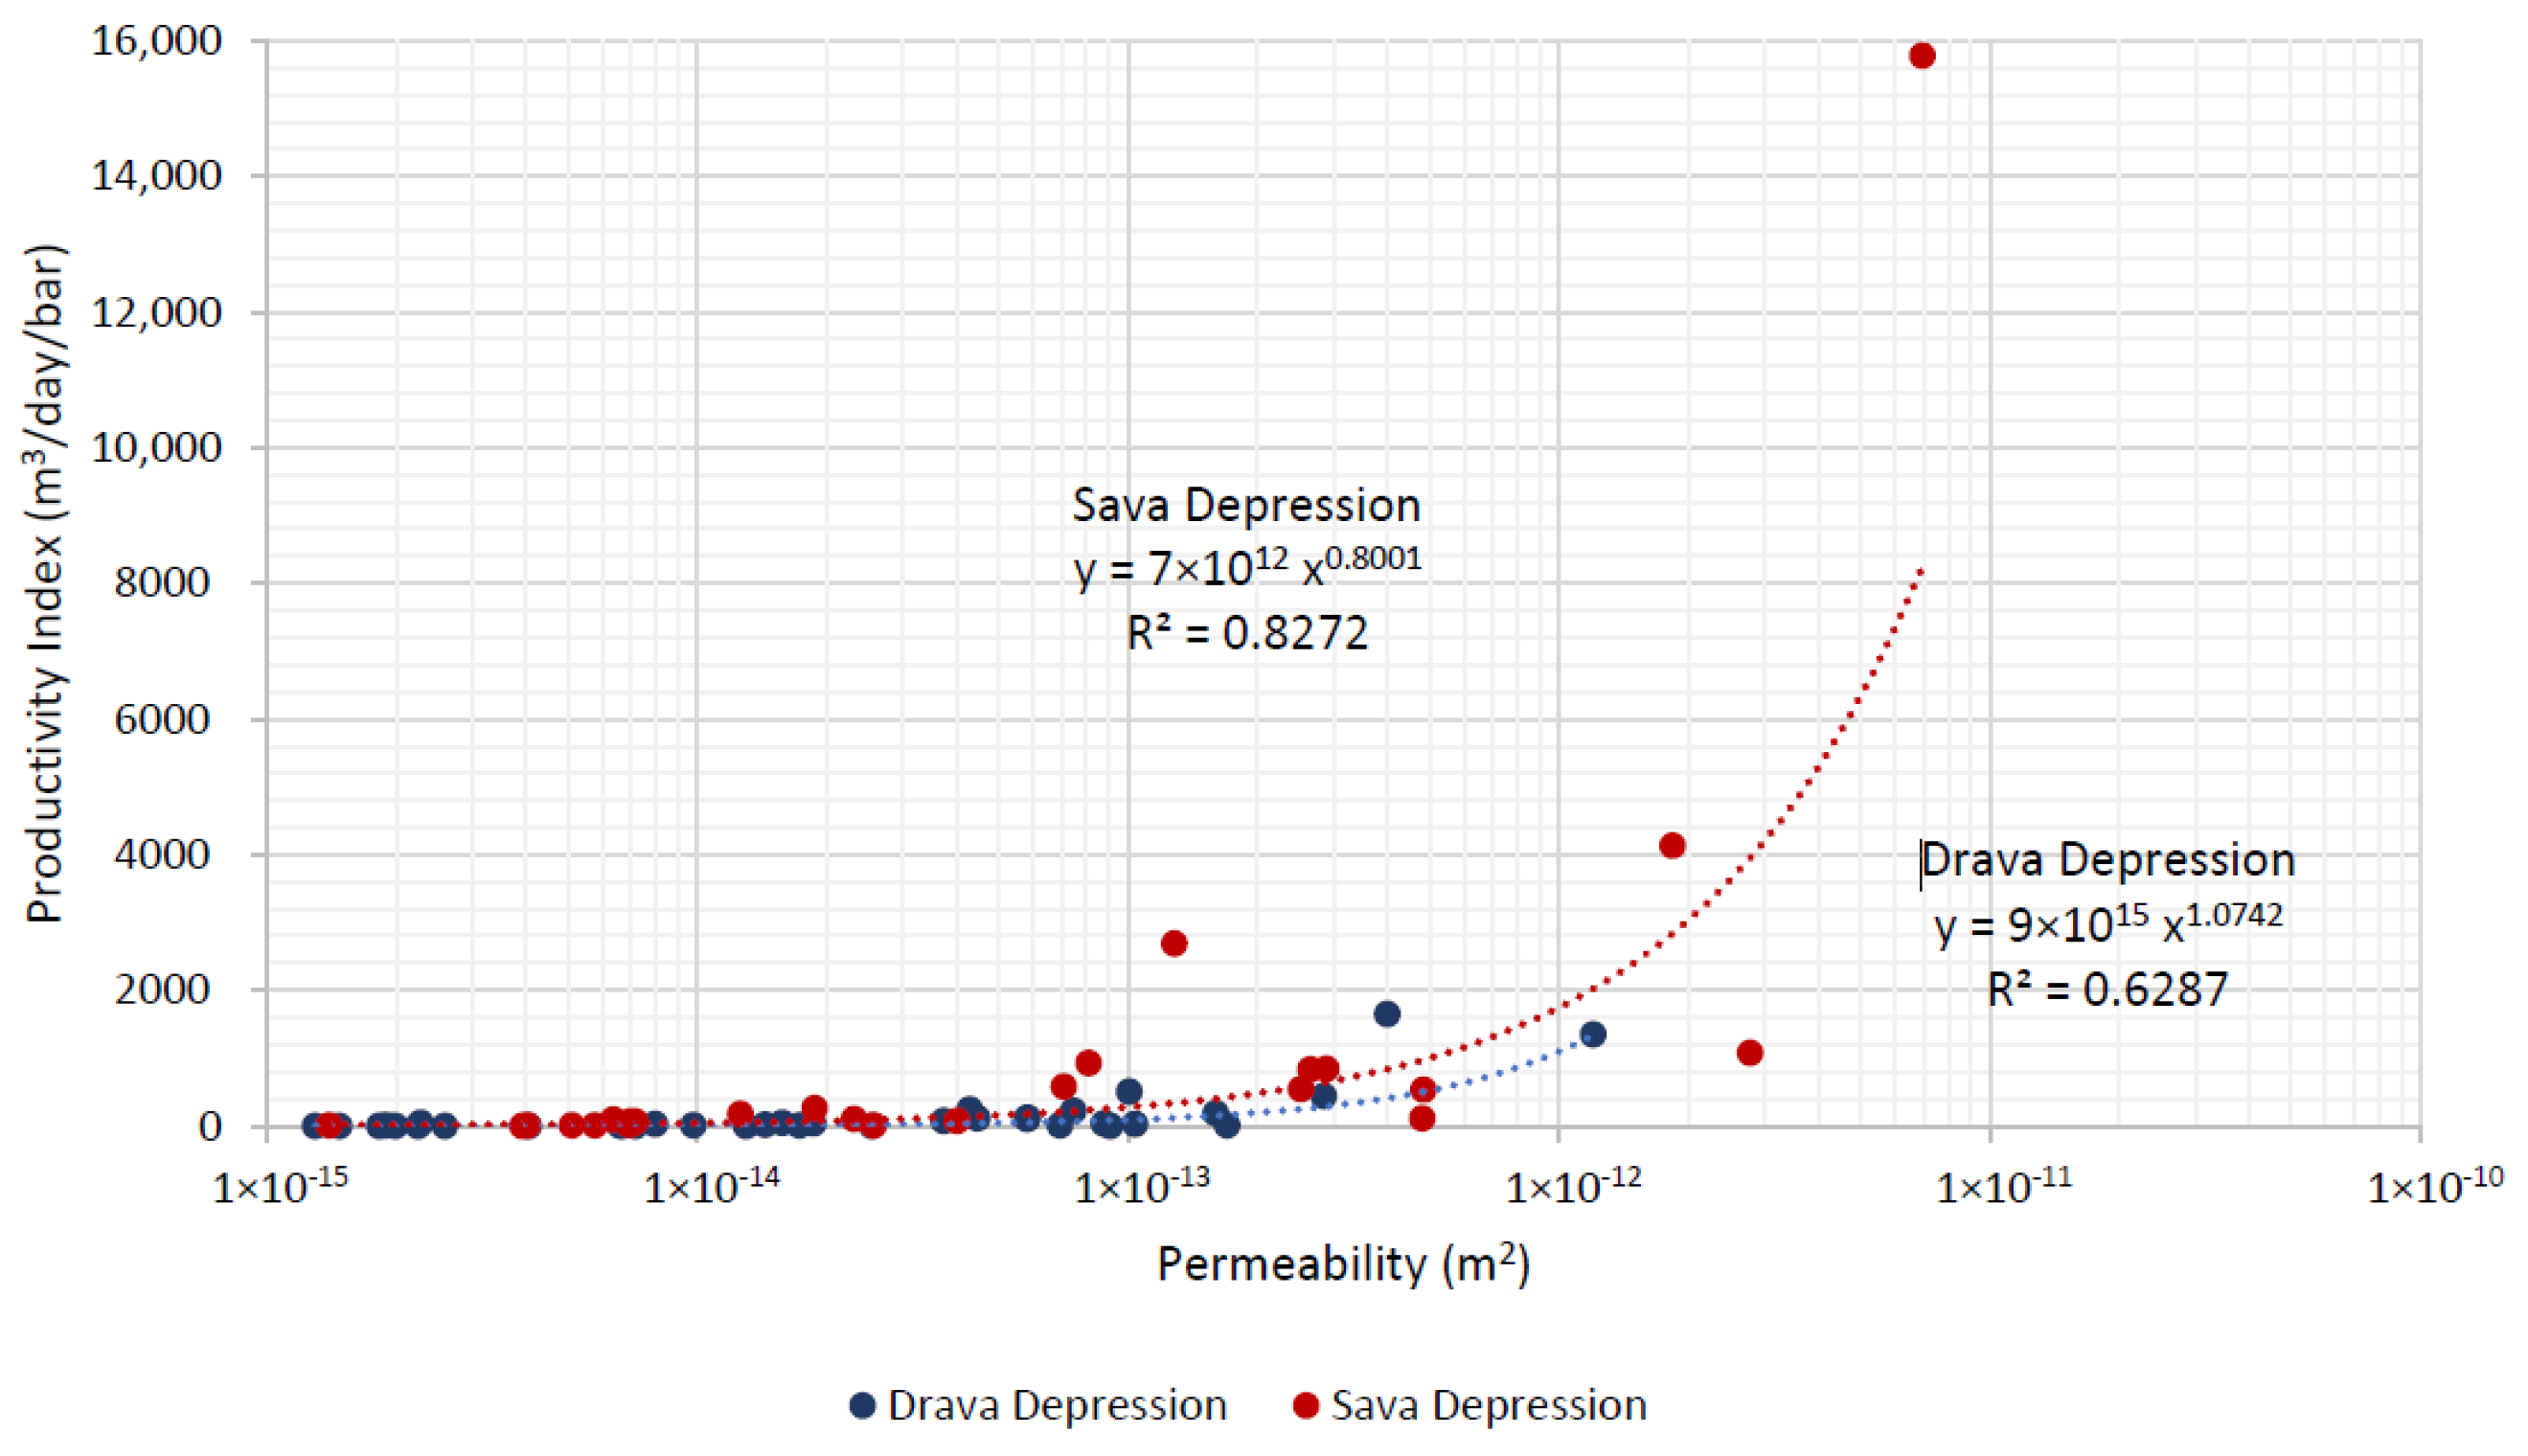
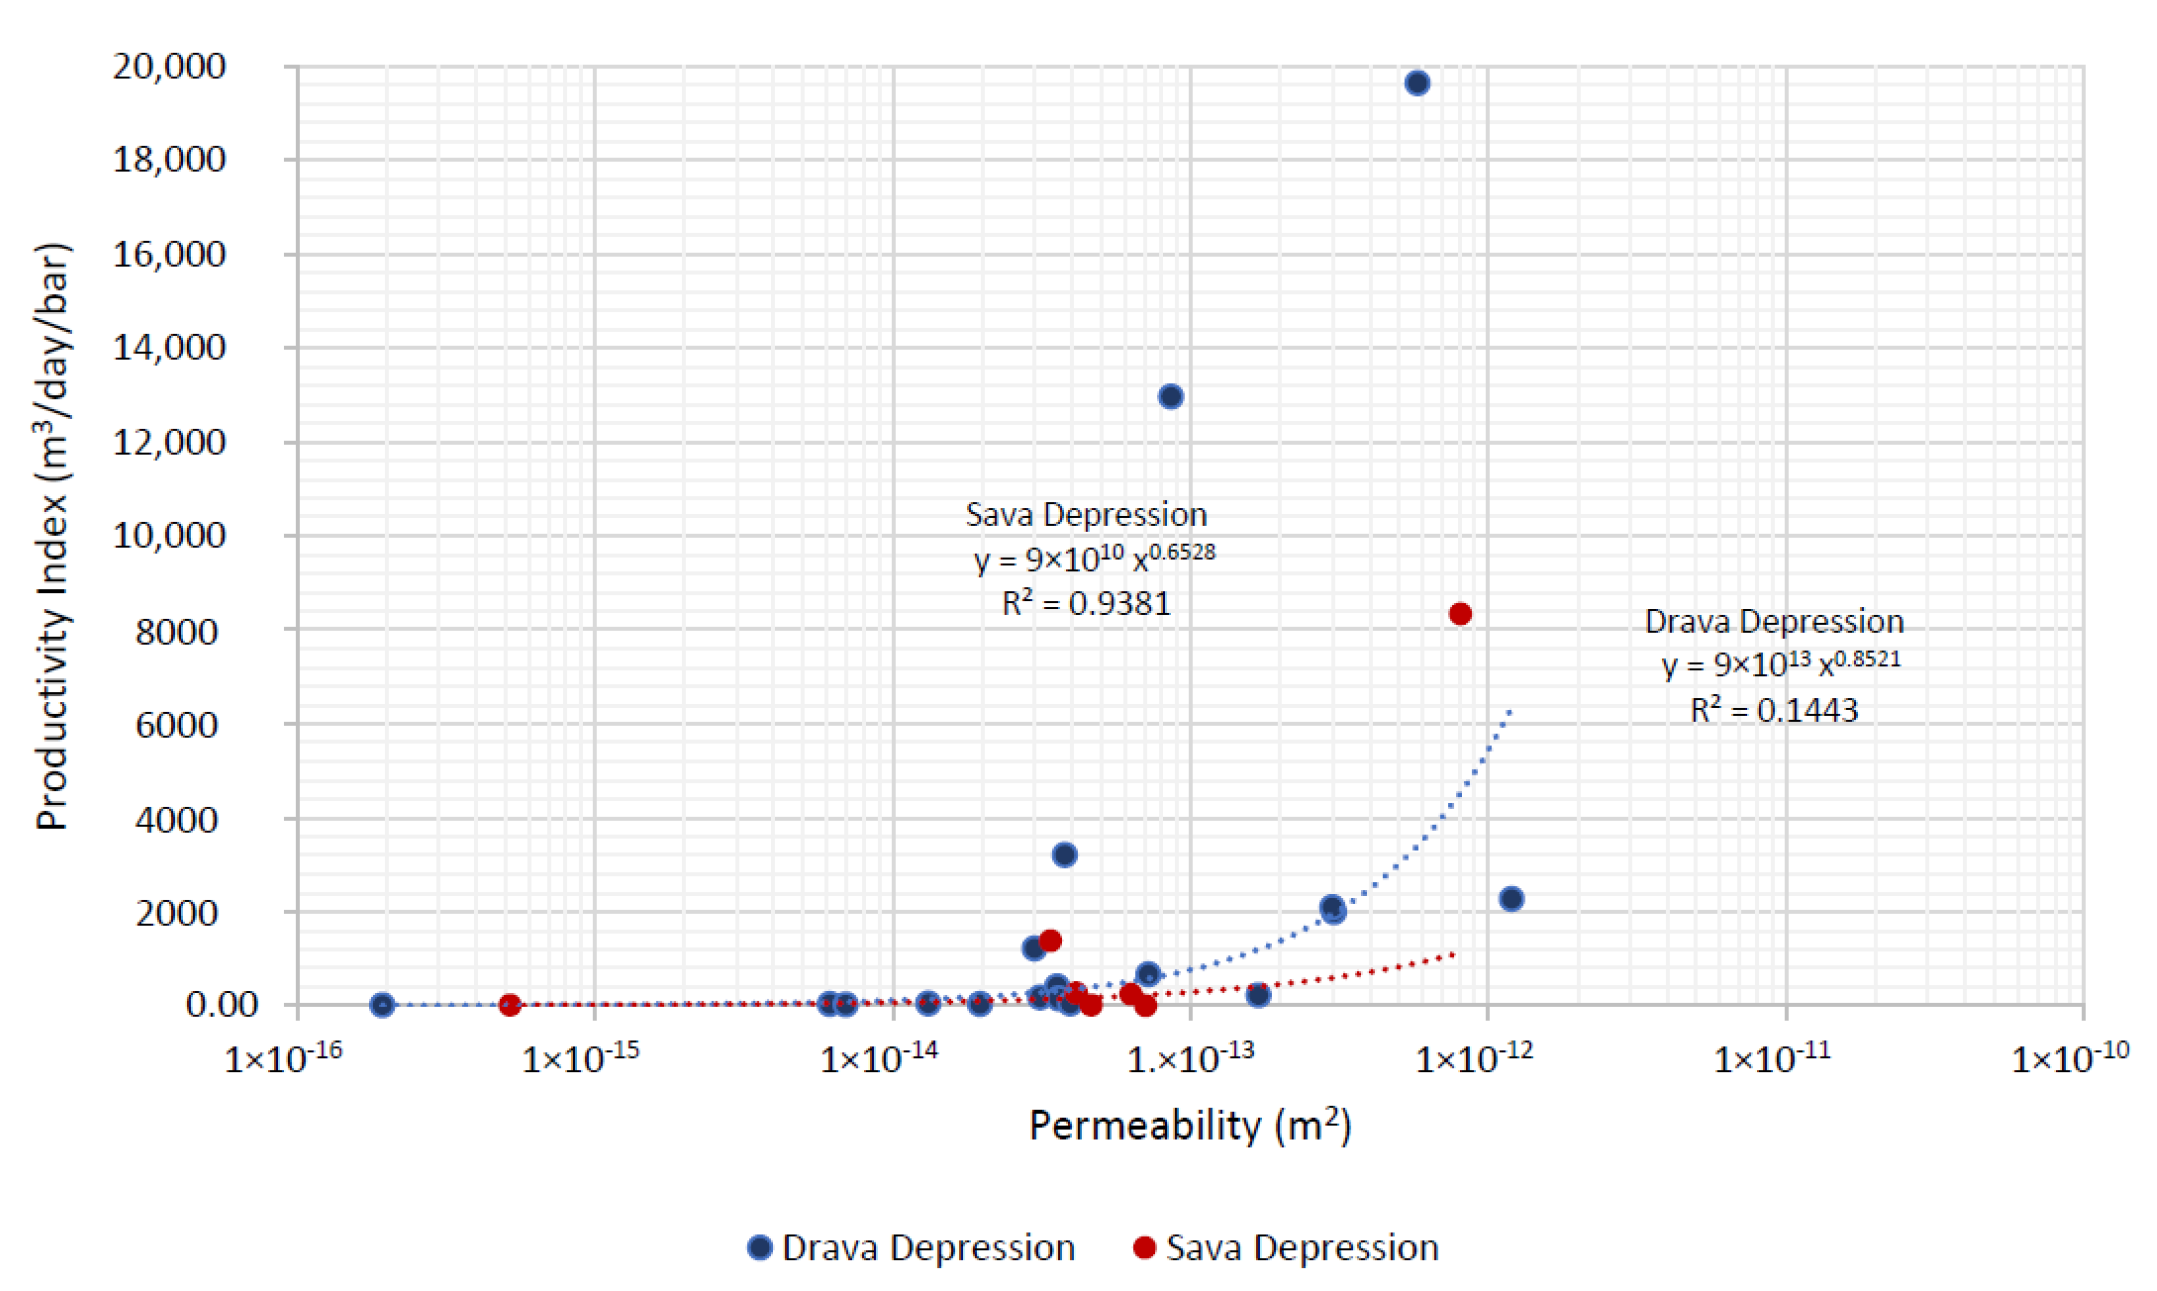
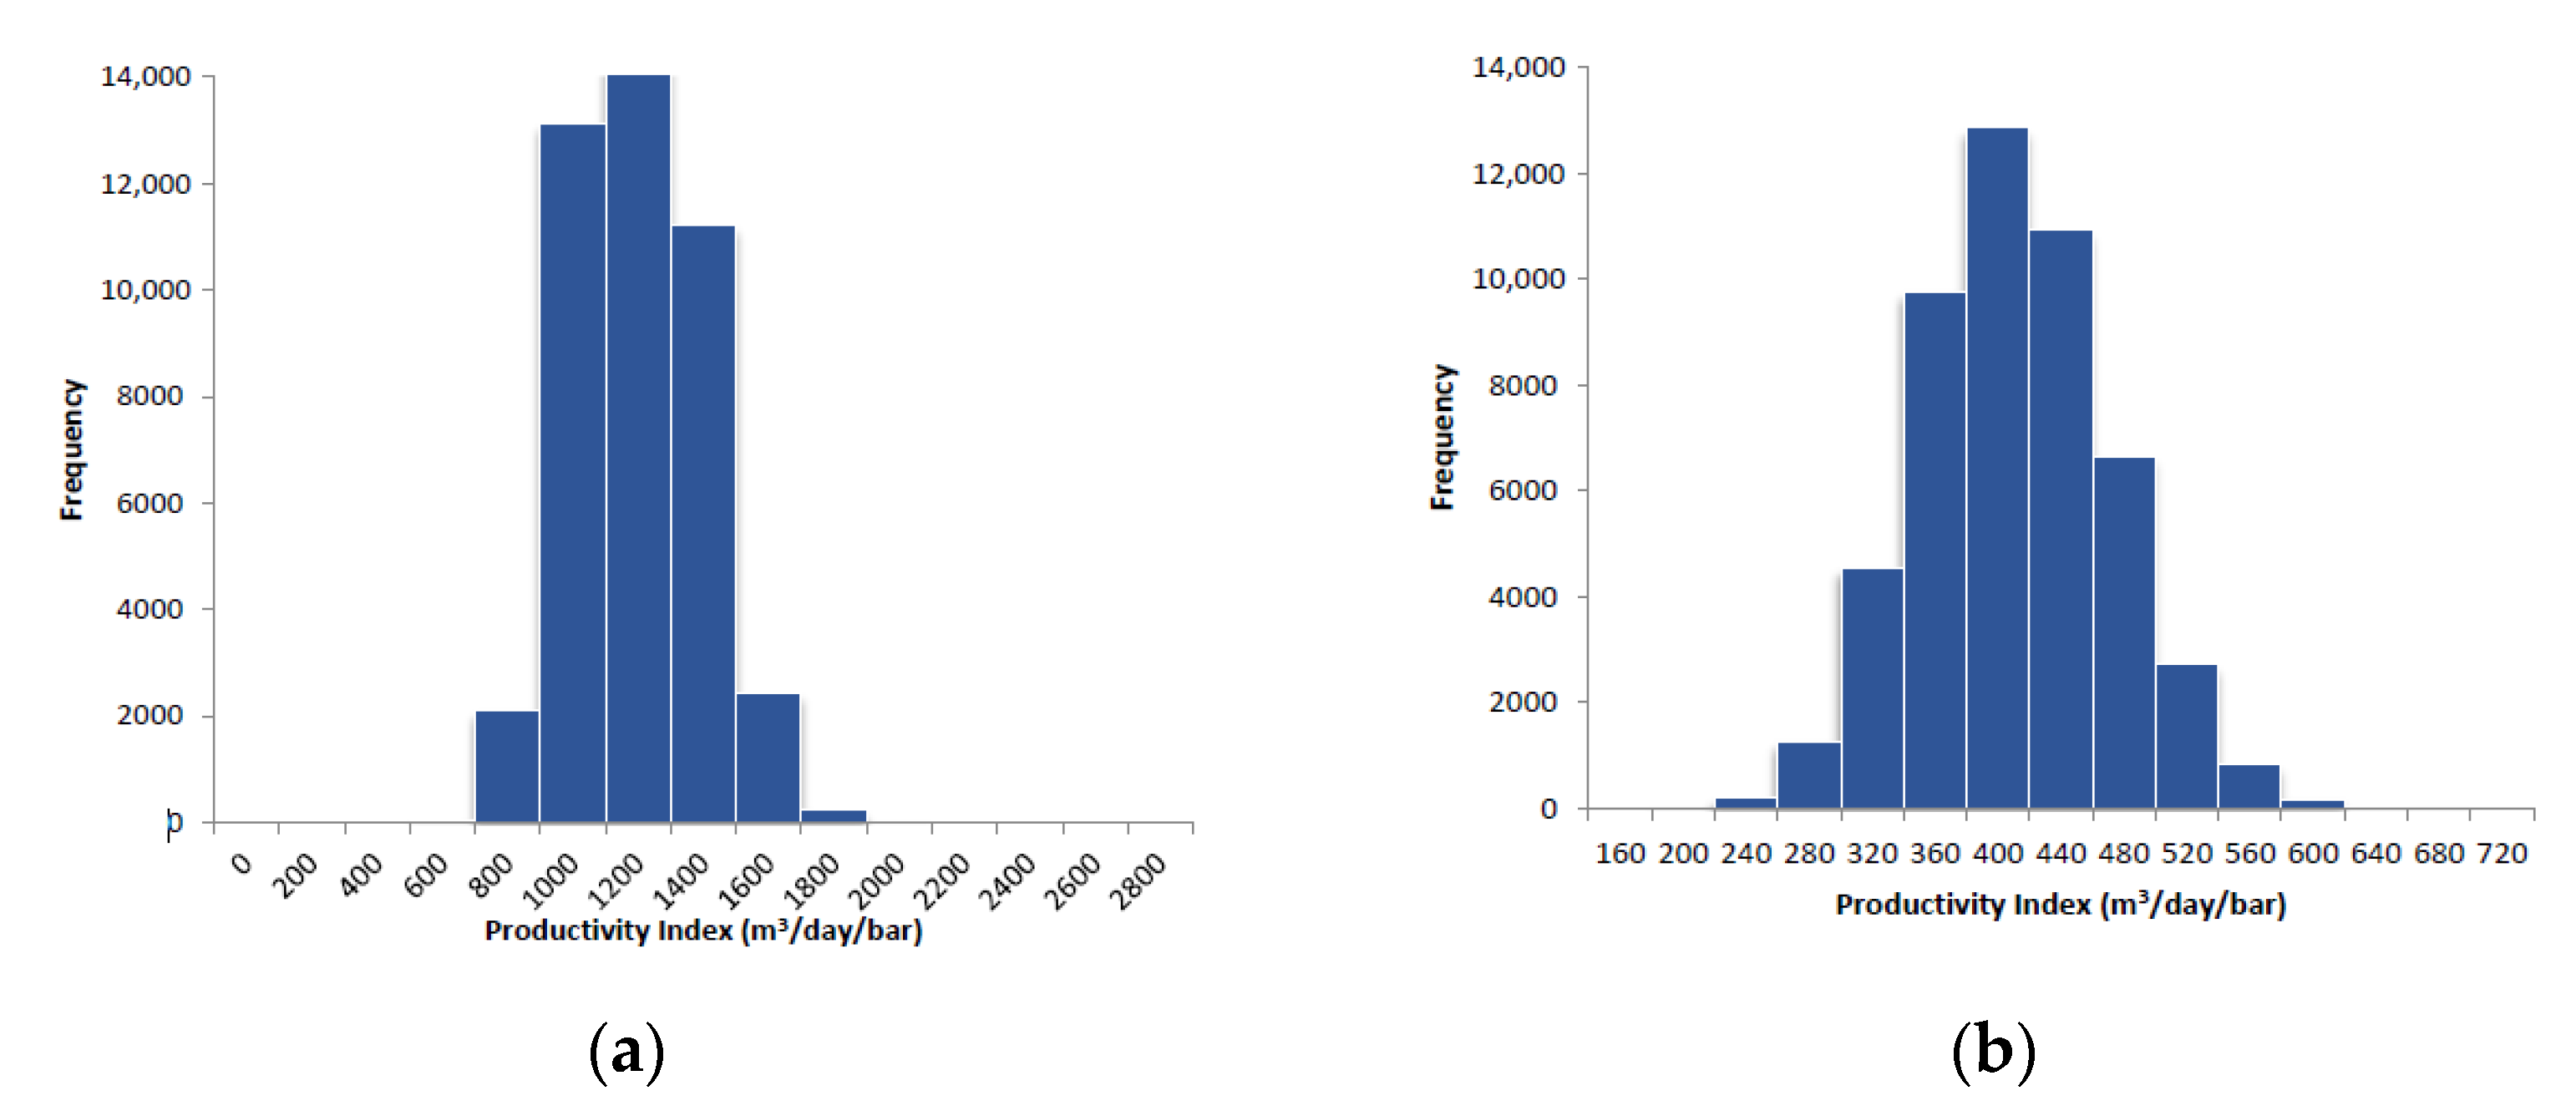
2.4. Productivity Index
3. Results and Discussion
- -
- The thickness of the reservoir corresponds to the thickness of the lithological unit.
- -
- The entire deposit participates in the assessment.
- -
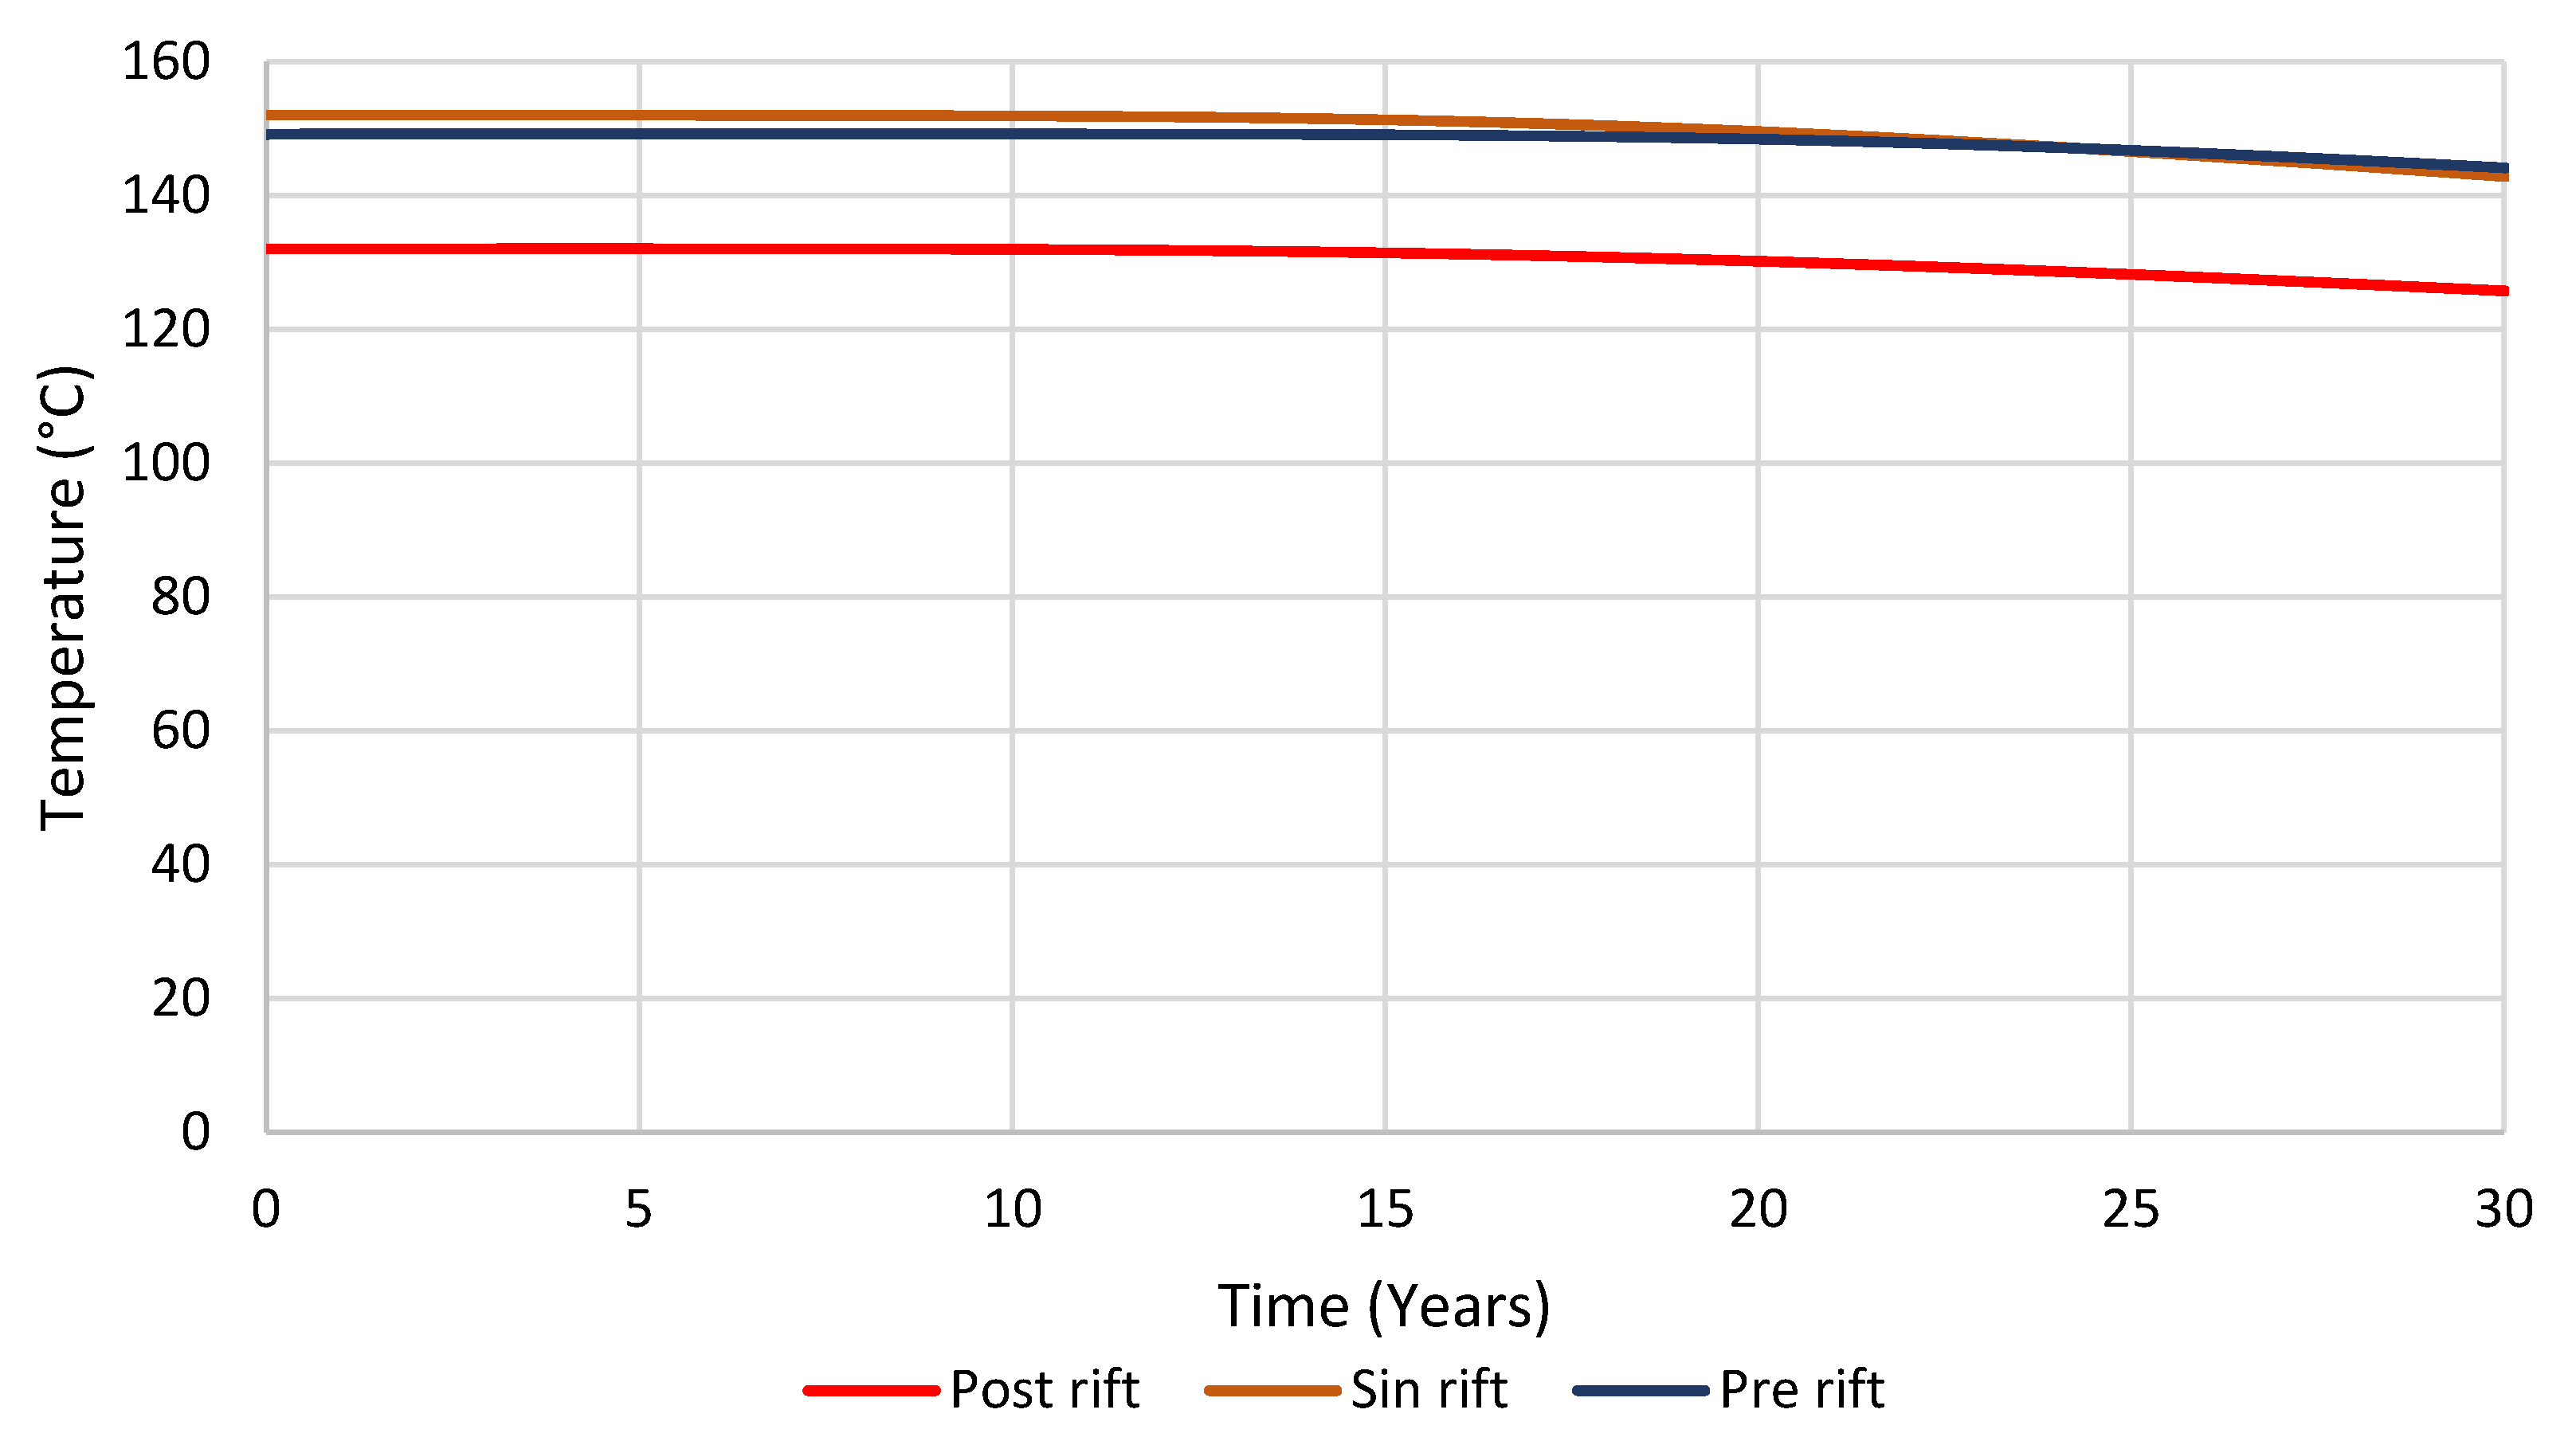
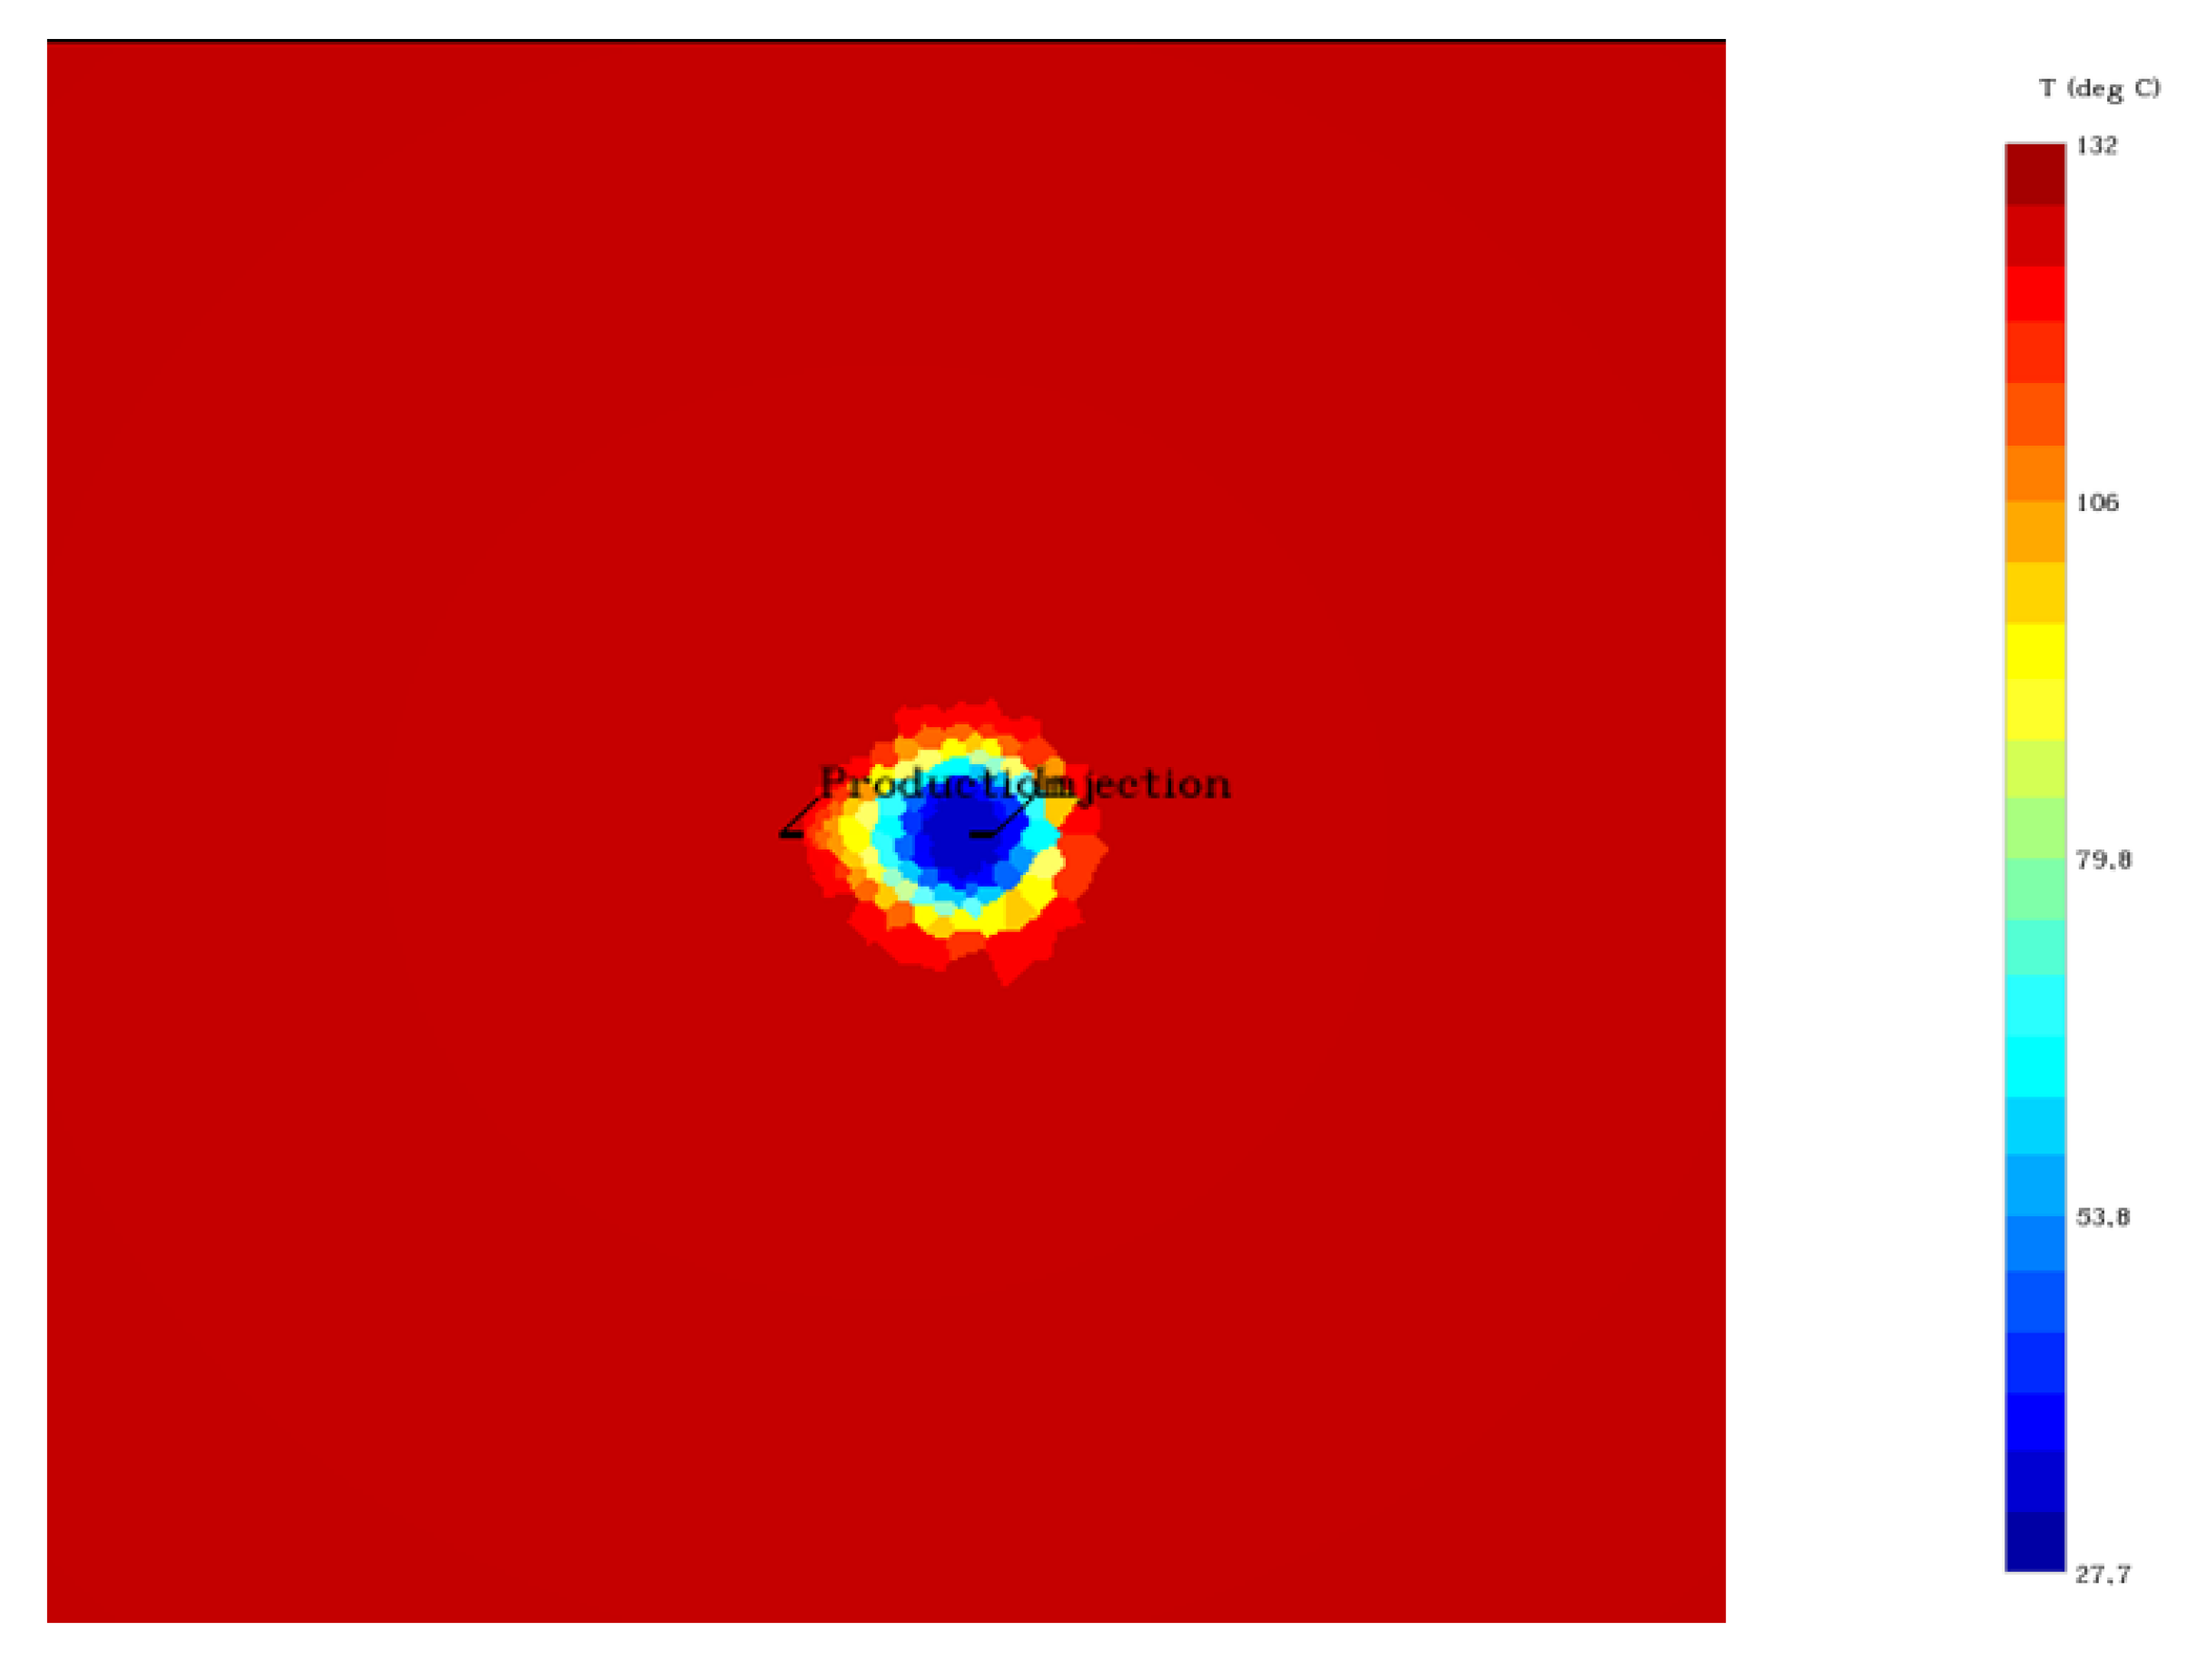
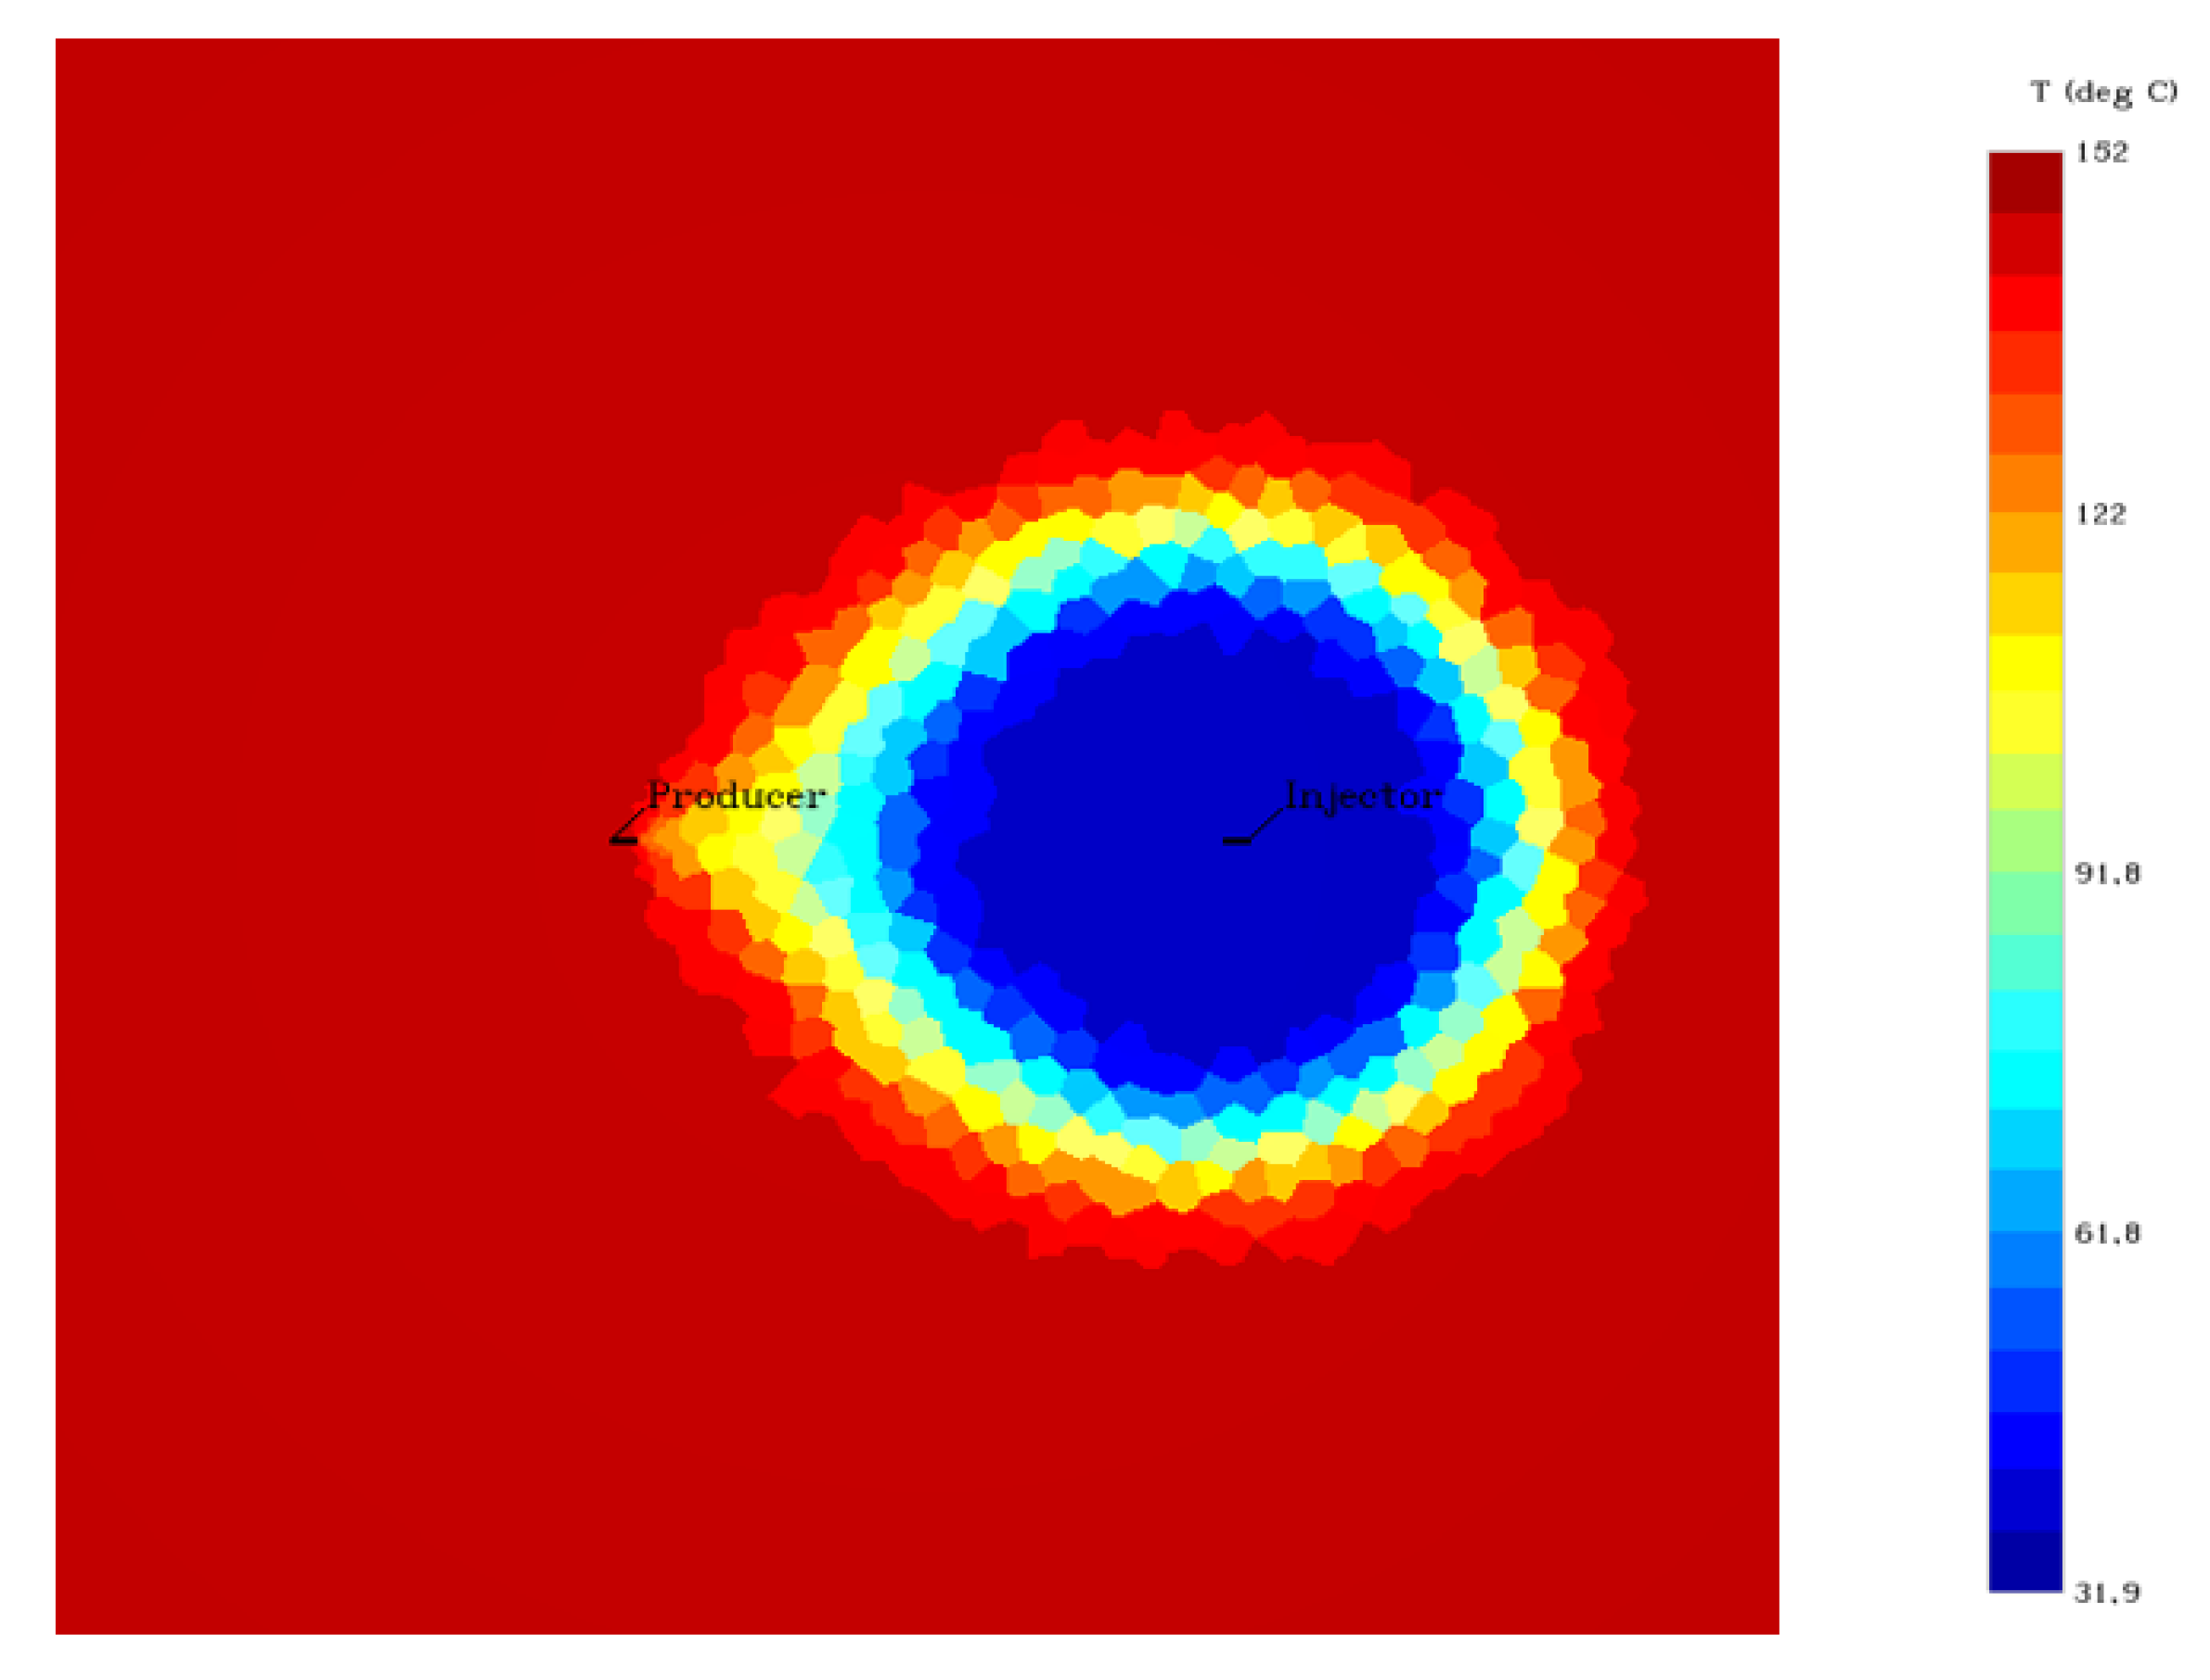
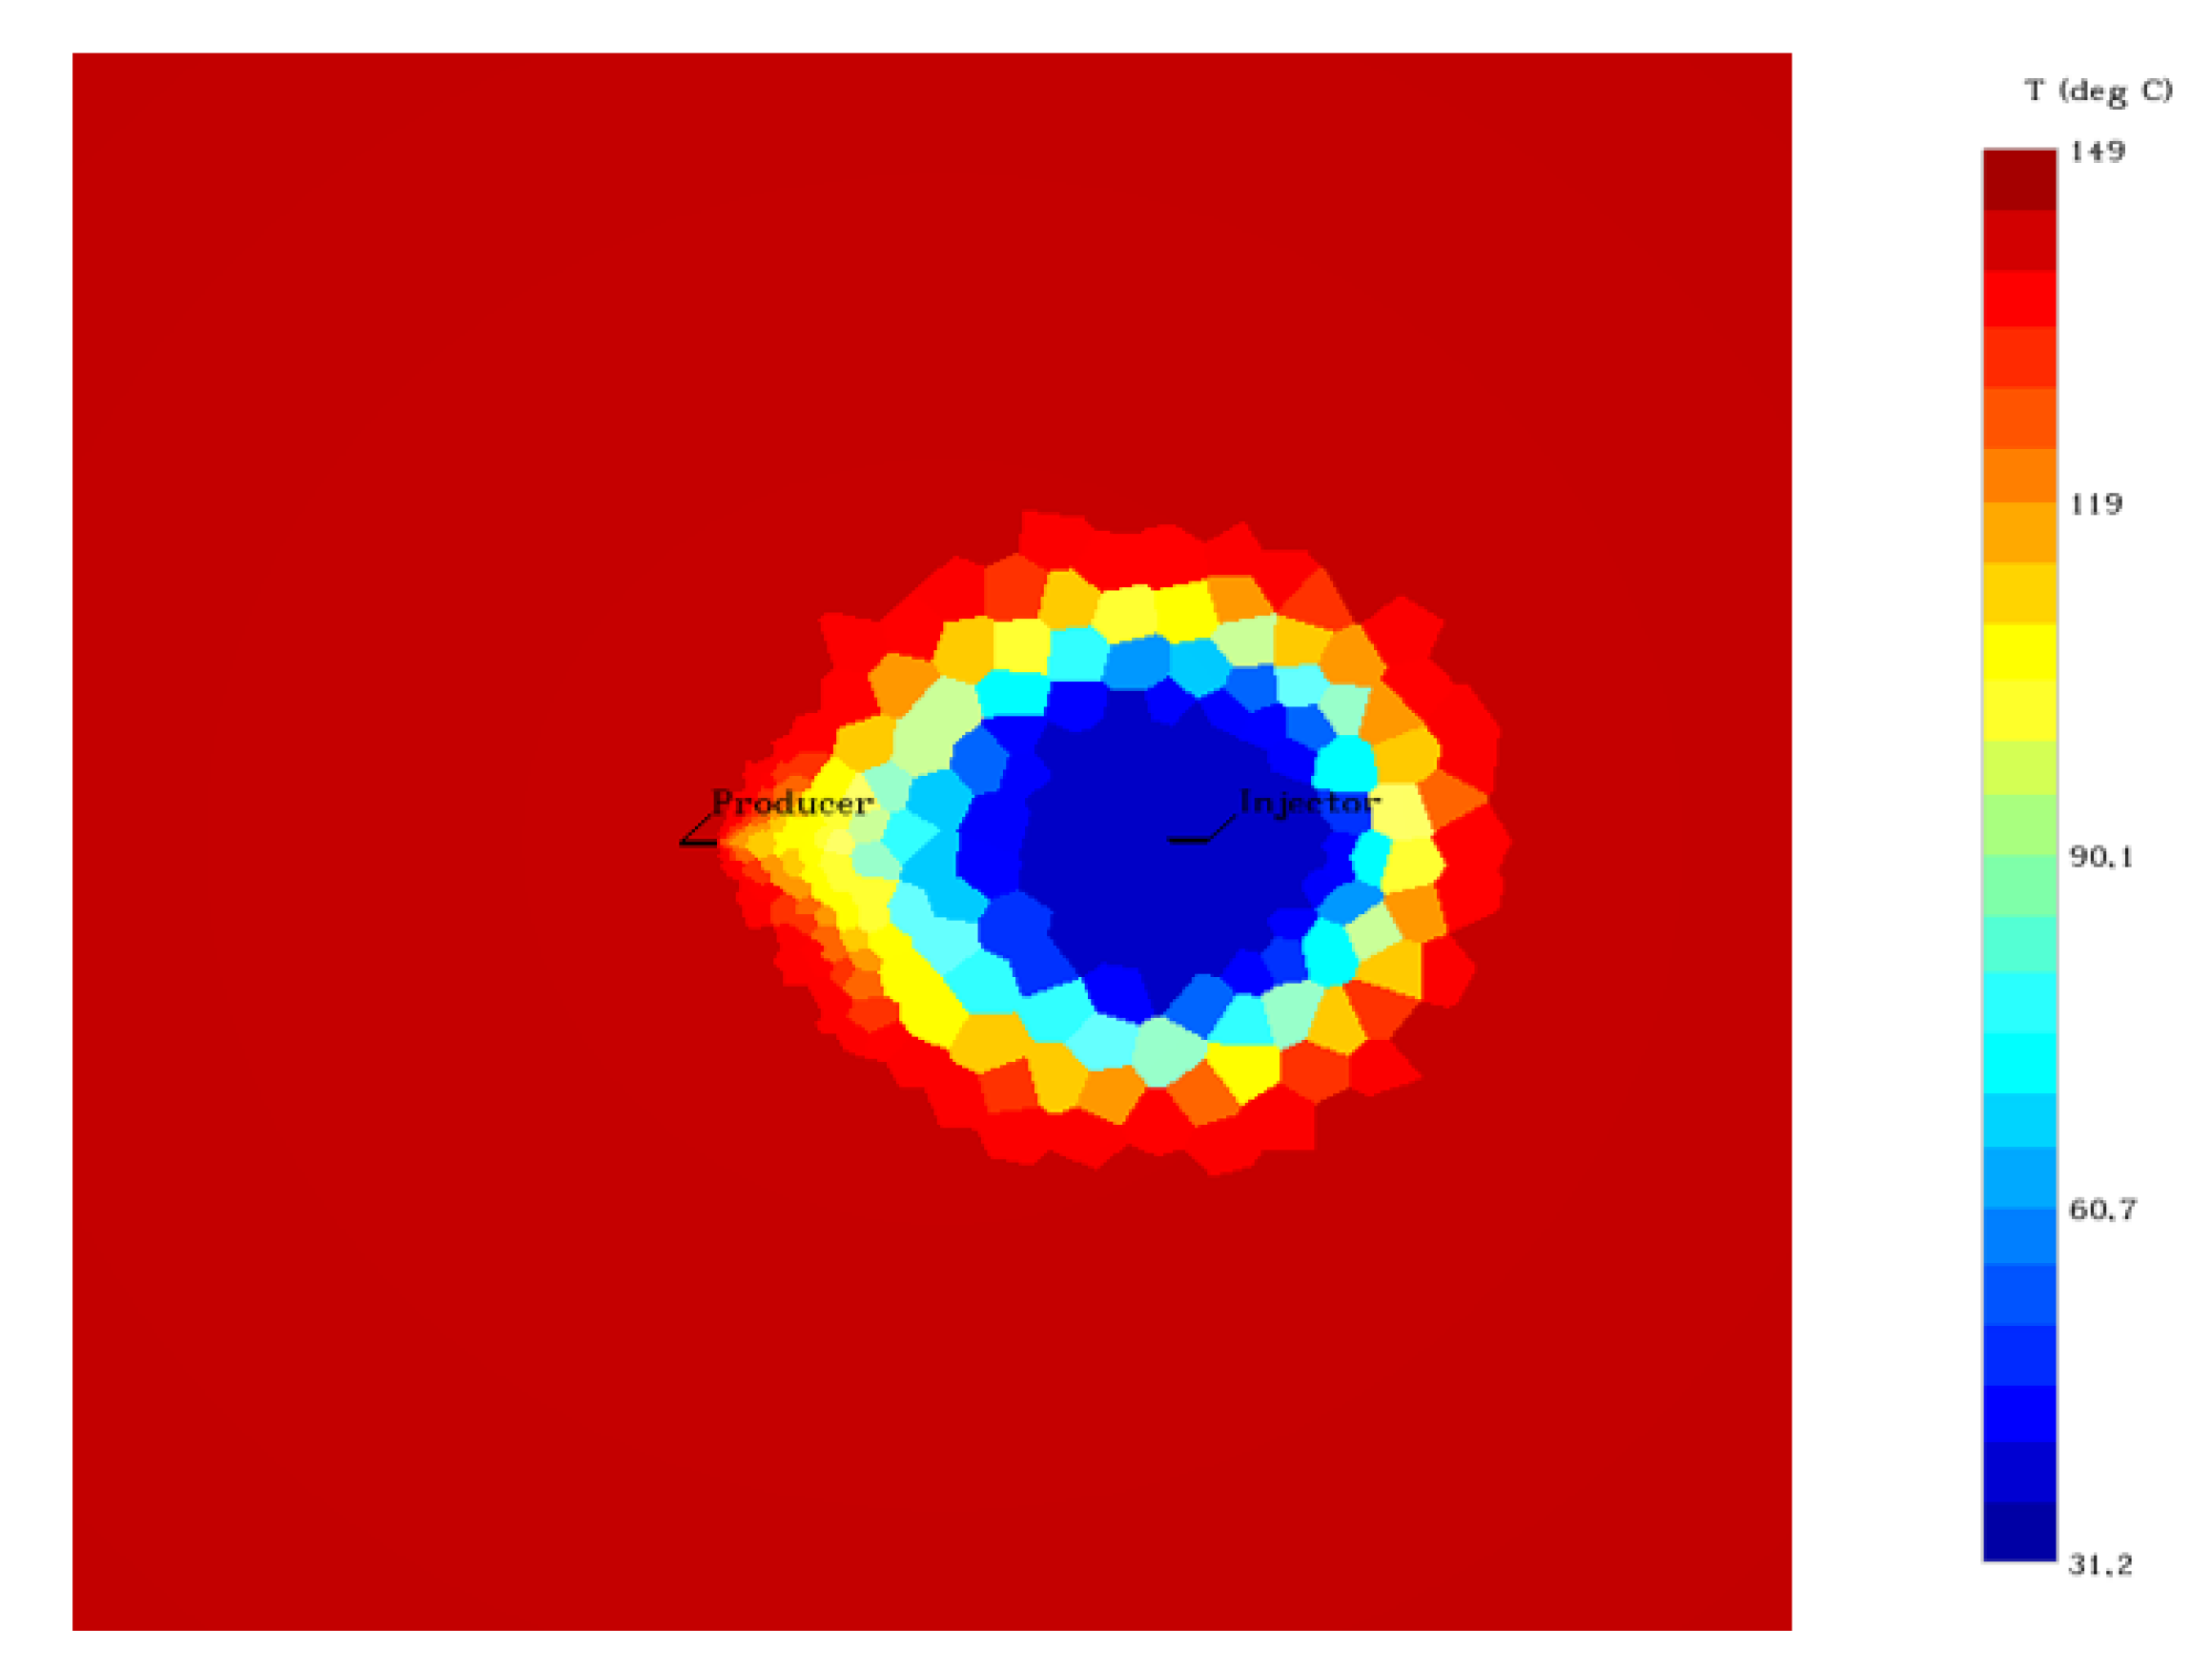
- There has been a constant temperature between the doublet wells over 30 years.
- -
- There is a pressure drop at the wellhead of 20 bar.
- -
- The system consists of a production well and an injection well.


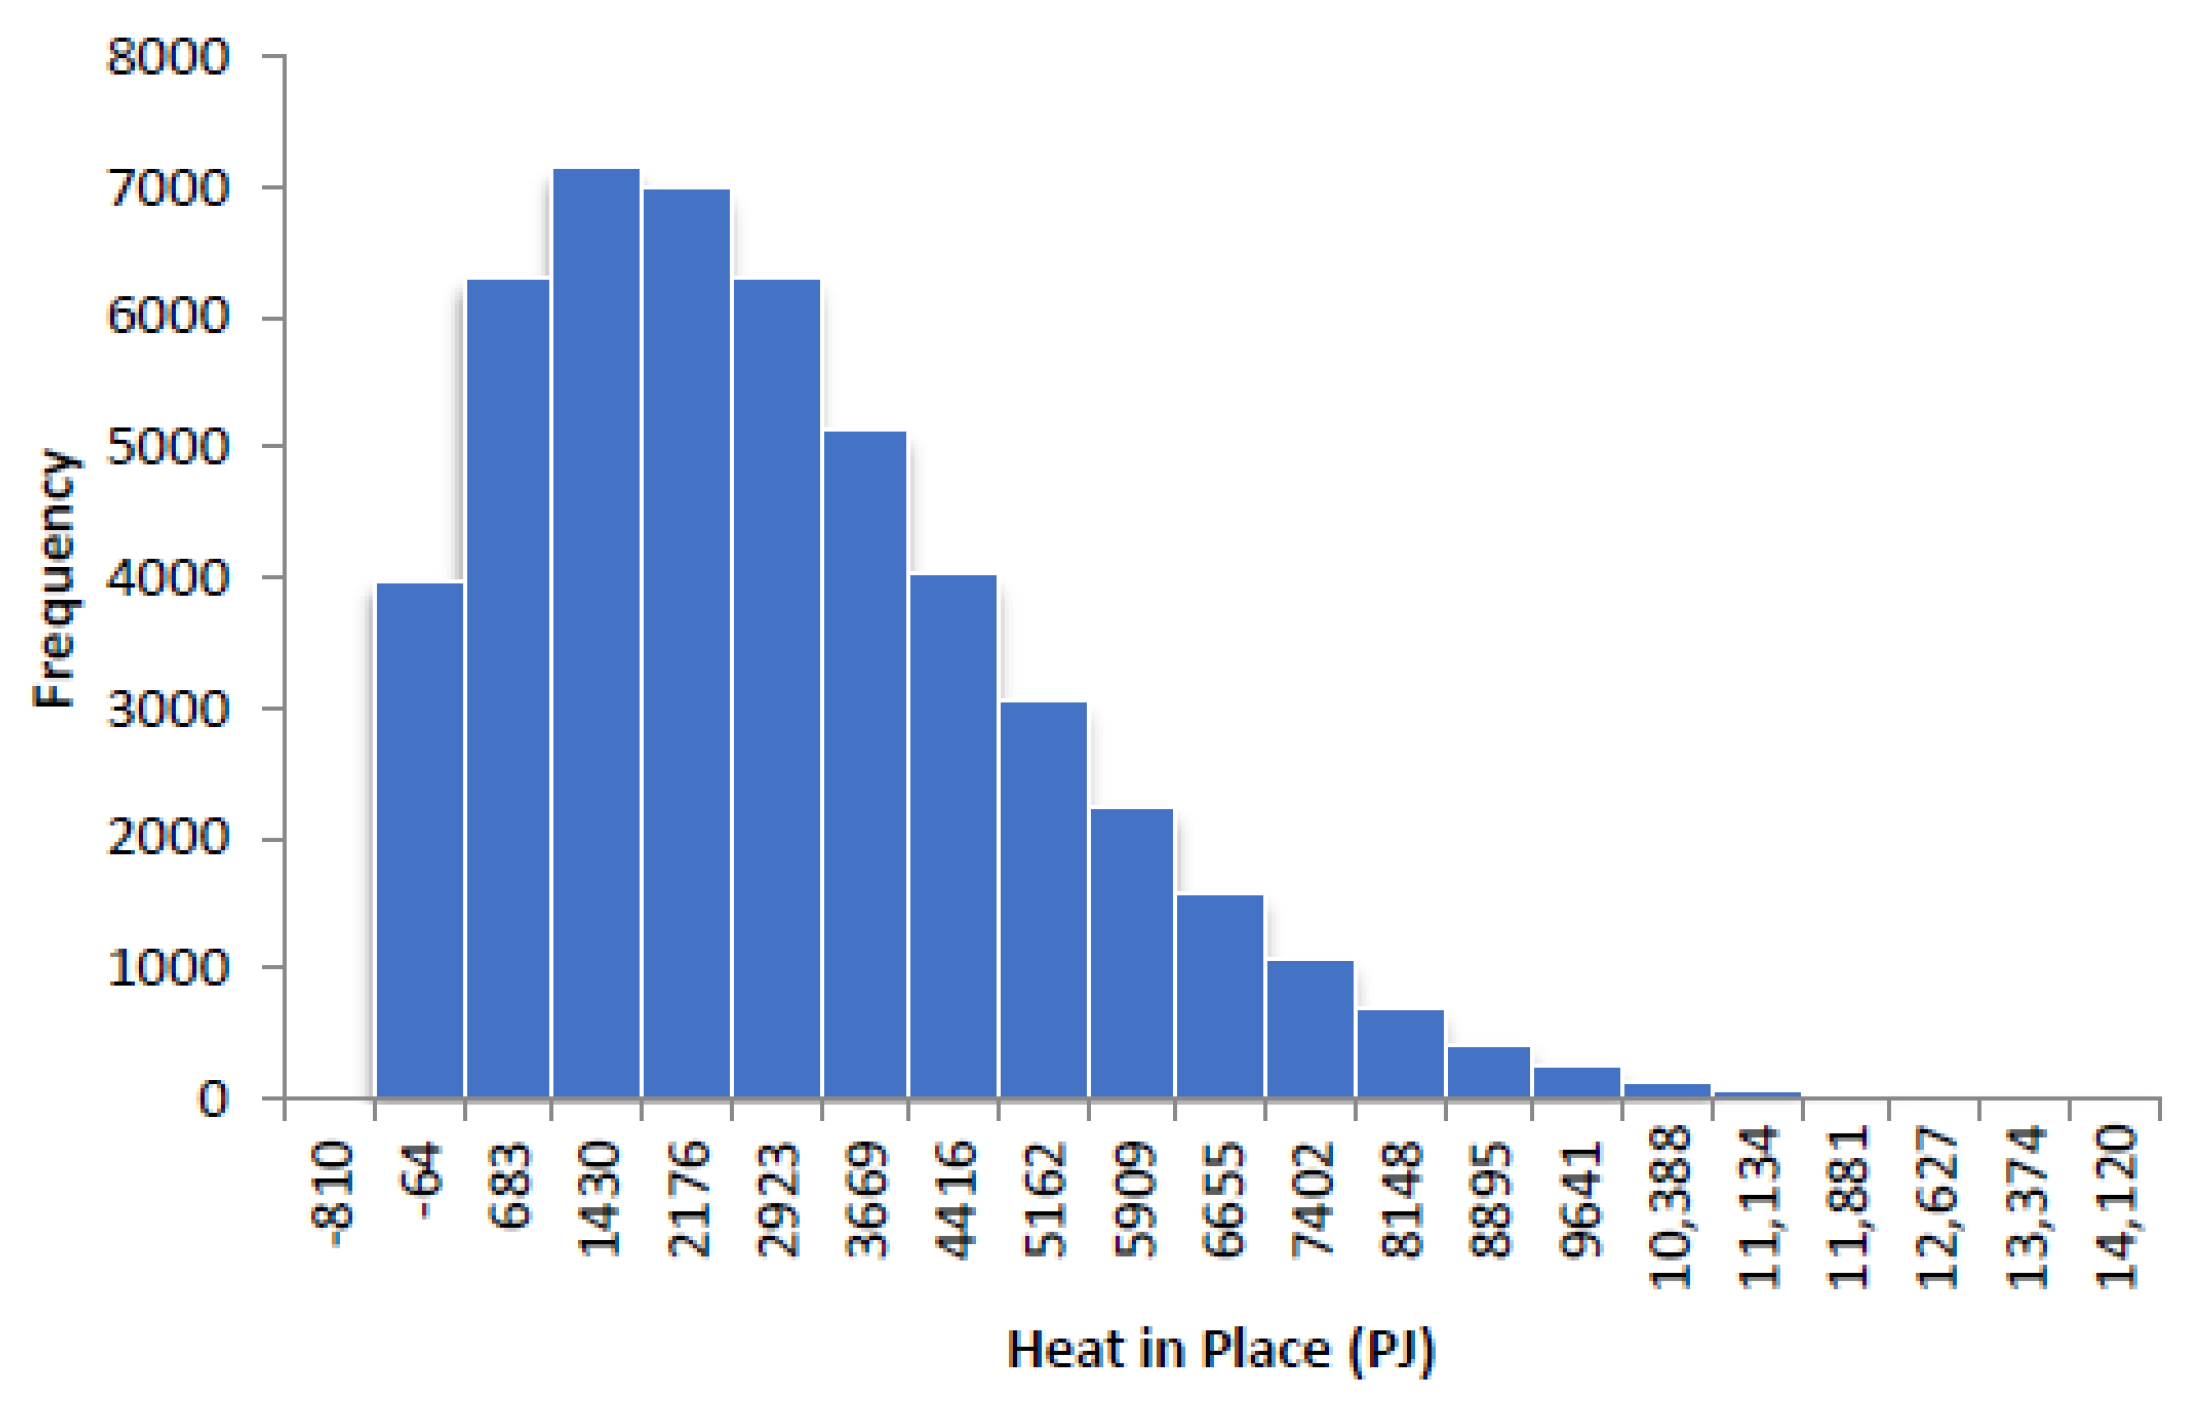
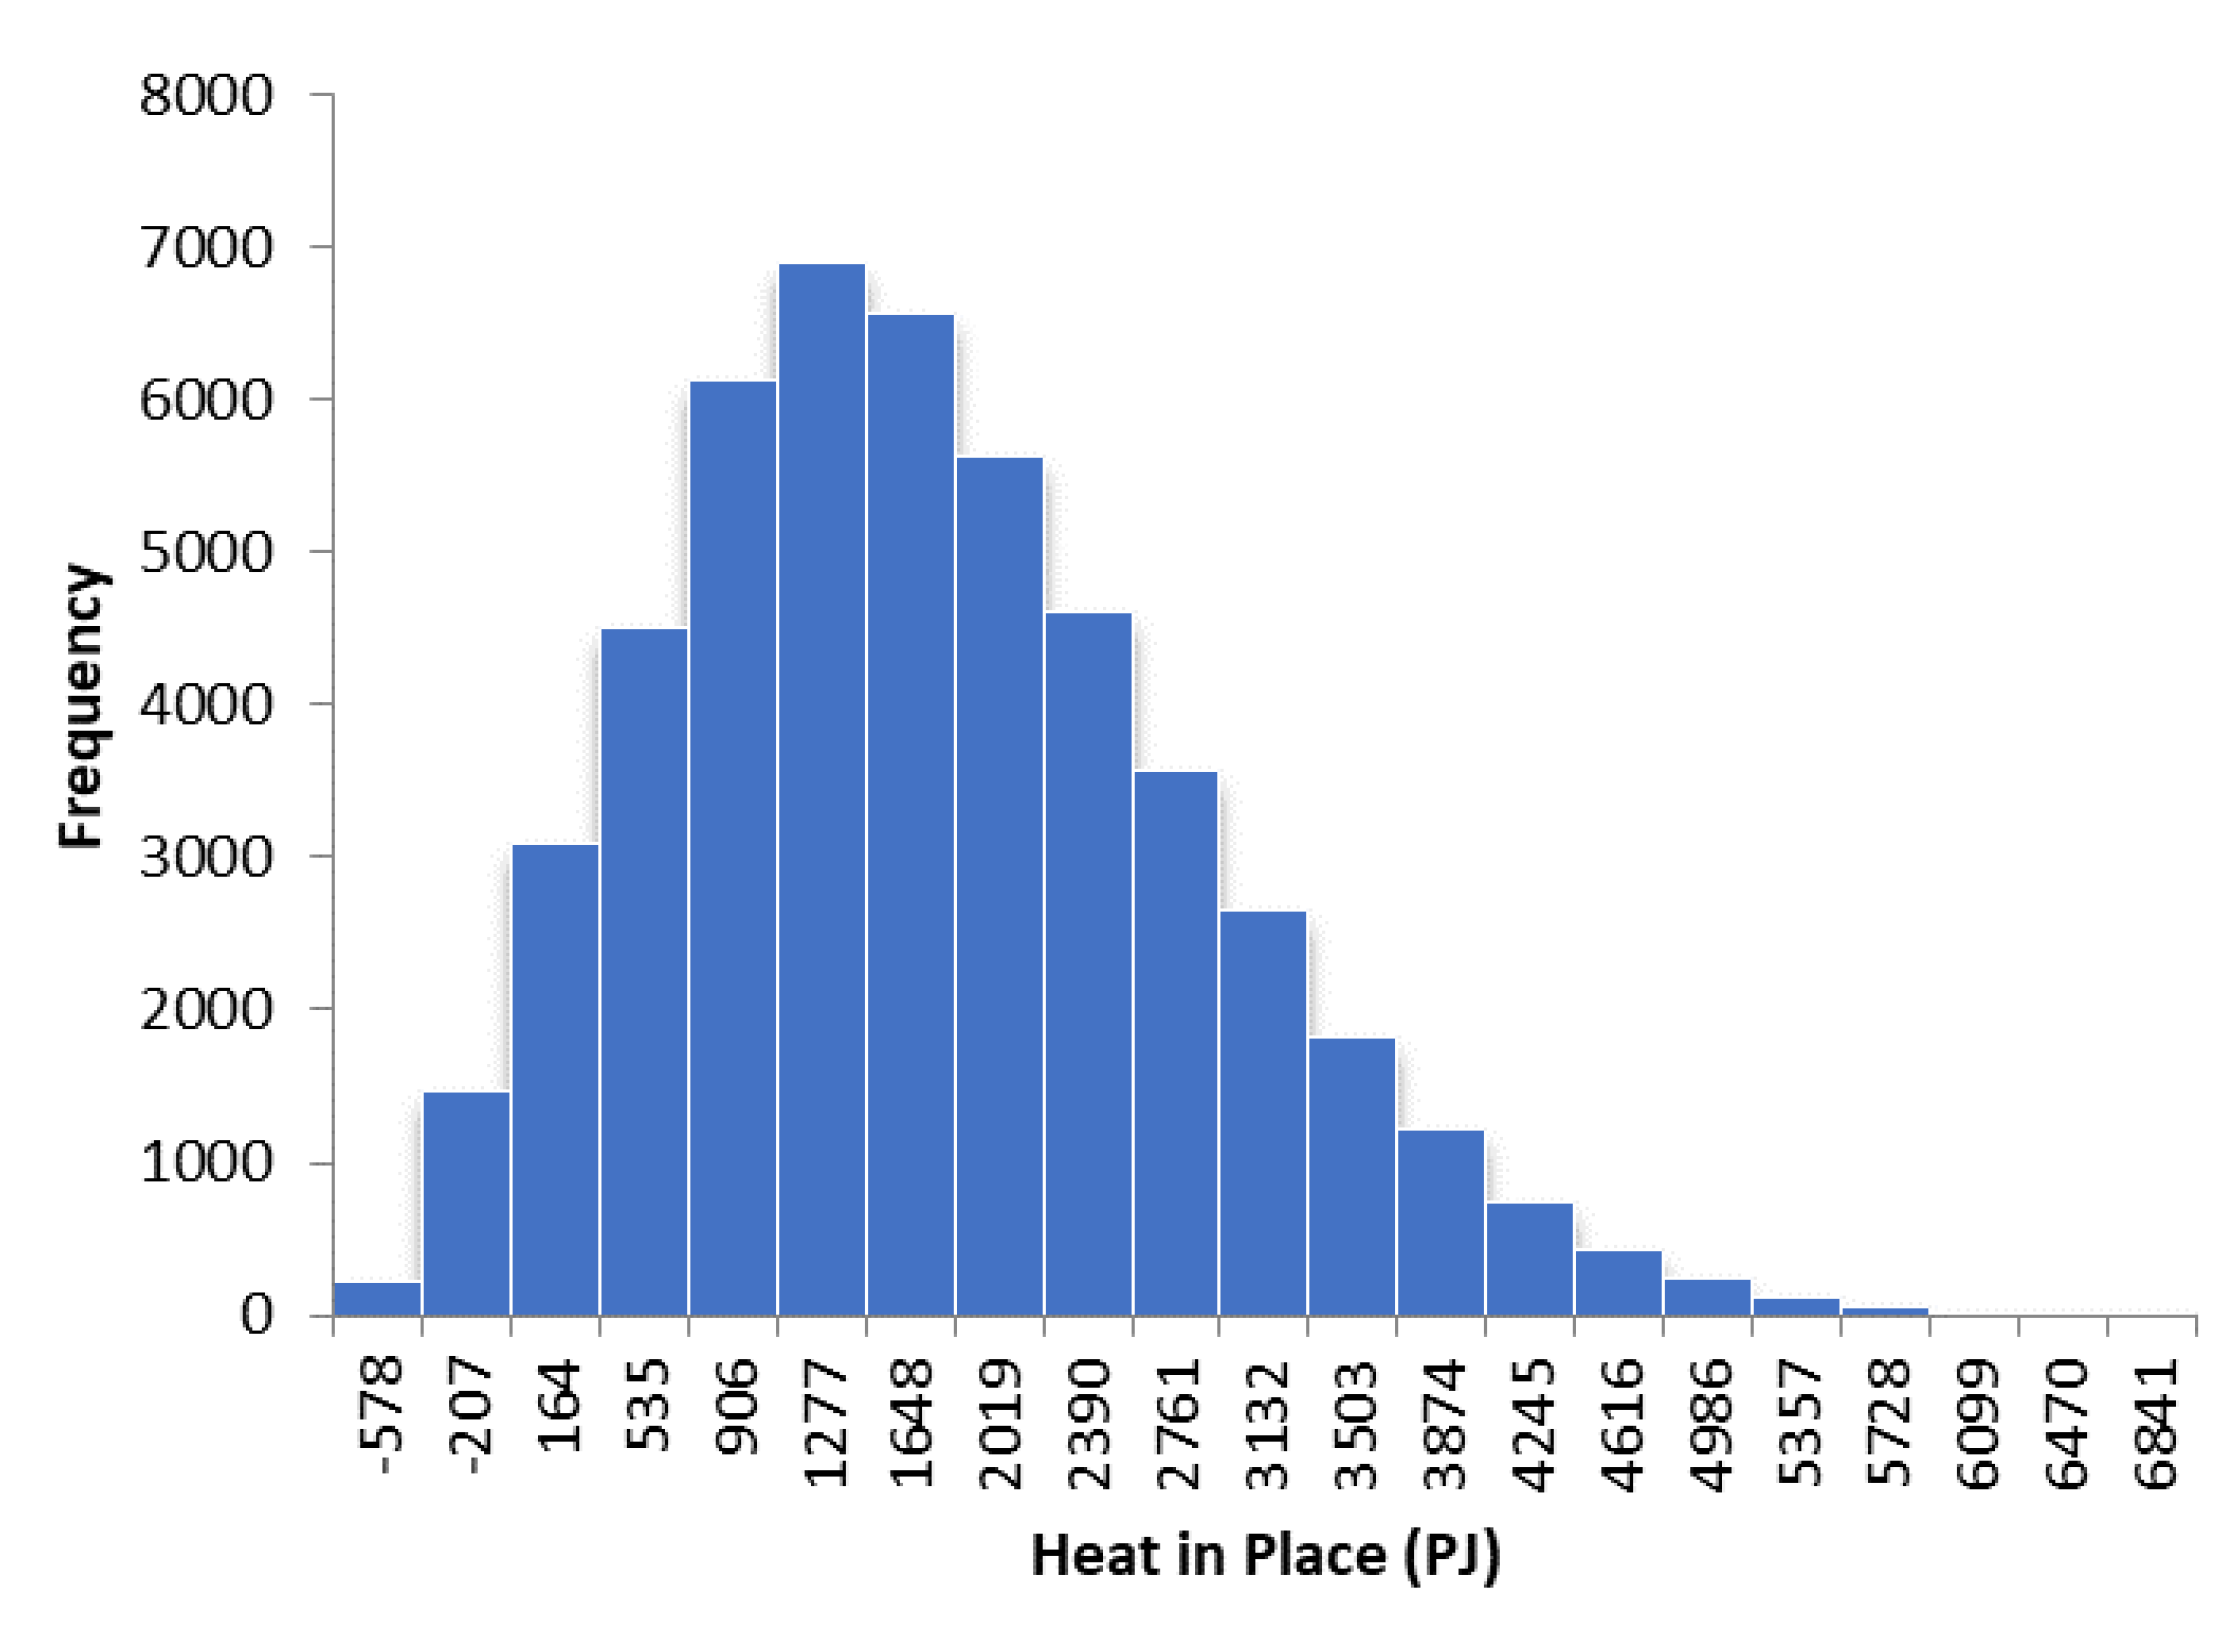
| Heat in Place-Analysed Well Doublets (J) | |||
|---|---|---|---|
| Mean | Minimum | Maximum | |
| Post-rift | 7.935 × 10¹⁷ | 3.620 × 10¹⁶ | 2.612 × 10¹⁸ |
| Syn-rift | 3.101 × 10¹⁸ | 1.158 × 10¹⁶ | 1.281 × 10¹⁹ |
| Pre-rift | 1.479 × 10¹⁸ | 9.655 × 10¹⁶ | 5.521 × 10¹⁸ |
| TOTAL | 5.373 × 10¹⁸ | 1.443 × 10¹⁷ | 2.094 × 10¹⁹ |
4. Conclusions
Author Contributions
Funding
Institutional Review Board Statement
Informed Consent Statement
Data Availability Statement
Conflicts of Interest
References
- European Commission. Green Plan. 2019. Available online: https://sustainabledevelopment.un.org/post2015/transformingourworld (accessed on 15 August 2022).
- European Commision. Recovery and Resiliance Facility. 2020. Available online: https://ec.europa.eu/info/business-economy-euro/recovery-coronavirus/recovery-and-resilience-facility_en#the-recovery-and-resilience-facility (accessed on 15 August 2022).
- Dekanić, I.; Kolundžić, S.; Daria, K. Stoljeće Nafte. In Veza Između Nafte, Novca i Noći Noja je Promijenila Svijet, 2nd ed.; Naklada Zadro: Zagreb, Croatia, 2003. [Google Scholar]
- Tuschl, M.; Kurevija, T.; Krpan, M.; Macenić, M. Overview of the current activities related to deep geothermal energy utilisation in the Republic of Croatia. Clean Technol. Environ. Policy 2022, 24, 3003–3031. [Google Scholar] [CrossRef]
- Jelić, K.; Ćubrić, S.; Pavičić, H.; Bošnjak, R. Geothermal Energy Potential and Utilization in the Republic of. World Geothermal Congress. In Proceedings of the World Geothermal Congress 2000, Tohoku, Japan, 28 May–10 June 2000; pp. 237–246. [Google Scholar]
- Jelić, K.; Kevrić, I.; Krasić, O. Temperatura i toplinski tok u tlu Hrvatske. In Proceedings of the 1. Croatian Geological Congress, Zagreb, Croatia, 18–21 October 1995; Croatian Geological Society. pp. 245–249. [Google Scholar]
- Jelić, K. Thermodynamic Characteristics of Sedimentary Complex of SW Part of Pannonian Basin (In Croatian: Termodinamičke Osobine Sedimentnog Kompleksa Jugozapadnog Dijela Panonskog Bazena). Ph.D. Thesis, University of Zagreb, Zagreb, Croatia, 1979. [Google Scholar]
- Macenić, M.; Kurevija, T.; Medved, I. Novel Geothermal Gradient map of the Croatian Part of the Pannonian Basin System Based on Data Interpretation from 154 Deep Exploration wells. Renew. Sustain. Energy Rev. 2020, 132, 110069. [Google Scholar] [CrossRef]
- Brobst, D.A.; Pratt, W.P. (Eds.) United States Mineral Resources; Geological Survey: Washington, DC, USA, 1973.
- Franco, A.; Donatini, F. Methods for the estimation of the energy stored in geothermal reservoirs. J. Physics: Conf. Ser. 2017, 796, 012025. [Google Scholar] [CrossRef] [Green Version]
- UNFC. United Nations Framework Classification for Fossil Energy and Mineral Reserves and Resources 2009. Economic Commission for Europe, ECE Energy Series No. 39, United Nations, New York and Geneva. 2010. Available online: https://unece.org/DAM/energy/se/pdfs/UNFC/unfc2009/UNFC2009_ES39_e.pdf (accessed on 1 September 2022).
- Rybach, L. Classification of Geothermal Resources by Potential. Geotherm. Energy Sci. 2015, 3, 13–17. [Google Scholar] [CrossRef] [Green Version]
- Muffler, L.J.P. Assesment of Geothermal Resources of the United States. Geol. Surv. Circ. 1978, 790, 163. [Google Scholar]
- Muffler, P.; Cataldi, R. Methods for regional assessment of geothermal resources. Geothermics 1978, 7, 53–89. [Google Scholar] [CrossRef] [Green Version]
- Limberger, J.; Boxem, T.; Pluymaekers, M.; Bruhn, D.; Manzella, A.; Calcagno, P.; Beekman, F.; Cloetingh, S.; van Wees, J.-D. Geothermal Energy in Deep Aquifers: A Global Assessment of the Resource Base for Direct Heat Utilization. Renew. Sustain. Energy Rev. 2018, 82, 961–975. [Google Scholar] [CrossRef]
- Kramers, L.; van Wees, J.-D.; Pluymaekers, M.; Kronimus, A.; Boxem, T. Direct Heat Resource Assessment and Subsurface Information Systems for Geothermal Aquifers; the Dutch Perspective. Neth. J. Geosci. 2012, 91, 637–649. [Google Scholar] [CrossRef] [Green Version]
- van Wees, J.-D.; Kronimus, A.; van Putten, M.P.D.; Pluymaekers, M.; Mijnlieff, H.; van Hooff, P.; Obdam, A.; Kramers, L. Geothermal Aquifer Performance Assessment for Direct Heat Production—Methodology and Application to Rotliegend Aquifers. Neth. J. Geosci. 2012, 91, 651–665. [Google Scholar] [CrossRef] [Green Version]
- Garg, S.K.; Jim, C. Appropriate Use of USGS Volumetric Heat in Place Method and Monte Carlo Calculations. In Proceedings of the Thirty-Fourth Workshop on Geothermal Reservoir Engineering, Stanford University, Stanford, CA, USA, 1–3 February 2010; Available online: https://pangea.stanford.edu/ERE/pdf/IGAstandard/SGW/2010/garg.pdf (accessed on 1 August 2022).
- Garg, S.K.; Combs, J. A reformulation of USGS Volumetric “Heat in Place” Resource Estimation Method. Geothermics 2015, 55, 150–158. [Google Scholar] [CrossRef]
- Takahashi, S.; Yoshida, S. Improvement of Calculating Formulas for Volumetric Resource Assessment. Geothermics 2016, 64, 187–195. [Google Scholar] [CrossRef]
- Shinya, T.; Yoshida, S. A Desktop Review of Calculation Equations for Geothermal Volumetric Assessment. In Proceedings of the 43rd Workshop on Geothermal Reservoir Engineering, Stanford University, Stanford, CA, USA, 12–14 February 2018; pp. 1–18. [Google Scholar]
- Williams, C.F.; Reed, M.J.; Robert, H.M. A Review of Methods Applied by the U.S. Geological Survey in the Assessment of Identified Geothermal Resources. In Open-File Report 2008–1296; U.S. Geological Survey: Reston, VA, USA, 2008; 30p. [Google Scholar]
- Kalos, M.H.; Paula, A. Whitlock. In Monte Carlo Methods, 2nd ed.; Wiley-Blackwell: Hoboken, NJ, USA, 2008. [Google Scholar]
- Franco, A.; Vaccaro, M. Sustainable Sizing of Geothermal Power Plants: Appropriate Potential Assessment Methods. Sustainability 2020, 12, 3844. [Google Scholar] [CrossRef]
- González-García, H.; Francke, H.; Sass, I.; Huenges, E. Production Forecast and Estimation of the Recovery Factor of the Los Humeros Geothermal Field, Mexico. Geotherm. Energy 2021, 9, 13. [Google Scholar] [CrossRef]
- Kahrobaei, S.; Fonseca, R.M.; Willems, C.J.L.; Wilschut, F.; van Wees, J.D. Regional Scale Geothermal Field Development Optimization under Geological Uncertainties. In Proceedings of the European Geothermal Conference 2019, Den Haag, The Netherlands, 11–14 June 2019. [Google Scholar]
- Nádor, A.; Sebess-Zilahi, L.; Rotár-Szalkai, Á.; Gulyás, Á.; Markovic, T. New Methods of Geothermal Potential Assessment in the Pannonian Basin. Neth. J. Geosci. 2019, 98, e10. [Google Scholar] [CrossRef] [Green Version]
- Shah, M.; Vaidya, D.; Sircar, A. Using Monte Carlo Simulation to Estimate Geothermal Resource in Dholera Geothermal Field, Gujarat, India. Multiscale Multidiscip. Model. Exp. Des. 2018, 1, 83–95. [Google Scholar] [CrossRef]
- Aravena, D.; Muñoz, M.; Morata, D.; Lahsen, A.; Parada, M.; Dobson, P. Assessment of High Enthalpy Geothermal Resources and Promising Areas of Chile. Geothermics 2016, 59, 1–13. [Google Scholar] [CrossRef] [Green Version]
- Athens, N.D.; Caers, J.K. A Monte Carlo-Based Framework for Assessing the Value of Information and Development Risk in Geothermal Exploration. Appl. Energy 2019, 256, 113932. [Google Scholar] [CrossRef]
- Iglesias, E.R.; Torres, R.J. Low- to Medium-Temperature Geothermal Reserves in Mexico: A First Assessment. Geothermics 2003, 32, 711–719. [Google Scholar] [CrossRef]
- Miranda, M.M.; Raymond, J.; Dezayes, C. Uncertainty and Risk Evaluation of Deep Geothermal Energy Source for Heat Production and Electricity Generation in Remote Northern Regions. Energies 2020, 13, 4221. [Google Scholar] [CrossRef]
- Agemar, T.; Weber, J.; Moeck, I.S. Assessment and Public Reporting of Geothermal Resources in Germany: Review and Outlook. Energies 2018, 11, 332. [Google Scholar] [CrossRef] [Green Version]
- Eyerer, S.; Schifflechner, C.; Hofbauer, S.; Bauer, W.; Wieland, C.; Spliethoff, H. Combined Heat and Power from Hydrothermal Geothermal Resources in Germany: An Assessment of the Potential. Renew. Sustain. Energy Rev. 2020, 120, 109661. [Google Scholar] [CrossRef]
- Zhang, L.; Gao, C.; Ji, B.; Zhang, R.; Niu, J. A Simplified Assessment Method for Estimating Recoverable Geothermal Resources. Geothermics 2019, 79, 145–151. [Google Scholar] [CrossRef]
- Gringarten, A.C.; Sauty, J.P. A Theoretical Study of Heat Extraction from Aquifers with Uniform Regional Flow. J. Geophys. Res. Atmos. 1975, 80, 4956–4962. [Google Scholar] [CrossRef]
- Gringarten, A.C. Reservoir Lifetime and Heat Recovery Factor in Geothermal Aquifers Used for Urban Heating. Pure Appl. Geophys. PAGEOPH 1978, 117, 297–308. [Google Scholar] [CrossRef]
- Augustine, C. Analysis of Sedimentary Geothermal Systems Using an Analytical Reservoir Model. Trans. Geotherm. Resour. Counc. 2014, 38, 641–647. [Google Scholar]
- Li, T.; Shiozawa, S.; McClure, M.W. Thermal Breakthrough Calculations to Optimize Design of a Multiple-Stage Enhanced Geothermal System. Geothermics 2016, 64, 455–465. [Google Scholar] [CrossRef] [Green Version]
- Chen, S.-Y.; Hsieh, B.-Z.; Hsu, K.-C.; Chang, Y.-F.; Liu, J.-W.; Fan, K.-C.; Chiang, L.-W.; Han, Y.-L. Well spacing of the doublet at the Huangtsuishan geothermal site, Taiwan. Geothermics 2020, 89, 101968. [Google Scholar] [CrossRef]
- Kamila, Z.; Kaya, E.; Zarrouk, S.J. Reinjection in Geothermal Fields: An Updated Worldwide Review 2020. Geothermics 2020, 89, 101970. [Google Scholar] [CrossRef]
- Patterson, J.R.; Cardiff, M.; Feigl, K.L. Optimizing Geothermal Production in Fractured Rock Reservoirs under Uncertainty. Geothermics 2020, 88, 101906. [Google Scholar] [CrossRef]
- Willems, C.; Nick, H.; Goense, T.; Bruhn, D. The Impact of Reduction of Doublet Well Spacing on the Net Present Value and the Life Time of Fluvial Hot Sedimentary Aquifer Doublets. Geothermics 2017, 68, 54–66. [Google Scholar] [CrossRef] [Green Version]
- Royden, L.; Horváth, F.; Rumpler, J. Evolution of the Pannonian Basin System: 1. Tectonics. Tectonics 1983, 2, 63–90. [Google Scholar] [CrossRef]
- Velić, J.; Malvić, T.; Cvetković, M.; Vrbanac, B. Reservoir Geology, Hydrocarbon Reserves and Production in the Croatian part of the Pannonian Basin. Geol. Croat. 2012, 65, 91–101. [Google Scholar] [CrossRef]
- Ferenc, H.; Royden, L. Mechanism for Formation of the Intra-Carpathian Basins: A Review. Earth Evol. Sci. 1981, 3, 307–316. [Google Scholar]
- Lučić, D.; Saftić, B.; Krizmanić, K.; Prelogović, E.; Britvić, V.; Mesić, I.; Tadej, J. The Neogene Evolution and Hydrocarbon Potential of the Pannonian Basin in Croatia. Mar. Pet. Geol. 2001, 18, 133–147. [Google Scholar] [CrossRef]
- Pavelić, D. Tectonostratigraphic Model for the North Croatian and North Bosnian Sector of the Miocene Pannonian Basin System. Basin Res. 2001, 13, 359–376. [Google Scholar] [CrossRef]
- Tari, G.C. Alpine Tectonics of the Pannonian Basin; Rice University: Houston, TX, USA, 1994. [Google Scholar]
- Tari, V.; Pamić, J. Geodynamic Evolution of the Northern Dinarides and the Southern Part of the Pannonian Basin. Tectonophysics 1998, 297, 269–281. [Google Scholar] [CrossRef]
- Velić, J. Geologija Ležišta Nafte i Plina (Geology of Oil and Gas Reservoirs); University of Zagreb: Zagreb, Croatia, 2007. [Google Scholar]
- Saftić, B.; Malvić, T. Dubinska Kartiranje (Depth Mapping); University of Zagreb: Zagreb, Croatia, 2008. [Google Scholar]
- Saftić, B.; Velić, J.; Sztano, O.; Juhasz, G.; Ivković, Ž.; Nafte, D.I.I. Tertiary Subsurface Facies, Source Rocks and Hydrocarbon Reservoirs in the SW Part of the Pannonian Basin (Northern Croatia and South-Western Hungary). Geol. Croat. 2003, 56, 101–122. [Google Scholar] [CrossRef]
- Horváth, F.; Tari, G. IBS Pannonian Basin Project: A Review of the Main Results and Their Bearings on Hydrocarbon Exploration. Geol. Soc. London, Spéc. Publ. 1999, 156, 195–213. [Google Scholar] [CrossRef]
- Ćorić, S.; Pavelić, D.; Rögl, F.; Mandić, O.; Vrabac, S.; Avanić, R.; Jerković, L.; Vranjković, A. Revised Middle Miocene Datum for Initial Marine Flooding of North Croatian Basins (Pannonian Basin System, Central Paratethys). Geol. Croat. 2009, 62, 31–43. [Google Scholar] [CrossRef]
- Malvić, T.; Naftaplin, Z.I.; Velić, J.; Peh, Z.; Survey, Z.C.G. Qualitative–Quantitative Analyses of the Influence of Depth and Lithological Composition on Lower Pontian Sandstone Porosity in the Central Part of Bjelovar Sag (Croatia). Geol. Croat. 2005, 58, 73–85. [Google Scholar] [CrossRef]
- Royden, L. Late Cenozoic Tectonics of the Pannonian Basin System. In AAPG Memoir 45; Royden, H.L., Horváth, F., Eds.; American Association of Petroleum Geologists: Tulsa, OK, USA, 1988; pp. 27–48. [Google Scholar]
- Velić, J.; Weisser, M.; Saftić, B.; Vrbanac, B.; Ivković, Ž. Petroleum-Geological Characteristics and Exploration Level of the Three Neogene Depositional Megacycles in the Croatian Part of the Pannonian Basin. NAFTA 2002, 53, 239–249. [Google Scholar]
- Vrbanac, B.; Velić, J.; Malvić, T. Sedimentation of Deep-Water Turbidites in the SW Part of the Pannonian Basin. Geol. Carpathica 2010, 61, 55–69. [Google Scholar] [CrossRef] [Green Version]
- Malvić, T.; Velic, J. Neogene Tectonics in Croatian Part of the Pannonian Basin and Reflectance in Hydrocarbon Accumulations. In New Frontiers in Tectonic Research—At the Midst of Plate Convergence; Schattner, U., Ed.; InTech eBooks: Rijeka, Croatia, 2011. [Google Scholar] [CrossRef] [Green Version]
- Durn, T.; Krpan, M. Onshore Croatia: Hydrocarbon Opportunities at the Crossroads of Europe; Geoexpo: Heggedal, Norway, 2019; Available online: https://www.geoexpro.com/articles/2019/02/onshore-croatia-hydrocarbon-opportunities-at-the-crossroads-of-europe (accessed on 1 August 2022).
- Förster, A.; Merriam, D.F.; Davis, J.C. Spatial Analysis of Temperature (BHT/DST) Data and Consequences for Heat-Flow Determination in Sedimentary Basins. Int. J. Earth Sci. 1997, 86, 252–261. [Google Scholar] [CrossRef]
- Gray, D.A.; Majorowicz, J.; Unsworth, M. Investigation of the Geothermal State of Sedimentary Basins Using Oil Industry Thermal Data: Case Study from Northern Alberta Exhibiting the Need to Systematically Remove Biased Data. J. Geophys. Eng. 2012, 9, 534–548. [Google Scholar] [CrossRef]


| Drava Depression | Sava Depression | ||||||
|---|---|---|---|---|---|---|---|
| Total No. of Wells | No. of Wells | Porosity Data | Permeability Data | No. of Wells | Porosity Data | Permeability Data | |
| Post-rift | 51 | 19 | 63.16% | 68.42% | 32 | 68.75% | 78.13% |
| Sin-rift | 96 | 51 | 82.35% | 84.31% | 45 | 64.44% | 62.22% |
| Pre-rift | 34 | 22 | 68.18% | 86.36% | 12 | 41.67% | 58.33% |
| Total | 181 | 92 | 75.00% | 81.52% | 89 | 74.67% | 67.42% |
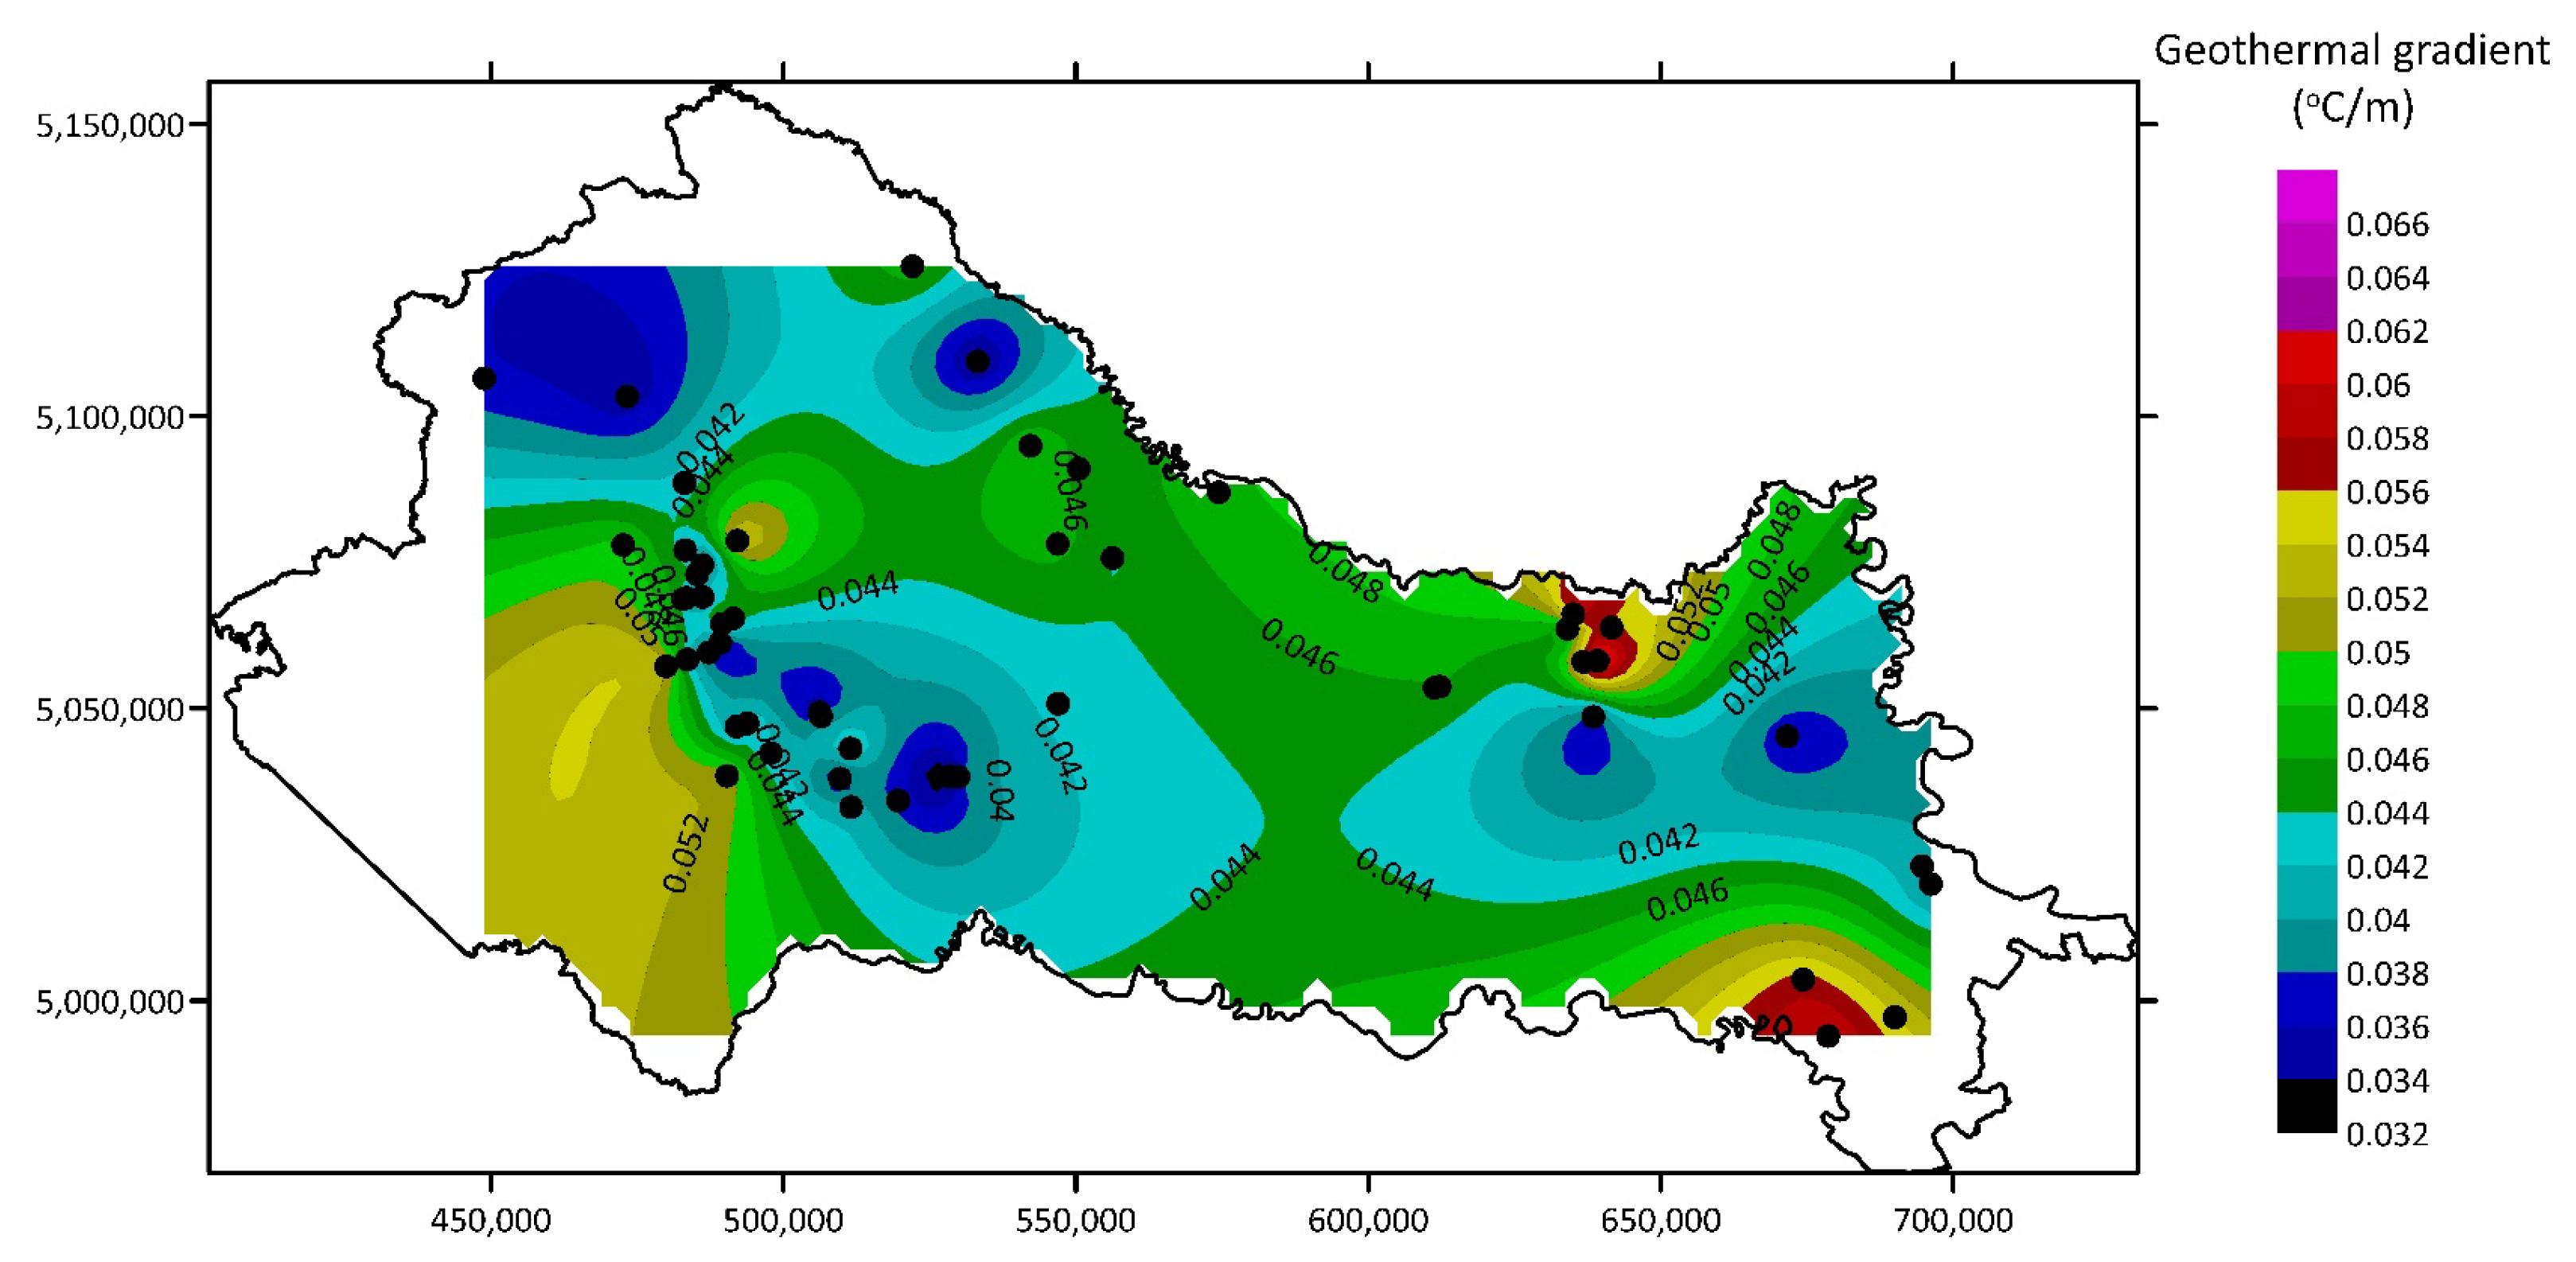
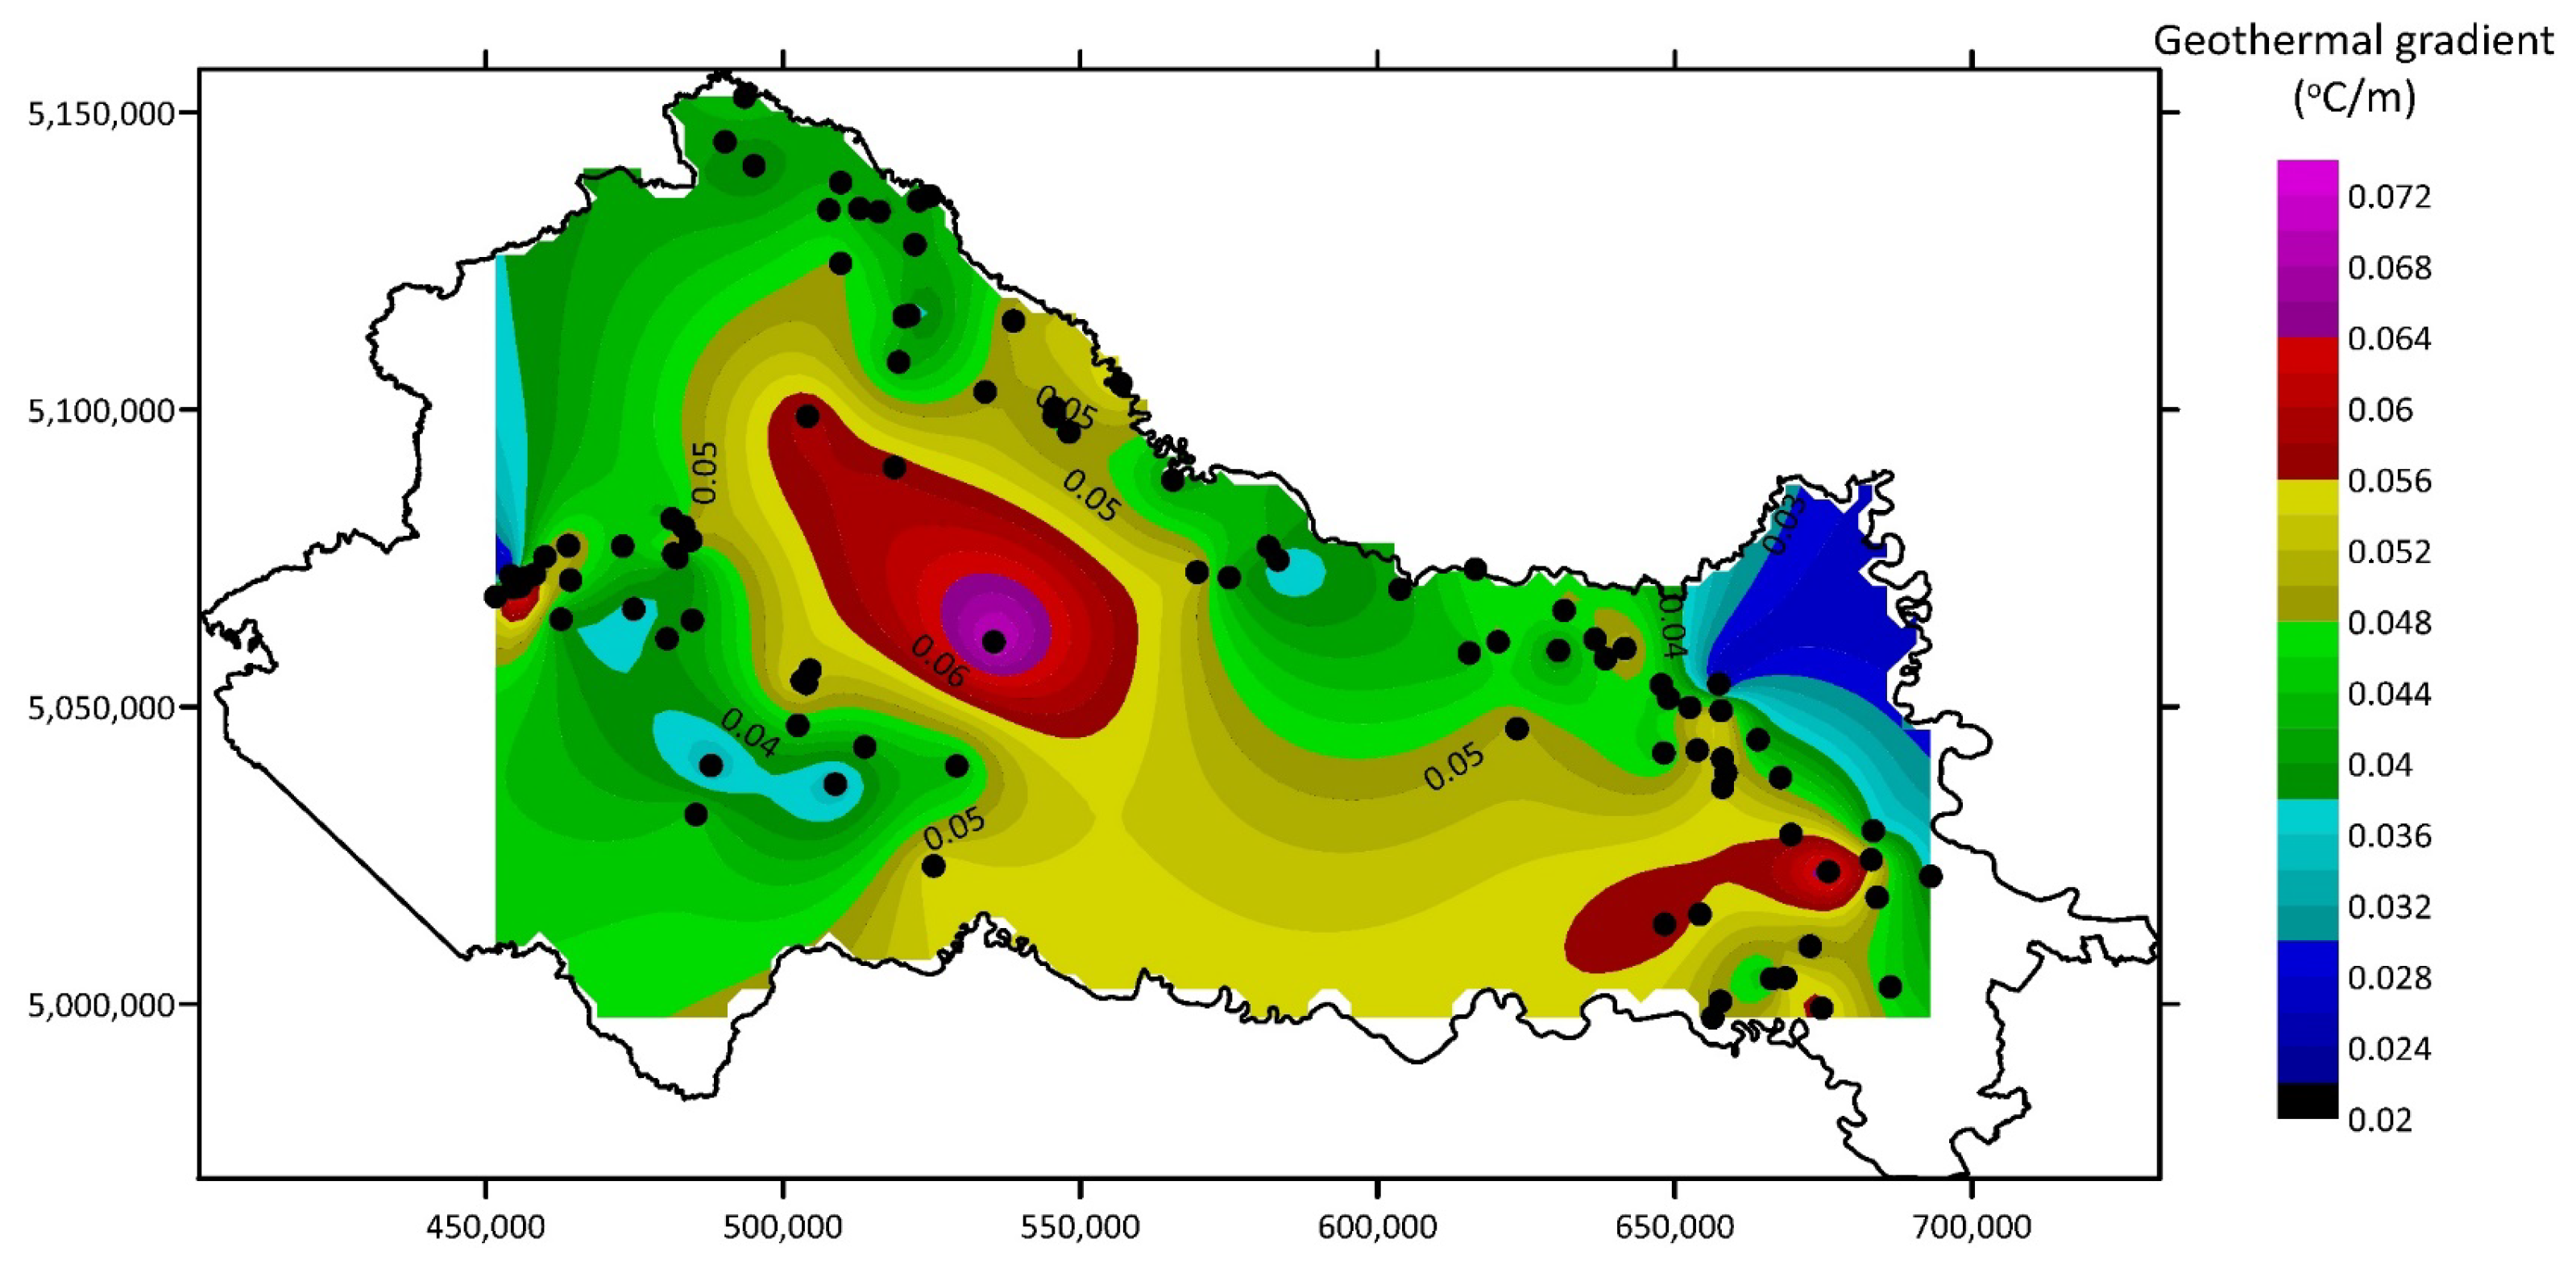
| Geothermal Gradient (°C/m) | Post-Rift | Syn-Rift | Pre-Rift |
|---|---|---|---|
| Tg < 0.04 | 35.29% | 15.63% | 11.76% |
| 0.04 < Tg < 0.05 | 43.14% | 46.88% | 47.06% |
| 0.05 < Tg < 0.06 | 17.65% | 31.25% | 32.35% |
| Tg > 0.06 | 3.92% | 6.25% | 8.82% |
| Initial Pressure (bar) | Initial Temperature (°C) | Reservoir Depth (m) | Reservoir Thickness (m) | Reservoir Porosity (%) | Reservoir Permeability (m2) | Doublet Spacing (m) | Production Rate (L/s) | |
|---|---|---|---|---|---|---|---|---|
| Post-rift | 374.00 | 132.00 | 2668.00 | 1053.00 | 13.30 | 9.40 × 10⁻¹⁴ | 307.80 | 66.24 |
| Syn-rift | 341.00 | 152.00 | 3388.00 | 719.00 | 7.90 | 2.81 × 10⁻¹³ | 704.65 | 331.77 |
| Pre-rift | 233.00 | 149.00 | 3721.00 | 217.00 | 12.90 | 6.20 × 10⁻¹⁴ | 873.00 | 115.00 |
Disclaimer/Publisher’s Note: The statements, opinions and data contained in all publications are solely those of the individual author(s) and contributor(s) and not of MDPI and/or the editor(s). MDPI and/or the editor(s) disclaim responsibility for any injury to people or property resulting from any ideas, methods, instructions or products referred to in the content. |
© 2023 by the authors. Licensee MDPI, Basel, Switzerland. This article is an open access article distributed under the terms and conditions of the Creative Commons Attribution (CC BY) license (https://creativecommons.org/licenses/by/4.0/).
Share and Cite
Tuschl, M.; Kurevija, T. Defining Heat in Place for the Discovered Geothermal Brine Reservoirs in the Croatian Part of Pannonian Basin. Water 2023, 15, 1237. https://doi.org/10.3390/w15061237
Tuschl M, Kurevija T. Defining Heat in Place for the Discovered Geothermal Brine Reservoirs in the Croatian Part of Pannonian Basin. Water. 2023; 15(6):1237. https://doi.org/10.3390/w15061237
Chicago/Turabian StyleTuschl, Martina, and Tomislav Kurevija. 2023. "Defining Heat in Place for the Discovered Geothermal Brine Reservoirs in the Croatian Part of Pannonian Basin" Water 15, no. 6: 1237. https://doi.org/10.3390/w15061237