Case Report

Occurrences, Seasonal Variations, and Potential Risks of Pharmaceutical and Personal Care Products in Lianjiang River, South of China

1
Guangdong Provincial Key Laboratory of Urbanization and Geo-Simulation, School of Geography and Planning, Sun Yat-sen University, Guangzhou 510275, China
2
Key Laboratory of Groundwater Sciences and Engineering, Ministry of Natural Resources, Shijiazhuang 050061, China
3
Technical Center of Gongbei Customs, Zhuhai 519000, China
4
Guangdong Provincial Key Laboratory of Applied Botany, Key Laboratory of Vegetation Restoration and Management of Degraded Ecosystems, South China Botanical Garden, Chinese Academy of Sciences, Guangzhou 510650, China
*
Author to whom correspondence should be addressed.
Water 2023, 15(6), 1136; https://doi.org/10.3390/w15061136
Submission received: 21 December 2022 / Revised: 9 March 2023 / Accepted: 13 March 2023 / Published: 15 March 2023

Abstract

:
Aquatic ecological problems caused by pharmaceutical and personal care products (PPCPs) are increasingly becoming an issue of concern. In this study, the seasonal and spatial occurrence and environmental risk of 20 PPCPs were studied at 19 sampling points in the surface waters of the Lianjiang River basin (southern of China); its watershed is about 10,100 km2. Sample preparation was performed using solid-phase extraction, and determination was performed by using a high-performance liquid-phase tandem triple quaternary mass spectrometer. Nine PPCPs were detected with total concentrations of 19.5–940.53 and 6.07–186.04 ng L−1 during the wet (August 2021) and dry (April 2022) seasons, respectively. Four kinds of compounds—sulfamethoxazole (SMX), sulfamonomethoxine (SMM), caffeine (CAF), and florfenicol (FFC)—had a detection rate of more than 50% in both seasons. CAF, carbamazepine (CBZ), and FFC were higher in the wet season than in the dry season in the Lianjiang River possibly due to the higher usage of PPCPs and increased tourism during summer. SMX and SMM showed higher average concentrations in the dry season possibly due to lower biodegradation in the dry season and a slight dilution effect from rainfall. The concentrations of SMX, SMZ, SMM, and FFC were strongly correlated with NO3, according to redundancy analysis and Spearman’s correlation analysis. The results of the risk quotient revealed that the ecological effect of CAF concentrations on green algae had low risk at all sampling points except R16.

1. Introduction

Pharmaceutical and personal care products (PPCPs) are emerging micro-pollutants in the environment. They include human and veterinary drugs and personal care products used in toiletries and disinfectants [1]. PPCPs are the major group of chemical pollutants among emerging micro-pollutants, which include industrial chemicals and pesticides, and are found in humans’ daily lives [2]. About 3000 commonly used pharmaceuticals have been registered in the EU market, with new pharmaceuticals still increasing globally [3]. A hundred thousand tons of pharmaceuticals are used to treat human and animal diseases every year [4]; China accounts for 60% of the total output of the global pharmaceutical industry [1,5]. It is estimated that the annual consumption of raw antibiotic materials in China is about 180,000 tons (including health and agricultural purposes) [6].
Parts of PPCPs are discharged into the aquatic environment and local water supply systems because wastewater treatment plants (WWTPs) cannot degrade all PPCPs. Fifteen PPCPs have been analyzed in four sewage treatment plants, with 11 PPCPs detected with an average total concentration of 147.02 ng L−1 in influent and 105.06 ng L−1 in effluent [7]. These chemicals can enter the environment though surface runoff, hazardous waste, waste sites, landfill leachates, and urban runoffs, especially during the rainy season [8,9,10]. However, WWTPs are generally considered as the main point source of PPCPs in the aquatic environment [7,11]. The presence of PPCPs has caused problems in many environmental compartments such as surface water, soil, and groundwater [12,13]. Many studies have been conducted on PPCPs in the Pearl River and the Pearl River district, one of the most developed areas of China [14,15,16]. However, the Lianjiang River, as a tributary of the Pearl River, has been rarely sampled and analyzed by researchers. The occurrence of PPCPs in water bodies such as rivers [17], lakes [18], groundwater [12], and oceans [19] has been widely reported worldwide in the existing literature. About 14% of the Earth’s land surface is covered by karst, and 25% of the world’s population depends entirely or partly on the drinking water of karst aquifers [20]. Karst aquifers, a particularly important source of groundwater, are especially vulnerable to pollution due to direct infiltration through streams, shafts, and caves [21]. Therefore, many previous studies focused on the environmental risk and migration tracing of PPCPs in karst aquifers. Caffeine (CAF), which degrades more rapidly in water, could be used as an indicator of wastewater in areas of groundwater with rapid flow and high vulnerability [22]. The reported concentrations of PPCPs in the aquatic environment reach from ng L−1 to μg L−1 levels [23] and may pose potential risks to organisms, humans, and even whole ecosystems, particularly groundwater that provides drinking water to humans. Carbamazepine (CBZ) is reportedly carcinogenic to rats and lethal to zebrafish at less than 50 μg L−1. In sum, the risk of PPCPs to organisms in the water environment needs to be evaluated.
The U.S. Environmental Protection Agency (US EPA) and the European Medicines Agency developed risk evaluation guidelines to assess the environmental hazards of PPCPs in the aquatic or terrestrial environment [24,25]. Risk quotients (RQs) have been used to assess the potential ecological risks of PPCPs [7,10,26]. Findings showed that they pose a significant risk to aquatic ecosystems. Therefore, comprehensively assessing the ecotoxicological risks of PPCPs in river water with RQs is necessary.
Previous studies investigated the impacts of environmental parameters on soil and water by using multivariate analyses such as principal component analysis, redundancy analysis (RDA), detrended correspondence analysis (DCA), and canonical correlation analysis [27]. RDA has been used in many environmental studies successfully [14,26,28], which focused on the relationship of aminoglycosides with environmental parameters, indicating a strong association with chemical oxygen demand (CODMn) and total nitrogen (TN) in the dry and wet seasons.
Nineteen sampling points were selected in this study to investigate the seasonal and spatial variations of the 20 target PPCPs in the Lianjiang River basin. The main aims of this study are (1) to characterize the occurrence and distribution of PPCPs in the Lianjiang River, (2) to reveal the seasonal variation of PPCPs between the wet and dry seasons, and (3) to use the measured concentrations in river water to evaluate the environmental risks from PPCPs.

2. Materials and Methods

2.1. Reagents and Chemicals

Twenty analytical-grade PPCPs (sulfadimethoxine [SDM], sulfamethoxazole [SMX], sulfamonomethoxine [SMM], sulfamerazine [SMR], sulfamethazine [SMZ], sulfachinoxalin [SCO], tetracycline [TC], doxycycline [DC], chlorotetracycline [CTC], oxytetracycline [OTC], enrofloxacin [EFX], ciprofloxacin [CFX], clenbuterol hydrochloride [CHR], salbutamol [SBT], cimaterol [CMT], ractopamine [RCP], florfenicol [FFC], chloramphenicol [CMP], carbamazepine [CBZ], and caffeine [CAF]) were obtained from ANPEL (Shanghai, China). The chemical structures of drug molecules and chemical properties are provided in Table S1 (Supplementary Materials). Solvents (HPLC grade), including ethyl acetate, methanol, and DCM for chromatographic analysis and experiments, were obtained from ANPEL (Shanghai, China). The mixed standards for 20 PPCPs, surrogates, and internal standards were purchased from Sigma (Saint Louis, MO, USA). Oasis HLB (6 cc, 500 mg) solid-phase extraction (SPE) cartridges were purchased from Waters Corporation (Milford, MA, USA). Ultrapure water was produced by a Milli-Q system (Millipore, Milford, MA, USA).

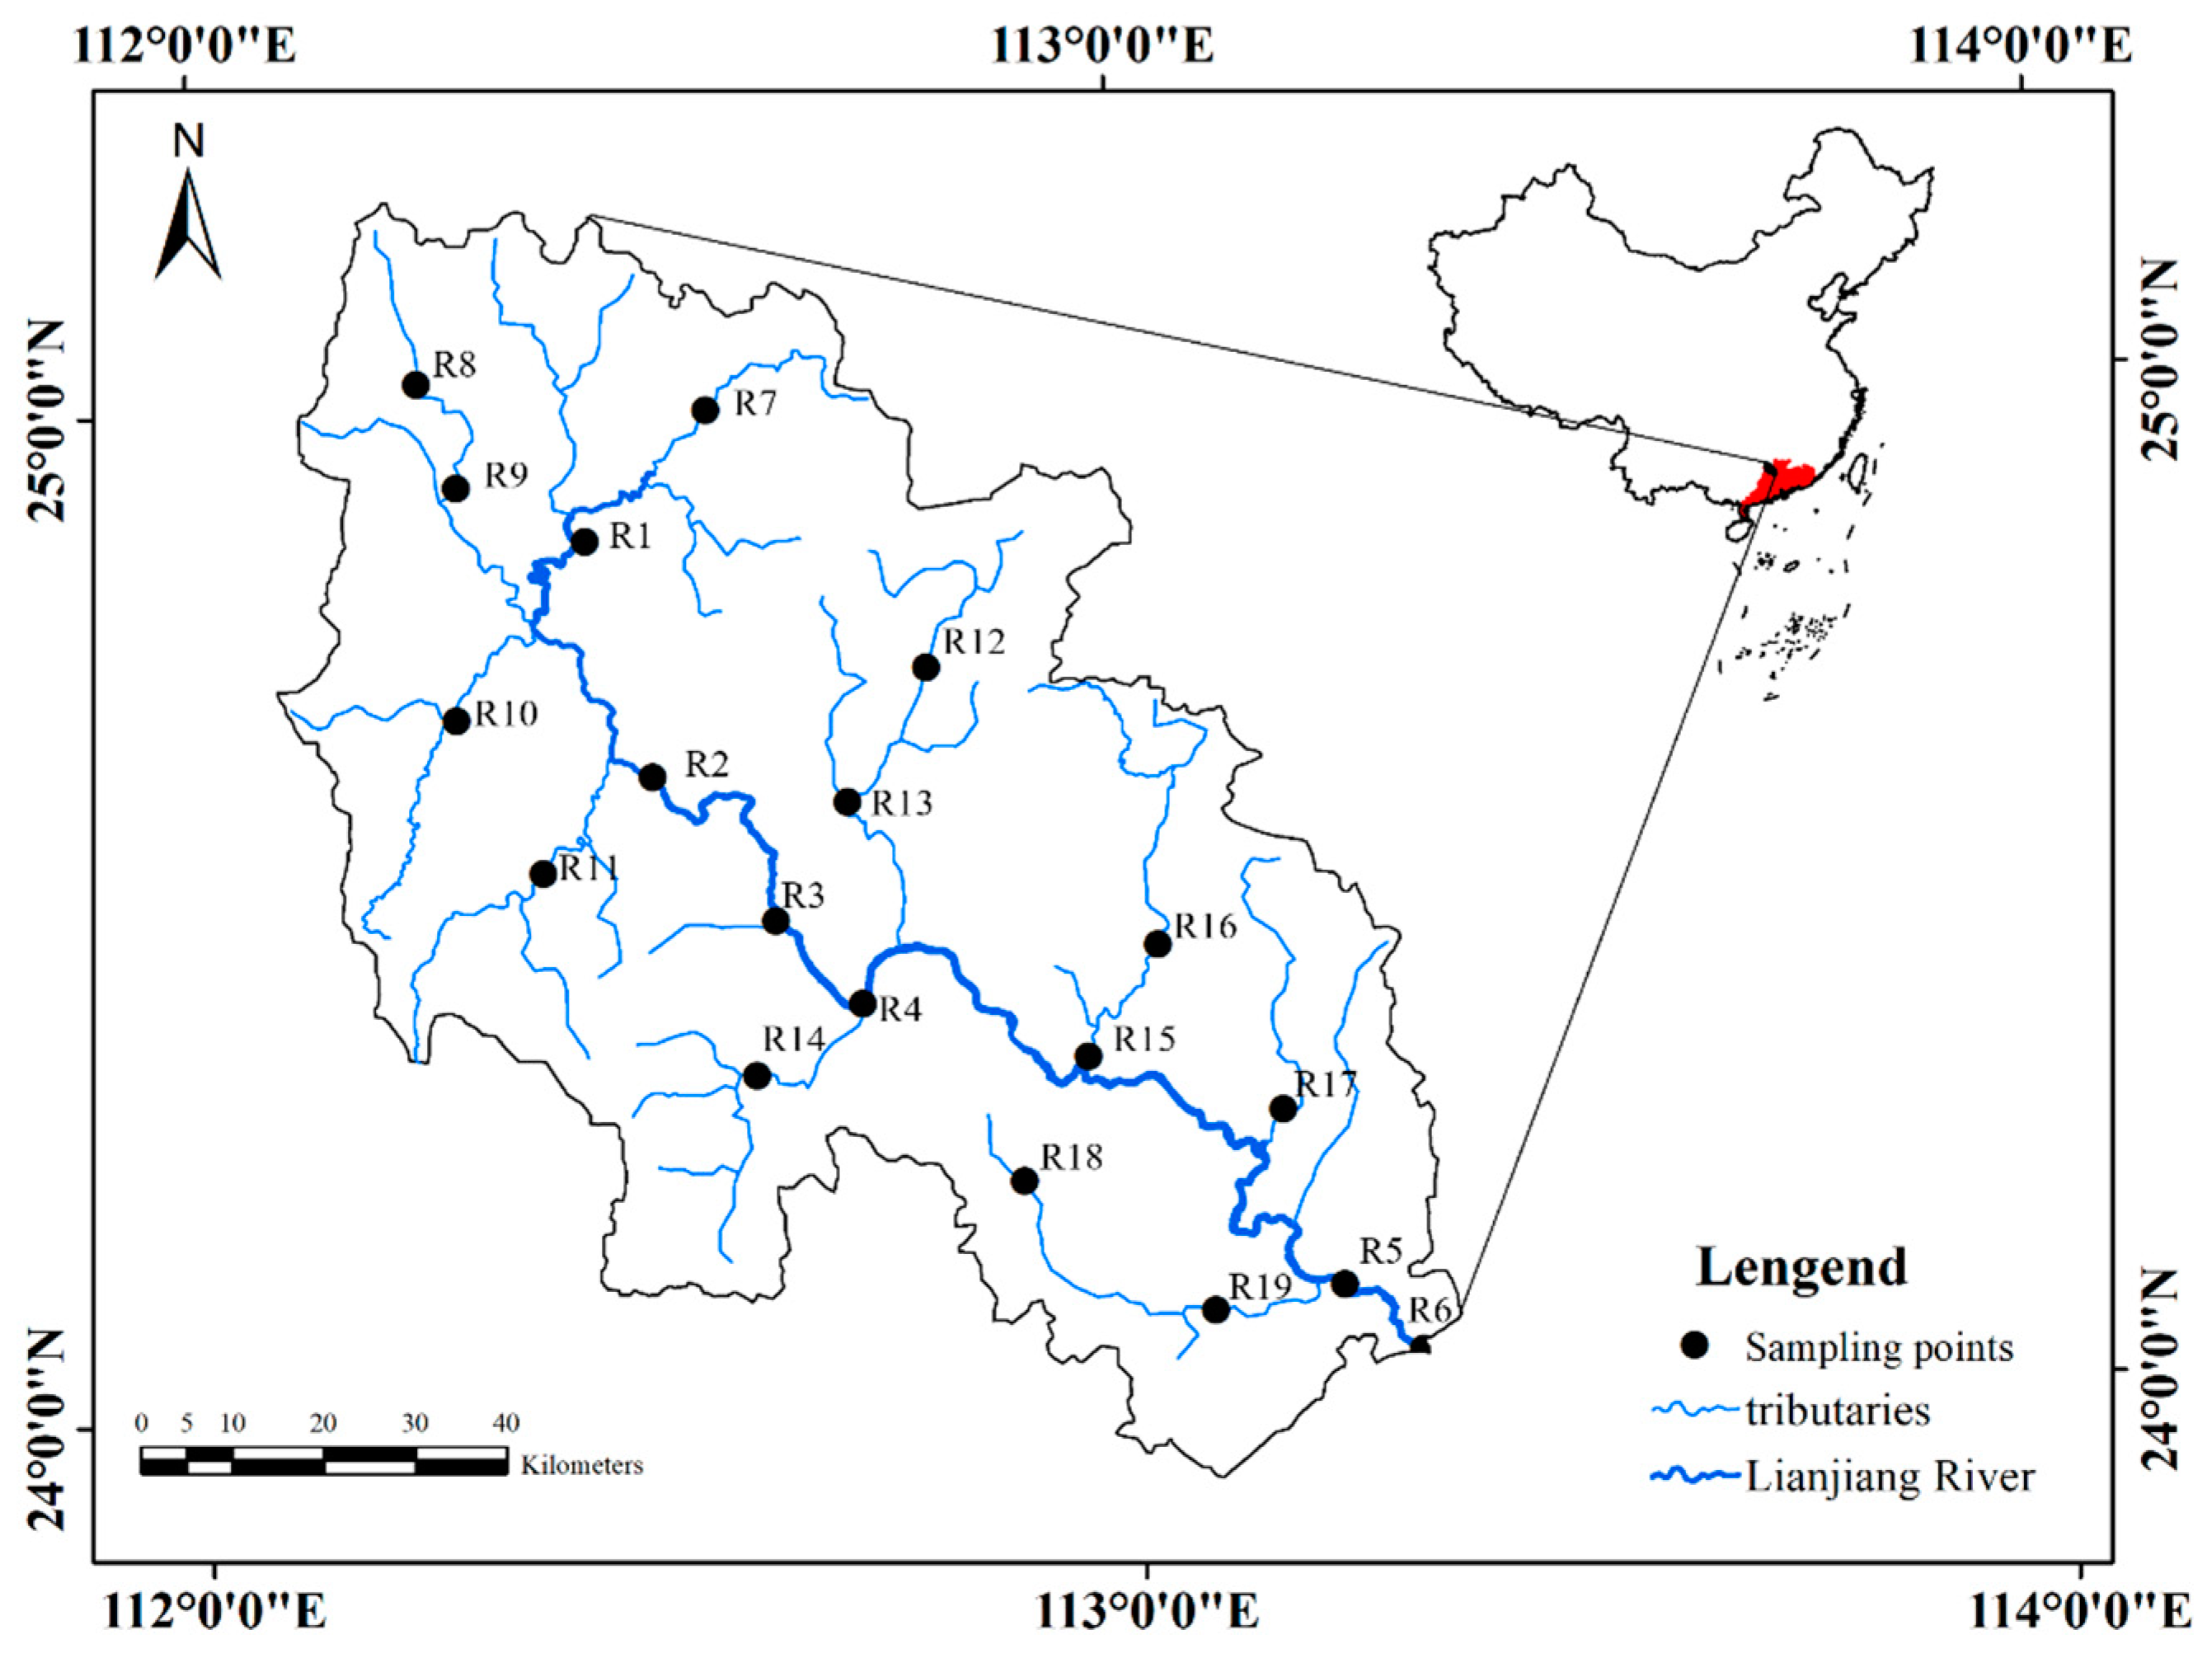
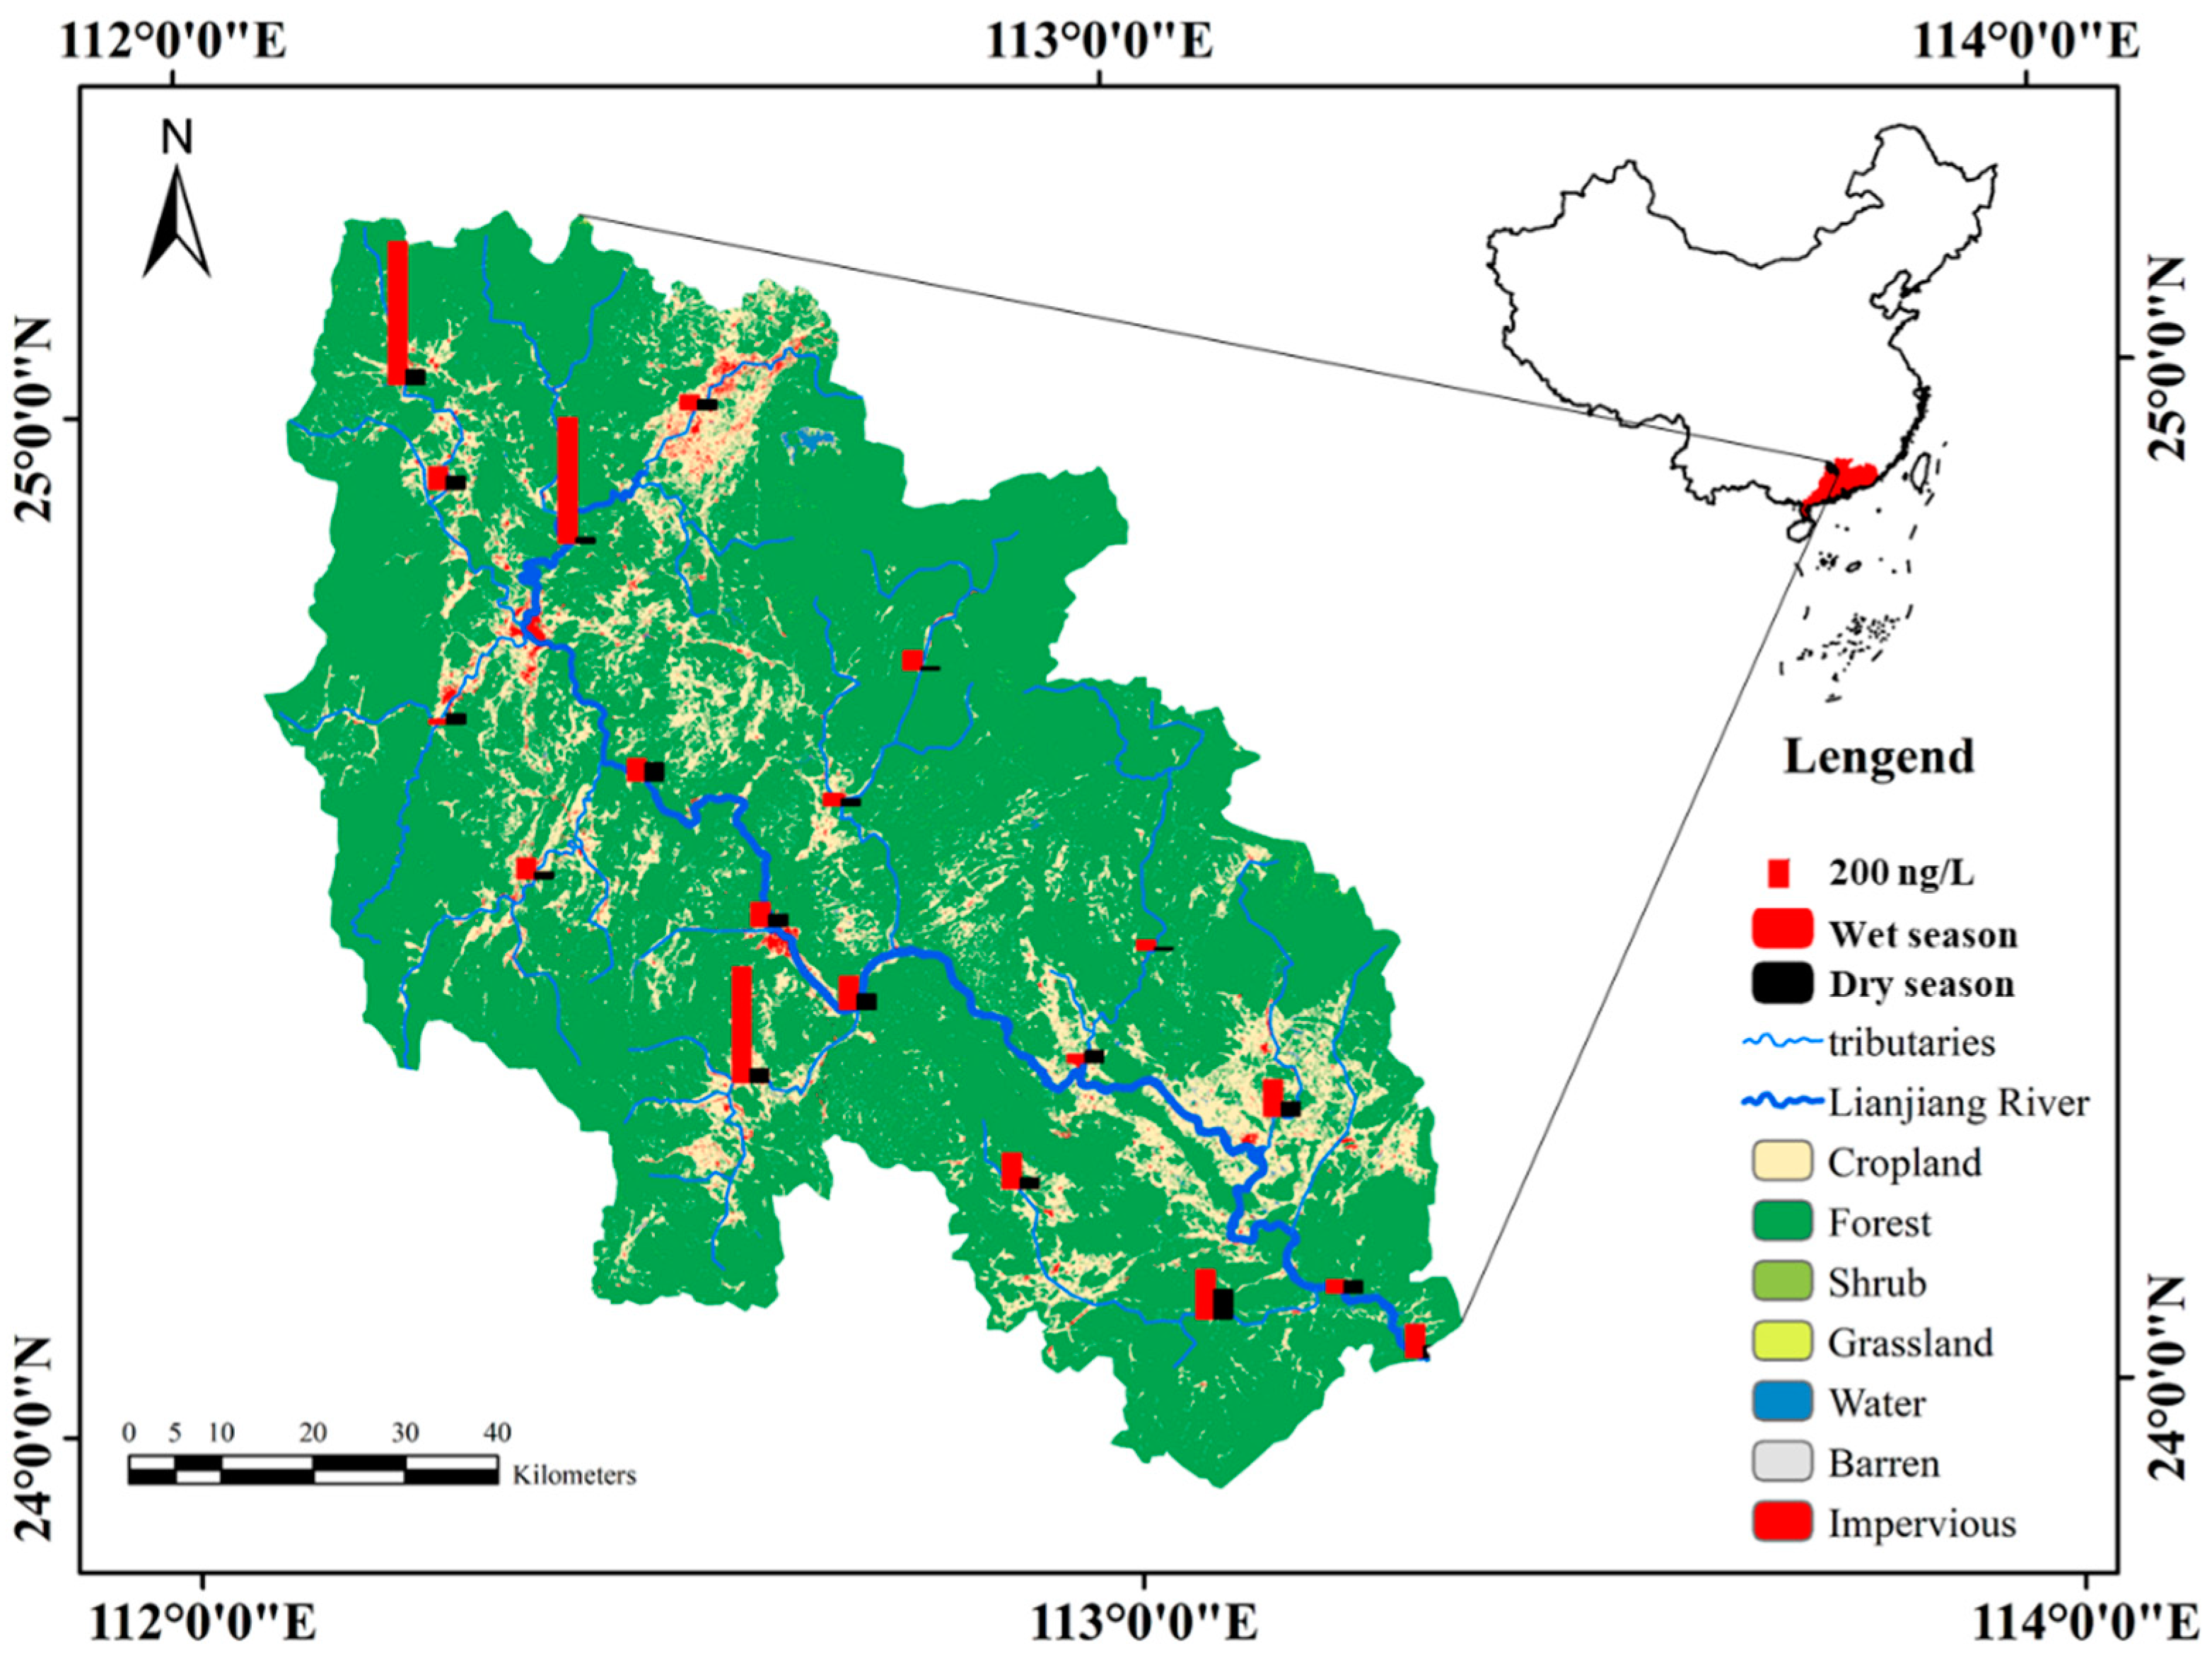
2.2. Characteristics of the Study Area

The Lianjiang River is located in Qingyuan City (23°26′–25°11′ N, 111°55′–113°55′ E), Guangdong Province, South China. It flows into the Beijiang River, which is the largest tributary of the Beijiang River of the Pearl River system, and has a catchment area of 10,100 km2 (Figure 1). The Lianjian River has a southern subtropical monsoon climate, with a mean annual temperature of 20.6 °C and annual rainfall of 1556 mm, and the rainfall in the wet season accounts for about 73% of the whole year. The annual runoff is 11.6 billion m3, accounting for 75–80% in the wet season. The study area is predominantly formed by limestone formed from the Late Paleozoic to Mesozoic (Triassic) and granite mainly formed during the Yanshanian. Most of the residents are farmers, living in small villages, as a traditional intensive animal breeding (chicken and pig) and aquaculture zone. Numerous small-scale, medium, and heavy industries, including ceramics, metal smelting, mining, and many landfill sites, are located in towns.

2.3. Sample Collection and Basic Analysis

A field campaign was conducted to investigate the PPCPs and relevant environmental parameters in August 2021 and April 2022, respectively. Thirty-eight water samples were taken from the Lianjiang River and its tributaries, collected in 3000 mL sealed brown glass bottles, immediately transported to the laboratory on ice. All water samples were preserved at 4 °C and processed within 7 days for further analysis. Field parameters (pH, DO, and temperature (T)) were measured with a multi-parameter measurement device (DR/800; HACH, Loveland, CO, USA) while sampling. Cl, NO3, and SO42− were analyzed using a DX-600 ion chromatograph (Dionex, Sunnyvale, CA, USA) in the laboratory.

2.4. Extracting Water Samples for PPCP Analysis

All standards were added with 1 mol/L HCl to adjust the pH to 3 and filtered through a 0.7 μm glass fiber filter membrane (Whatman GF/F, 0.7 m, London, UK). Then, 0.75 g of Na2EDTA was added to enhance the extraction efficiency. The 3 L water sample was spiked with 50 ng metronidazole-d4 (MDZ-d4) and carbamazepine-d10 (CBZ-d10). Then, the water samples were extracted using solid-phase extraction (Oasis HLB cartridges 6cc, 500 mg), having been preconditioned with 10 mL methanol and 10 mL deionized water (pH = 3) at a flow rate of 5 mL/min under vacuum. After extraction, the target compounds were eluted from the SPE cartridges with 24 mL of methanol containing 5% formic acid, enriched to approximately 0.5 mL by using a gentle stream of nitrogen gas at 40 °C. The samples were reconstituted to 1 mL with a mobile phase (water:methanol, 50:50 v/v) and filtered through a 0.22 μm syringe filter. Finally, the samples were transferred to 1.5 mL amber vials and preserved at −20 °C until instrument analysis was performed.

2.5. Liquid Chromatography-Mass Spectrometry

The detection and quantification of the target compounds were performed by using a high-performance liquid-phase tandem triple quaternary mass spectrometer (HPLC, Shimdzu, Kyoto, Japan; MS AB5500, AB Sciex, Framingham, MA, USA) equipped with an electrospray ionization (ESI) source using multiple reaction monitoring. A Shim-pack XR-ODS column (100 × 2.0 mm, particle size of 1.7 μm) was used. Mobile phase A was purified water (containing 5 mmol L−1 ammonium acetate), mobile phase B was acetonitrile, and the total flow rate was 0.3 mL·min−1. The gradient started with 10% B, was maintained for 2 min, increased to 20%, was maintained for 2 min, increased to 80%, was maintained for 2 min, dropped to 5%, and was maintained for 3 min, for a total run time of 7 min. The injection quantity was 2 μL. The column temperature was set to 25 °C, and the ESI source temperature was 550 °C. The needle was washed once before and after injection. After every 10 sample injections, blank and spiked standards were injected for quality assurance and quality control purposes. The MS operation parameters, including fragment voltage and collision energy, are presented in Table S2.

2.6. Quality Assurance and Quality Control

To reduce the influence of the matrix and the experimental process on the quantitative determination, the standard curve used for the quantification was the standard working curve drawn by the recovery of the spiked sample. The prepared standard working solution was used for processing and determination according to the sample pretreatment method, and the analyte peak area and its concentration were used for linear regression. The external standard method was used for chloramphenicol and FFC, and the internal standard method was used for other compounds. The calibration curve of an individual compound was greater than 0.99 (r2 > 0.99). The concentrations of PPCPs were calculated by the internal or external standard method (Table S3). Different PPCPs have different chemical structures and properties, and the instrument signal response value is different when the instrument is used for detection, so their LODs were also different.

2.7. Environmental Risk Assessment

The RQ method is one of the most common approaches to assess the impact of chemical exposure on the ecosystem [17,29]. The RQ was calculated through the measured environmental concentration divided by the predicted no-effect concentration (PNEC) of each compound for aquatic organisms (Equation (1)).
RQ = MEC PNEC
The PNEC of each target analyte for organisms (fishes, green algae, and daphnia) was estimated by dividing EC50 or LC50 by an assessment factor of 1000 (Equation (2)). The EC50 and LC50 are the median effective concentration and lethal concentration 50%, respectively [30].
The EC50 or LC50 values for aquatic organisms were obtained from the US EPA ECOSAR database (Table 1).
PNEC = EC 50   or   LC 50 AF
The risk to aquatic organisms was subsequently divided into four classes according to the RQ value: insignificant ecological risk (RQ < 0.01), low risk (RQ < 0.1), moderate risk (0.1 < RQ < 1), and high risk (RQ > 1).

2.8. Statistical Analysis

Data analyses were performed by SPSS 22.0, Origin 2023, and ArcGIS 10.2 software. The relationship among the concentration of PPCPs and environmental parameters was identified through RDA by CANOCO software at each sampling site. Spearman’s correlation analysis was performed to analyze the relationships among the concentrations of PPCPs and environmental parameters by R.

3. Results and Discussion

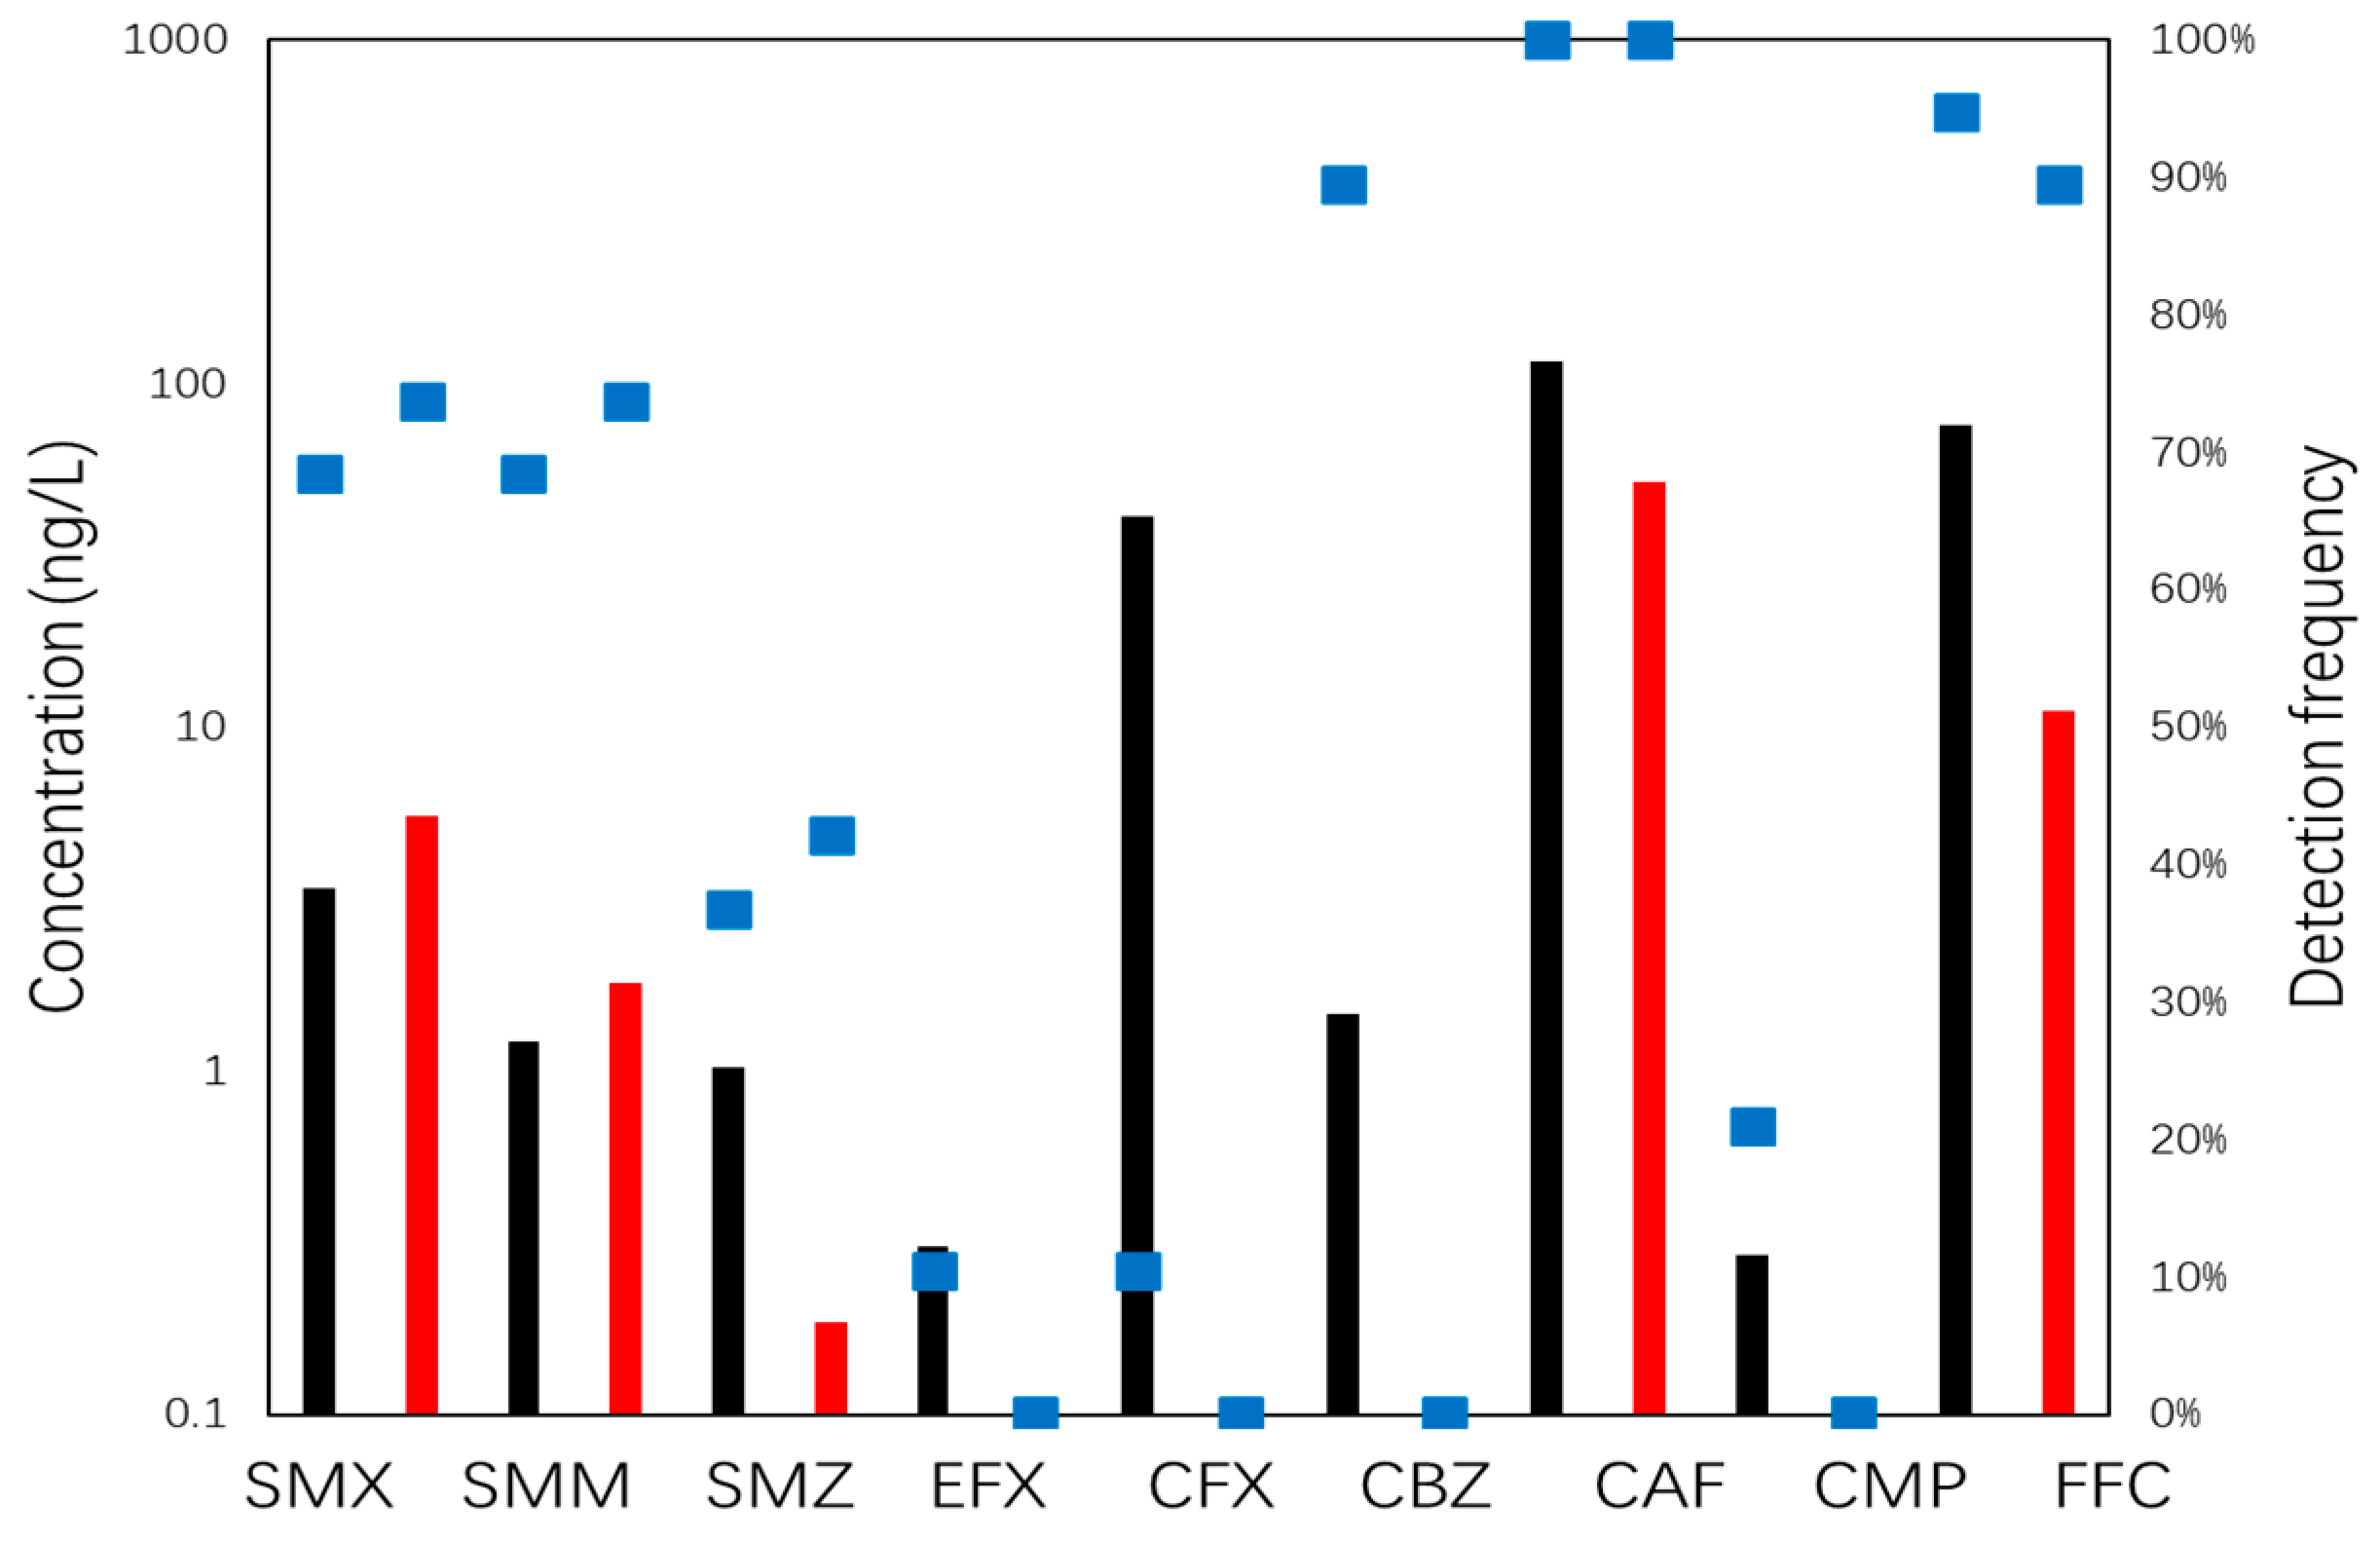
3.1. Occurrence of PPCPs in the Lianjiang River

The average concentrations and detection frequencies of PPCPs for the wet (August 2021) and dry (April 2022) seasons in the Lianjiang River and its tributaries are presented in Figure 2. Among the 20 PPCPs, nine PPCPs had concentrations that ranged from 19.5 to 940.53 and 6.07 to 186.04 ng L−1 during the wet and dry seasons, respectively. The detected concentrations had a similar magnitude to the levels reported in other major rivers in China (ranging from a few ng L−1 to about 1000 ng L−1); for example, the concentrations of all antibiotics range from 678 to 1951 ng L−1 in the dry season and 414 to 1786 ng L−1 in the wet season in the Haihe River [26], and the concentration of all PPCPs was close to 600 ng L−1 in the dry season and 200 ng L−1 in the wet season in the Yangtze River estuary [31].
As described in Table 2, nine compounds were detected from different sampling points in the Lianjiang River out of 20 target compounds. CAF, FFC, and CBZ, showed the highest detection frequencies (>89–100%), and SMX, SMM, SMZ, EFX, CFX, and CMP showed moderate to low detection frequencies (74–11%). These nine detected analytes were identified as antibacterials (five), antiepileptic drugs (one), stimulants (one), and antibiotics (two).
The accumulation concentration of PPCPs in the Lianjiang River in the dry and wet seasons is presented in Figure 3. The highest cumulative concentration of PPCPs was found in tributaries, followed by the midstream and downstream in the wet season (Figure 3). No significant difference was found during the dry season.
CAF is a neuroactive purine-like plant alkaloid that acts as a stimulant to the central nervous system [32]. As one of the most common PPCPs, CAF is found in about 60 plant species in nature, especially in coffee, tea, and cacao plants, and is considered beneficial to human health, making it one of the most widely consumed stimulants in the world [33]. After being absorbed by the human body, more than 90% of CAF is discharged through urine and feces, resulting in its high concentration in wastewater and the natural aquatic environment, and it can be used as an ideal wastewater tracer [34,35,36]. Global CAF consumption results in its constant release into the aquatic environment and growing concerns related to the associated risks [37]. Many related studies have been conducted throughout the world [22,38,39]. Recent reports indicate that CAF levels range from ng L−1 to μg L−1. In this study, the highest concentration (R1) of CAF was in the upstream tributary of the Lianjiang River in the wet season. The high CAF content may be due to the high consumption of coffee and tea in the upstream and surrounding areas, as well as the domestic wastewater directly discharged from a hospital into the river. The upstream tributary of the Lianjiang River has many tourist attractions, and many tourists come to visit every year, especially during the wet season.
Antibacterial (SMX, SMM, SMZ, EFX, and CFX) sulfonamides are the oldest chemically synthesized antibacterial agents and are still widely used to treat various bacterial, protozoan, and fungal infections [40]. SMX is not only used for the prevention and treatment of human diseases but is also commonly used in veterinary medicine in the breeding industry [41]. The concentration ranges and detection frequencies of SMX detected in all river water samples were ND–35.25 ng L−1 and 68% in the wet season and ND–47.15 ng L−1 and 74% in the dry season. SMM (68% in the wet season and 74% in the dry season) is followed by SMZ (40% in the wet season and 42% in the dry season), EFX (11% in the wet season and not detected in the dry season), and CFX (11% in the wet season and not detected in the dry season). The highest individual concentrations of SMX (47.15 ng L−1), SMM (13.8 ng L−1), SMZ (10.5 ng L−1), EFX (3.74 ng L−1), and CFX (775 ng L−1) were similar to those in previous studies [42,43,44]. The high concentrations and detection frequencies of antibacterials such as SAs may be related to the discharge of upstream and surrounding domestic sewage, livestock husbandry, and aquaculture; this information was derived with the help of web-map information (map.baidu.com). In all river samples, CFX was detected only at two sampling points with 775 and 8.8 ng L−1. The highest concentration (R8) was detected in a small tributary in the upstream area of the Lianjiang River, which may be caused by the leakage of the fertilizer pool of the nearby hospital or nursing home and also due to the direct discharge of the nearby domestic sewage into the river.
The antibiotic (FFC and CMP) FFC is widely used in veterinary medicine and aquaculture to control bacterial diseases because of its quick effect and low cost [45]. FFC has been detected in lake water in the middle and lower reaches of the Yangtze River at concentrations as high as 94%, with a maximum of 108 ng L−1 [18]. The concentration range and detection frequency of FFC detected in all river water samples was ND–690 ng L−1 and 95% in the wet season, while the concentration range and the detection frequency were ND–74.5 ng L−1 and 89% in the dry season. This detection frequency was followed by that of CMP (21% in the wet season and not detected in the dry season). The highest individual concentration (R14) of FFC (690 ng L−1) is in the lower reaches and may be caused by leakage from a nearby large fish farm.
CBZ, a widely used anticonvulsant drug in the treatment of human psychiatric disorders, is confirmed as a resilient and not noticeably degradable contaminant and is highly resistant to biodegradation [46,47]. Its high consumption in the world leads to its high accumulation and detection frequency in the environment. The concentration range and detection frequency of CBZ detected in all river water samples were ND–18.9 ng L−1 and 89% in the wet season, whereas it was not detected in the dry season. Generally, CBZ tends to adsorb to sediments in aquatic environments or soil particle due to its high Koc value, reaching a concentration of 31.8 ng g−1 [48]. The detection concentration and frequency of CBZ are higher in the wet season than in the dry season possibly because CBZ residues in the soil infiltrate the river channel after being washed by rain, or the CBZ adsorbed on the sediment at the bottom of the river channel is resuspended into the aqueous phase due to the increased river water volume.
The major PPCPs observed in this study consist of veterinary drugs, e.g., SMM, SMX, and CMP, and FFC, and medicines for human use, e.g., EFX and CFX, implying that the aquatic environment receives emissions from different anthropogenic activities.

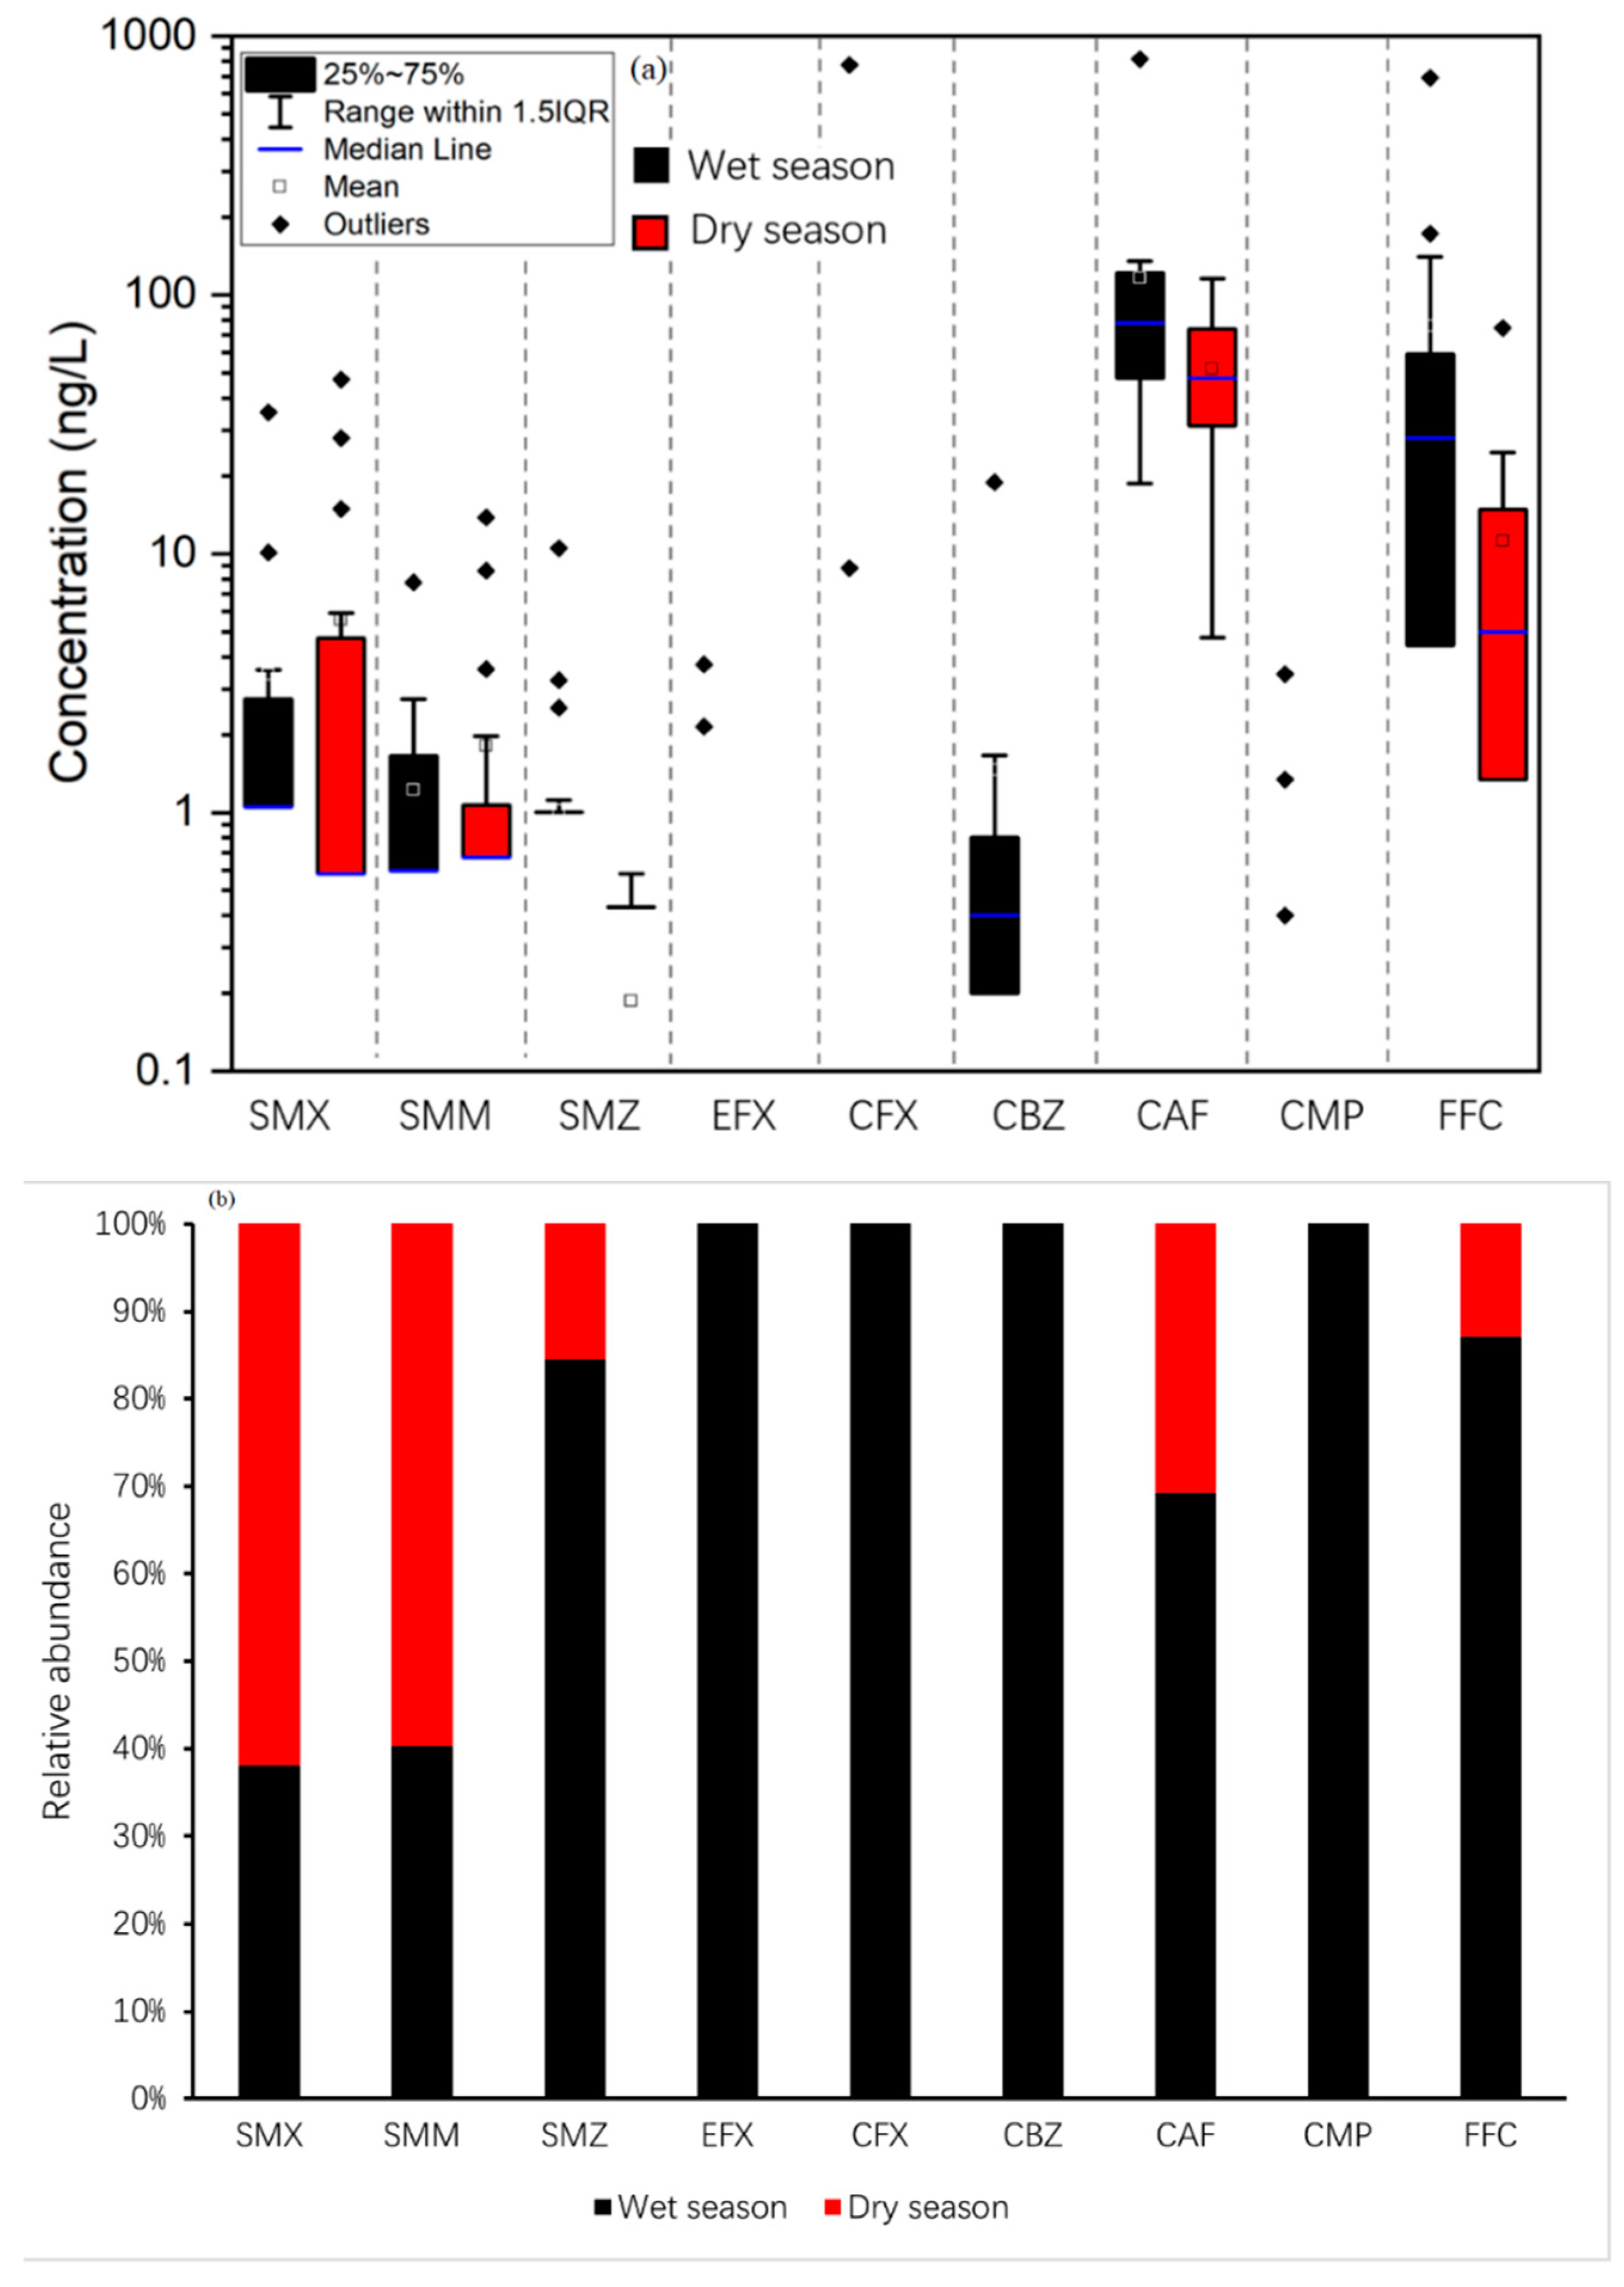
3.2. Seasonal Variations in PPCPs in the Lianjiang River

Due to the uneven distribution of rainfall and runoff in the Lianjiang River basin in the wet and dry seasons, samples were collected in these two periods to analyze the seasonal variability. Seasonal differences in the compositions and concentration of PPCPs in aquatic environments are usually due to environmental conditions and usage [49]. In fact, the seasonal variations of PPCP concentration and composition have been widely found in natural aquatic environments, such as the Pearl River estuary [14], Haihe River [26], Maozhou River [16], and Bengaluru River [50]. The descriptive statistical analysis results of the concentrations of PPCPs in the Lianjiang River during the wet and dry seasons are summarized in Table 1 and Figure 4a. Out of 20 surveyed PPCPs, only CAF showed 100% detection frequency possibly due to its widespread use throughout the year and its high water solubility [7]. Other PPCPs that had detection frequencies of more than 60% in both seasons were SMX, SMM, and FFC. The detection frequencies of other PPCPs such as CBZ, SMZ, CMP, EFX, and CFX ranged from 11% to 89% in the wet season, the detection frequency of SMZ was 42% in the dry season, and the remaining PPCPs were not detected. The relative abundance of all the studied compounds is summarized in Figure 4b, as data showed that EFX, CFX, CBZ, and FFC was detected in the wet season only; CAF, CMP, and SMZ had higher concentrations during the wet season; and SMX and SMM had higher concentrations during the dry season. The statistical results for CBZ (p < 0.05), CAF (p = 0.023), and FFC (p = 0.022) showed significantly higher concentrations in water during the wet season possibly due to the extensive use of PPCPs in medical and aquacultural industries during summer. The other compounds showed no significant variations between the wet and dry seasons.
In this study, out of all sulfonamides (SMX, SMM, and SMZ), the total concentration of SMX was relatively higher with 64.80 and 105.19 ng L−1 in the wet and dry seasons, respectively. The concentration was detected at most sampling points below 5 ng L−1, except three sampling points (R15 = 14.9 ng L−1, R17 = 47.15 ng L−1, and R19 = 28 ng L−1) in the downstream tributary in the dry season. The total concentrations of SMM were 23.19 and 34.265 ng L−1 in the wet and dry seasons, respectively. The total concentrations of SMZ were 19.38 and 3.55 ng L−1 in the wet and dry seasons, respectively. Therefore, the total concentration of individual SAs may vary slightly in both seasons, but it is not statistically significant different. In sum, anthropogenic inputs such as wastewater from hospitals and domestic wastewater are the main sources. The concentrations of compounds were lower in the wet season possibly because of dilution and the temperature effect, which is consistent with a previous study [51].
For EFX and CFX, only two sampling points were detected in the wet season. The highest concentration of CFX was 775 ng L−1 (R8) in the upper stream of the Lianjiang River, and the remaining sampling point that can be detected with 8.8 ng L−1 (R14) was in the downstream tributary of the Lianjiang River. The high concentration at the sampling point may be due to domestic sewage or veterinary sources in the upstream area of the river being washed by rain and leaking into the river during the wet season.
CBZ shows statistically significant season variations; the reason for this condition is discussed above. In the summer, the temperatures reach up to 25–40 °C, leading to high blood pressure, which can then trigger seizures. As a result, the consumption of CBZ as the main antiepileptic drug increases.
CAF (a human indicator) was dominant in the overall concentration of PPCPs in the Lianjiang River. CAF has a 100% detection frequency in both seasons possibly because it is used in a variety of beverages, such as coffee, tea, and numerous food products. The concentration of CAF in the wet season is nearly twice that in the dry season. During the wet season, the ambient temperature reaches almost 40 °C, and people at work become tired; thus, they may need more coffee or tea to refresh themselves.
For antibiotics (FFC and CMP), CMP was detected at only four sampling points in the wet season. The highest concentration was 3.45 ng L−1 (R8); the overall concentration is too low to reflect the environmental situation. Compared with CMP, FFC shows statistically significant season variations. Its highest concentration was 690 ng L−1 (R14), and its total concentration in the wet season was seven times that in the dry season. The Lianjiang River basin has many fish farms. During summer, bacteria multiply fast because of the high ambient temperature, and the dissolved oxygen is low. Thus, fish become prone to various diseases, requiring a large number of antibacterial drugs such as FFC to be mixed in the fish pond. These drugs leak easily into the river.

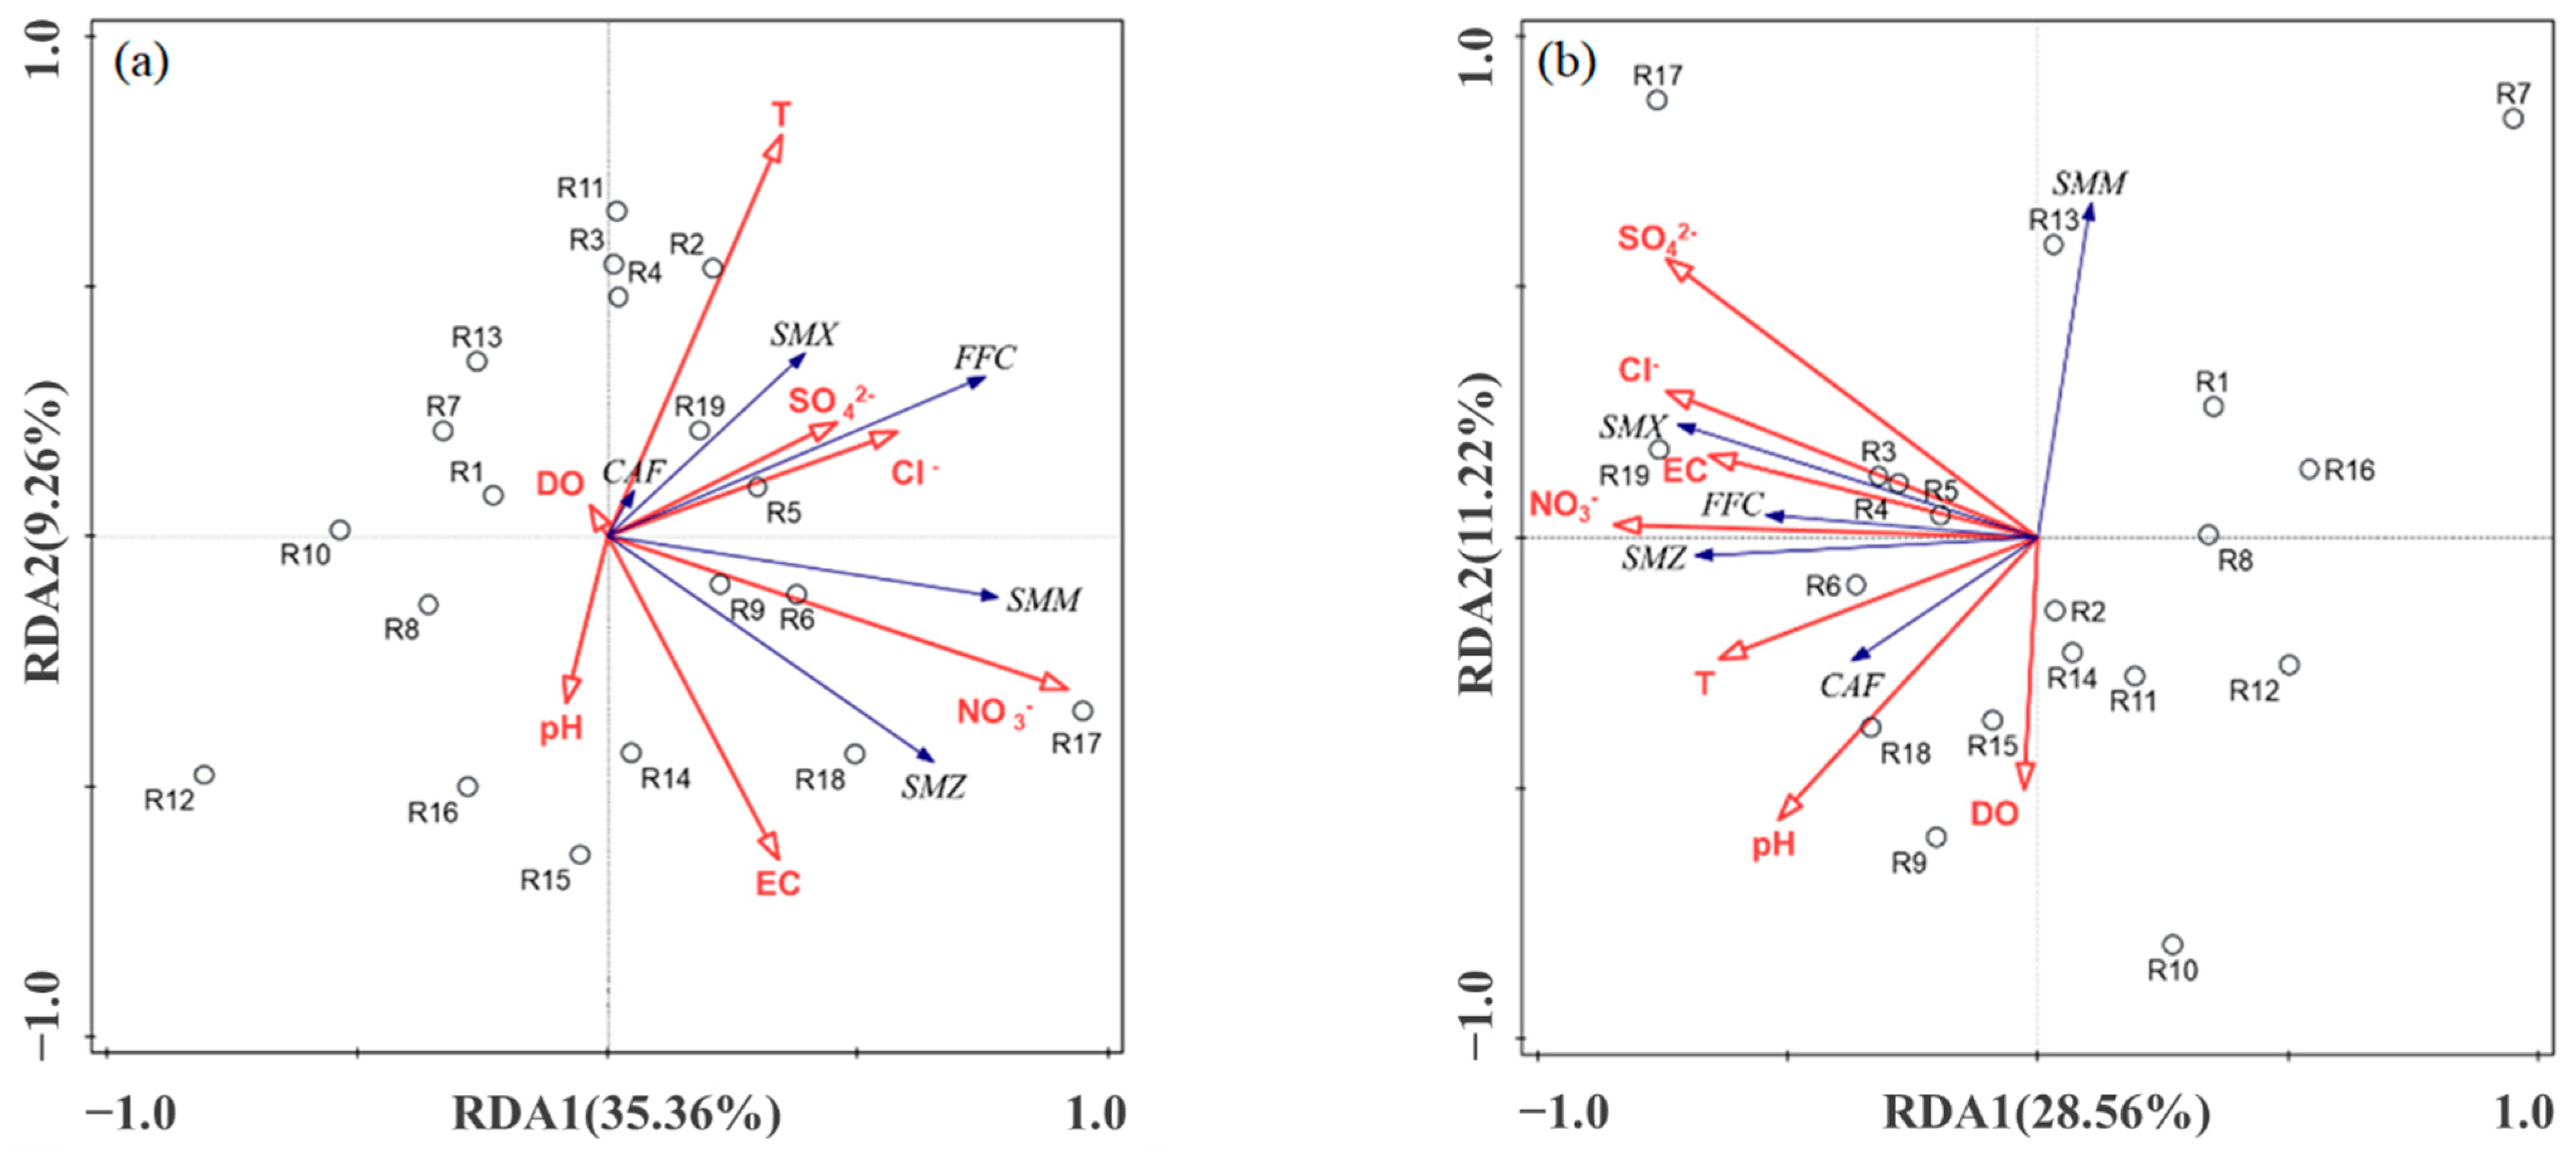
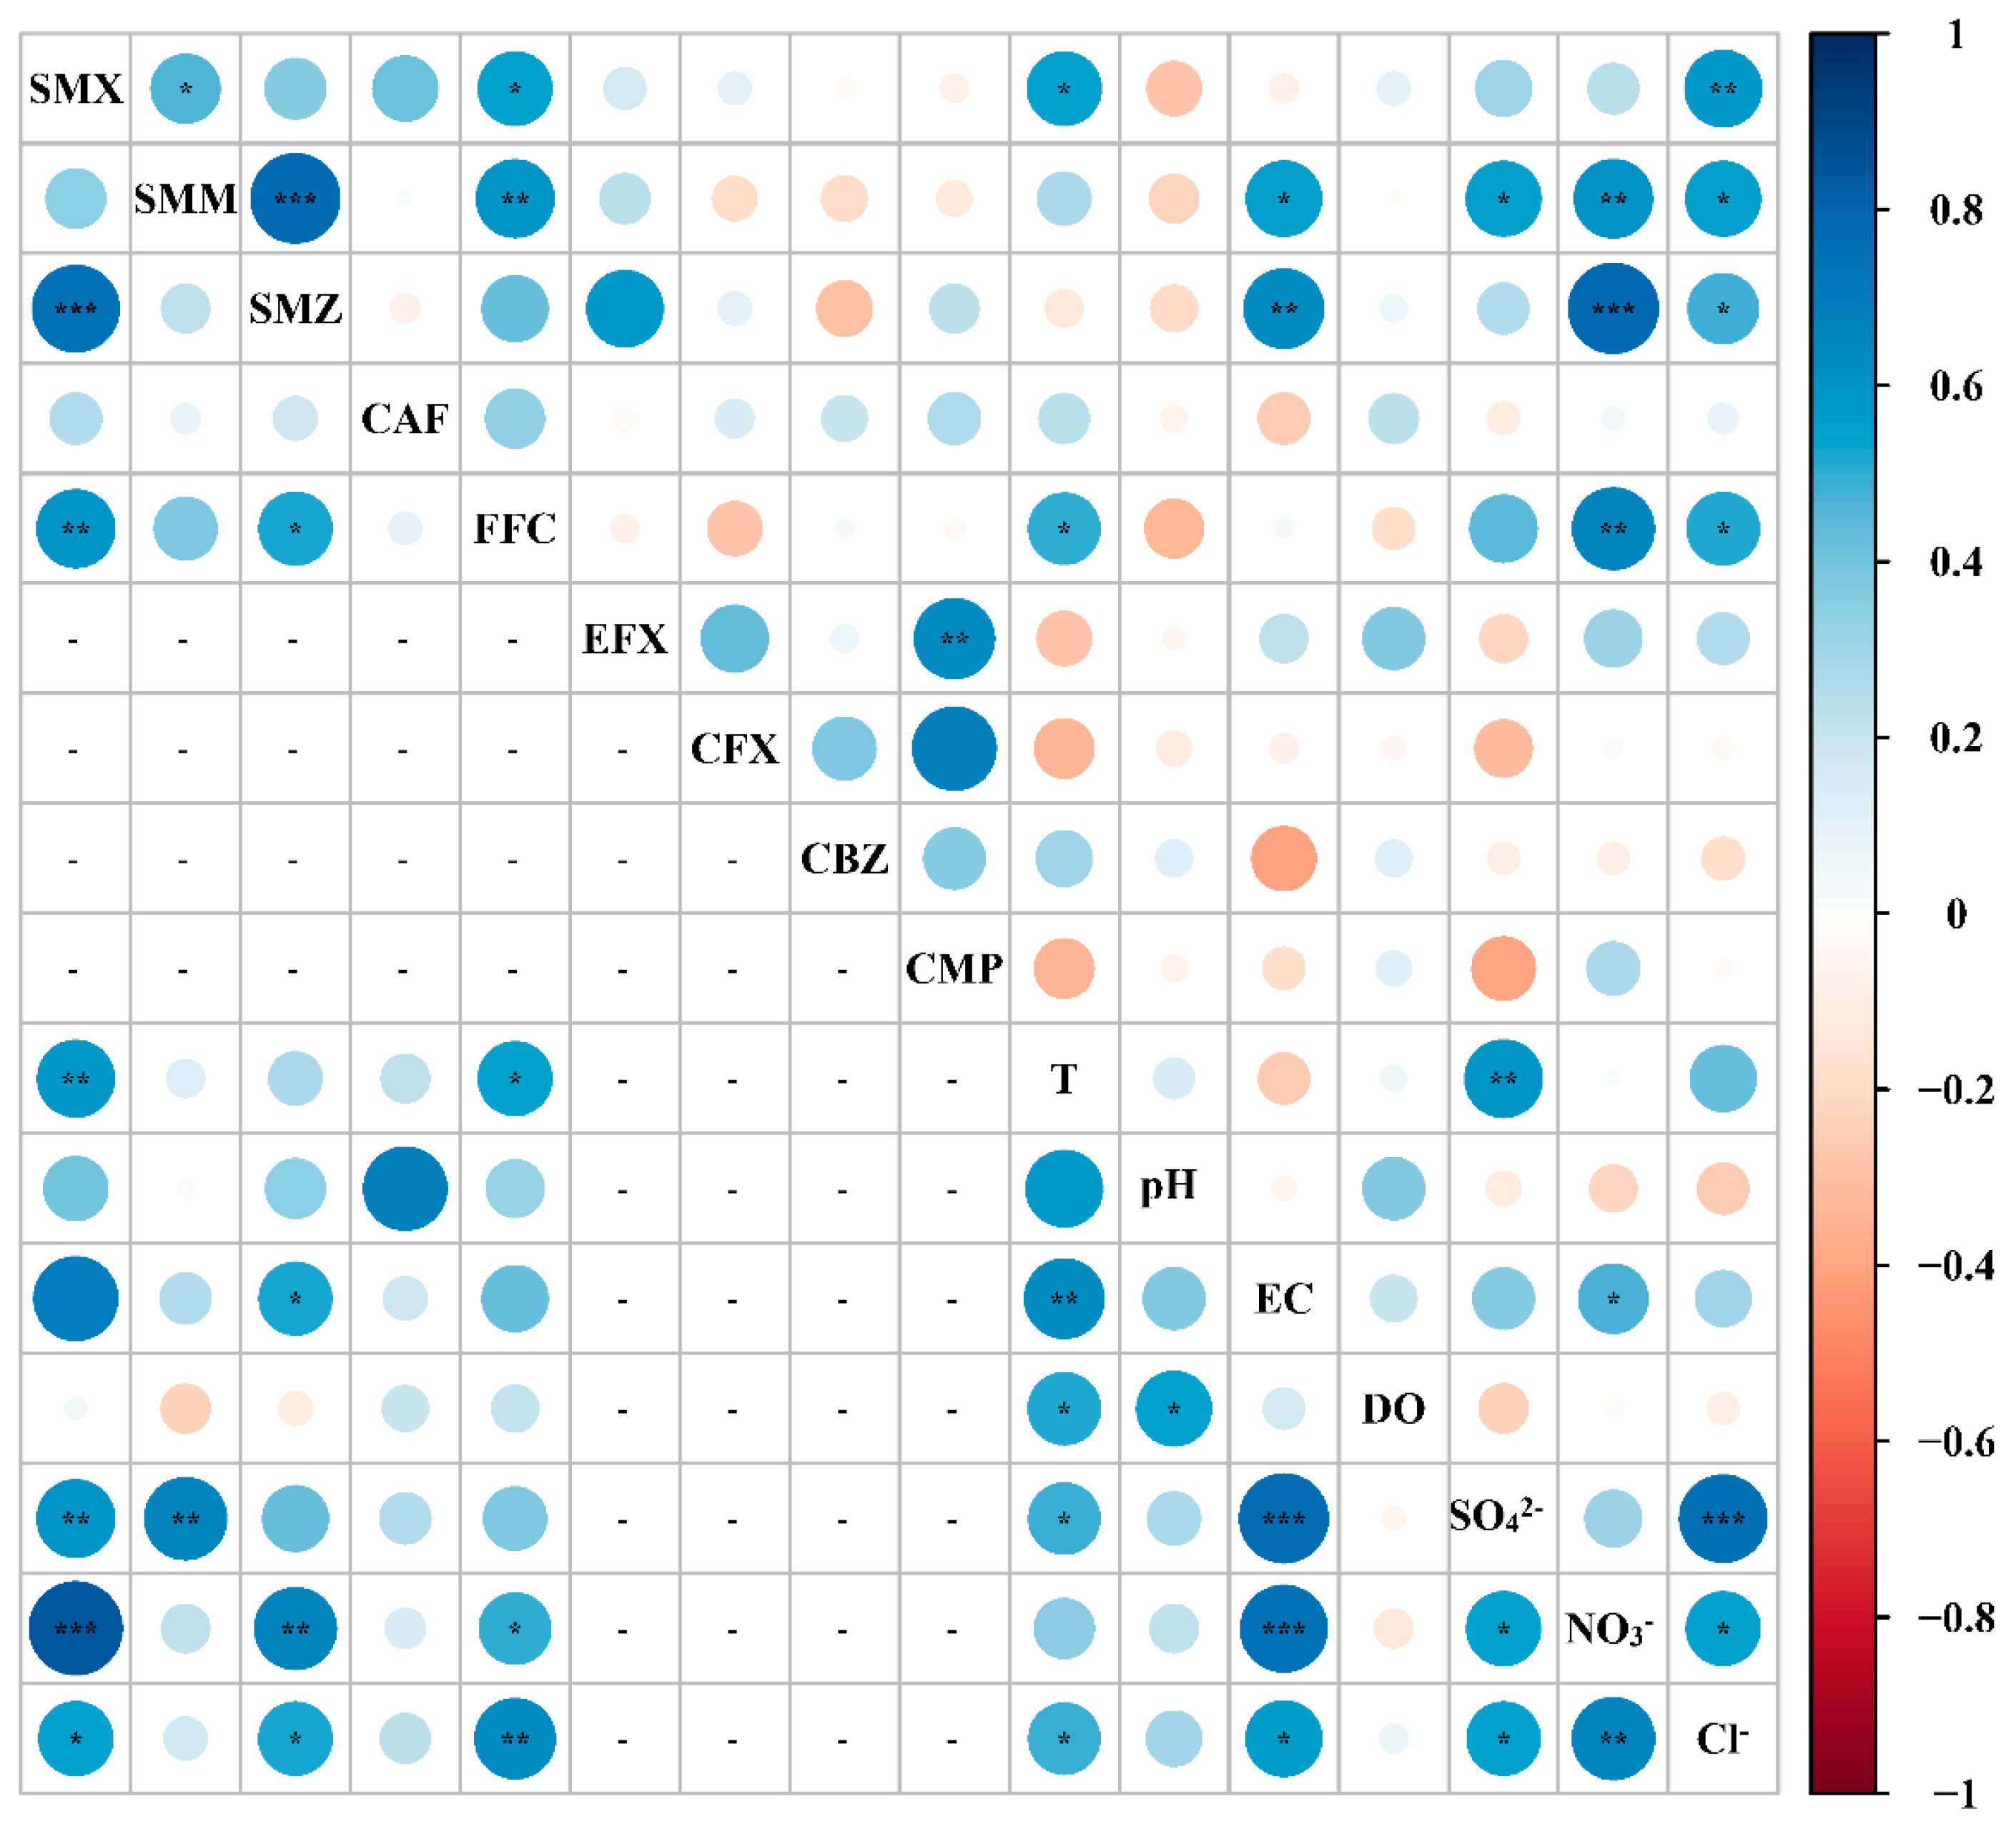
3.3. Correlation between PPCPs and Environmental Parameters

In this study, the relationship between PPCP concentrations and environmental factors in the Lianjiang River was evaluated by multivariate analysis. The length of the gradient in the first axis calculated by DCA was <3. Thus, the RDA model was selected to evaluate the potential relationship between the distribution of PPCPs and environmental parameters [14,19,52]. The RDA and Spearman’s correlation analysis results are presented in Figure 5 and Figure 6, respectively.
The high concentration of CAF in the environment, which has high removal efficiencies (80–100%) in wastewater treatment plants, indicates an untreated source of wastewater [53]. In this study, the 100% detection frequency and high concentrations of CAF are dominated by the direct discharge of domestic sewage and non-point pollution of runoff, especially during the wet season. The concentration of CAF showed a positive correlation with temperature in both seasons, suggesting that it is prone to degradation in the river environment, which is consistent with a previous study [54].
Cl, as a conservative ion and ideal indicator, will not react with other compounds, and it can only diffuse in the river system. The results indicate that SMX in water had a positive correlation with Cl in the wet season and was associated with NO3 in the dry season, indicating different sources during the wet and dry seasons.
The distribution of SMZ, SMM, and FFC showed a strong correlation with NO3 in the wet season, and SMZ and FFC were associated with NO3 in the dry season, while SMM was correlated with SO42− in the dry season, reflecting their contamination via similar sources, such as discharge from domestic sewage and aquaculture. This result is consistent with that of previous studies [52,55].
EFX, CFX, CBZ, and CMP were detected only in the wet season, and CFX, CBZ, and CMP had the highest concentrations in the same sampling point (R8), indicating that this sampling point was strongly affected by human activities. Although the detection frequency of CBZ reached 89%, its concentration was negatively correlated with EC, indicating that it had multiple sources.

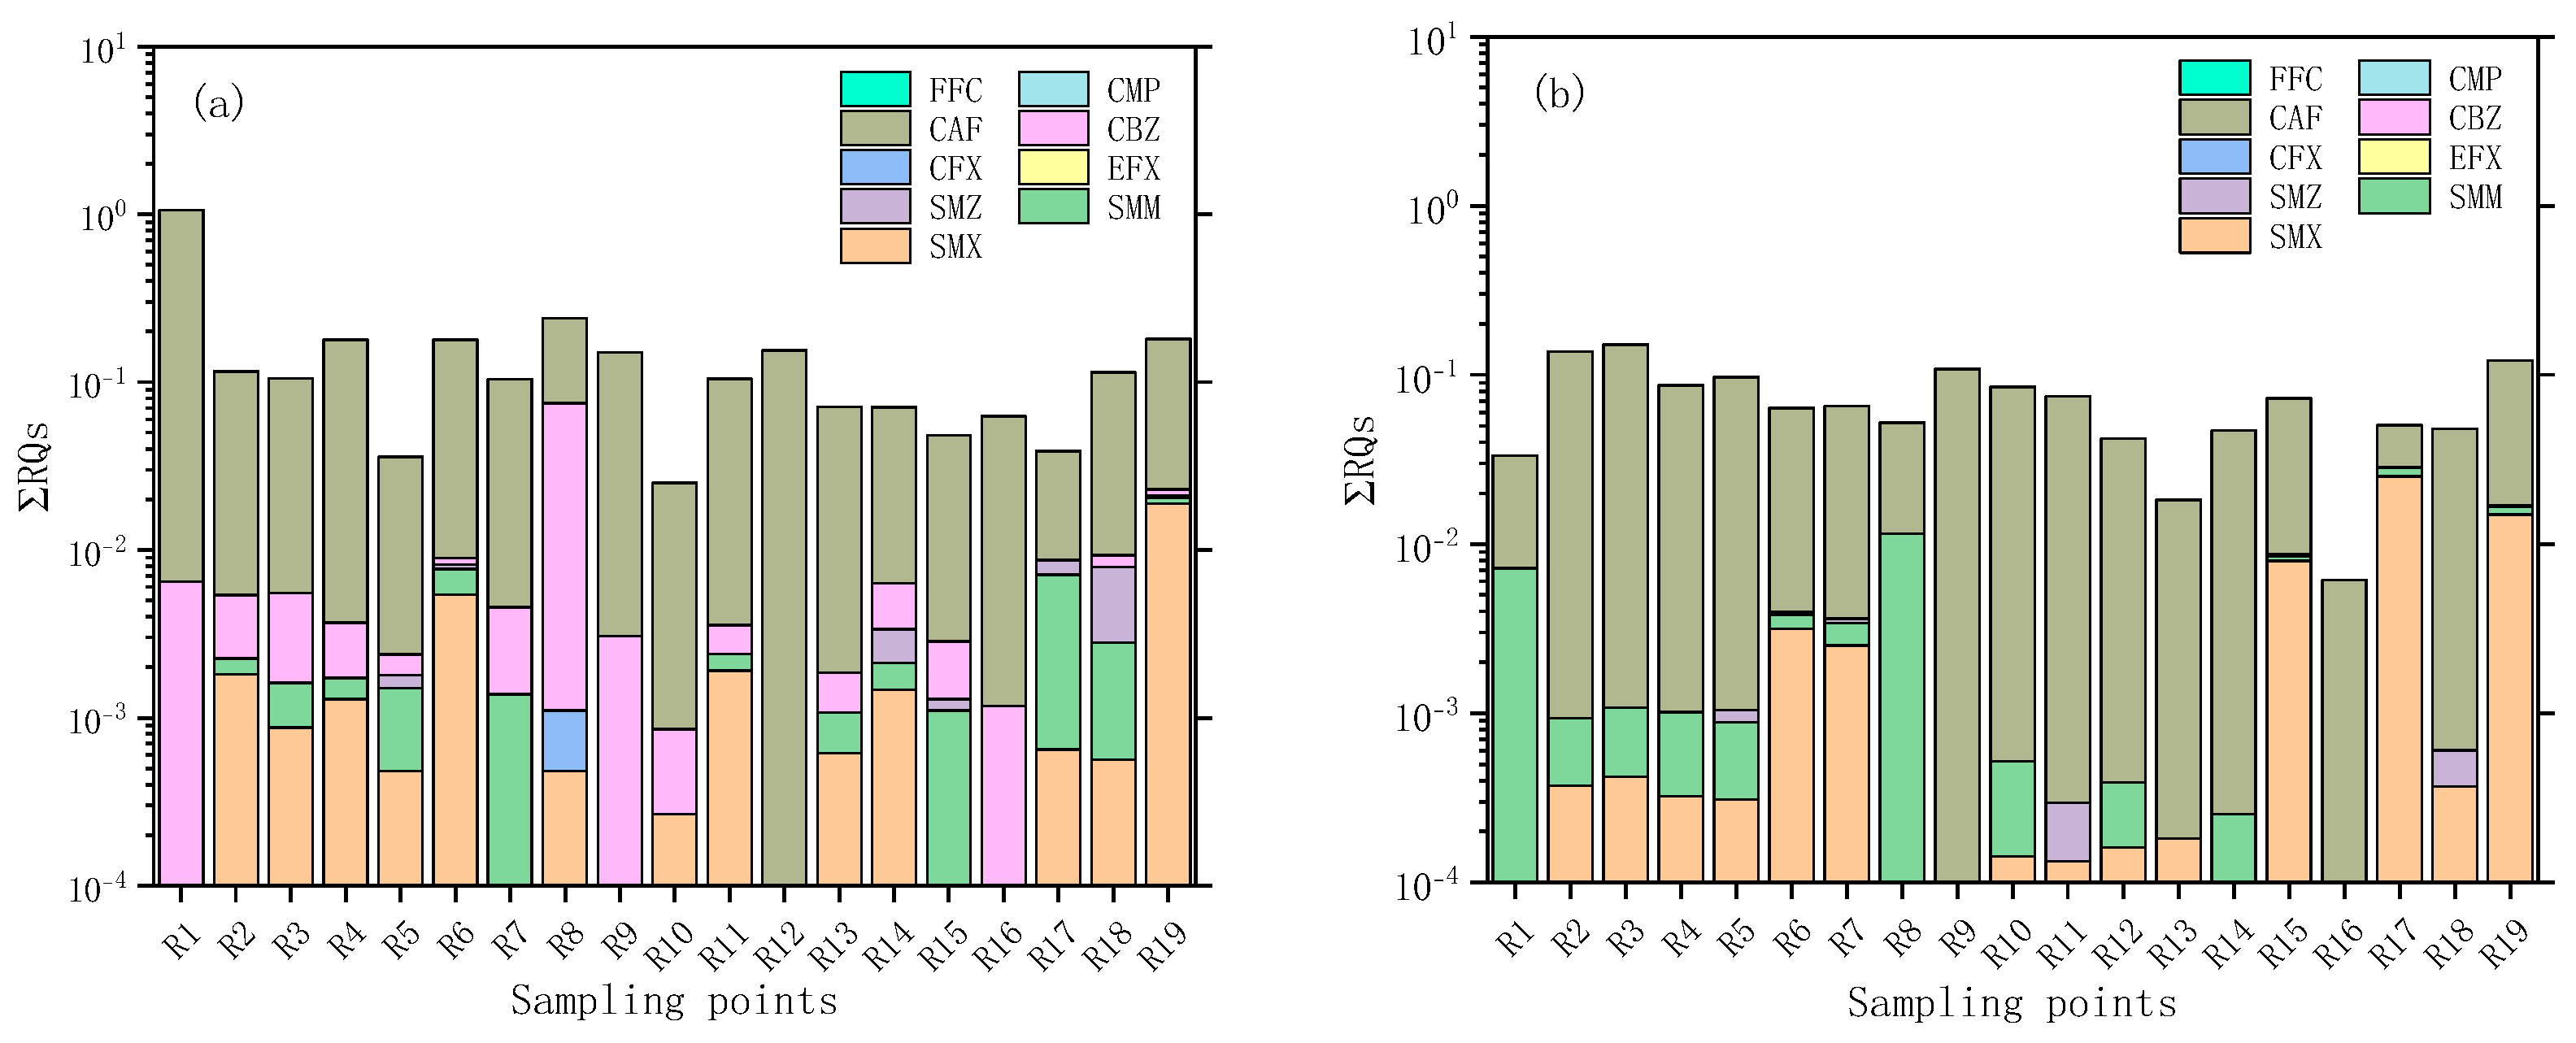
3.4. Potential Ecological Risk Assessment

Several studies have focused on the effects of PPCPs on aquatic organisms in different countries such as China [56], India [57], Pakistan [58], and Brazil [59]. Large amounts of PPCPs are present in rivers, which can accumulate in biota and contribute to greater exposure risks. Significant environmental risks due to the presence of PPCPs in different environmental matrices have been found globally [43,60].
To estimate the ecological risks of the PPCPs to aquatic organisms (green algae, daphnia, and fish), the RQ values for nine target PPCPs are shown in Figure 7a,b for different seasons in the Lianjiang River. Among the nine PPCPs detected in the Lianjiang River, CAF showed noticeably high RQ values for green algae in both seasons. The highest RQ value (high risk) for green algae was found in the upper stretch of the Lianjiang River (R1) in the wet season. Nine and four out of 19 sampling points showed moderate risks in the wet and dry seasons, respectively. The rest of the sampling points showed low risks, except sampling point (R16) in the dry season. For SMX, one (R19) and two (R17 and R19) sampling points showed low risks in the wet and dry seasons, respectively. For SMM, only one sampling point (R8) presented low risk in the dry season, and CBZ also showed low risk in the same sampling point (R8) in the wet season. The RQs of other PPCPs were less than 0.01 in both the wet and dry seasons, indicating very low or negligible toxicity to aquatic organisms. However, this long-term low concentration will also affect the functions, behaviors, metabolism, reproduction, and genotoxicity of aquatic organisms [51]. The cumulative RQ for PPCPs in an individual sampling point presented low risk due to the high weight of CAF, except sampling point R16.
In general, the sites with medium and high risk were mostly located in small tributaries mainly because the concentration of PPCPs may be diluted after entering the main stream or the amount of PPCPs discharged along the main stream is small. The true ecological risk of organisms in rivers is not the simple addition of the RQs of individual PPCP but is more likely a mixed effect, which may be a multiplication or exponential increase. Thus, the RQs of PPCPs should be carefully evaluated.

4. Conclusions

In this study, 20 PPCPs of different classes in the Lianjiang River, China, were investigated in the wet and dry seasons. The spatial distribution, seasonal variation, and the potential risk for aquatic organisms were studied. Nine of the target analytes were detected throughout the study area, with the highest concentration of CAF (815 ng L−1), followed by CFX (775 ng L–1) and FFC (690 ng L−1). Compared with the dry season, significantly higher concentrations of CBZ (p < 0.05), CAF (p = 0.023), and FFC (p = 0.022) in river water were found in the wet season probably due to higher consumption during hot summers or domestic sewage or surface soil flushing by heavy rain, resulting in higher emission. RDA indicated that the concentrations of SMM, SMX, SMZ, and FFC showed similar sources with NO3, Cl, SO42−, and CAF sources and were highly variable. Risk assessment revealed that CAF greatly contributed to the ecological risk in the whole river. This study can provide useful basic data to predict and evaluate possible pollution measures in the Lianjiang River basin in the future.

Supplementary Materials

The following supporting information can be downloaded at: https://www.mdpi.com/article/10.3390/w15061136/s1.

Author Contributions

Conceptualization, P.Z. and J.C.; methodology, Z.L. and J.W.; software, P.Z. and D.T.; validation, L.G., P.Z. and J.C.; formal analysis, Z.L. and P.Z.; investigation, Z.Y., Q.W., R.L. and S.L.; resources, J.C.; data curation, K.R.; writing—original draft preparation, P.Z.; writing—review and editing, P.Z., Z.L. and J.C.; visualization, P.Z.; supervision, J.C.; funding acquisition, J.C. All authors have read and agreed to the published version of the manuscript.

Funding

This work was financially supported by the National Natural Science Foundation of China (project nos. 41961144027 and 41771027), the Open Funding Project of the Key Laboratory of Groundwater Sciences and Engineering, the Ministry of Natural Resources (SK202102), the Scientific and Technological Innovation Project of the Water Sciences Department of Guangdong Province (2020-09), and the Asia-Pacific Network for Global Change Research (CRRP2019-09MY-Onodera).

Data Availability Statement

The data presented in this study are available on reasonable request from the corresponding author.

Conflicts of Interest

The authors declare no conflict of interest.

References

  1. Meng, Y.; Zhang, J.; Fiedler, H.; Liu, W.; Pan, T.; Cao, Z.; Zhang, T. Influence of land use type and urbanization level on the distribution of pharmaceuticals and personal care products and risk assessment in Beiyun River, China. Chemosphere 2022, 287, 132075. [Google Scholar] [CrossRef] [PubMed]
  2. Kumar, M.; Sridharan, S.; Sawarkar, A.D.; Shakeel, A.; Anerao, P.; Mannina, G.; Sharma, P.; Pandey, A. Current research trends on emerging contaminants pharmaceutical and personal care products (PPCPs): A comprehensive review. Sci. Total. Environ. 2023, 859, 160031. [Google Scholar] [CrossRef] [PubMed]
  3. Patel, M.; Kumar, R.; Kishor, K.; Mlsna, T.; Pittman, C.U., Jr.; Mohan, D. Pharmaceuticals of Emerging Concern in Aquatic Systems: Chemistry, Occurrence, Effects, and Removal Methods. Chem. Rev. 2019, 119, 3510–3673. [Google Scholar] [CrossRef] [PubMed] [Green Version]
  4. Zenker, A.; Cicero, M.R.; Prestinaci, F.; Bottoni, P.; Carere, M. Bioaccumulation and biomagnification potential of pharmaceuticals with a focus to the aquatic environment. J. Environ. Manag. 2014, 133, 378–387. [Google Scholar] [CrossRef] [PubMed]
  5. Rehman, M.S.U.; Rashid, N.; Ashfaq, M.; Saif, A.; Ahmad, N.; Han, J.-I. Global risk of pharmaceutical contamination from highly populated developing countries. Chemosphere 2015, 138, 1045–1055. [Google Scholar] [CrossRef]
  6. Zheng, Q.; Zhang, R.; Wang, Y.; Pan, X.; Tang, J.; Zhang, G. Occurrence and distribution of antibiotics in the Beibu Gulf, China: Impacts of river discharge and aquaculture activities. Mar. Environ. Res. 2012, 78, 26–33. [Google Scholar] [CrossRef]
  7. Singh, V.; Suthar, S. Occurrence, seasonal variation, mass loading and fate of pharmaceuticals and personal care products (PPCPs) in sewage treatment plants in cities of upper Ganges bank, India. J. Water Process. Eng. 2021, 44, 102399. [Google Scholar] [CrossRef]
  8. Chang, X.; Meyer, M.T.; Liu, X.; Zhao, Q.; Chen, H.; Chen, J.-A.; Qiu, Z.; Yang, L.; Cao, J.; Shu, W. Determination of antibiotics in sewage from hospitals, nursery and slaughter house, wastewater treatment plant and source water in Chongqing region of Three Gorge Reservoir in China. Environ. Pollut. 2010, 158, 1444–1450. [Google Scholar] [CrossRef]
  9. Kosma, C.I.; Lambropoulou, D.A.; Albanis, T.A. Occurrence and removal of PPCPs in municipal and hospital wastewaters in Greece. J. Hazard. Mater. 2010, 179, 804–817. [Google Scholar] [CrossRef]
  10. Zhu, S.; Chen, H.; Li, J. Sources, distribution and potential risks of pharmaceuticals and personal care products in Qingshan Lake basin, Eastern China. Ecotoxicol. Environ. Saf. 2013, 96, 154–159. [Google Scholar] [CrossRef]
  11. Anumol, T.; Vijayanandan, A.; Park, M.; Philip, L.; Snyder, S.A. Occurrence and fate of emerging trace organic chemicals in wastewater plants in Chennai, India. Environ. Int. 2016, 92–93, 33–42. [Google Scholar] [CrossRef]
  12. Ebele, A.J.; Oluseyi, T.; Drage, D.S.; Harrad, S.; Abdallah, M.A.-E. Occurrence, seasonal variation and human exposure to pharmaceuticals and personal care products in surface water, groundwater and drinking water in Lagos State, Nigeria. Emerg. Contam. 2020, 6, 124–132. [Google Scholar] [CrossRef]
  13. Zhao, F.; Chen, L.; Yang, L.; Sun, L.; Li, S.; Li, M.; Feng, Q. Effects of land use and rainfall on sequestration of veterinary antibiotics in soils at the hillslope scale. Environ. Pollut. 2020, 260, 114112. [Google Scholar] [CrossRef] [PubMed]
  14. Li, S.; Shi, W.; Li, H.; Xu, N.; Zhang, R.; Chen, X.; Sun, W.; Wen, D.; He, S.; Pan, J.; et al. Antibiotics in water and sediments of rivers and coastal area of Zhuhai City, Pearl River estuary, south China. Sci. Total. Environ. 2018, 636, 1009–1019. [Google Scholar] [CrossRef] [PubMed]
  15. Yuan, X.; Hu, J.; Li, S.; Yu, M. Occurrence, fate, and mass balance of selected pharmaceutical and personal care products (PPCPs) in an urbanized river. Environ. Pollut. 2020, 266, 115340. [Google Scholar] [CrossRef]
  16. Zhao, X.; Zheng, Y.; Hu, S.; Qiu, W.; Jiang, J.; Gao, C.; Xiong, J.; Lu, H.; Quan, F. Improving urban drainage systems to mitigate PPCPs pollution in surface water: A watershed perspective. J. Hazard. Mater. 2021, 411, 125047. [Google Scholar] [CrossRef]
  17. Noutsopoulos, C.; Koumaki, E.; Sarantopoulos, V.; Mamais, D. Analytical and mathematical assessment of emerging pollutants fate in a river system. J. Hazard. Mater. 2019, 364, 48–58. [Google Scholar] [CrossRef] [PubMed]
  18. Zhou, L.-J.; Li, J.; Zhang, Y.; Kong, L.; Jin, M.; Yang, X.; Wu, Q.L. Trends in the occurrence and risk assessment of antibiotics in shallow lakes in the lower-middle reaches of the Yangtze River basin, China. Ecotoxicol. Environ. Saf. 2019, 183, 109511. [Google Scholar] [CrossRef]
  19. Chen, H.; Liu, S.; Xu, X.-R.; Zhou, G.-J.; Liu, S.-S.; Yue, W.-Z.; Sun, K.-F.; Ying, G.-G. Antibiotics in the coastal environment of the Hailing Bay region, South China Sea: Spatial distribution, source analysis and ecological risks. Mar. Pollut. Bull. 2015, 95, 365–373. [Google Scholar] [CrossRef]
  20. Hartmann, A.; Goldscheider, N.; Wagener, T.; Lange, J.; Weiler, M. Karst water resources in a changing world: Review of hydrological modeling approaches. Rev. Geophys. 2014, 52, 218–242. [Google Scholar] [CrossRef]
  21. Reberski, J.L.; Terzić, J.; Maurice, L.D.; Lapworth, D.J. Emerging organic contaminants in karst groundwater: A global level assessment. J. Hydrol. 2022, 604, 127242. [Google Scholar] [CrossRef]
  22. Hillebrand, O.; Nödler, K.; Licha, T.; Sauter, M.; Geyer, T. Caffeine as an indicator for the quantification of untreated wastewater in karst systems. Water Res. 2012, 46, 395–402. [Google Scholar] [CrossRef] [PubMed]
  23. Peng, Y.; Fang, W.; Krauss, M.; Brack, W.; Wang, Z.; Li, F.; Zhang, X. Screening hundreds of emerging organic pollutants (EOPs) in surface water from the Yangtze River Delta (YRD): Occurrence, distribution, ecological risk. Environ. Pollut. 2018, 241, 484–493. [Google Scholar] [CrossRef] [PubMed]
  24. Cui, J.; Fu, L.; Tang, B.; Bin, L.; Li, P.; Huang, S.; Fu, F. Occurrence, ecotoxicological risks of sulfonamides and their acetylated metabolites in the typical wastewater treatment plants and receiving rivers at the Pearl River Delta. Sci. Total. Environ. 2020, 709, 136192. [Google Scholar] [CrossRef] [PubMed]
  25. Ginebreda, A.; Muñoz, I.; de Alda, M.L.; Brix, R.; López-Doval, J.; Barceló, D. Environmental risk assessment of pharmaceuticals in rivers: Relationships between hazard indexes and aquatic macroinvertebrate diversity indexes in the Llobregat River (NE Spain). Environ. Int. 2010, 36, 153–162. [Google Scholar] [CrossRef]
  26. Lei, K.; Zhu, Y.; Chen, W.; Pan, H.-Y.; Cao, Y.-X.; Zhang, X.; Guo, B.-B.; Sweetman, A.; Lin, C.-Y.; Ouyang, W.; et al. Spatial and seasonal variations of antibiotics in river waters in the Haihe River Catchment in China and ecotoxicological risk assessment. Environ. Int. 2019, 130, 104919. [Google Scholar] [CrossRef]
  27. Yang, S.; Zhao, W.; Pereira, P. Determinations of environmental factors on interactive soil properties across different land-use types on the Loess Plateau, China. Sci. Total. Environ. 2020, 738, 140270. [Google Scholar] [CrossRef]
  28. Zhang, R.; Gu, J.; Wang, X.; Li, Y.; Zhang, K.; Yin, Y.; Zhang, X. Contributions of the microbial community and environmental variables to antibiotic resistance genes during co-composting with swine manure and cotton stalks. J. Hazard. Mater. 2018, 358, 82–91. [Google Scholar] [CrossRef]
  29. Singh, V.; Suthar, S. Occurrence, seasonal variations, and ecological risk of pharmaceuticals and personal care products in River Ganges at two holy cities of India. Chemosphere 2021, 268, 129331. [Google Scholar] [CrossRef]
  30. Lu, S.; Wang, B.; Xin, M.; Wang, J.; Gu, X.; Lian, M.; Li, Y.; Lin, C.; Ouyang, W.; Liu, X.; et al. Insights into the spatiotemporal occurrence and mixture risk assessment of household and personal care products in the waters from rivers to Laizhou Bay, southern Bohai Sea. Sci. Total. Environ. 2022, 810, 152290. [Google Scholar] [CrossRef]
  31. Yan, C.; Yang, Y.; Zhou, J.; Liu, M.; Nie, M.; Shi, H.; Gu, L. Antibiotics in the surface water of the Yangtze Estuary: Occurrence, distribution and risk assessment. Environ. Pollut. 2013, 175, 22–29. [Google Scholar] [CrossRef] [PubMed]
  32. Sebastião, A.M.; Ribeiro, J.A. Tuning and Fine-Tuning of Synapses with Adenosine. Curr. Neuropharmacol. 2009, 7, 180–194. [Google Scholar] [CrossRef] [PubMed] [Green Version]
  33. Korekar, G.; Kumar, A.; Ugale, C. Occurrence, fate, persistence and remediation of caffeine: A review. Environ. Sci. Pollut. Res. 2020, 27, 34715–34733. [Google Scholar] [CrossRef] [PubMed]
  34. Ben, W.; Zhu, B.; Yuan, X.; Zhang, Y.; Yang, M.; Qiang, Z. Occurrence, removal and risk of organic micropollutants in wastewater treatment plants across China: Comparison of wastewater treatment processes. Water Res. 2018, 130, 38–46. [Google Scholar] [CrossRef] [PubMed]
  35. Loos, R.; Carvalho, R.; António, D.C.; Comero, S.; Locoro, G.; Tavazzi, S.; Paracchini, B.; Ghiani, M.; Lettieri, T.; Blaha, L.; et al. EU-wide monitoring survey on emerging polar organic contaminants in wastewater treatment plant effluents. Water Res. 2013, 47, 6475–6487. [Google Scholar] [CrossRef] [PubMed]
  36. Wang, C.; Lu, Y.; Wang, C.; Xiu, C.; Cao, X.; Zhang, M.; Song, S. Distribution and ecological risks of pharmaceuticals and personal care products with different anthropogenic stresses in a coastal watershed of China. Chemosphere 2022, 303, 135176. [Google Scholar] [CrossRef]
  37. Vulin, I.; Tenji, D.; Teodorovic, I.; Kaisarevic, S. Assessment of caffeine neurotoxicity using novel biomarkers of neural function in SH-SY5Y cells—Is there a need for environmental concern? Chem. Interactions 2022, 365, 110082. [Google Scholar] [CrossRef]
  38. Dodgen, L.; Kelly, W.; Panno, S.; Taylor, S.; Armstrong, D.; Wiles, K.; Zhang, Y.; Zheng, W. Characterizing pharmaceutical, personal care product, and hormone contamination in a karst aquifer of southwestern Illinois, USA, using water quality and stream flow parameters. Sci. Total. Environ. 2017, 578, 281–289. [Google Scholar] [CrossRef]
  39. Sun, Q.; Li, Y.; Li, M.; Ashfaq, M.; Lv, M.; Wang, H.; Hu, A.; Yu, C.-P. PPCPs in Jiulong River estuary (China): Spatiotemporal distributions, fate, and their use as chemical markers of wastewater. Chemosphere 2016, 150, 596–604. [Google Scholar] [CrossRef] [Green Version]
  40. Mastrolorenzo, A.; Scozzafava, A.; Supuran, C.T. Antifungal activity of silver and zinc complexes of sulfadrug derivatives incorporating arylsulfonylureido moieties. Eur. J. Pharm. Sci. 2000, 11, 99–107. [Google Scholar] [CrossRef]
  41. Xie, J.; Liu, Y.; Wu, Y.; Li, L.; Fang, J.; Lu, X. Occurrence, distribution and risk of pharmaceutical and personal care products in the Haihe River sediments, China. Chemosphere 2022, 302, 134874. [Google Scholar] [CrossRef] [PubMed]
  42. Xu, M.; Huang, H.; Li, N.; Li, F.; Wang, D.; Luo, Q. Occurrence and ecological risk of pharmaceuticals and personal care products (PPCPs) and pesticides in typical surface watersheds, China. Ecotoxicol. Environ. Saf. 2019, 175, 289–298. [Google Scholar] [CrossRef] [PubMed]
  43. Yang, L.; Wang, T.; Zhou, Y.; Shi, B.; Bi, R.; Meng, J. Contamination, source and potential risks of pharmaceuticals and personal products (PPCPs) in Baiyangdian Basin, an intensive human intervention area, China. Sci. Total. Environ. 2021, 760, 144080. [Google Scholar] [CrossRef] [PubMed]
  44. Yao, B.; Yan, S.; Lian, L.; Yang, X.; Wan, C.; Dong, H.; Song, W. Occurrence and indicators of pharmaceuticals in Chinese streams: A nationwide study. Environ. Pollut. 2018, 236, 889–898. [Google Scholar] [CrossRef]
  45. Wang, J.; Wang, X.; Zheng, X.; Yang, Y.; He, Z.; Zhang, L.; Liao, Q. Effects of florfenicol on methane accumulation and changes in the structure of the prokaryotic community in a water–sediment system. Sci. Total. Environ. 2022, 847, 157444. [Google Scholar] [CrossRef]
  46. Kondor, A.C.; Jakab, G.; Vancsik, A.; Filep, T.; Szeberényi, J.; Szabó, L.; Maász, G.; Ferincz, Á.; Dobosy, P.; Szalai, Z. Occurrence of pharmaceuticals in the Danube and drinking water wells: Efficiency of riverbank filtration. Environ. Pollut. 2020, 265, 114893. [Google Scholar] [CrossRef]
  47. van Driezum, I.H.; Derx, J.; Oudega, T.J.; Zessner, M.; Naus, F.L.; Saracevic, E.; Kirschner, A.K.T.; Sommer, R.; Farnleitner, A.H.; Blaschke, A.P. Spatiotemporal resolved sampling for the interpretation of micropollutant removal during riverbank filtration. Sci. Total Environ. 2019, 649, 212–223. [Google Scholar] [CrossRef]
  48. Zhang, P.-W.; Zhou, H.-D.; Zhao, G.-F.; Li, K.; Liu, Q.-N.; Ren, M.; Zhao, D.-D.; Li, D.-J. Spatial, temporal distribution characteristics and potential risk of PPCPs in surface sediments from Taihu Lake. Huanjing Kexue/Environ. Sci. 2016, 37, 3348–3355. [Google Scholar] [CrossRef]
  49. Letsinger, S.; Kay, P.; Rodríguez-Mozaz, S.; Villagrassa, M.; Barceló, D.; Rotchell, J.M. Spatial and temporal occurrence of pharmaceuticals in UK estuaries. Sci. Total. Environ. 2019, 678, 74–84. [Google Scholar] [CrossRef] [Green Version]
  50. Gopal, C.M.; Bhat, K.; Ramaswamy, B.R.; Kumar, V.; Singhal, R.K.; Basu, H.; Udayashankar, H.N.; Vasantharaju, S.G.; Praveenkumarreddy, Y.; Shailesh; et al. Seasonal occurrence and risk assessment of pharmaceutical and personal care products in Bengaluru rivers and lakes, India. J. Environ. Chem. Eng. 2021, 9, 105610. [Google Scholar] [CrossRef]
  51. Kumar, M.; Kuroda, K.; Barcelo, D.; Furumai, H. Monsoon dilutes the concurrence but increases the correlation of viruses and Pharmaceuticals and Personal Care Products (PPCPs) in the urban waters of Guwahati, India: The context of pandemic viruses. Sci. Total. Environ. 2022, 813, 152282. [Google Scholar] [CrossRef] [PubMed]
  52. Wang, Z.; Du, Y.; Yang, C.; Liu, X.; Zhang, J.; Li, E.; Zhang, Q.; Wang, X. Occurrence and ecological hazard assessment of selected antibiotics in the surface waters in and around Lake Honghu, China. Sci. Total. Environ. 2017, 609, 1423–1432. [Google Scholar] [CrossRef] [PubMed]
  53. Dai, G.; Wang, B.; Huang, J.; Dong, R.; Deng, S.; Yu, G. Occurrence and source apportionment of pharmaceuticals and personal care products in the Beiyun River of Beijing, China. Chemosphere 2015, 119, 1033–1039. [Google Scholar] [CrossRef] [PubMed]
  54. Sui, Q.; Huang, J.; Deng, S.; Yu, G.; Fan, Q. Occurrence and removal of pharmaceuticals, caffeine and DEET in wastewater treatment plants of Beijing, China. Water Res. 2010, 44, 417–426. [Google Scholar] [CrossRef]
  55. Li, S.; Ju, H.; Zhang, J.; Chen, P.; Ji, M.; Ren, J.; Zhao, S. Occurrence and distribution of selected antibiotics in the surface waters and ecological risk assessment based on the theory of natural disaster. Environ. Sci. Pollut. Res. 2019, 26, 28384–28400. [Google Scholar] [CrossRef]
  56. Shen, Q.-C.; Wang, D.-D.; Qu, Y.-Y.; Zhang, J.; Zhang, X.-Q. Occurrence, transport and environmental risk assessment of pharmaceuticals and personal care products (PPCPs) at the mouth of Jiaozhou Bay, China based on stir bar sorptive extraction. Mar. Pollut. Bull. 2022, 184, 114130. [Google Scholar] [CrossRef]
  57. Sengar, A.; Vijayanandan, A. Human health and ecological risk assessment of 98 pharmaceuticals and personal care products (PPCPs) detected in Indian surface and wastewaters. Sci. Total. Environ. 2022, 807, 150677. [Google Scholar] [CrossRef]
  58. Ashfaq, M.; Li, Y.; Rehman, M.S.U.; Zubair, M.; Mustafa, G.; Nazar, M.F.; Yu, C.-P.; Sun, Q. Occurrence, spatial variation and risk assessment of pharmaceuticals and personal care products in urban wastewater, canal surface water, and their sediments: A case study of Lahore, Pakistan. Sci. Total. Environ. 2019, 688, 653–663. [Google Scholar] [CrossRef]
  59. Chaves, M.D.J.S.; Barbosa, S.C.; Malinowski, M.D.M.; Volpato, D.; Castro, B.; Franco, T.C.R.D.S.; Primel, E.G. Pharmaceuticals and personal care products in a Brazilian wetland of international importance: Occurrence and environmental risk assessment. Sci. Total. Environ. 2020, 734, 139374. [Google Scholar] [CrossRef]
  60. Xie, H.; Hao, H.; Xu, N.; Liang, X.; Gao, D.; Xu, Y.; Gao, Y.; Tao, H.; Wong, M. Pharmaceuticals and personal care products in water, sediments, aquatic organisms, and fish feeds in the Pearl River Delta: Occurrence, distribution, potential sources, and health risk assessment. Sci. Total. Environ. 2019, 659, 230–239. [Google Scholar] [CrossRef]
Figure 1. Map of the Lianjiang River (LJR) and the locations of the sampling points, the red area is Guangdong province.
Water 15 01136 g001
Figure 2. The average concentration (column) and detection frequencies (blue points) of detected PPCPs in the river during the wet (black column) and dry (red column) seasons.
Water 15 01136 g002
Figure 3. The accumulation concentration of PPCPs in the Lianjiang River in the wet and dry seasons, the red area is Guangdong province.
Water 15 01136 g003
Figure 4. The concentrations (a) and relative abundances (b) of different PPCPs among the wet and dry seasons in the Lianjiang River. The IQR represents the interquartile range (25% to 75%).
Water 15 01136 g004
Figure 5. Redundancy analysis results showing the relationships between PPCPs (blue arrows) and environmental factors (red arrows) in the Lianjiang River in the wet season (a) and the dry season (b), the empty circles represent the sampling points.
Water 15 01136 g005
Figure 6. Spearman correlations among selected PPCPs and environmental parameters. The darker blue color indicates stronger positive correlation, and the darker red color indicates stronger negative correlation, * p < 0.05, ** p < 0.01, *** p < 0.001, FDR corrected (lower and left triangle: the dry season; upper and right triangle: the wet season). The larger the size of the circle, the greater the absolute value of the correlation coefficient, and vice versa. ”-” represents no data.
Water 15 01136 g006
Figure 7. The calculated risk quotients (RQs) for PPCPs in Lianjiang River water during the wet (a) and dry (b) seasons. The maximum concentrations among the samples were used to calculate the RQs. Insignificant ecological risk (RQs < 0.01), low risk (RQs < 0.1), moderate risk (0.1 < RQs < 1), and high risk (RQs > 1).
Water 15 01136 g007
Table 1. The EC or LC of PPCPs to aquatic organisms.
CompoundAbbreviationGreen Algae (EC)
(mg/L)
Daphnia (LC)
(mg/L)
Fish (LC)
(mg/L)
SulfamethoxazoleSMX6.621.87410.76
SulfamonomethoxineSMM8.771.202351.88
SulfamethazineSMZ6.262.05291.39
EnrofloxacinEFX561.23504.574922.63
CiprofloxacinCFX1621.631240.4313,131.42
CarbamazepineCBZ0.2614.9041.33
CaffeineCAF0.7711.93111.50
ChloramphenicolCMP185.31643.46883.29
FlorfenicolFFC912.554570.406764.04
Table 2. (a) The descriptive analysis of overall PPCP concentration data of the Lianjiang River in the dry season; PPCP concentration is given in ng L−1. (b) The descriptive analysis of overall PPCP concentration data of the Lianjiang River in the wet season; PPCP concentration is given in ng L−1.
(a)
CompoundAbbreviationRangeMedianMeanFrequency (%)
SulfamethoxazoleSMXND–47.150.585.5474
SulfamonomethoxineSMMND–13.80.671.8174
SulfamethazineSMZND–0.5800.1942
EnrofloxacinEFXND000
CiprofloxacinCFXND000
CarbamazepineCBZND000
CaffeineCAF4.7–115.547.751.76100
ChloramphenicolCMPND000
FlorfenicolFFCND–74.54.9911.2189
(b)
CompoundAbbreviationRangeMedianMeanFrequency (%)
SulfamethoxazoleSMXND–35.251.13.4168
SulfamonomethoxineSMMND–7.750.61.2268
SulfamethazineSMZND–10.501.0240
EnrofloxacinEFXND–3.7400.3111
CiprofloxacinCFXND–775041.2511
CarbamazepineCBZND–18.90.41.4689
CaffeineCAF18.7–81578116.6100
ChloramphenicolCMPND–3.4300.2921
FlorfenicolFFCND–6902875.6895
ND—not detectable.
Disclaimer/Publisher’s Note: The statements, opinions and data contained in all publications are solely those of the individual author(s) and contributor(s) and not of MDPI and/or the editor(s). MDPI and/or the editor(s) disclaim responsibility for any injury to people or property resulting from any ideas, methods, instructions or products referred to in the content.

