Article

Mining Leachates Effect on the Hydraulic Performance of Geosynthetic Clay Liners under Different Temperatures

1
School of Earth Sciences and Spatial Information Engineering, Hunan University of Science and Technology, Xiangtan 411201, China
2
Hunan Geological Disaster Monitoring, Early Warning and Emergency Rescue Engineering Technology Research Center, Changsha 410004, China
*
Author to whom correspondence should be addressed.
Water 2023, 15(6), 1132; https://doi.org/10.3390/w15061132
Submission received: 23 February 2023 / Revised: 10 March 2023 / Accepted: 12 March 2023 / Published: 15 March 2023
(This article belongs to the Special Issue Risk Management Technologies for Deep Excavations in Water-Rich Areas)

Abstract

:
Geosynthetic clay liners (GCLs) are often used as anti-seepage systems in landfills and at the bottom of tailing ponds. The anti-seepage performance of GCL will change under different temperatures. In this study, bentonite was mixed with test solutions at different temperatures to measure the basic performance indexes of bentonite components and analyze the permeability. The composition and micro-structure of bentonite at different temperatures were analyzed by X-ray diffraction, X-ray fluorescence spectrum, and SEM, and the change rule of permeability property with the mine leachates at different temperatures was understood by combining the macro-measured parameters with the microscopic analysis results. The research results indicate that the fluid loss of two bentonites increased with the increasing temperature due to the inhibition of ion exchange between bentonite and mixture by the increased temperature. The swelling index of the bentonite increased at high temperatures. The micro-structure analysis showed the increase of the pore size attributed to high temperature, and the uneven distribution of the pore size resulted in the increase of the intrinsic permeability. The study would provide the reference for the application of GCL in mining.

1. Introduction

There are various and large nonferrous metal mines in Hunan province. During the mining process, large amounts of tailings and mineral waste residue pollute the groundwater and soil. Agentia, such as foaming agent, inhibitor, conditioning agent, and flocculant, would be added in a beneficiation process [1,2,3,4,5,6]. These mining leachates are stored in the tailing impoundment; therefore, heavy metal pollutants and chemical agents are in the tailings. The mining leachates flowing into the groundwater system and soil affect crop growth and the people’s health [7,8,9,10,11,12]; therefore, the tailing impoundment should establish an anti-seepage system to prevent seepage of the leachates.
The geosynthetic clay liner (GCL) is an industrial product that has very low permeability and greater freeze–thaw cycle resistance [13,14,15,16]. Due to its easy transportation and low cost, GCL has been widely used in the anti-seepage systems of railways, roads, etc., and the cover or bottom layer for the tailings and landfills [17,18,19,20]. The low permeability of GCL is due mainly to the swelling of its bentonite component. All the tests in the study are conducted primarily on the bentonite component.
Temperature has great influence on the impermeability of GCL, and the reaction between the metallic cations in the mining leachates and the acidic or alkaline solution release heat; thus, the increased temperature may affect the hydraulic properties of GCL [20,21,22,23].
The bentonite component of GCL absorbs a lot of water from the soil at the time landfill construction, and the ambient temperature around GCL in landfills can reach 55 °C or higher, which greatly reduces the amount of water absorbed by the bentonite component [24,25,26,27]. However, at room temperature, the water content of bentonite reaches more than 100%. Therefore, the high temperature generated in the natural environment will have a negative impact on the hydraulic performance of GCL [28,29,30]. The decrease of water absorption increases the external pressure of bentonite, which results in cracking and seriously reduces the anti-seepage performance of GCL. Lin et al. [31] discussed the engineering performance of GCL under the temperature effect, and summarized Southen and Rowe’s assessment of the cracking possibility of GCL’s bentonite component under the thermal effect by using the SUMMIT model. Arden et al. [32] indicated that the increased temperature exerts a negative impact on the permeability of GCL by reducing the amount of water absorbed and leading to cracking and subsequent degradation of the hydraulic performance of the GCL [33,34,35,36,37,38]. Southen and Rowe indicated that the cracking of the bentonite component is greatly influenced by the initial water content of the underlying soil and the temperature gradient. Lower water content and higher temperature gradient result in a greater possibility of cracking [39,40,41,42,43,44,45]. The cracking of the bentonite component at high temperature may be one of the main factors affecting the permeability of GCL. Therefore, this study analyzes the cracking mechanism of the bentonite component and the change of GCL permeability through a series of tests on the basic properties of GCL at high temperatures.
Hanson et al. [46] studied the influence of temperature and humidity on the shear strength of double-layer nonwoven GCL and high-density polyethylene mesh geomembranes (T-GM). In direct shear tests at the interface, pressures of 10, 20, and 30 kPa were applied to the upper covered GCL, and pressures of 100, 200, and 300 kPa were applied to the bottom GCL. The temperature environments were set at 20 °C and 40 °C. It was found that the influence of temperature on the shear strength was greater than that resulting from the moisture content, and the shear strength varied with temperature by up to 54%. For the bottom liner, the shear strength was affected more by moisture content than by temperature. The degree of variation with moisture content was 43%. Jiang [47] believed that the components in landfill leachate are complex, and GCL’s bentonite component has different absorption degrees of heavy metal ions at different temperatures.
Many studies on the hydraulic performance of GCL have already been conducted. He [48] found that the permeability increased with the increasing temperature, and the k increased 5.5× when the temperature increased from 20 °C to 70 °C. Shao et al. [49] studied the liquid limit and swell index of three types of clay under 5 °C–50 °C. They found that the liquid limit and swell index were increased with the increase of the temperature, which was attributed to the water absorbed amount and the absorbed types. Research by Ishimori [50] indicated that the free swell index values were higher at 60 °C than those at 20 °C in NaCl solutions. Ye et al. [51] obtained similar results by conducting the swell index and hydraulic conductivity tests on Gaomianzi bentonite under different temperatures.
In this study, parameters such as fluid loss and free swell index are determined to clarify the changing rule of the hydraulic performance of GCL under different temperatures. Based on the previous research, this study conducts the tests under room temperature (25 °C) and at 50 °C, 60 °C, and 70 °C. The composition and micro-structure of bentonite is studied by using micro-observation, including XRD, XRF, and SEM. The hydraulic performance of the GCL with different mining leachates are evaluated in this study.

2. Materials and Methods

2.1. Materials

2.1.1. Geosynthetic Clay Liners

The geosynthetic clay liners used in this study are both granular and those with nonwoven geotextile in the bottom and woven geotextile at the top. The bentonite components were peeled out, and the constituent of two bentonites are shown in Table 1.

2.1.2. Test Solutions

The three test solutions used in this study are deionized water and mining leachates from Xikuangshan and Baojinshan mines, which are both in Loudi City, Hunan Province (Figure 1). The main mineral resources of Xikuangshan are antimony, and mineral processing agents include mainly lead nitrate, xanthate, sulfur nitrogen, and foaming agent. Baojinshan is a typical gold mine; xanthate, black medicine, copper sulfate, and other agents are adding in the process of mineral processing. The leachates constituents are determined and shown in Table 2 and Table 3.
As shown in the tables, in the leachates of Xikuangshan tailings and Baojinshan tailings, the sodium contents are higher and the calcium contents are relatively lower, and the different compositions and concentrations of the two types of leachates have different influences on the impermeability of GCL.

2.2. Conducted Tests

2.2.1. Fluid Loss Test

A modified fluid loss test was conducted by initially combining the American Petroleum Institute (API) methods (API Spec 13A, 13B) with that of the American Society of Testing and Materials (ASTM standard D5891). The main differences in our approach from the ASTM method were that solutions were collected after 7.5 min, 30 min, 60 min, and 90 min, the thickness of the filter cakes was measured using a Vernier caliper, and the wet and dry masses of the filter cake were measured. In order to clarify the influence of the temperature, the suspensions were placed in an incubator and heated in a water bath for 24 h to the test temperature (50 °C, 60 °C, and 70 °C). The temperature-controlled devices were used to prevent the heat loss during the tests. The detailed procedures are as follows: The bentonite is ground to 100% through 200 mesh sieve; 22.5 g bentonite is mixed with 350 mL leachates using blender; after stirring for 5 ± 0.5 min, the mixing cup is removed from the mixer, and the bentonite adhering to the cup wall is scraped off; and the prepared suspensions are placed in a water bath incubator and heated for 24 h with the temperature setting at 50 °C, 60 °C, and 70 °C. Heating plates are used throughout the subsequent test processes to prevent heat loss. At 7.5 min, remove all adhesive liquid from the beaker and the drain, immediately place the clean, dry 100 mL cylinder under the drain line, and collect the liquids at 30.0 min, 60.0 min, and 90.0 min. The collected liquid volume, the bentonite cake thickness, and the weight of the cake are recorded.

2.2.2. Free Swell Index Test

Free swell index tests were performed according to ASTM D5890, except that de-ionized water was replaced with mining leachates. The detailed procedures are as follows: (1) The bentonite was dried in the oven at 105 °C, ground to powdered bentonite 100%, and passed through a 200 mesh sieve. (2) Weigh 2.00 ± 0.01 g dry powdered bentonite on a weighing paper. (3) Add 90 mL de-ionized water to a clean 100 mL measuring cylinder. (4) Take up no more than 0.1 g of powdered bentonite from the weighing paper and carefully sprinkle it over the entire water surface in the cylinder within approximately 30 s. Let the powdered bentonite moisten and settle to the bottom of the cylinder. Repeat Step 4 until the entire 2.00 g sample has been added. (5) Rinse all the attached particles from the side of the cylinder into the cylinder and pour the test liquid to 100 mL level. (7) After standing for 16 h, the observed volume of hydrated bentonite was recorded. All the free swell index tests were conducted under the setting temperature, and the temperature-controlled wrap was used during the tests to ensure that the test was performed at the setting temperature.

2.2.3. X-ray Observation

X-ray diffraction (XRD) and X-ray fluorescence spectrum (XRF) were performed for the bentonite powder in order to obtain quantitative analysis, and samples of the bentonites after fluid loss test were sent to Changsha Institute of Mining and Metallurgy for quantitative mineralogical analysis. The typical mineralogical methods used were as follows: the amount of 1.5 g of oven-dried material was milled (<10 micron). The samples were then mixed thoroughly before lightly back-pressing into stainless steel sample holders for XRD analysis. XRD patterns were collected on a PANalytical X’ Pert Pro Multi-purpose diffractometer using Fe-filtered Co K radiation (λ = 1.78897 Å), variable divergence slit, 1 °C anti-scatter slit, and fast X’ Celerator Si strip detector. The diffraction patterns were recorded in 0.017° 2θ steps with a 0.5 s counting time per step and logged to data files for analysis.

2.2.4. Scanning Electron Microscope

Scanning electron microscope images were obtained on a Hitachi SU3500 SEM equipment at Hunan University of Science and Technology. Powdered specimens of bentonites (unreacted or reacted with mining leachates at different temperatures) were air-dried to constant weight and then were affixed onto a stainless steel sub with carbon tape. The prepared specimens were kept in a desiccator before testing to avoid moisture absorption. Platinum coating was conducted on the specimens to improve image quality. The detailed procedures are as follows: (1) Bentonite sample preparation: the filter cake obtained after the fluid loss test is put into the oven at 105 °C for drying, and the dry cake is taken out for future use. (2) Black conductive tape with a length smaller than the sample stage was cut off and pasted on the sample stage. The conductive tape was smoothed with tweezers to make the adhesive tape adhere more firmly. After smoothing, the protective film on the other side of the tape was torn off with tweezers. The sample was taken out and fixed on the conductive adhesive surface with tweezers and slightly pressed to make it stick well to the conductive adhesive. After the sample was placed, a WD-40 powerful dust removal tank was used to dust the sample surface. (3) The sample stage was placed into the holder in the electron microscope. Since multiple samples were placed onto the stage, the numbers were marked in a certain sequence, and photos were taken to prevent sample confusion during observation. (4) The representative characteristic areas of each sample were selected, and the bentonite micro-structure was observed in accordance with the magnifications of 200×, 500×, 1000×, 2000×, and 5000×.

3. Results and Discussion

3.1. Fluid Loss Test

The fluid loss changes of bentonite under different test solutions at various temperatures are shown in Figure 2. As shown, the fluid loss of both bentonites increased with the gradual rise of temperature. This could be attributed to the inhibition of the ion exchange between bentonite and the mining leachates since ionic adsorption of bentonite is an exothermic reaction. The increased temperature resulted in the reduction of the number of absorbed water molecular layers, which indicates the degradation of the anti-seepage performance of GCL. At 70 °C, the leachate volume of bentonite B with Xikuangshan mine tailings reached 196.6 mL after 90 min. This indicates that the high temperature may even lead to the failure of the anti-seepage system and greatly degrade the anti-seepage performance. Moreover, the fluid loss values of bentonite in tailing leachate during the increase from room temperature to 50 °C was greater than those from 60 °C to 70 °C. This indicates that the temperature gradient also exerts an influence on the permeability of bentonite, and the increase of the temperature gradient resulted in the increase in the amplitude of change for the permeability.

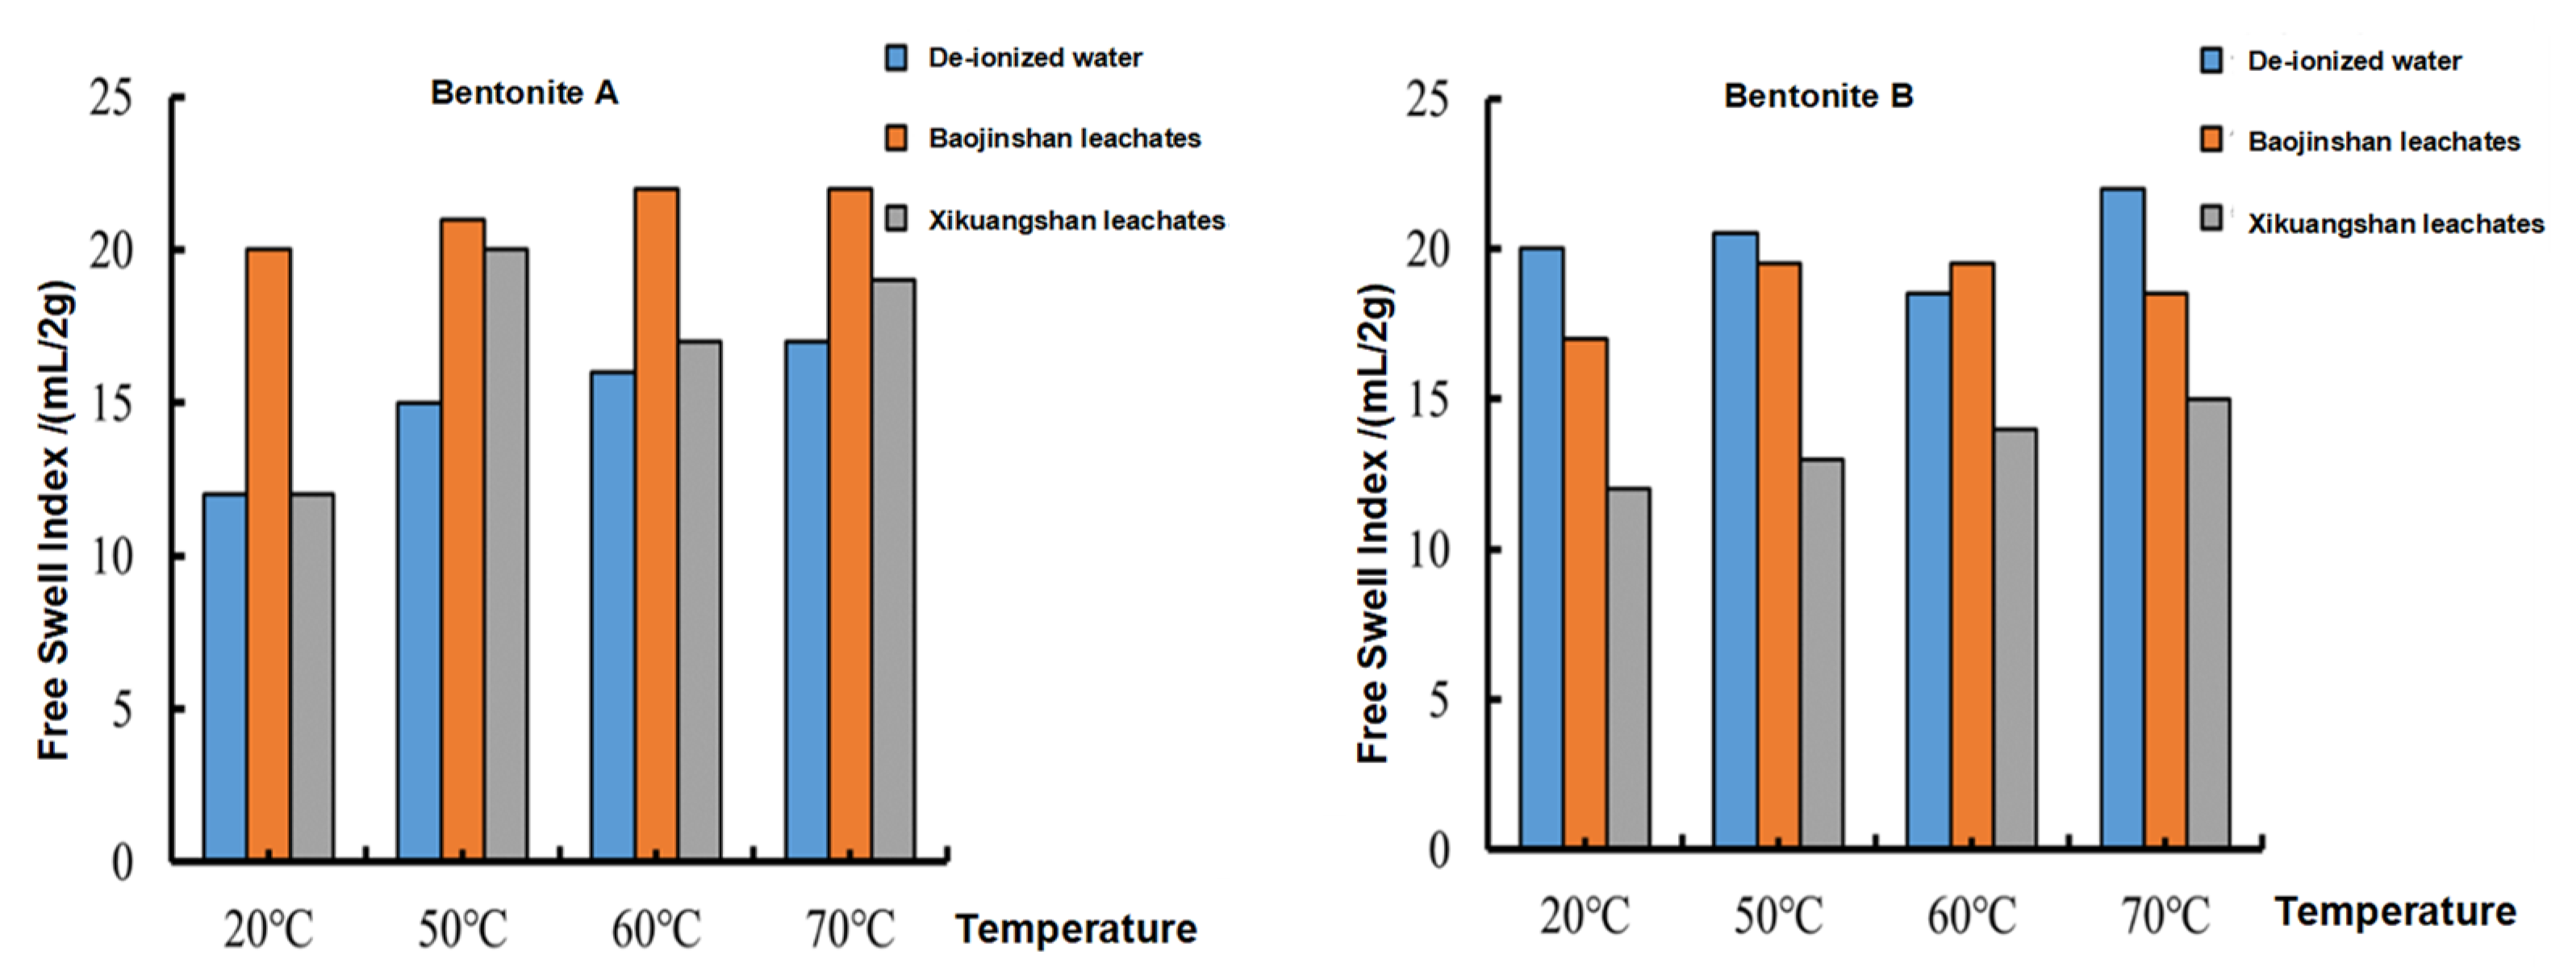
3.2. Free Swell Index Test

The results of free swell index tests under different temperatures with various mining leachates are shown in Figure 3. Generally, the free swell index of bentonite increases slightly with the increase of temperature. For both bentonite A and B, the swell index values are greatest in Baojinshan mining leachates. The species and content of cations in the leachate of Baojinshan tailing mine make the ion exchange reaction of bentonite more adequate than other leachates, and the high temperature improves the ion transport and the bentonite dispersion.

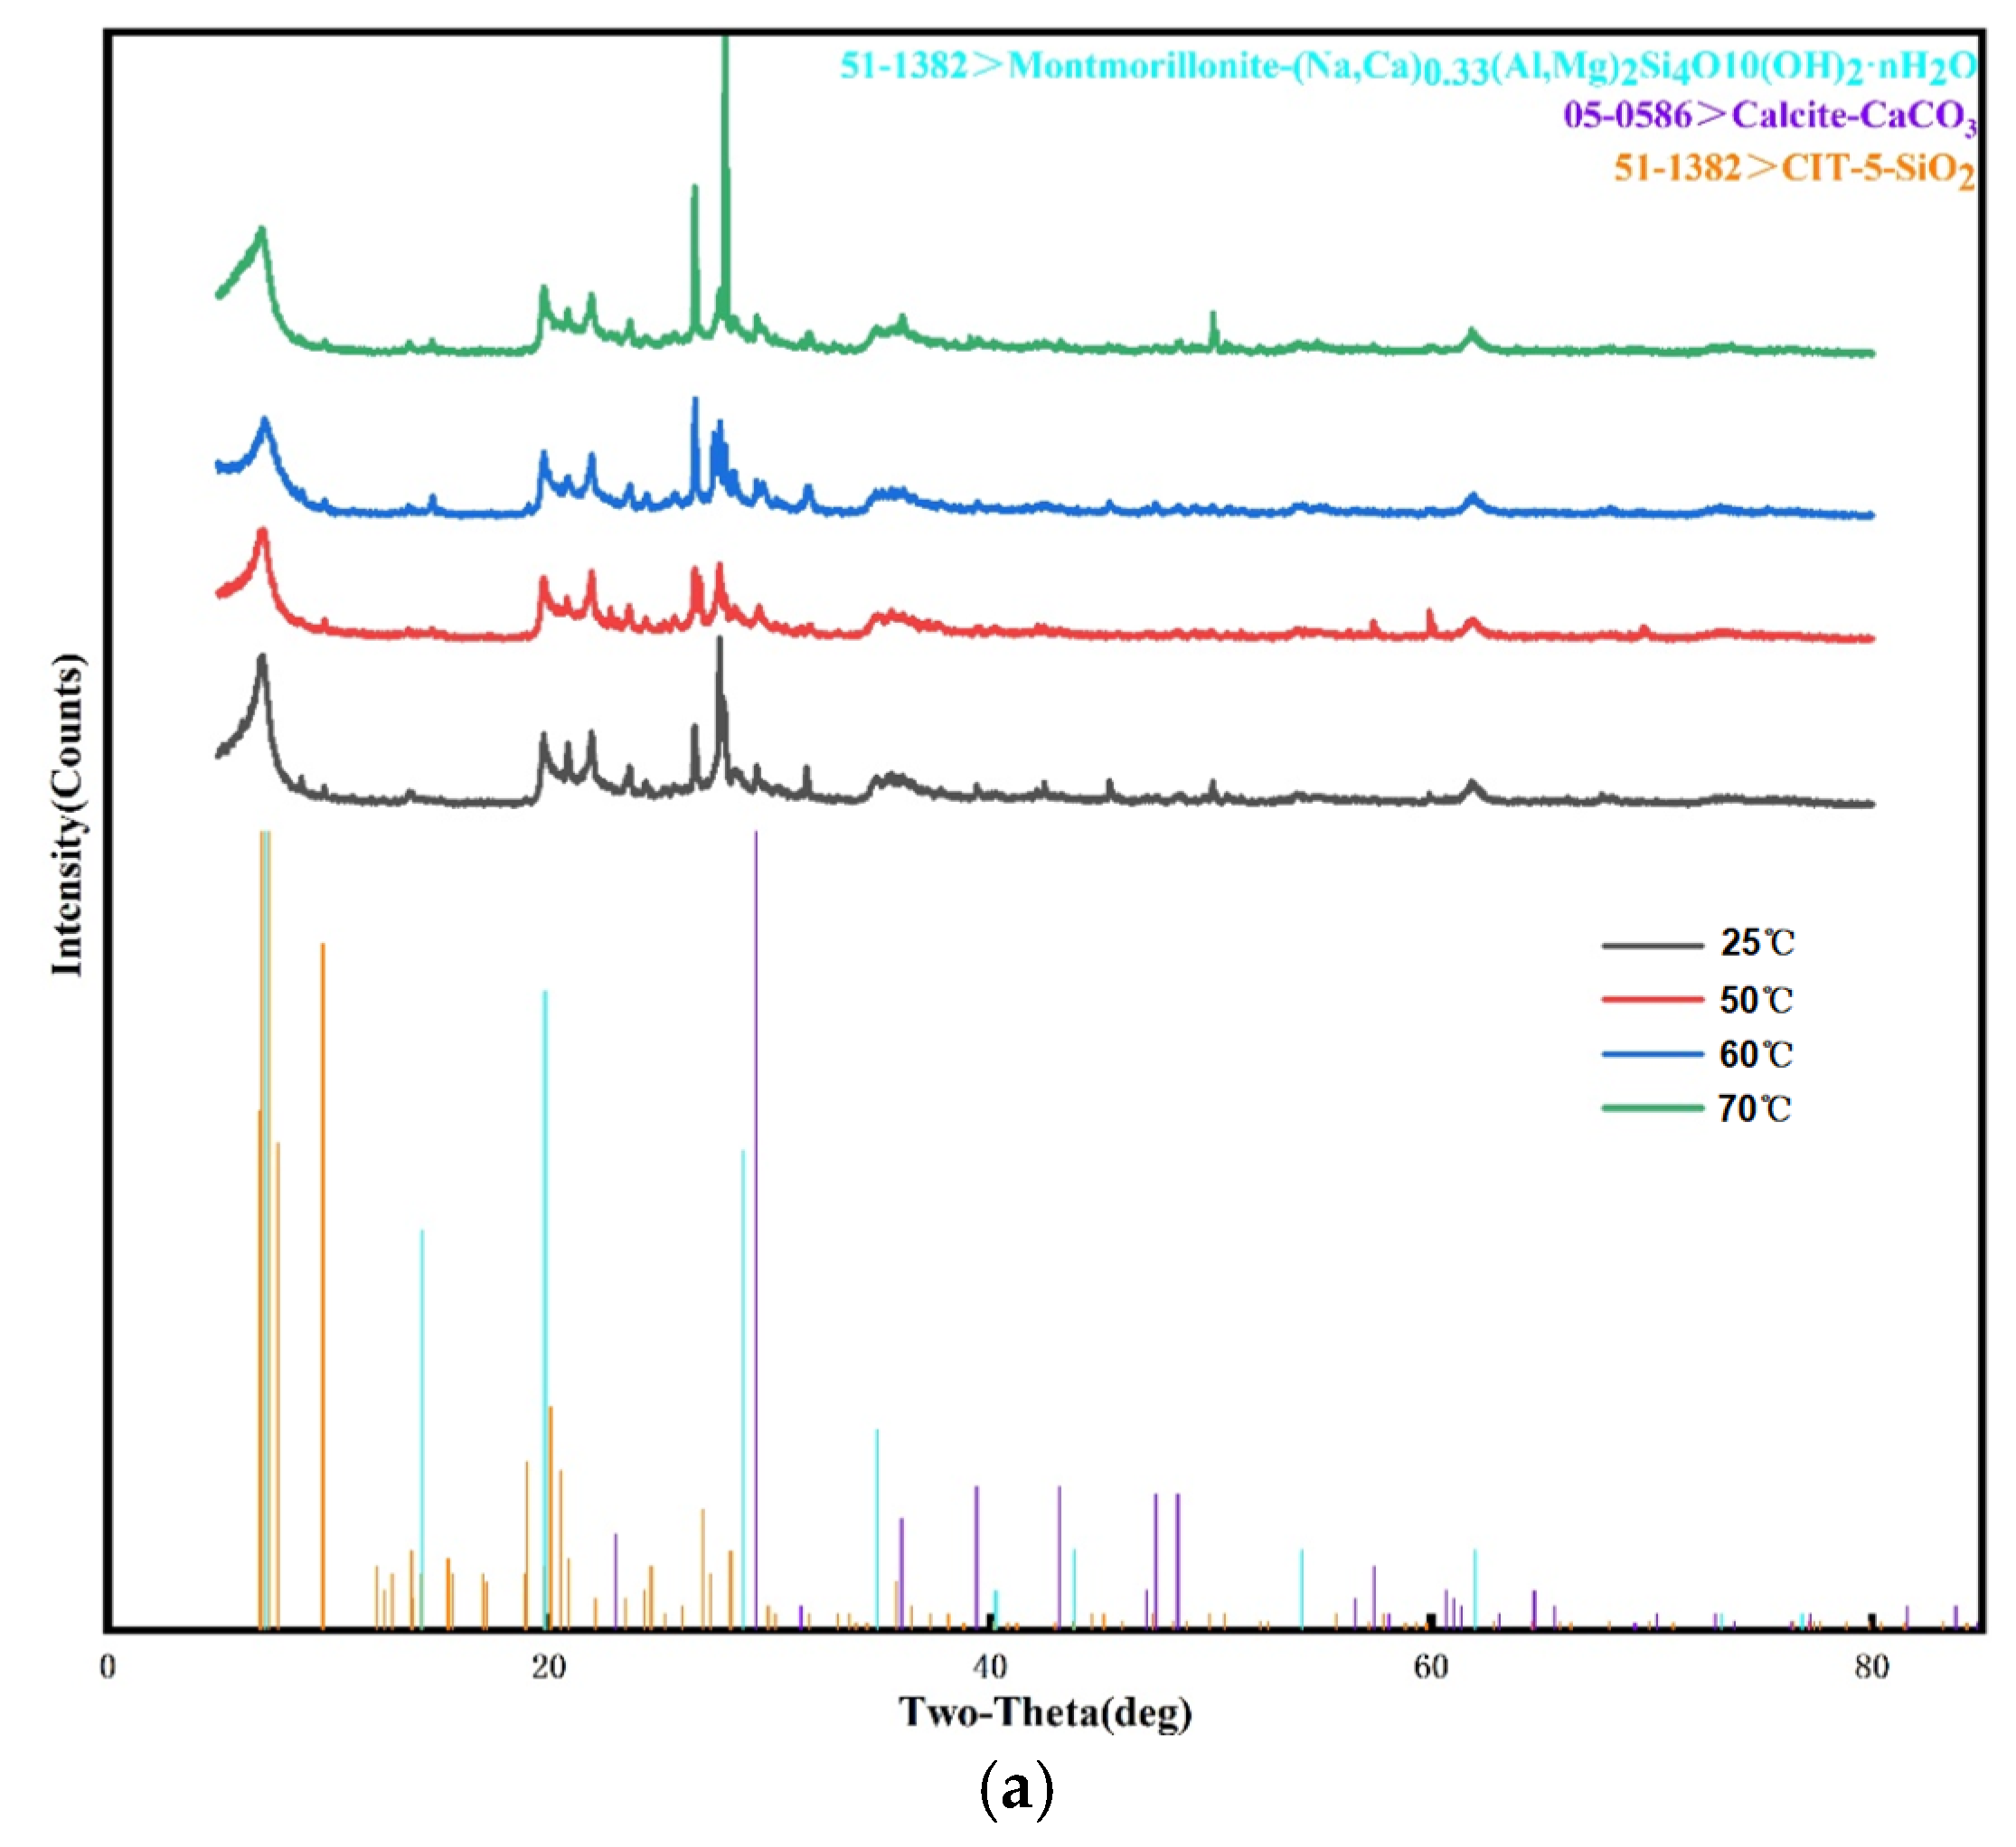
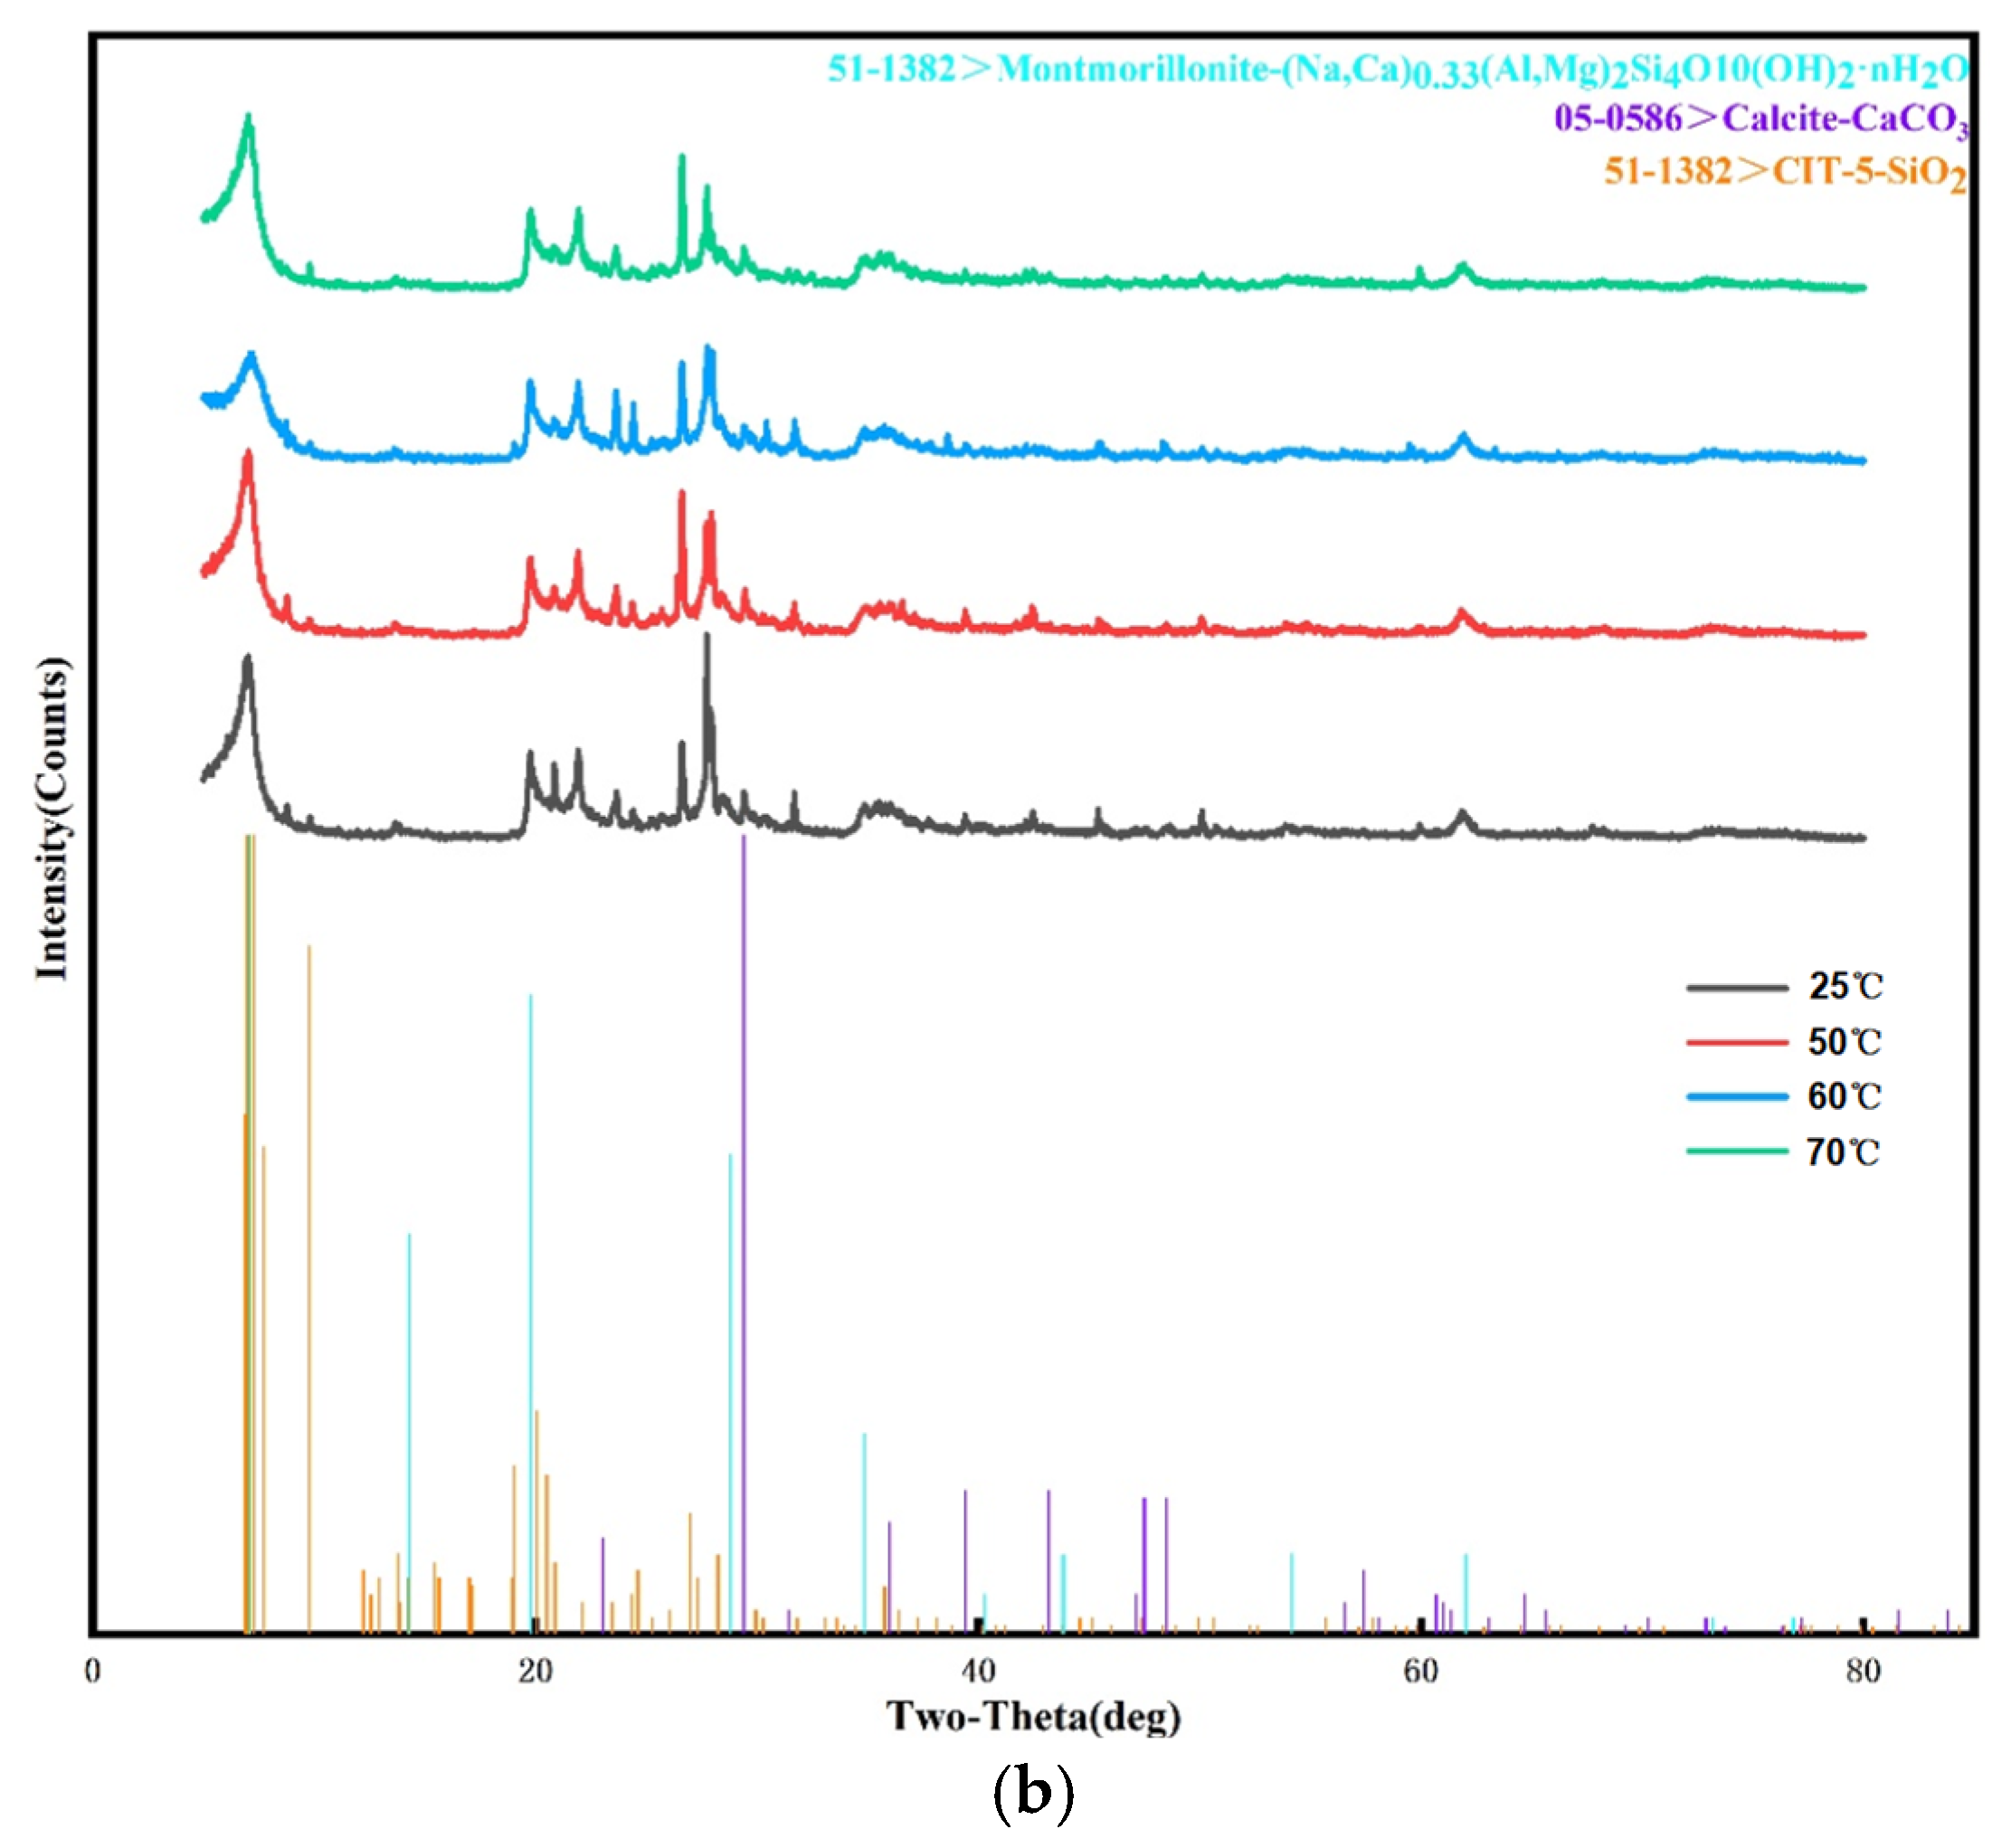
3.3. X-ray Diffraction and X-ray Fluorescence Spectrum

MDI Jade 6.5 was applied to analyze the XRD spectrum; as shown in Figure 4, the diffraction angles of each peak of bentonite basically remain unchanged at different temperatures, which indicates that the increased temperature did not result in the change of the bentonite mineral composition. XRF shows an increased content of sodium but a decreased content of calcium in the leachates at high temperatures (as see in Table 4). The increased temperature speeds up the ion exchange reaction between the bentonite and the mining leachates. The loss of sodium in the bentonite structure resulted in fewer absorbed water layers microscopically and, therefore, increased the bentonite permeability.

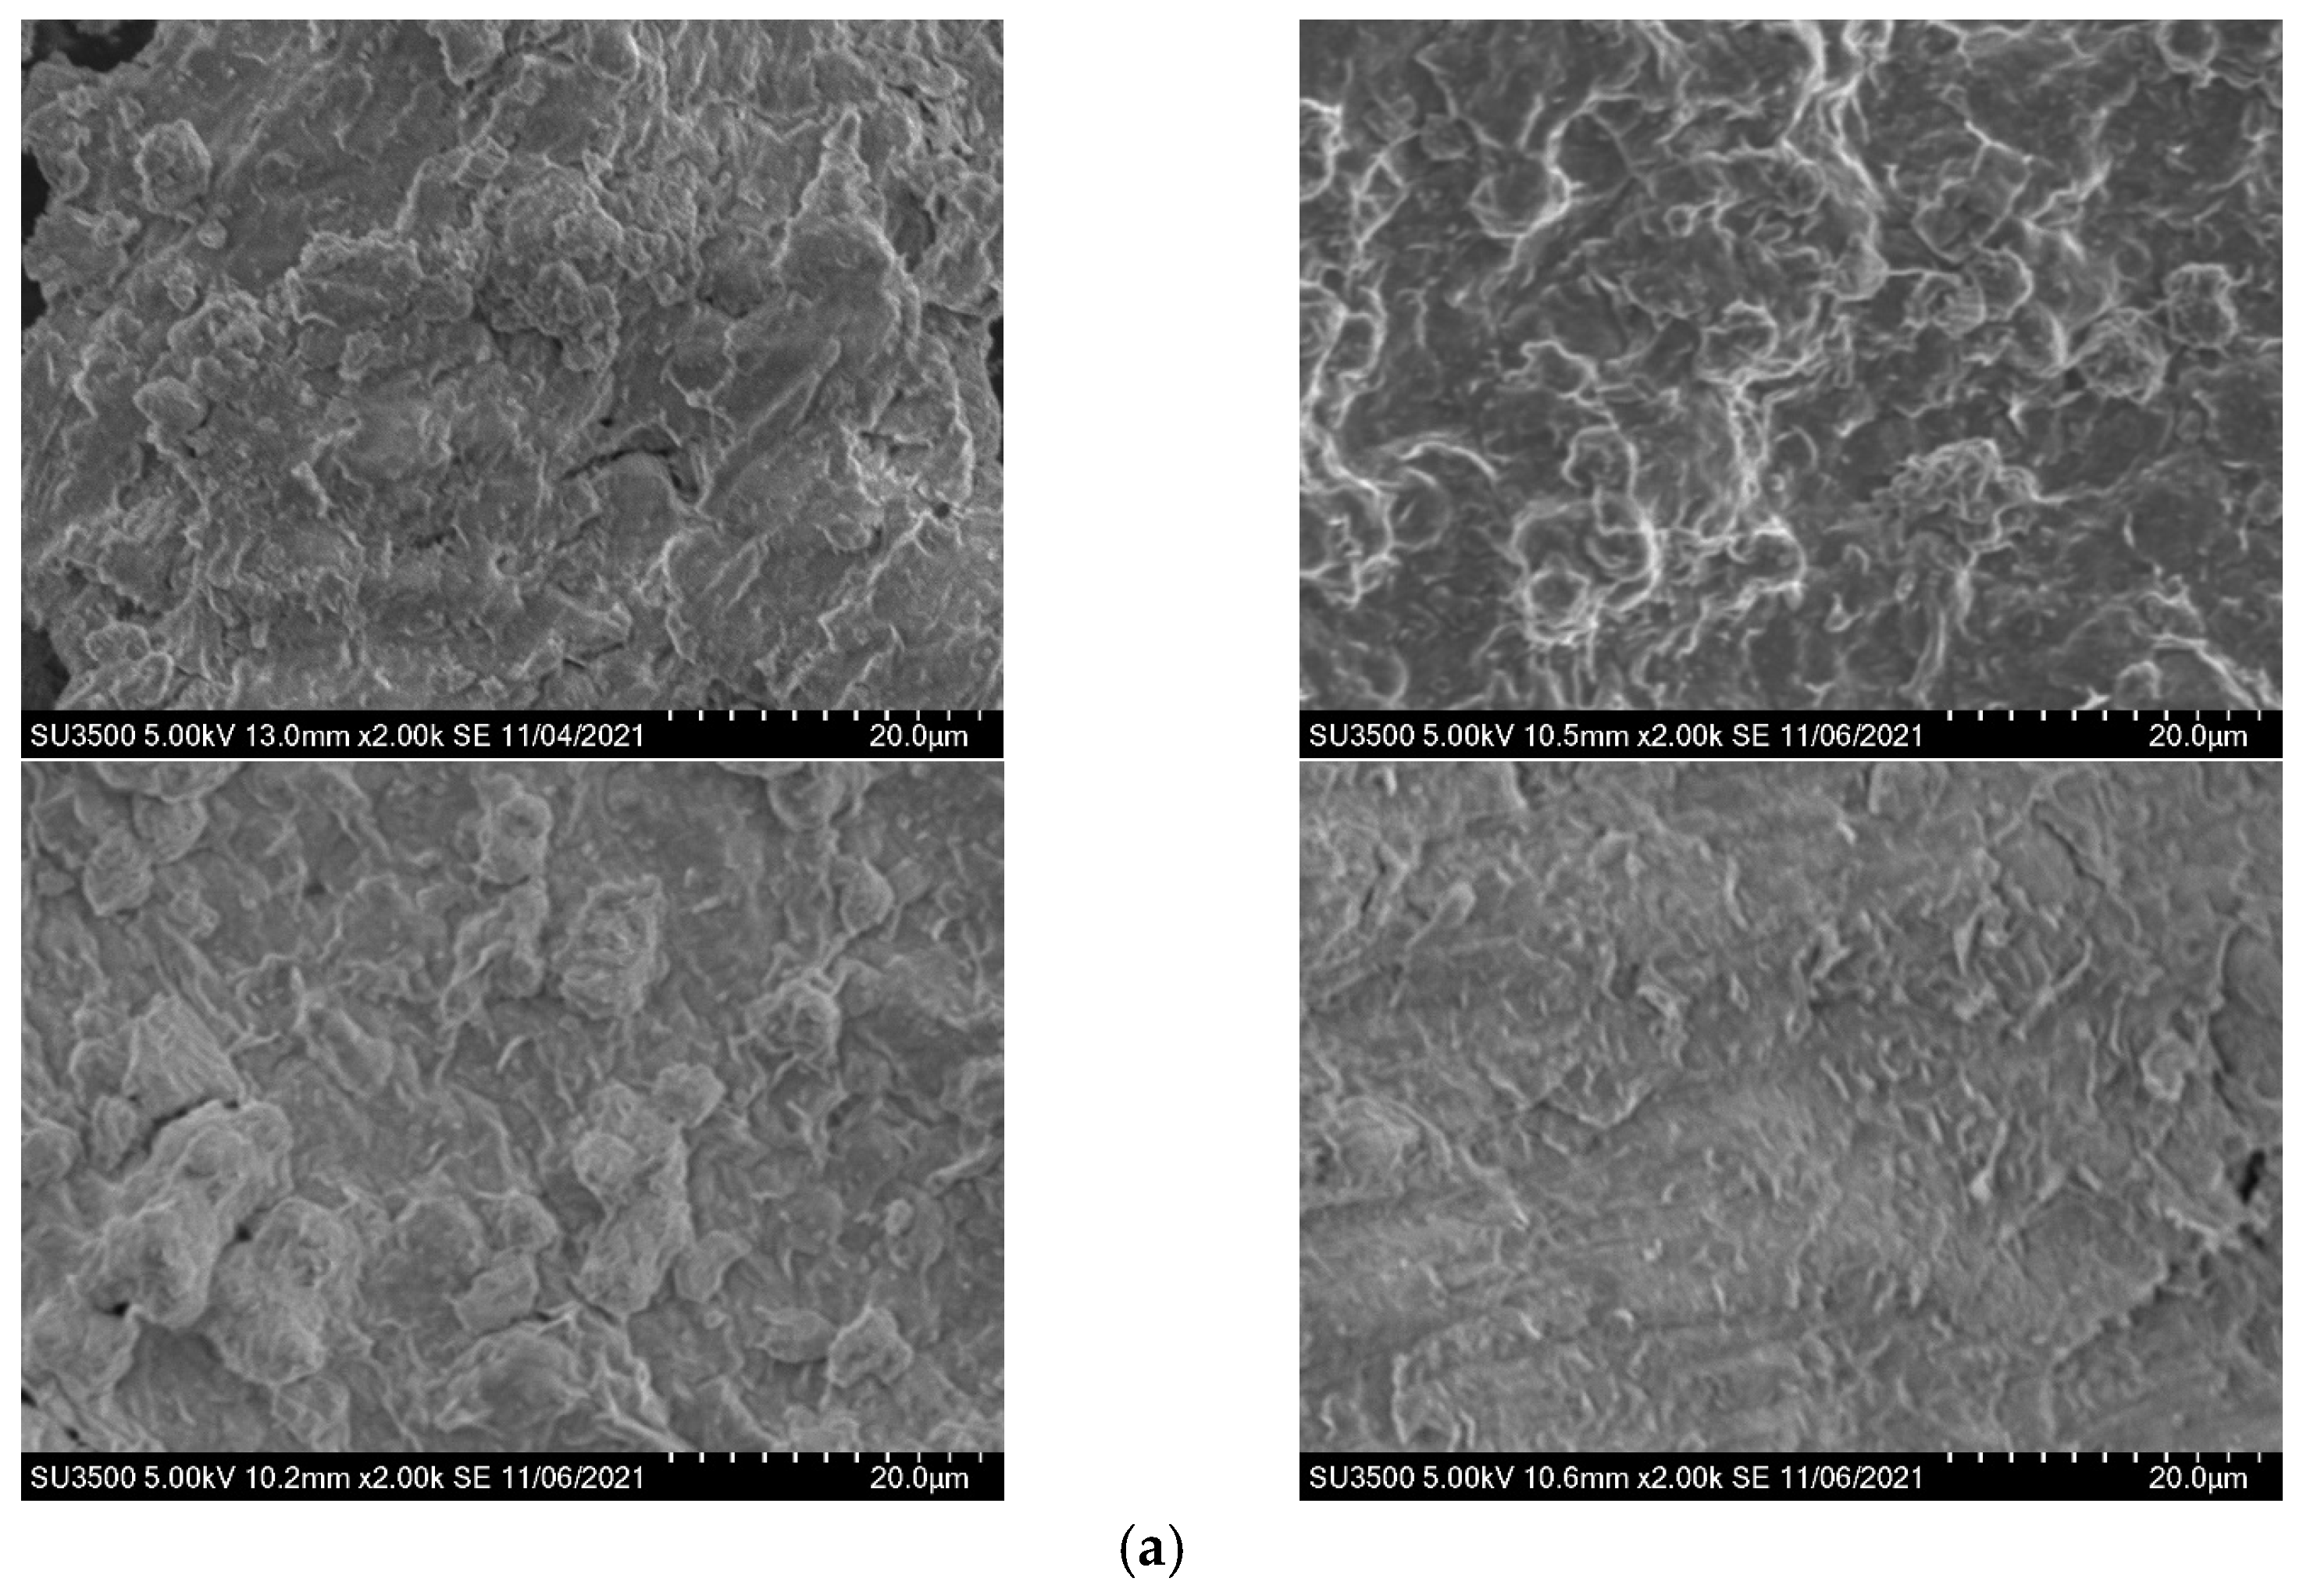
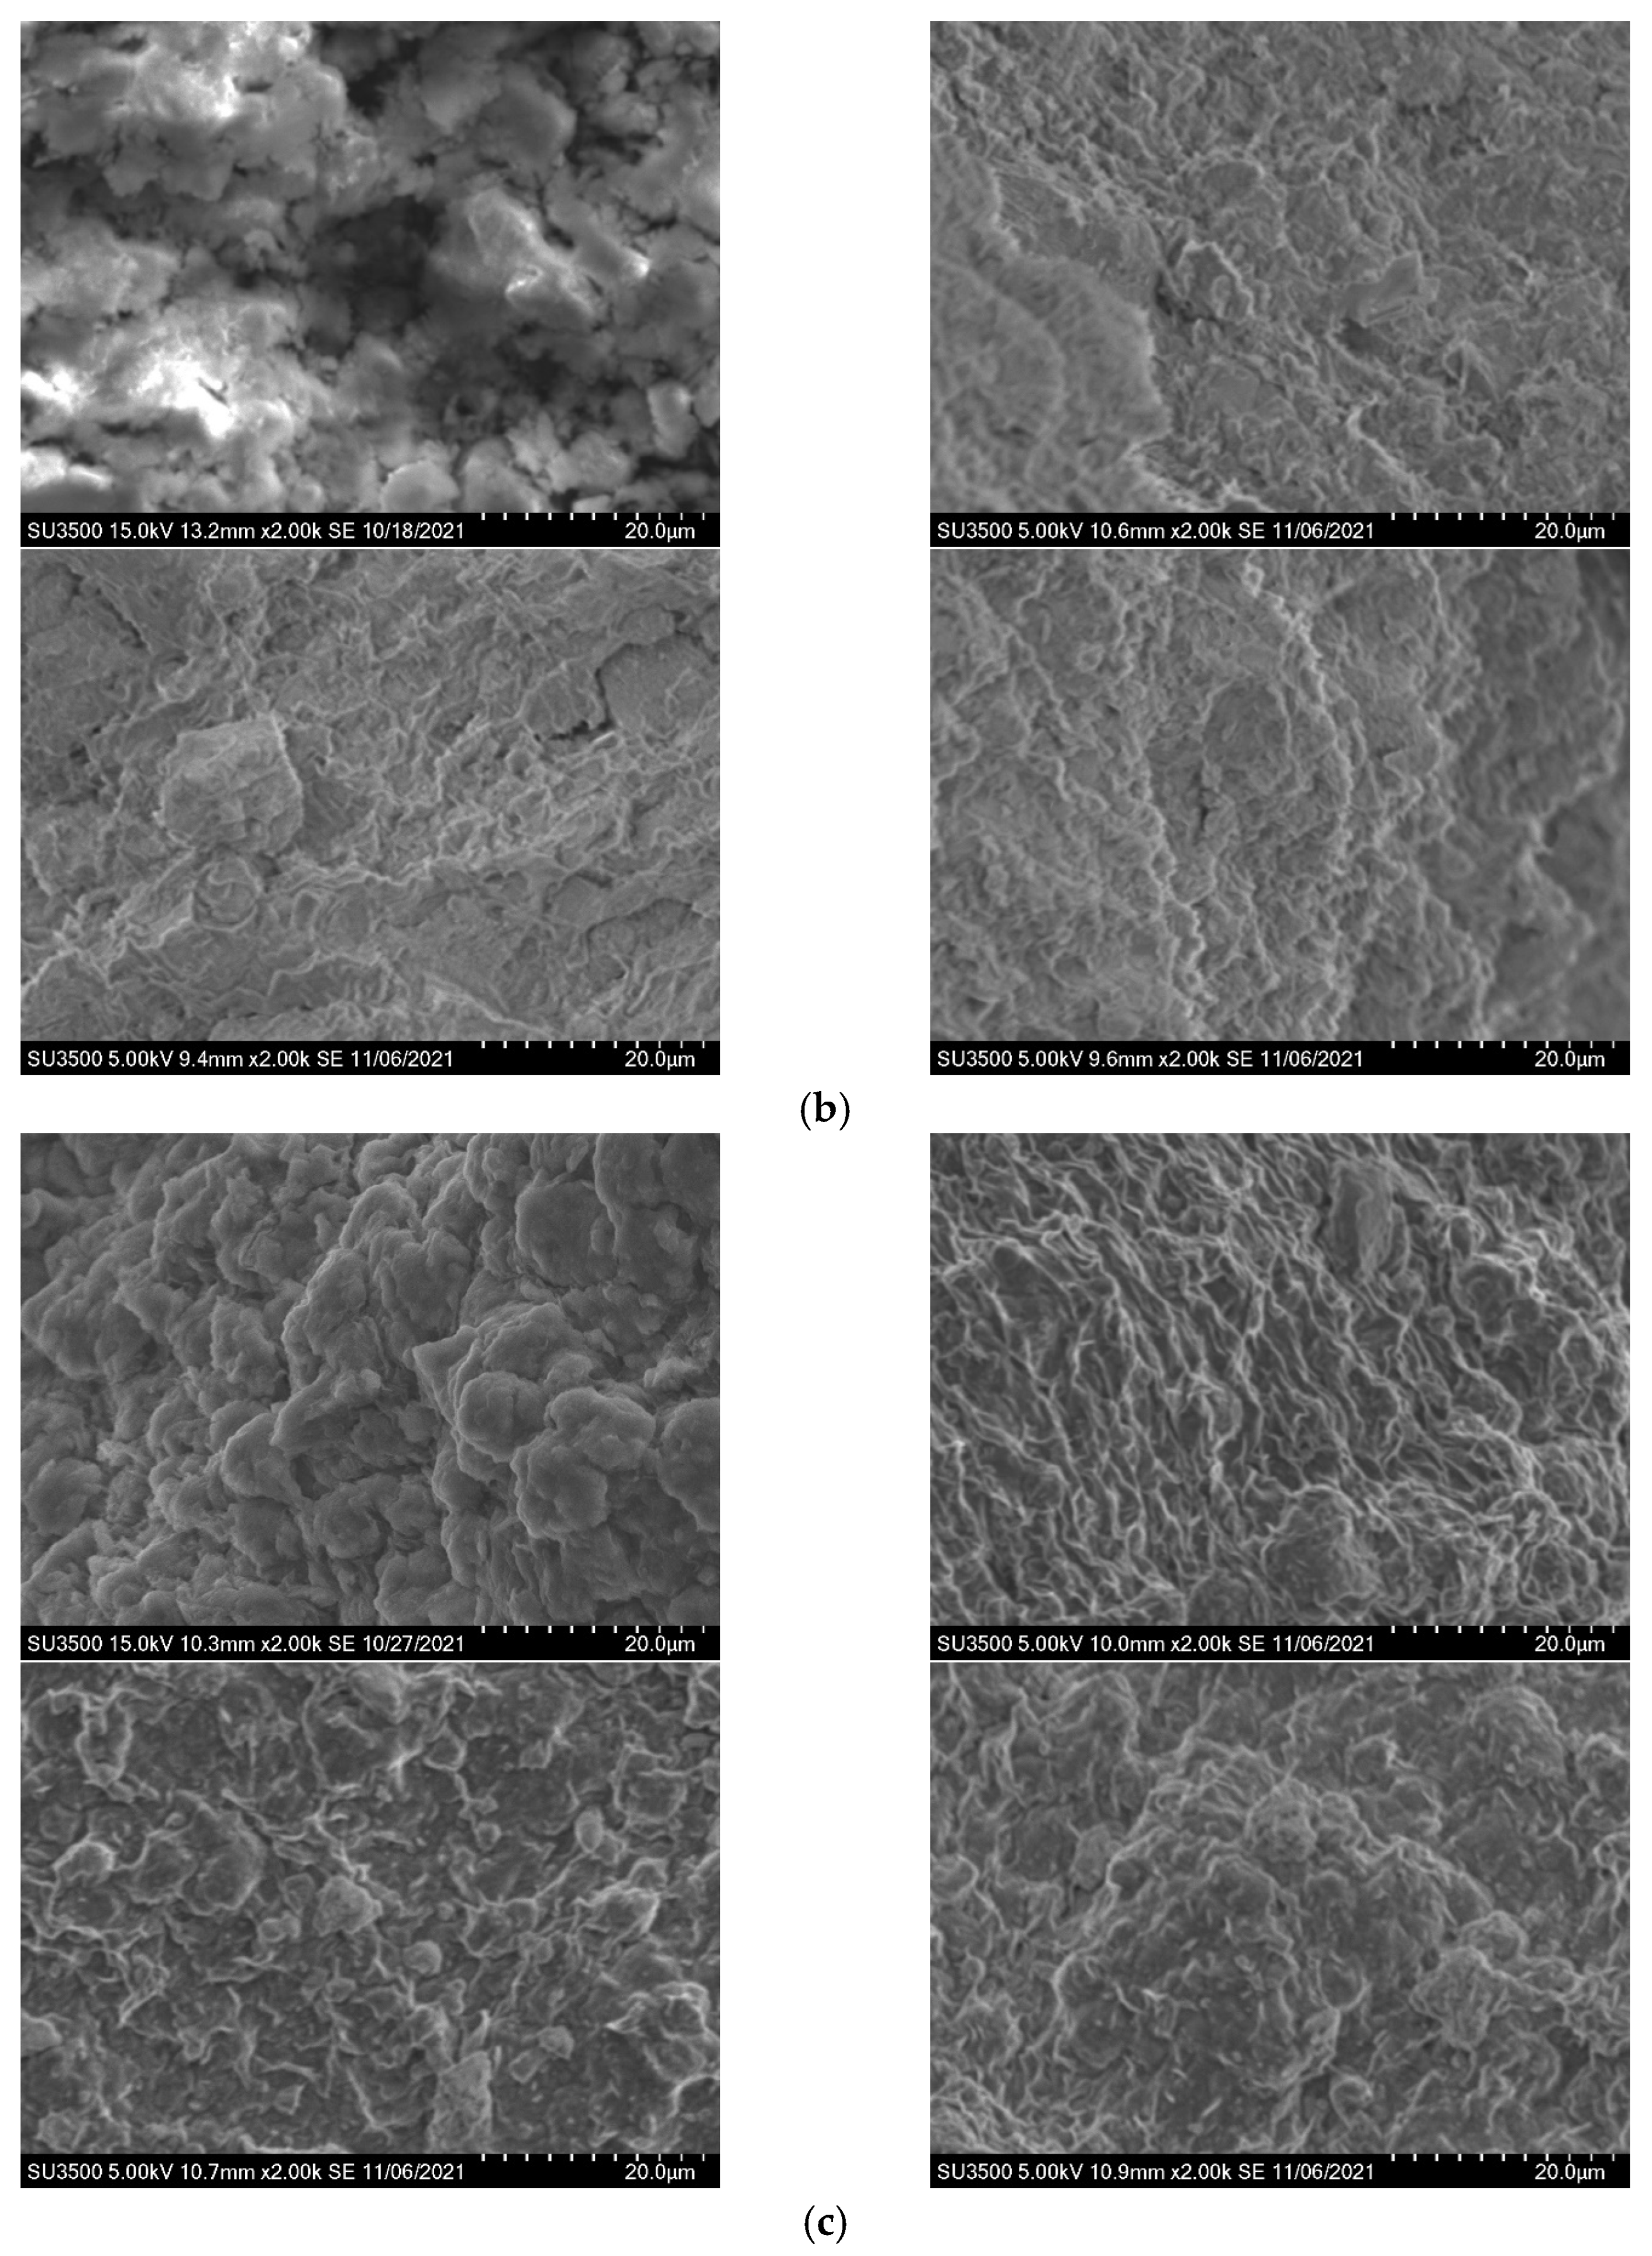
3.4. Scanning Electron Microscope

As shown by the SEM images in Figure 5, the bentonite surfaces were coarser and denser at high temperature; this is because the rise of temperature resulted in the bentonite crack, thereby making the particles look uneven and rough [52,53,54,55,56]. According to the microscopic observation on bentonite SEM images under high temperature environment, it can be found that the porosity of particles tended to increase, while the surface fractal dimension slightly increased with the increase of temperature, indicating that the surface structure and morphology of bentonite changed greatly at high temperatures. According to the microscopic data of bentonite in a high temperature environment, it can be found that the porosity of particles tended to increase with the increase of temperature. The increased porosity resulted in higher permeability. This may be because the ionic exchange reaction occurred after bentonite was mixed with the mining leachates, which is an exothermic reaction. The increased temperature inhibited the reaction of ion exchange to some extent. The cationic adsorption capacity of bentonite was weakened, the mutual attraction between each particles was affected, and the distance of double layer decreased. All these changes may degrade the hydraulic performance, which is consistent with the results of fluid loss. The crack could be observed at high temperatures, and the space between particles increased; therefore, the free swelling of bentonite increased as well, which is consistent with the free swell index test results obtained in this study.

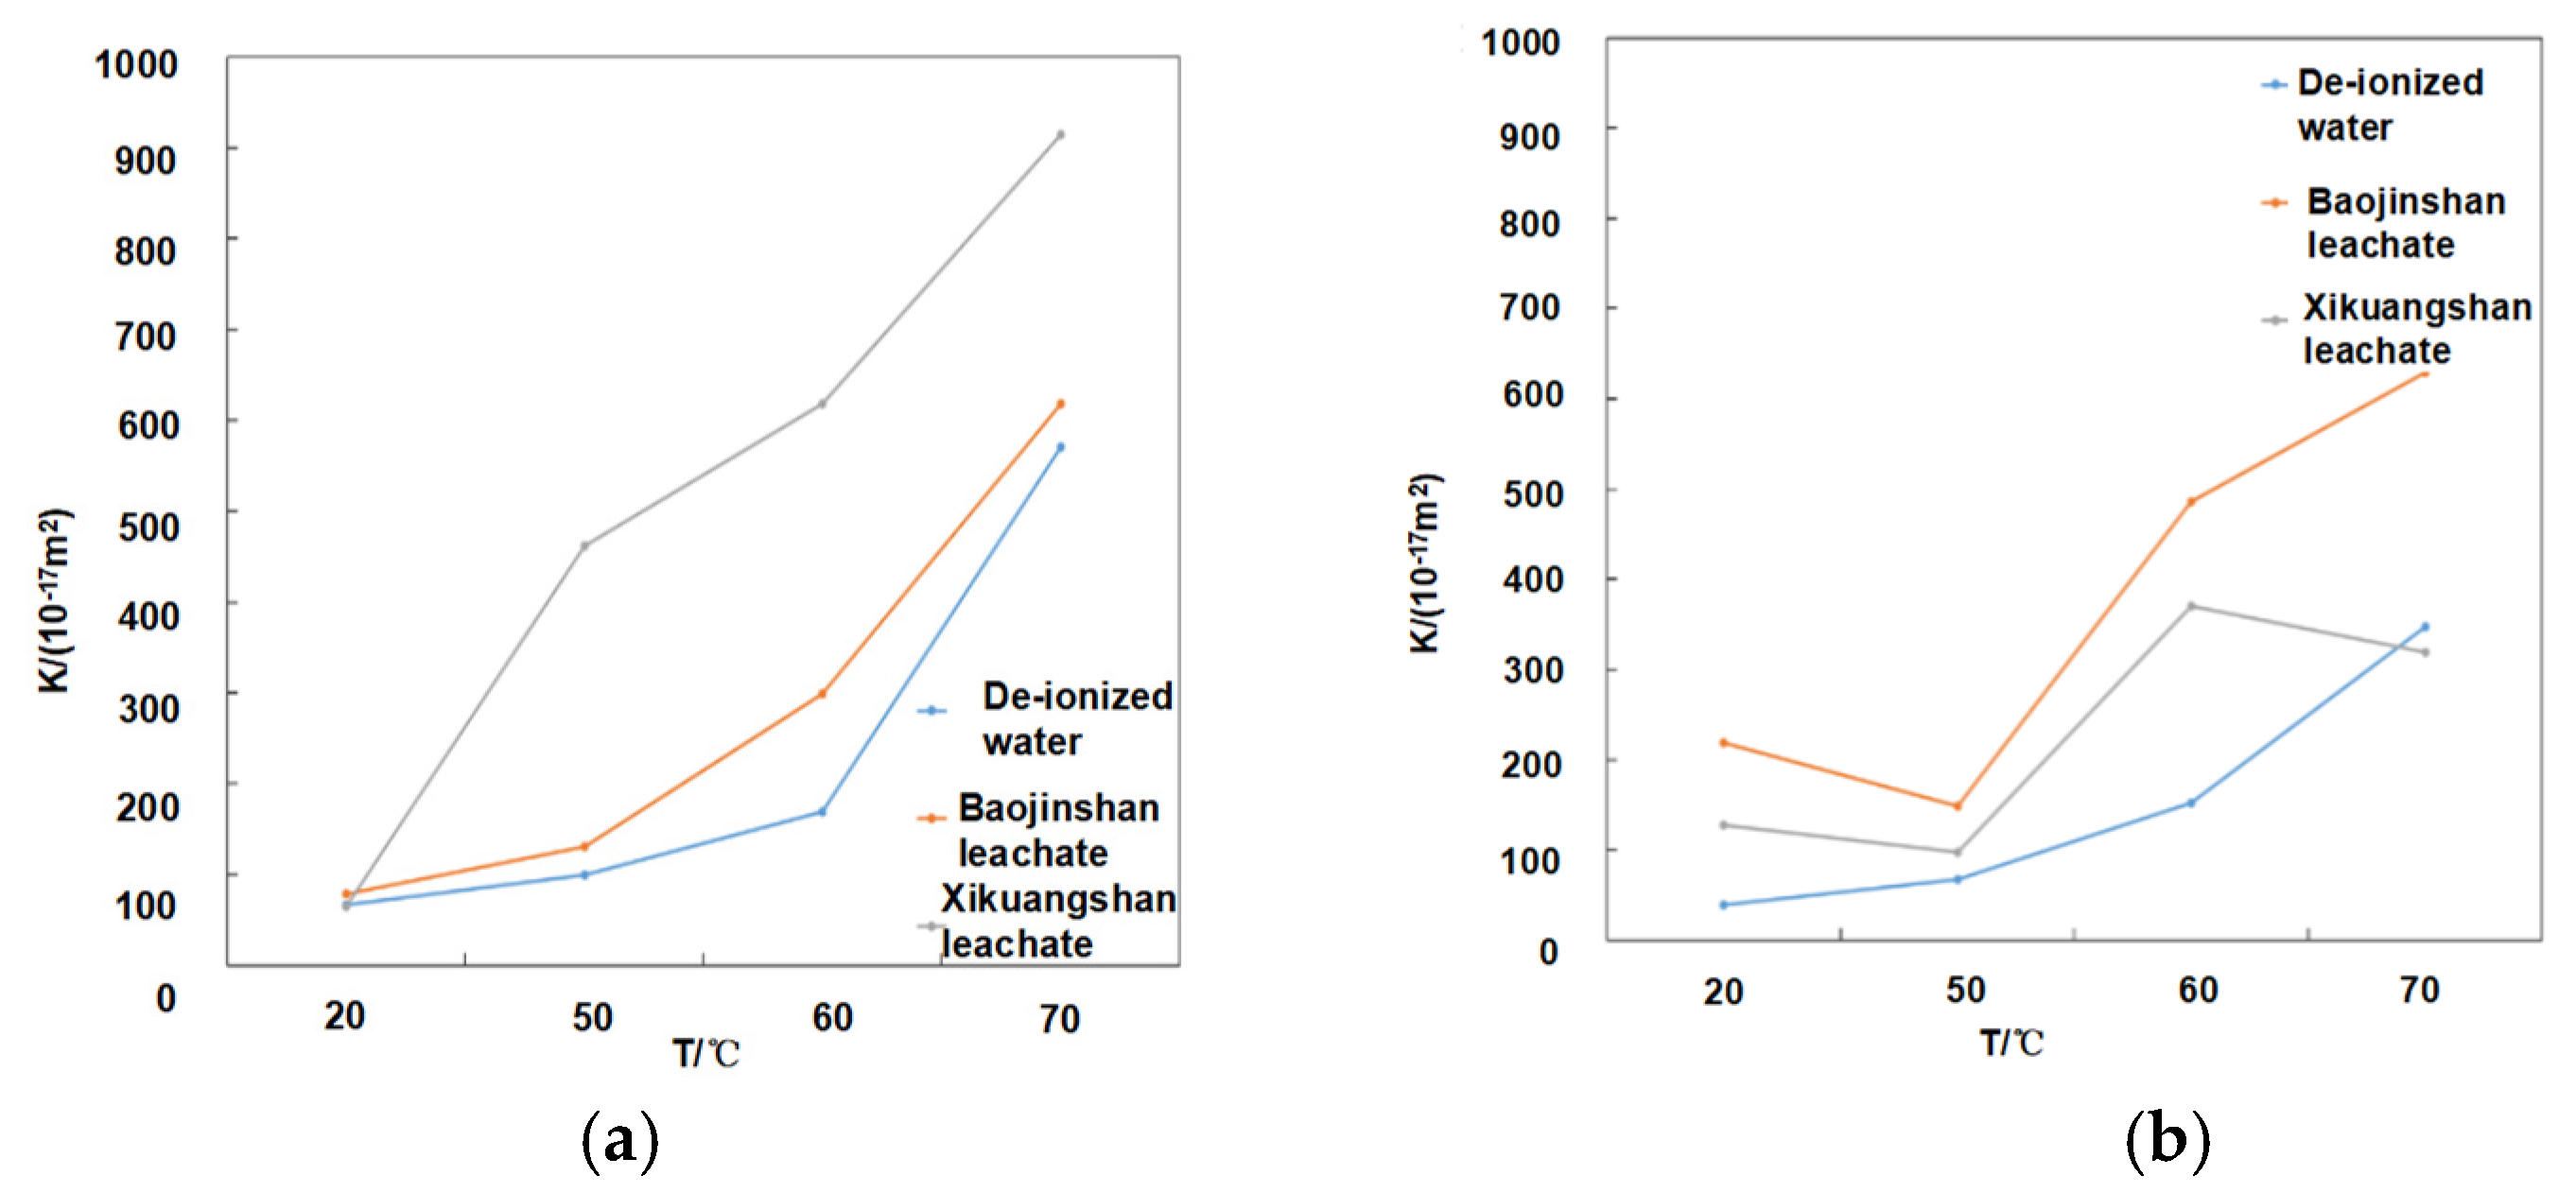
3.5. Hydraulic Conductivity Analysis

One of the important indexes to test the impermeability of bentonite is its permeability coefficient, which is estimated by Equations (1)–(5) through the bentonite fluid loss tests under different temperatures.
As reported by Rushton et al. (2000) [57], materials under a constant applied stress condition (i.e., 690 kPa in this study) should yield a filter cake of roughly constant density. Therefore, the filter cake formed during the 30 min test is expected to be incompressible with a constant void ratio (cake density) within the time frame. As such, the filter cake volume is expected to linearly increase for each unit volume of suspension filtered, and the constant of proportionality, β, can then be used to give an equation for cake thickness at any time (Chung and Daniel, 2008) [58]:
L = β V A
where L is the thickness of the filter cake (m), V is the filter cake volume (m3), and A is the filter cake area (m2).
Chung and Daniel (2008) calculated the β value with the method of a mass balance on the solid and liquid in the filter system:
β = C m ρ w 1 C m 1 n c ρ s C m n c ρ w
where Cm is the mass fraction of solids in the suspension, ρw is liquid density, nc is the porosity of the filter cake, and ρs is the particle density of solid.
The porosity (nc) of the filter cake can be calculated as:
e = ρ s ρ d ,               n c = 1 + e e
where e is the void ratio of filter cake, ρs is particle density of clay (assumed to be 2.7 g/cm3 for the bentonites used in this study), and ρd is the dry density of clay calculated from the ratio of dry mass and volume of filter cake.
The filtration model derived by Rushton et al. (2000) from Darcy’s equation is:
d V f d t = k c γ w P 0 L A
where Vf is the filtrate volume (m3), t is the filtration time (s), kc is the hydraulic conductivity of filter cake (m/s), γw is the unit weight of liquids (kN/m3), P0 is the applied stress (kPa), and L and A are defined as above.
Therefore, Chung and Daniel (2008) put forward an equation to calculate the hydraulic conductivity (kc) of the filter cake as:
k c = β γ ω 2 A 2 V f 2 P 0 t
To assess the validity of Equation (5), Chung and Daniel plotted the data of P0t/Vf against Vf to check for linearity. In the present study, the viscosity (η) changed with the temperature; therefore, the equation is shown as:
k c = β γ ω 2 A 2 V f 2 P 0 t η
The parameters including filtrate volume, cake thickness, and cake quality were recorded at different times. The permeability coefficients of bentonite at various temperatures are calculated according to Equation (5) as shown in Table 5.
As shown in Table 5, the permeability coefficient of bentonite gradually increases with the rise of temperature. The increase of temperature inhibited the ion exchange reaction of bentonite, resulting in the weakening of the cationic adsorption capacity of bentonite in the test solutions. The particles dispersed and cracked, which was consistent with the microscopic observation results. With the increase of permeability coefficient, the seepage resistance of bentonite decreased, resulting in a gradual increase in the volume of filtered liquid during the fluid loss test.
Katsumi et al. [59] showed that there is a strong correlation between bentonite permeability coefficient (k) and free swell index (SI) in different test solutions (Figure 6a). The correlation between the SI values of bentonite and calculated kc at different temperatures in this study is shown in Figure 6b. As can be seen from the figure, the calculated k values are consistent with those values from Katsumi et al. under different temperatures. The calculated kc is slightly greater than the k from Katsumi, which may be because the samples used in the Katsumi test are GCLs with the test pressure at 20–35.4 kPa, while the samples in the fluid loss tests in this study are bentonite with the filtration pressure at 690 kPa; thus, the calculated k value is greater than the measured k value from Katsumi et al.
The changes of bentonite permeability are complicated at different temperatures; thus, the bentonite intrinsic permeability was studied by Equation (7) in order to further investigate the change mechanism of bentonite permeability under different temperatures. Generally, the permeability coefficient can be expressed as:
k = K ρ g μ = K g η
where k is permeability coefficient, m/s; K is the intrinsic permeability, m2; ρ is fluid density, kg/m3; μ is fluid viscosity, Pa·s; η is the dynamic viscosity coefficient, m2/s; and g is the acceleration of gravity, 9.81 m/s2. The density of fluids at different temperatures was determined by reference [32].
By calculating the natural permeability, the relationship between the natural permeability at different temperatures was obtained (see Figure 7). Intrinsic permeability is a parameter used to characterize the fluid conductivity of soil itself, and the values are related to particle size, interface physical and chemical properties, pore characteristics, etc., but have no relationship with the properties of the testing leachates. It can be seen from Figure 6 that the intrinsic permeability is not a constant, and it changes with the change of temperatures. When the temperature gradually increases, the intrinsic permeability increases with the increase of temperature. This may also be attributed to the bentonite cracks with the increase of temperature, which results in the uneven distribution of the pore size, finally leading to the increase of the intrinsic permeability.
Through the calculation of the permeability coefficient and the study on the intrinsic permeability, it is found that the permeability coefficient and the intrinsic permeability have the same change trend under different temperatures. Both of them gradually increase as the temperature rises. This indicates that the permeability coefficient and the intrinsic permeability have superimposed effects on the impermeability of bentonite, rather than being in conflict with each other.

4. Conclusions

In this study, three types of mine tailing leachate were used by setting different temperature environments. The change rule of bentonite permeability was analyzed by measuring the basic properties of bentonite components. X-ray diffraction, X-ray fluorescence spectroscopy, and SEM were used to analyze the composition of bentonite at different temperatures and observe the micro-structure changes. The fluid loss of both bentonite gradually increased with the increase of temperature because the increase in temperature inhibited the ion exchange between bentonite and the filtrate. In the free swell index test, the cracking of bentonite resulting from the high temperature also provided more swelling space. X-ray diffraction and fluorescence spectrum analysis of bentonite found that the main composition of bentonite did not change with the change of temperature. XRF showed an increased content of sodium but a decreased content of calcium in the leachates at high temperatures. The increased temperatures sped up the ion exchange reaction between the bentonite and the mining leachates, which influenced the bentonite swelling and the hydraulic performance of GCL. SEM images showed that the surface of bentonite became denser and coarser with the increase of temperature during to the cracking.
The permeability coefficient and intrinsic permeability of bentonite increased gradually with the increase of temperature because the increase of temperature inhibited the ion exchange reaction, leading to the particle dispersion and cracking and thus resulting in the increase. Through the calculation of the permeability coefficient and the study on the intrinsic permeability, it was found that the influence of the permeability coefficient and the intrinsic permeability on the impervious performance of bentonite was concurrent.

Author Contributions

Software, X.L.; Writing—original draft, Y.T.; Writing—review & editing, Y.L. (Yang Liu); Project administration, Y.L. (Yang Liu); Methodology, Y.L. (Yulong Lu). All authors have read and agreed to the published version of the manuscript.

Funding

This work was supported by the Natural Science Foundation of Hunan Province (Grant No. 2022JJ30244) and the Research Project of Teaching Reform of Hunan Province (Grant No. HNJG-2022-0790).

Data Availability Statement

No new data were created or analyzed in this study. Data sharing is not applicable to this article.

Conflicts of Interest

The authors declare no conflict of interest.

References

  1. Komnitsas, K.; Kontopoulos, A.; Lazar, I. Risk assessment and proposed remedial actions in coastal tailings disposal sites in Romania. Miner. Eng. 1998, 11, 1179–1190. [Google Scholar] [CrossRef]
  2. Li, Y.C.; Xu, Z.; Ma, H.; Hursthouse, A.S. Removal of Manganese(II) from Acid Mine Wastewater: A Review of the Challenges and Opportunities with Special Emphasis on Mn-Oxidizing Bacteria and Microalgae. Water 2019, 11, 2493. [Google Scholar] [CrossRef] [Green Version]
  3. Meng, D.; Li, J.; Liu, T.; Liu, Y.; Yan, M.; Hu, J.; Li, H.; Liu, X.; Liang, Y.; Liu, H.; et al. Effects of redox potential on soil cadmium solubility:Insight into microbial community. J. Environ. Sci. 2019, 75, 224–232. [Google Scholar] [CrossRef]
  4. Deng, R.J.; Jin, C.S.; Ren, B.Z.; Hou, B.L.; Hursthouse, A.S. The Potential for the Treatment of Antimony-Containing Wastewater by Iron-Based Adsorbents. Water 2017, 9, 794. [Google Scholar] [CrossRef] [Green Version]
  5. Wang, Z.; Liao, L.; Hursthouse, A.; Song, N.; Ren, B. Sepiolite-based adsorbents for the removal of potentially toxic elements from water: A strategic review for the case of environmental contamination in Hunan, China. Int. J. Environ. Res. Public Health 2018, 15, 1653. [Google Scholar] [CrossRef]
  6. Liu, Y.; Bouazza, A.; Gates, W.P.; Rowe, R.K. Hydraulic performance of geosynthetic clay liners to sulfuric acid solutions. Geotext. Geomembr. 2015, 43, 14–23. [Google Scholar] [CrossRef]
  7. Rowe, R.K.; Mukunoki, T.; Bathurst, R.J. Hydraulic conductivity to Jet-A1 of GCLs after up to 100 freeze–thaw cycles. Géotechnique 2008, 58, 503–511. [Google Scholar] [CrossRef]
  8. Zhao, Y.L.; Zhang, C.S.; Wang, Y.X.; Lin, H. Shear-related roughness classification and strength model of natural rock joint based on fuzzy comprehensive evaluation. Int. J. Rock Mech. Min. Sci. 2021, 137, 104550. [Google Scholar] [CrossRef]
  9. Xie, Q.; Ren, B.Z.; Hursthouse, A.S.; Shi, X.Y. Effects of mining activities on the distribution, controlling factors, and sources of metals in soils from the Xikuangshan South Mine, Hunan Province. Integr. Environ. Assess. Manag. 2022, 18, 748–756. [Google Scholar] [CrossRef]
  10. Liu, Y.; He, B.; Xie, J.; Lu, Y.; Zhang, L. Compatibility of geosynthetic clay liners at different temperatures. J. Environ. Prot. Ecol. 2021, 22, 2295–2306. [Google Scholar]
  11. Feng, H.; Liu, F.; Luo, P.; Xie, G.; Xiao, R.; Hu, W.; Peng, J.; Wu, J. Performance of integrated ecological treatment system for decentralized rural wastewater and significance of plant harvest management. Ecol. Eng. 2018, 124, 69–76. [Google Scholar]
  12. Zhao, Y.L.; Zhang, L.Y.; Liao, J.; Wang, W.J.; Liu, Q.; Tang, L.M. Experimental study of fracture toughness and subcritical crack growth of three rocks under different environments. Int. J. Geomech. 2020, 20, 04020128. [Google Scholar] [CrossRef]
  13. Zhao, Y.L.; Tang, J.Z.; Chen, Y.; Zhang, L.Y.; Wang, W.J.; Liao, J.P. Hydromechanical coupling tests for mechanical and permeability characteristics of fractured limestone in complete stress-strain process. Environ. Earth Sci. 2017, 76, 24. [Google Scholar] [CrossRef]
  14. Tang, L.; Tang, X.W.; Liu, Y.; Qu, S.X. Prediction of pore size characteristics of woven slit-film geotextiles subjected to unequal biaxial tensile strains. Geotext. Geomembr. 2020, 48, 724–734. [Google Scholar] [CrossRef]
  15. Wang, T.; Huang, C.; Du, G.; Liu, Y.; Xie, J.; Li, H. Geochronology, geochemistry and zircon Hf-isotopes of the early Mesoproterozoic Yaopengzi dolerite in SW Yangtze block (Sichuan, SW China): Implications for the Columbia supercontinent breakup. Geosci. J. 2019, 23, 557–573. [Google Scholar] [CrossRef]
  16. Zhang, J.; Deng, R.; Ren, B.; Hou, B.; Hursthouse, A. Preparation of a novel Fe3O4/HCO composite adsorbent and the mechanism for the removal of antimony (III) from aqueous solution. Sci. Rep. 2019, 9, 13021. [Google Scholar] [CrossRef] [PubMed] [Green Version]
  17. Tang, Z.; Deng, R.; Zhang, J.; Ren, B.; Hursthouse, A. Regional distribution characteristics and ecological risk assessment of heavy metal pollution of different land use in an antimony mining area-Xikuangshan, China. Hum. Ecol. Risk Assess. 2020, 26, 1779–1794. [Google Scholar] [CrossRef]
  18. Liu, Y.; Hao, Y.; Lu, Y. Improved design of risk assessment model for PPP project under the development of marine architecture. J. Coast. Res. 2018, 83, 74–80. [Google Scholar] [CrossRef]
  19. Zhu, G.; Wang, C.; Dong, X. Fluorescence excitation-emission matrix spectroscopy analysis of landfill leachate DOM in coagulation-flocculation process. Environ. Technol. 2017, 9, 1489–1497. [Google Scholar] [CrossRef]
  20. Zhou, L.; Liu, X.; Li, J.; Liao, J. Robust AVO inversion for the fluid factor and shear modulus. Geophysics 2021, 86, 471–483. [Google Scholar] [CrossRef]
  21. Liu, Y.; Gates, W.P.; Bouazza, A. Acid induced degradation of the bentonite component used in geosynthetic clay liners. Geotext. Geomembr. 2013, 36, 71–80. [Google Scholar] [CrossRef]
  22. Li, Y.; Hu, X.; Ren, B. Treatment of antimony mine drainage: Challenges and opportunities with special emphasis on mineral adsorption and sulfate reducing bacteria. Water Sci. Technol. 2016, 73, 2039–2051. [Google Scholar] [CrossRef] [PubMed]
  23. Luo, X.; Ren, B.; Hursthouse, A.S.; Thacker, R.M.; Wang, Z. Soil from an Abandoned Manganese Mining Area (Hunan, China): Significance of Health Risk from Potentially Toxic Element Pollution and Its Spatial Context. Int. J. Environ. Res. Public Health 2020, 17, 6554. [Google Scholar] [CrossRef]
  24. Zhou, Y.; Ren, B.; Hursthouse, A.S.; Zhou, S. Antimony Ore Tailings: Heavy Metals, Chemical Speciation, and Leaching Characteristics. Pol. J. Environ. Stud. 2019, 28, 485–495. [Google Scholar] [CrossRef]
  25. Liu, Y.; Gates, W.P.; Bouazza, A. Impact of acid leachates on microtexture of bentonites used in geosynthetic clay liners. Geosynth. Int. 2019, 26, 136–145. [Google Scholar] [CrossRef]
  26. Lu, Y.; Cao, C.; Liu, Y.; Liu, Y. Study on Application of Comprehensive Geophysical Prospecting Method in Urban Geological Survey—Taking Concealed Bedrock Detection as an Example in Dingcheng District, Changde City, Hunan Province, China. Appl. Sci. 2023, 13, 417. [Google Scholar] [CrossRef]
  27. Song, N.; Hursthouse, A.; McLellan, I.; Wang, Z. Treatment of environmental contamination using sepiolite: Current approaches and future potential. Environ. Geochem. Health 2021, 43, 2679–2697. [Google Scholar] [CrossRef]
  28. He, Z.; Ren, B.; Hursthouse, A.; Wang, Z. Efficient removal of Cd(II) using SiO2-Mg(OH)2 nanocomposites derived from sepiolite. Int. J. Environ. Res. Public Health 2020, 17, 2223. [Google Scholar] [CrossRef] [Green Version]
  29. Ling, J.; Dai, S.; Zhou, Y.; Chen, Q.; Zhang, Y.; Li, K. Three-Dimensional DC Anisotropic Resistivity Modeling Using a Method in the Mixed Space-Wavenumber Domain. Pure Appl. Geophys. 2022, 179, 2183–2200. [Google Scholar] [CrossRef]
  30. Song, K.; Ren, X.; Mohanmod, A.; Liu, J.; Wang, F. Research on drinking groundwater source safety management based on numerical simulation. Sci. Rep. 2020, 10, 15481. [Google Scholar] [CrossRef] [PubMed]
  31. Lin, B.; Zhang, C.; Feng, Y. Research progress on temperature effect of impervious clay liners in sanitary landfills. In Proceedings of the Second National Geotechnical and Engineering, Taipei, Taiwan, 28 October–1 November 2006; Chinese Society of Rock Mechanics and Engineering: Wuhan, China, 2006; Volume 2, p. 8. [Google Scholar]
  32. Arden, B.; Mohammad, C. Effect of temperature on hydration of geosynthetic clay liners in landfills. Waste Manag. Res. 2013, 22, 58–71. [Google Scholar]
  33. Zhao, Y.L.; Luo, S.L.; Wang, Y.X.; Wang, W.J.; Zhang, L.Y.; Wan, W. Numerical analysis of karst water inrush and a criterion for establishing the width of water-resistant rock pillars. Mine Water Environ. 2017, 36, 508–519. [Google Scholar] [CrossRef]
  34. Yuan, Q.; Zhu, G. A review on metal organic frameworks (MOFs) modified membrane for remediation of water pollution. Environ. Eng. Res. 2021, 26, 190435.1–190435.2. [Google Scholar] [CrossRef]
  35. Deng, R.J.; Shao, R.; Ren, B.Z.; Hou, B.L.; Tang, Z.E.; Hursthouse, A. Adsorption of Antimony(III) onto Fe(III)-Treated Humus Sludge Adsorbent: Behavior and Mechanism Insights. Pol. J. Environ. Stud. 2019, 28, 577–586. [Google Scholar] [CrossRef] [PubMed]
  36. Yang, X.; Liu, Y.; Yang, C. Research on the slurry for long-distance large-diameter pipe jacking in expansive soil. Adv. Civ. Eng. 2018, 9, 47–54. [Google Scholar] [CrossRef]
  37. Zhao, Y.L.; Liu, Q.; Zhang, C.; Liao, J.; Lin, H.; Wang, Y. Coupled seepage-damage effect in fractured rock masses: Model development and a case study. Int. J. Rock Mech. Min. Sci. 2021, 144, 104822. [Google Scholar] [CrossRef]
  38. Zhang, Y.; Ren, B.; Hursthouse, A.; Deng, R.; Hou, B. Study on the migration rules of Sb in antimony ore soil based on HYDRUS-1D. Pol. J. Environ. Stud. 2018, 28, 965–972. [Google Scholar] [CrossRef]
  39. Zhang, Y.; Ren, B.; Hursthouse, A.; Deng, R.; Hou, B. An Improved SWAT for predicting manganese pollution load at the soil-water interface in a manganese mine area. Pol. J. Environ. Stud. 2018, 27, 2357–2365. [Google Scholar] [CrossRef]
  40. Xie, J.; Liu, Y.; Lu, Y.; Zhang, L. Application of the high-density resistivity method in detecting a mined-out area of a quarry in Xiangtan City, Hunan Province. Front. Environ. Sci. 2022, 10, 1068956. [Google Scholar]
  41. Hou, B.L.; Liu, X.; Li, Z.; Ren, B.Z.; Kuang, Y. Heterogeneous fenton oxidation of butyl xanthate catalyzed by iron-loaded sewage sludge. Fresenius Environ. Bull. 2022, 31, 4125–4131. [Google Scholar]
  42. Zhao, Y.L.; Zhang, L.; Wang, W.; Tang, J.; Lin, H.; Wan, W. Transient pulse test and morphological analysis of single rock fractures. Int. J. Rock Mech. Min. Sci. 2017, 91, 139–154. [Google Scholar] [CrossRef]
  43. Hou, B.; Li, Z.; Deng, R.; Ren, B. Advanced treatment of coal chemical industry wastewater by expansive flow biological aerated filter. Fresenius Environ. Bull. 2017, 26, 4517–4521. [Google Scholar]
  44. Shi, X.; Ren, B.; Hursthouse, A. Source identification and groundwater health risk assessment of PTEs in the stormwater runoff in an abandoned mining area. Environ. Geochem. Health 2022, 44, 3555–3570. [Google Scholar] [CrossRef] [PubMed]
  45. Zhang, Y.; Huang, F. Indicative significance of the magnetic susceptibility of substrate sludge to heavy metal pollution of urban lakes. Sci. Asia 2021, 47, 374. [Google Scholar] [CrossRef]
  46. Hanson, J.L.; Chrysovergis, T.S.; Yesiller, N. Temperature and moisture effects on GCL and textured geomembrane interface shear strength. Geotextile Geomembr. 2015, 22, 110–124. [Google Scholar] [CrossRef]
  47. Jiang, J. Experimental Study on Application Characteristics of GCL under Complex Conditions; Wenzhou University: Wenzhou, China, 2017. [Google Scholar]
  48. He, J.; Hu, X.; Yan, X.; Wan, J. Temperature effect test on clay permeability. Adv. Sci. Technol. Water Resour. 2017, 37, 55–60. [Google Scholar]
  49. Shao, Y.; Shi, B.; Liu, C.; Gu, K.; Tang, C. Study on temperature effect of hydrophysical properties of clay. J. Geotech. Eng. 2011, 33, 1576–1582. [Google Scholar]
  50. Ishimori, H.; Katsumi, T. Temperature effects on the swelling capacity and barrier performance of geosynthetic clay liners permeated with sodium chloride solutions. Geotext. Geomembr. 2012, 33, 25–33. [Google Scholar] [CrossRef]
  51. Ye, W.M.; Wan, M.; Chen, B.; Chen, Y.; Cui, J. Temperature effects on the unsaturated permeability of the densely compacted GMZ01 bentonite under confined conditions. Eng. Geol. 2012, 126, 1–7. [Google Scholar] [CrossRef] [Green Version]
  52. Tang, C.; Shi, B. Swelling and shrinkage deformation characteristics of expansive soil during the dry-wet cycle. Chin. J. Geotech. Eng. 2011, 33, 1376–1384. [Google Scholar]
  53. Xie, Q.; Ren, B. Pollution and risk assessment of heavy metals in rivers in the antimony capital of Xikuangshan. Sci. Rep. 2022, 12, 14393. [Google Scholar] [CrossRef] [PubMed]
  54. Zhou, S.; Hursthouse, A. The impact of physical properties on the leaching of potentially toxic elements from antimony ore processing wastes. Int. J. Environ. Res. Public Health 2019, 16, 2355. [Google Scholar] [CrossRef] [PubMed] [Green Version]
  55. Song, K.; Yang, G.; Wang, F.; Liu, J.; Liu, D. Application of Geophysical and Hydrogeochemical Methods to the Protection of Drinking Groundwater in Karst Regions. Int. J. Environ. Res. Public Health 2020, 17, 3627. [Google Scholar] [CrossRef] [PubMed]
  56. Lu, Y.; Yang, T.; Abdollah, T.; Liu, Y. Fast Recognition on Shallow Groundwater and Anomaly Analysis Using Frequency Selection Sounding Method. Water 2023, 15, 96. [Google Scholar]
  57. Rushton, A.; Ward, A.S.; Holdich, R.G. Solid-Liquid Filtration and Separation Technology, 2nd ed.; Wiley-VCH Verlag GmbH: Weinbeim, Germany, 2000. [Google Scholar]
  58. Chung, J.; Daniel, D.E. Modified fluid loss test as an improved measure of hydraulic conductivity for Bentonite. Geotech. Test. J. 2008, 31, 243–251. [Google Scholar]
  59. Katsumi, T.; Ishimori, H.; Onikata, M.; Fukagawa, R. Long-term barrier performance of modified bentonite materials against sodium and calcium permeant solutions. Geotext. Geomembr. 2008, 26, 14–30. [Google Scholar] [CrossRef]
Figure 1. Location map of the study area.
Water 15 01132 g001
Figure 2. Fluid loss of bentonite with different test solutions at various temperatures ((ac) are bentonite with deionized water, Xikuangshan, and Baojinshan, respectively; A, B refer to bentonite A and bentonite B, respectively).
Water 15 01132 g002
Figure 3. Free swell index of bentonite A and B at different temperatures.
Water 15 01132 g003
Figure 4. XRD spectrum of bentonite at different temperatures ((a) bentonite B+Xikuangshan mining leachates and (b) bentonite B+Baojinshan mining leachates).
Water 15 01132 g004aWater 15 01132 g004b
Figure 5. SEM images of bentonite A with test solutions at various temperature. ((ac) are Bentonite A with deionized water, Baojinshan mining leachates, and Xikuangshan mining leachates, respectively, at room temperature, 50 °C, 60 °C, and 70 °C).
Water 15 01132 g005aWater 15 01132 g005b
Figure 6. Relationship between the free swell index and permeability ((a) from Katusmi and (b) from the data in this study).
Water 15 01132 g006
Figure 7. Intrinsic permeability of two bentonites ((a) for bentonite A and (b) for bentonite B) at different temperatures.
Water 15 01132 g007
Table 1. Basic constituents of bentonite.
Bentonite ABentonite B
Mineral Constituents/%Montmorillonite78.174.1
Quartz7.65.3
Feldspar9.69.4
Calcite4.76.1
Mica5.1
Element Constituents/%O47.545.4
Na2.98.01
Mg1.591.05
Al8.678.18
Si29.3728.61
K1.071.07
Ca3.482.85
Others5.424.38
Table 2. Element content table of Xikuangshan ore leachate.
ElementAlCaKMgNaPbSSiSbSrW
mg/Lmg/Lmg/Lmg/Lmg/Lmg/Lmg/Lmg/Lmg/Lmg/Lmg/L
Content0.0337.119.924800.0219290.020.071.8
Table 3. Element content table of Baojinshan ore leachate.
ElementAlCaKMgLiNaSSiSbSr
mg/Lmg/Lmg/Lmg/Lmg/Lmg/Lmg/Lmg/Lmg/Lmg/L
Content0.2620.922.03.90.1244413168.40.0230.208
Table 4. X-ray fluorescence element content of Bentonite in Baojinshan leachate.
SampleElement
ONaMgAlSiPSCl
A47.2002.6501.4908.95228.0500.1140.0551.227
A + 50 °C46.1002.8001.5007.99927.2300.0891.4791.290
A + 70 °C47.5003.5101.5808.16327.4900.0990.7151.200
KCaTiCrMnFeNiCu
A2.0604.1510.4450.0050.0643.409-0.007
A + 50 °C1.0503.8380.435-0.0873.103--
A + 70 °C0.9583.7090.447-0.0773.156-0.003
ZnGaRbSrZrNbBaOthers
A0.010-0.0050.0110.009-0.0730.010
A + 50 °C0.009-0.0040.0270.016-0.0652.154
A + 70 °C0.009-0.0040.0290.014-0.0691.962
ONaMgAlSiPSCl
B42.2005.4601.3508.87728.9600.0870.3980.886
B + 50 °C47.9003.3801.5008.24028.2600.1010.5511.280
B + 70 °C47.4003.8301.4808.07930.1500.0910.3621.240
KCaTiCrMnFeNiCu
B1.0603.1510.4450.0050.0643.409-0.007
B + 50 °C1.2392.9180.454-0.0743.147--
B + 70 °C1.1002.8900.436-0.0733.131--
ZnGaRbSrZrNbBaOthers
B0.010-0.0050.0110.009-0.0730.013
B + 50 °C0.009-0.0040.0280.012-0.0750.390
B + 70 °C0.009-0.0040.0280.012-0.0740.021
Table 5. Calculation value of permeability coefficient of bentonite at high temperature.
BentoniteAB
Temperature( °C)05060700506070
De-ionized water6.96 × 10−98.12 × 10−91.22 × 10−83.24 × 10−82.04 × 10−84.63 × 10−86.11 × 10−88.56 × 10⁻⁸
Baojinshan leachates2.62 × 10−84.46 × 10−87.15 × 10−89.35 × 10−84.37 × 10−85.12 × 10−87.26 × 10−89.44 × 10⁻⁸
Xikuangshan leachates9.18 × 10−96.04 × 10−78.81 × 10−72.12 × 10−64.14 × 10−74.78 × 10−76.88 × 10−78.66 × 10⁻⁷
Disclaimer/Publisher’s Note: The statements, opinions and data contained in all publications are solely those of the individual author(s) and contributor(s) and not of MDPI and/or the editor(s). MDPI and/or the editor(s) disclaim responsibility for any injury to people or property resulting from any ideas, methods, instructions or products referred to in the content.

