1. Introduction
As cities are facing the impacts of climate change and urbanisation [
1], the expansion and densification of built-up areas and human activities have increased the emission of GHG. Cities consume around 67–76% of energy worldwide and generate 71–76% of global CO
2 emissions [
2,
3]. The increase of urban population continuing in the coming decades poses challenges to the habitability and sustainability of cities, especially megacities across the world in all climate zones. More frequent extreme climate events caused by the compounded effects of climate change and urban development could lead to severe consequences to regional ecological, socio-economic and infrastructure systems [
4,
5]. Global sea-level rise is predicted to accelerate during the 21st century and could rise 65 ± 12 cm by 2100 compared with 2005 [
6,
7]. The coastal regions are extremely vulnerable to climate change [
8], especially for low-lying coastal plains and deltas, as they are most likely to be affected due to further human-induced sediment starvation and land sinking [
9,
10]. About 23% of the world’s population (around 1.2 billion people) live within 100 km of the coast, and this figure is estimated to reach 50% in 2030 [
11]. Many regional key cities are located in river delta regions due to historical, trading and institutional reasons. The increased coastal flooding contributed by rising sea levels poses serious threats and challenges to regional and national sustainability and stability.
Climate change will also exacerbate the urban heat island effect (UHI). UHI can be defined as zones with increased temperature compared with surrounding parts inside cities [
12]. It usually happens in the built-up areas as both air and surface temperatures will be higher when compared with green space, due to changes of heat-absorbing surfaces, anthropogenic heat production, development of specific air circulation patterns (e.g., street canyons) and other factors [
13,
14]. The exact phenomena vary for each city and depend on its size and geographic location; however, for those located in warm climate zones with a large population, its manifestation is relatively higher [
13,
15]. The damage of extreme heatwaves brought by UHI are related to increased human discomfort and their effects (including higher mortality and morbidity of inhabitants), more energy consumption during hot seasons and impaired air and water quality and other adverse impacts [
16,
17]. The most vulnerable groups of citizens include children, women, people with special needs, elderly persons, people with low incomes, those with social and physical impairments and those with no accessibility to mitigation measures such as air-conditioning, whom are most likely to be more exposed to the danger of heatwaves [
18].
The current study investigates the impact of climate change on one Chinese coastal megacity, Guangzhou, for both physical and social aspects. To analyse physical aspects, the current study used satellite-derived/remote-sensing datasets. This study then assessed climate change’s physical factors such as temperatures and precipitation by using geo-spatial tools. For social aspects, an online survey was carried out to ascertain public perceptions on the impacts of climate change in Guangzhou city. Then, these results were compared with five similar cities to better understand the severity of climate change in different sites in context with the current study area. Furthermore, the research also compared both physical and social science survey results to better understand the trends of physical data analysis and public opinion. These results will be helpful to the regional, sub-regional and national policy and decision makers to revise existing or establish new strategies to improve the environment and quality of life in coastal megacities, particularly Ganzhou. The results will also be helpful for comparing with other similar cities across China and the Global South.
2. Literature Review
2.1. Climate Change in China
The reported rise during this century in the mean temperature of the planet’s surface is referred to as climate change or global warming [
19,
20,
21]. There is no doubt that climate change is becoming more severe across the globe. There are limited studies which offer critical insights into the direct links of climate change to the built environment, coastal regions and cities. According to the Intergovernmental Panel on Climate Change (IPCC), the pace of climate change is accelerated due to human activities, and it is reported with 95% confidence that people are the main reason for global warming and Earth’s climate changing [
22,
23]. China is subjected to some of the world’s most devastating natural disasters on a regular basis. For instance, in China, droughts, earthquakes, typhoons, floods and landslides/mudslides have frequently occurred [
24,
25,
26]. Moreover, it is predicted that by 2030, the mean air temperature in China will rise by 2.2 °C and by 2050 that the average surface temperature increase difference will reach 2.8 °C [
27]. The consequences of climate change will be harsh for all regions in China, from North to South. China contributes to climate change mitigation by setting appropriate environmental goals, not only to avoid these consequences that will affect its region but also to contribute to the global effort to combat climate change [
28,
29,
30].
2.2. Urban Heat Island Impact in China
An urban heat island (UHI) is a metropolitan area that is significantly warmer than the rural areas surrounding it. It is therefore considerably affected by urbanisation [
31,
32]. This phenomenon has an impact on earth systems and accordingly on microclimatology, water and air quality, vegetation growth, human wellbeing and energy consumption [
33,
34,
35]. These impacts impose additional challenges on policy makers and other multi-stakeholders contributing to the sustainable built and urban environment. Therefore, different studies have been required to investigate the effect of UHI on metropolitan cities; for example, Tian and co-authors [
36] stated that China has and is still experiencing the most rapid urbanisation and is accordingly a great example for studying UHI effects. Zhou and co-researchers [
37] examined UHI’s effect on 32 major Chinese cities using moderate resolution imaging spectroradiometer land surface temperature products in conjunction with cloud-free Landsat Thematic Mapper and Enhanced Thematic Mapper Plus images between 2003 and 2012. The study showed that the UHI effect diminished exponentially toward rural areas for most of the studied cities that belonged to different climatic zones. Yue along with co-researchers [
38] expanded the research to 36 Chinese cities to examine diurnal and seasonal UHI intensities and their relation to urban configuration. The study showed that urban configuration was found to be significantly correlated to UHI intensities during summer; however, significance was not detected in winter. Another study also found that UHI intensities are also influenced by other factors including the land cover features, cloud coverage and air velocity [
39,
40]. The authors recommended renewable energy as an effective solution to mitigate UHI in urbanised areas.
The relationship between UHI and energy consumption has also been studied in various other aspects. According to Wong and team [
41], building energy demands have accounted for 24.1% and 27.5% in 1996 and 2001, respectively. Zhou and co-researchers [
42] added that building energy consumption is significantly affected by UHI, as it was found to be increasing the average cooling energy consumption by 19.0% at the regional and global levels [
42]. Studies showed that the UHI effect was found to be increasing the air-conditioning demands in urban areas including Beijing [
43] and Hong Kong [
44]. Although many studies have investigated the effect of UHI in Chinese cities, more studies are required to guide relevant evidence-based public policies for UHI effect mitigation.
2.3. China: Physical and Social Geography
China is the second-largest economy in the world [
45] with widely varying geographic and climate features. During the past 40 years, since the adoption of its socio-economic opening-up policy, China’s urbanisation rate has augmented from 17.92% to 59.58% with an average annual urbanisation growth rate of 1.04%. This is much higher than the global average during the same period [
46]. Its urban population increased from 172.45 million to 831.37 million, and the number of cities increased from 193 to 657 [
46]. This rapid and vast urbanisation process has been the major engine promoting China’s economic growth. It contributed to the construction of public infrastructure, the upgrading of the service industry and the expansion of consumer markets. Thus, the continuity of urbanisation is among the key economic strategies adopted by the central government. Urban agglomerations are planned at the national/regional/local level to guide the future growth. Among the five national agglomerations, three (Yangtze River Delta, Zhujiang River Delta and Beijing–Tianjin–Hebei) are located along the coastline and are exposed to rising sea level caused by climate changes.
The Guangdong province hosts the Zhujiang River Delta and has shown the highest rate of urbanisation [
47]. Since the opening-up policy was adopted in 1978, which aimed to encourage foreign investment, five special economic zones (SEZ) have been set up. Three out of all five of these SEZs were located in Guangdong province, which includes Shenzhen, Zhuhai and Shantou. Ever since then, Guangdong has witnessed consistent urban expansion and economic gain, although some of them were gained at the cost of environmental damages. Today, it is still one of the most important economic and industrial powerhouses in China and has a vital impact on regional and national political stability. As mentioned before, the fast increase of GDP and urban built areas are mainly driven by industrial and sustainable infrastructure-oriented investment. This has led to several problems such as inefficient land use, unequitable spatial distributions and environmental impacts, leading to worsening climate changes. In light of this, the central government has set out a new strategy for urban development which prioritises the balance between tackling climate changes and economic growth. The comfort, happiness and health of urban residents are the main elements to be considered in the decision making of policies. The newly planned urban built areas should provide more equal consideration of improved living conditions to people and the creation of more sustainable environments for industries and businesses. Both short-term hazards such as UHI, which can affect residents’ lives and work, and the long-term impact on the climate, which leads to the deterioration of coastal flooding, are acute problems calling for urgent solutions. Adopting a regional case study, we use Guangzhou city as the example to study how UHI has impacted the local climate and what it has contributed to the increase of coastal flooding. Moreover, we will discuss how the findings can support effective strategies for urban planning and policy making to mitigate climate change impacts.
2.4. Guangzhou City as Regional Case Study
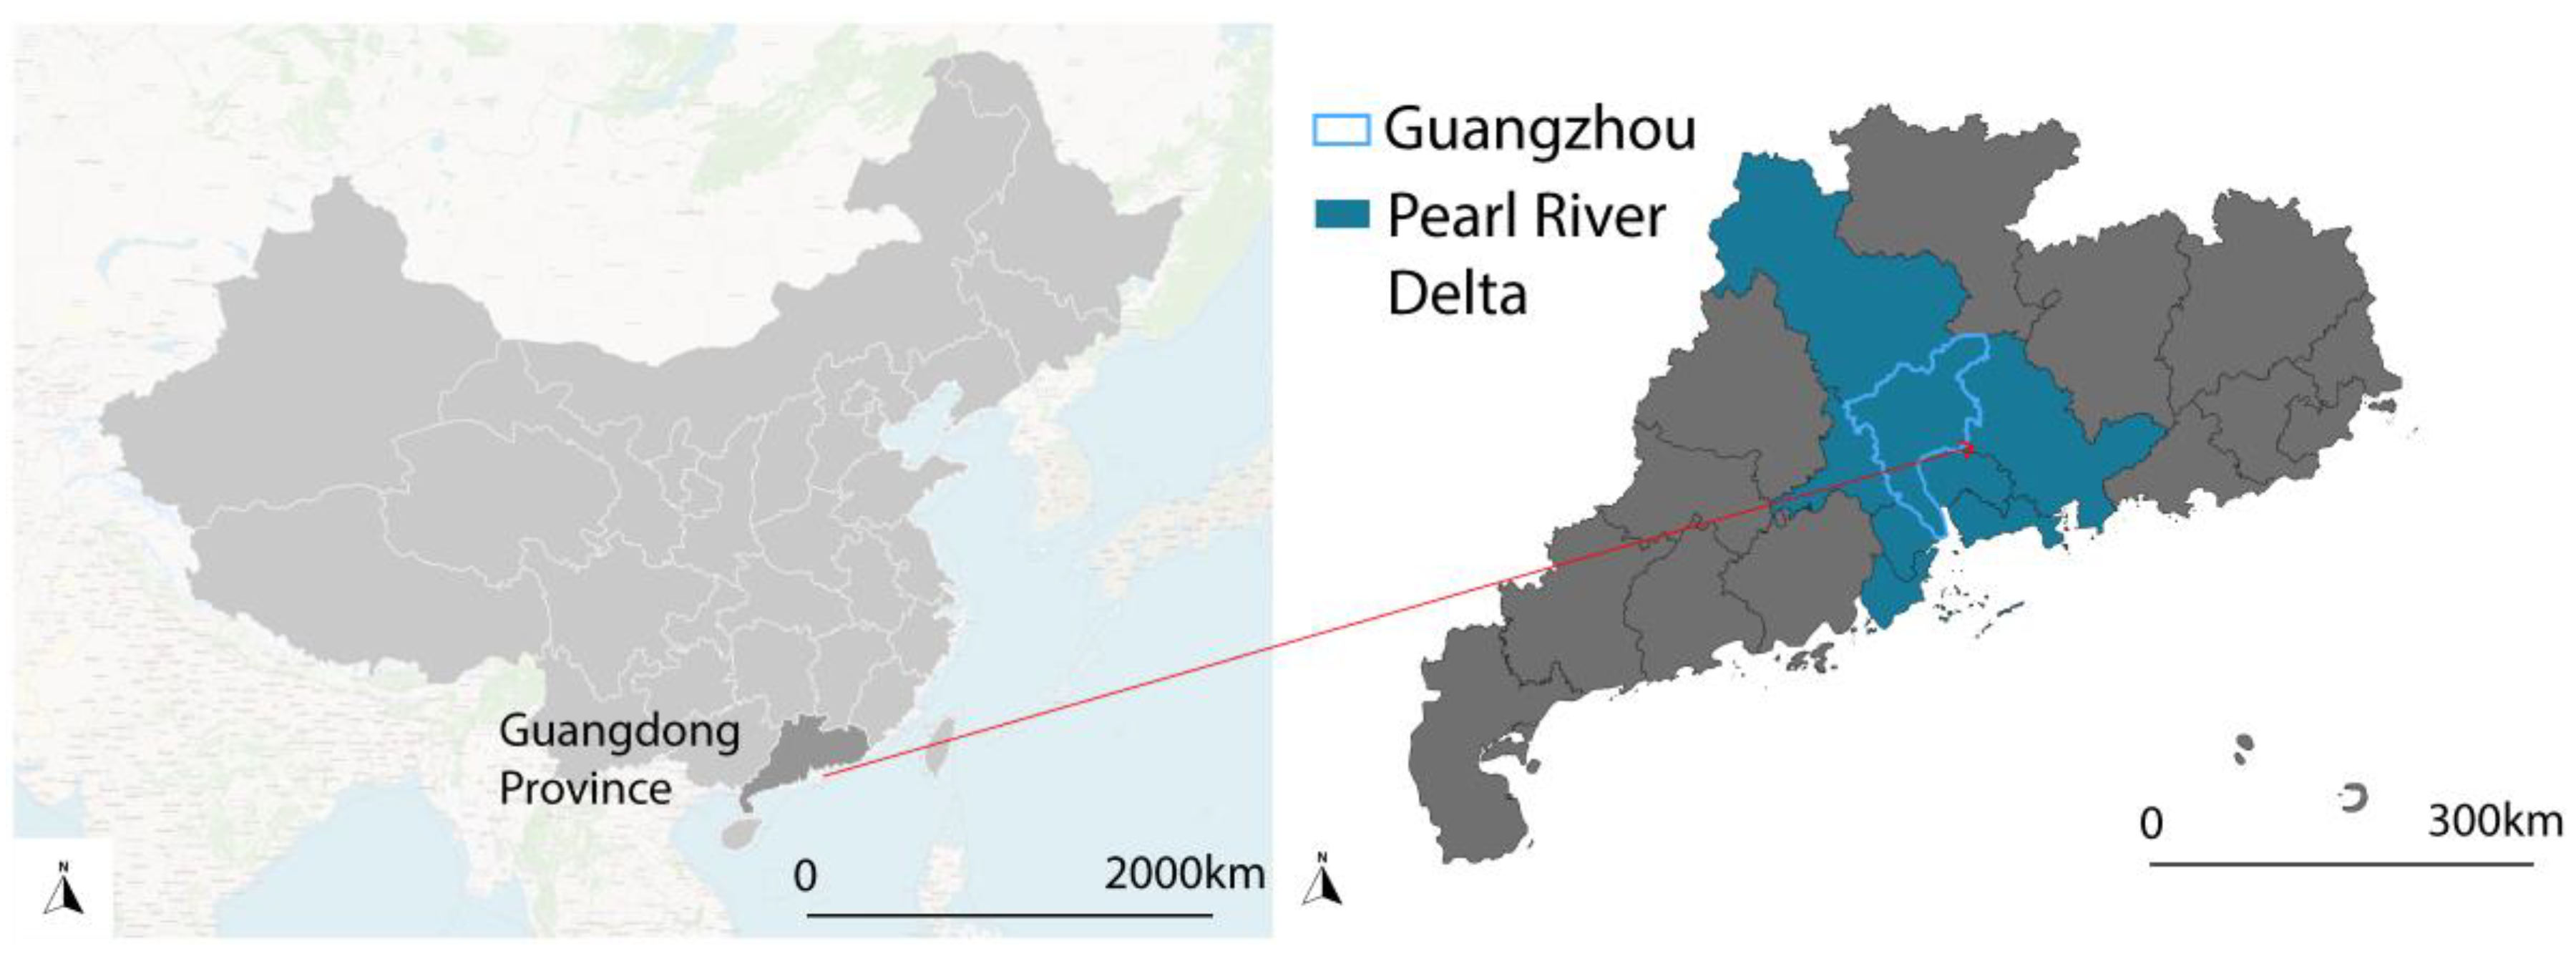
Guangzhou is the third-largest city in China and the main city in the Pearl River Delta (PRD) area (
Figure 1). The total area of Guangzhou city is 7434.40 km
2, including 11 districts, and the central urban area is 3843 km
2. In 1987, Guangzhou was nominated as the “experimental field” [
48] under the open-door policy, which led the city to become the first region in China to experience marketisation. Due to the market-oriented urbanisation, the spatial structure has been changed. Due to urbanisation and shrinkage of surface water, the previous canals and streams in the old towns have been replaced by modern transport-related infrastructures; urban developments have been built upon flood buffers which were previously used as floodplains and waterfronts. According to Zhou and Cai [
49], the average tidal level is at +2.02 m MSL (mean sea level), while most of the urban segments in Guangzhou are situated less than +2.0 m MSL, which means those areas can be flooded by the diurnal tidal effects and suffer from flooding. Meanwhile, the Pearl River was sharply narrowed by continuous land reclamation and usual sedimentation towards the south [
50]. Due to the high occurrence of typhoons, large populations are exposed to flooding on a regular basis in this area [
51].
3. Methodology
Historical climate change data between 1960 and 2021 were accessed through open-source data providers including World Weather Online and Meteostat. The data file was acquired via REST API and saved as JSON files. The contents of the data cover records for temperature, precipitation, humidity and wind speed, which are key parameters for assessing climate change; however, the Guangzhou study focused its evaluation on precipitation and temperatures. For the comparison study, evaluated temperatures, perception and humidity were considered. More recent hourly weather data were accessed through the open-source data provider Kaggle. The hourly weather data include humidity, precipitation, cumulated precipitation, average temperature and PM2.5 concentration from 2010 to 2015. In particular, PM2.5 readings are often included in air-quality reports from environmental authorities and companies. PM2.5 refers to atmospheric particulate matter (PM) that has a diameter less than 2.5 µm and used as a measure of pollution.
Guangzhou is then compared to five other cities located in the same province with similar climate characteristics but different built area size and population density. The cities selected are Heyuan, Shantou, Shaoguan, Shenzhen and Yangjiang. Moreover, the comparison was undertaken for a period of 30 years, from 1992 to 2021. The weather variables that have been compared between the six different cities are the average temperature, the maximum temperature, the precipitation and the wind speed. In addition, the graphs were created with Python programming language, using Jupyter notebook, Anaconda and the comparison maps with QGIS Desktop 3.22.4 software. Finally, the analysis was carried out initially for the 30-year period, and then for the 5 recent years and lastly for the year 2021, which is the latest for which data are available. Finally, an online survey was conducted in Guangzhou to understand how climate change and the urban heat island affect local residents’ lives and work. The survey collected the participants’ demographic data, their knowledge on climate related crises and their opinions on how to tackle these challenges within the local industrial and cultural contexts.
4. Results
4.1. Climate Change Pattern of Guangzhou-Precipitation
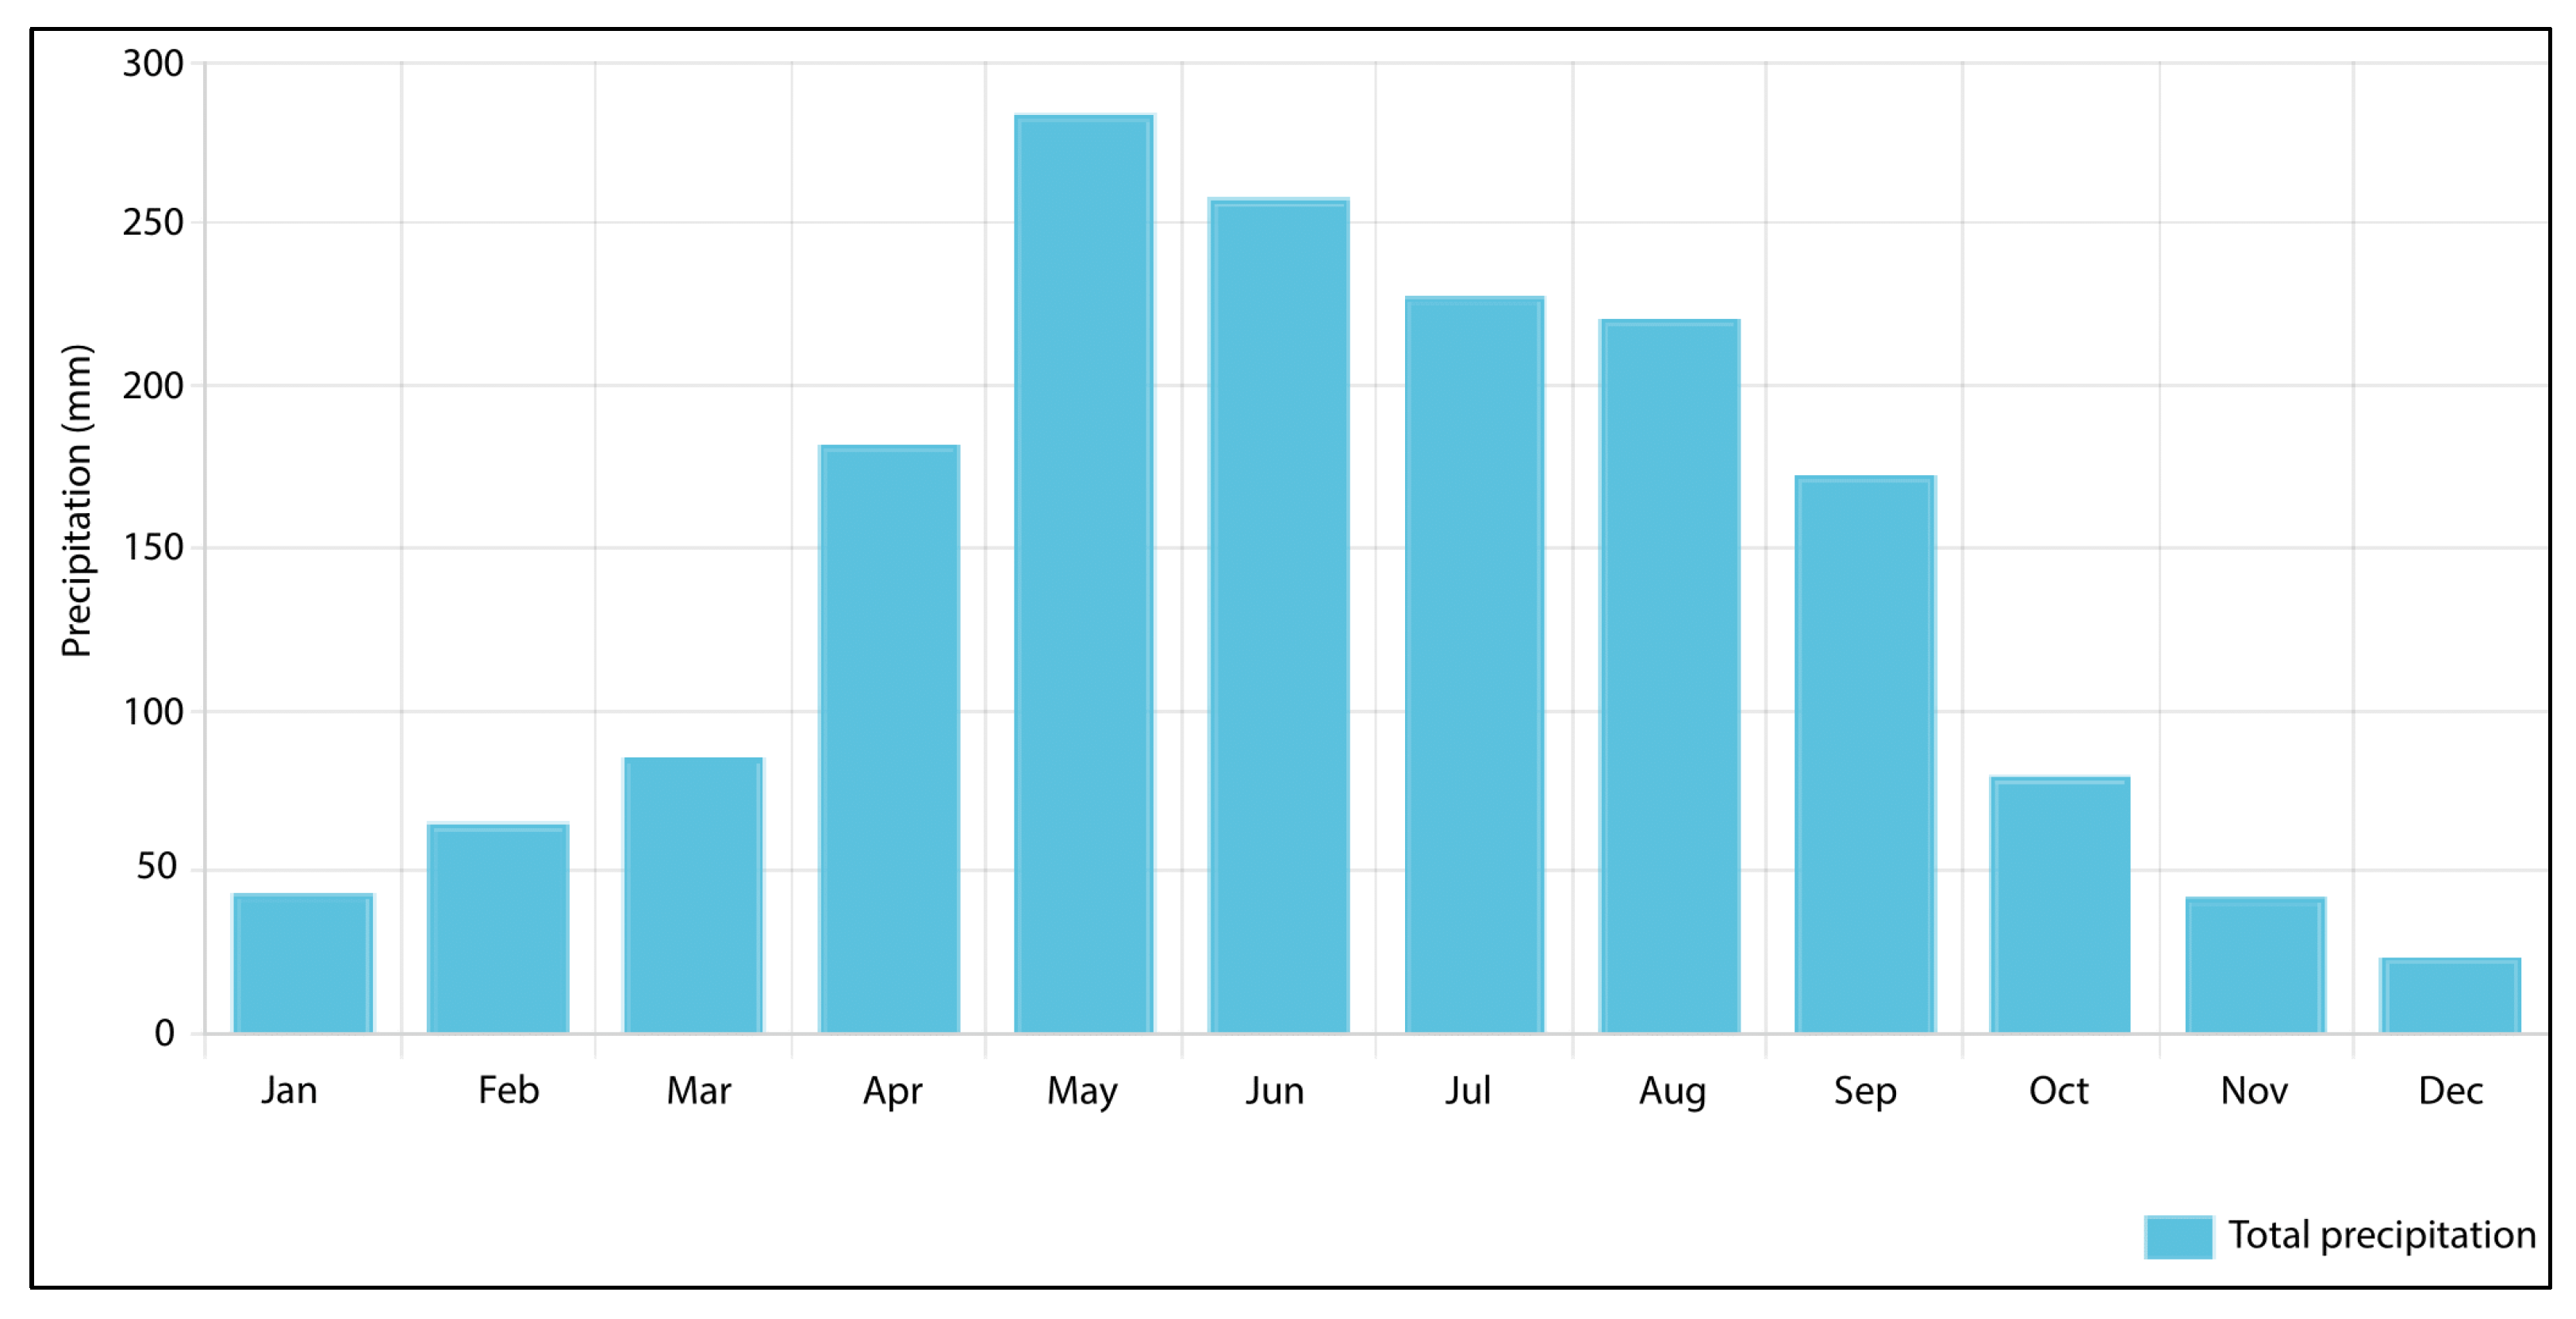
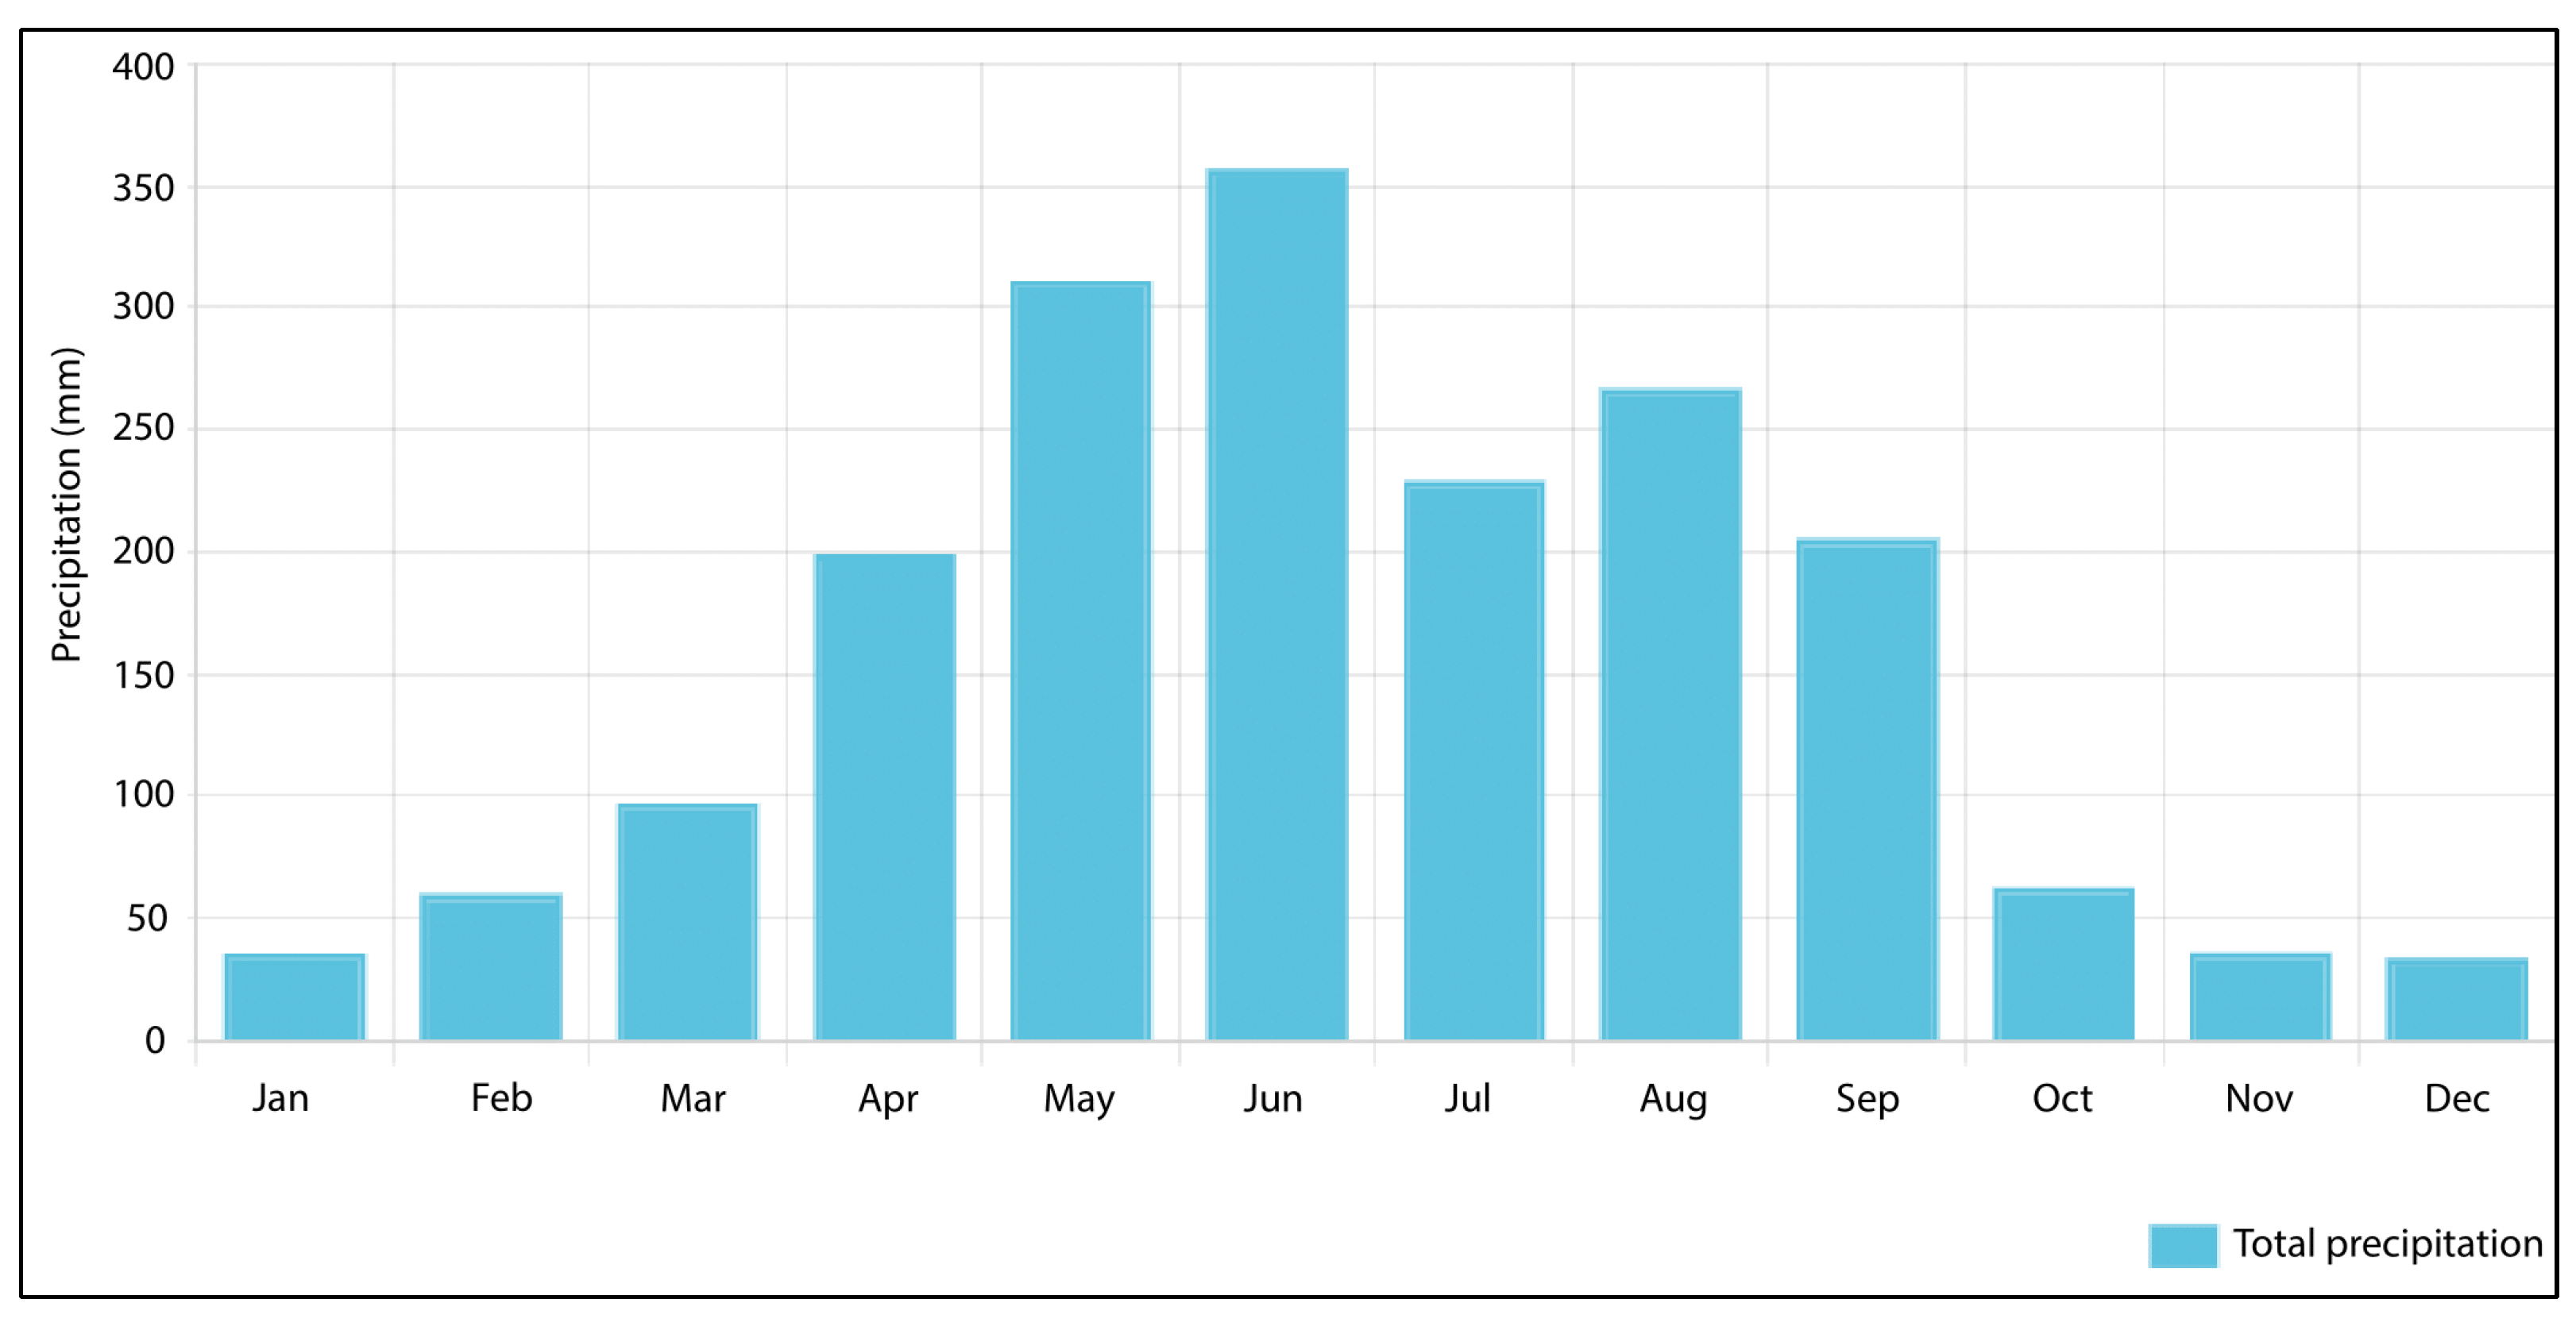
To study the changes of climate, we firstly compared precipitation data of two periods, each covering 30 years. The monthly average precipitation data between 1961 to 1990 and 1991 to 2020 are shown in
Figure 2 and
Figure 3. During the period 1961–1990, the city received most rainfall in May, reaching 283.6 mm. During the period 1991–2020, the city received the highest rainfall in June, which was recorded at 356.6 mm and shows an increase of 73 mm. The severe monsoon season brought more risks of flooding, particularly coastal flooding, to the city.
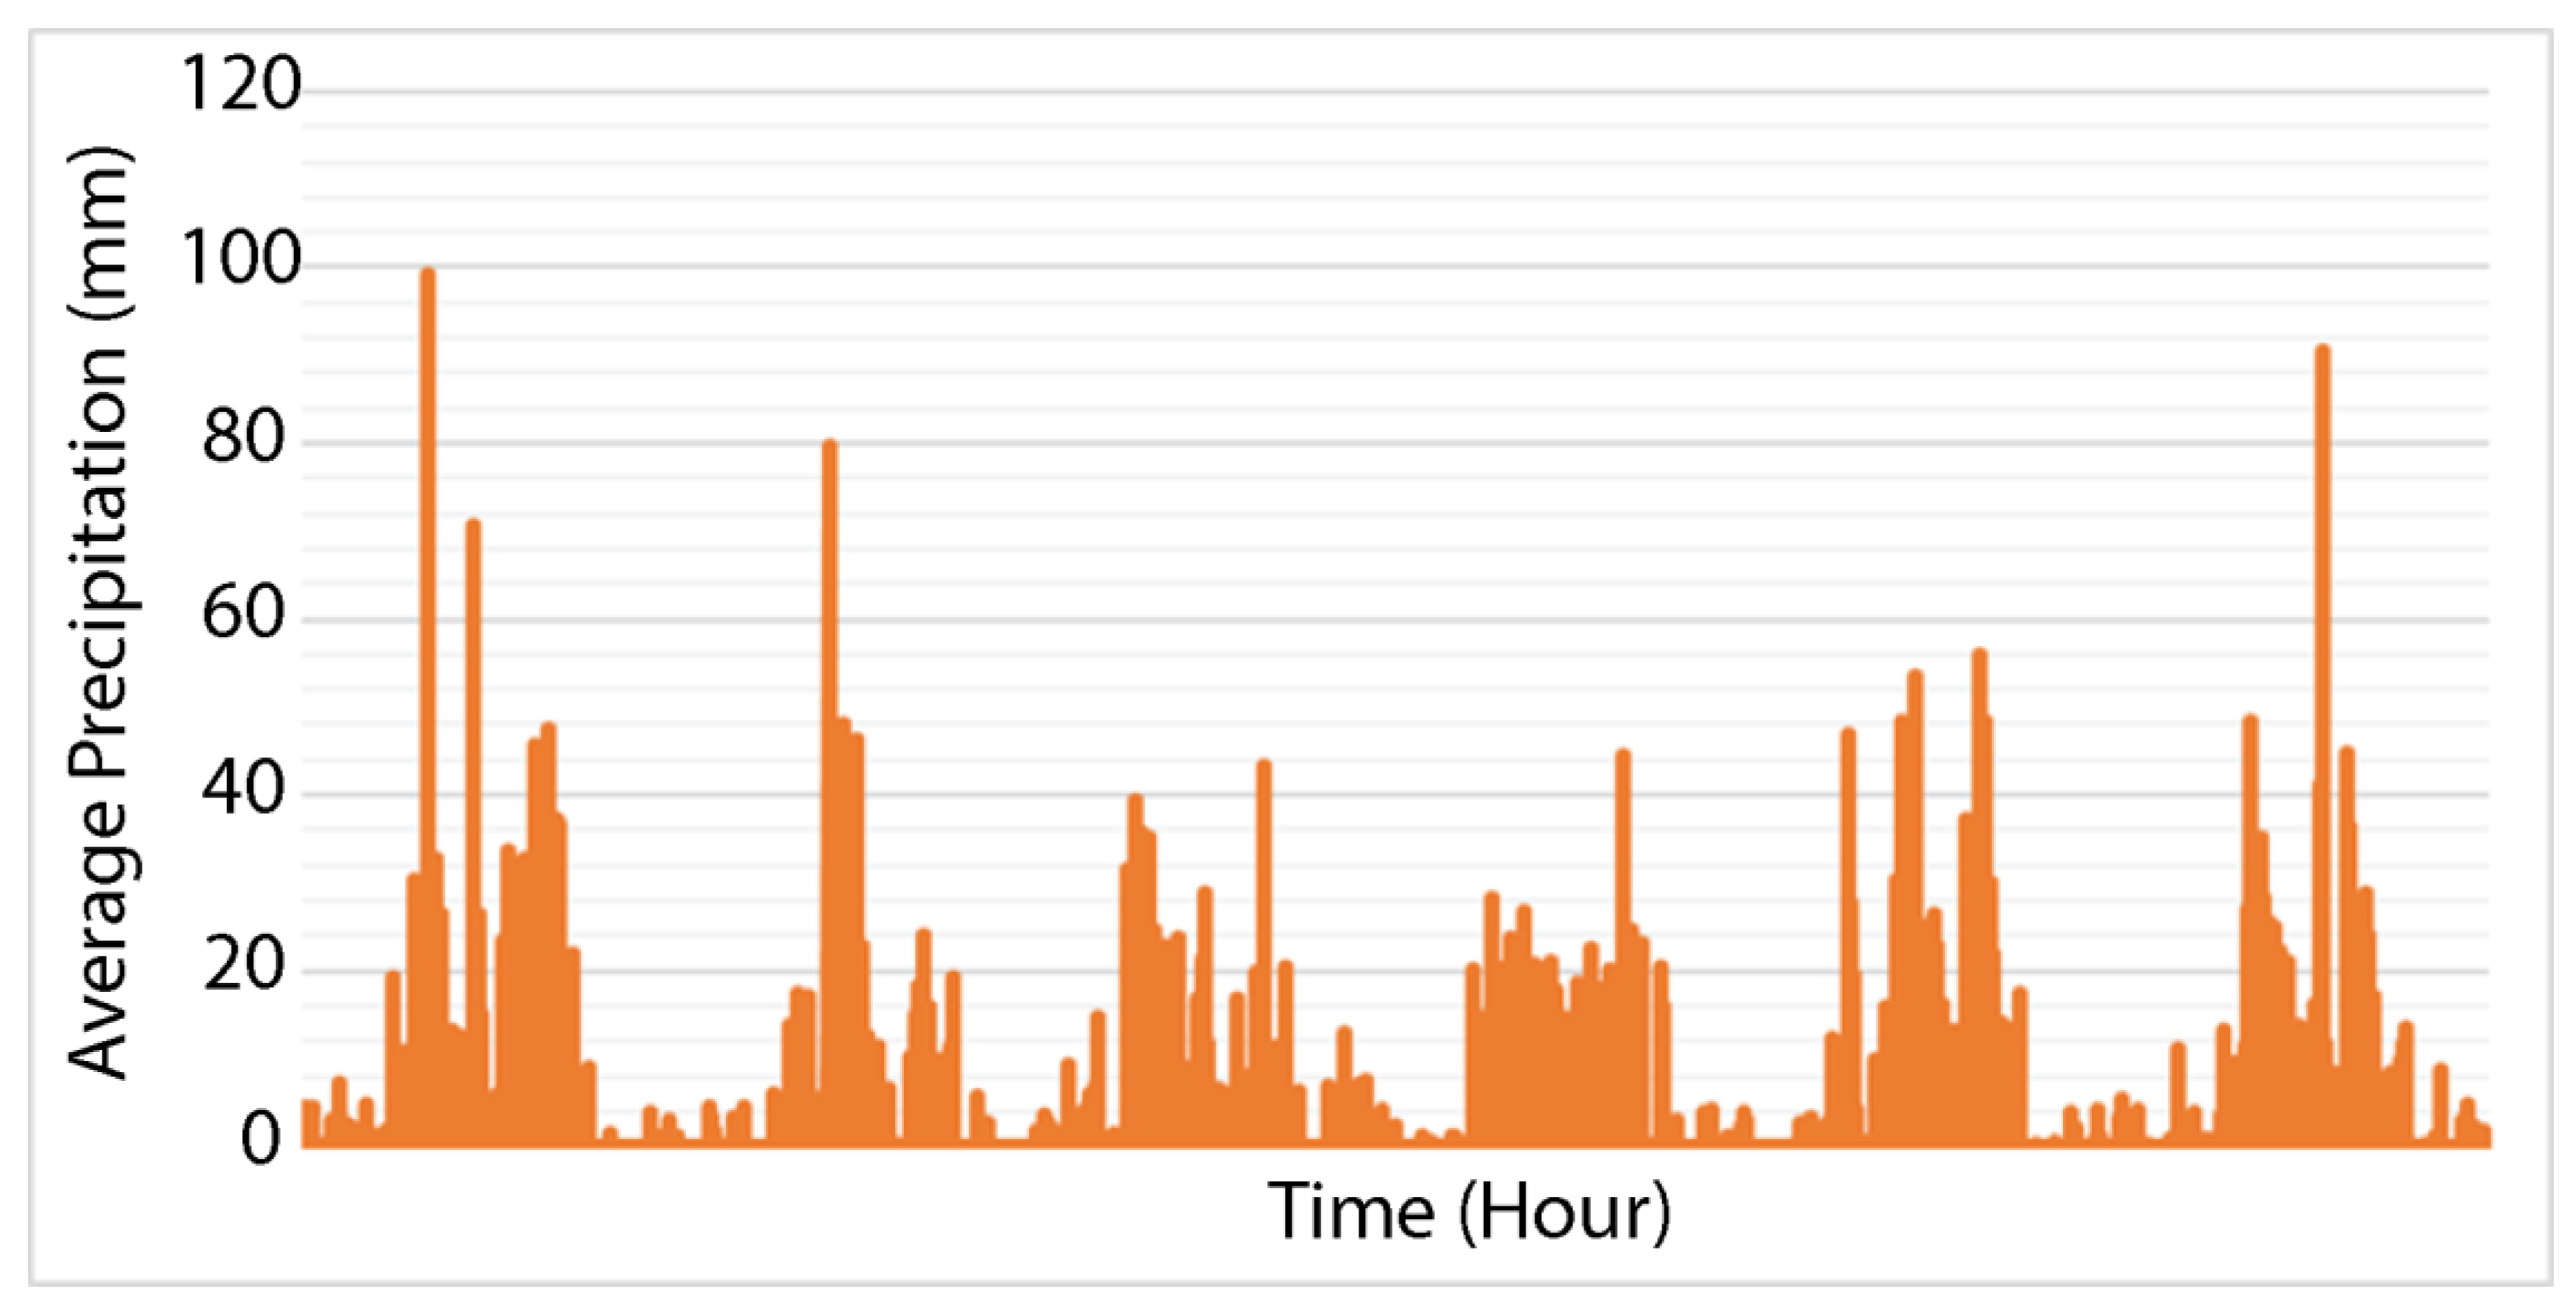
Examining the data at a more detailed temporal resolution, the hourly precipitation between 2010 and 2015 is illustrated in
Figure 4. The precipitation changed not only throughout the months but also throughout the years. More specifically, the years 2012 and 2013 are notable in that they are characterized as comparably drier years.
4.2. Temperatures
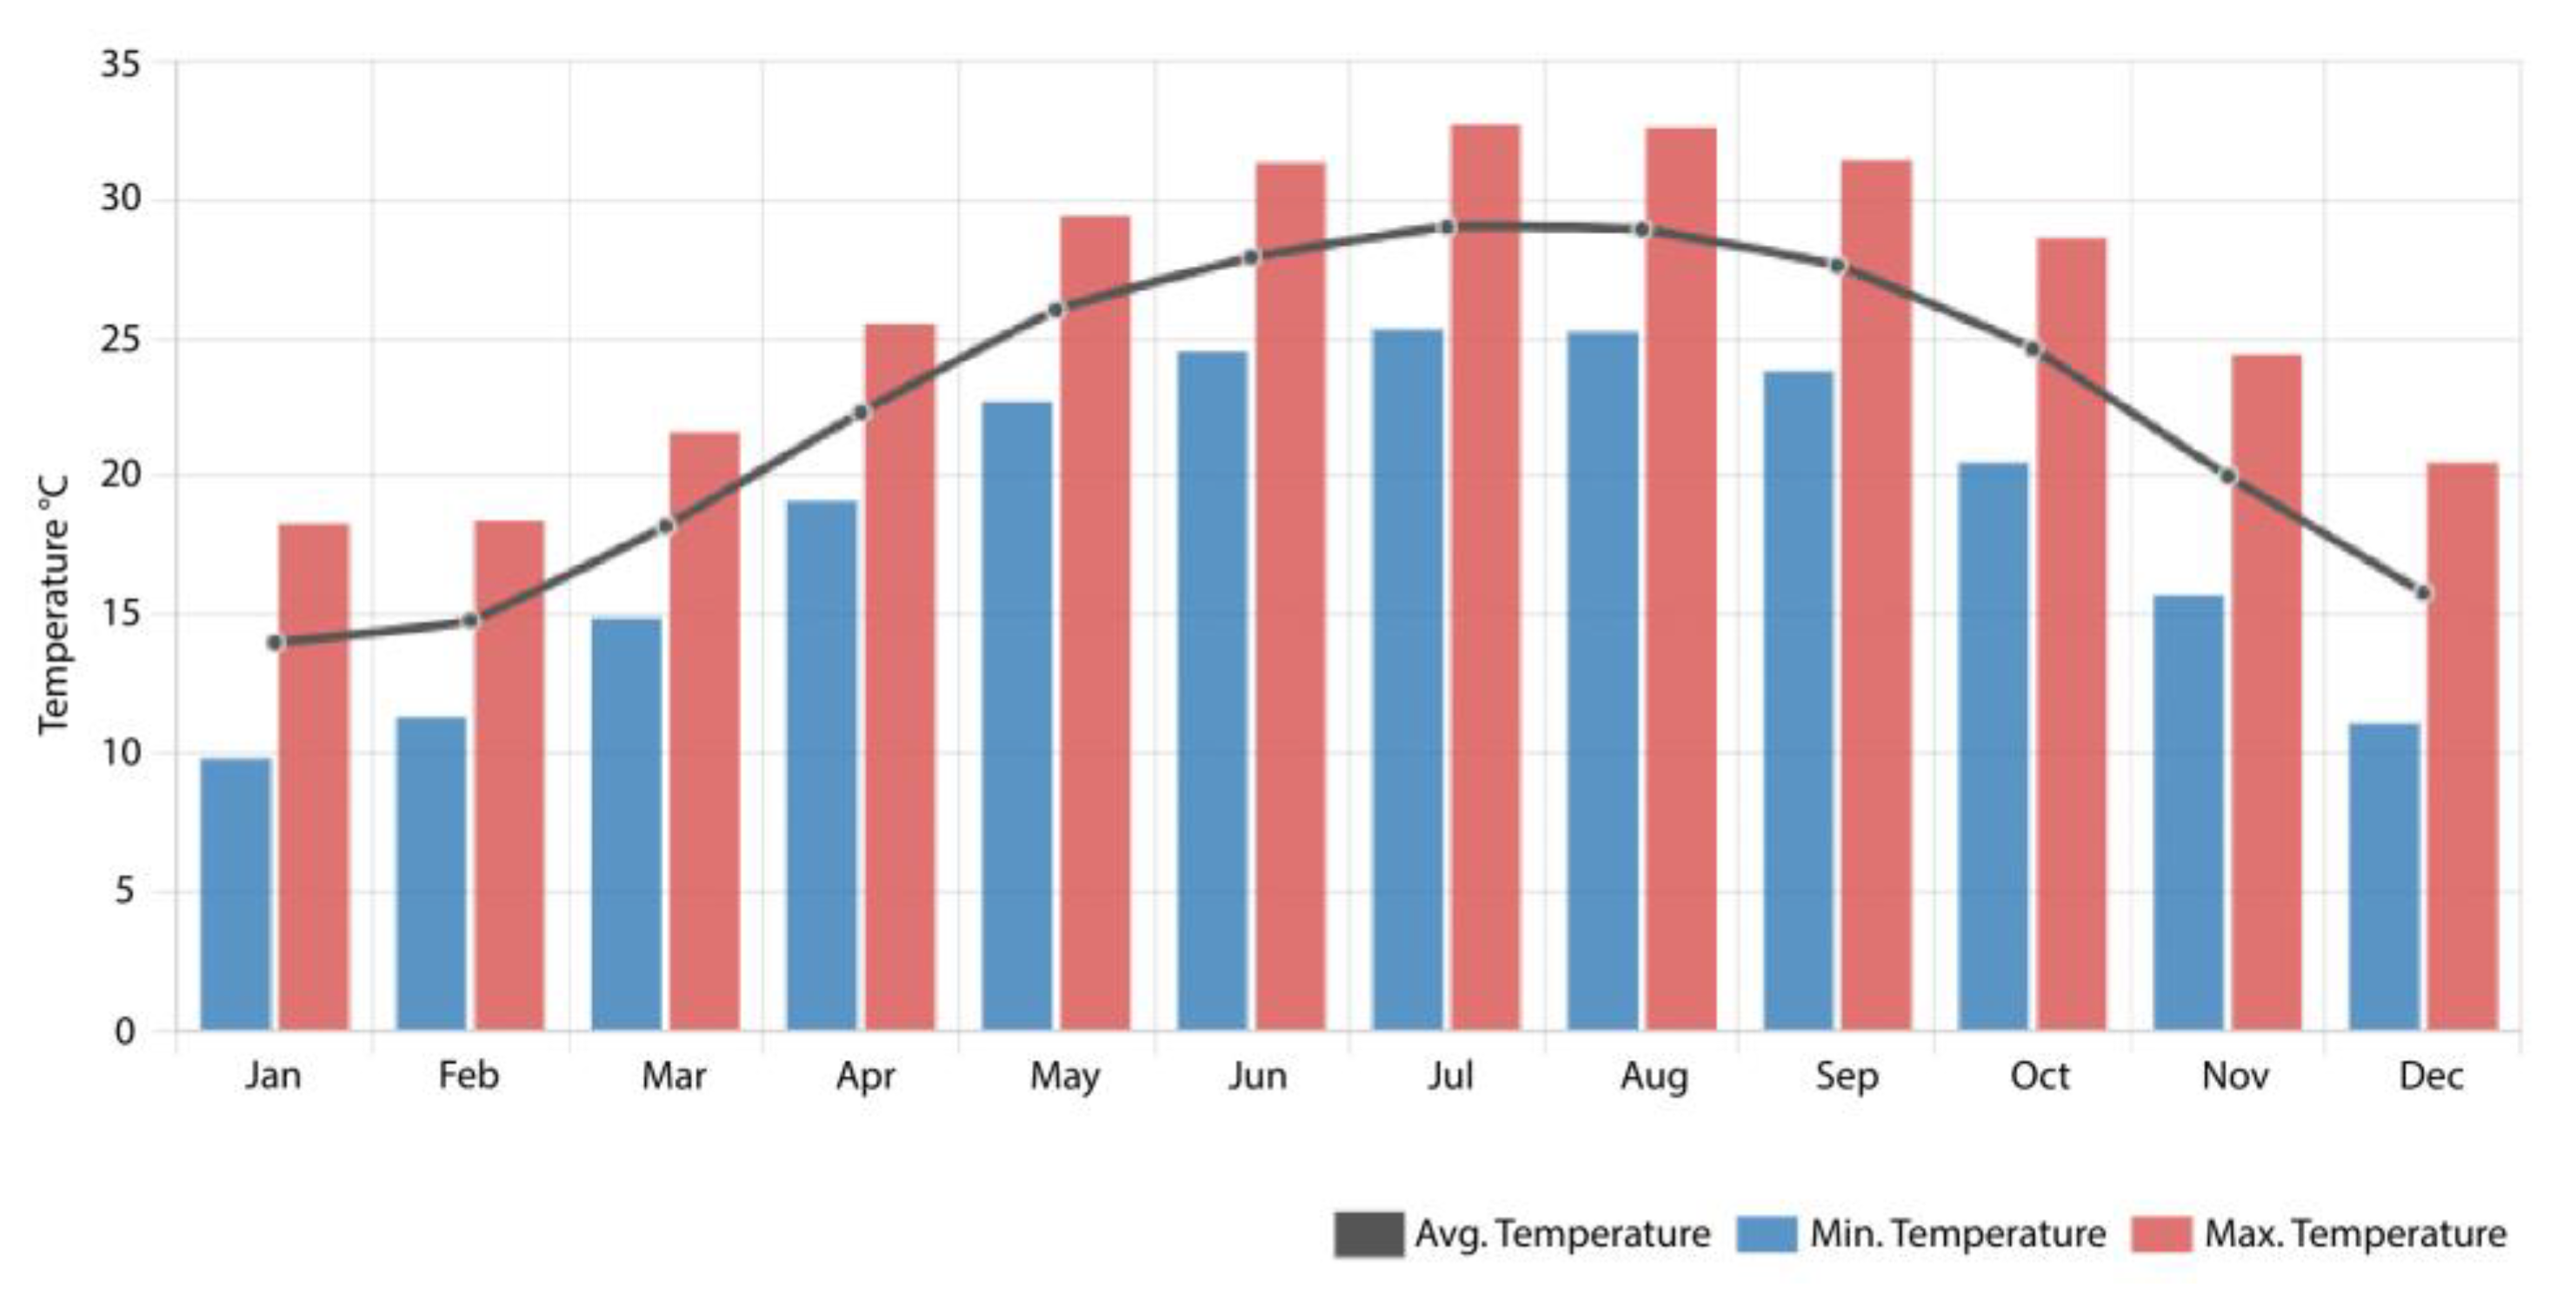
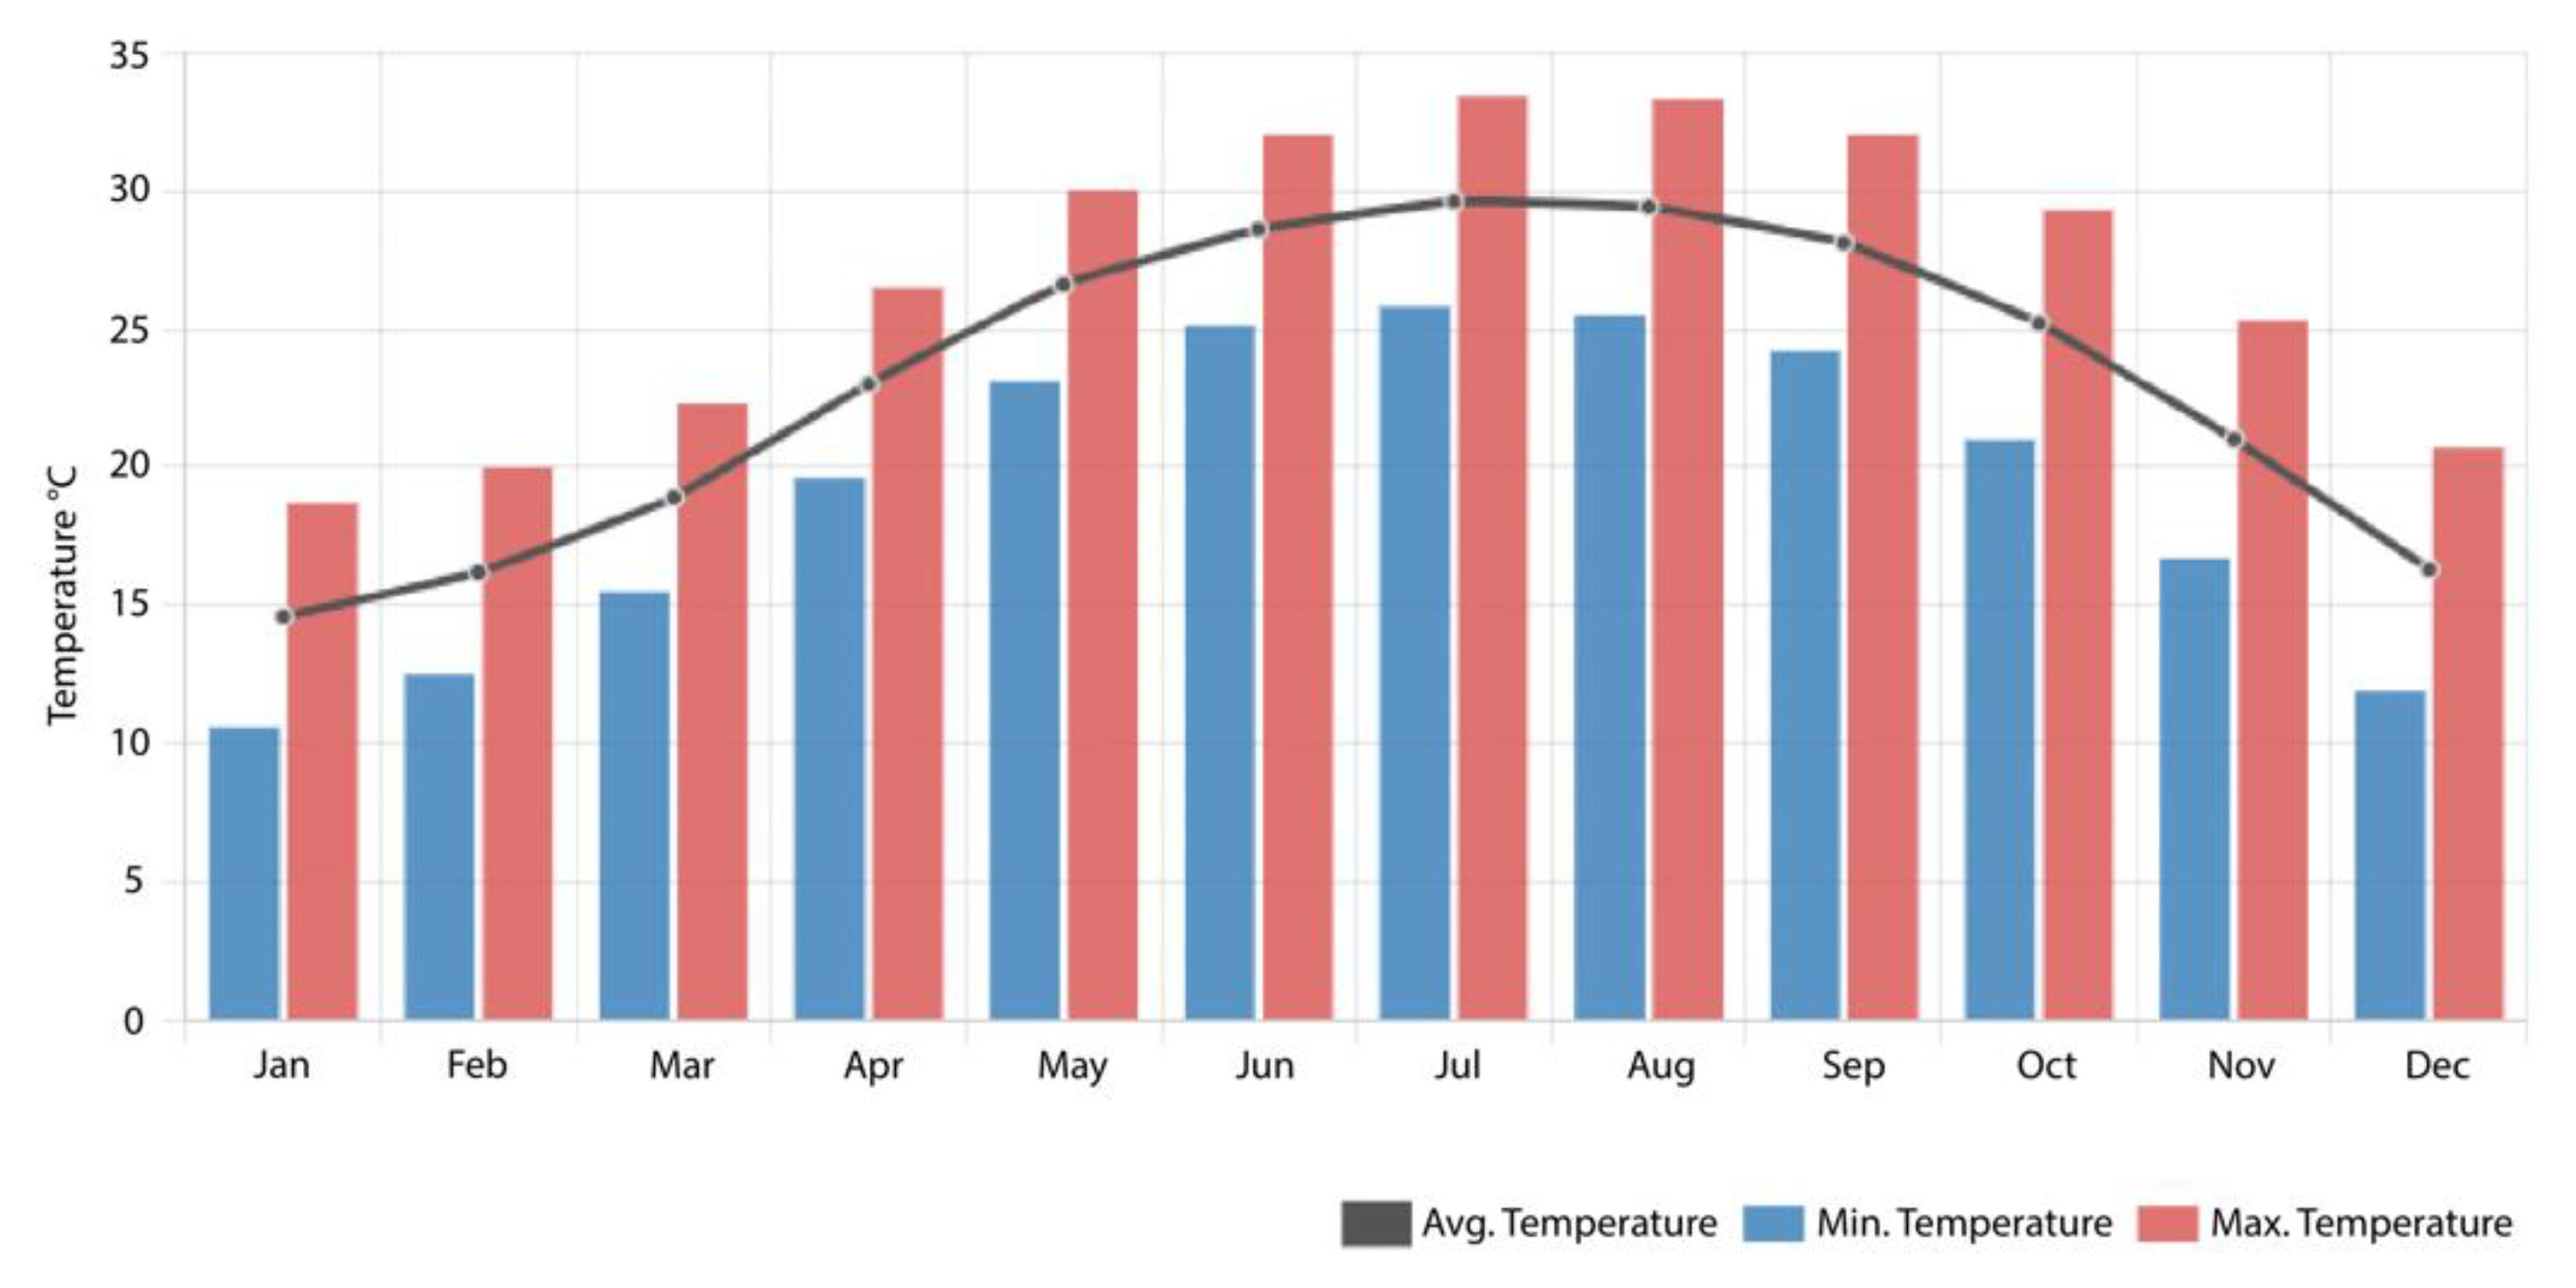
The monthly temperature information between 1961 to 1990 and 1991 to 2020 is shown in
Figure 5 and
Figure 6. Comparing these two periods, the average temperature for the warmest month, July, increased by 0.6 °C, reaching 29.6 °C. The coldest month of January also increased by 0.6 °C, reaching 14.6 °C.
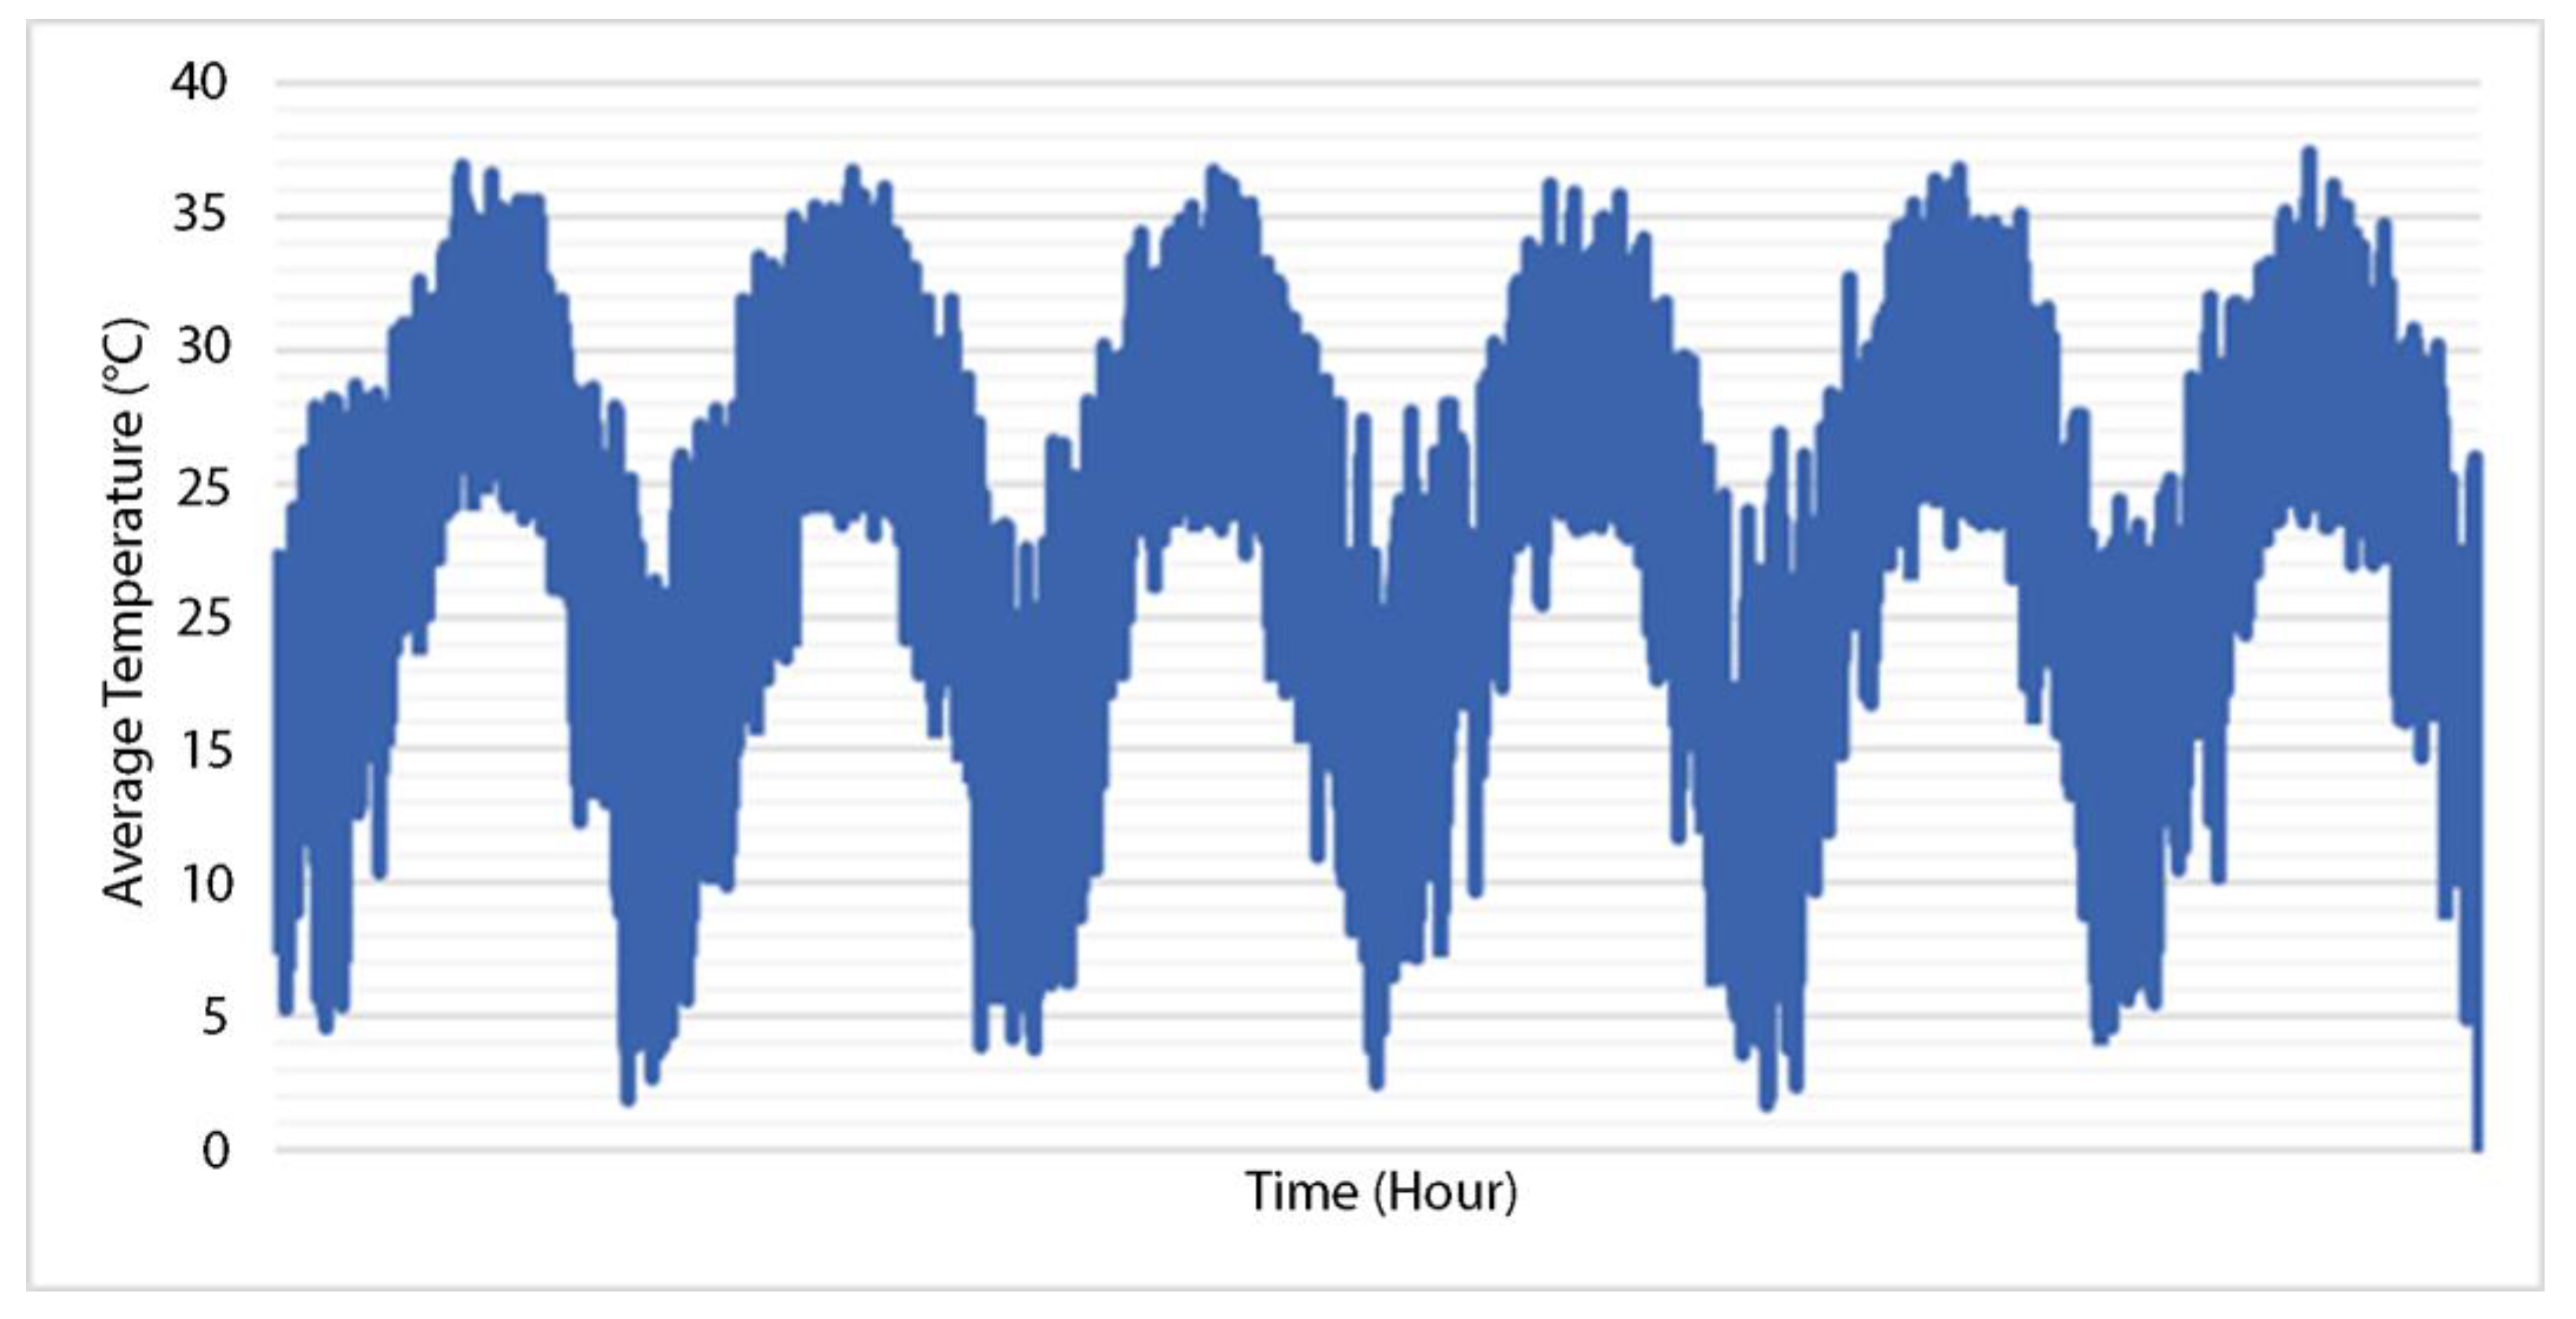
More recently, during the last decade, the city suffered extremely high temperatures in summer. The number of days with an average temperature over 30 °C is slowly increasing.
Figure 7 shows the average hourly temperature between the years 2010 and 2015. As can be seen, the maximum temperature of 38 °C fluctuates by around 2 °C, and 38 °C is the maximum of the 6 years; it can be seen that the max summer period temperature increases year by year. More recently, during the last decade, the city suffered extremely high temperatures in summer.
4.3. Comparison of Guangzhou with Nearby Cities
As mentioned previously, the current study compared Guangzhou with five nearby cities (
Table 1) in terms of temperatures, precipitation and wind speed. All the cities studied vary in population and urban density.
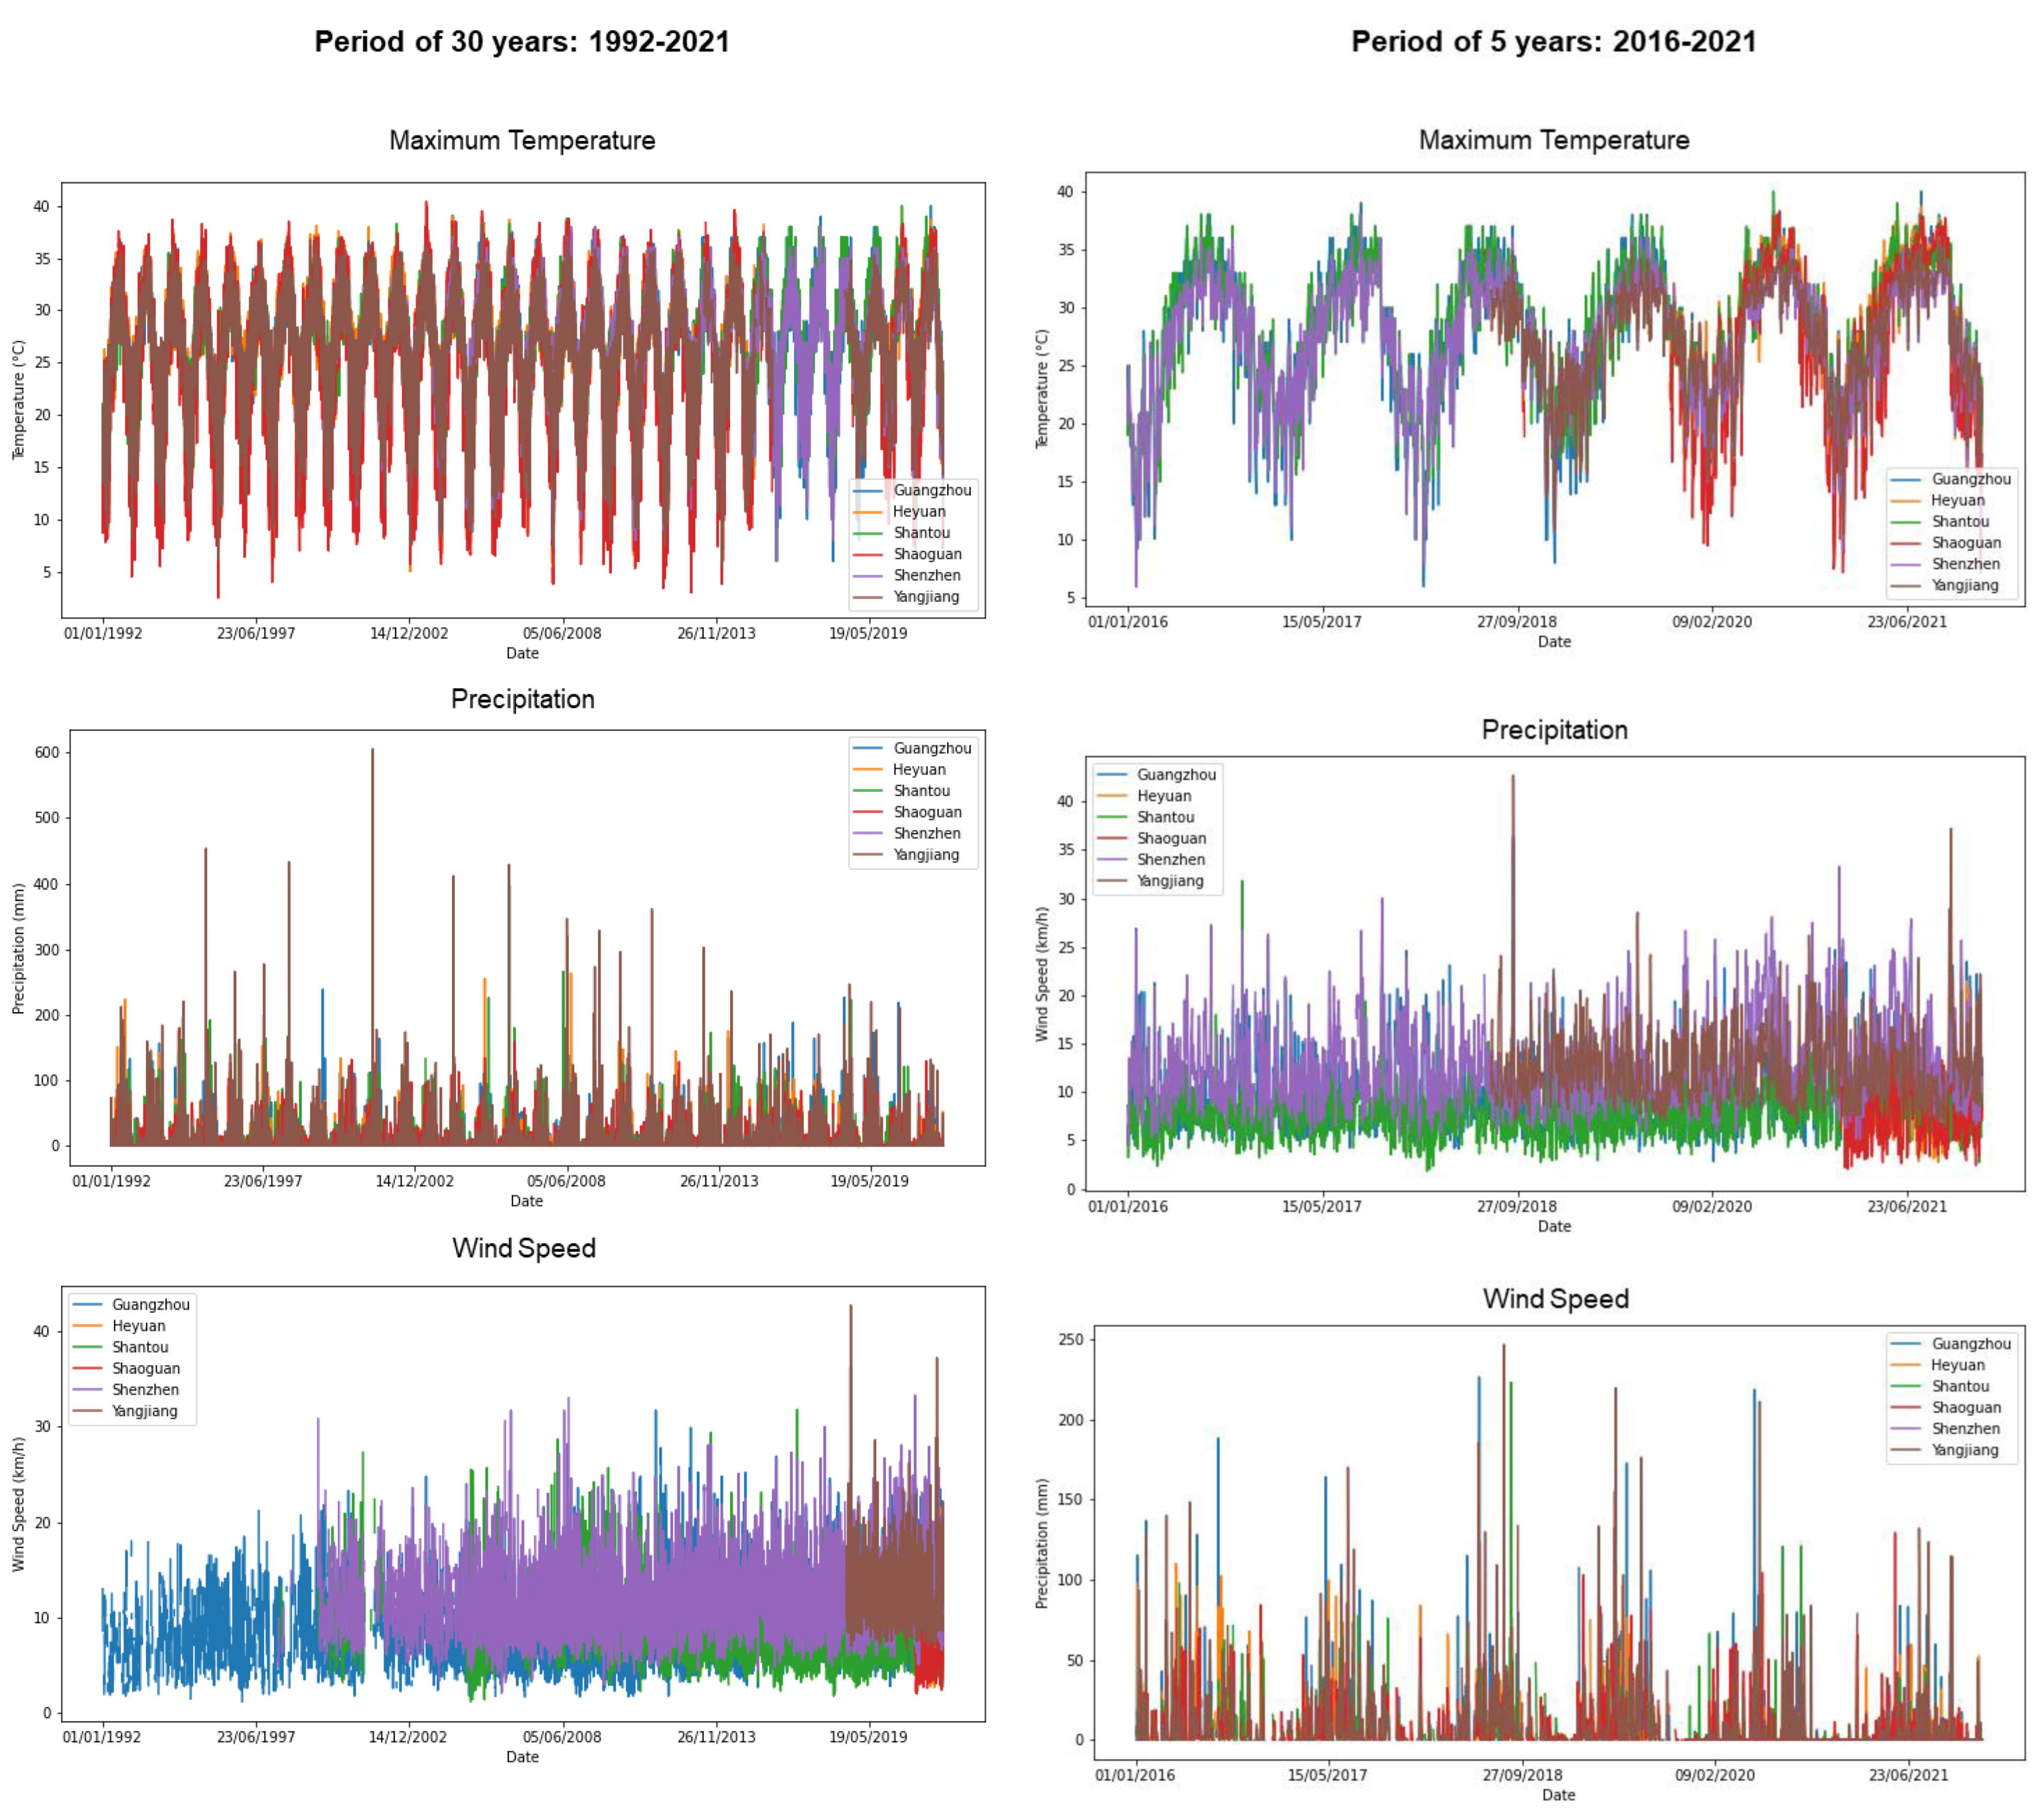
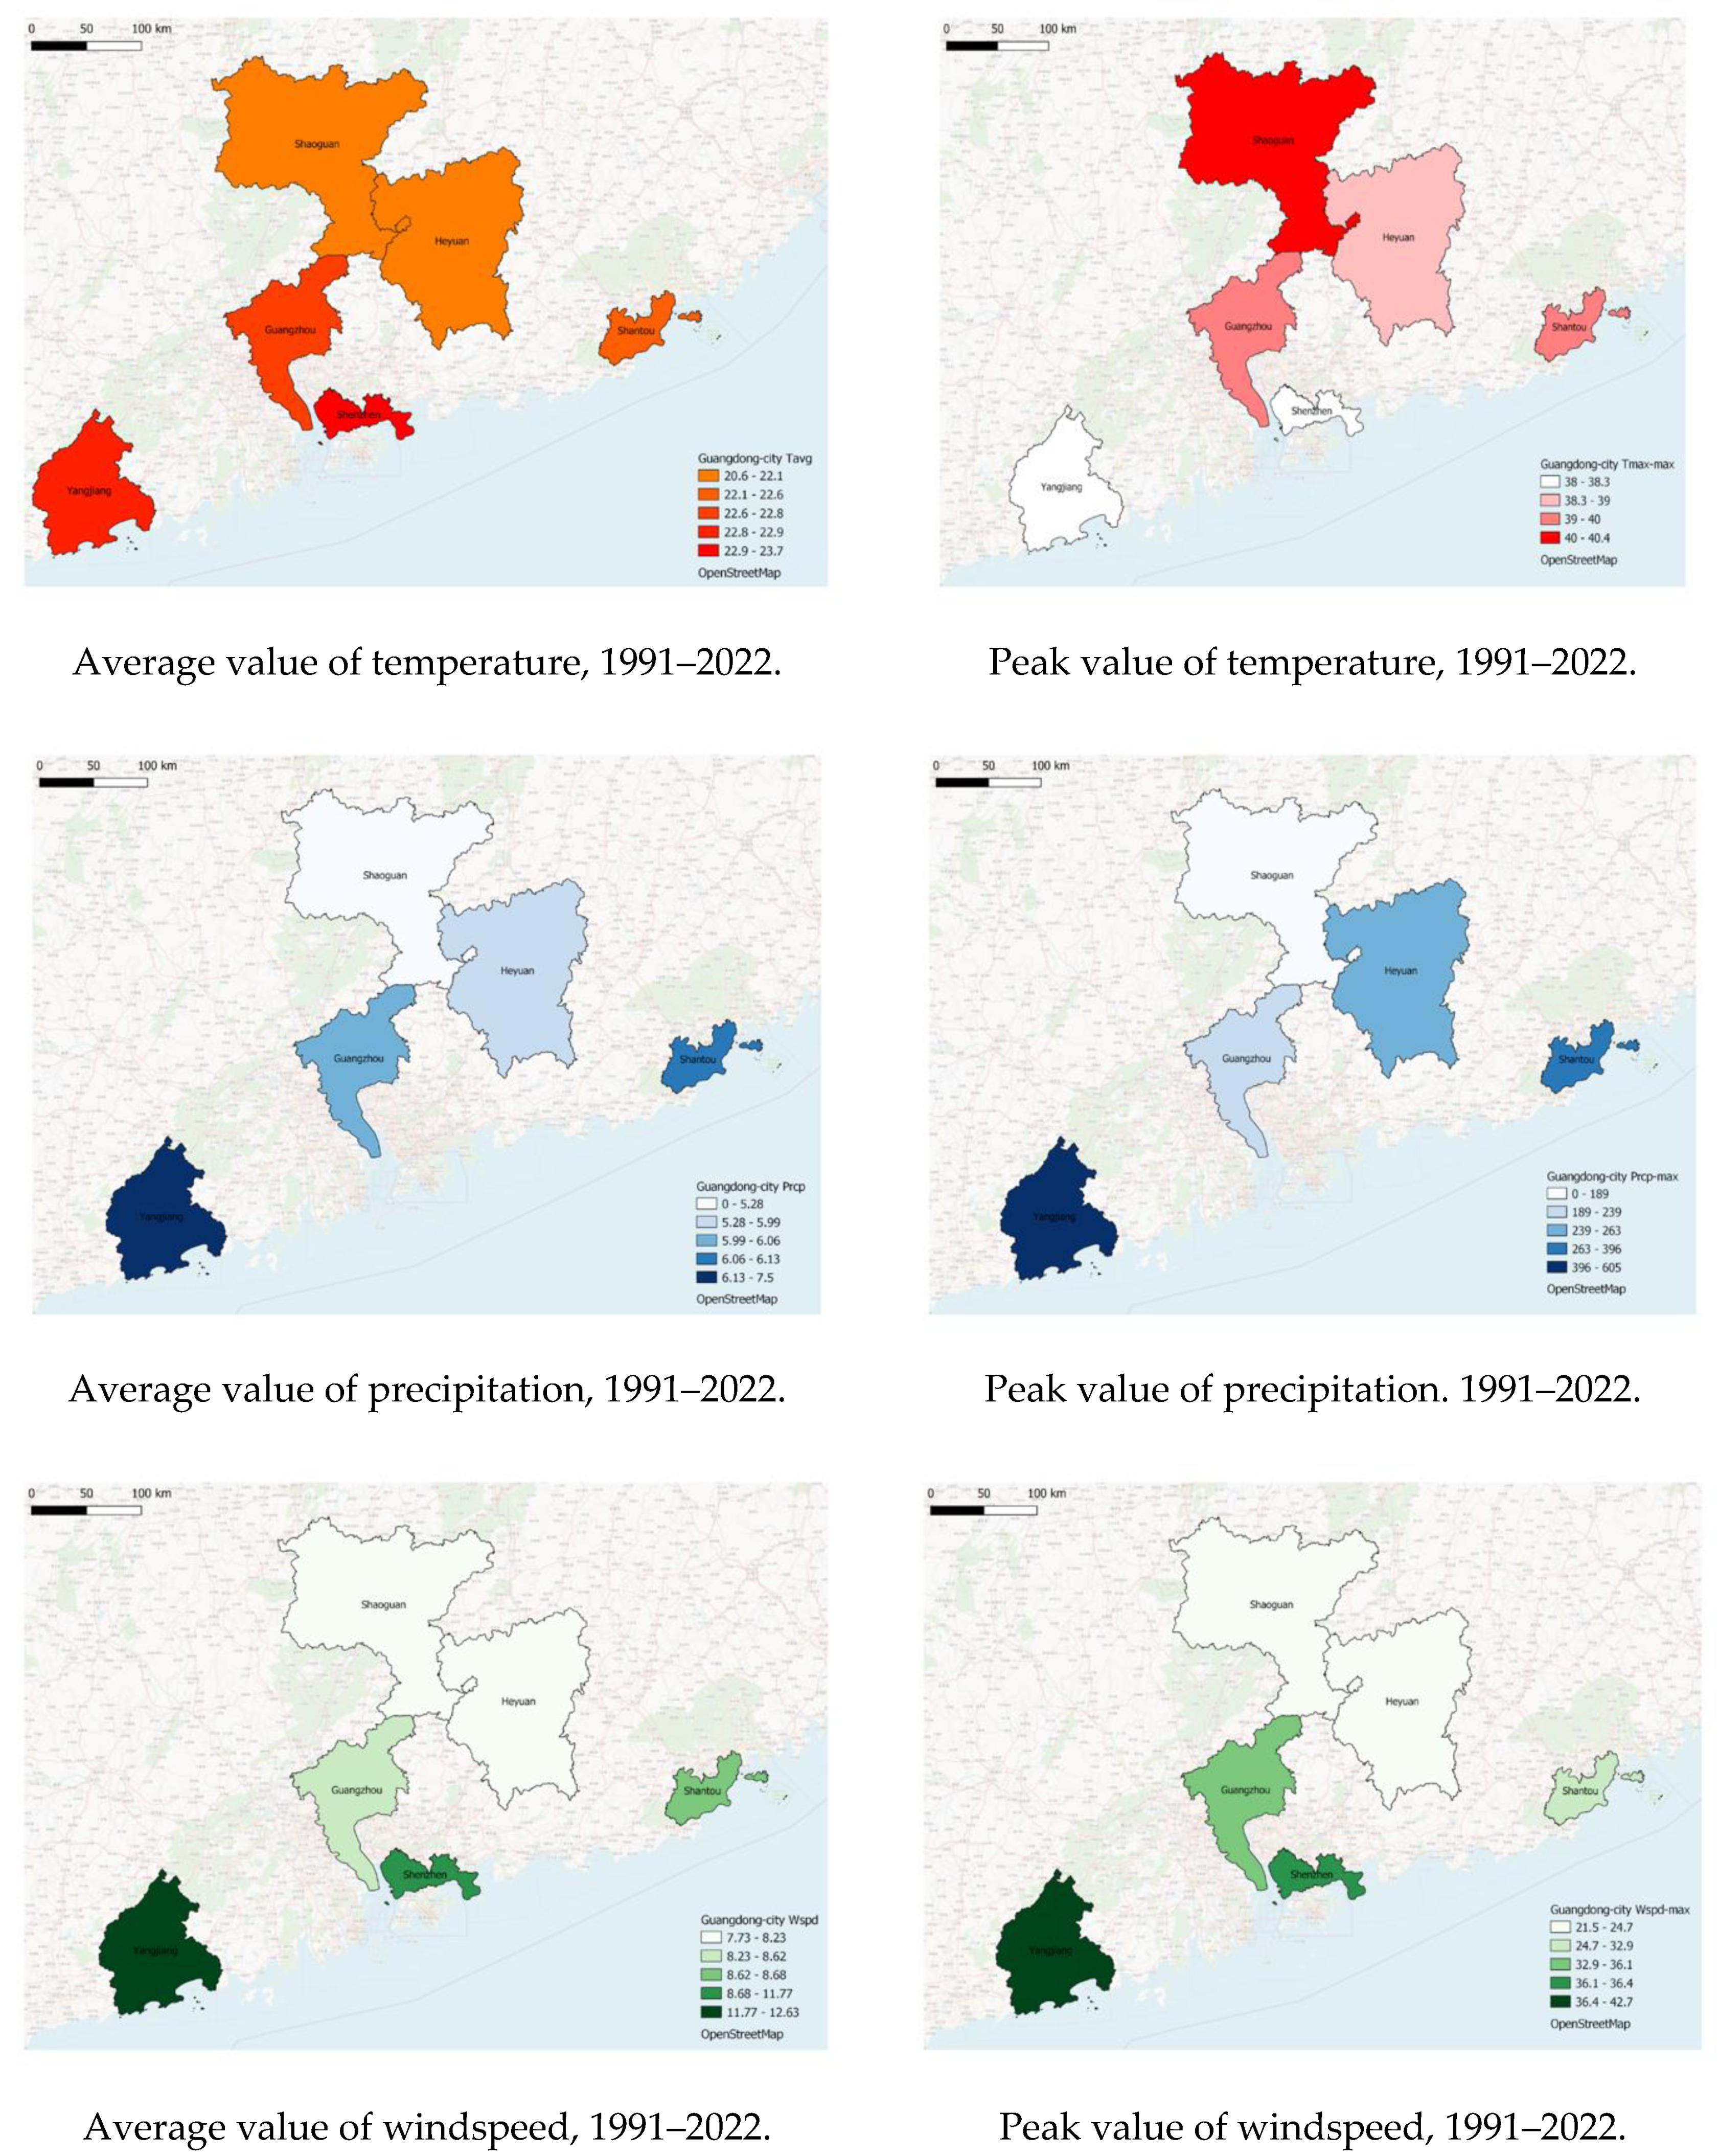
Firstly, the graphs regarding the comparison of the last 30 years, 5 years and 1 year are presented, and then maps of the average and peak values are illustrated, with some tables of the values. Maximum temperature (
Figure 8) shows a recurring pattern and similar temperatures in all six cities. For precipitation for the period of 30 years, Guangzhou is more similar to Heyuan. Wind speeds indicate an increase in all cities, especially for the case-study city. Hence, with respect to wind speed, the cities follow the same pattern.
As
Figure 8 shows, the maximum temperature is shown for all six cities for the last five years (2016–2021), and as it has been observed that the maximum temperature follows the same pattern for all of the cities. Moreover, in the last 5 years, precipitation was observed as a recurring pattern in the summer and winter periods where precipitation is higher in these two periods. Nevertheless, in this picture (
Figure 8), it can be seen that Guangzhou has high precipitation, similar to Shenzhen. After these two cities, Shantou follows with relatively high precipitation. Finally,
Figure 9 shows the wind speed, with Guangzhou having the same pattern as Shenzhen again. It can be seen that the last year of Heyuan and Shantou had higher temperatures recorded than Guangzhou, which is very interesting.
In
Figure 9, it can be seen that Guangzhou is ranked in third place regarding the highest average temperature for the last 30 years in relation to the five nearby cities. However, in
Figure 9, it can be seen that it is the city with the highest average maximum temperature for these 30 years. Regarding precipitation, there were no data for Shenzhen city, but the other cities have been compared. Guangzhou is among the top three of the cities with the highest average precipitation. Guangzhou is the city with the fourth highest wind speed. As regards to the precipitation analysis, Shaoguan and Yangjiang have higher peak values than Guangzhou; the same occurs for wind speed.
The study then visualised the data using QGIS to produce maps as a convenient way to compare Guangzhou’s climate to the other cities.
4.4. Trend Analysis for Mean Temperatures: 1992–2021
The trend for temperature for the mean average for 1992–2021 showed an increasing trend (
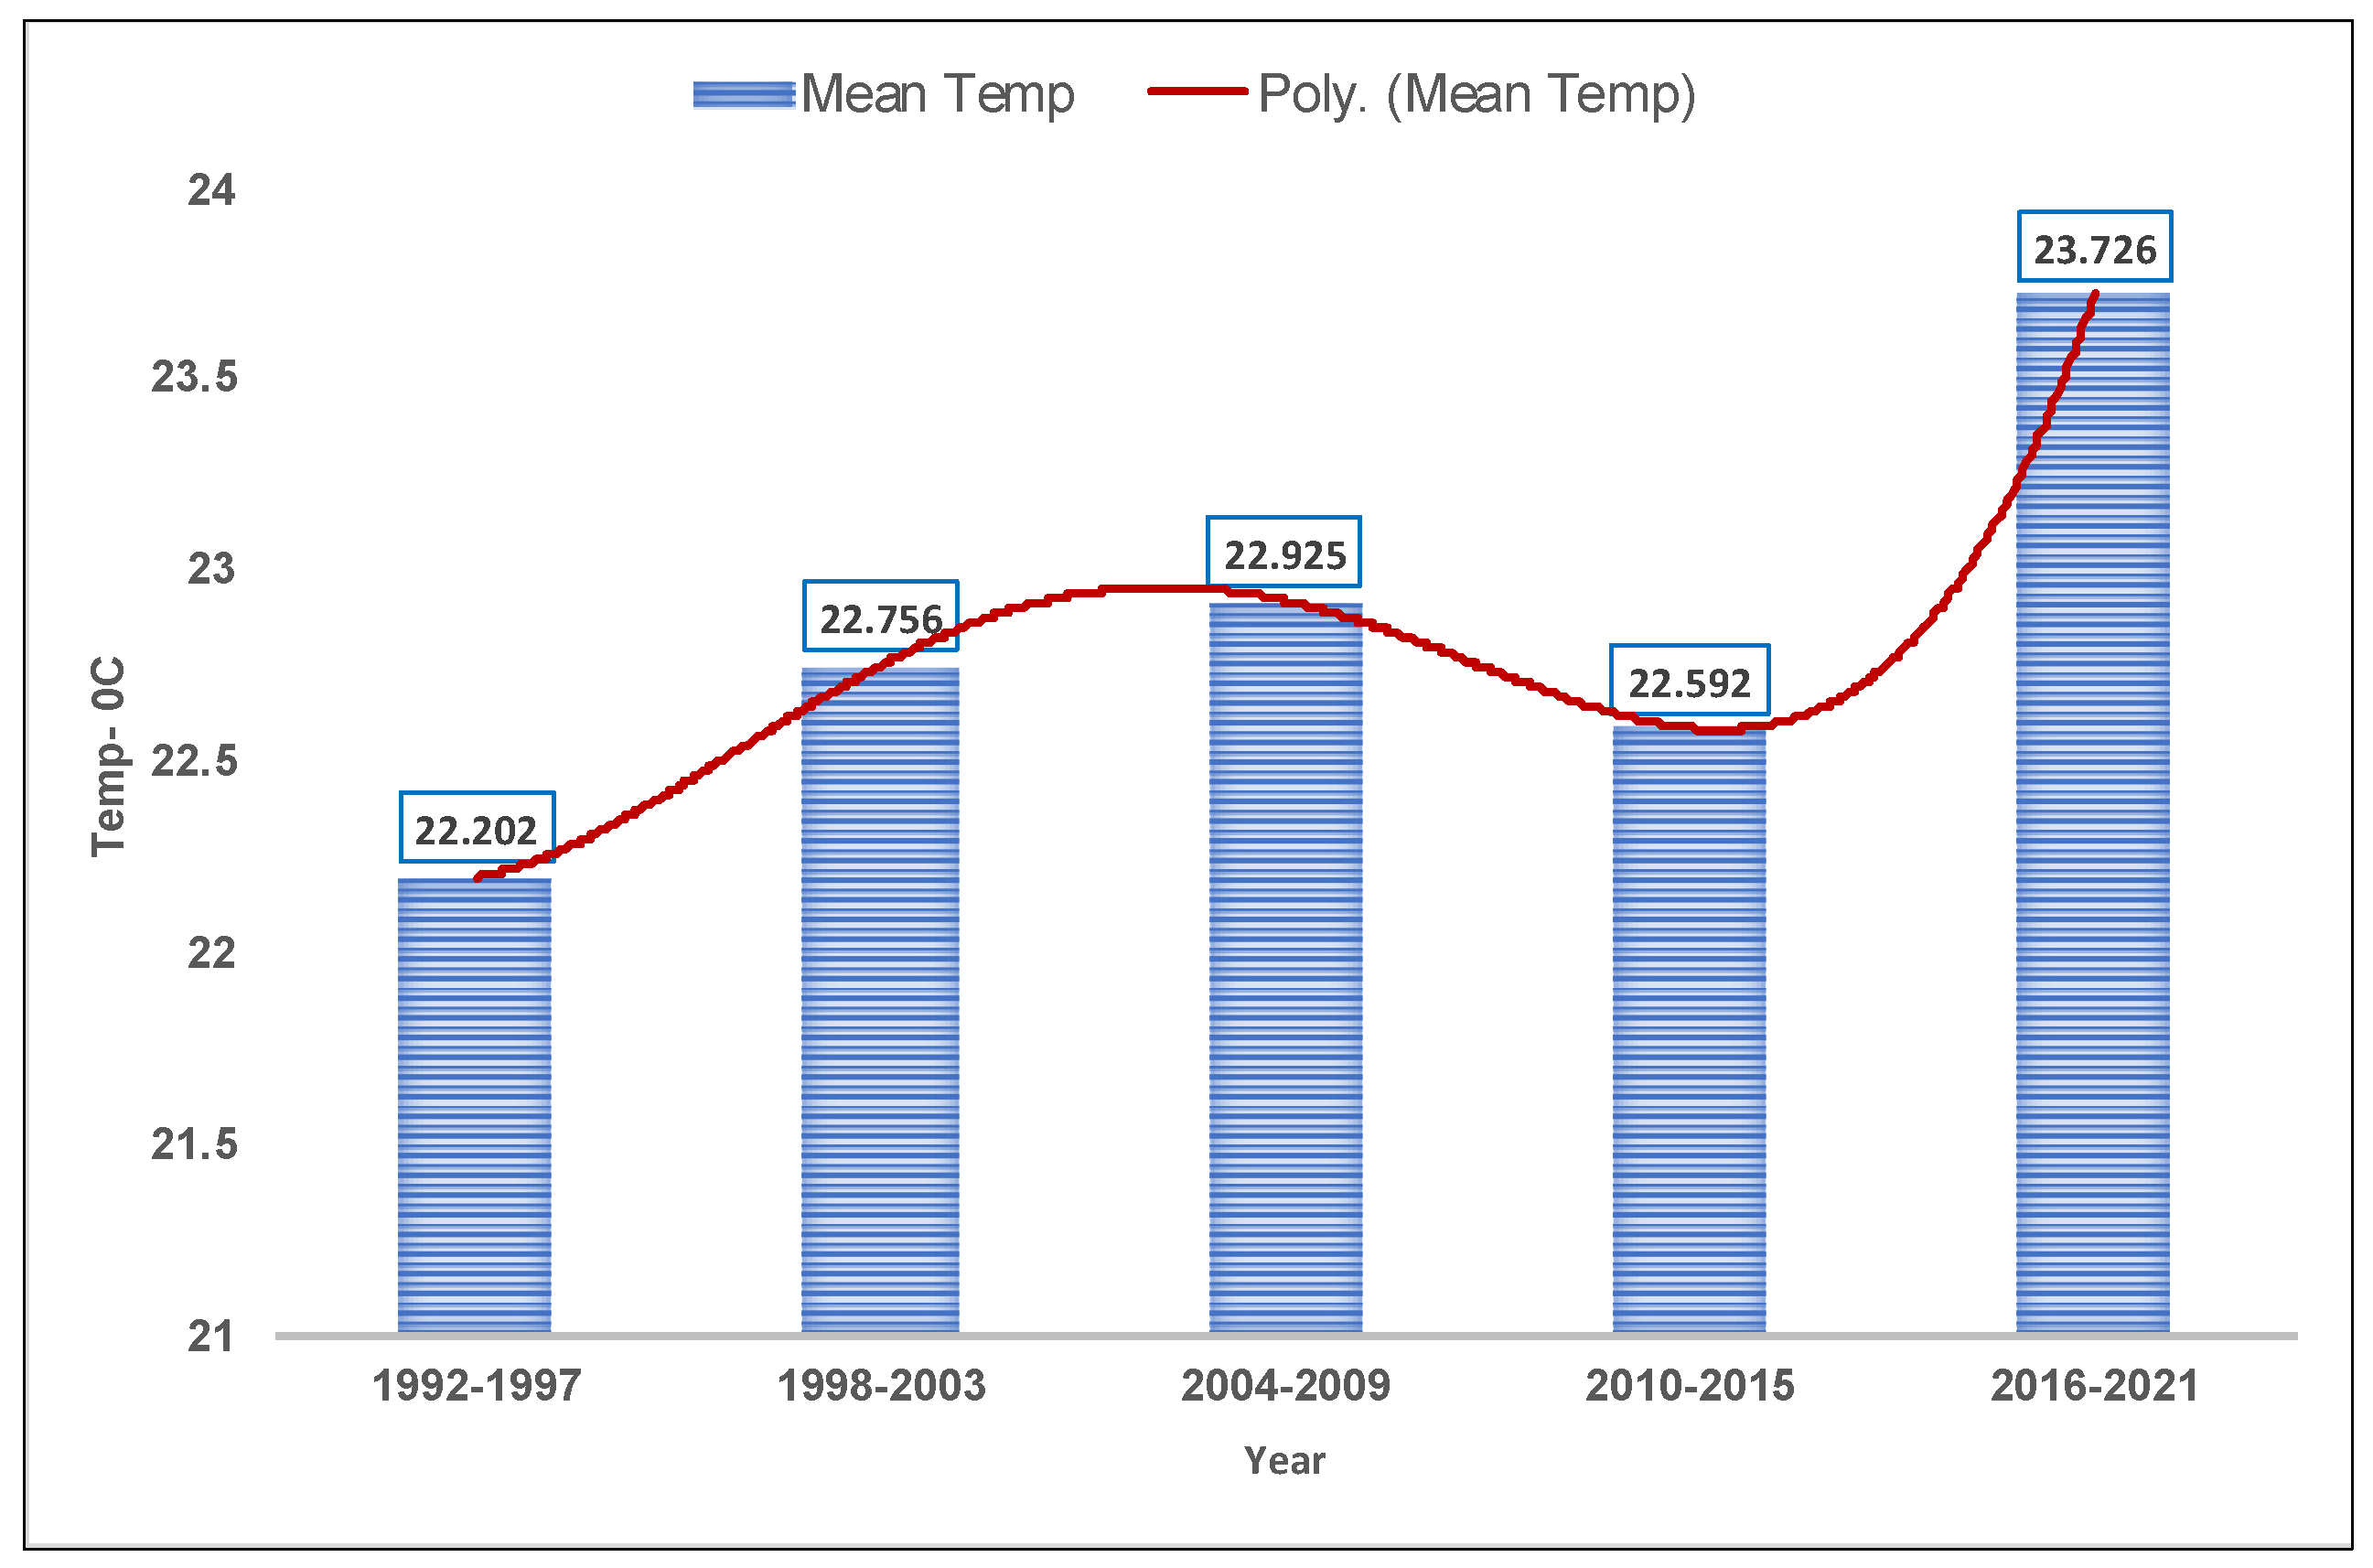
Figure 10) reaching a peak between 2016 and 2021. The period from 1992 to 2009 showed a continuous upsurge trend; however, it dropped slightly in 2010–2015 and then once again showed an increased trend. This analysis indicates that there were significant fluctuations in temperature trends for the period of 1992–2021 with overall growth in this period.
5. Social Factor Analysis: Survey Results
5.1. Public Views on Heat Island Effect and Coastal Flooding in Guangzhou
The online survey initially contacted 500 participants in Guangzhou, and 400 participants agreed to participate, but only 350 participants offered their views. Of those 350, 14 participants’ opinions were not included in the analysis because of incomplete answers to all questions. Finally, the remaining 336 participants’ opinions were considered for analysis. Results identified that there was a balance of participants with 52.51% male and 47.49% female. All participants are currently living in Guangzhou or have lived there for a long period of time, which allows them to have detailed knowledge and experiences regarding the city’s climate, particularly the extreme heat environment. In terms of age distribution, 4% are older than 50 years and more than half of the participants are between 26 and 40 years old. The majority of participants are undergraduate and master’s students from the University of Guangzhou. The question papers were shared via a QR code and online links on social media. Most of the participants join the survey on their mobile phones, which was a convenient and efficient method for participants. The questionnaire has 16 questions including topics about climate change, the urban heat island and heatwaves in Guangzhou. The participants could share their opinions about the urban environment, particularly in order to answer “why” and “how” to deal with UHI and what they can do to deal with the impact.
5.2. Public Perception on Climate Change and Urban Heat Island Impact
Participants’ perceptions of the effects of climate change were generally similar, and these views could be categorised into two groups: climate issues and urban problems caused by the changing climate. Most of the responses (75%) perceived the increased frequency of extreme weather (
Figure 11), including typhoons, heavy rainfall and multiple days of hot weather with higher temperatures and an increased number of hot days. These participants also stated that extreme weather can cause damage to infrastructure and crops around Guangzhou, which further affects crop cultivation, increases the urban heat island effect and dramatically enhances the risk of heat-related diseases such as pyrexia. In addition, 65% of participants identified that climate change would bring inevitable problems such as the inundation of cities due to sea level rise, global temperature increase and ecological changes in water bodies due to algae growth. It is worth mentioning that 35% of participants suggested that, in the future, Guangzhou needs to build a new area inland for residents in order to avoid climate change impact. However, only 1% of participants think that climate change has no impact and are not concerned about it.
In Guangzhou, the press and social media are the principal communication methods, and more than 73% of the residents have learned about climate change through these media; others have learned about climate change through universities and educational institutions. In total, 75% of the participants agree that Guangzhou has already suffered from the effects of climate change (
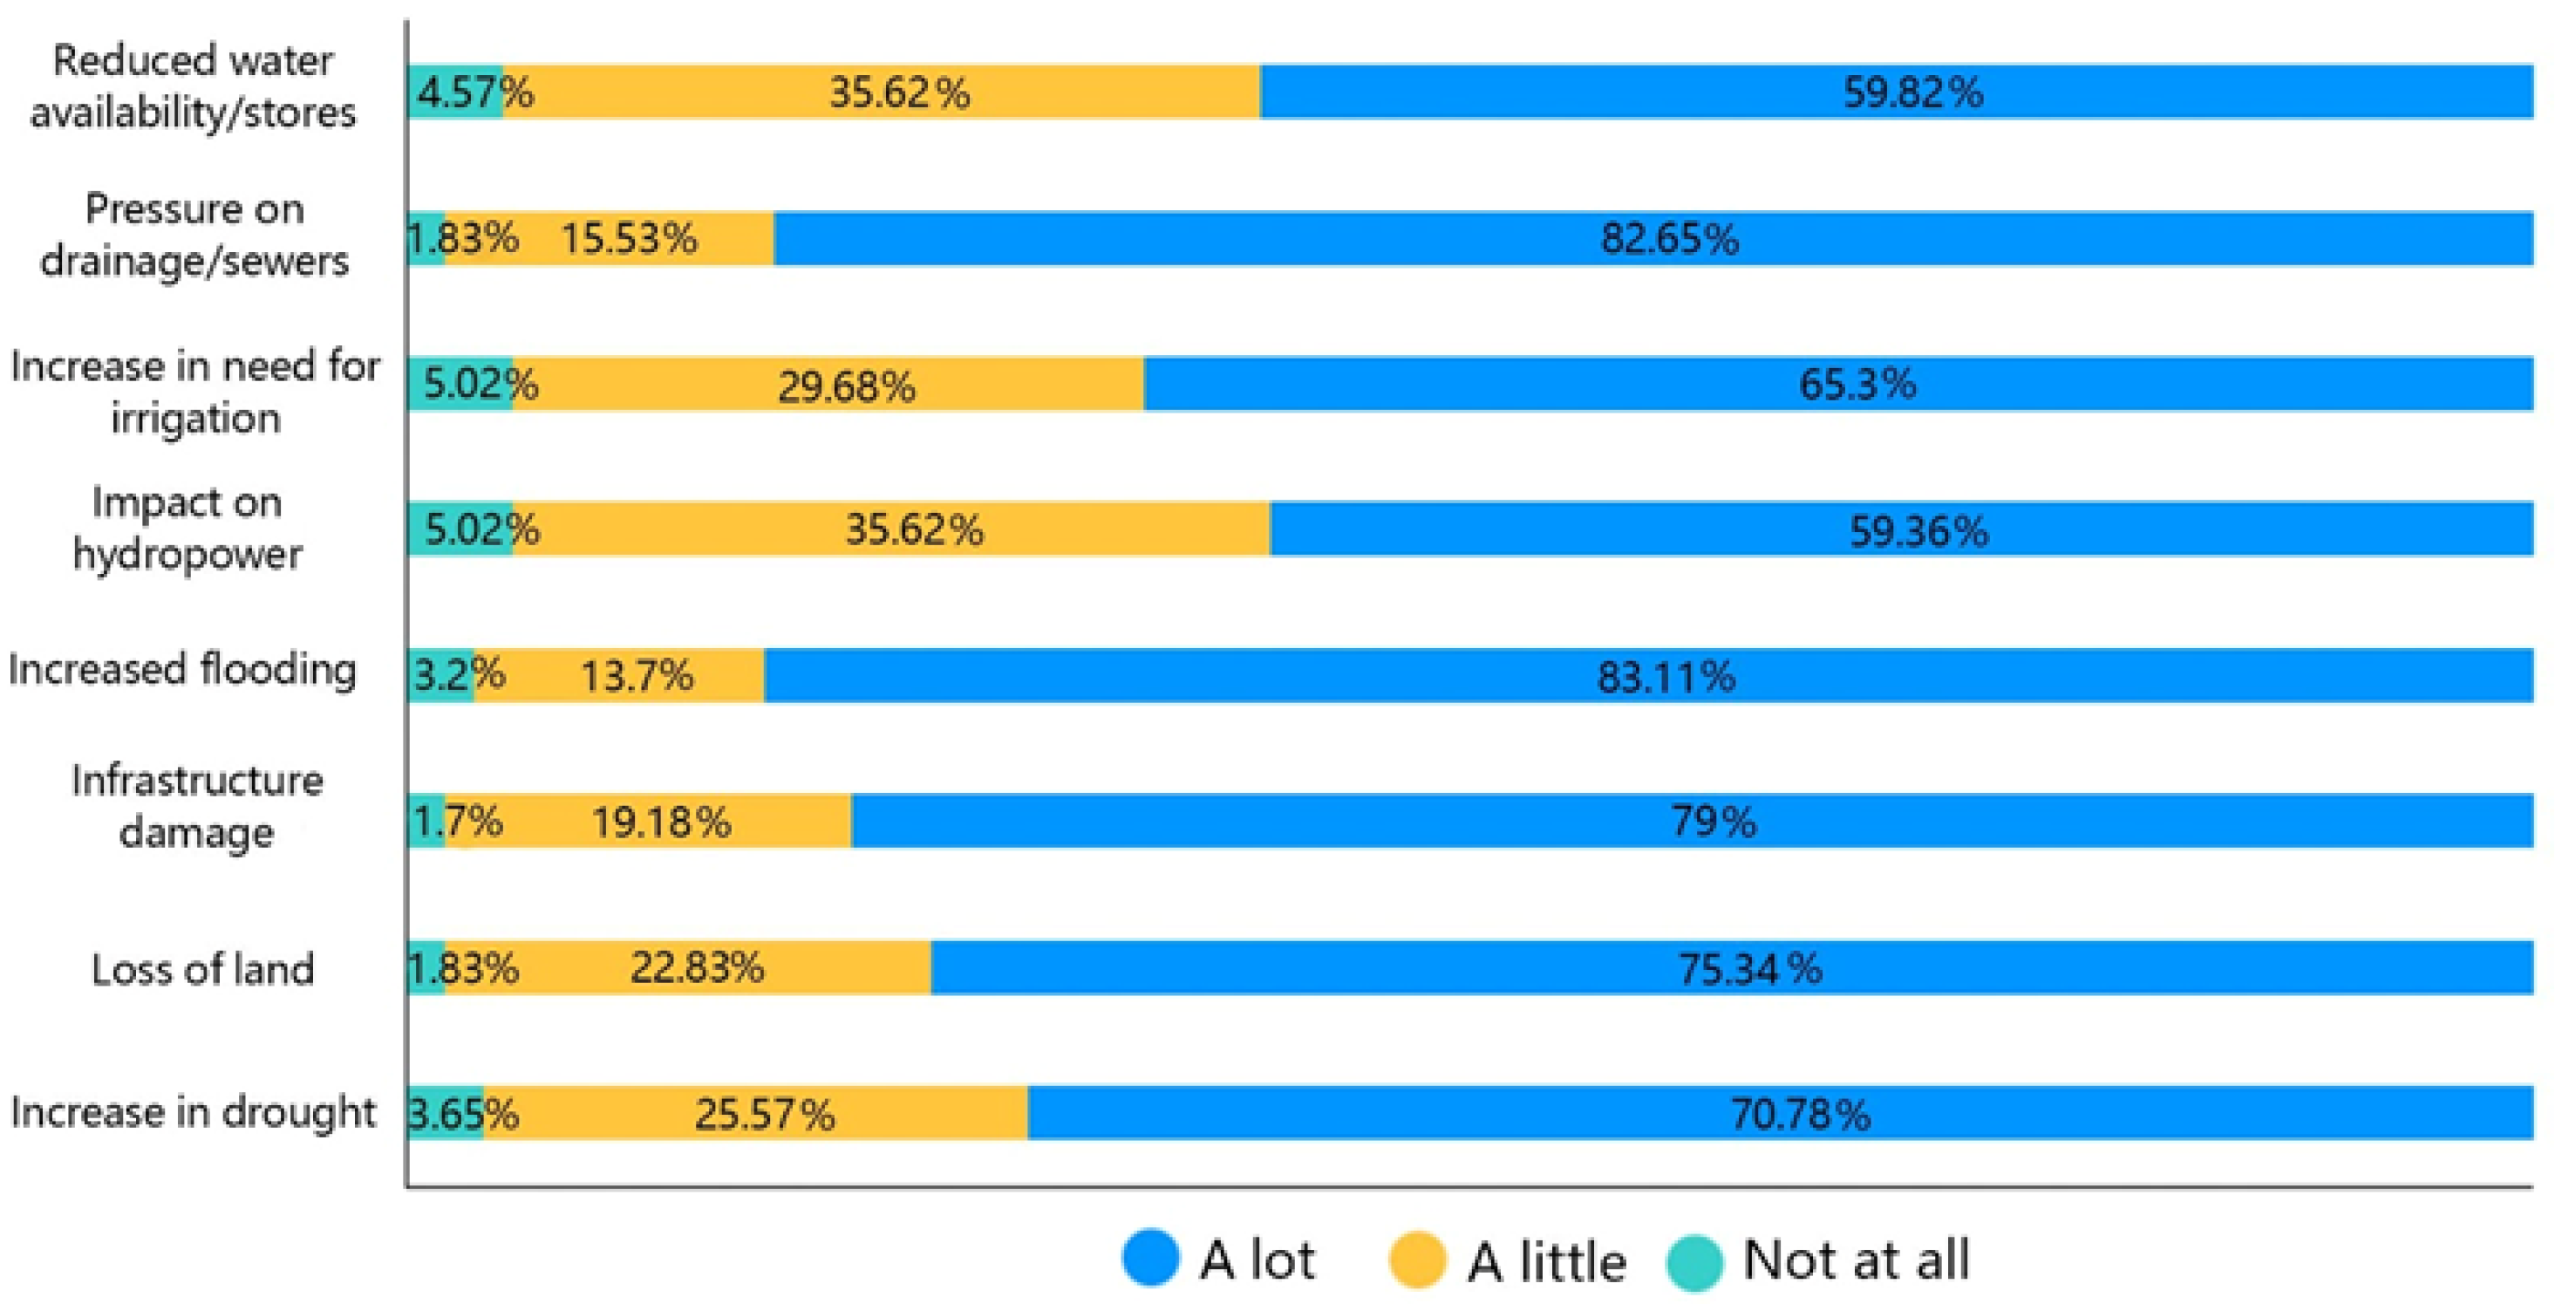
Figure 12), and participants perceive that there is moderate-to-high correlation between natural disasters and climate change in Guangzhou. More than 45% of residents agreed that climate change and natural disasters affecting Guangzhou are highly correlated. In terms of the question of what impacts climate change might have, more than 70% of the residents believe that the issues of increased load on the city’s pipeline network, land loss and infrastructure are very related to climate change. Drought, hydroelectricity and urban water resources are considered by residents to be relatively less related to climate change. Overall, more than half of the population agrees that climate change has led to a number of municipal and infrastructure problems.
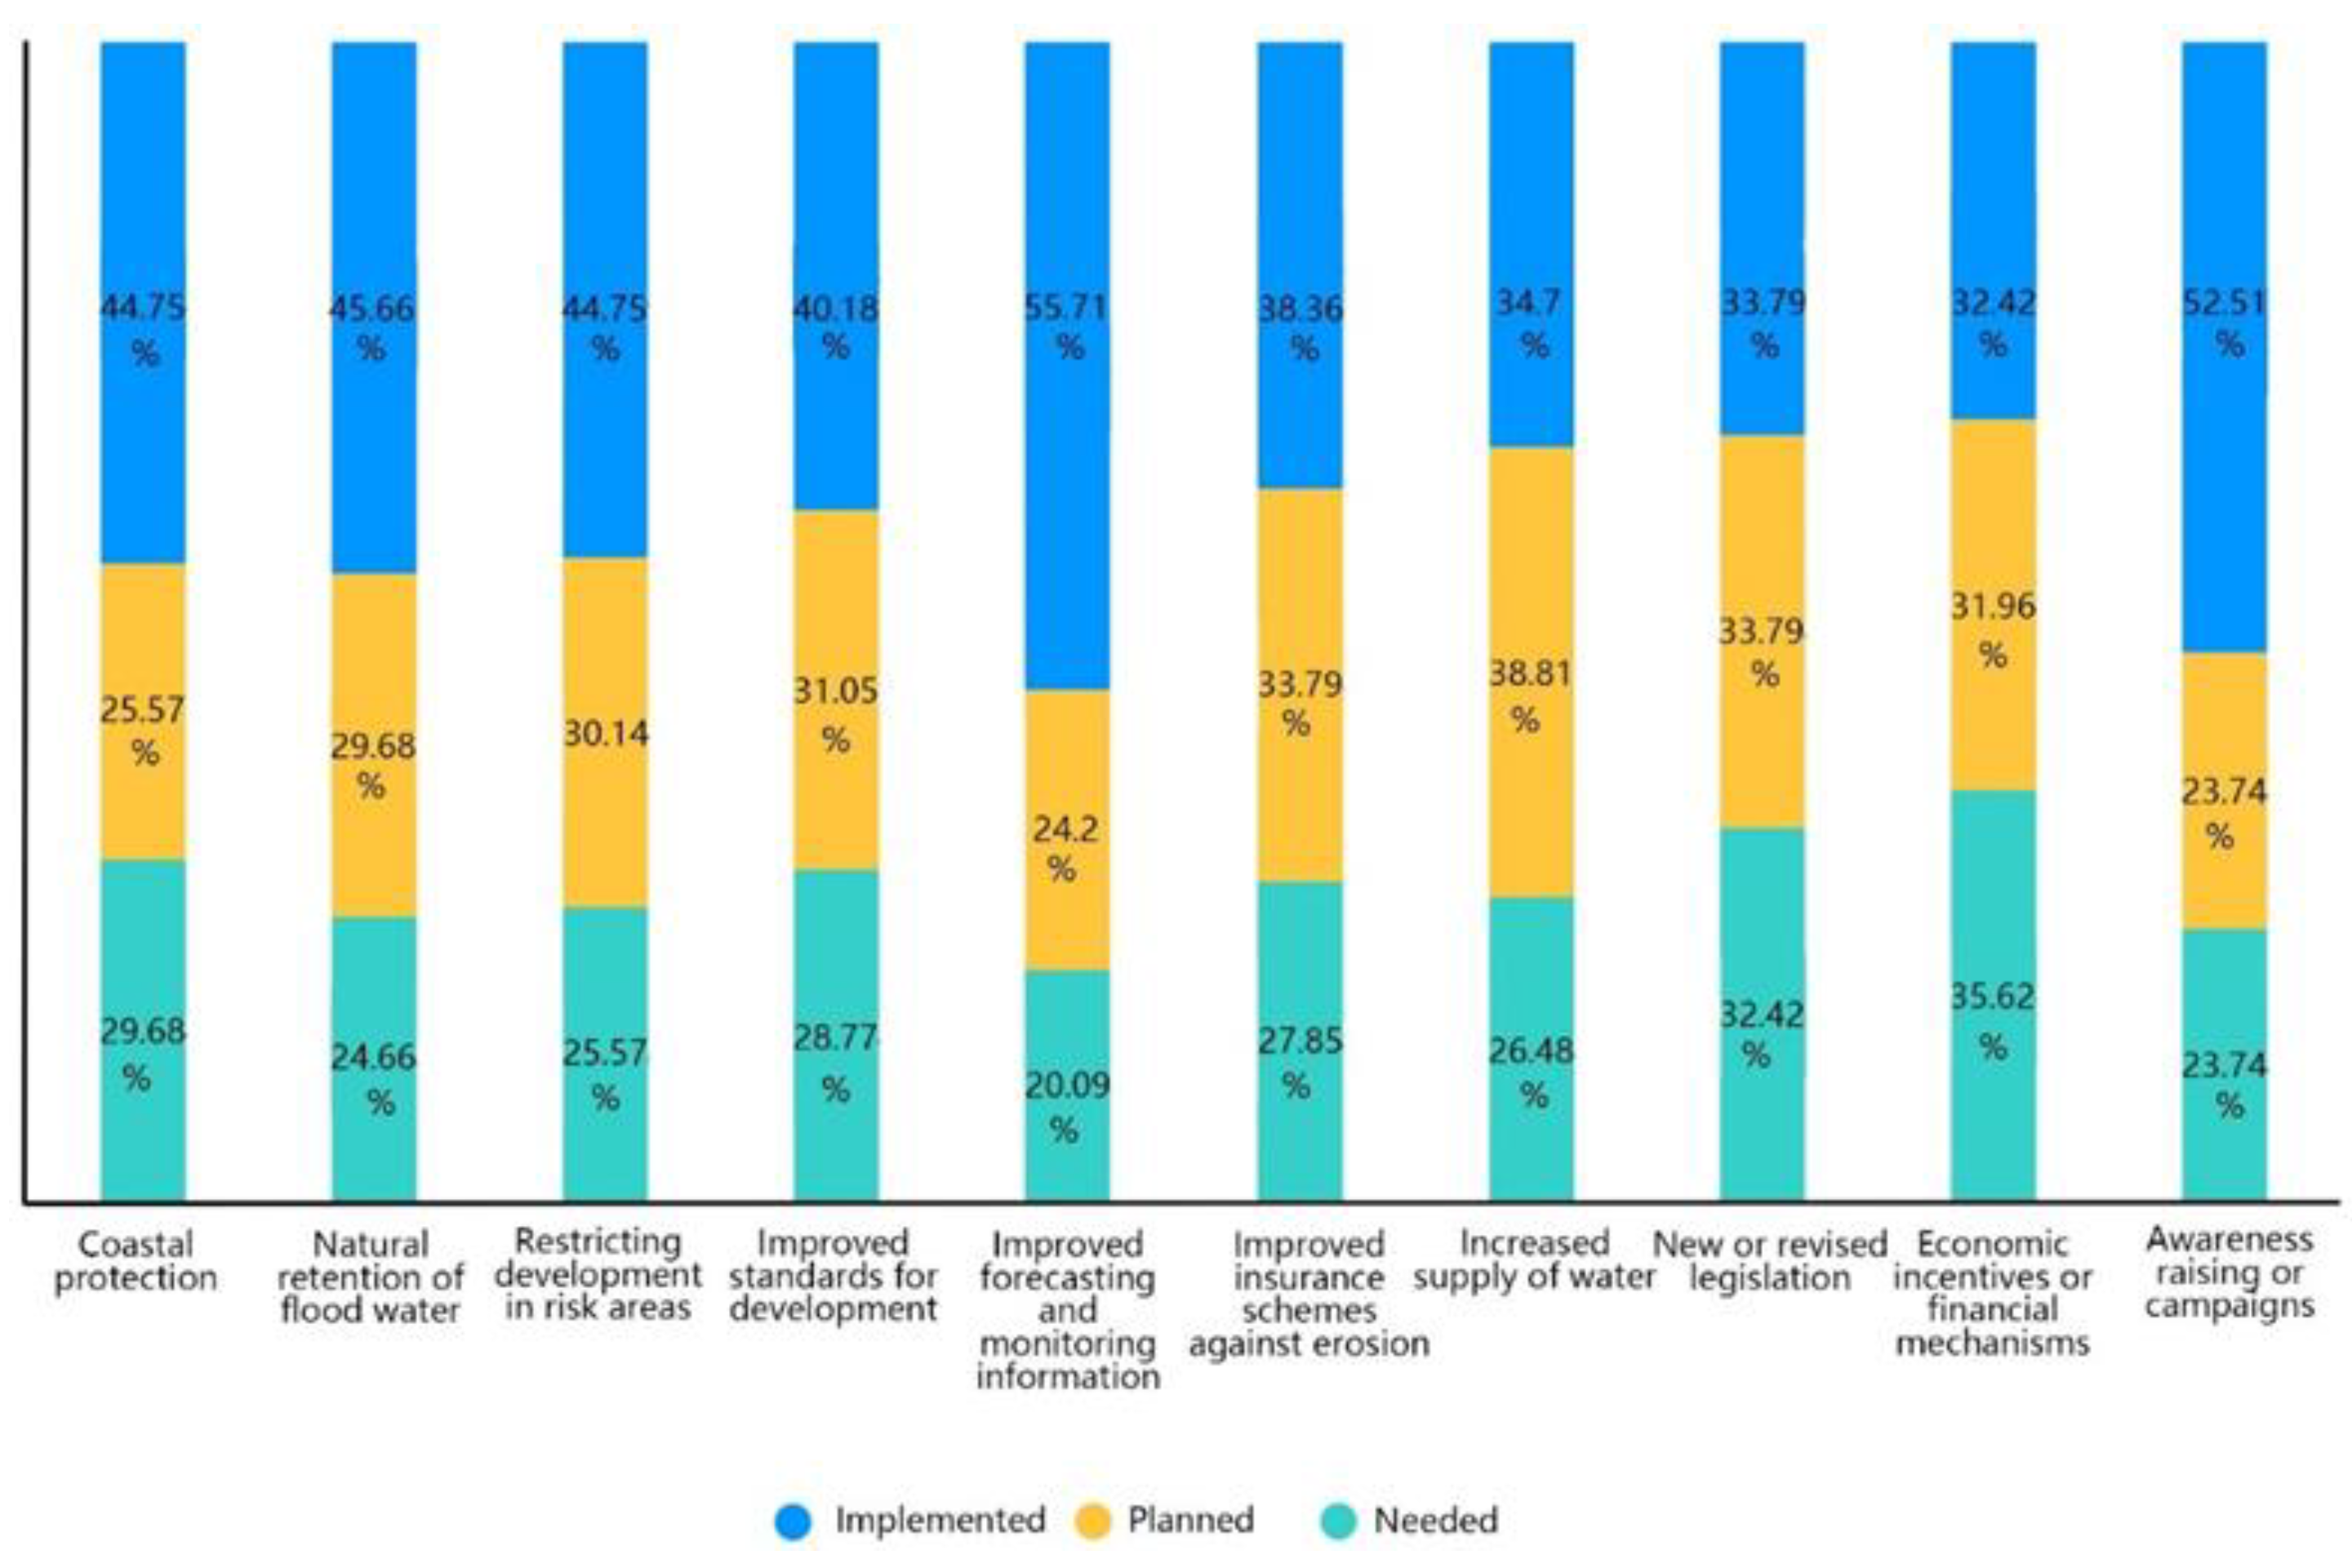
There is a divergence in perceived priorities for the implementation of future measures to address these issues. In terms of measures to mitigate urban problems, the questionnaire is divided into those that have been implemented, those that are planned and those that are needed, according to a limited number of categories. For the questions regarding coastal protection, awareness raising or campaigns and improved forecasting and monitoring information, more than 65% of the participants believe that Guangzhou is already implementing strategies to improve the quality of life of the city’s people. With respect to questions on new or revised legislation and increased supply of water, only about 35% of the residents believe that the government has already started to implement interventions. In addition, some of the participants (25%) expressed positive attitudes toward the government’s current approach toward addressing the threat of climate change. In general, participants’ feelings about the future of the city as a measure of governance are rather heterogeneous, differing from the more concentrated distribution of responses in the previous sections.
5.3. Public Views on Urban Heat Island Impacts
In the responses to questions related to the heat island effect, more than 80% of residents’ areas were within the heat island (
Figure 13). People perceive that the primary causes of the urban heat island problem are due to industrial production and anthropogenic heat generated by the city. Around 30% of the responses stated that the greenhouse effect was caused by industrial heat and gas emissions, as well as carbon emissions. In addition, the environmental aspects of the city are corelated to building density, the reflection of building façade materials and heat and exhaust emissions from cars and other vehicles. Many participants also referred to environmental issues in the city and the effect of the surface of paved areas on surface temperature. According to Lima [
52], buildings’ energy consumption is growing rapidly, with the energy used by buildings in the urban area accounting for over one-third of the total energy demand. Mardookhy [
53] stated that 61% of residential buildings’ energy consumption is related to space heating or cooling. Climate conditions affect building energy demands, indoor thermal conditions and comfort levels [
54].
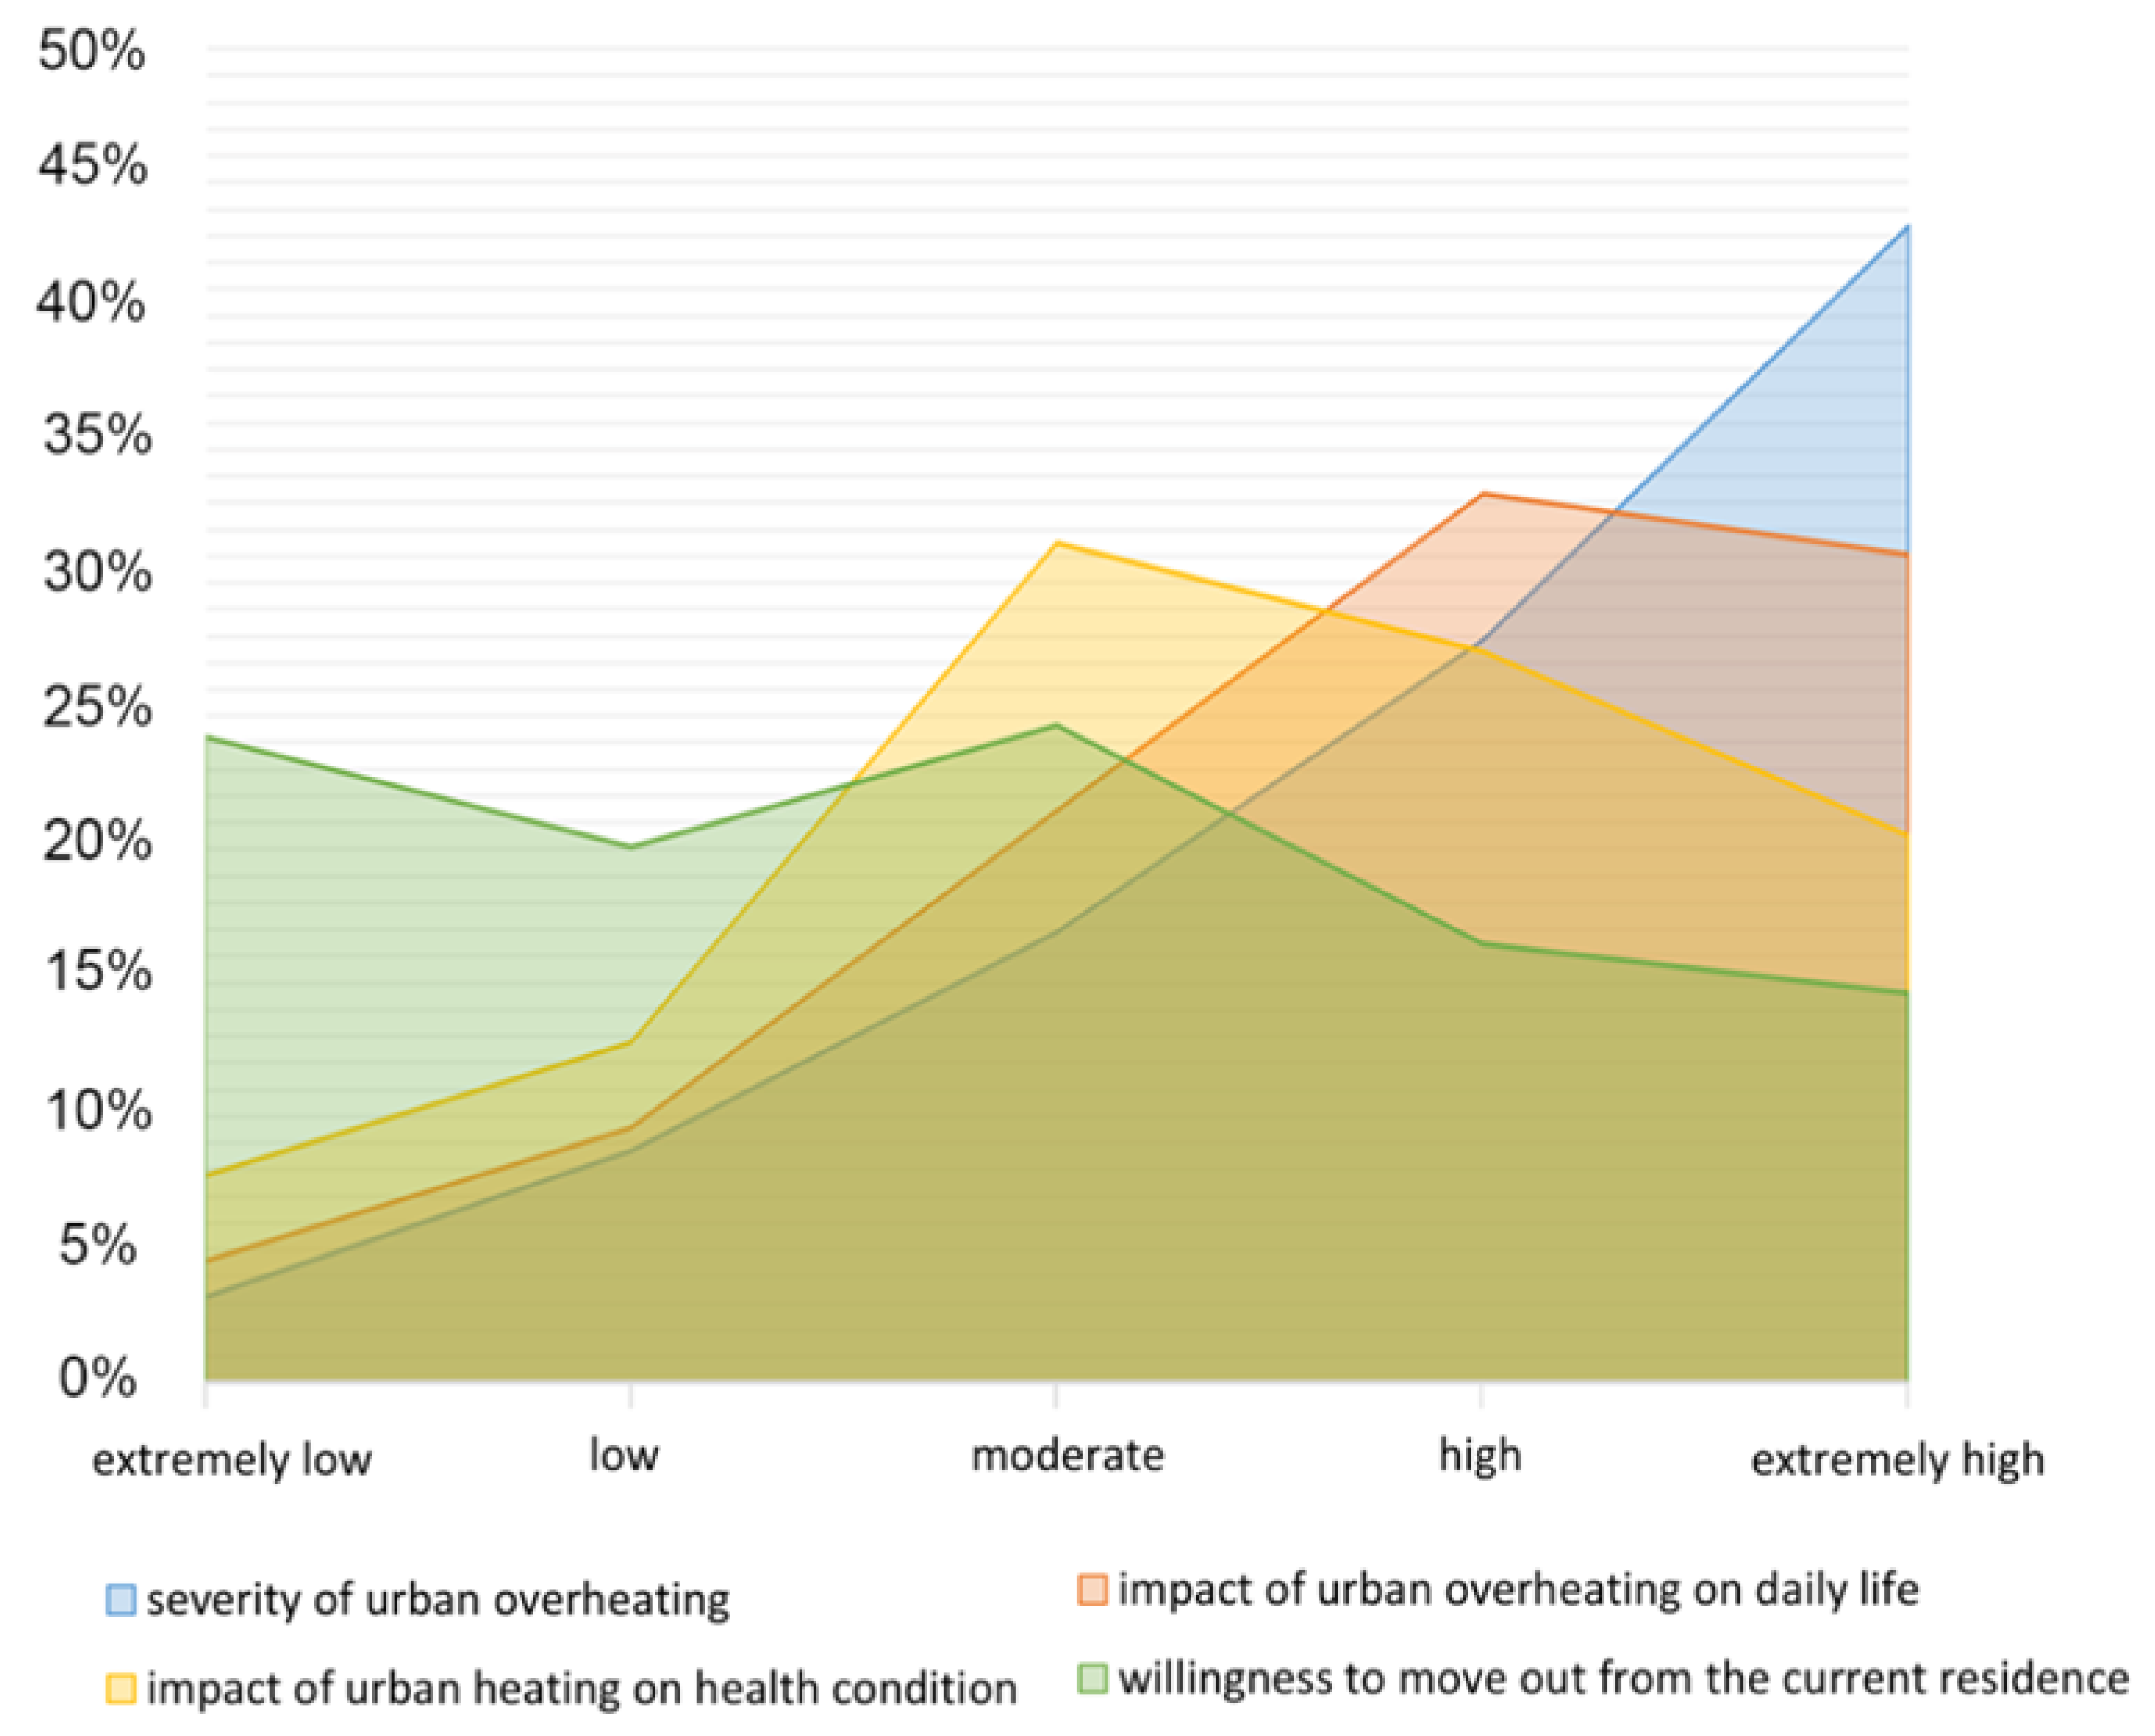
Urban overheating has become a serious issue for many cities in the world. Many people are worried that there is an urban overheating problem in their living areas in Guangzhou. All participants agreed that extreme heat happens at least twice a year on average, and 43% of participants thought that there are more than six heatwaves every year. The extreme heat is caused by both temperature and humidity [
55,
56], as it is a coastal city located close to the South China Sea, and the average humidity of Guangzhou is between 63% and 82%, which is high all throughout the year, and the high humidity aggravates the extreme heat [
56]. Therefore, it was suggested by 73% of the respondents that the extremely high temperature has a non-negligible influence on their daily life, and the average score for the impact of extreme heat is 68 out of 100. However, it is worth mentioning that the respondents thought the urban heat island phenomenon has a 60/100 effect on human health, and 21% of participants considered the impact as mild. High air temperatures can cause thermal discomfort; however, the impacts of this are mitigated by the presence of air conditioning in most of the public transport, commercial buildings and residential buildings in Guangzhou. Urban overheating mainly affects the outdoor thermal environment and the people who are living in that area. To escape from the adverse effects of heat, people are willing to pay for electricity, which is relatively low price to use air conditioning indoors. The development of cooling systems provides a healthy and comfortable environment for people working and living, which abates the negative effect of urban overheating on human thermal comfort. However, the use of AC increases the CO
2 emissions and further increases the ambient air temperature, which causes higher demand for indoor space cooling. Although the extreme heat and urban overheating have become problems for local people, the desire to move out of Guangzhou is not strong. The results indicate that climate change is not a key reason for people to decide if the city is liveable. There are many other factors such as economy, culture, family, education and opportunity, which also affect their decisions on liveability.
According to the responses, people are aware of the importance of mitigating the urban heat island effect, and some of the participants mentioned that vegetation coverage should be increased by planting more trees. People also expect the government to establish relevant policies and apply appropriate measures to encourage and enable low-carbon lifestyles. Participants also stated that that the development process should slow and also reduce carbon dioxide emissions. In general, Guangzhou inhabitants are aware of the effects of climate change and the current state of the city and that many issues are already being resolved locally. Regarding the future, about 32% of inhabitants believes the government should take the lead in limiting anthropogenic CO2 emissions and forest destruction through legislation and rules, while 41% agrees that everyone needs to become involved in climate action. Unquestionably, the problem of climate change is already having an effect on the community, and some action on response work is already in progress. According to a number of respondents, combating climate change will require a coordinated effort by the government and the people in terms of urban planning. Residents have grown more aware of, and active in, the betterment of the city, even though there is still debate regarding financial measures, rules and regulations.
6. Discussion
Regarding the overall climate analysis of Guangzhou city, it has been observed that over the time period studied, the frequency of the extreme weather events has been increasing. For instance, it has been seen that the average monthly temperature for the period 1991–2020 was higher than the temperature for the period from 1961 to 1990, especially for the winter months. Regarding precipitation, the findings have shown that an increased hazard of floods has impacted the city partly as a result of the more severe monsoon season. However, these results are aligned to measurements elsewhere as regards the effects of global climate change. In more detail, in the past 30 years, the worldwide average temperature has grown by around 0.2 °C each decade, which is comparable to the warming rate anticipated in the 1980s by early simulations of the Earth’s climate change model with transient greenhouse gas increases [
57]. A recent U.S. study in 2021 has shown that the annual temperature from 1901 to 2020 has dramatically increased, which means that global warming impacts the climate globally [
58].
Table 2 documents the exact numerical values that have been obtained from the analysis regarding average and peak (maximum) values for the comparison of the six cities.
As a consequence of climate change and the increased temperatures, greater precipitation threatens both the mainland and coastal regions. The impacts of coastal flooding are various and extend from the natural and built environment to everyday human health and wellbeing. Concerning the natural environment, one of the impacts of coastal flooding is the intrusion of saltwater into drinking water [
59]. From the comparison of Guangzhou city with the other five cities, regarding climate change through the 30 years of the study period, Guangzhou has the highest fluctuations in precipitation. This means that the city is highly affected by climate change. According to the comparison maps, and particularly to the average maximum temperature that has been observed over the last 30 years, it is evident that Guangzhou ranks first, with the highest average temperature record.
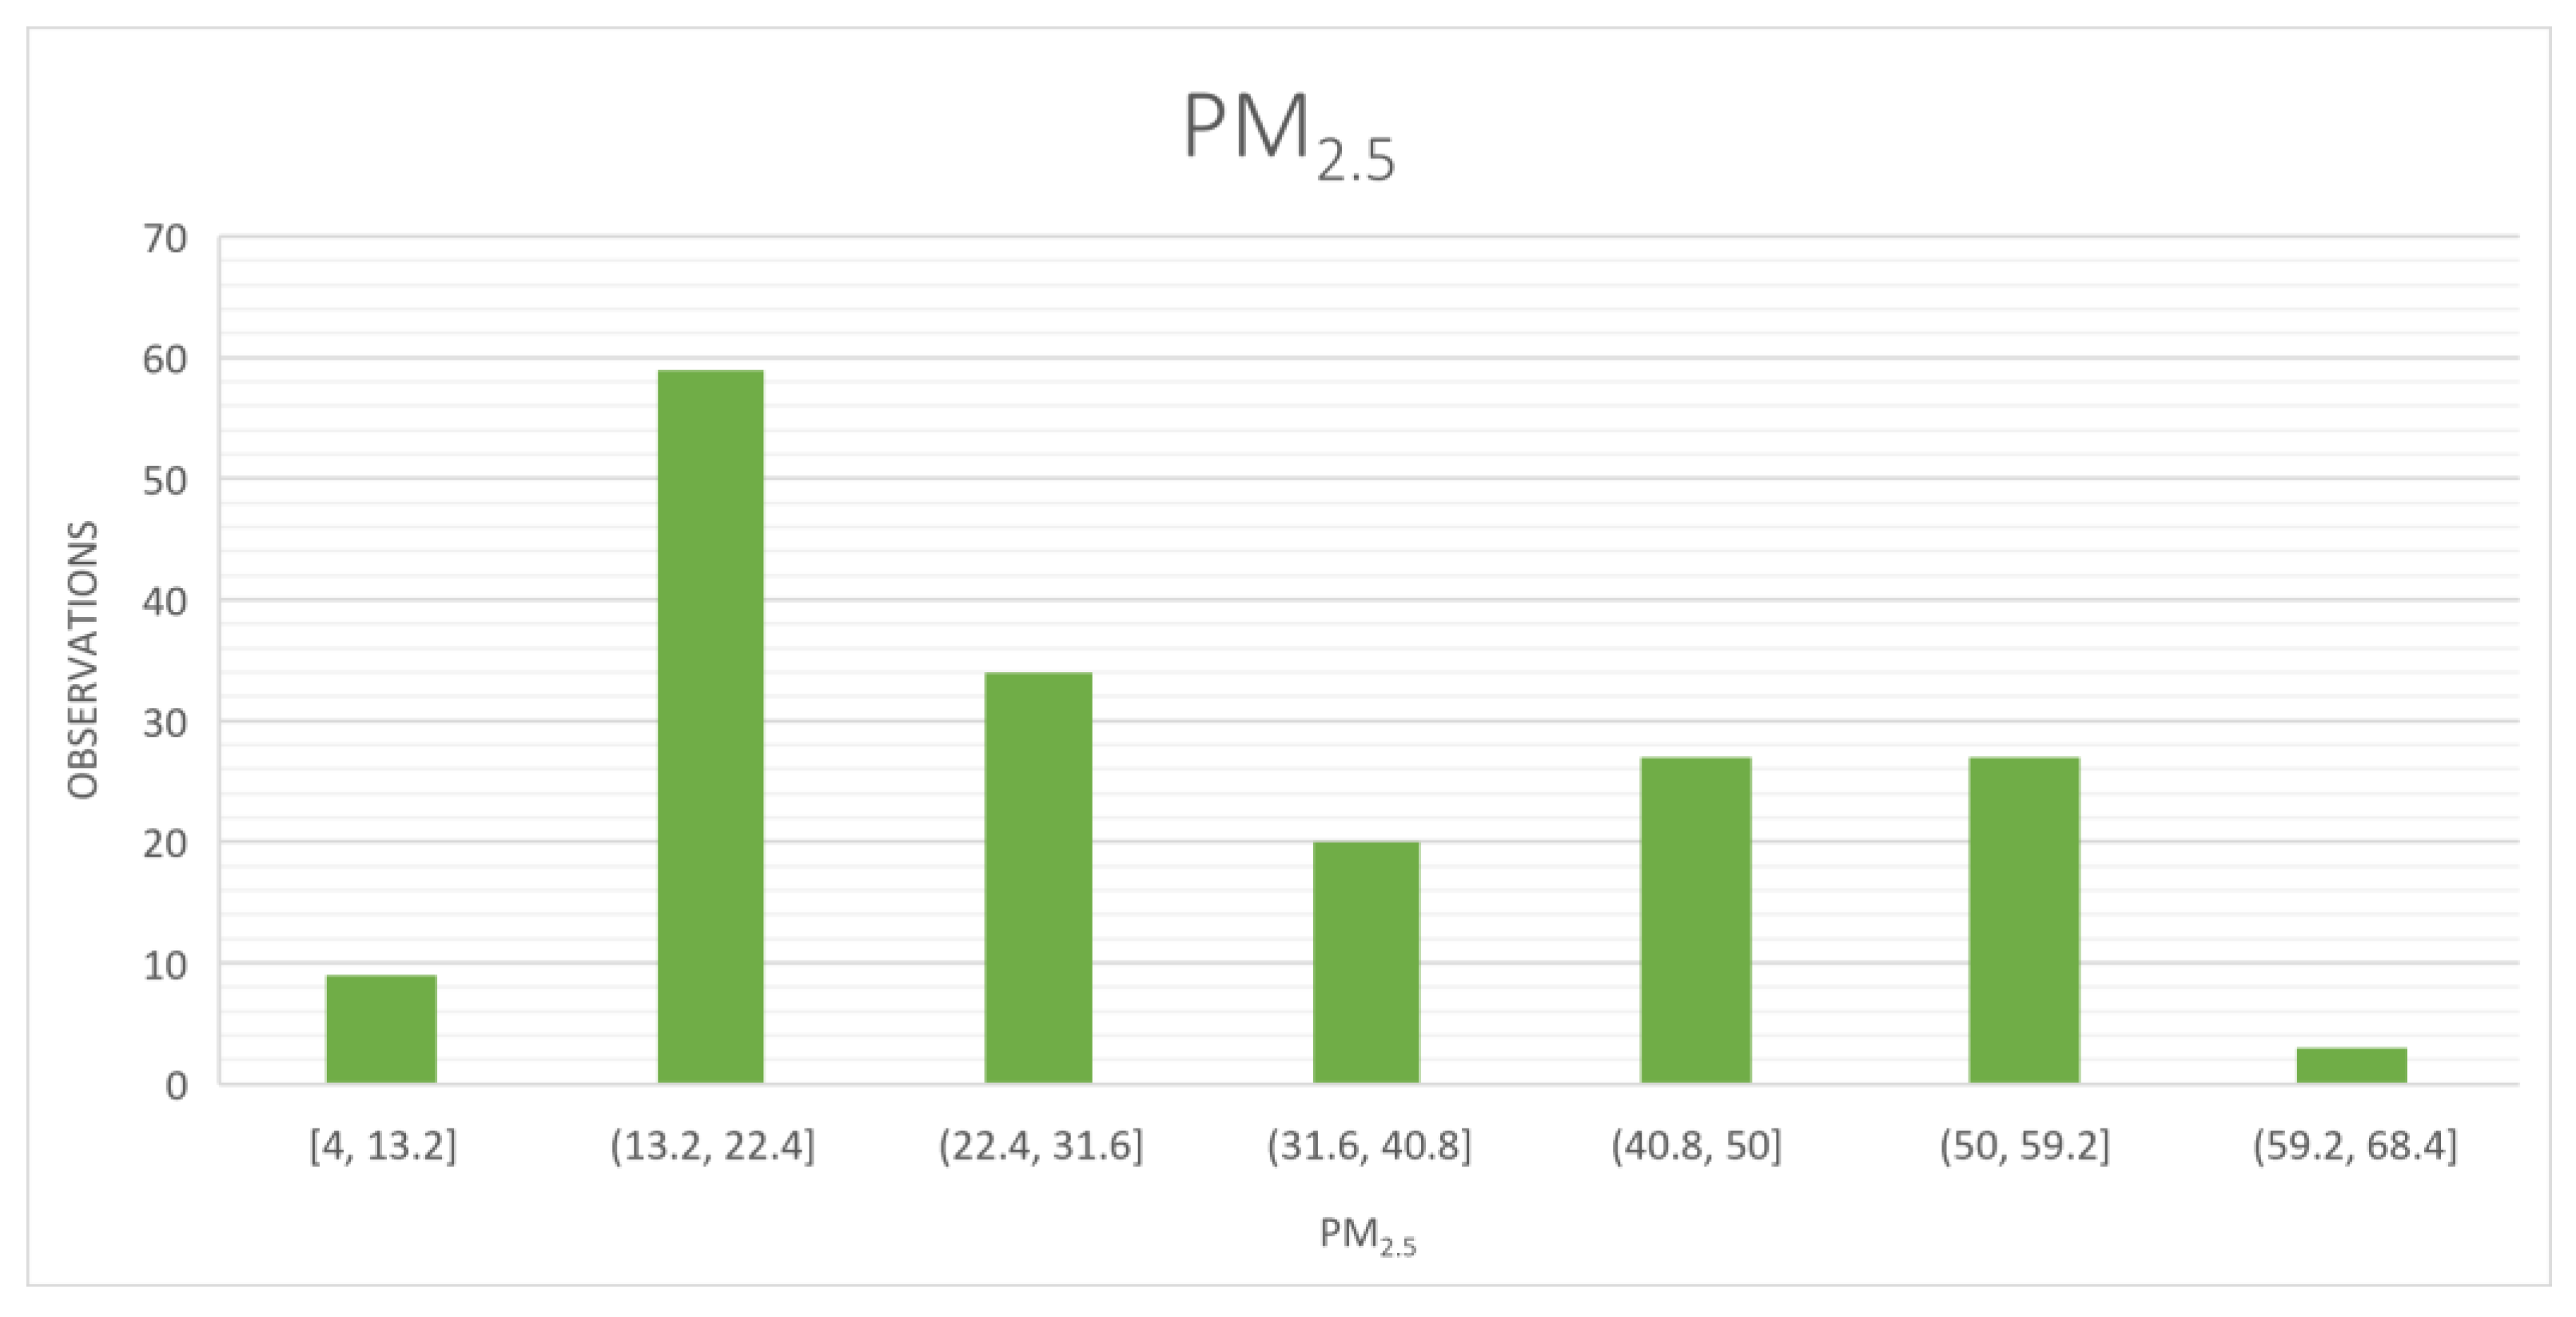
UHI is one of the principal concerns for Guangzhou city, where the trend for temperatures is increasing. Air pollution, urban growth and high heat cumulatively impact the UHI effects [
60].
Figure 14 illustrates the air pollution measured with PM
2.5; the majority of the observations range between 13.2 and 22.5.
The survey results showed that even though communities are aware of the climate change and UHI impacts, they do not want to migrate to other areas because of emotional bonding with that place. These study results show clearly that the majority of the public is aware of anthropogenic climatic changes, severe weather events and associated hazards.
7. Comparison of Physical Analysis Results with Social Science Survey Results
The current study compared climate change and associated factors’ physical analysis results with survey (public opinion) results to identify the trends between physical and social analysis.
Table 3 explores these trends.
The results revealed that the majority of people have basic-to-good knowledge on climate change, urban heat impact and associated things. However, despite suffering from climate change impacts, they do not want to change their location. Nonetheless, they want to contribute towards reducing climate change and its impacts.
As mentioned in the study, temperatures and precipitation showed significant fluctuations in the case-study area in China. Similarly, other Asian nations including India, Indonesia and Bangladesh, etc., showed the same trends in the last 60 years. Panda and Sahu explored 37 years of data for Kalahandi, Bolangir and Koraput districts of Odisha, India, and indicated the temperatures and rainfall have shown rising trends for the period of 1980–2017 [
61]. Mullick and team analysed 50 years (1966–2015) of data of temperatures and rainfall for Bangladesh and identified that both temperatures and rainfall showed an increased trend in the above-mentioned period [
62]. Kantamaneni and co-researchers identified that, due to climate change, temperatures and rainfall trends have shown increasing trends in Indonesia, particularly in the Sabang Island in last decades [
63]. All these things cumulatively indicate that precipitation/rainfall and temperatures show an increased trend across Asia, which highlights the severity of climate change.
8. Limitations
There are some limitations to this study. The primary issue is the limited datasets available to undertake the assessment of precipitation and humidity. There are no freely available continuous datasets for coastal flooding; accordingly, the study did not evaluate coastal flooding. In relation to the survey, initially survey participants could not participate due to language barriers; however, the survey questions were subsequently advertised in local languages. This study did not consider exposure, sensitivity and adaptation (ESA) elements for the assessment, as ESA are more common criteria in CVI (coastal vulnerability index) studies. Despite the above limitations, the study has identified significant findings.
9. Conclusions
The study analysed physical factors related to climate change such as temperature and precipitation in Guangzhou, a Chinese urban megacity. A survey of public perceptions concerning these physical factors was also undertaken. A comparison of the results from Guangzhou was made with other similar cities in the same province to better understand their vulnerability to the impacts of climate change. The physical climate change results revealed that there has been a significant increase in precipitation and temperature. The months of May and June received the highest rainfall between 1961 and 2021. The research results revealed that temperatures showed an increasing trend in this period. Furthermore, there was correlation of the study results to existing scientific analysis and benchmarks on climate change impacts. In addition to the analysis of data related to the physical impacts of climate change on temperatures and precipitation, an online survey was conducted with more than 300 participants to understand the public’s views in relation to this. The public are aware of the trends in relation to urban heat island effects, precipitation and increased risk of hazards and expressed that climate change is one of the main contributing factors. However, most of the public expressed a preference not to leave their home cities despite their increased vulnerability to various climatic hazards. The participants revealed powerful emotional bonds with their homes and neighbourhoods and are ready to accept the climate vulnerability despite the impacts of climate change. The results from this study contribute vital knowledge to regional and national policy makers to enable better understanding of current climate change patterns and the public’s opinion about climate change and other environmental problems and subsequently improve the governments’ abilities to deal with these challenges.
Author Contributions
Conceptualization, K.K. and M.Z.; methodology, K.K., A.A., M.Z., W.X., S.P., L.P.R. and C.J.-B.; software, M.Z., K.K. and A.A.; validation, K.K., I.K., L.P.R. and H.W.; formal analysis, K.K., M.Z. and A.A.; investigation, K.K., Q.L. and H.W.; resources, K.K.; data curation, K.K., S.P. and R.R.B.P.; writing—original draft preparation, K.K.; writing—review and editing, K.K., L.R., S.P. and R.R.B.P.; visualization, K.K. and M.Z.; supervision, K.K.; project administration, K.K., Q.L. and M.Z.; funding acquisition, K.K. All authors have read and agreed to the published version of the manuscript.
Funding
This research was funded by British Council—Challenge Prize.
Institutional Review Board Statement
The study was conducted in accordance with the Declaration of University of Central Lancashire (UCLan) and approved by UCLan’s Science Ethics Review Panel Reference Number: SCIENCE 0182 on 12 May 2022.
Informed Consent Statement
Informed consent was obtained from all subjects involved in the study.
Data Availability Statement
Not applicable.
Conflicts of Interest
The authors declare no conflict of interest.
References
- Xu, L.; Wang, X.; Liu, J.; He, Y.; Tang, J.; Nguyen, M.; Cui, S. Identifying the trade-offs between climate change mitigation and adaptation in urban land use planning: An empirical study in a coastal city. Environ. Int. 2019, 133, 105162. [Google Scholar] [CrossRef] [PubMed]
- Habitat, U. Urbanization and development: Emerging futures. World Cities Rep. 2016, 3, 4–51. [Google Scholar]
- Seto, K.C.; Dhakal, S.; Bigio, A.; Blanco, H.; Delgado, G.C.; Dewar, D.; Huang, L.; Inaba, A.; Kansal, A.; Lwasa, S. Human settlements, infrastructure and spatial planning. In Climate Change 2014: Mitigation of Climate Change; Cambridge University Press: Cambridge, UK, 2014. [Google Scholar]
- Birkmann, J.; Welle, T.; Solecki, W.; Lwasa, S.; Garschagen, M. Boost resilience of small and mid-sized cities. Nature 2016, 537, 605–608. [Google Scholar] [CrossRef] [PubMed]
- Hallegatte, S.; Green, C.; Nicholls, R.J.; Corfee-Morlot, J. Future flood losses in major coastal cities. Nat. Clim. Chang. 2013, 3, 802–806. [Google Scholar] [CrossRef]
- Kopp, R.E.; Kemp, A.C.; Bittermann, K.; Horton, B.P.; Donnelly, J.P.; Gehrels, W.R.; Hay, C.C.; Mitrovica, J.X.; Morrow, E.D.; Rahmstorf, S. Temperature-driven global sea-level variability in the Common Era. Proc. Natl. Acad. Sci. USA 2016, 113, E1434–E1441. [Google Scholar] [CrossRef]
- Nerem, R.S.; Beckley, B.D.; Fasullo, J.T.; Hamlington, B.D.; Masters, D.; Mitchum, G.T. Climate-change–driven accelerated sea-level rise detected in the altimeter era. Proc. Natl. Acad. Sci. USA 2018, 115, 2022–2025. [Google Scholar] [CrossRef]
- Hansen, H.S. Modelling the future coastal zone urban development as implied by the IPCC SRES and assessing the impact from sea level rise. Landsc. Urban Plan. 2010, 98, 141–149. [Google Scholar] [CrossRef]
- Syvitski, J.P.; Kettner, A.J.; Overeem, I.; Hutton, E.W.; Hannon, M.T.; Brakenridge, G.R.; Day, J.; Vörösmarty, C.; Saito, Y.; Giosan, L. Sinking deltas due to human activities. Nat. Geosci. 2009, 2, 681–686. [Google Scholar] [CrossRef]
- Giosan, L.; Syvitski, J.; Constantinescu, S.; Day, J. Climate change: Protect the world’s deltas. Nature 2014, 516, 31–33. [Google Scholar] [CrossRef]
- Adger, W.N.; Hughes, T.P.; Folke, C.; Carpenter, S.R.; Rockstrom, J. Social-ecological resilience to coastal disasters. Science 2005, 309, 1036–1039. [Google Scholar] [CrossRef]
- Leal Filho, W.; Echevarria Icaza, L.; Emanche, V.O.; Quasem Al-Amin, A. An evidence-based review of impacts, strategies and tools to mitigate urban heat islands. Int. J. Environ. Res. Public Health 2017, 14, 1600. [Google Scholar] [CrossRef]
- Stewart, I.D.; Oke, T.R. Local climate zones for urban temperature studies. Bull. Am. Meteorol. Soc. 2012, 93, 1879–1900. [Google Scholar] [CrossRef]
- Hirano, Y.; Yoshida, Y. Assessing the effects of CO2 reduction strategies on heat islands in urban areas. Sustain. Cities Soc. 2016, 26, 383–392. [Google Scholar] [CrossRef]
- Ramamurthy, P.; Sangobanwo, M. Inter-annual variability in urban heat island intensity over 10 major cities in the United States. Sustain. Cities Soc. 2016, 26, 65–75. [Google Scholar] [CrossRef]
- Gartland, L.M. Heat Islands: Understanding and Mitigating Heat in Urban Areas; Routledge: London, UK. [CrossRef]
- Hsieh, C.-M.; Huang, H.-C. Mitigating urban heat islands: A method to identify potential wind corridor for cooling and ventilation. Comput. Environ. Urban Syst. 2016, 57, 130–143. [Google Scholar] [CrossRef]
- Rebetez, M.; Dupont, O.; Giroud, M. An analysis of the July 2006 heatwave extent in Europe compared to the record year of 2003. Theor. Appl. Climatol. 2009, 95, 1–7. [Google Scholar] [CrossRef]
- Haunschild, R.; Bornmann, L.; Marx, W. Climate change research in view of bibliometrics. PLoS ONE 2016, 11, e0160393. [Google Scholar] [CrossRef] [PubMed]
- Santos, R.M.; Bakhshoodeh, R. Climate change/global warming/climate emergency versus general climate research: Comparative bibliometric trends of publications. Heliyon 2021, 7, e08219. [Google Scholar] [CrossRef]
- Li, J.; Zheng, X.; Zhang, C. Retrospective research on the interactions between land-cover change and global warming using bibliometrics during 1991–2018. Environ. Earth Sci. 2021, 80, 573. [Google Scholar] [CrossRef]
- Pachauri, R.K.; Reisinger, A. Synthesis Report. Fifth Assessment Report of the Intergovernmental Panel on Climate Change; IPCC: Geneva, Switzerland, 2007; pp. 151–165. [Google Scholar]
- Pachauri, R.; Meyer, L. Climate Change 2014: Synthesis Report. Contribution of Working Groups I, II and III to the Fifth Assessment Report of the Intergovernmental Panel on Climate Change; IPCC: Geneva, Switzerland, 2014. [Google Scholar]
- Wang, J.A.; Liang, S.; Shi, P. Natural disasters. In The Geography of Contemporary China; Springer: Berlin/Heidelberg, Germany, 2022; pp. 231–261. [Google Scholar]
- Guha-Sapir, D.; Vos, F.; Below, R.; Ponserre, S. Annual Disaster Statistical Review 2011: The Numbers and Trends; Université catholique de Louvain: Brussels, Belgium, 2012. [Google Scholar]
- Ting, Y.H. Natural disasters in China. In International Perspectives on Natural Disasters: Occurrence, Mitigation, and Consequences; Springer: Berlin/Heidelberg, Germany, 2007; pp. 181–192. [Google Scholar]
- Song, Y.; Ge, Y.; Wang, J.; Ren, Z.; Liao, Y.; Peng, J. Spatial distribution estimation of malaria in northern China and its scenarios in 2020, 2030, 2040 and 2050. Malar. J. 2016, 15, 345. [Google Scholar] [CrossRef] [PubMed]
- Kang, S.; Eltahir, E.A. North China Plain threatened by deadly heatwaves due to climate change and irrigation. Nat. Commun. 2018, 9, 2894. [Google Scholar] [CrossRef] [PubMed]
- Su, B.; Huang, J.; Fischer, T.; Wang, Y.; Kundzewicz, Z.W.; Zhai, J.; Sun, H.; Wang, A.; Zeng, X.; Wang, G. Drought losses in China might double between the 1.5 C and 2.0 C warming. Proc. Natl. Acad. Sci. USA 2018, 115, 10600–10605. [Google Scholar] [CrossRef] [PubMed]
- Lu, X.; Hong, J.; Zhang, L.; Cooper, O.R.; Schultz, M.G.; Xu, X.; Wang, T.; Gao, M.; Zhao, Y.; Zhang, Y. Severe surface ozone pollution in China: A global perspective. Environ. Sci. Technol. Lett. 2018, 5, 487–494. [Google Scholar] [CrossRef]
- Peng, S.; Feng, Z.; Liao, H.; Huang, B.; Peng, S.; Zhou, T. Spatial-temporal pattern of, and driving forces for, urban heat island in China. Ecol. Indic. 2019, 96, 127–132. [Google Scholar] [CrossRef]
- Geng, X.; Zhang, D.; Li, C.; Yuan, Y.; Yu, Z.; Wang, X. Impacts of climatic zones on urban heat island: Spatiotemporal variations, trends, and drivers in China from 2001–2020. Sustain. Cities Soc. 2022, 89, 104303. [Google Scholar] [CrossRef]
- Geng, S.; Yang, L.; Sun, Z.; Wang, Z.; Qian, J.; Jiang, C.; Wen, M. Spatiotemporal patterns and driving forces of remotely sensed urban agglomeration heat islands in South China. Sci. Total Environ. 2021, 800, 149499. [Google Scholar] [CrossRef]
- Grimm, N.B.; Foster, D.; Groffman, P.; Grove, J.M.; Hopkinson, C.S.; Nadelhoffer, K.J.; Pataki, D.E.; Peters, D.P. The changing landscape: Ecosystem responses to urbanization and pollution across climatic and societal gradients. Front. Ecol. Environ. 2008, 6, 264–272. [Google Scholar] [CrossRef]
- Gago, E.J.; Roldan, J.; Pacheco-Torres, R.; Ordóñez, J. The city and urban heat islands: A review of strategies to mitigate adverse effects. Renew. Sustain. Energy Rev. 2013, 25, 749–758. [Google Scholar] [CrossRef]
- Tian, L.; Li, Y.; Lu, J.; Wang, J. Review on urban heat island in China: Methods, its impact on buildings energy demand and mitigation strategies. Sustainability 2021, 13, 762. [Google Scholar] [CrossRef]
- Zhou, D.; Zhao, S.; Zhang, L.; Sun, G.; Liu, Y. The footprint of urban heat island effect in China. Sci. Rep. 2015, 5, 1–11. [Google Scholar] [CrossRef]
- Yue, W.; Liu, X.; Zhou, Y.; Liu, Y. Impacts of urban configuration on urban heat island: An empirical study in China mega-cities. Sci. Total Environ. 2019, 671, 1036–1046. [Google Scholar] [CrossRef]
- Ngarambe, J.; Oh, J.W.; Su, M.A.; Santamouris, M.; Yun, G.Y. Influences of wind speed, sky conditions, land use and land cover characteristics on the magnitude of the urban heat island in Seoul: An exploratory analysis. Sustain. Cities Soc. 2021, 71, 102953. [Google Scholar] [CrossRef]
- Connors, J.P.; Galletti, C.S.; Chow, W.T. Landscape configuration and urban heat island effects: Assessing the relationship between landscape characteristics and land surface temperature in Phoenix, Arizona. Landsc. Ecol. 2013, 28, 271–283. [Google Scholar] [CrossRef]
- Wong, S.L.; Wan, K.K.; Yang, L.; Lam, J.C. Changes in bioclimates in different climates around the world and implications for the built environment. Build. Environ. 2012, 57, 214–222. [Google Scholar] [CrossRef]
- Zhou, N.; Fridley, D.; Khanna, N.Z.; Ke, J.; McNeil, M.; Levine, M. China’s energy and emissions outlook to 2050: Perspectives from bottom-up energy end-use model. Energy Policy 2013, 53, 51–62. [Google Scholar] [CrossRef]
- Zhang, B.; Gao, J.-x.; Yang, Y. The cooling effect of urban green spaces as a contribution to energy-saving and emission-reduction: A case study in Beijing, China. Build. Environ. 2014, 76, 37–43. [Google Scholar] [CrossRef]
- Morakinyo, T.E.; Ren, C.; Shi, Y.; Lau, K.K.-L.; Tong, H.-W.; Choy, C.-W.; Ng, E. Estimates of the impact of extreme heat events on cooling energy demand in Hong Kong. Renew. Energy 2019, 142, 73–84. [Google Scholar] [CrossRef]
- WorldData. The world’s Largest Economies. 2022 WorldData. Available online: https://www.worlddata.info/largest-economies.php (accessed on 24 November 2022).
- Yu, B. Ecological effects of new-type urbanization in China. Renew. Sustain. Energy Rev. 2021, 135, 110239. [Google Scholar] [CrossRef]
- Gong, P.; Liang, S.; Carlton, E.J.; Jiang, Q.; Wu, J.; Wang, L.; Remais, J.V. Urbanisation and health in China. Lancet 2012, 379, 843–852. [Google Scholar] [CrossRef]
- Verma, R.; Sahu, L.; Kondo, Y.; Takegawa, N.; Han, S.; Jung, J.; Kim, Y.; Fan, S.; Sugimoto, N.; Shammaa, M. Temporal variations of black carbon in Guangzhou, China, in summer 2006. Atmos. Chem. Phys. 2010, 10, 6471–6485. [Google Scholar] [CrossRef]
- Zhou, X.; Cai, L. Coastal and marine environmental issues in the Pearl River Delta region, China. Int. J. Environ. Stud. 2010, 67, 137–145. [Google Scholar] [CrossRef]
- Zhang, G.; Parker, A.; House, A.; Mai, B.; Li, X.; Kang, Y.; Wang, Z. Sedimentary records of DDT and HCH in the Pearl River Delta, south China. Environ. Sci. Technol. 2002, 36, 3671–3677. [Google Scholar] [CrossRef] [PubMed]
- Yang, L.; Scheffran, J.; Qin, H.; You, Q. Climate-related flood risks and urban responses in the Pearl River Delta, China. Reg. Environ. Chang. 2015, 15, 379–391. [Google Scholar] [CrossRef]
- Lima, I.; Scalco, V.; Lamberts, R. Estimating the impact of urban densification on high-rise office building cooling loads in a hot and humid climate. Energy Build. 2019, 182, 30–44. [Google Scholar] [CrossRef]
- Mardookhy, M.; Sawhney, R.; Ji, S.; Zhu, X.; Zhou, W. A study of energy efficiency in residential buildings in Knoxville, Tennessee. J. Clean. Prod. 2014, 85, 241–249. [Google Scholar] [CrossRef]
- Qi, R.; Lu, L.; Huang, Y. Energy performance of solar-assisted liquid desiccant air-conditioning system for commercial building in main climate zones. Energy Convers. Manag. 2014, 88, 749–757. [Google Scholar] [CrossRef]
- Weather Climate Climate in Guangzhou (Guangdong), China. 2022. Available online: https://weather-and-climate.com/average-monthly-Rainfall-Temperature-Sunshine,guangzhou,China (accessed on 5 August 2022).
- Healthline Hot and Cold: Extreme Temperature Safety. 2022. Available online: https://www.healthline.com/health/extreme-temperature-safety (accessed on 5 October 2022).
- Hansen, J.; Sato, M.; Ruedy, R.; Lo, K.; Lea, D.W.; Medina-Elizade, M. Global temperature change. Proc. Natl. Acad. Sci. USA 2006, 103, 14288–14293. [Google Scholar] [CrossRef]
- World Meterological Organisation. Weather, Climate, Environment and Health; WHO: Geneva, Switzerland, 2022. Available online: https://public.wmo.int/en (accessed on 2 November 2022).
- Yao-Dong, D.; Xu-Hua, C.; Xian-Wei, W.; Hui, A.; Hai-Lai, D.; Jian, H.; Xiao-Xuan, W. A Review of Assessment and Adaptation Strategy to Climate Change Impacts on the Coastal Areas in South China. Adv. Clim. Chang. Res. 2013, 4, 201–207. [Google Scholar] [CrossRef]
- Ulpiani, G. On the linkage between urban heat island and urban pollution island: Three-decade literature review towards a conceptual framework. Sci. Total Environ. 2021, 751, 141727. [Google Scholar] [CrossRef]
- Panda, A.; Sahu, N. Trend analysis of seasonal rainfall and temperature pattern in Kalahandi, Bolangir and Koraput districts of Odisha, India. Atmos. Sci. Lett. 2019, 20, e932. [Google Scholar] [CrossRef]
- Mullick, M.R.A.; Nur, R.M.; Alam, M.J.; Islam, K.M.A. Observed trends in temperature and rainfall in Bangladesh using pre-whitening approach. Glob. Planet. Chang. 2019, 172, 104–113. [Google Scholar] [CrossRef]
- Kantamaneni, K.; Christie, D.; Lyddon, C.E.; Huang, P.; Nizar, M.; Balasubramani, K.; Ravichandran, V.; Prasad, K.A.; Pushparaj, R.R.B.; Robins, P.; et al. Comprehensive Assessment of Climate Change and Coastal Inundation through Satellite-Derived Datasets: A Case Study of Sabang Island, Indonesia. Remote Sens. 2022, 14, 2857. [Google Scholar] [CrossRef]
Figure 1.
Location of Guangzhou city.
Figure 1.
Location of Guangzhou city.
Figure 2.
Monthly precipitation, 1961–1990.
Figure 2.
Monthly precipitation, 1961–1990.
Figure 3.
Monthly precipitation, 1991–2020.
Figure 3.
Monthly precipitation, 1991–2020.
Figure 4.
Hourly precipitation, 2010–2015.
Figure 4.
Hourly precipitation, 2010–2015.
Figure 5.
Average monthly temperature, 1961–1990.
Figure 5.
Average monthly temperature, 1961–1990.
Figure 6.
Average monthly temperature, 1991–2020.
Figure 6.
Average monthly temperature, 1991–2020.
Figure 7.
Hourly temperature, 2010–2015.
Figure 7.
Hourly temperature, 2010–2015.
Figure 8.
Trends of temperature, precipitation and windspeed in Guangzhou and the other five cities.
Figure 8.
Trends of temperature, precipitation and windspeed in Guangzhou and the other five cities.
Figure 9.
Comparison of Guangzhou with five other cities—average and peak values of temperatures, precipitation and windspeed for 1991–2022.
Figure 9.
Comparison of Guangzhou with five other cities—average and peak values of temperatures, precipitation and windspeed for 1991–2022.
Figure 10.
Trend analysis: temperatures (1992–2021).
Figure 10.
Trend analysis: temperatures (1992–2021).
Figure 11.
Participants’ views on hazards of climate change and coastal/flood vulnerability.
Figure 11.
Participants’ views on hazards of climate change and coastal/flood vulnerability.
Figure 12.
Participants’ views on the hazards of climate change and urban vulnerability.
Figure 12.
Participants’ views on the hazards of climate change and urban vulnerability.
Figure 13.
Public views on urban heat island impacts.
Figure 13.
Public views on urban heat island impacts.
Figure 14.
Hourly air pollution (PM
2.5), 2010–2015. [Note: When displaying numerical data, a histogram divides the data into "bins" of equal width. Each bin is represented graphically by a bar whose height reflects the number of data points it contains. The range of the numbers is symbolized with either round brackets (or parentheses) or square brackets, depending on the meaning of each bin. The round brackets are used for numbers that are not contained in the bin, and the square brackets are used for numbers that are part of a bin. For example, at
Figure 14, the second bin, namely (13.2, 22.4], means that the number 13.2 is not contained at its range, but the number 22.4 is part of the specific range].
Table 1.
Comparison of Guangzhou with other five cities in terms of population and density.
Table 1.
Comparison of Guangzhou with other five cities in terms of population and density.
| | Guangzhou | Heyuan | Shantou | Shaoguan | Shenzhen | Yangjiang |
|---|
| Total population (million) | 18.67 | 2.8 | 5.5 | 2.8 | 17.56 | 2.6 |
Urban
density(/km2) | 4300 | 1900 | 2400 | 360 | 8400 | 520 |
Table 2.
Comparison of Guangzhou city with other similar cities for temperatures, precipitation and wind speed average values (1992–2021) for temperature.
Table 2.
Comparison of Guangzhou city with other similar cities for temperatures, precipitation and wind speed average values (1992–2021) for temperature.
Comparison of Guangzhou City with Other
Similar Cities (1992–2021) | Guangzhou | Heyuan | Shantou | Shaoguan | Shenzhen | Yangjiang |
|---|
| Average Temperature (°C) | 34.4 | 33.3 | 33.9 | 32.9 | 33.4 | 32.3 |
| Maximum Temperature (°C) | 40 | 39 | 40 | 40.4 | 38 | 38.3 |
| Precipitation (mm) | 239 | 263.4 | 396 | 189.2 | | 605.3 |
| Wind Speed(kt) | 36.1 | 24.7 | 32.9 | 21.5 | 36.4 | 42.7 |
Table 3.
Trend of physical and social survey analysis.
Table 3.
Trend of physical and social survey analysis.
| | Physical Analysis | Social Analysis |
|---|
| 1 | The maximum temperature of 38 °C fluctuates by about 2 °C; 38 °C is the maximum value over 6 years from 2010 to 2015. | People are aware that urban overheating has become a problem for local residents. More than 60% of people believe that heatwaves have large effects on their daily life and reported that heatwaves occurred more than 5 times. |
| 2 | During the past decade, the average temperature of the hottest month (July) rose by 0.6 °C to 29.6 °C. The coldest month (January) also rose by 0.6 °C. | Participants identified that the urban heat island phenomenon has a 60/100 effect on human health, and 21% of them put the impact as mild. |
| 3 | Guangzhou has the highest average temperature in the past 30 years compared to the neighbouring cities. | The primary causes of the urban heat island problem are industrial production and anthropogenic heat generated by the city. |
| 4 | Guangzhou’s population density greatly exceeds that of the other five cities. However, Guangzhou suffers from extremely high temperatures in the summer. The number of days with average temperatures above 30 °C is slowly increasing. | Although the extreme heat and urban overheating became a problem for local people, the desire to move out of Guangzhou is not strong. Many other factors also affect the decisions on livability. |
| 5 | The maximum temperature is increasing annually.
Air pollution, urban development and high temperatures affect UHI cumulatively. | Some participants mentioned that green space should be increased in urban areas. The government is expected to play a leading role in low-carbon lifestyles through legislation and encouragement. |
| 6 | The average humidity in Guangzhou ranges from 63% to 82%, with high levels of humidity throughout the year exacerbating the heat. | More than 50 percent of the participants believed that extreme weather would cause damage to infrastructure and crops, which would further exacerbate the urban heat island effect and significantly increase the risk of heat-related illnesses such as heatstroke. |
| 7 | Guangzhou has experienced the largest fluctuations in precipitation over the past 30 years. This implies that the city is highly influenced by climate change. | Climate change has been strongly interlinked with disasters such as floods. This includes typhoons, heavy rainfall and several days of hot temperatures. |
| 8 | Maximum rainfall has been increasing in the past few decades.
The monsoon brings more coastal flooding risk to the city. | People in Guangzhou believe climate change is strongly interlinked with disasters such as floods and erosion. More than 70% of residents believe that problems such as land loss and infrastructure damage are strongly linked to climate change. |
| 9 | Most of the urban segments in Guangzhou are situated less than +2.0 m MSL, which means large populations are exposed to flooding. | In total, 65% of participants believe climate change will bring unavoidable problems such as urban flooding due to rising sea levels and global temperature increases. Moreover, 35% of the participants suggested that Guangzhou needs to build new inland residential areas in the future to avoid the impact of climate change. |
| 10 | The frequency of extreme weather events is increasing. This is particularly occurring in winter months. In addition, increasing flooding problems have partially affected residents, infrastructure and urban development. | The majority of residents believe that the government should take immediate measures to address climate change. The issue of climate change already has an impact on society. While there is some debate over financial measures, rules and regulations, residents are increasingly aware of, and actively involved in, the city’s improvements. |
| Disclaimer/Publisher’s Note: The statements, opinions and data contained in all publications are solely those of the individual author(s) and contributor(s) and not of MDPI and/or the editor(s). MDPI and/or the editor(s) disclaim responsibility for any injury to people or property resulting from any ideas, methods, instructions or products referred to in the content. |
© 2023 by the authors. Licensee MDPI, Basel, Switzerland. This article is an open access article distributed under the terms and conditions of the Creative Commons Attribution (CC BY) license (https://creativecommons.org/licenses/by/4.0/).


 ,
, _Apostolopoulou.jpg)


