
Duration, but Not Bottle Volume, Affects Phytoplankton Community Structure and Growth Rates in Microcosm Experiments

Abstract
:1. Introduction
2. Materials and Methods
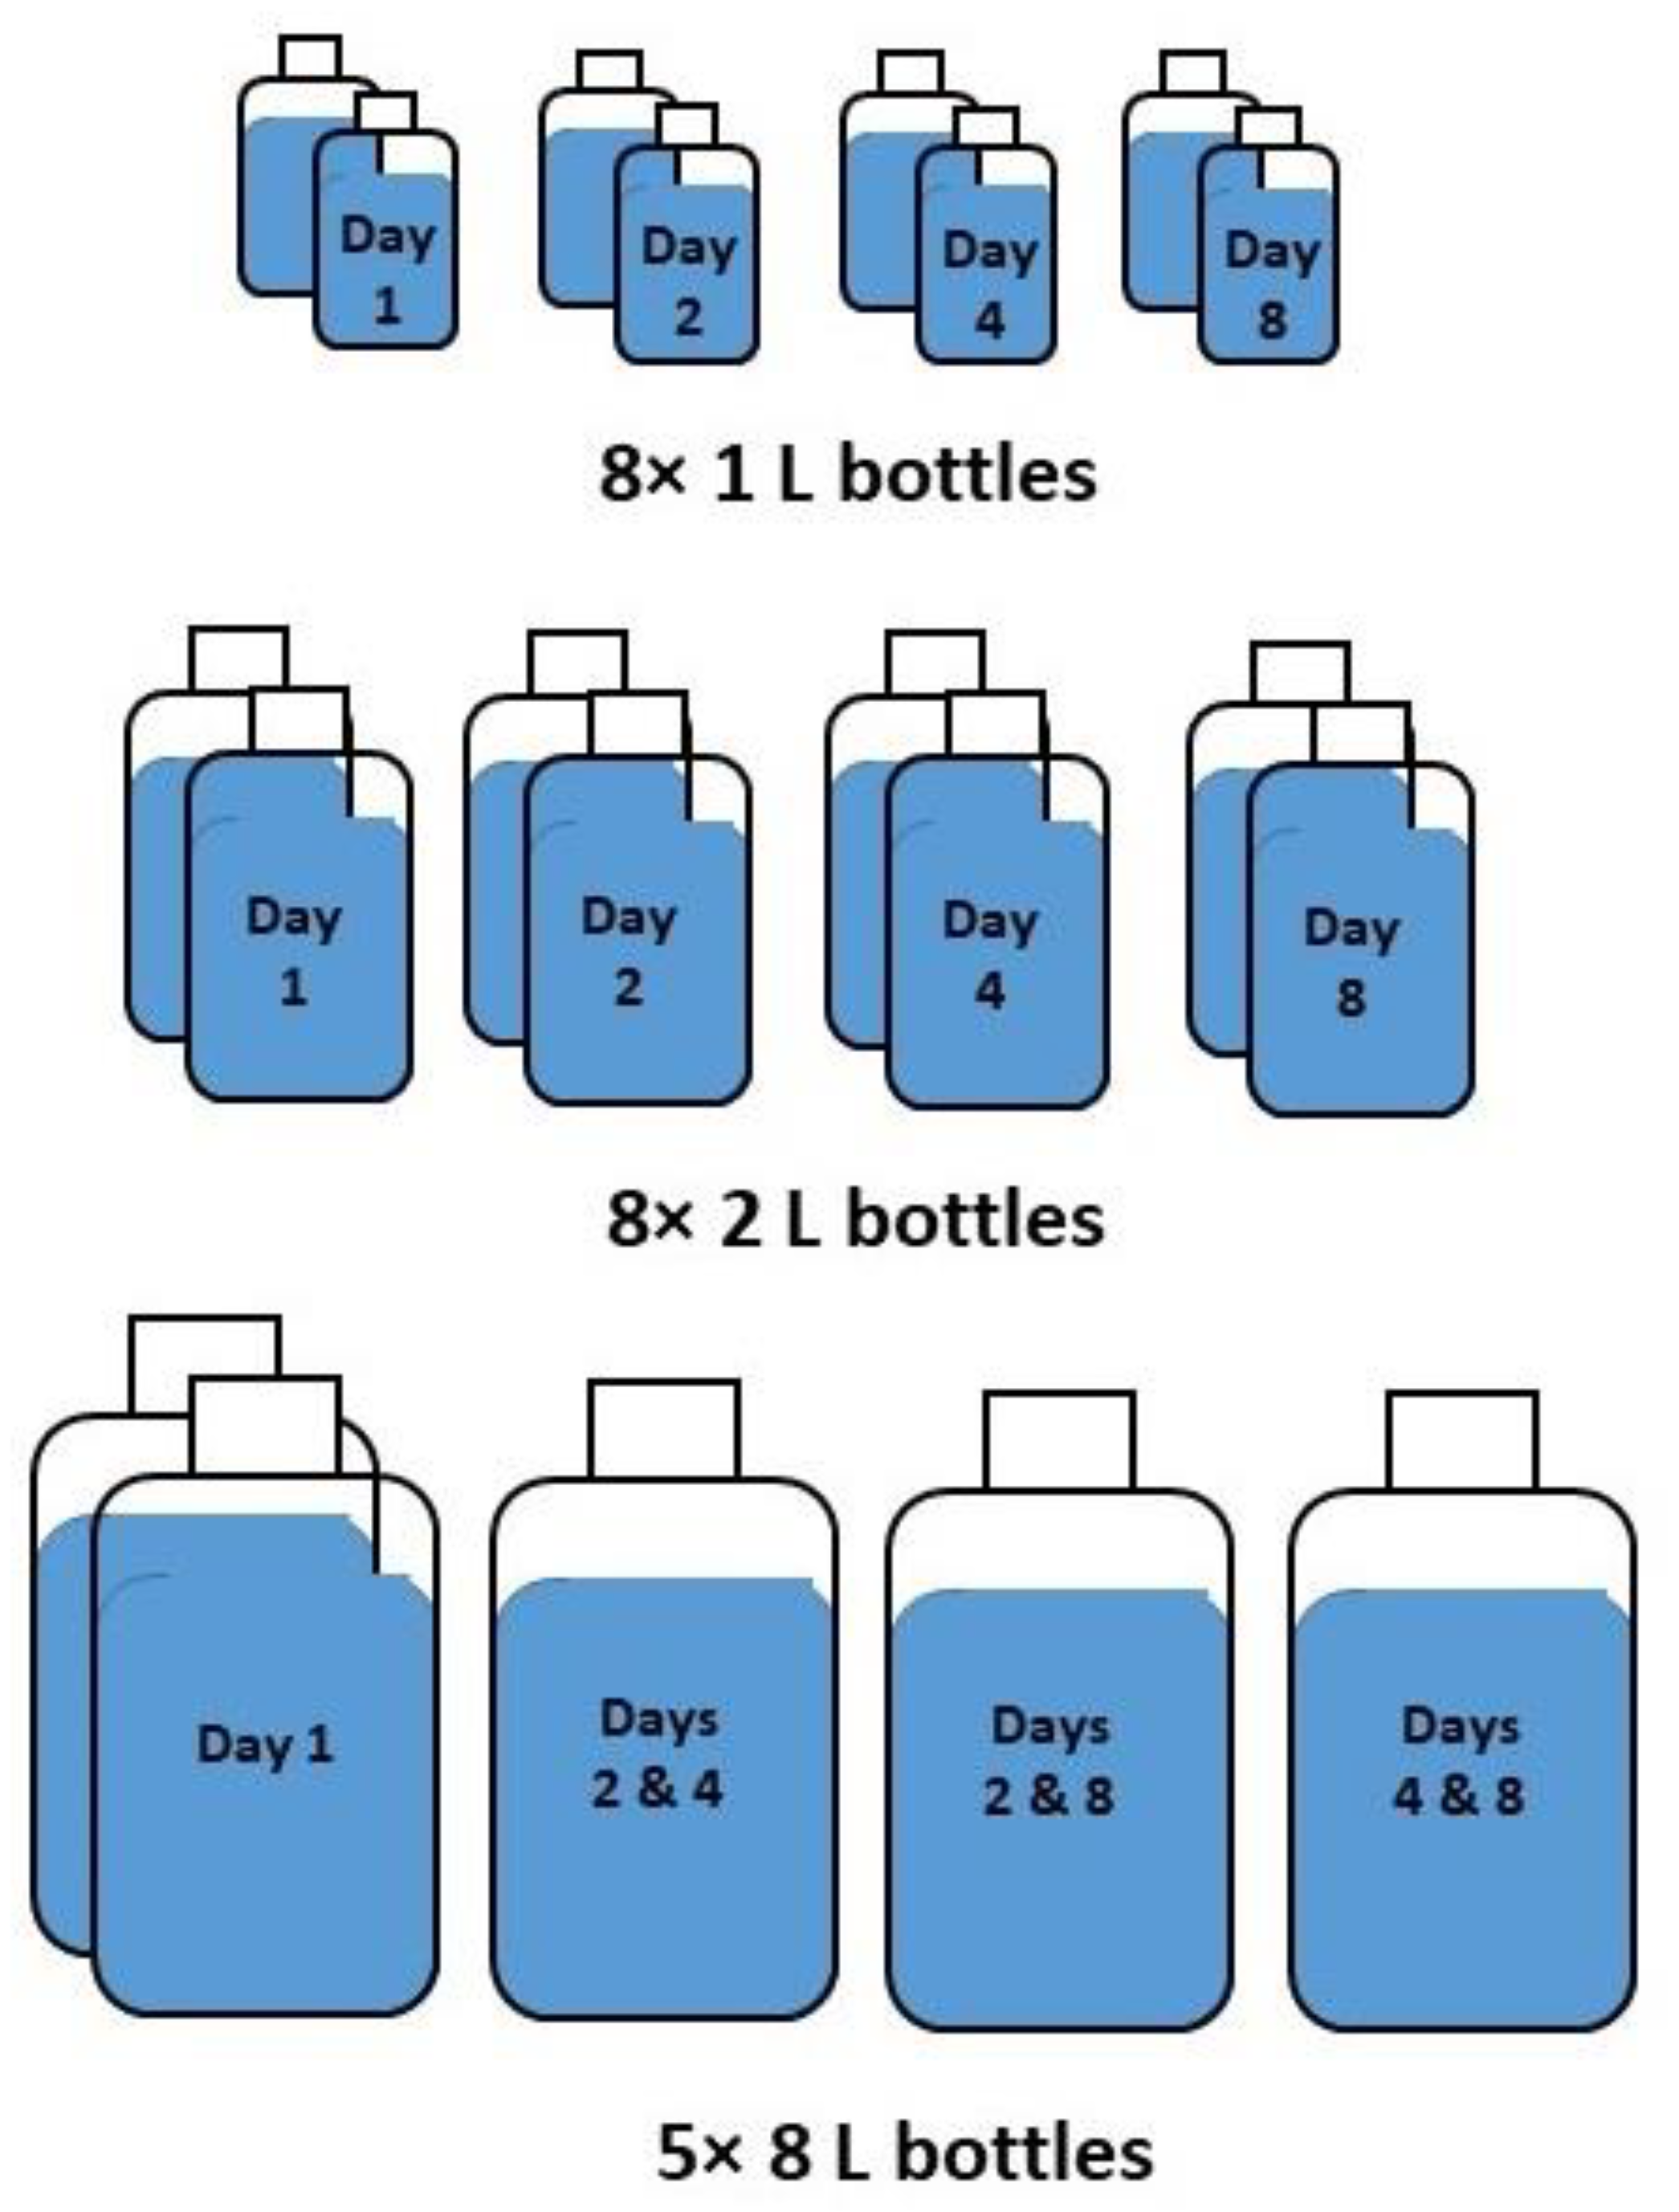
2.1. Sampling and Experimental Strategy
2.2. Chlorophyll a Concentration, Phytoplankton Abundance and Composition
2.3. Data Analysis
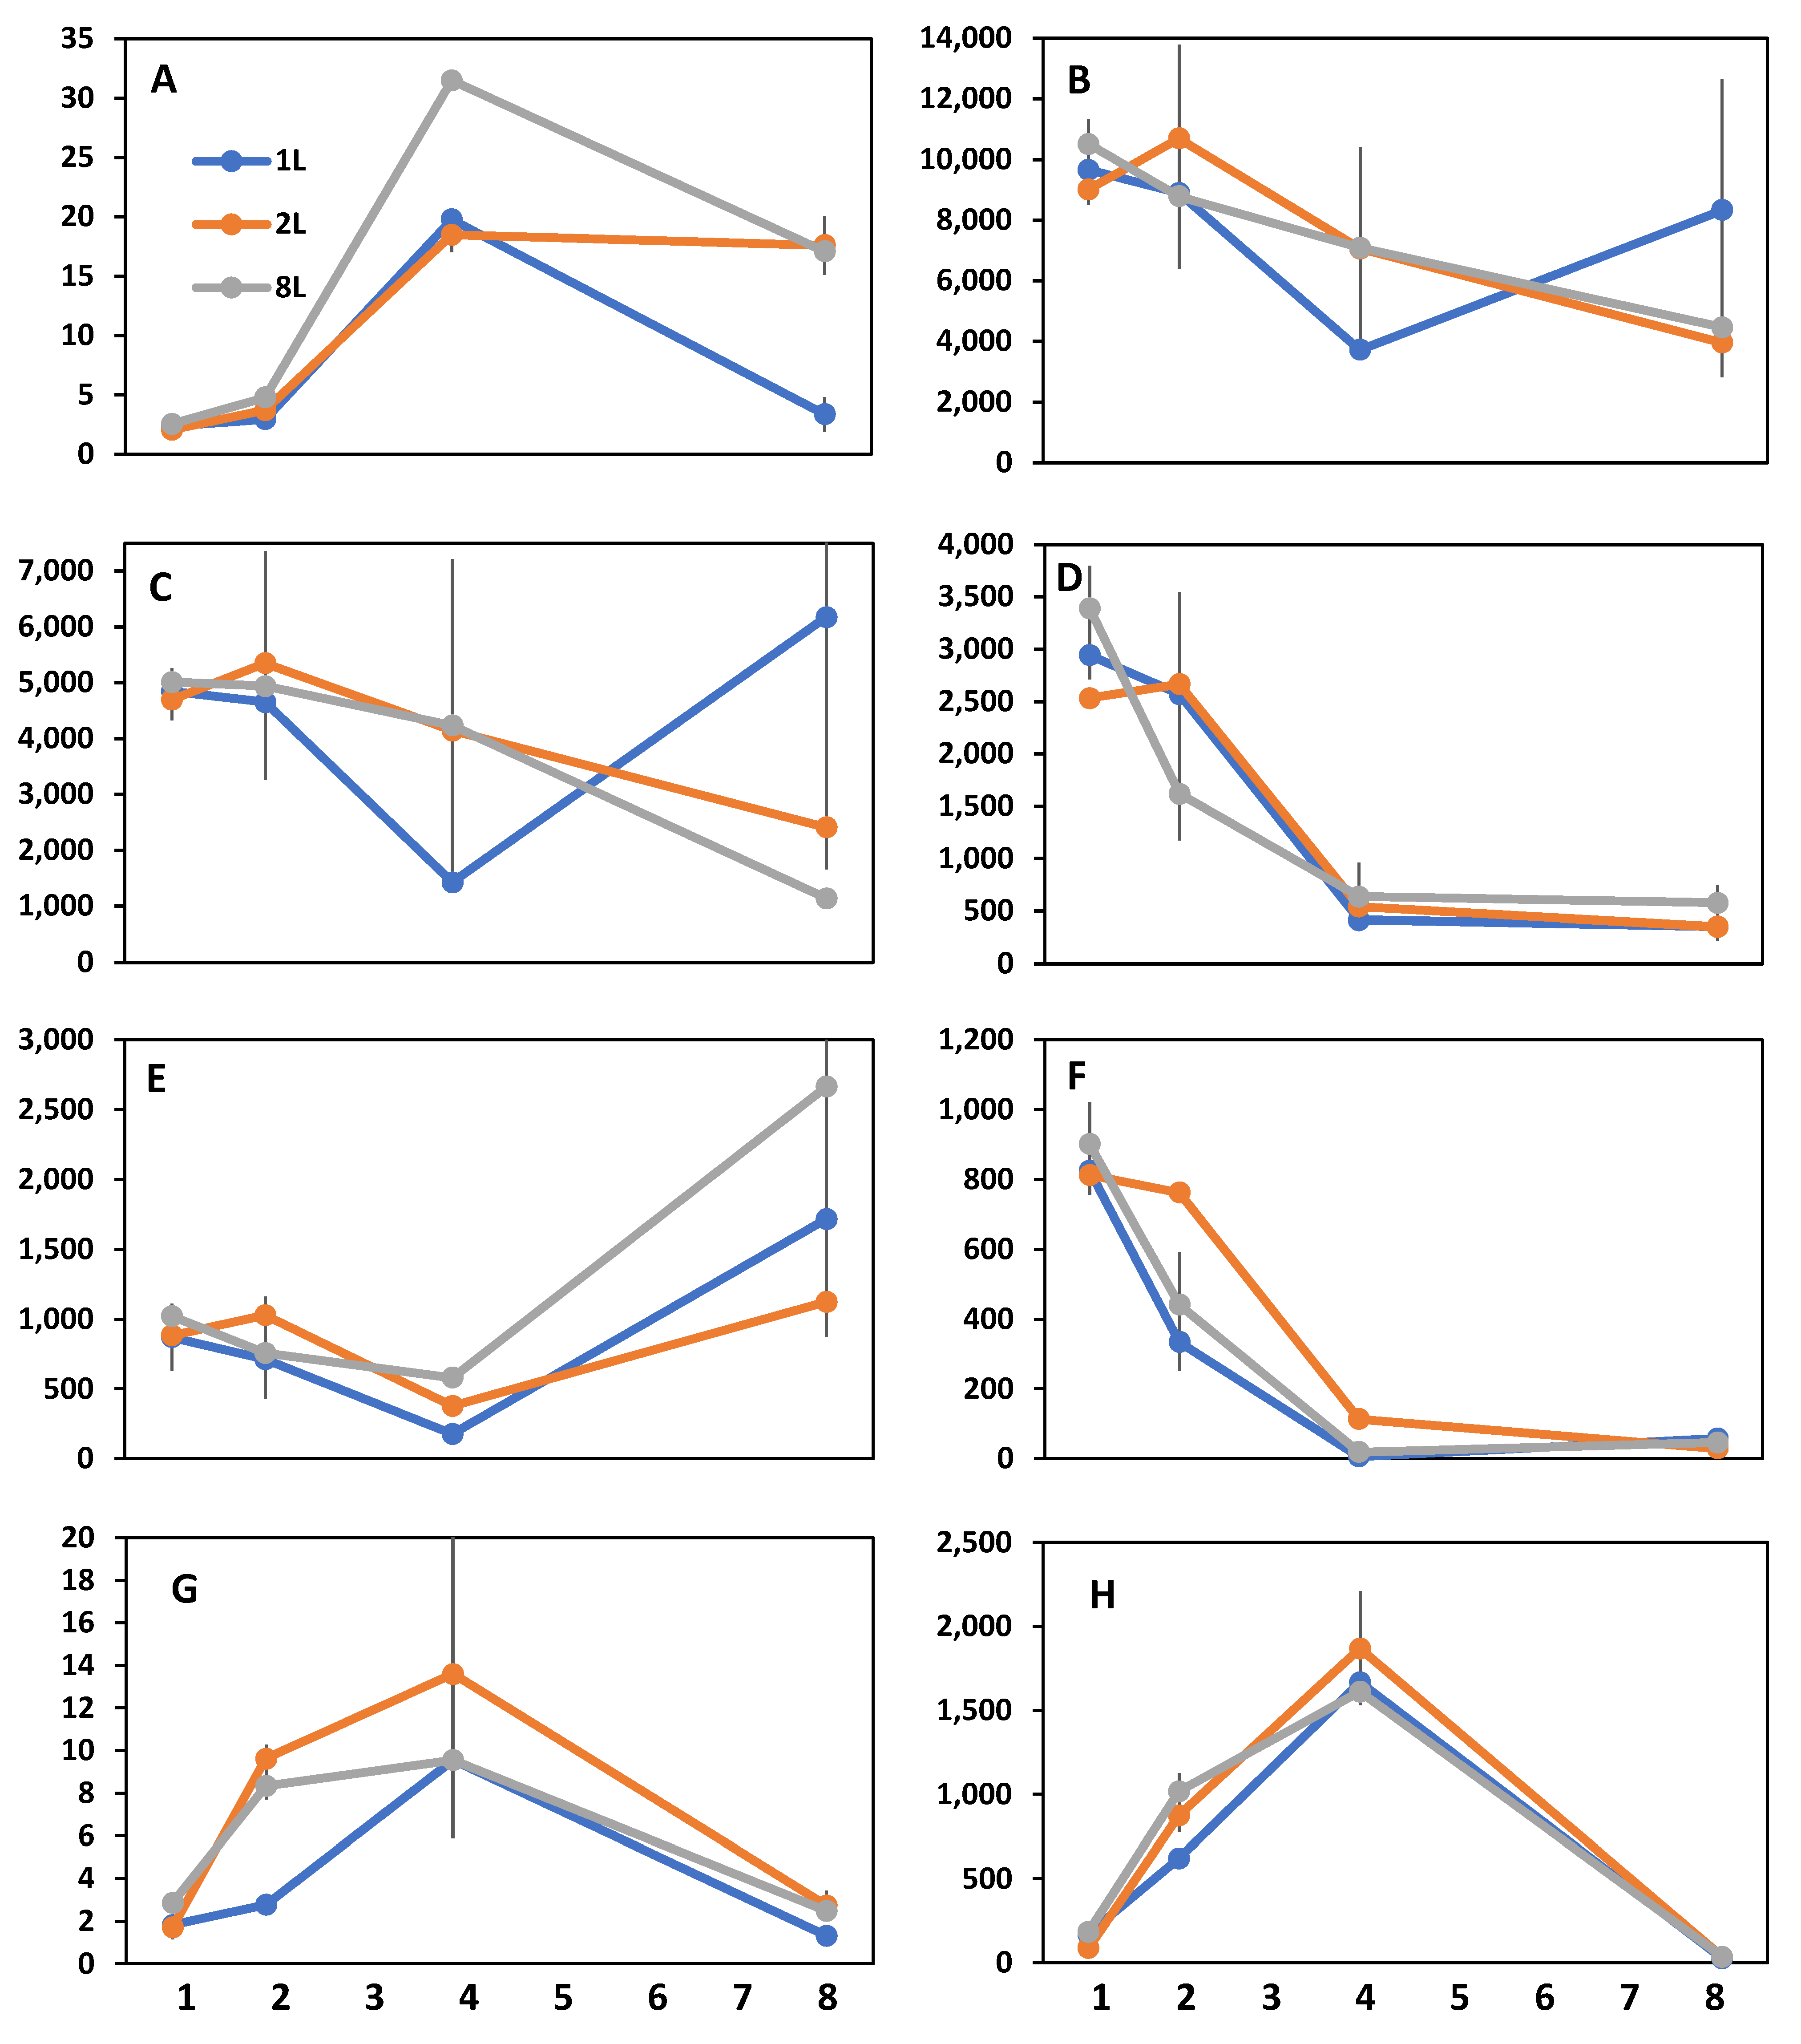
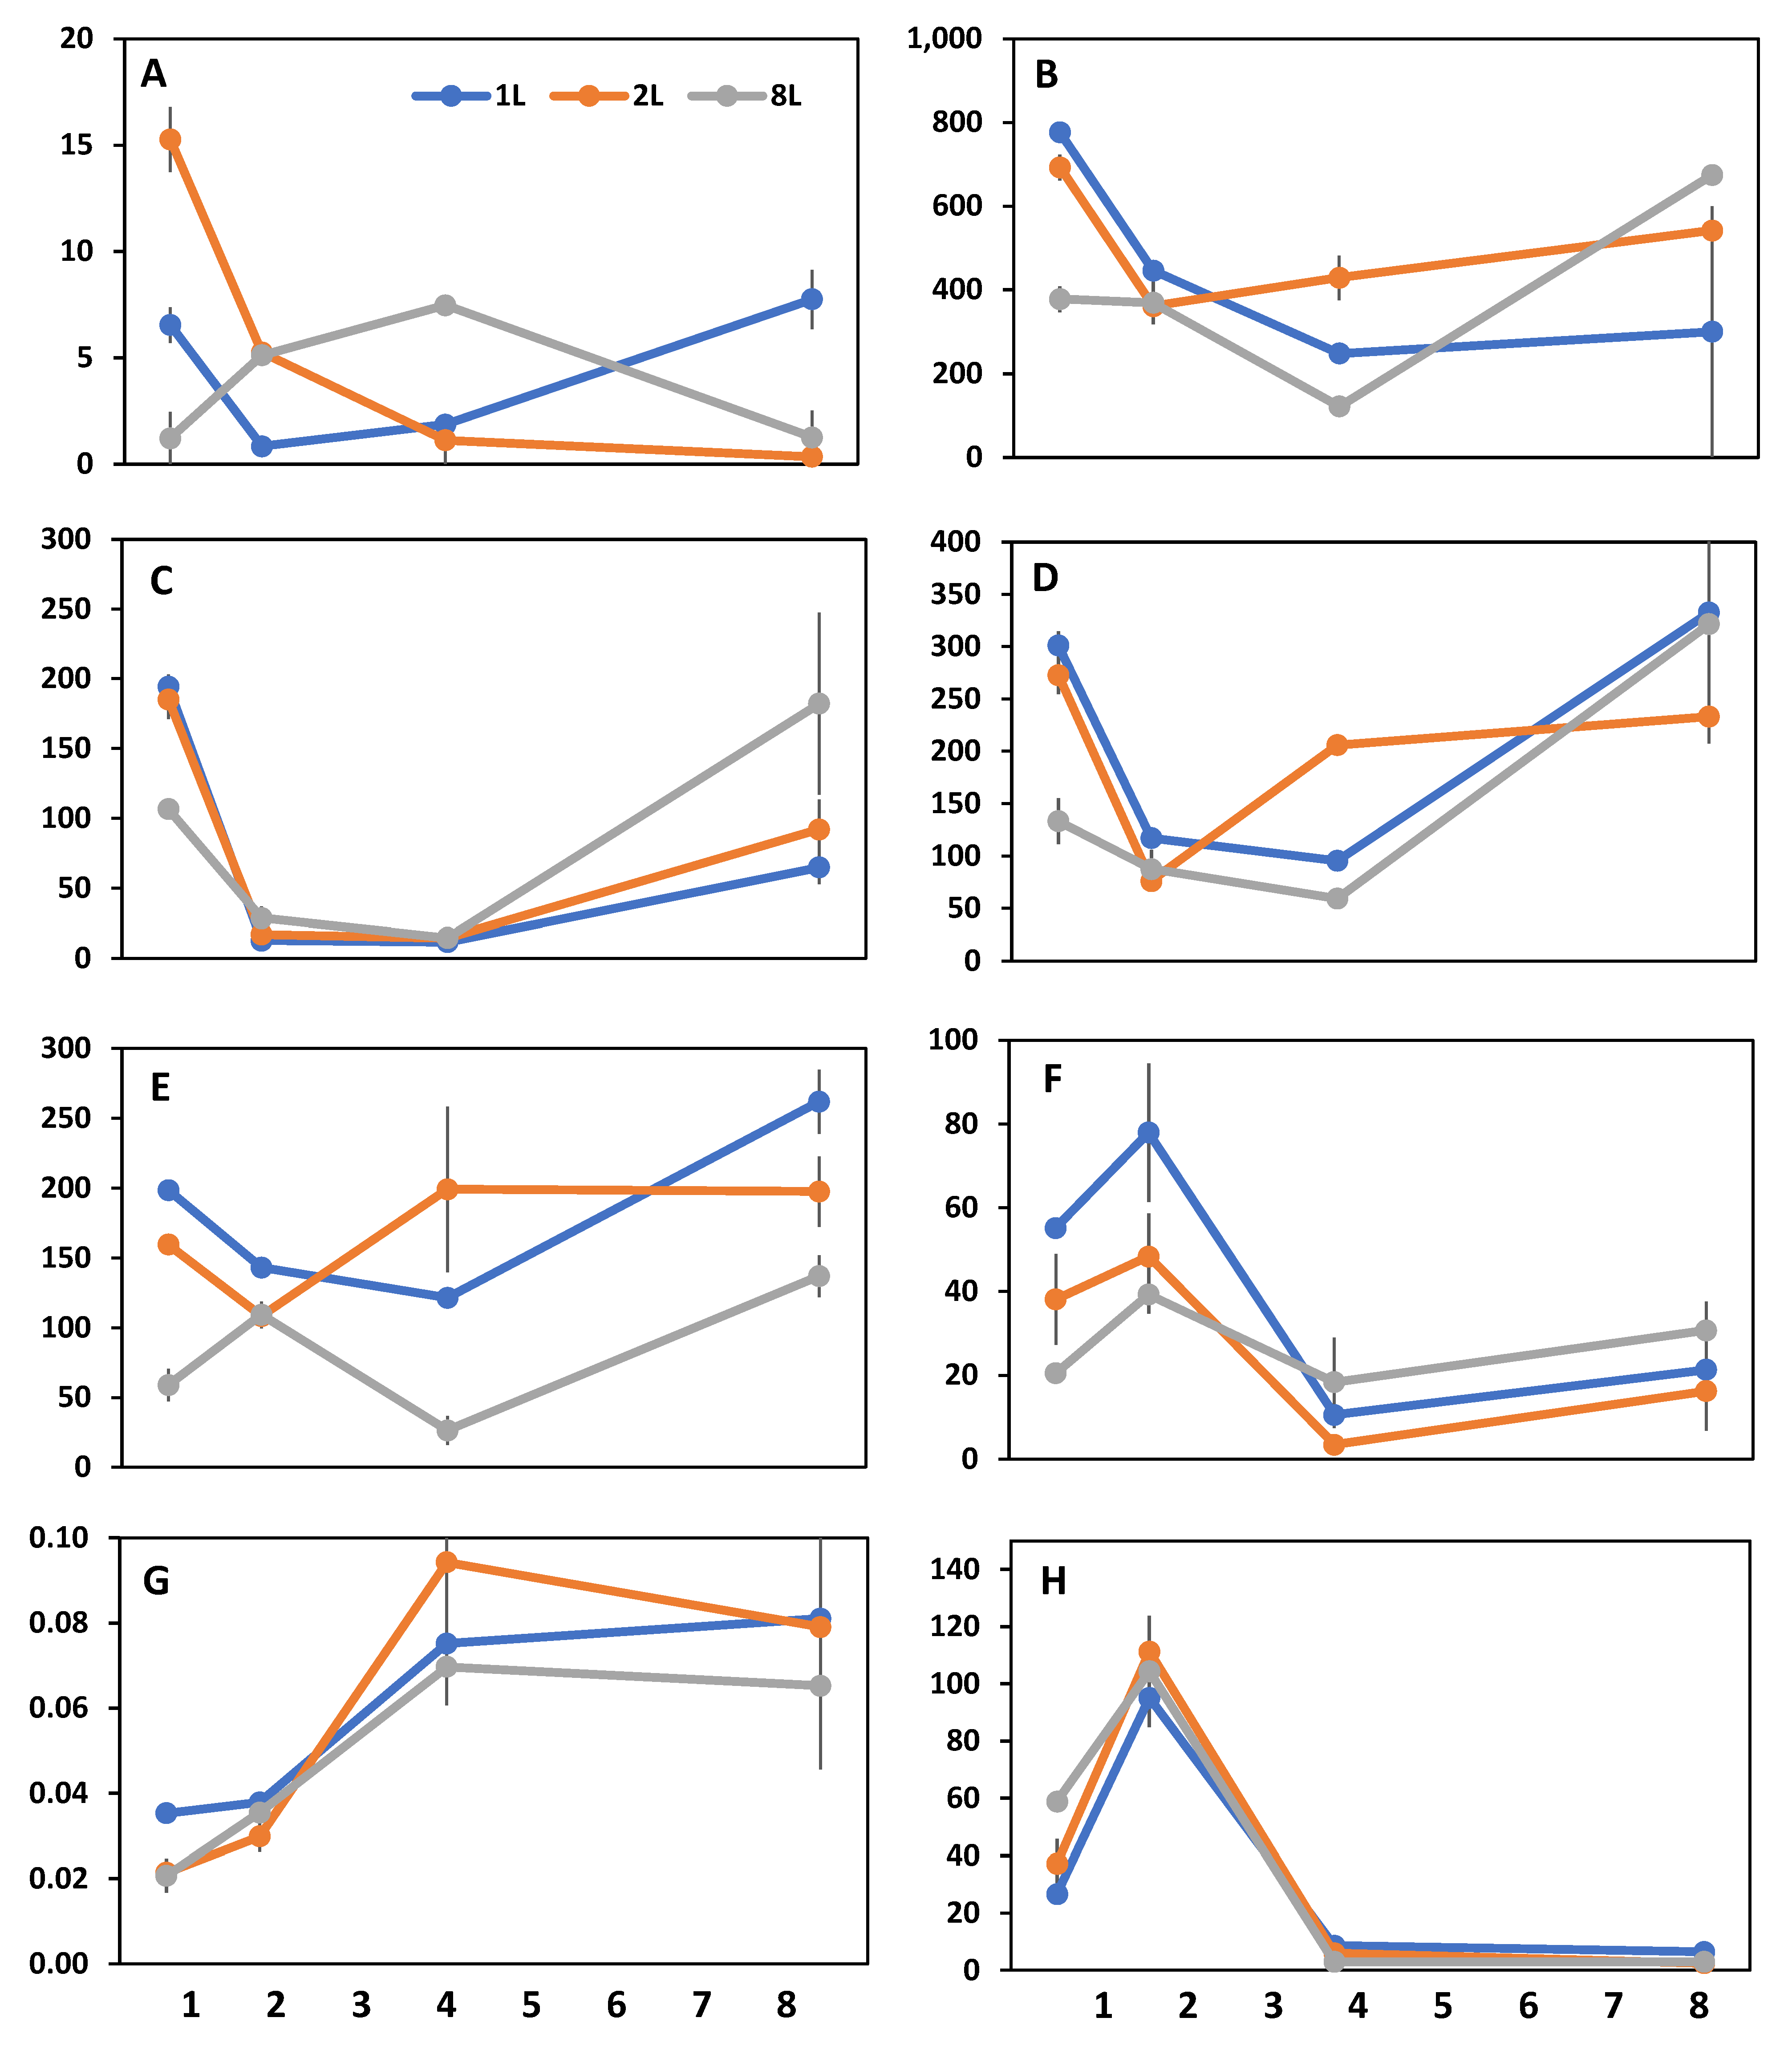
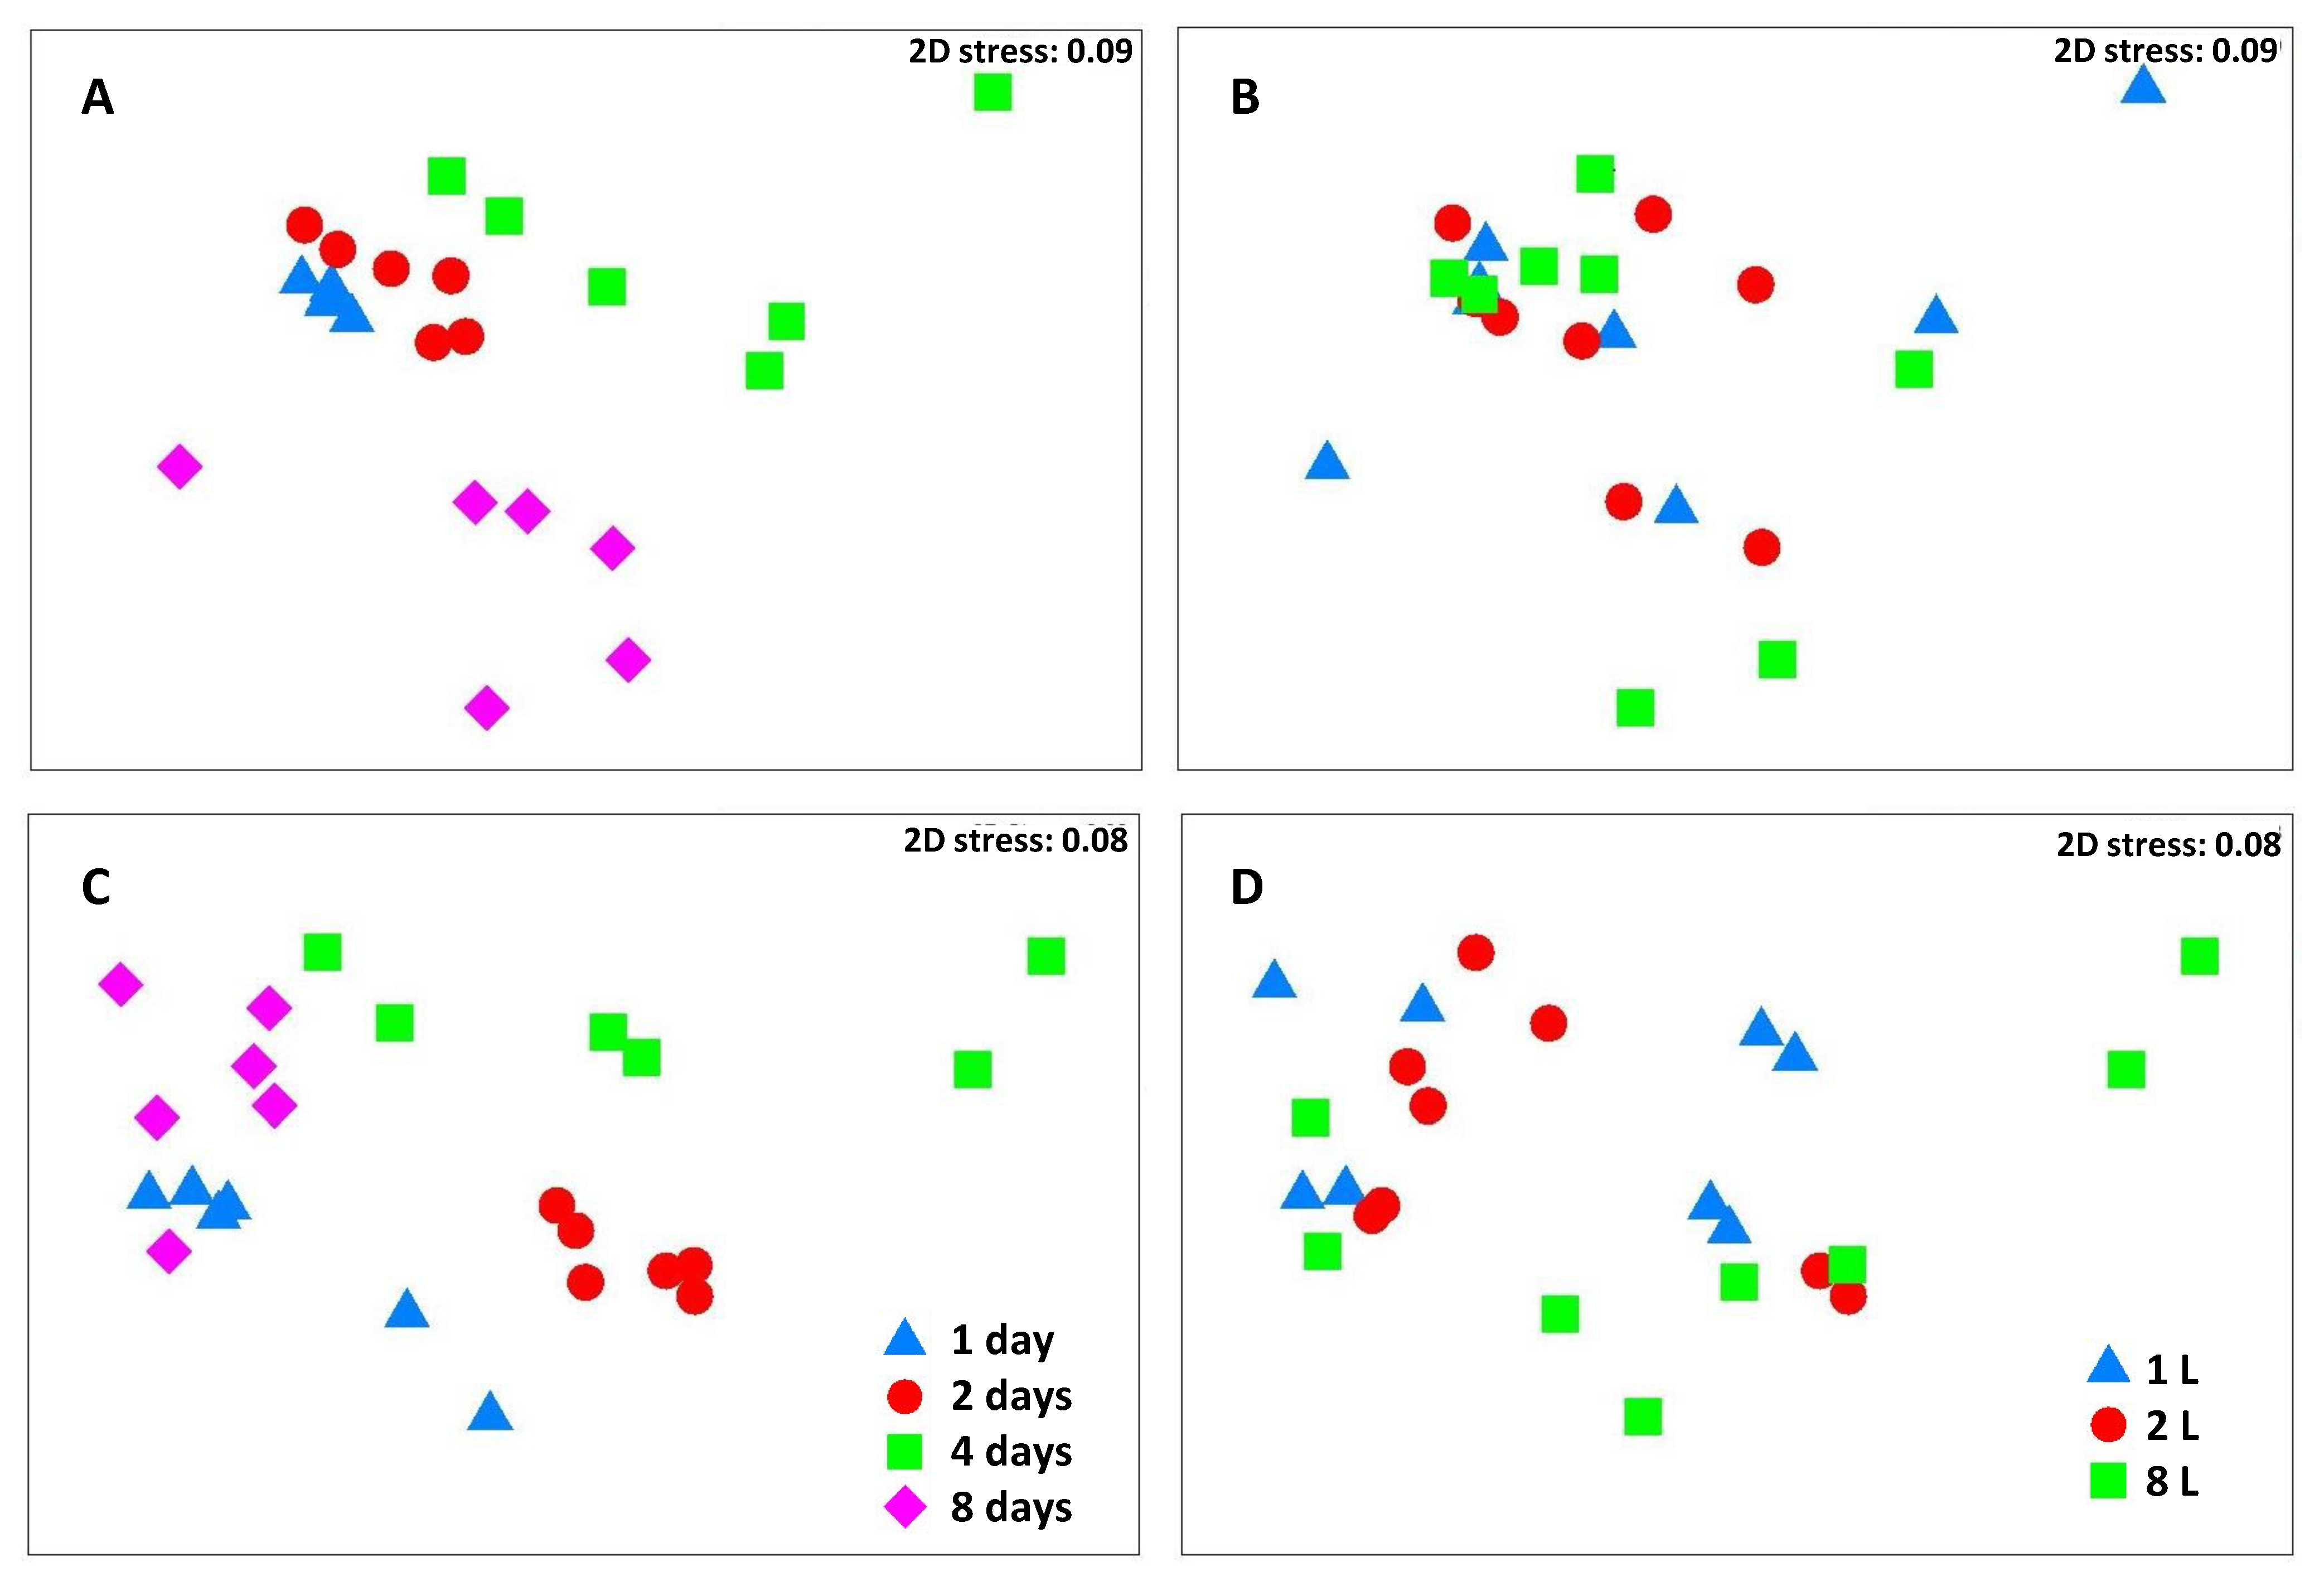
3. Results
4. Discussion
5. Conclusions
Author Contributions
Funding
Data Availability Statement
Conflicts of Interest
References
- Gerhart, D.Z.; Likens, G.E. Enrichment Experiments for Determining Limitation: Four Methods Compared. Limnol. Oceanogr. 1975, 20, 649–653. [Google Scholar] [CrossRef]
- Huston, M.A. Microcosm Experiments Have Limited Relevance for Community and Ecosystem Ecology: Synthesis of Comments. Ecology 1999, 80, 1088–1089. [Google Scholar] [CrossRef]
- Duarte, C.M.; Gasol, J.M.; Vaqué, D. Role of Experimental Approaches in Marine Microbial Ecology. Aquat. Microb. Ecol. 1997, 13, 101–111. [Google Scholar] [CrossRef] [Green Version]
- Venrick, E.L.; Beers, J.R.; Heinbokel, J.F. Possible Consequences of Containing Microplankton for Physiological Rate Measurements. J. Exp. Mar. Biol. Ecol. 1977, 26, 55–76. [Google Scholar] [CrossRef]
- Englund, G.; Cooper, S.D. Scale Effects and Extrapolation in Ecological Experiments. Adv. Ecol. Res. 2003, 33, 161–213. [Google Scholar] [CrossRef]
- Pernthaler, J.; Amann, R. Fate of Heterotrophic Microbes in Pelagic Habitats: Focus on Populations. Microbiol. Mol. Biol. Rev. 2005, 69, 440–461. [Google Scholar] [CrossRef] [Green Version]
- Petersen, J.E.; Cornwell, J.C.; Kemp, W.M. Implicit Scaling in the Design of Experimental Aquatic Ecosystems. Oikos 1999, 85, 3. [Google Scholar] [CrossRef]
- Robinson, C.; Williams, P.J.B. Respiration and Its Measurement in Surface Marine Waters. In Respiration in Aquatic Ecosystems; del Giorgio, P., Williams, P.J.B., Eds.; Oxford University Press: New York, NY, USA, 2005; pp. 147–180. [Google Scholar]
- Carpenter, S.R. Microcosm Experiments Have Limited Relevance for Community and Ecosystem Ecology. Ecology 1996, 77, 677–680. [Google Scholar] [CrossRef]
- de Boeck, H.J.; Vicca, S.; Roy, J.; Nijs, I.; Milcu, A.; Kreyling, J.; Jentsch, A.; Chabbi, A.; Campioli, M.; Callaghan, T.; et al. Global Change Experiments: Challenges and Opportunities. Bioscience 2015, 65, 922–931. [Google Scholar] [CrossRef] [Green Version]
- Bestion, E.; Barton, S.; García, F.C.; Warfield, R.; Yvon-Durocher, G. Abrupt Declines in Marine Phytoplankton Production Driven by Warming and Biodiversity Loss in a Microcosm Experiment. Ecol. Lett. 2020, 23, 457–466. [Google Scholar] [CrossRef]
- Domingues, R.B.; Guerra, C.C.; Barbosa, A.B.; Galvão, H.M. Will Nutrient and Light Limitation Prevent Eutrophication in an Anthropogenically-Impacted Coastal Lagoon? Cont. Shelf. Res. 2017, 141, 11–25. [Google Scholar] [CrossRef]
- Domingues, R.B.; Guerra, C.C.; Galvão, H.M.; Brotas, V.; Barbosa, A.B. Short-Term Interactive Effects of Ultraviolet Radiation, Carbon Dioxide and Nutrient Enrichment on Phytoplankton in a Shallow Coastal Lagoon. Aquat. Ecol. 2017, 51, 91–105. [Google Scholar] [CrossRef]
- Hofmann, P.; Chatzinotas, A.; Harpole, W.S.; Dunker, S. Temperature and Stoichiometric Dependence of Phytoplankton Traits. Ecology 2019, 100, e02875. [Google Scholar] [CrossRef] [PubMed]
- Schulhof, M.A.; Shurin, J.B.; Declerck, S.A.J.; van de Waal, D.B. Phytoplankton Growth and Stoichiometric Responses to Warming, Nutrient Addition and Grazing Depend on Lake Productivity and Cell Size. Glob. Chang. Biol. 2019, 25, 2751–2762. [Google Scholar] [CrossRef] [Green Version]
- Fraser, L.H.; Keddy, P. The Role of Experimental Microcosms in Ecological Research. Trends Ecol. Evol. 1997, 12, 478–481. [Google Scholar] [CrossRef]
- Hammes, F.; Vital, M.; Egli, T. Critical Evaluation of the Volumetric “ Bottle Effect ” on Microbial Batch Growth. Appl. Env. Microbiol. 2010, 76, 1278–1281. [Google Scholar] [CrossRef] [Green Version]
- Nogueira, P.; Domingues, R.B.; Barbosa, A.B. Are Microcosm Volume and Sample Pre-Filtration Relevant to Evaluate Phytoplankton Growth? J. Exp. Mar. Biol. Ecol. 2014, 461, 323–330. [Google Scholar] [CrossRef]
- Spivak, A.C.; Vanni, M.J.; Mette, E.M. Moving on up: Can Results from Simple Aquatic Mesocosm Experiments Be Applied across Broad Spatial Scales? Freshw. Biol. 2011, 56, 279–291. [Google Scholar] [CrossRef]
- Weisse, T.; Lukić, D.; Lu, X. Container Volume May Affect Growth Rates of Ciliates and Clearance Rates of Their Microcrustacean Predators in Microcosm Experiments. J. Plankton Res. 2021, 43, 288–299. [Google Scholar] [CrossRef]
- Haanes, H.; Hansen, E.L.; Hevrøy, T.H.; Jensen, L.K.; Gjelsvik, R.; Jaworska, A.; Bradshaw, C. Realism and Usefulness of Multispecies Experiment Designs with Regard to Application in Radioecology: A Review. Sci. Total Environ. 2020, 718, 134485. [Google Scholar] [CrossRef]
- Parsons, T.R.; Maita, Y.; Lalli, C.M. A Manual of Chemical and Biological Methods for Seawater Analysis; Pergamon Press: Oxford, UK, 1984. [Google Scholar]
- Haas, L.W. Improved Epifluorescence Microscopy for Observing Planktonic Micro-Organisms. Ann. L’institut Oceanogr. 1982, 58, 261–266. [Google Scholar]
- Utermöhl, H. Zur Vervollkommnung Der Quantitativen Phytoplankton-Methodik. Mitt. Int. Ver. Theor. Und Angew. Limnol. 1958, 9, 1–38. [Google Scholar] [CrossRef]
- Venrick, E.L. How Many Cells to Count? In Phytoplankton Manual; Sournia, A., Ed.; UNESCO: Paris, France, 1978; pp. 167–180. [Google Scholar]
- Dytham, C. Choosing and Using Statistics: A Biologist’s Guide, 2nd ed.; Blackwell Publishing: Hoboken, NJ, USA, 2003. [Google Scholar]
- Albers, C.; Lakens, D. When Power Analyses Based on Pilot Data Are Biased: Inaccurate Effect Size Estimators and Follow-up Bias. J. Exp. Soc. Psychol. 2018, 74, 187–195. [Google Scholar] [CrossRef] [Green Version]
- Olejnik, S.; Algina, J. Generalized Eta and Omega Squared Statistics: Measures of Effect Size for Some Common Research Designs. Psychol. Methods 2003, 8, 434–447. [Google Scholar] [CrossRef] [PubMed] [Green Version]
- Teixeira, I.G.; Arbones, B.; Froján, M.; Nieto-Cid, M.; Álvarez-Salgado, X.A.; Castro, C.G.; Fernández, E.; Sobrino, C.; Teira, E.; Figueiras, F.G. Response of Phytoplankton to Enhanced Atmospheric and Riverine Nutrient Inputs in a Coastal Upwelling Embayment. Estuar. Coast. Shelf. Sci. 2018, 210, 132–141. [Google Scholar] [CrossRef]
- Cira, E.K.; Paerla, H.W.; Wetza, M.S. Effects of Nitrogen Availability and Form on Phytoplankton Growth in a Eutrophied Estuary (Neuse River Estuary, NC, USA). PLoS ONE 2016, 11, e0160663. [Google Scholar] [CrossRef] [Green Version]
- Groß, E.; di Pane, J.; Boersma, M.; Meunier, C.L. River Discharge-Related Nutrient Effects on North Sea Coastal and Offshore Phytoplankton Communities. J. Plankton Res. 2022, 44, 947–960. [Google Scholar] [CrossRef]
- Nwankwegu, A.S.; Li, Y.; Huang, Y.; Wei, J.; Norgbey, E.; Lai, Q.; Sarpong, L.; Wang, K.; Ji, D.; Yang, Z.; et al. Nutrient Addition Bioassay and Phytoplankton Community Structure Monitored during Autumn in Xiangxi Bay of Three Gorges Reservoir, China. Chemosphere 2020, 247, 125960. [Google Scholar] [CrossRef]
- Rollwagen-Bollens, G.; Connelly, K.A.; Bollens, S.M.; Zimmerman, J.; Coker, A. Nutrient Control of Phytoplankton Abundance and Biomass, and Microplankton Assemblage Structure in the Lower Columbia River (Vancouver, Washington, USA). Water 2022, 14, 1599. [Google Scholar] [CrossRef]
- Jacquemin, C.; Bertrand, C.; Oursel, B.; Thorel, M.; Franquet, E.; Cavalli, L. Growth Rate of Alpine Phytoplankton Assemblages from Contrasting Watersheds and N-Deposition Regimes Exposed to Nitrogen and Phosphorus Enrichments. Freshw. Biol. 2018, 63, 1326–1339. [Google Scholar] [CrossRef]
- Giraud, M.; Boye, M.; Garçon, V.; Donval, A.; de la Broise, D. Simulation of an Artificial Upwelling Using Immersed in Situ Phytoplankton Microcosms. J. Exp. Mar. Biol. Ecol. 2016, 475, 80–88. [Google Scholar] [CrossRef]
- Fogg, G.E.; Calvario-Martinez, O. Effects of Bottle Size in Determinations of Primary Productivity by Phytoplankton. Hydrobiologia 1989, 173, 89–94. [Google Scholar] [CrossRef]
- Domingues, R.B.; Barbosa, A.B.; Sommer, U.; Galvão, H.M. Ammonium, Nitrate and Phytoplankton Interactions in a Freshwater Tidal Estuarine Zone: Potential Effects of Cultural Eutrophication. Aquat. Sci. 2011, 73, 331–343. [Google Scholar] [CrossRef]
- Domingues, R.B.; Anselmo, T.P.; Barbosa, A.B.; Sommer, U.; Galvão, H.M. Nutrient Limitation of Phytoplankton Growth in the Freshwater Tidal Zone of a Turbid, Mediterranean Estuary. Estuar. Coast. Shelf. Sci. 2011, 91, 282–297. [Google Scholar] [CrossRef]
- McQuatters-Gollop, A.; Johns, D.G.; Bresnan, E.; Skinner, J.; Rombouts, I.; Stern, R.; Aubert, A.; Johansen, M.; Bedford, J.; Knights, A. From Microscope to Management: The Critical Value of Plankton Taxonomy to Marine Policy and Biodiversity Conservation. Mar. Policy 2017, 83, 1–10. [Google Scholar] [CrossRef]
- Domingues, R.B.; Barbosa, A.; Galvão, H. Constraints on the Use of Phytoplankton as a Biological Quality Element within the Water Framework Directive in Portuguese Waters. Mar. Pollut. Bull. 2008, 56, 1389–1395. [Google Scholar] [CrossRef]
- Arnott, R.N.; Cherif, M.; Bryant, L.D.; Wain, D.J. Artificially Generated Turbulence: A Review of Phycological Nanocosm, Microcosm, and Mesocosm Experiments. Hydrobiologia 2021, 848, 961–991. [Google Scholar] [CrossRef]
- Yu, L.; Li, Y.; Yao, Z.; You, L.; Jiang, Z.-P.; Fan, W.; Pan, Y. Characterization of Fine-Scale Turbulence Generated in a Laboratory Orbital Shaker and Its Influence on Skeletonema Costatum. J. Mar. Sci. Eng. 2022, 10, 1053. [Google Scholar] [CrossRef]
- Orefice, I.; Musella, M.; Smerilli, A.; Sansone, C.; Chandrasekaran, R.; Corato, F.; Brunet, C. Role of Nutrient Concentrations and Water Movement on Diatom’s Productivity in Culture. Sci. Rep. 2019, 9, 1479. [Google Scholar] [CrossRef] [Green Version]
- Waterhouse, A.F.; MacKinnon, J.A.; Nash, J.D.; Alford, M.H.; Kunze, E.; Simmons, H.L.; Polzin, K.L.; Laurent, L.C.; Sun, O.M.; Pinkel, R.; et al. Global Patterns of Diapycnal Mixing from Measurements of the Turbulent Dissipation Rate. J. Phys. Oceanogr. 2014, 44, 1854–1872. [Google Scholar] [CrossRef]
- Båmstedt, U.; Larsson, H. An Indoor Pelagic Mesocosm Facility to Simulate Multiple Water-Column Characteristics. Int. Aquat. Res. 2018, 10, 13–29. [Google Scholar] [CrossRef]


| V | T | VxT | ||||
|---|---|---|---|---|---|---|
| p | ωG2 | p | ωG2 | p | ωG2 | |
| Chlorophyll a | 0.002 | 0.01 | <0.001 | 0.92 | 0.025 | 0.00 |
| 0.788 | −0.02 | <0.001 | 0.76 | 0.435 | 0.00 | |
| Total phytoplankton | 0.562 | 0.00 | <0.001 | 0.99 | 0.385 | 0.00 |
| 0.235 | 0.04 | 0.675 | −0.04 | 0.072 | 0.29 | |
| Cyanobacteria | 0.860 | −0.03 | 0.001 | 0.64 | 0.742 | −0.05 |
| 0.390 | 0.00 | <0.001 | 0.87 | <0.001 | 0.10 | |
| Eukaryotic picophytoplankton | 0.905 | −0.01 | <0.001 | 0.84 | 0.368 | 0.01 |
| <0.001 | 0.17 | <0.001 | 0.45 | <0.001 | 0.28 | |
| Autotrophic nanoflagellates | 0.269 | 0.00 | <0.001 | 0.92 | 0.778 | −0.01 |
| <0.001 | 0.35 | <0.001 | 0.22 | <0.001 | 0.35 | |
| Cryptophytes | 0.029 | 0.00 | <0.001 | 0.99 | 0.045 | 0.00 |
| 0.007 | 0.08 | <0.001 | 0.61 | 0.006 | 0.17 | |
| Dinoflagellates | 0.026 | 0.09 | <0.001 | 0.52 | 0.046 | 0.13 |
| 0.012 | 0.14 | 0.004 | 0.26 | 0.008 | 0.32 | |
| Diatoms | 0.014 | 0.02 | <0.001 | 0.86 | 0.002 | 0.07 |
| 0.157 | 0.00 | <0.001 | 0.98 | 0.001 | 0.01 | |
Disclaimer/Publisher’s Note: The statements, opinions and data contained in all publications are solely those of the individual author(s) and contributor(s) and not of MDPI and/or the editor(s). MDPI and/or the editor(s) disclaim responsibility for any injury to people or property resulting from any ideas, methods, instructions or products referred to in the content. |
© 2023 by the authors. Licensee MDPI, Basel, Switzerland. This article is an open access article distributed under the terms and conditions of the Creative Commons Attribution (CC BY) license (https://creativecommons.org/licenses/by/4.0/).
Share and Cite
Domingues, R.B.; Mosley, B.A.; Nogueira, P.; Maia, I.B.; Barbosa, A.B. Duration, but Not Bottle Volume, Affects Phytoplankton Community Structure and Growth Rates in Microcosm Experiments. Water 2023, 15, 372. https://doi.org/10.3390/w15020372
Domingues RB, Mosley BA, Nogueira P, Maia IB, Barbosa AB. Duration, but Not Bottle Volume, Affects Phytoplankton Community Structure and Growth Rates in Microcosm Experiments. Water. 2023; 15(2):372. https://doi.org/10.3390/w15020372
Chicago/Turabian StyleDomingues, Rita B., Benjamin A. Mosley, Patrícia Nogueira, Inês B. Maia, and Ana B. Barbosa. 2023. "Duration, but Not Bottle Volume, Affects Phytoplankton Community Structure and Growth Rates in Microcosm Experiments" Water 15, no. 2: 372. https://doi.org/10.3390/w15020372