
Study on the Water Level–Discharge Relationship Changes in Dongting Lake Outlet Section over 70 Years and the Impact of Yangtze River Backwater Effect

Abstract
:1. Introduction
2. Materials and Methods
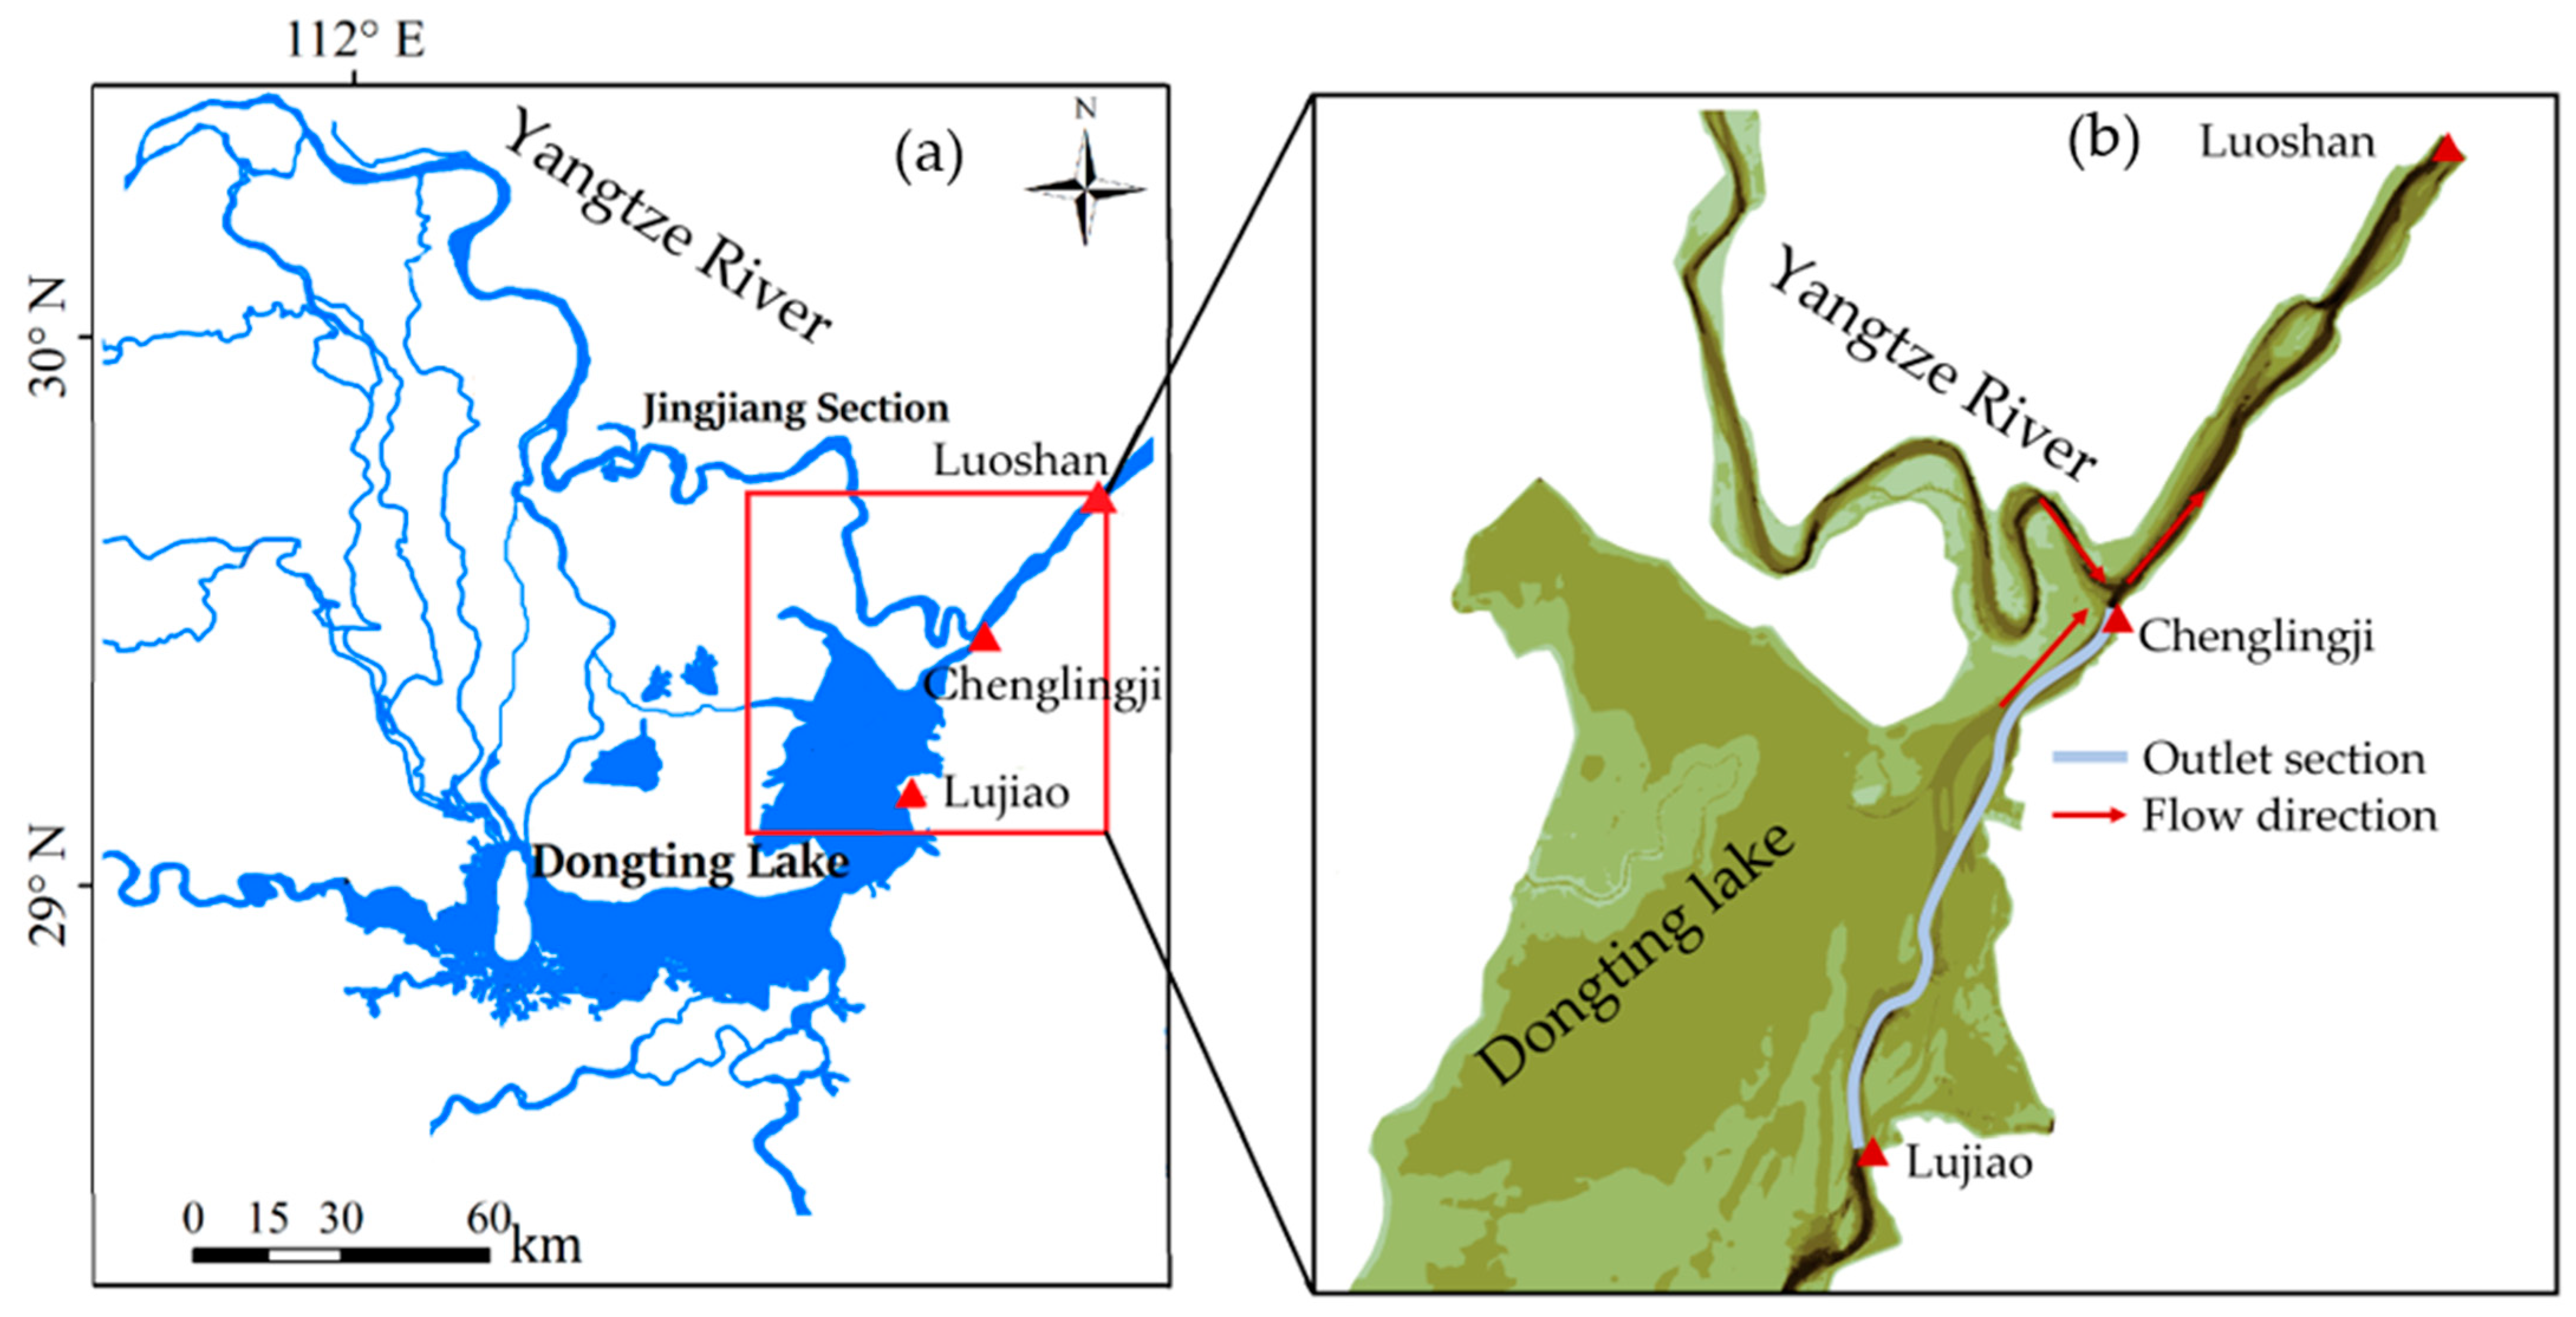
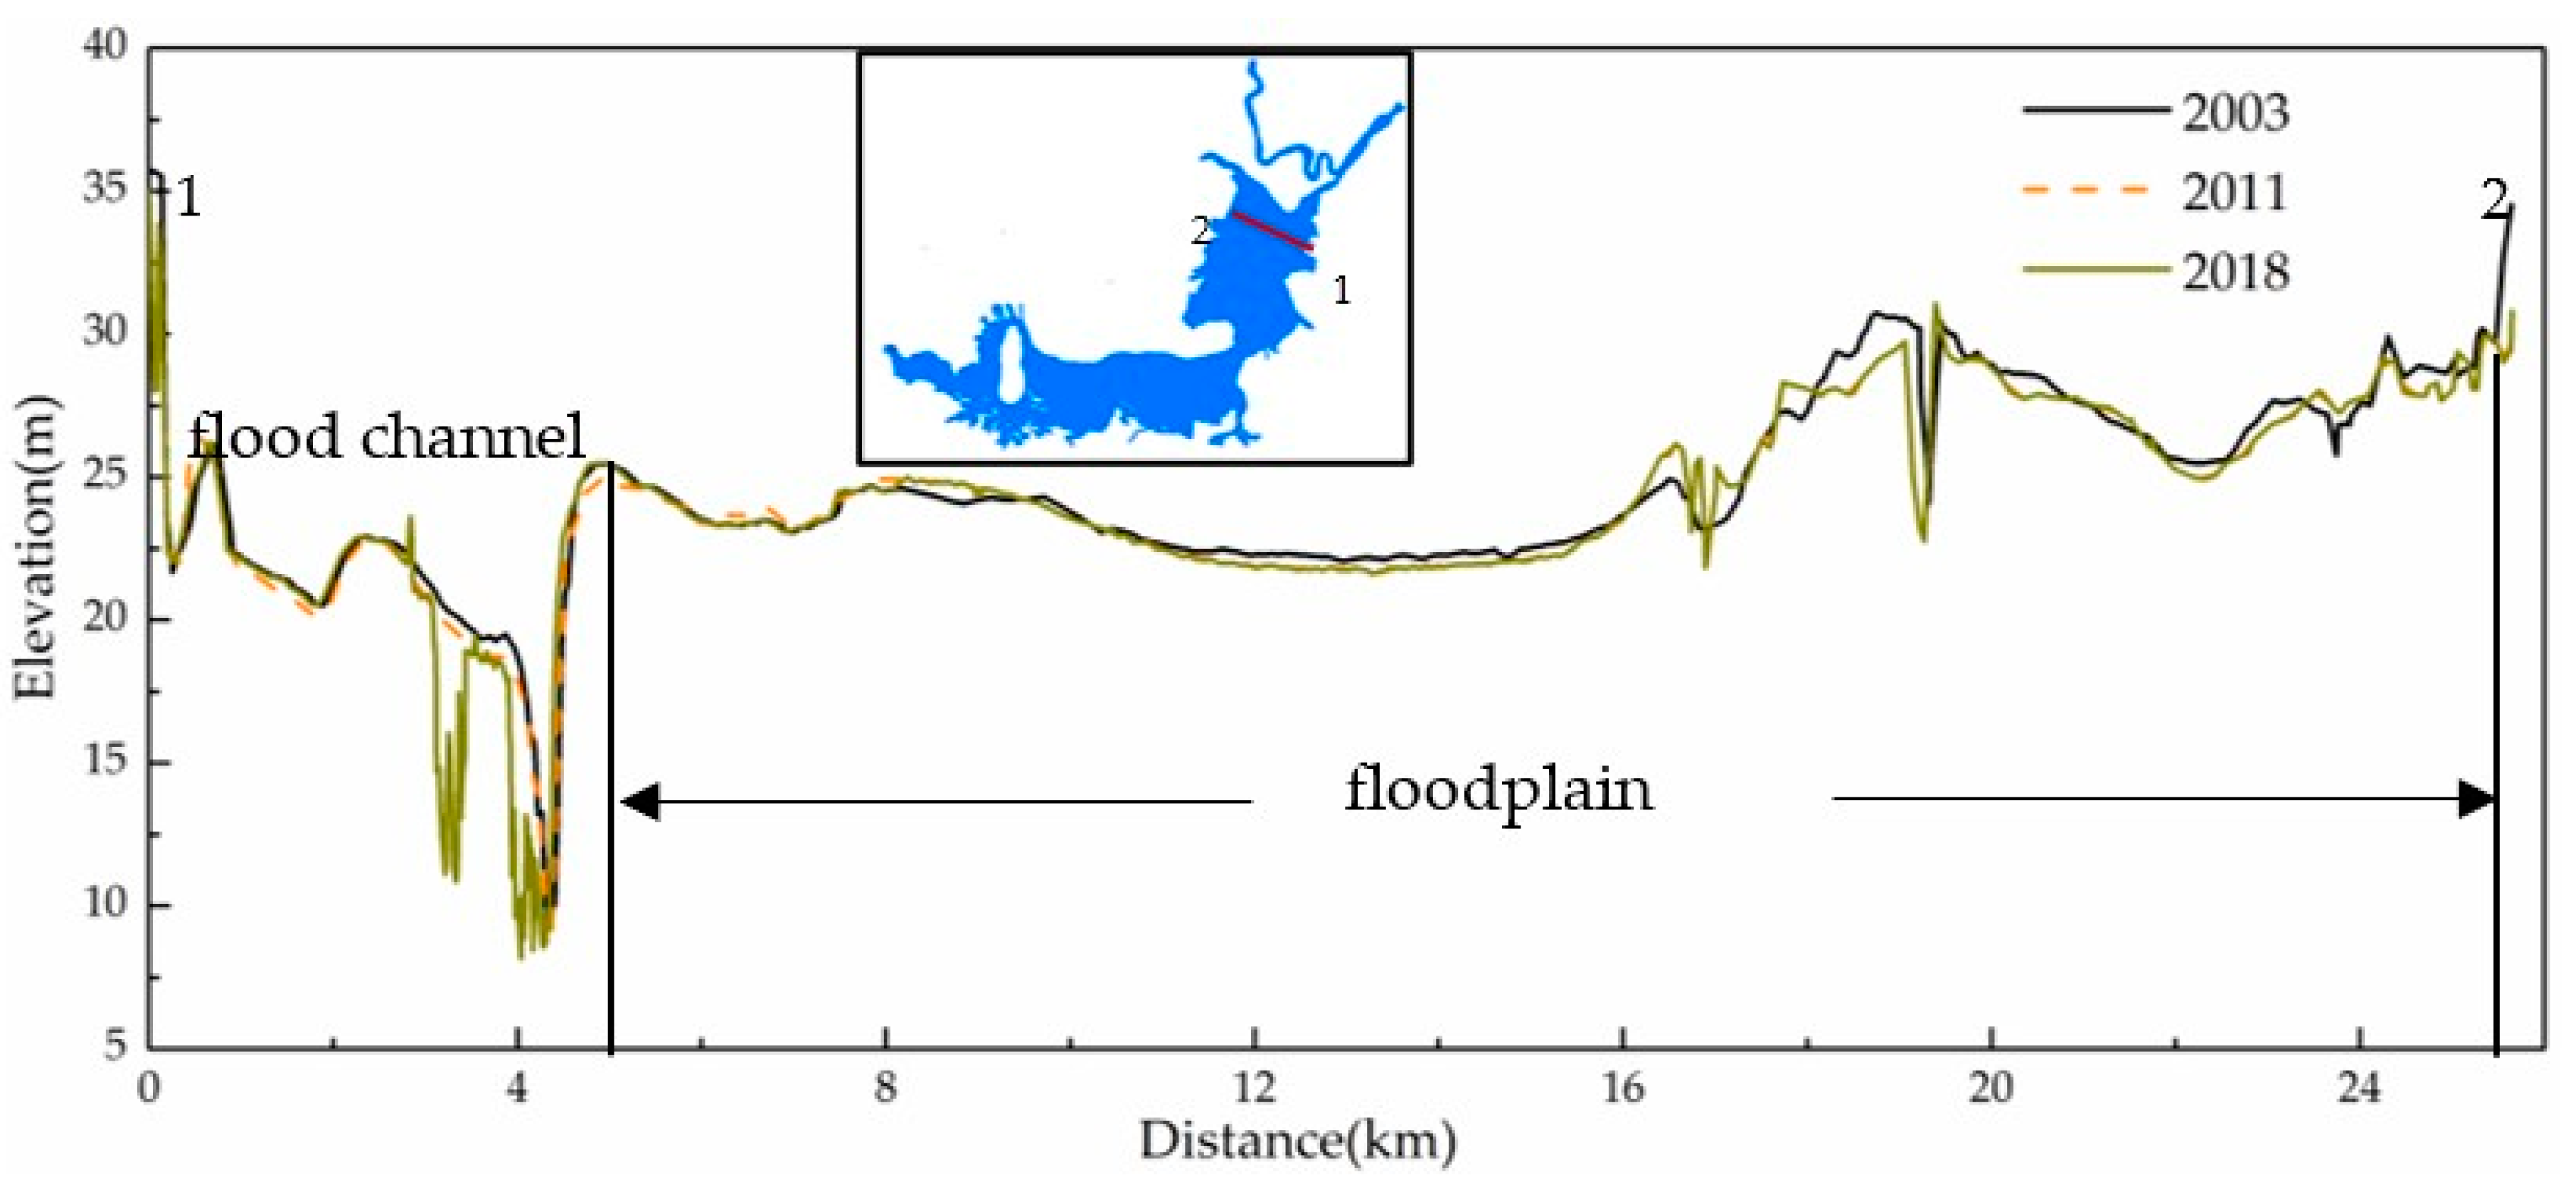
2.1. Study Area
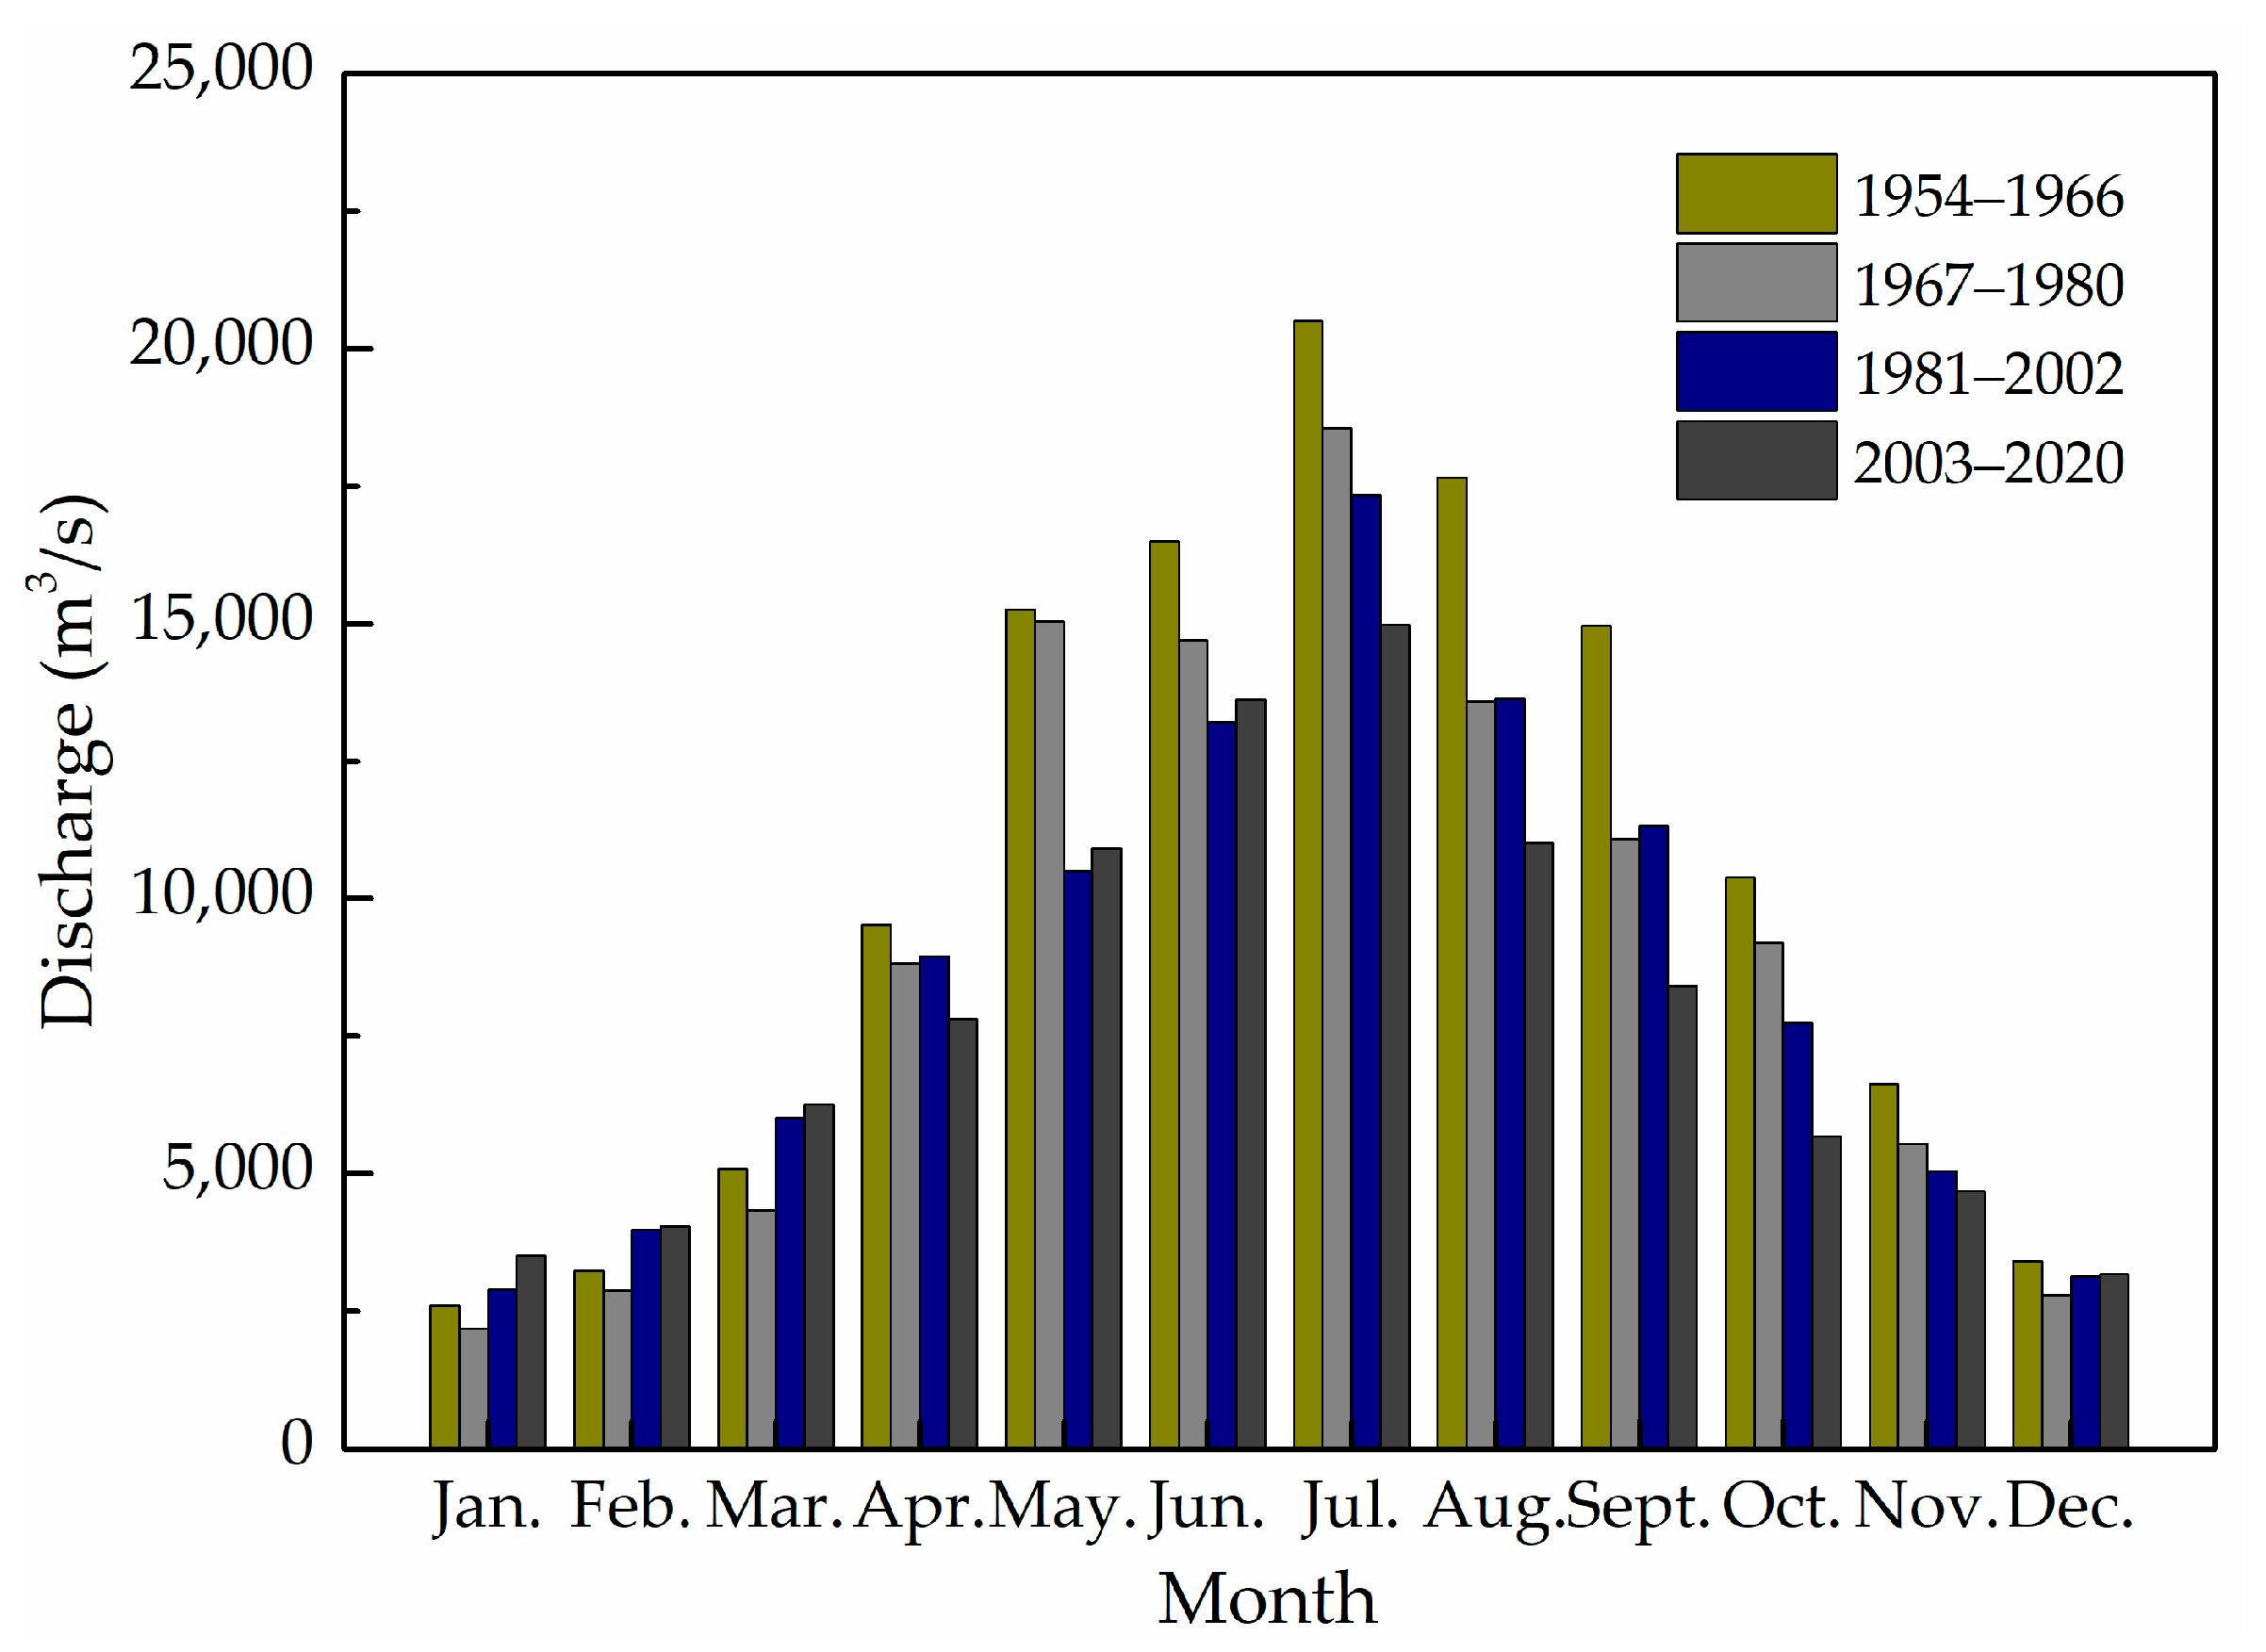
2.2. Data Sources
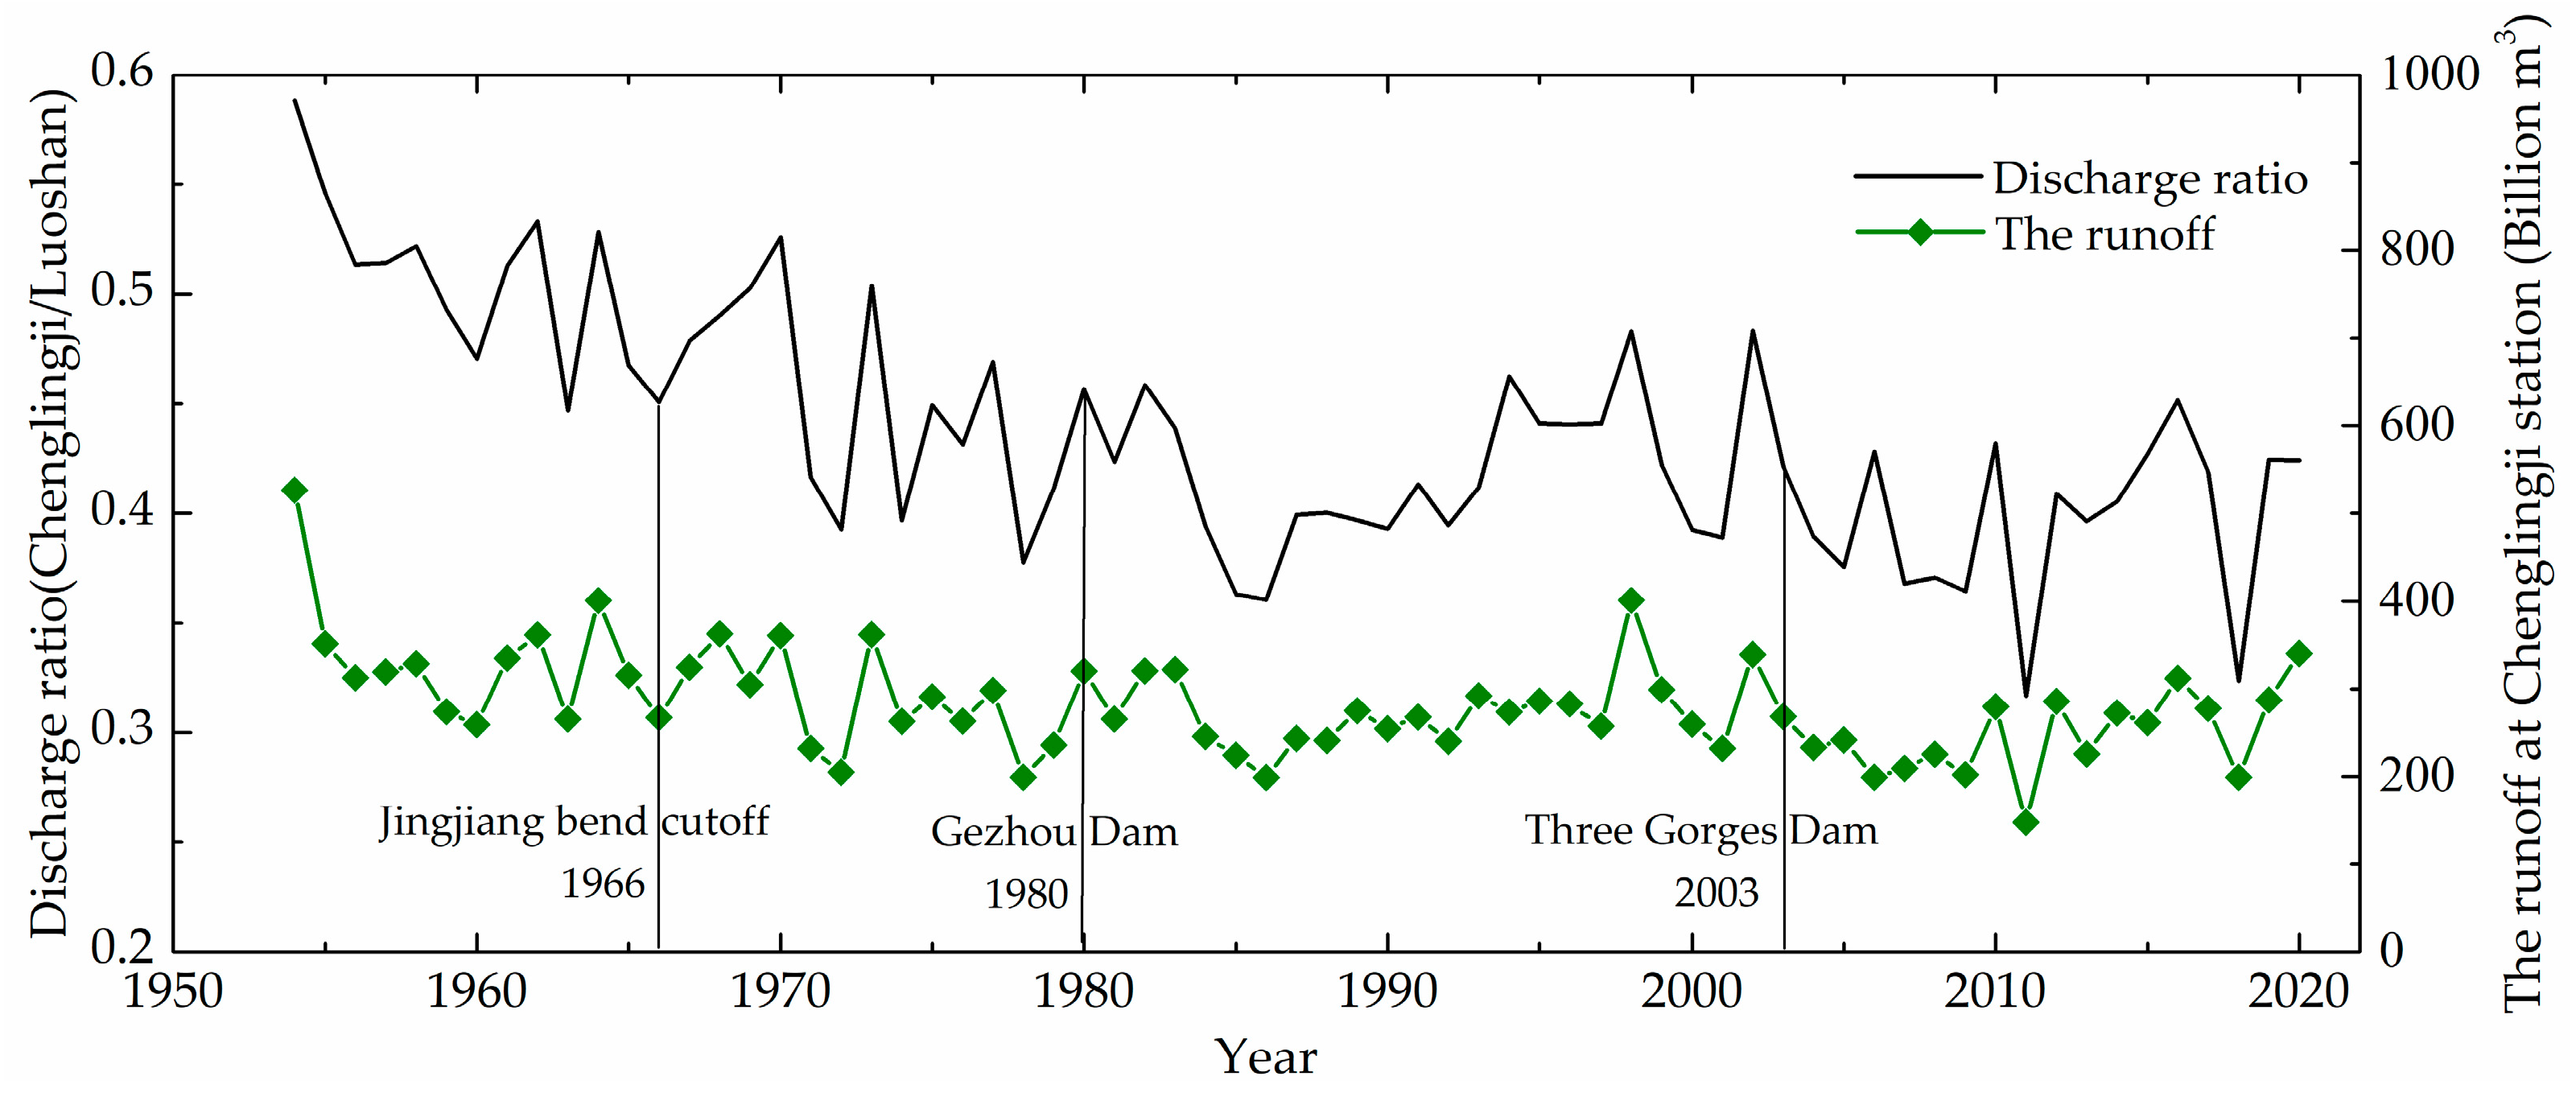
2.3. Variation of Water Level and Discharge Relationship at Chenglingji Station
3. Results
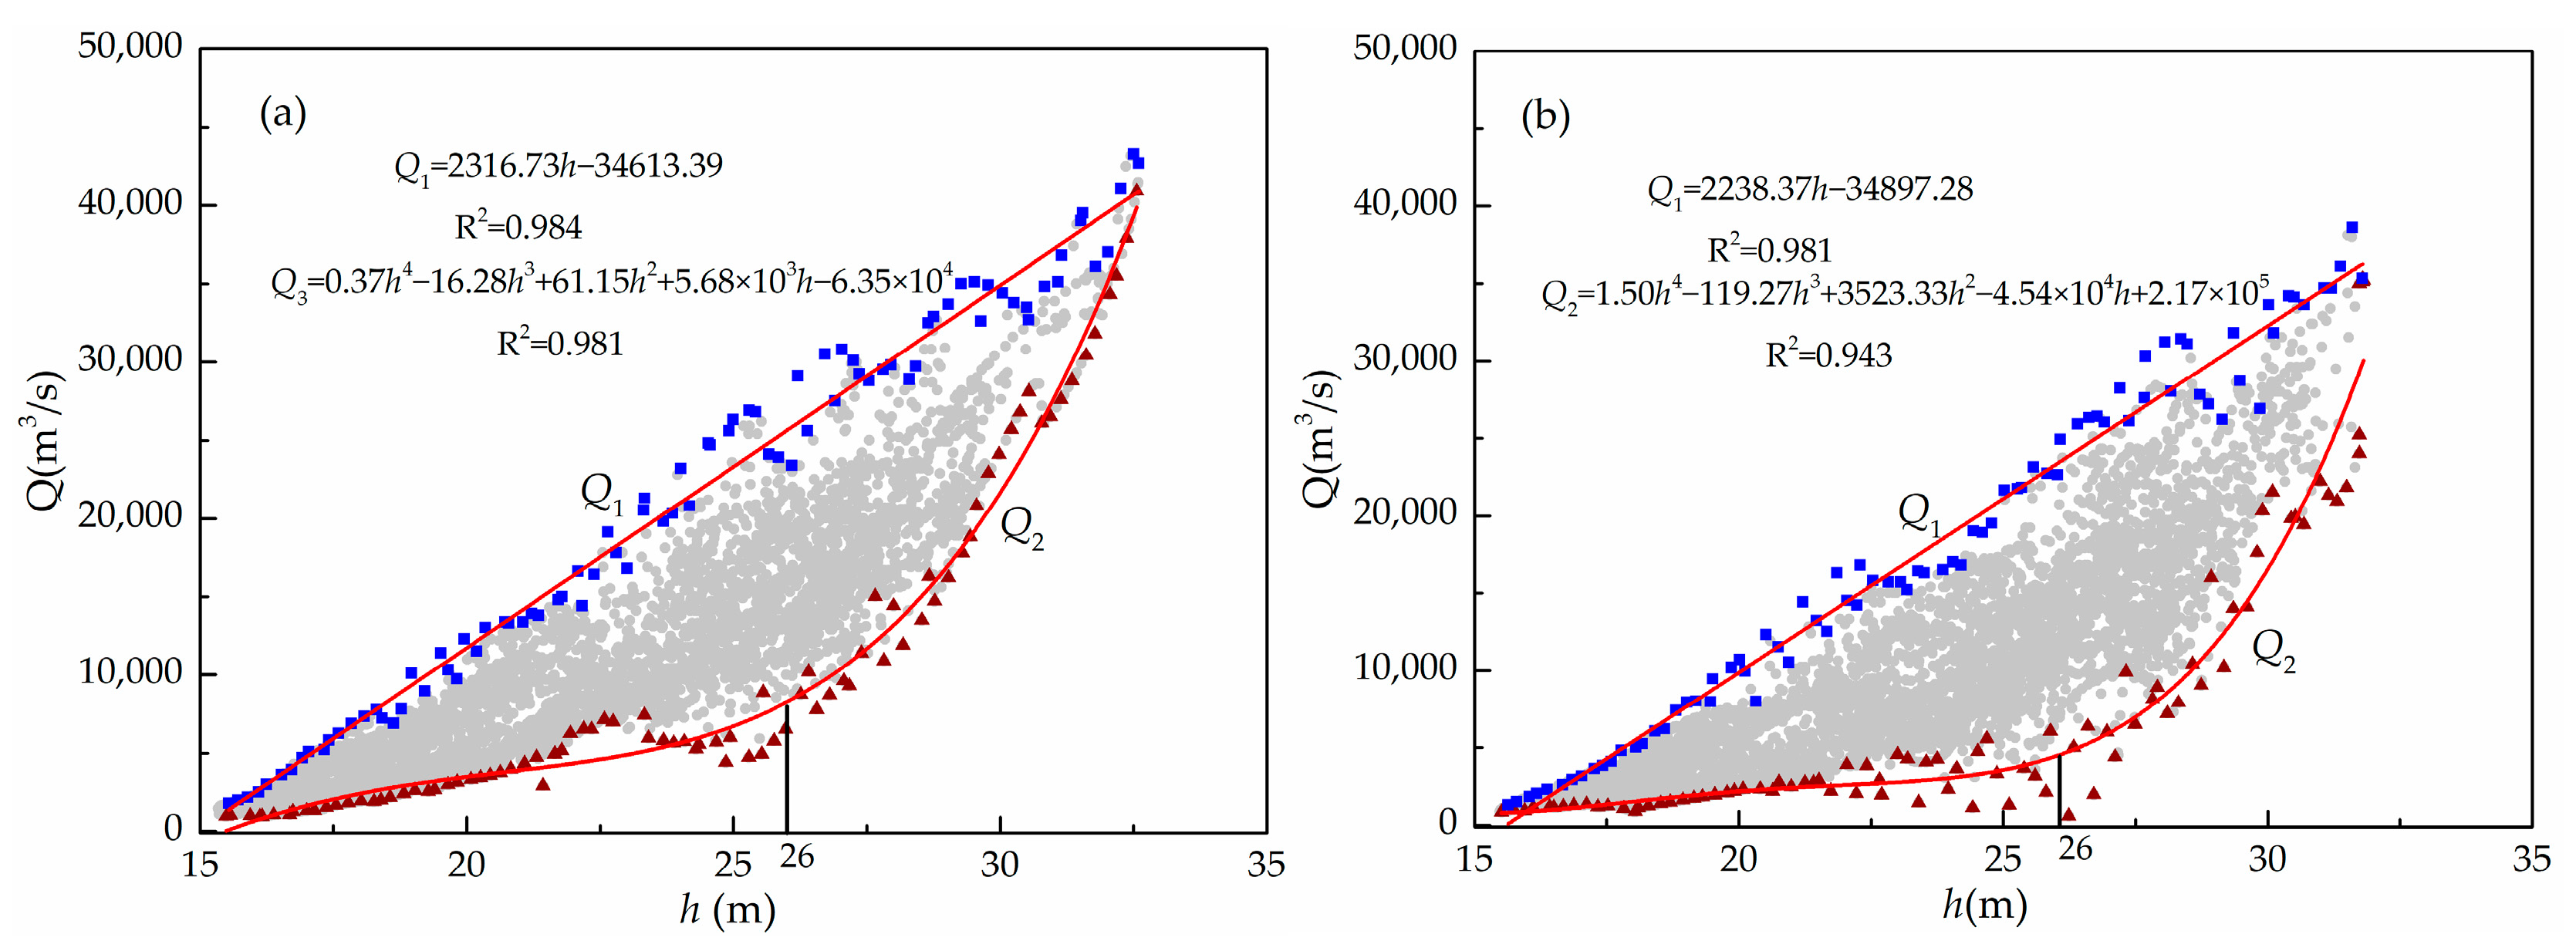
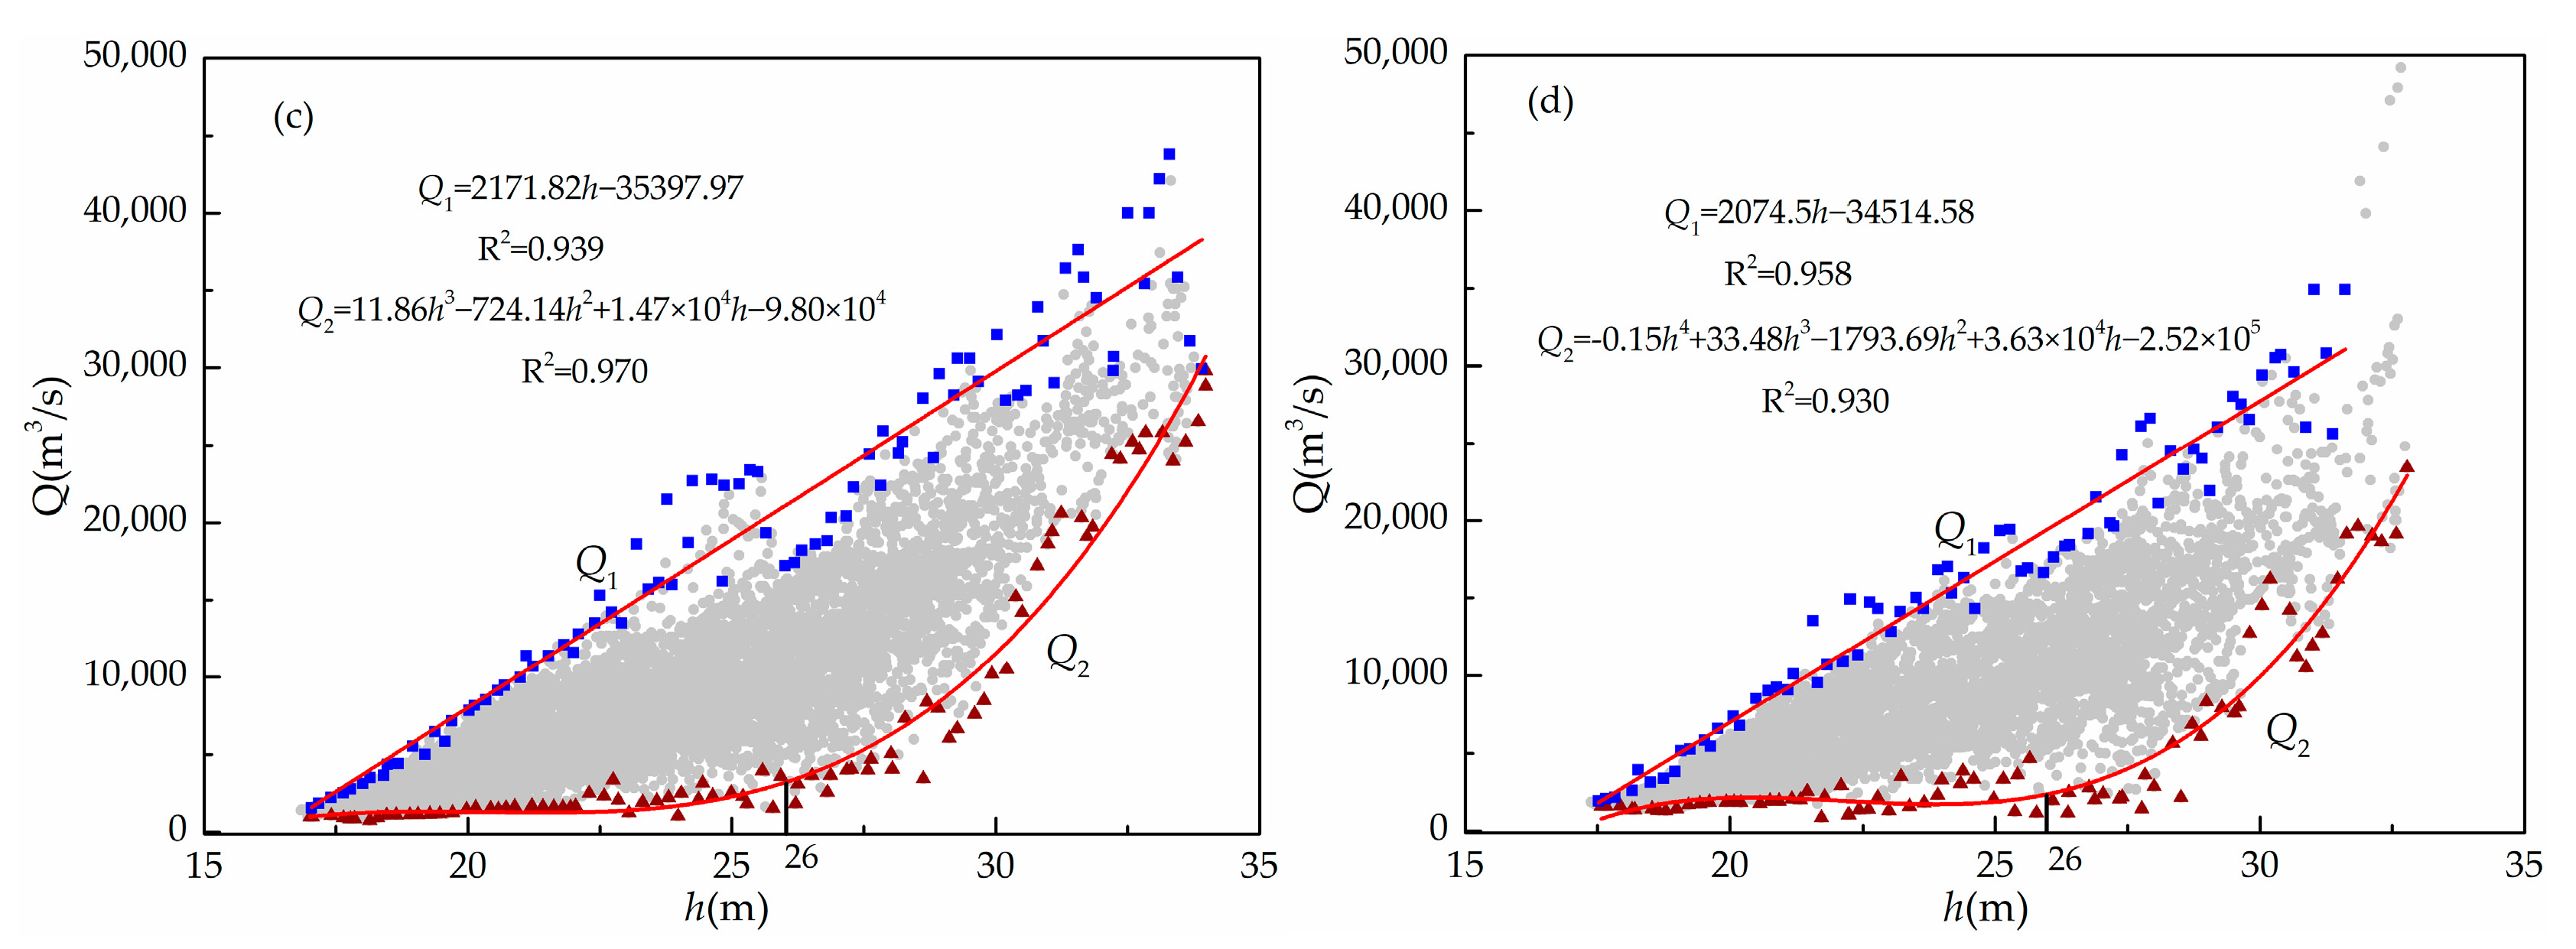
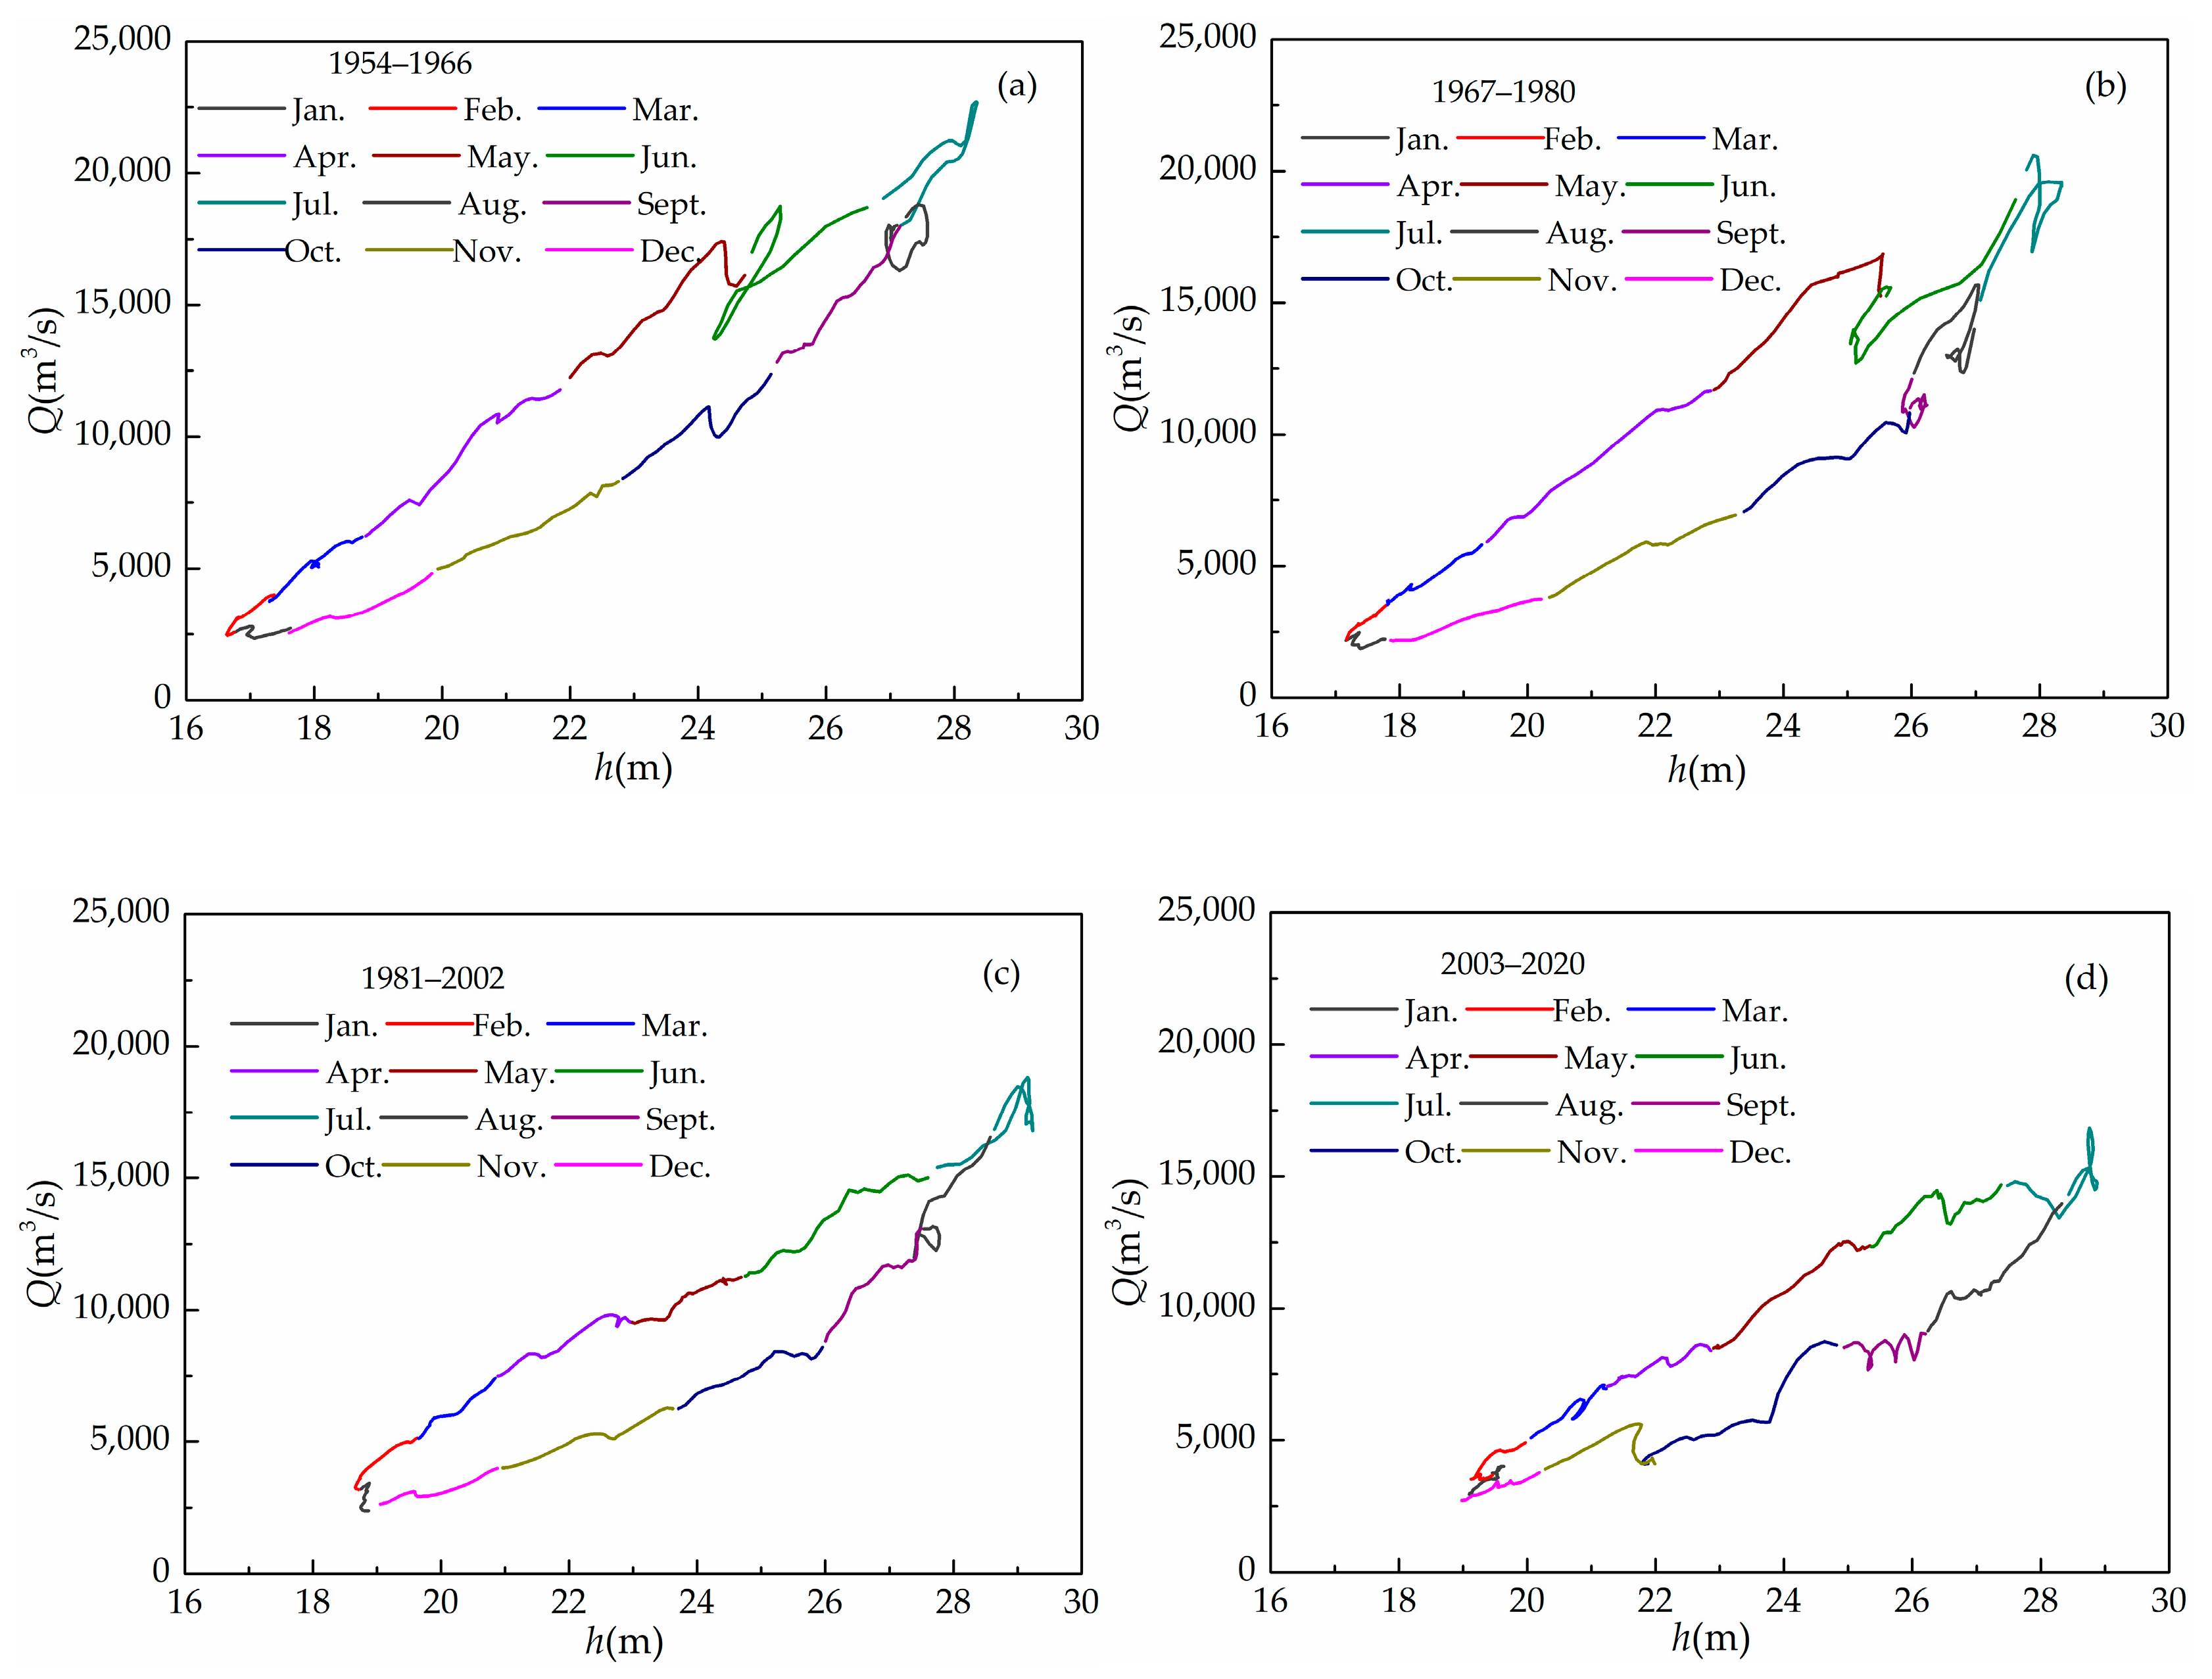
3.1. The Envelope Curve of the Relationship between Water Level and Discharge
3.2. The Lowest Water Level Corresponding to the Same Discharge
3.3. The Water Level Variation Range with the Same Discharge
3.4. The Relationship between the Daily Average Water Level and Discharge
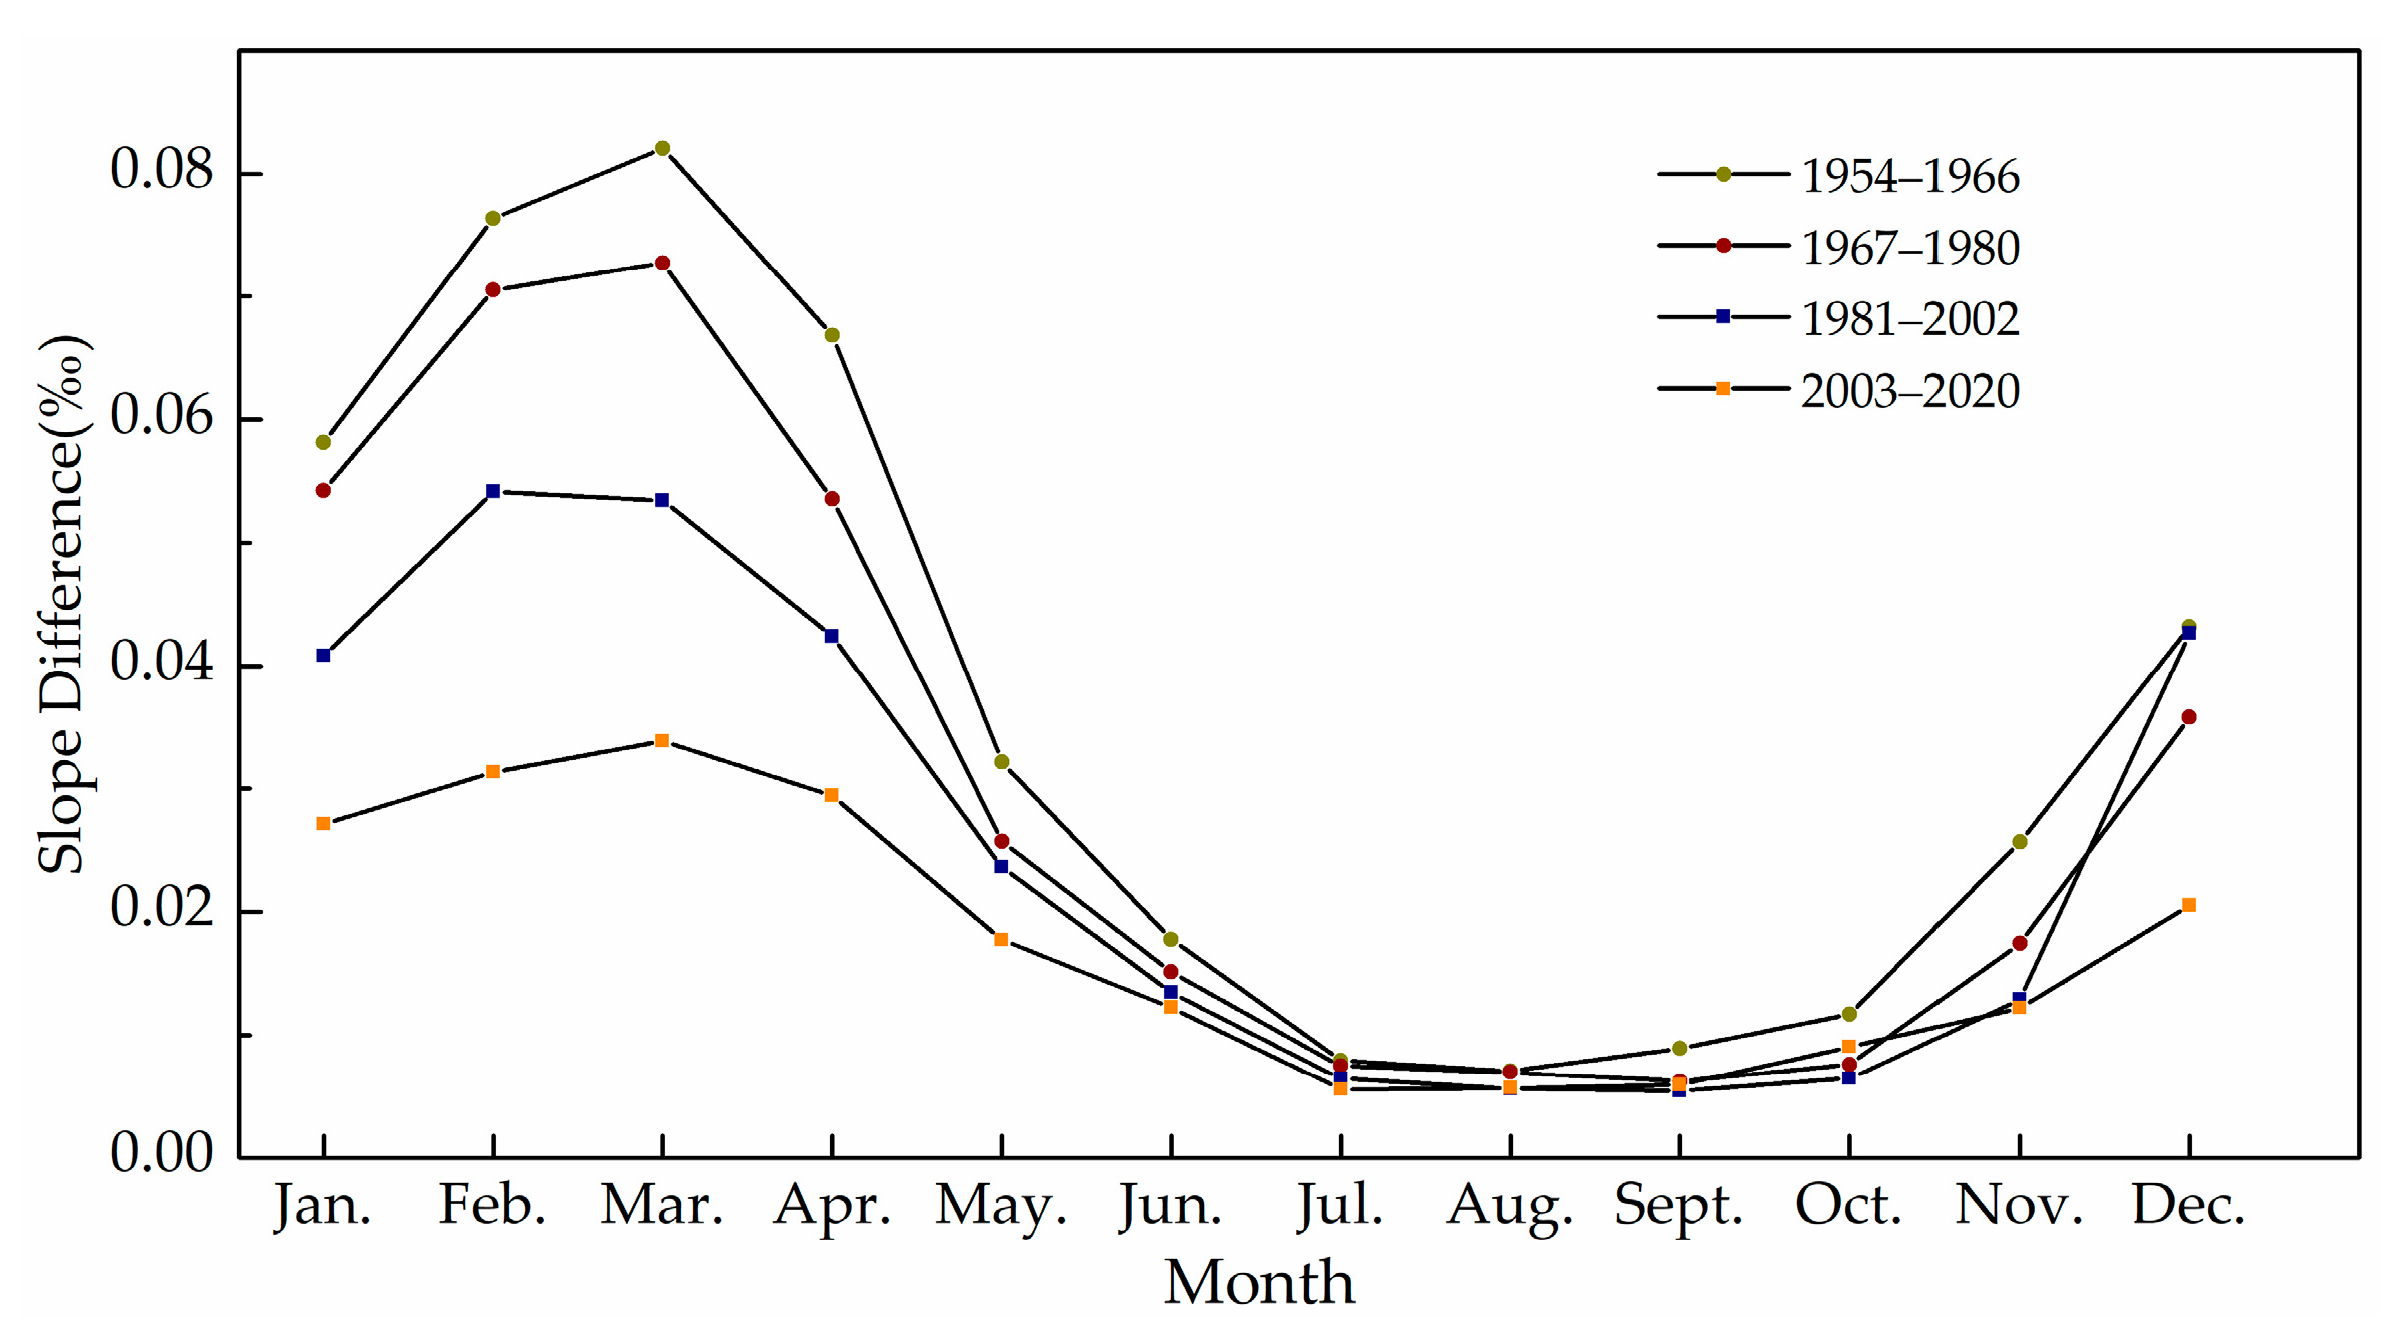
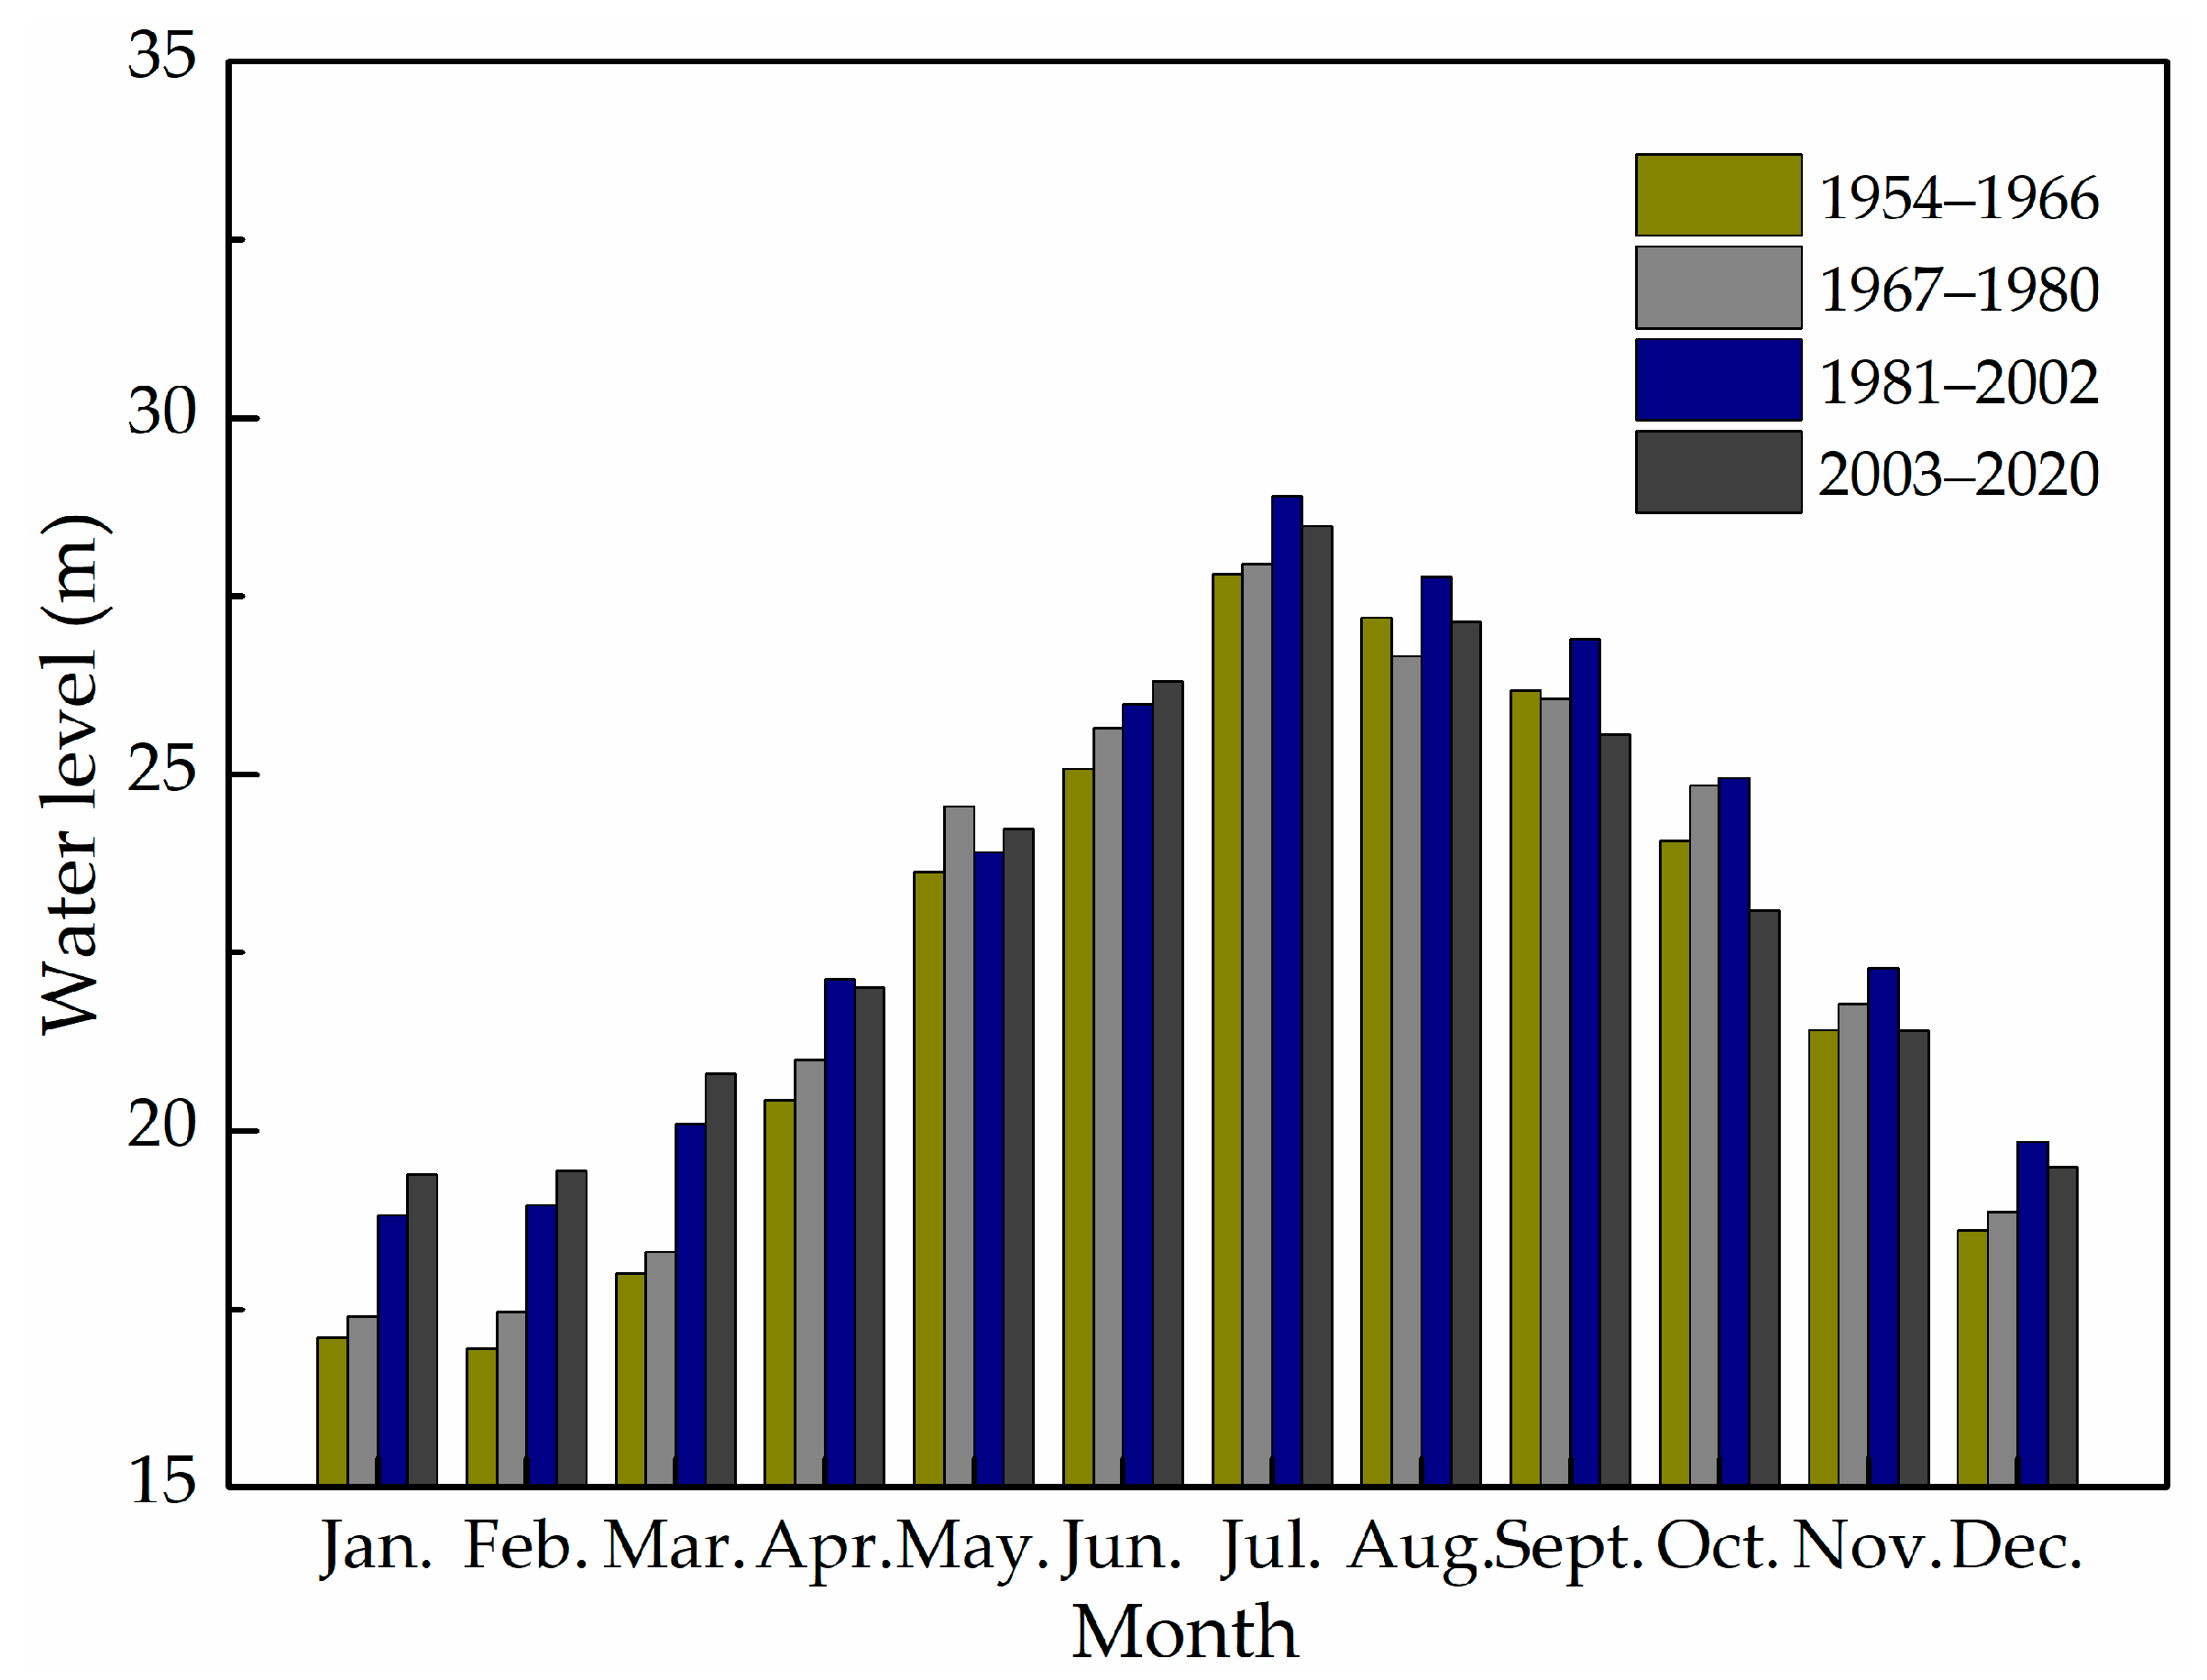
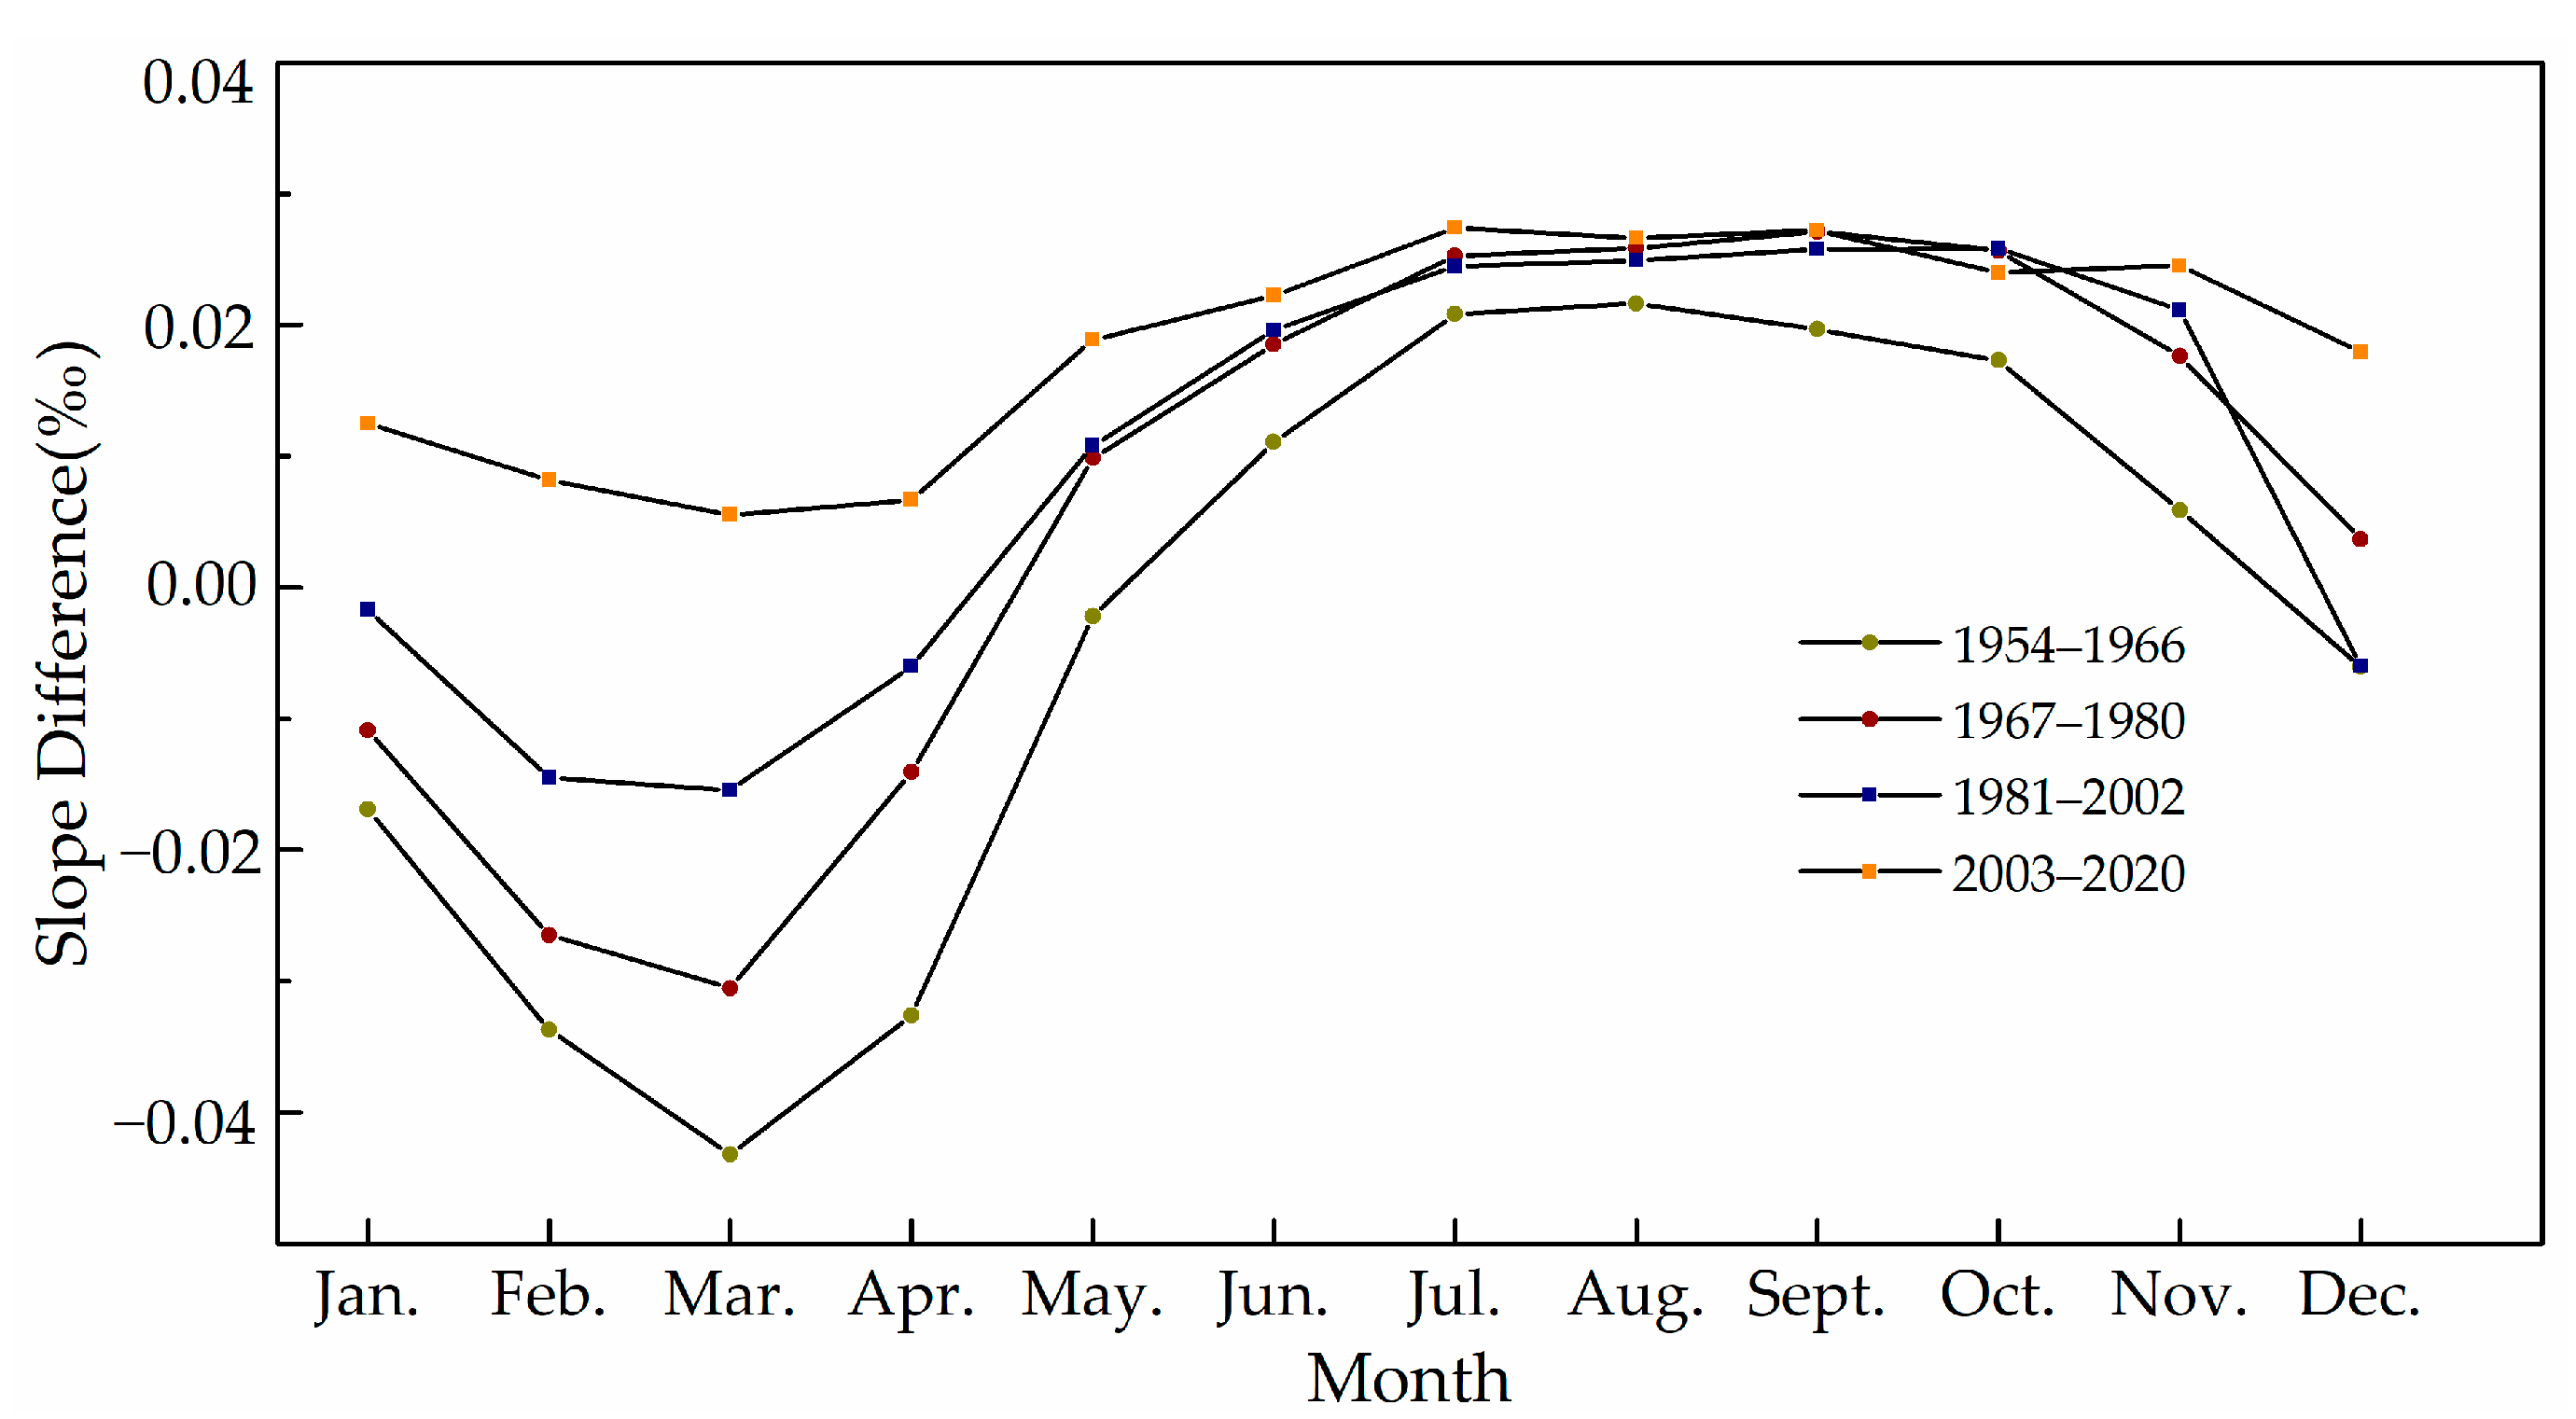
3.5. Water Surface Slope in the Outlet Section of Dongting Lake
4. Discussion
4.1. The Backwater Effect of the Yangtze River on Dongting Lake
4.2. The Limitations of the Study
5. Conclusions
- (1)
- It is found that at Chenglingji station, the water level seemed to increase steadily over the four periods under the same discharge condition. While this could potentially help alleviate drought conditions in the Dongting Lake area during periods of low discharge, it also presents a significant challenge to flood control efforts in the same area during periods of high discharge.
- (2)
- Except for the high flood period (July–September), the water surface slope drop shows a decreasing trend, especially during the dry period when the water surface slope decreases significantly. It indicates that the water surface slope in the outlet section of Dongting Lake becomes gentler, which strengthens the backwater effect of the Yangtze River on the water level in Dongting Lake.
- (3)
- The change in downstream water level and riverbed topography are the main factors that change the water surface slope in the outlet section of Dongting Lake. After the completion of the Three Gorges Dam in 2003, there has been a notable shift in the interaction between the Yangtze River and Dongting Lake. The backwater effect of the Yangtze River has become the dominant factor in this relationship, as evidenced by the positive difference in monthly average water surface slope from January to April.
Author Contributions
Funding
Data Availability Statement
Conflicts of Interest
References
- Alizadeh-Choobari, O.; Ahmadi-Givi, F.; Mirzaei, N.; Owlad, E. Climate change and anthropogenic impacts on the rapid shrinkage of Lake Urmia. Int. J. Climatol. 2016, 36, 4276–4286. [Google Scholar] [CrossRef]
- Yu, Y.; Mei, X.; Dai, Z.; Gao, J.; Li, J.; Wang, J.; Lou, Y. Hydromorphological processes of Dongting Lake in China between 1951 and 2014. J. Hydrol. 2018, 562, 254–266. [Google Scholar] [CrossRef]
- Liu, Y.; Yang, S.-Q.; Jiang, C.; Long, Y.; Deng, B.; Yan, S. Hydrological Drought in Dongting Lake Area (China) after the Running of Three Gorges Dam and a Possible Solution. Water 2020, 12, 2713. [Google Scholar] [CrossRef]
- Huang, Q.; Sun, Z.D.; Opp, C.; Lotz, T.; Jiang, J.H.; Lai, X.J. Hydrological Drought at Dongting Lake: Its Detection, Characterization, and Challenges Associated with Three Gorges Dam in Central Yangtze, China. Water Resour. Manag. 2014, 28, 5377–5388. [Google Scholar] [CrossRef]
- Zhang, C.; Ji, C.; Wang, Y.; Xiao, Q. Flood hydrograph coincidence analysis of the upper Yangtze River and Dongting Lake, China. Nat. Hazards 2021, 110, 1339–1360. [Google Scholar] [CrossRef]
- Liu, Y.; Yang, S.-Q.; Jiang, C.; Sivakumar, M.; Enever, K.; Long, Y.; Deng, B.; Khalil, U.; Yin, L. Flood Mitigation Using an Innovative Flood Control Scheme in a Large Lake: Dongting Lake, China. Appl. Sci. 2019, 9, 2465. [Google Scholar] [CrossRef]
- Xiao, X.; Mao, B.; Wu, S. Dynamics of hydrological characteristics in Changjiang River and Lake Dongting confluence reach in the past 100 years. J. Lake Sci. 2021, 33, 266–276. (In Chinese) [Google Scholar] [CrossRef]
- Wan, R.; Yang, G.; Wang, X.; Qin, N.; Dai, X. Progress of research on the relationship between the Yangtze River and its connected lakes in the middle reaches. J. Lake Sci. 2014, 26, 1–8. (In Chinese) [Google Scholar]
- Li, Z.; Yang, H.; Xia, J.; Zhou, M.; Deng, S.; Wang, Y. Channel morphologic processes of a highly sinuous bend approaching neck cutoff by bank erosion in the middle Yangtze River. Int. J. Sediment Res. 2021, 36, 457–467. [Google Scholar] [CrossRef]
- Xia, J.Q.; Zhou, M.R.; Lin, F.F.; Deng, S.S.; Lu, J.Y. Variation in reach-scale bankfull discharge of the Jingjiang reach undergoing upstream and downstream boundary controls. J. Hydrol. 2017, 547, 534–543. [Google Scholar] [CrossRef]
- Yin, H.; Liu, G.; Pi, J.; Chen, G.; Li, C. On the river–lake relationship of the middle Yangtze reaches. Geomorphology 2007, 85, 197–207. [Google Scholar] [CrossRef]
- Chen, Z.Y.; Chen, D.C.; Xu, K.Q.; Zhao, Y.W.; Wei, T.Y.; Chen, J.; Li, L.Q.; Watanabe, W. Acoustic Doppler current profiler surveys along the Yangtze River. Geomorphology 2007, 85, 155–165. [Google Scholar] [CrossRef]
- Wang, H.; Sun, F.; Liu, W. Characteristics of Streamflow in the Main stream of Changjiang River and the Impact of the Three Gorges Dam. Catena 2020, 189, 104498. [Google Scholar] [CrossRef]
- Guo, L.; Su, N.; Townend, I.; Wang, Z.B.; Zhu, C.; Zhang, Y.; Wang, X.; He, Q. From the headwater to the delta: A synthesis of the basin-scale sediment load regime in the Changjiang River. Earth-Sci. Rev. 2019, 197, 102900. [Google Scholar] [CrossRef]
- Lyu, Y.; Zheng, S.; Tan, G.; Shu, C. Effects of Three Gorges Dam operation on spatial distribution and evolution of channel thalweg in the Yichang-Chenglingji Reach of the Middle Yangtze River, China. J. Hydrol. 2018, 565, 429–442. [Google Scholar] [CrossRef]
- Wang, J.; Dai, Z.; Mei, X.; Lou, Y.; Wei, W.; Ge, Z. Immediately downstream effects of Three Gorges Dam on channel sandbars morphodynamics between Yichang-Chenglingji Reach of the Changjiang River, China. J. Geogr. Sci. 2018, 28, 629–646. [Google Scholar] [CrossRef]
- Xia, J.; Deng, S.; Lu, J.; Xu, Q.; Zong, Q.; Tan, G. Dynamic channel adjustments in the Jingjiang Reach of the Middle Yangtze River. Sci. Rep. 2016, 6, 22802. [Google Scholar] [CrossRef]
- Lyu, Y.; Fagherazzi, S.; Tan, G.; Zheng, S.; Feng, Z.; Han, S.; Shu, C. Hydrodynamic and geomorphic adjustments of channel bars in the Yichang-Chenglingji Reach of the Middle Yangtze River in response to the Three Gorges Dam operation. Catena 2020, 193, 104628. [Google Scholar] [CrossRef]
- Hu, C.; Fang, C.; Cao, W. Shrinking of Dongting Lake and its weakening connection with the Yangtze River: Analysis of the impact on flooding. Int. J. Sediment Res. 2015, 30, 256–262. [Google Scholar] [CrossRef]
- Lu, C.; Jia, Y.; Jing, L.; Zeng, Q.; Lei, J.; Zhang, S.; Wen, L.I. Shifts in river-floodplain relationship reveal the impacts of river regulation: A case study of Dongting Lake in China. J. Hydrol. 2018, 559, 932–941. [Google Scholar] [CrossRef]
- Zhong, Y.; Yue, H.; Yao, S.; Zhu, S.; Zhao, Z. Influence of sand mining on river regime in typical river channel of Xiangjiang River. Yangtze River 2021, 52, 10–15. (In Chinese) [Google Scholar]
- Dai, X.; Yang, G.; Wan, R.; Li, Y. The effect of the Changjiang River on water regimes of its tributary Lake East Dongting. J. Geogr. Sci. 2018, 28, 1072–1084. [Google Scholar] [CrossRef]
- Zhang, C.; Yuan, Y.; Zeng, G.; Liang, J.; Guo, S.; Huang, L.; Hua, S.; Wu, H.; Zhu, Y.; An, H.; et al. Influence of hydrological regime and climatic factor on waterbird abundance in Dongting Lake Wetland, China: Implications for biological conservation. Ecol. Eng. 2016, 90, 473–481. [Google Scholar] [CrossRef]
- Chen, D.; Qu, G.; Guo, X.; Yu, M. Study of the Supporting and Falling Impact of Dongting Lake on the Lower Jingjiang River Before and After Construction of Three Gorges Dam. Adv. Eng. Sci. 2020, 50, 86–94. (In Chinese) [Google Scholar]
- Mao, B.; Wu, Z.; Mei, J.; Tao, W. Confluence relationship changes of Yangtze River and Dongting Lake since impoundment of Three Gorges project. J. Hydroelectr. Eng. 2013, 32, 48–57. (In Chinese) [Google Scholar]
- Meng, X.; Jiang, X.; Li, Z.; Wang, J.; Cooper, K.M.; Xie, Z. Responses of macroinvertebrates and local environment to short-term commercial sand dredging practices in a flood-plain lake. Sci. Total Environ. 2018, 631, 1350–1359. [Google Scholar] [CrossRef]
- Duan, W.; Zheng, Y.; Liu, J. Causes of water level rising in Chenglingji-Luoshan reach of Changjiang River. J. Hydraul. Eng. 2001, 32, 29–34. [Google Scholar]
- Zhang, M.; Feng, X.; Liu, Z.; Li, W. Impact on Dongting Lake channel caused by the change of flow and sediment environment after Three Gorges Project impoundment. Adv. Water Sci. 2015, 26, 423–431. [Google Scholar]
- Gao, J.; Zhang, C.; Jiang, J.; Huang, Q. Changes in Sediment Deposition and Erosion and Their Spatial Distribution in the Dongting Lake. Acta Geogr. Sin. 2001, 56, 269–277. (In Chinese) [Google Scholar]
- Yao, J.; Xia, J.; Deng, S.; Zhou, M.; Xu, Q. Variation in flood-discharge capacity of Chenglingji-Hankou reach in the middle Yangtze River and analysis of influencing factors since the onset of Three Gorges Reservoir. J. Lake Sci. 2021, 33, 830–841. (In Chinese) [Google Scholar]
- Changjiang Water Resource Commission. Yangtze River Sediment Bulletin (1990–2019); Changjiang Water Resource Commission: Wuhan, China, 1990–2019. (In Chinese) [Google Scholar]
- Yao, J.; Zhang, Q.; Ye, X.C.; Zhang, D.; Bai, P. Quantifying the impact of bathymetric changes on the hydrological regimes in a large floodplain lake: Poyang Lake. J. Hydrol. 2018, 561, 711–723. [Google Scholar] [CrossRef]
- Li, Z.W.; Fu, W.; Hu, X.Y.; Huang, C.; Zhong, Y.D. Calculation and Analysis of Sand Excavation Quantity in Jingjiang River Reach and Dongting Lake’s River Network. J. Yangtze River Sci. Res. Inst. 2019, 36, 8–12. [Google Scholar]


| Period | Highest Water Level (m) | Discharge Corresponding to the Highest Water Level (m3/s) | Maximum Discharge (m3/s) | Discharge Difference (m3/s) |
|---|---|---|---|---|
| 1954–1966 | 32.60 | 42,700 | 43,300 | 600 |
| 1967–1980 | 31.81 | 35,200 | 38,600 | 3400 |
| 1981–2002 | 33.98 | 29,800 | 43,800 | 14,000 |
| 2003–2020 | 32.78 | 23,400 | 49,200 | 25,800 |
| Discharge (m3/s) | Period | |||
|---|---|---|---|---|
| 1954–1966 | 1967–1980 | 1981–2002 | 2003–2020 | |
| 1000 | 15.36 | 16.03 | 16.75 | 17.11 |
| 2000 | 15.79 | 16.47 | 17.21 | 17.59 |
| 5000 | 17.09 | 17.81 | 18.59 | 19.04 |
| 10,000 | 19.25 | 20.05 | 20.89 | 21.45 |
| 15,000 | 21.41 | 22.28 | 23.20 | 23.86 |
| 20,000 | 23.56 | 24.52 | 25.50 | 26.27 |
| 25,000 | 25.72 | 26.75 | 27.80 | 28.68 |
| 30,000 | 27.88 | 28.98 | 30.10 | 31.09 |
| Discharge (m3/s) | Period | |||
|---|---|---|---|---|
| 1954–1966 | 1967–1980 | 1981–2002 | 2003–2020 | |
| 2000 | 1.58 | 2.88 | 7.34 | 7.73 |
| 4000 | 4.59 | 8.19 | 8.52 | 8.94 |
| 6000 | 6.85 | 8.76 | 8.80 | 9.06 |
| 8000 | 7.46 | 8.74 | 8.78 | 8.89 |
| 10,000 | 7.58 | 8.49 | 8.60 | 8.56 |
| 12,000 | 7.48 | 8.12 | 8.32 | 8.16 |
| 14,000 | 7.25 | 7.67 | 7.96 | 7.69 |
| Period | Water Level (m) | Discharge (m3/s) | ||
|---|---|---|---|---|
| Highest | Lowest | Highest | Lowest | |
| 1954–1966 | 28.36 | 16.64 | 22,700 | 2343 |
| 1967–1980 | 28.34 | 17.17 | 20,593 | 1875 |
| 1981–2002 | 29.24 | 18.66 | 18,830 | 2387 |
| 2003–2020 | 28.88 | 18.98 | 16,837 | 2716 |
Disclaimer/Publisher’s Note: The statements, opinions and data contained in all publications are solely those of the individual author(s) and contributor(s) and not of MDPI and/or the editor(s). MDPI and/or the editor(s) disclaim responsibility for any injury to people or property resulting from any ideas, methods, instructions or products referred to in the content. |
© 2023 by the authors. Licensee MDPI, Basel, Switzerland. This article is an open access article distributed under the terms and conditions of the Creative Commons Attribution (CC BY) license (https://creativecommons.org/licenses/by/4.0/).
Share and Cite
Liu, Y.; Jiang, C.; Long, Y.; Deng, B.; Jiang, J.; Yang, Y.; Wu, Z. Study on the Water Level–Discharge Relationship Changes in Dongting Lake Outlet Section over 70 Years and the Impact of Yangtze River Backwater Effect. Water 2023, 15, 2057. https://doi.org/10.3390/w15112057
Liu Y, Jiang C, Long Y, Deng B, Jiang J, Yang Y, Wu Z. Study on the Water Level–Discharge Relationship Changes in Dongting Lake Outlet Section over 70 Years and the Impact of Yangtze River Backwater Effect. Water. 2023; 15(11):2057. https://doi.org/10.3390/w15112057
Chicago/Turabian StyleLiu, Yizhuang, Changbo Jiang, Yuannan Long, Bin Deng, Jieyu Jiang, Yang Yang, and Zhiyuan Wu. 2023. "Study on the Water Level–Discharge Relationship Changes in Dongting Lake Outlet Section over 70 Years and the Impact of Yangtze River Backwater Effect" Water 15, no. 11: 2057. https://doi.org/10.3390/w15112057