
The 100-Year Series of Weather-Related Fatalities in the Czech Republic: Interactions of Climate, Environment, and Society
 , , , ,
Abstract
:1. Introduction
2. Materials and Methods
2.1. Data
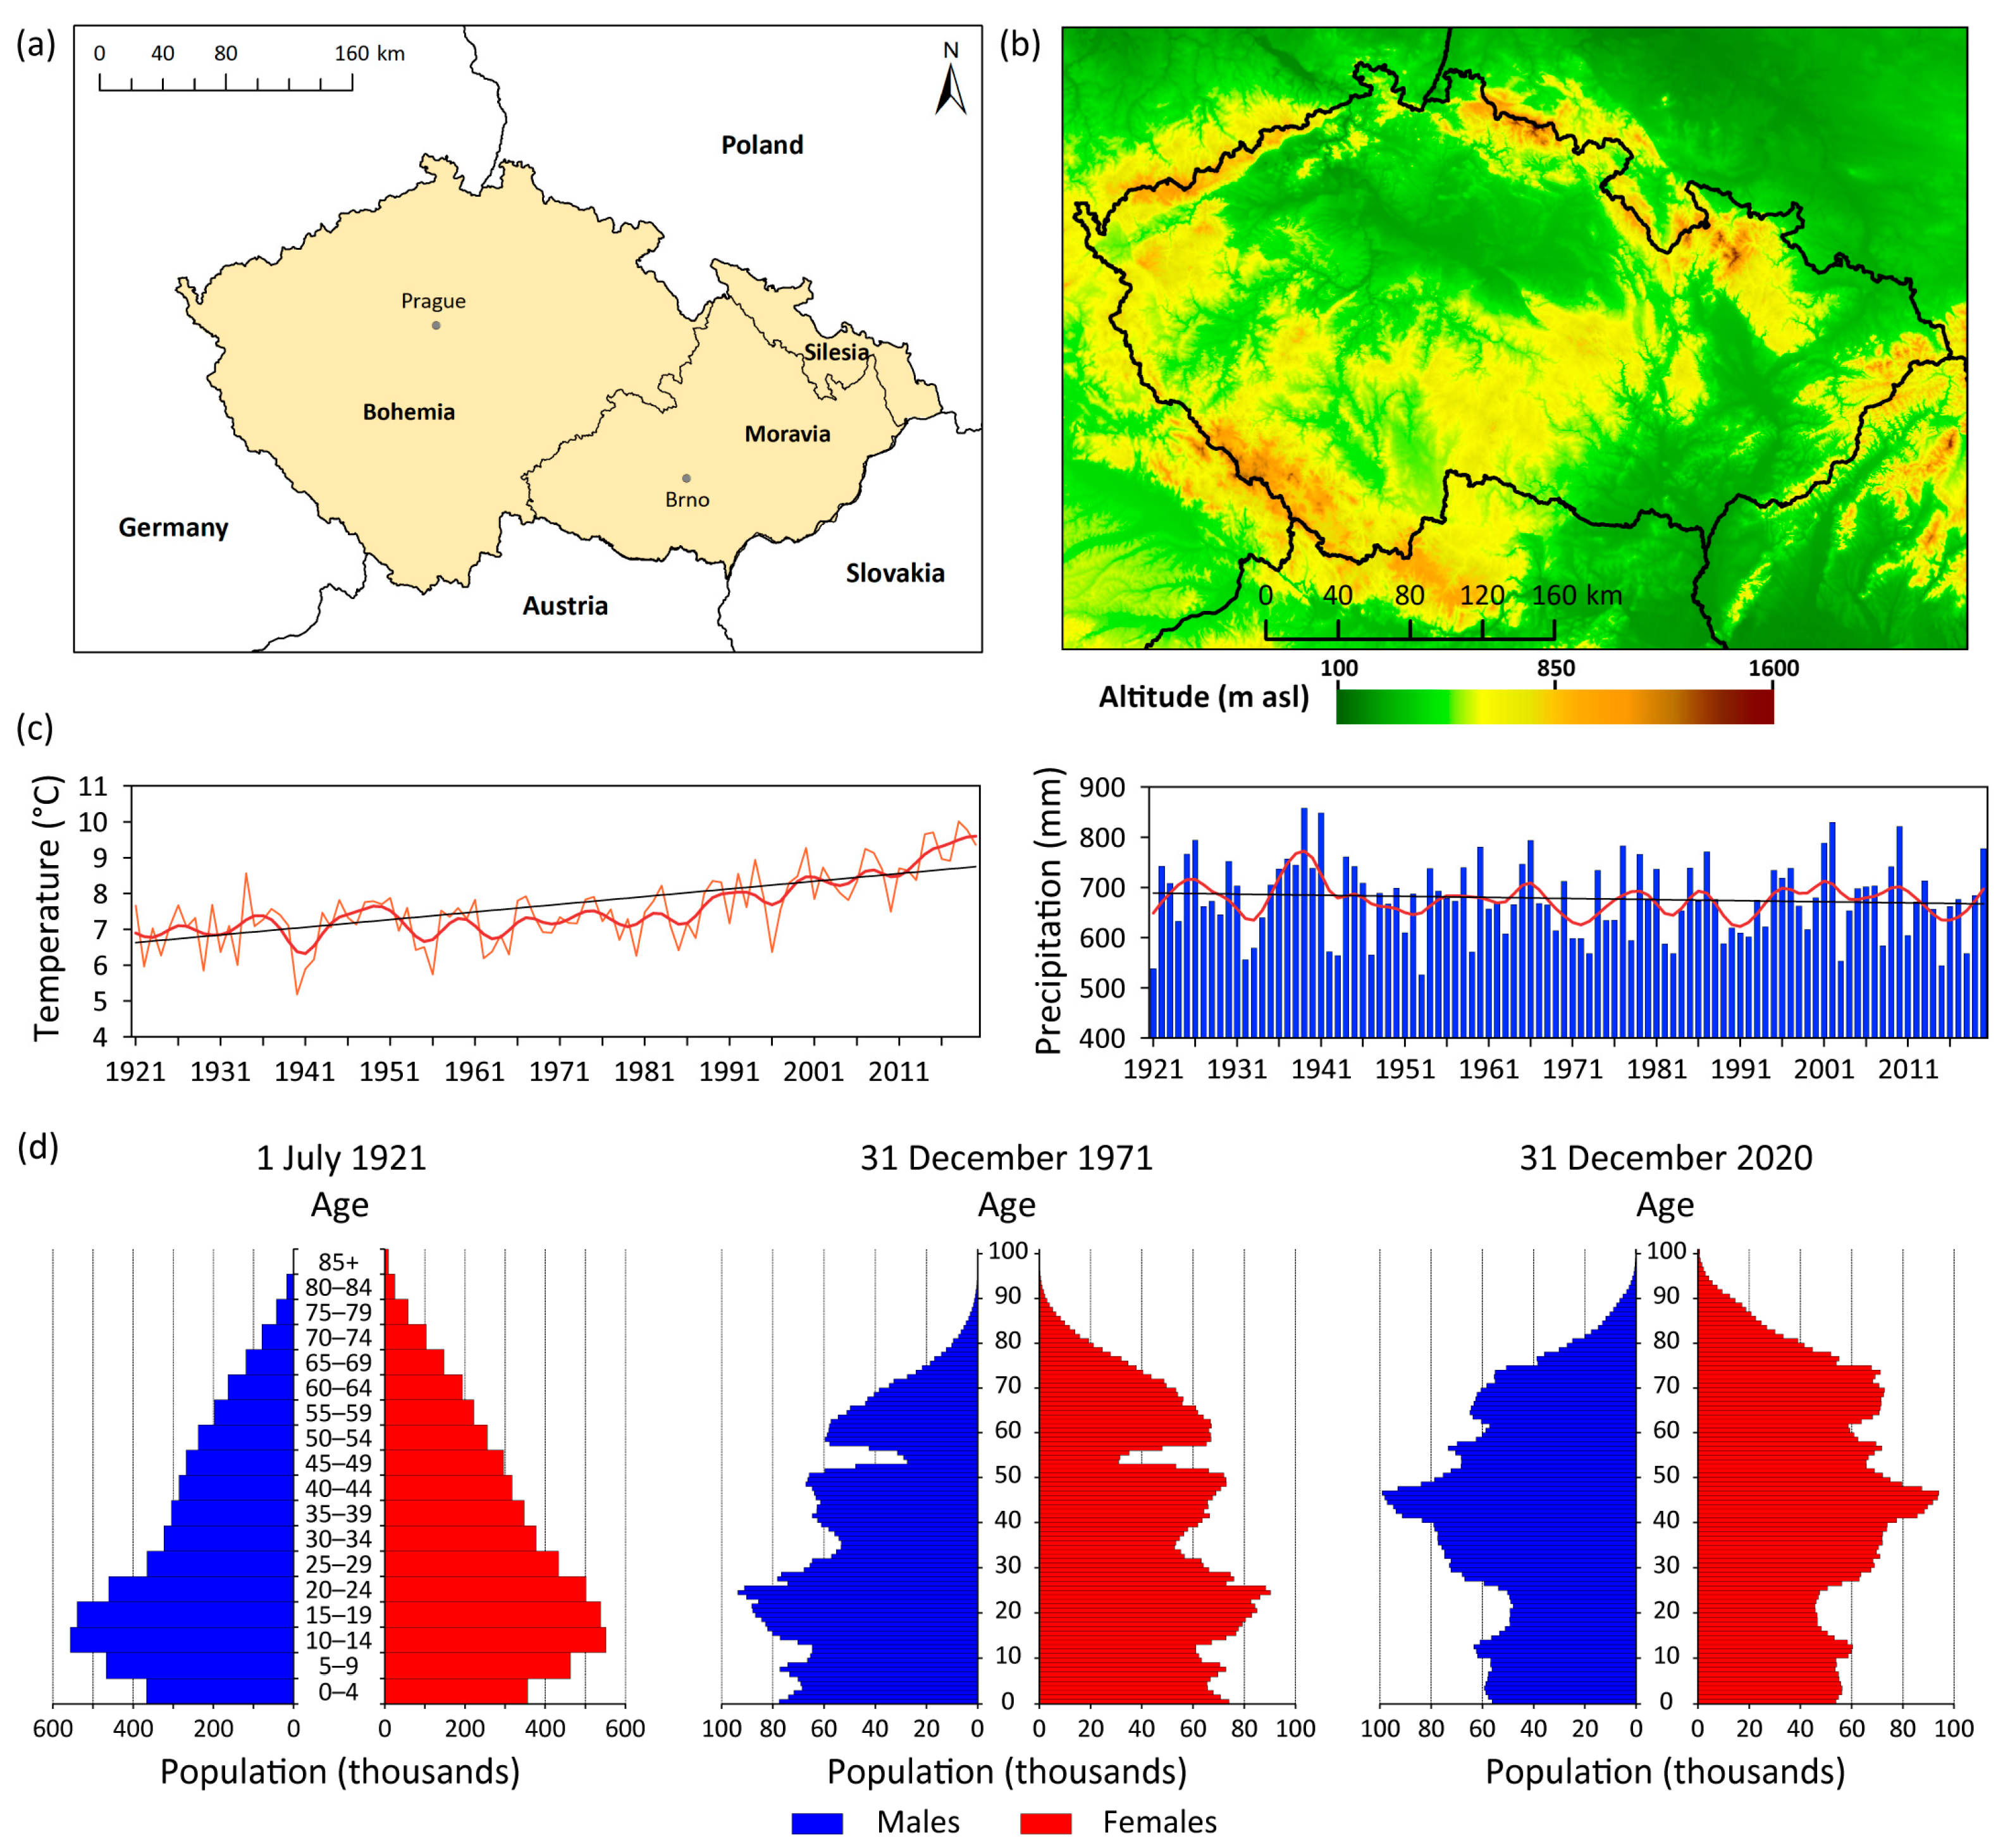
2.1.1. The Czech Republic
2.1.2. Fatality Data
- (i)
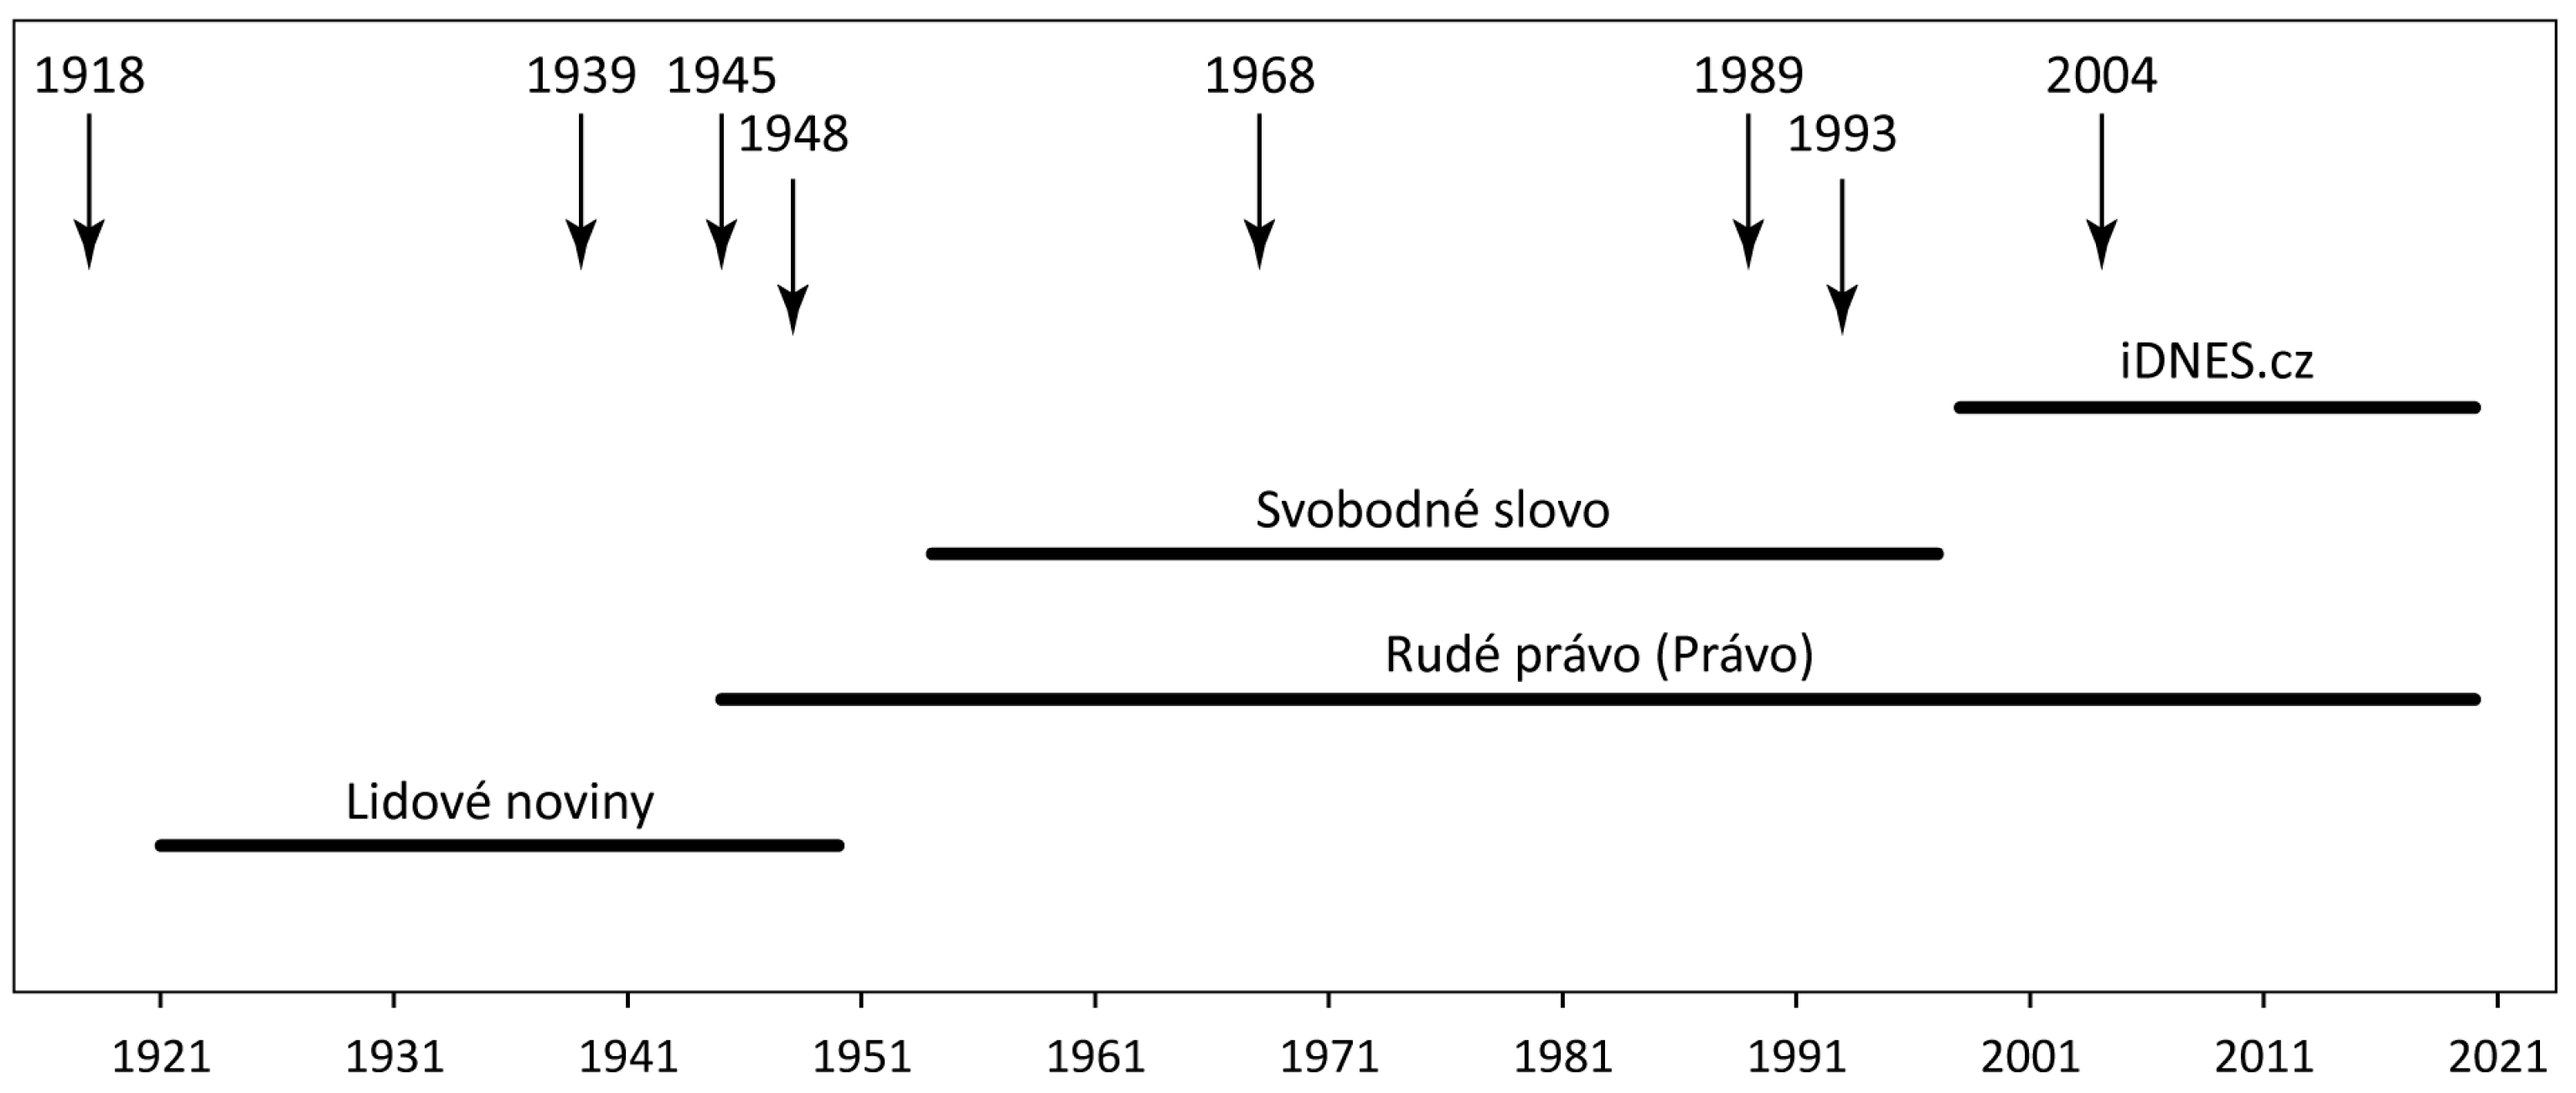
- Newspapers and magazines
- (ii)
- Narrative sources
- (iii)
- Climatological records
- (iv)
- Parliamentary proposals
- (v)
- Professional papers and reports
- (vi)
- Memorials
- (vii)
- Internet sources
2.2. Methods
2.2.1. Types of Severe Weather
- (i)
- Flood
- (ii)
- Windstorm
- (iii)
- Convective storm
- (iv)
- Snow and glaze ice
- (v)
- Frost
- (vi)
- Fog
- (vii)
- Other inclement weather
2.2.2. Database of Fatalities
- (i)
- date of the fatal accident or event;
- (ii)
- locality (i.e., the place of the fatal accident or event);
- (iii)
- type of weather category (see Section 2.2.1);
- (iv)
- time (hour) of the day when the fatal accident or event occurred (morning 0400–0800 CET, forenoon 0800–1200 CET, afternoon 1200–1800 CET, evening 1800–2200 CET, night 2200–0400 CET);
- (v)
- name of the casualty;
- (vi)
- gender of the casualty (male, female);
- (vii)
- age of the casualty (exact age in years or estimated age: child 0–15 years, adult 16–65 years, elderly 66 years and older);
- (viii)
- cause of death (drowning, falling tree/branch, traffic (vehicle/plane/train) accident, underlying health reason, freezing to death/hypothermia, lightning strike, other reason);
- (ix)
- place of death (river/lake/reservoir/bank, within a building, road, open space in a built-up area, countryside, other places);
- (x)
- type of death (direct—deaths caused by weather phenomena, e.g., drowning due to water torrent or collapse of a building; indirect—deaths during activity related to weather phenomena, e.g., health collapse during saving activities);
- (xi)
- behavior of the casualty or culprit of a deadly event (non-hazardous, hazardous);
- (xii)
- source of information.
2.2.3. Statistical Analysis
3. Results
3.1. Fatalities in Individual Weather Categories
3.1.1. Floods
3.1.2. Windstorms
3.1.3. Convective Storms
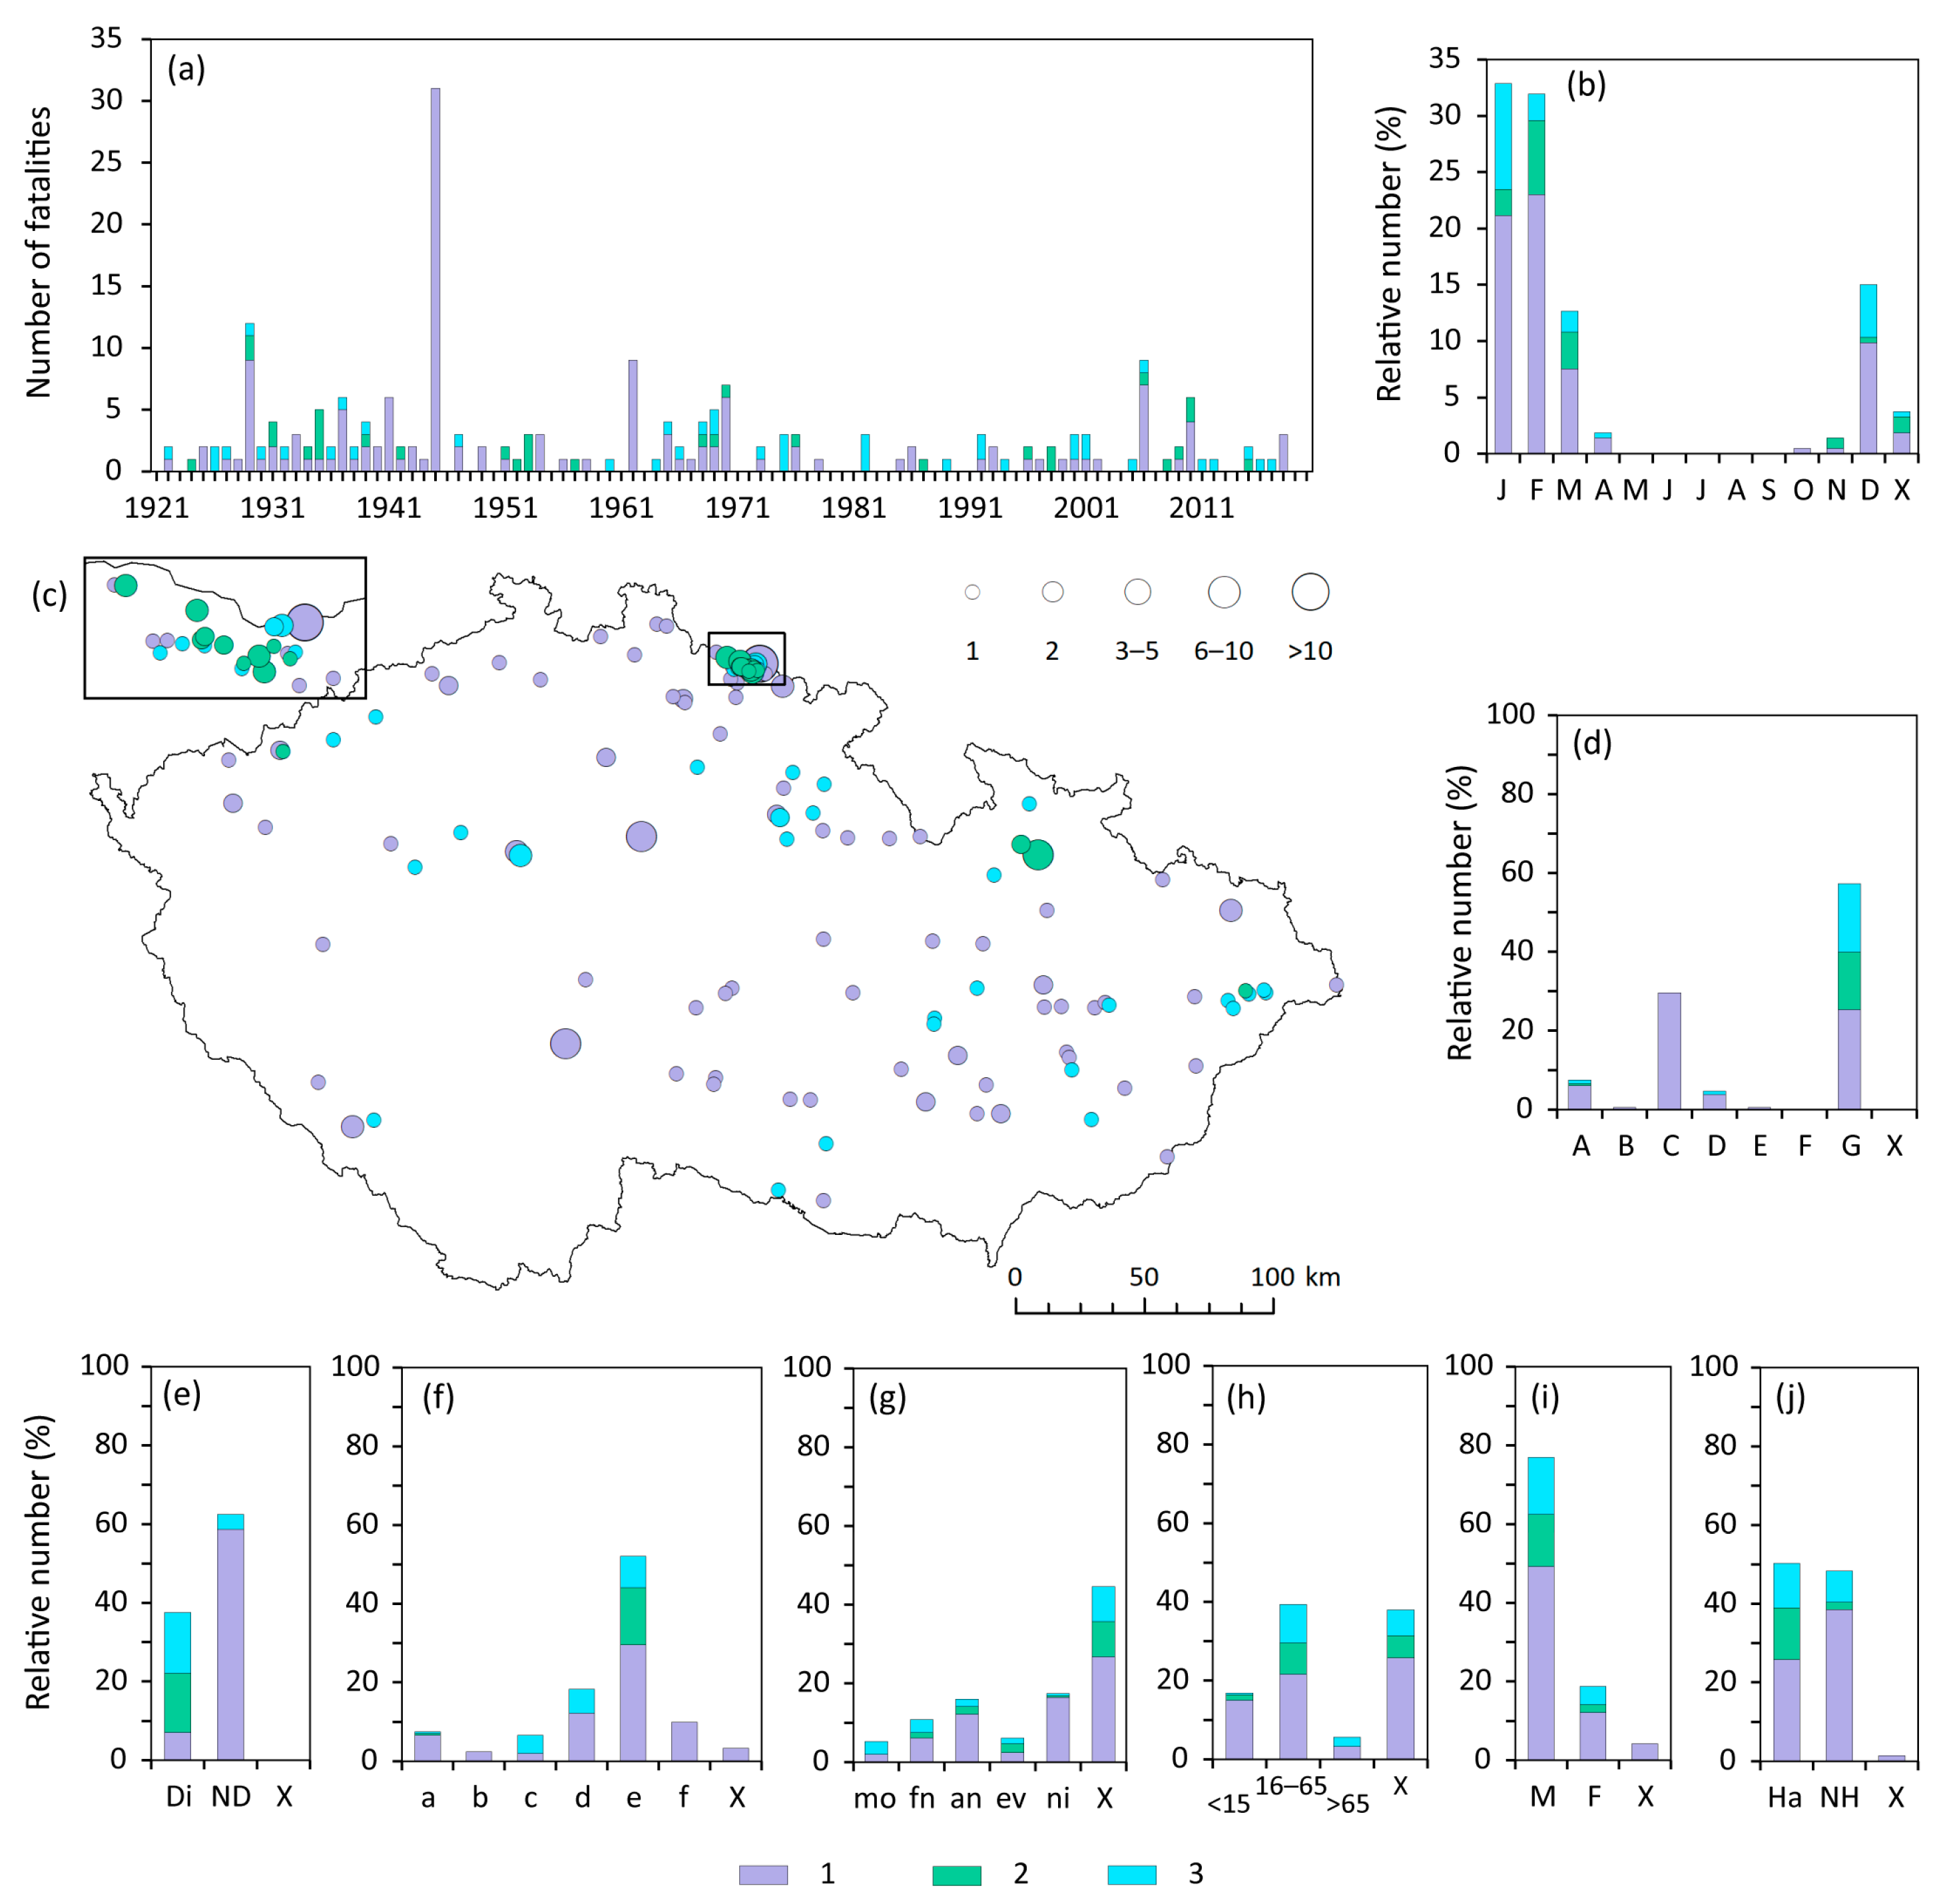
3.1.4. Snow and Glaze Ice
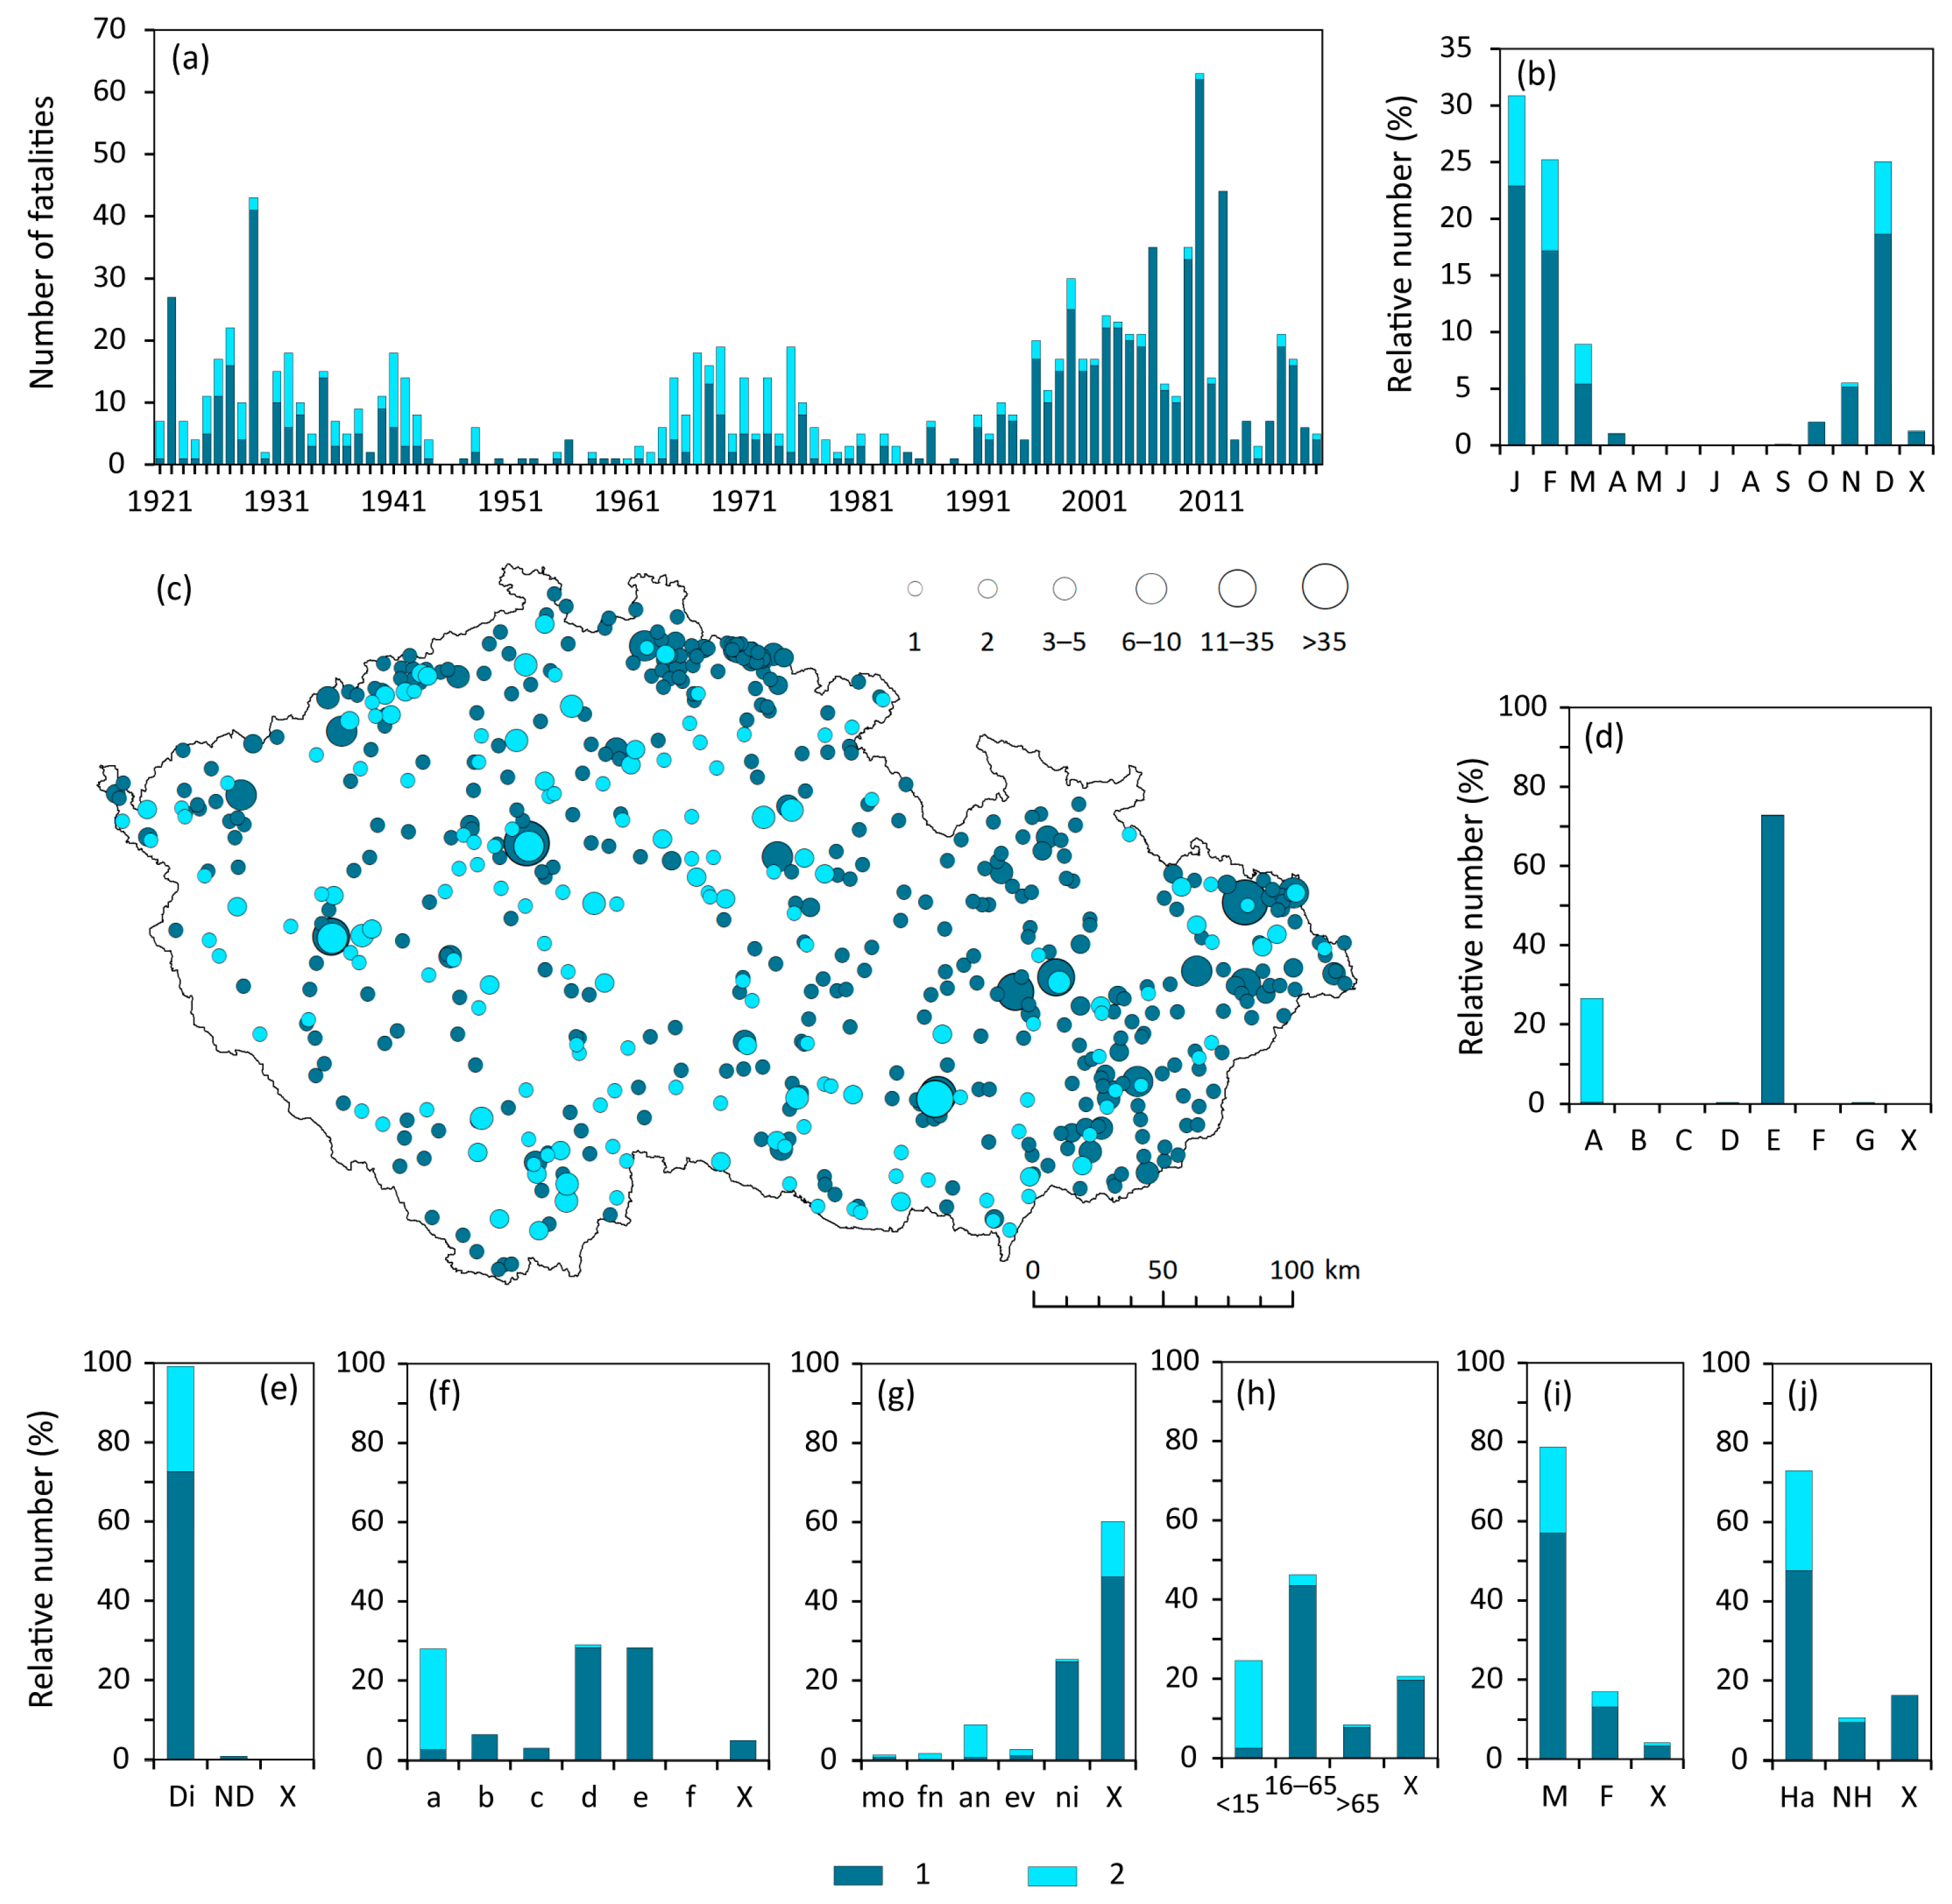
3.1.5. Frosts
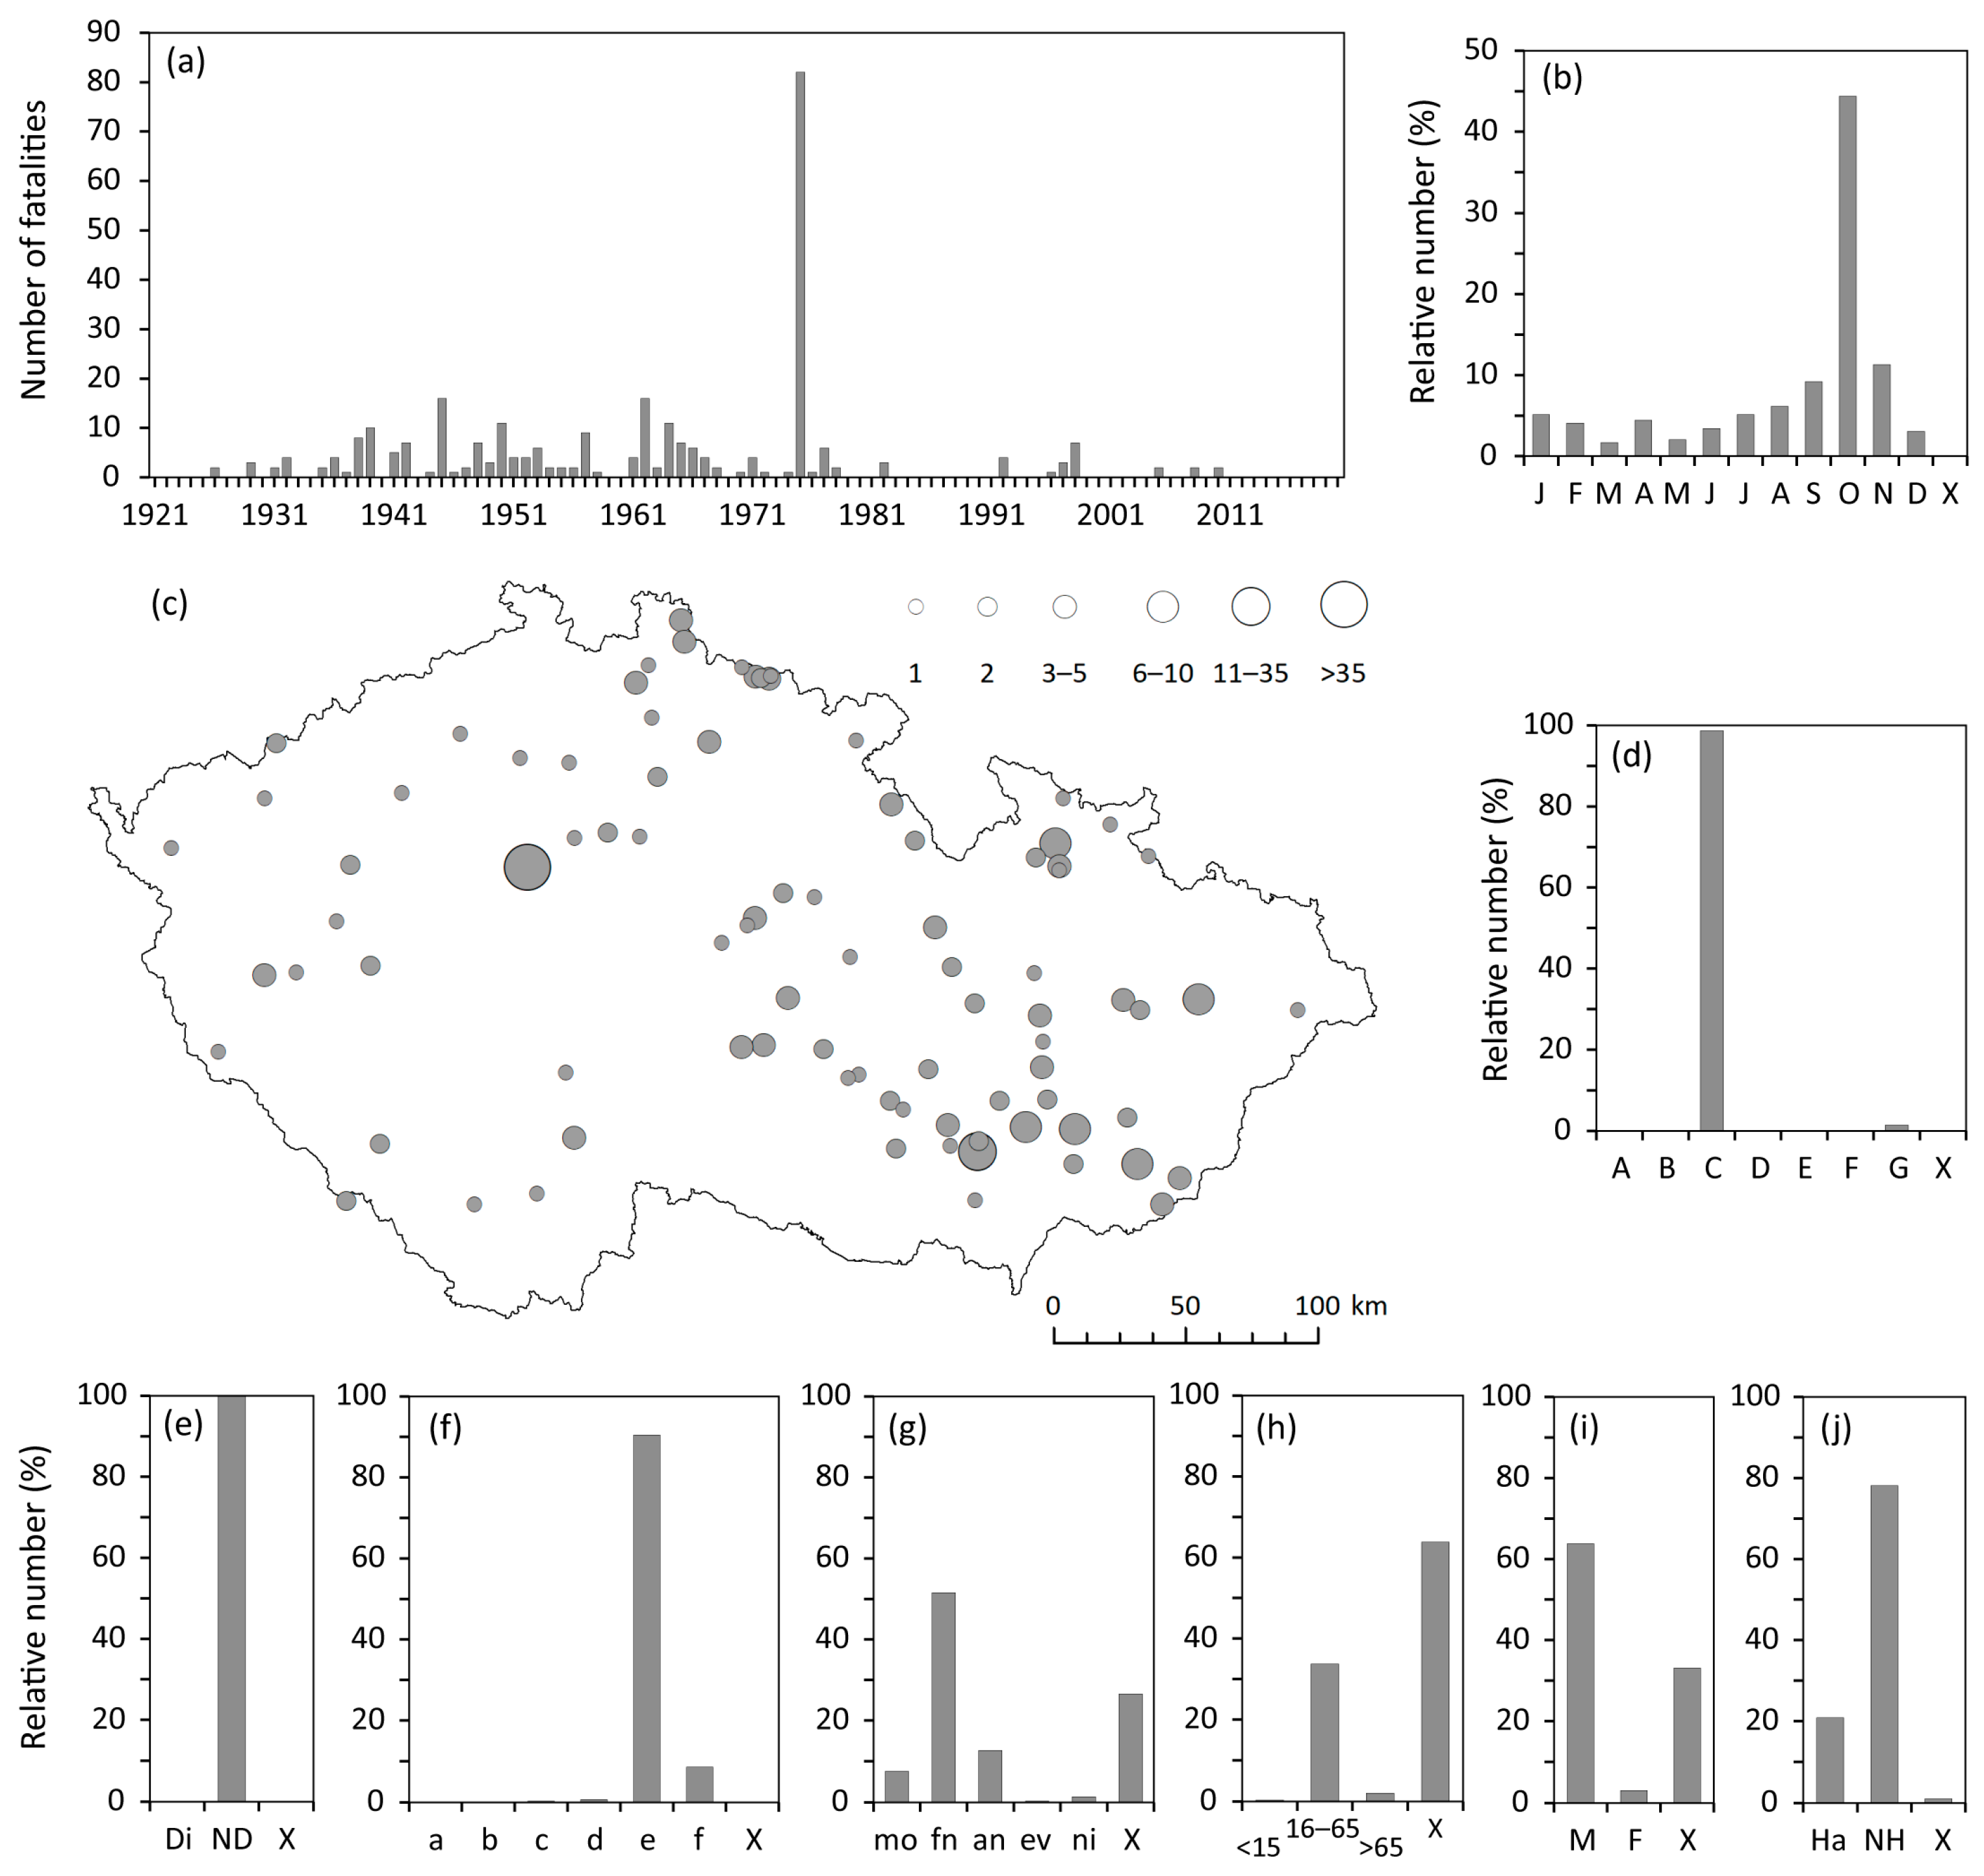
3.1.6. Fog
3.1.7. Other Inclement Weather
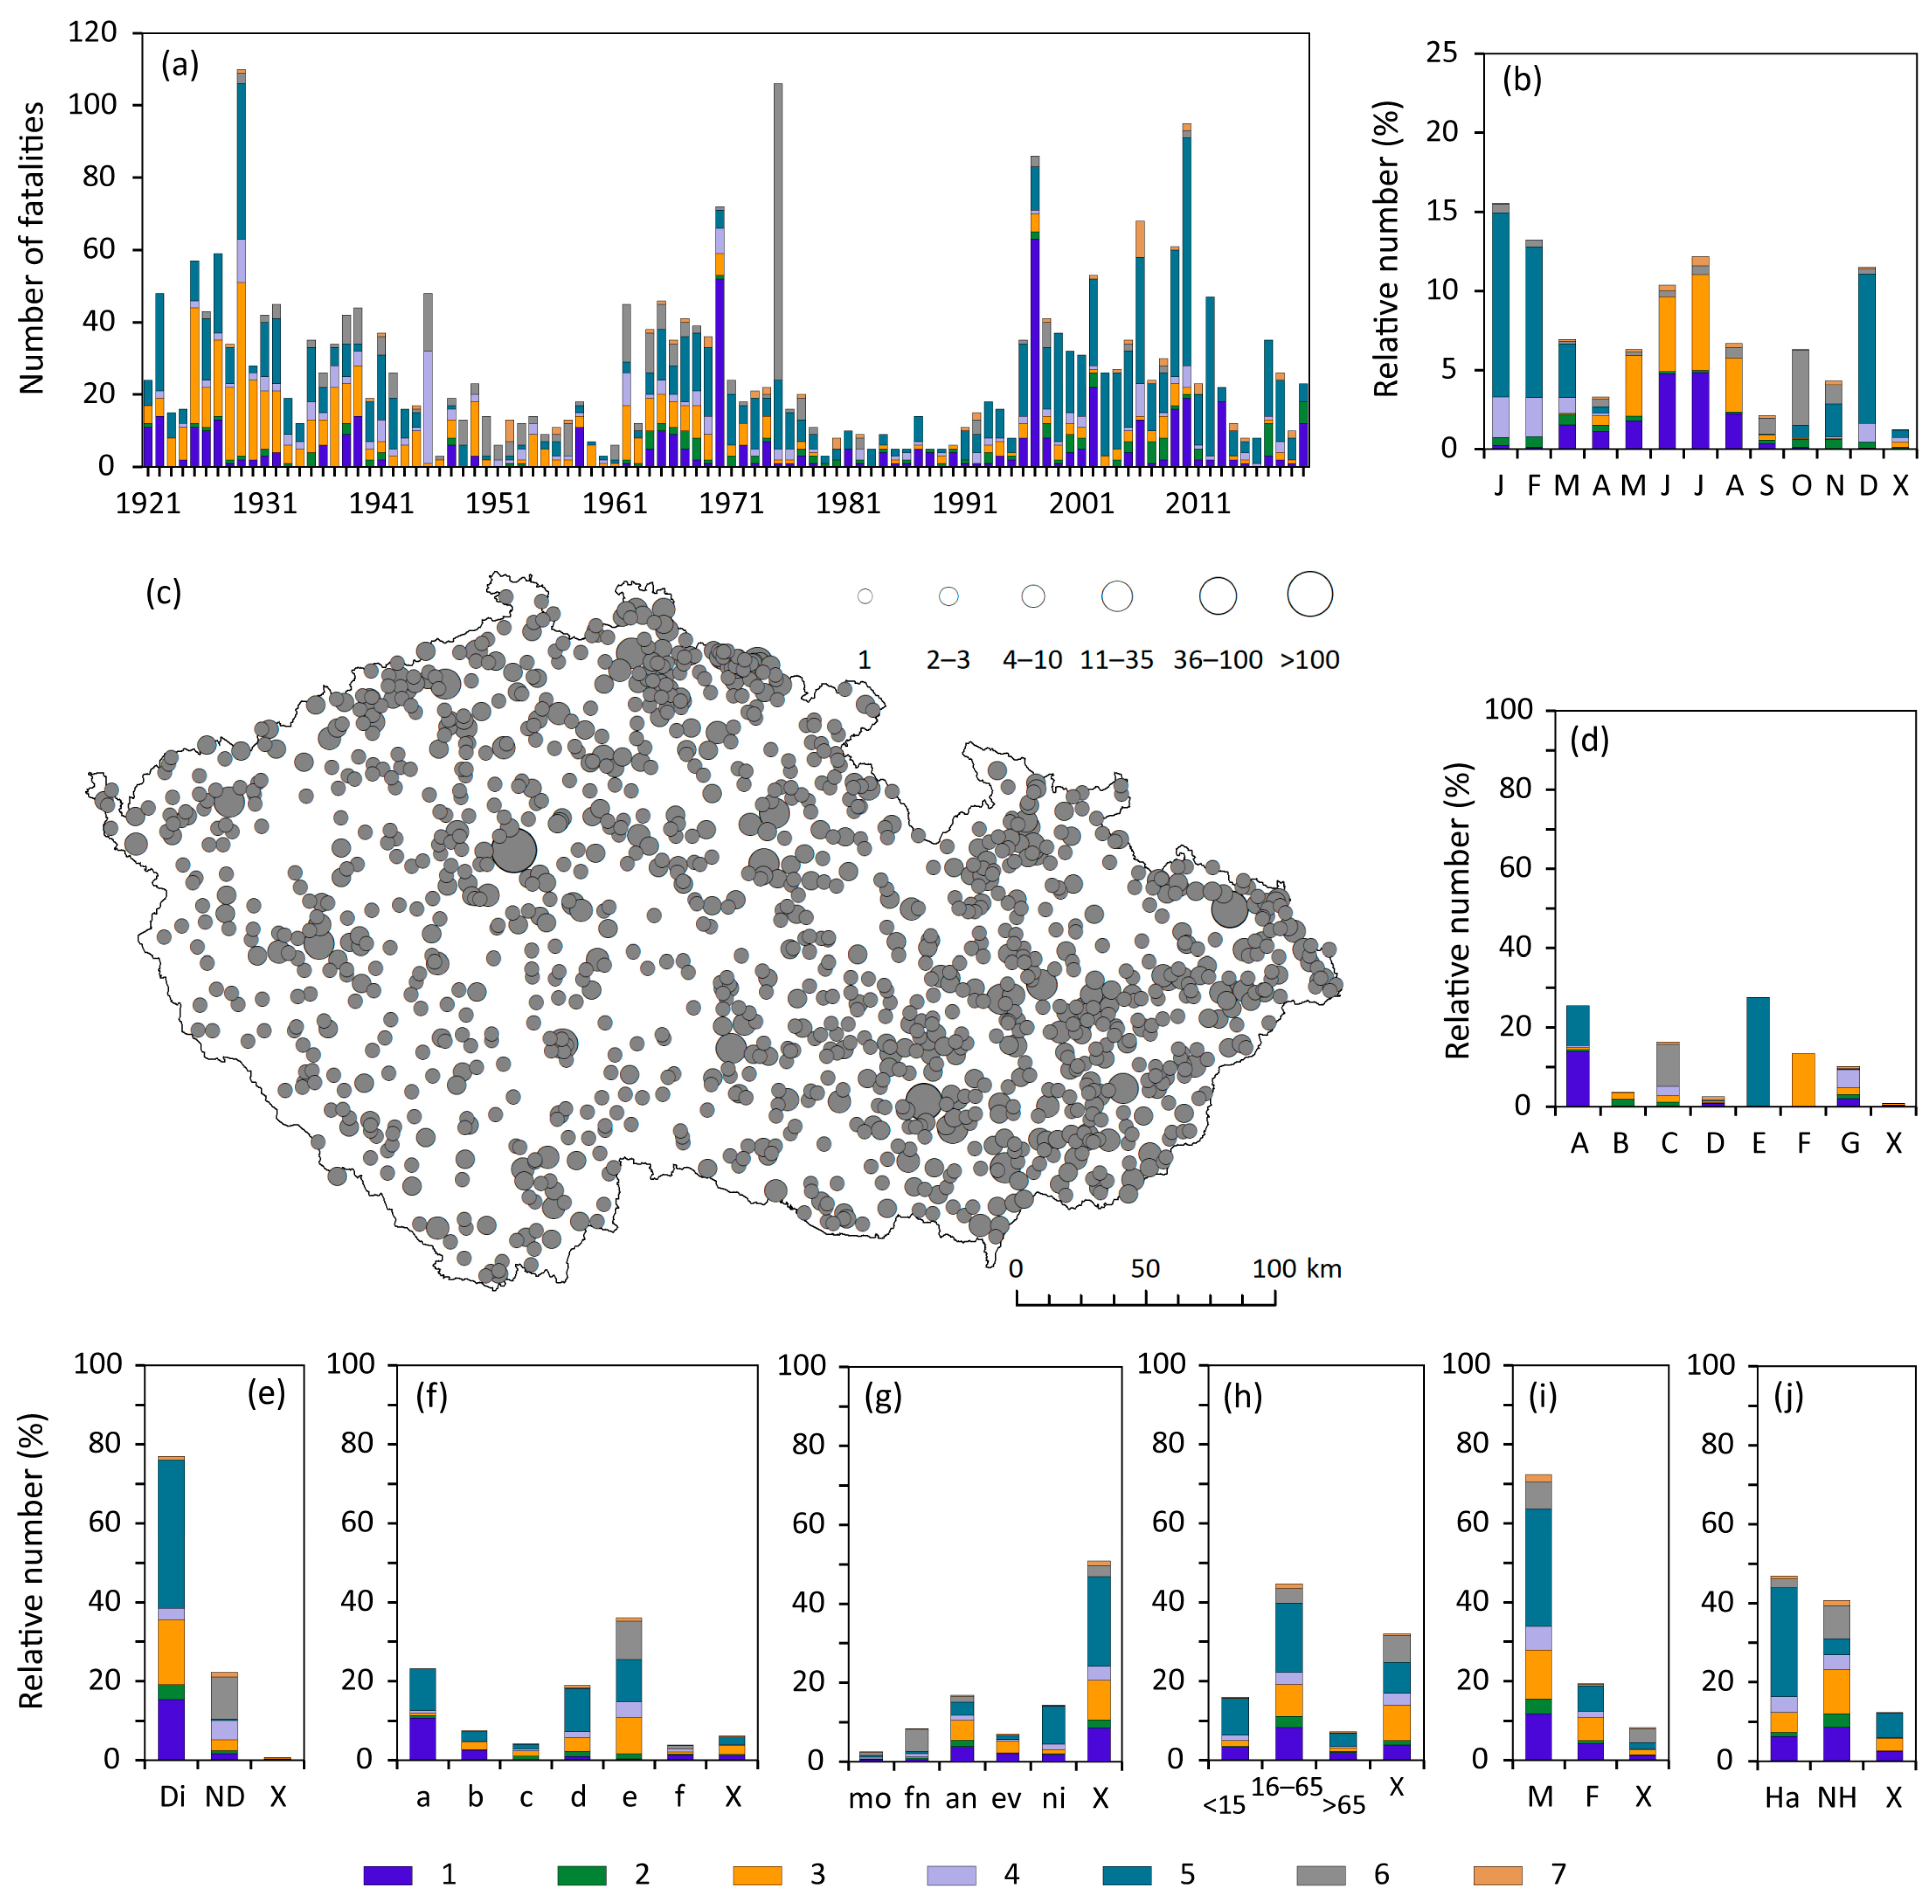
3.2. Synthesis of Weather-Related Fatalities
4. Discussion
4.1. Data Uncertainty
4.2. Broader Context
5. Conclusions
- (i)
- The database of weather-related fatalities in the past 100 years was created from different documentary sources, particularly newspapers. By covering a long period and a broad scope of severe weather events, it is a unique dataset in the national and European scales. Despite representing a lower estimate of the real numbers of such fatalities, this database is suitable for the study of spatiotemporal variability of weather-related fatalities, as well as their different special characteristics and features.
- (ii)
- Historical milestones, political and socioeconomic developments, as well as changes in media, significantly influenced the availability of fatality reports related to extreme weather in newspapers. As a result, fatality data are highly underestimated in 1945–1961 and 1978–1995, which makes it difficult to analyze long-term trends and compare them with trends in selected climatological variables.
- (iii)
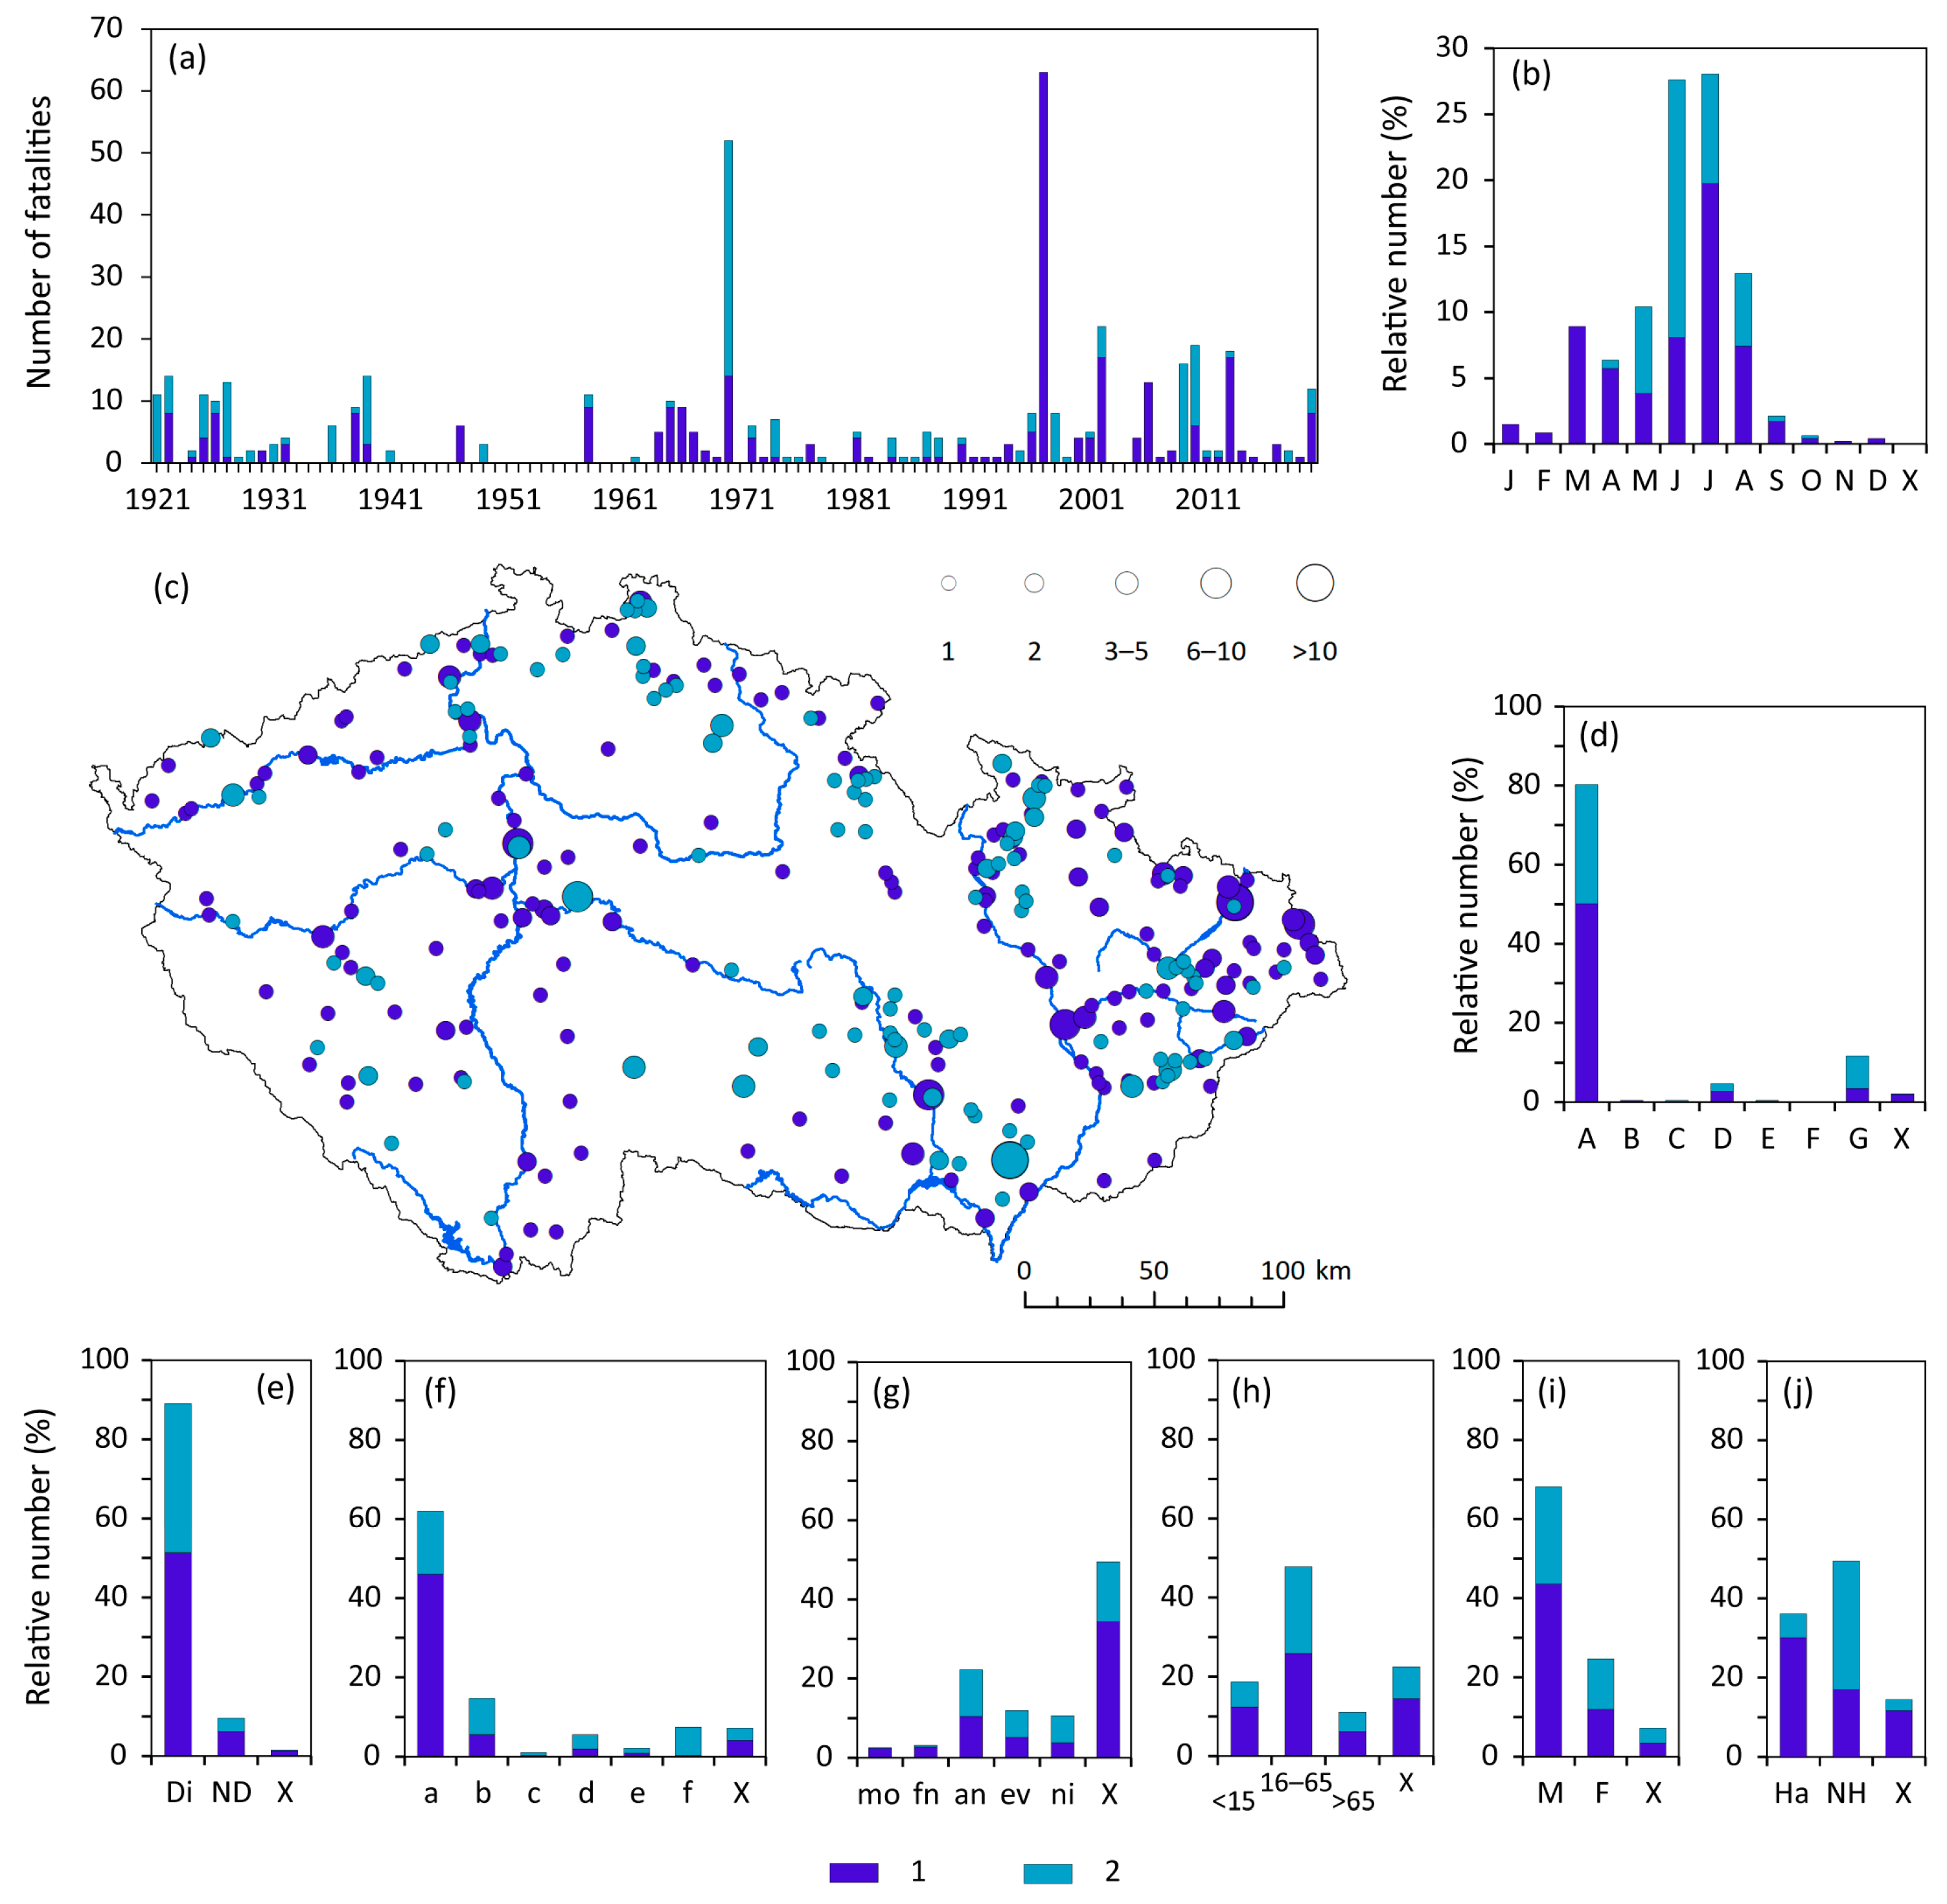
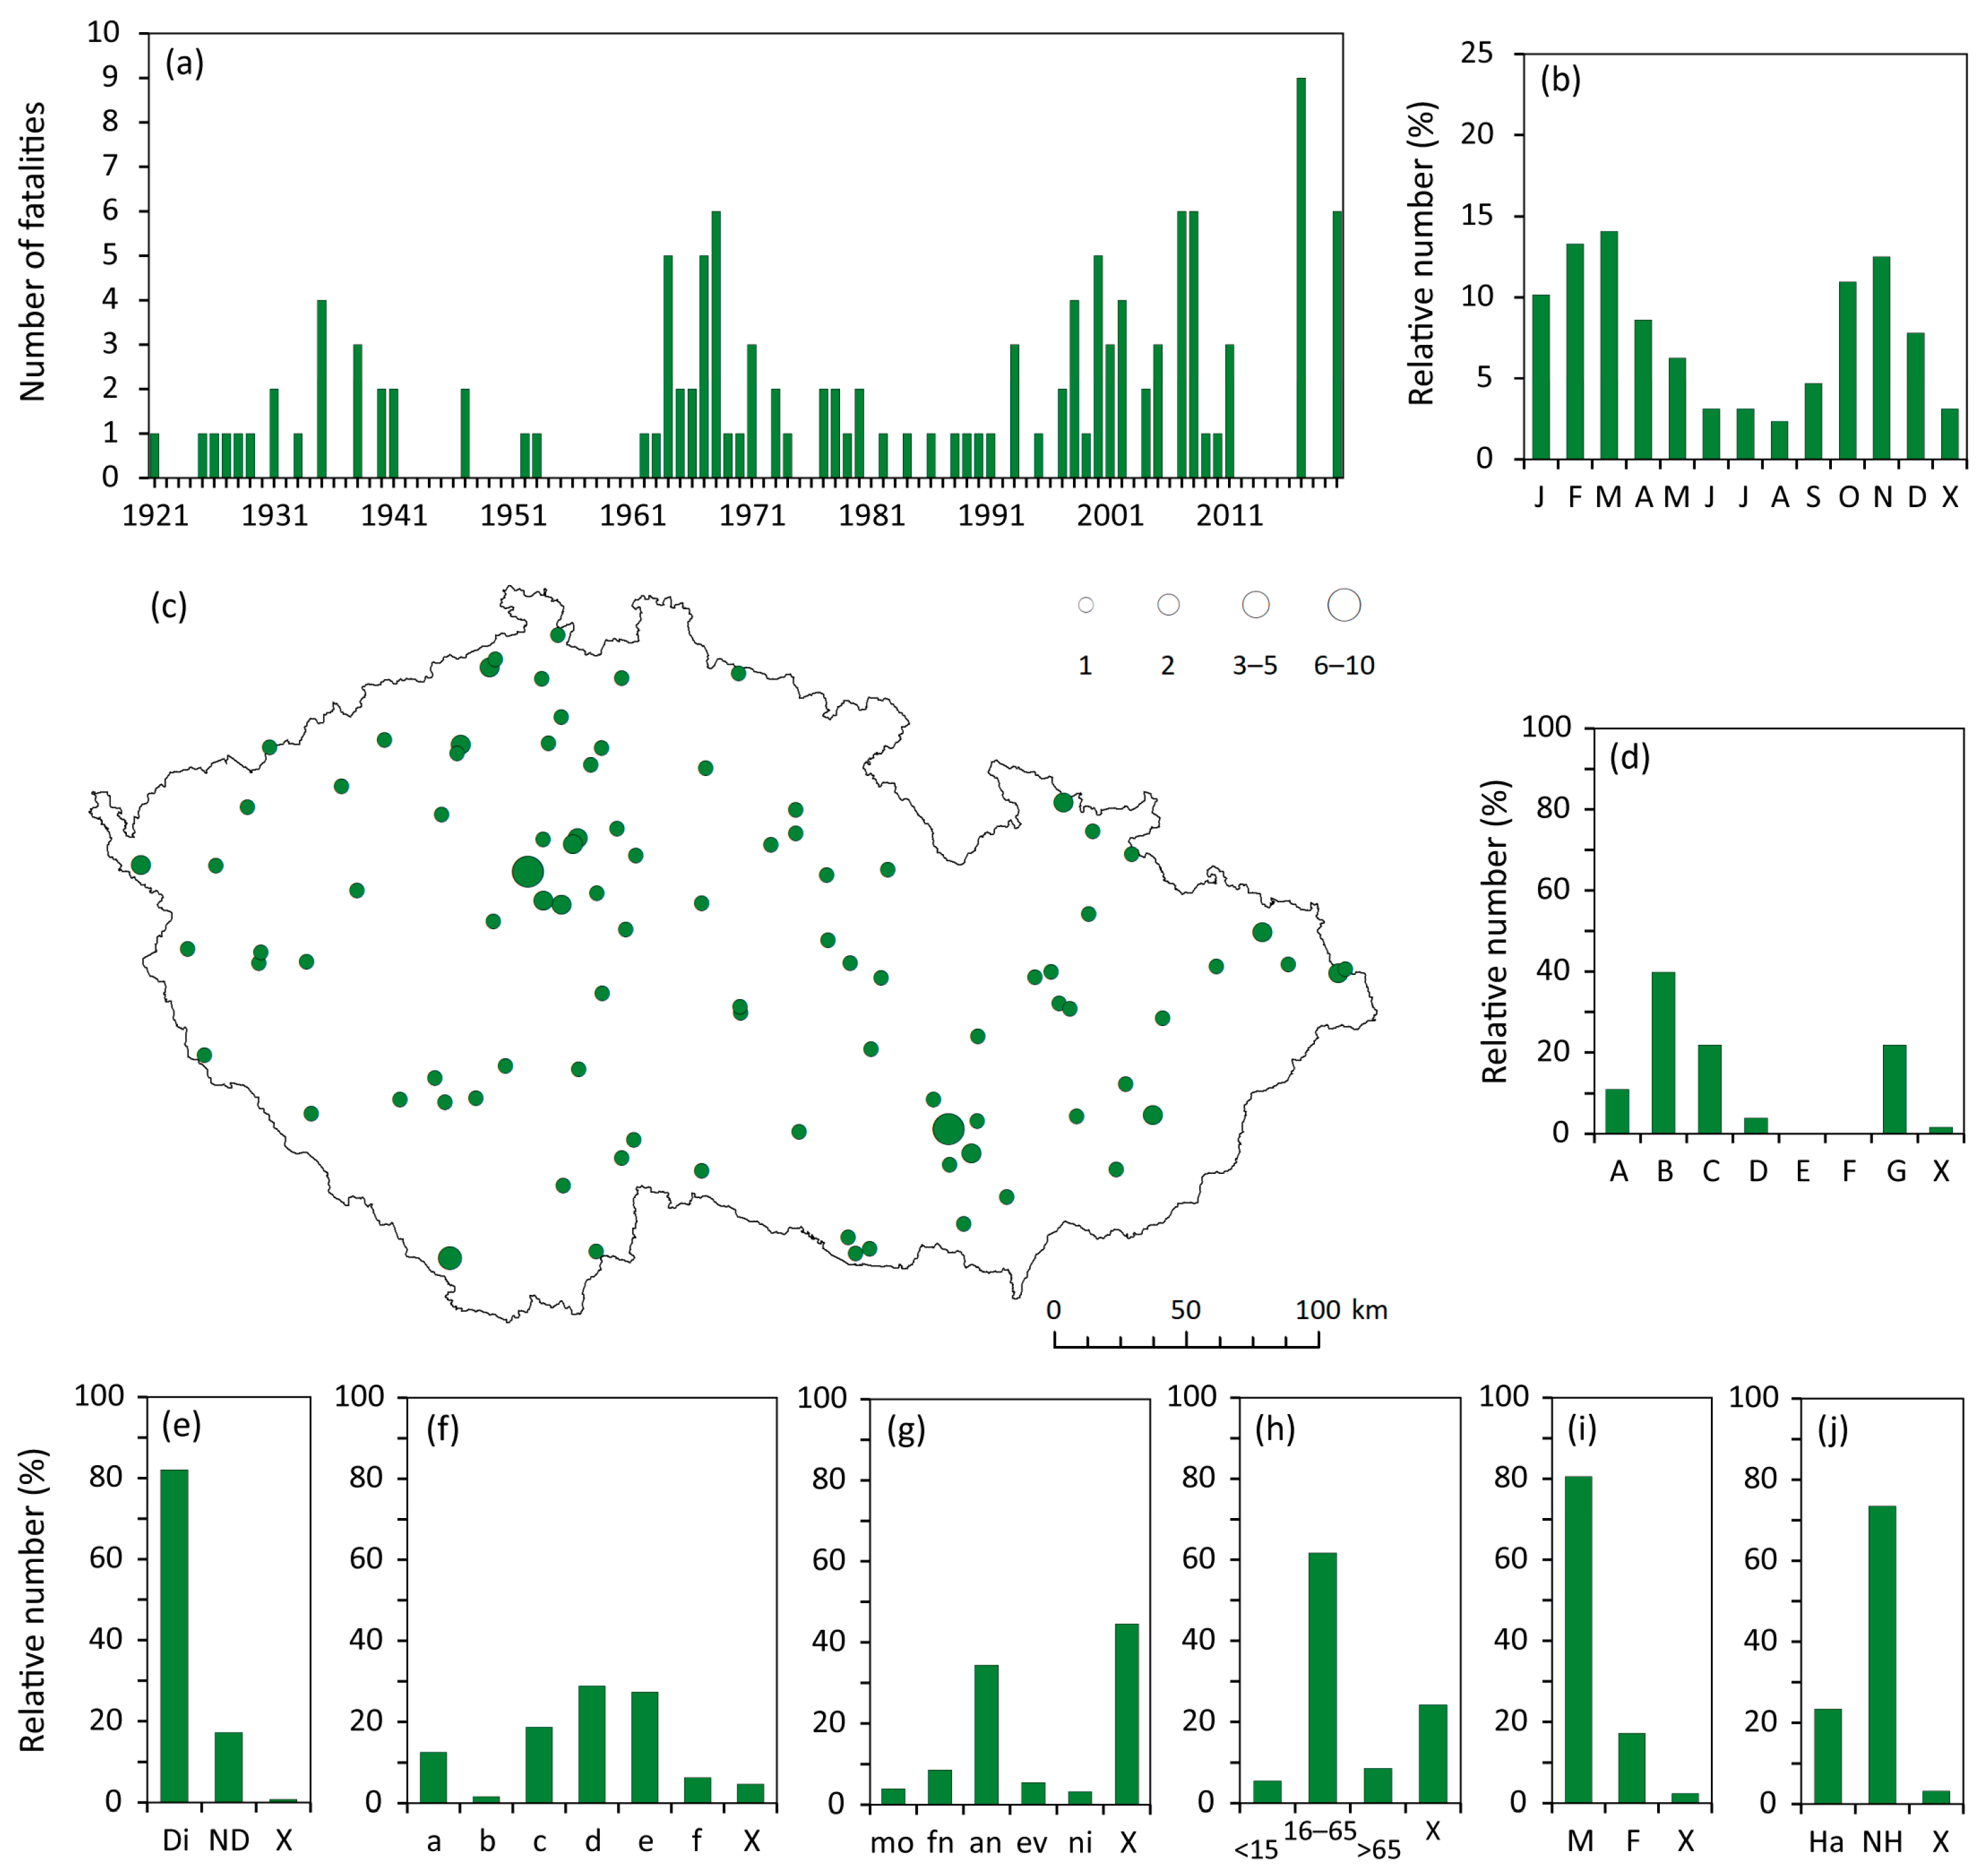
- An annual average of 27.3 weather-related fatalities per year was attributed to the following weather categories: frosts—cold spells and ice on water bodies (38%); convective storms—lightning strike, strong wind, thunderstorm (19%); floods—including flash floods (17%); fog with bad visibility (11%); snow, avalanches, and glaze ice (8%); windstorms (5%); and other inclement weather not attributable to any preceding categories (2%).
- (iv)
- Despite some differences among individual weather categories, the prevailing characteristics/features of all fatalities were as follows: direct deaths; fatalities mainly caused by freezing to death/hypothermia or drowning, happening in the afternoon and night in an open countryside or on rivers and water bodies; particularly dominant male and adult fatalities; hazardous behavior of victims (or culprits of deadly events) more frequently than non-hazardous.
- (v)
- Detailed knowledge of weather-related fatalities with respect to their spatiotemporal occurrence, structure, and characteristics, with almost half of them classified as hazardous behavior of victims (or culprits of deadly events), offers the possibility to learn from this fatality data to apply appropriate risk communication and contribute to potentially decreasing fatalities (injuries) during extreme weather events.
- (vi)
- Further research on weather-related fatalities in the CR would require their comparison with other official public sources as demographic yearbooks (despite their more generalized data), extension of the period analyzed back to 19th century and the study of fatalities in their broad climatological, environmental, and socioeconomic context in contrast to recent climate change.
Author Contributions
Funding
Data Availability Statement
Acknowledgments
Conflicts of Interest
Appendix A

References
- WMO. Atlas of Mortality and Economic Losses from Weather, Climate and Water Extremes (1970–2019); WMO-No. 1267; World Meteorological Organization: Geneva, Switzerland, 2021. [Google Scholar]
- Brázdil, R.; Chromá, K.; Zahradníček, P.; Dobrovolný, P.; Dolák, L.; Řehoř, J.; Řezníčková, L. Changes in weather-related fatalities in the Czech Republic during the 1961–2020 period. Atmosphere 2022, 13, 688. [Google Scholar] [CrossRef]
- Pilorz, W.; Laskowski, I.; Surowiecki, A.; Łupikasza, E. Fatalities related to sudden meteorological events across Central Europe from 2010 to 2020. Int. J. Disaster. Risk Reduct. 2023, 88, 103622. [Google Scholar] [CrossRef]
- Diakakis, M.; Deligiannakis, G. Flood fatalities in Greece: 1970–2010. J. Flood Risk Manag. 2017, 10, 115–123. [Google Scholar] [CrossRef]
- Petrucci, O.; Aceto, L.; Bianchi, C.; Bigot, V.; Brázdil, R.; Pereira, S.; Kahraman, A.; Kiliç, Ö.; Kotroni, V.; Llasat, M.C.; et al. Flood fatalities in Europe, 1980–2018: Variability, features, and lessons to learn. Water 2019, 11, 1682. [Google Scholar] [CrossRef]
- Špitalar, M.; Brilly, M.; Kos, D.; Žiberna, A. Analysis of flood fatalities—Slovenian illustration. Water 2020, 12, 64. [Google Scholar] [CrossRef]
- Petrucci, O. Review article: Factors leading to the occurrence of flood fatalities: A systematic review of research papers published between 2010 and 2020. Nat. Hazards Earth Syst. Sci. 2022, 22, 71–83. [Google Scholar] [CrossRef]
- Diakakis, M.; Papagiannaki, K.; Fouskaris, M. The occurrence of catastrophic multiple-fatality flash floods in the Eastern Mediterranean region. Water 2023, 15, 119. [Google Scholar] [CrossRef]
- Hilker, N.; Badoux, A.; Hegg, C. The Swiss flood and landslide damage database 1972–2007. Nat. Hazards Earth Syst. Sci. 2009, 9, 913–925. [Google Scholar] [CrossRef]
- Salvati, P.; Petrucci, O.; Rossi, M.; Bianchi, C.; Pasqua, A.A.; Guzzetti, F. Gender, age and circumstances analysis of flood and landslide fatalities in Italy. Sci. Total Environ. 2018, 610–611, 867–879. [Google Scholar] [CrossRef]
- Petrucci, O. Landslide fatality occurrence: A systematic review of research published between January 2010 and March 2022. Sustainability 2022, 14, 9346. [Google Scholar] [CrossRef]
- Petrucci, O.; Papagiannaki, K.; Aceto, L.; Boissier, L.; Kotroni, V.; Grimalt, M.; Llasat, M.C.; Llasat-Botija, M.; Rosselló, J.; Pasqua, A.A.; et al. MEFF: The database of MEditerranean Flood Fatalities (1980 to 2015). J. Flood Risk Manag. 2019, 12, e12461. [Google Scholar] [CrossRef]
- Papagiannaki, K.; Petrucci, O.; Diakakis, M.; Kotroni, V.; Aceto, L.; Bianchi, C.; Brázdil, R.; Grimalt Gelabert, M.; Inbar, M.; Kahraman, A.; et al. Developing a large-scale dataset of flood fatalities for territories in the Euro-Mediterranean region, FFEM-DB. Sci. Data 2022, 9, 166. [Google Scholar] [CrossRef] [PubMed]
- Paprotny, D.; Morales-Nápoles, O.; Jonkman, S.N. HANZE: A pan-European database of exposure to natural hazards and damaging historical floods since 1870. Earth Syst. Sci. Data 2018, 10, 565–581. [Google Scholar] [CrossRef]
- Výberči, D.; Švec, M.; Faško, P.; Savinova, H.; Trizna, M.; Mičietova, E. The effects of the 1996–2012 summer heat events on human mortality in Slovakia. Morav. Geogr. Rep. 2015, 23, 58–70. [Google Scholar] [CrossRef]
- Graczyk, D.; Kundzewicz, Z.W.; Choryński, A.; Førland, E.J.; Pińskwar, I.; Szwed, M. Heat-related mortality during hot summers in Polish cities. Theor. Appl. Climatol. 2019, 136, 1259–1273. [Google Scholar] [CrossRef]
- Park, J.; Choi, Y.; Chae, Y. Heatwave impacts on traffic accidents by time-of-day and age of casualties in five urban areas in South Korea. Urban Clim. 2021, 39, 100917. [Google Scholar] [CrossRef]
- Vicedo-Cabrera, A.M.; Scovronick, N.; Sera, F.; Royé, D.; Schneider, R.; Tobias, A.; Astrom, C.; Guo, Y.; Honda, Y.; Hondula, D.M.; et al. The burden of heat-related mortality attributable to recent human-induced climate change. Nat. Clim. Chang. 2021, 11, 492–500. [Google Scholar] [CrossRef]
- Analitis, A.; Katsouyanni, K.; Biggeri, A.; Baccini, M.; Forsberg, B.; Bisanti, L.; Kirchmayer, U.; Ballester, F.; Cadum, E.; Goodman, P.G.; et al. Effects of cold weather on mortality: Results from 15 European cities within the PHEWE Project. Am. J. Epidemiol. 2008, 168, 1397–1408. [Google Scholar] [CrossRef]
- Fonseca-Rodríguez, O.; Sheridan, S.C.; Lundevaller, E.H.; Schumann, B. Effect of extreme hot and cold weather on cause-specific hospitalizations in Sweden: A time series analysis. Environ. Res. 2021, 193, 110535. [Google Scholar] [CrossRef]
- Petkova, E.P.; Dimitrova, L.K.; Sera, F.; Gasparrini, A. Mortality attributable to heat and cold among the elderly in Sofia, Bulgaria. Int. J. Biometeorol. 2021, 65, 865–872. [Google Scholar] [CrossRef]
- Elsom, D.M. Deaths and injuries caused by lightning in the United Kingdom: Analyses of two databases. Atmos. Res. 2001, 56, 325–334. [Google Scholar] [CrossRef]
- Elsom, D.M.; Webb, J.D.C. Deaths and injuries from lightning in the UK, 1988–2012. Weather 2014, 69, 221–226. [Google Scholar] [CrossRef]
- Singh, O.; Singh, J. Lightning fatalities over India: 1979–2011. Meteorol. Appl. 2015, 22, 770–778. [Google Scholar] [CrossRef]
- Antonescu, B.; Cărbunaru, F. Lightning-related fatalities in Romania from 1999 to 2015. Weather Clim. Soc. 2018, 10, 241–252. [Google Scholar] [CrossRef]
- Taszarek, M.; Gromadzki, J. Deadly tornadoes in Poland from 1820 to 2015. Mon. Weather Rev. 2017, 145, 1221–1243. [Google Scholar] [CrossRef]
- Salvador, C.; Nieto, R.; Linares, C.; Díaz, J.; Gimeno, L. Short-term effects of drought on daily mortality in Spain from 2000 to 2009. Environ. Res. 2020, 183, 109200. [Google Scholar] [CrossRef]
- Kyselý, J.; Plavcová, E. Declining impacts of hot spells on mortality in the Czech Republic, 1986–2009: Adaptation to climate change? Clim. Chang. 2012, 113, 437–453. [Google Scholar] [CrossRef]
- Hanzlíková, H.; Plavcová, E.; Kynčl, J.; Kříž, B.; Kyselý, J. Contrasting patterns of hot spell effects on morbidity and mortality for cardiovascular diseases in the Czech Republic, 1994–2009. Int. J. Biometeorol. 2015, 59, 1673–1684. [Google Scholar] [CrossRef]
- Arsenović, D.; Lehnert, M.; Fiedor, D.; Šimáček, P.; Středová, H.; Středa, T.; Savić, S. Heat-waves and mortality in Czech cities: A case study for the summers of 2015 and 2016. Geogr. Pannonica 2019, 23, 162–172. [Google Scholar] [CrossRef]
- Urban, A.; Fonseca-Rodríguez, O.; Di Napoli, C.; Plavcová, E. Temporal changes of heat-attributable mortality in Prague, Czech Republic, over 1982–2019. Urban. Clim. 2022, 44, 101197. [Google Scholar] [CrossRef]
- Kyselý, J.; Pokorná, L.; Kyncl, J.; Kříž, B. Excess cardiovascular mortality associated with cold spells in the Czech Republic. BMC Public Health 2009, 9, 1–11. [Google Scholar] [CrossRef] [PubMed]
- Plavcová, E.; Urban, A. Intensified impacts on mortality due to compound winter extremes in the Czech Republic. Sci. Total Environ. 2020, 746, 141033. [Google Scholar] [CrossRef] [PubMed]
- Brázdil, R.; Chromá, K.; Řehoř, J.; Zahradníček, P.; Dolák, L.; Řezníčková, L.; Dobrovolný, P. Potential of documentary evidence to study fatalities of hydrological and meteorological events in the Czech Republic. Water 2019, 11, 2014. [Google Scholar] [CrossRef]
- Brázdil, R.; Chromá, K.; Dolák, L.; Řehoř, J.; Řezníčková, L.; Zahradníček, P.; Dobrovolný, P. Fatalities associated with the severe weather conditions in the Czech Republic, 2000–2019. Nat. Hazards Earth Syst. Sci. 2021, 21, 1355–1382. [Google Scholar] [CrossRef]
- Brázdil, R.; Chromá, K.; Zahradníček, P.; Dobrovolný, P.; Dolák, L. Weather and traffic accidents in the Czech Republic, 1979–2020. Theor. Appl. Climatol. 2022, 149, 153–167. [Google Scholar] [CrossRef]
- Tolasz, R.; Míková, T.; Valeriánová, A.; Voženílek, V. Atlas Podnebí Česka (Climate Atlas of Czechia); Český Hydrometeorologický ústav, Univerzita Palackého v Olomouci: Praha, Czech Republic, 2007. [Google Scholar]
- Brázdil, R.; Bělínová, M.; Dobrovolný, P.; Mikšovský, J.; Pišoft, P.; Řezníčková, L.; Štěpánek, P.; Valášek, H.; Zahradníček, P. Temperature and Precipitation Fluctuations in the Czech Lands During the Instrumental Period; Masaryk University: Brno, Czech Republic, 2012. [Google Scholar]
- Český Statistický Úřad, Veřejná Databáze (Czech Statistical Office, Public Database). Available online: https://vdb.czso.cz/vdbvo2/faces/en/index.jsf (accessed on 3 April 2023).
- Bor. Z černé kroniky, Dva chlapci utonuli (From Black Chronicle, Two Boys Drowned). Rudé Právo, 14 February 1975; p. 4.
- Mrazy zabily o víkendu šest lidí (Frosts killed six people during the weekend). Právo, 25 January 2010; p. 1.
- Pamětní kniha obce Karlovice (The Memorial Book of the Karlovice Village). Available online: http://karlovice-sedmihorky.cz/Oobci/Kronika/1941-50.htm#1941 (accessed on 22 September 2022).
- Obec Radotín, Kronika 1961–1981 (The Radotín Village, The Chronicle 1961–1981). Available online: https://www.obecradotin.cz/kronika-1961-1981 (accessed on 15 September 2022).
- Český hydrometeorologický ústav, pobočka Hradec Králové. Klimatologický výkaz stanice Polička, září 1934 (Czech Hydrometeorological Institute, Hradec Králové. Climatological sheet of the Polička station, September 1934). Unpublished work.
- Český hydrometeorologický ústav, pobočka Ostrava. Klimatologický výkaz stanice Nový Jičín, srpen 1958 (Czech Hydrometeorological Institute, Ostrava. Climatological sheet of the Nový Jičín station, August 1958). Unpublished work.
- Společná česko-slovenská digitální parlamentní knihovna (Joint Czech and Slovak Digital Parliamentary Library). Available online: http://www.psp.cz/eknih/ (accessed on 10 April 2022).
- Národní shromáždění československé/Poslanecká sněmovna 1925–1929, tisk 1028 (Czechoslovak National Assembly/Chamber of deputies 1925–1929, Print 1028). Available online: https://www.psp.cz/eknih/1925ns/ps/tisky/t1028_00.htm (accessed on 25 April 2022).
- Polách, D.; Gába, Z. Historie povodní na šumperském a jesenickém okrese (History of floods in the Šumperk and Jeseník districts). Sev. Morava 1998, 75, 3–30. [Google Scholar]
- Památník obětem hor (Monument to Victims of Mountains). Available online: https://www.krkonose.eu/pamatnik-obetem-hor (accessed on 14 December 2022).
- Památník obětem hor na Červenohorském sedle. Jména v památníku. (Monument to Victims of Mountains at the Červenohorské Sedlo. Names on the monument). Available online: https://www.pamatnik-obetem-hor.com/plakety-v-pamatniku2/ (accessed on 16 December 2022).
- Památník čtyř žen usmrcených bleskem severně od Záluží (Memorial of Four Women Killed by Lightning North of Záluží). Available online: https://www.drobnepamatky.cz/node/5697 (accessed on 18 January 2023).
- Jizerskohorské pomníčky. Seznam pomníčků (Memorials of the Jizerské hory Mts. List of Memorials). Available online: http://jizerpom.wz.cz/ (accessed on 17 June 2022).
- Letecká badatelna (Air research). Available online: http://www.leteckabadatelna.cz/havarie-a-sestrely (accessed on 11 November 2022).
- Letecké nehody vojenských strojů České a Československé republiky (Air Crashes of Military Planes of the Czech and Czechoslovak Republics). Available online: https://cs.wikipedia.org/wiki/Letecké_nehody_vojenských_strojů_České_a_Československé_republiky (accessed on 11 November 2022).
- Seznam železničních nehod v Česku (List of Czech train accidents). Available online: https://cs.wikipedia.org/wiki/Seznam_železničních_nehod_v_Česku (accessed on 10 October 2022).
- Sen, P.K. Estimates of the regression coefficient based on Kendall’s tau. J. Am. Stat. Assoc. 1968, 63, 1379–1389. [Google Scholar] [CrossRef]
- Theil, H. A rank-invariant method of linear and polynomial regression analysis. In Henri Theil’s Contributions to Economics and Econometrics; Advanced Studies in Theoretical and Applied Econometrics 23; Raj, B., Koerts, J., Eds.; Springer: Dordrecht, The Netherlands, 1992; pp. 345–381. [Google Scholar] [CrossRef]
- Mann, H.B. Non-parametric tests against trend. Econometrica 1945, 13, 163–171. [Google Scholar] [CrossRef]
- Kendall, M.G. Rank Correlation Methods, 4th ed.; Charles Griffin: London, UK, 1975. [Google Scholar]
- Matějíček, J.; Hladný, J. Povodňová katastrofa 20. století na území České republiky (Flood Disaster of the 20th Century on the Territory of the Czech Republic); Ministerstvo Životního Prostředí České Republiky: Praha, Czech Republic, 1999.
- Hladný, J.; Krátká, M.; Kašpárek, L. August 2002 Catastrophic Flood in the Czech Republic; Ministry of the Environment of the Czech Republic: Prague, Czech Republic, 2004.
- Daňhelka, J.; Kubát, J. Flash Floods in the Czech Republic in June and July 2009; Ministry of the Environment of the Czech Republic, Czech Hydrometeorological Institute: Prague, Czech Republic, 2009.
- Daňhelka, J.; Kubát, J.; Šercl, P. Povodně v České republice v roce 2010 (Floods in the Czech Republic in 2010); Český Hydrometeorologický Ústav: Praha, Czech Republic, 2012.
- Daňhelka, J.; Kubát, J.; Šercl, P.; Čekal, R. Floods in the Czech Republic in June 2013; Czech Hydrometeorological Institute: Prague, Czech Republic, 2014.
- Hostýnek, J.; Novák, M.; Žák, M. Kyrill a Emma v Česku—Meteorologické příčiny, průběh bouří s hodnocením větrných extrémů (The Kyrill and Emma storms in Czechia—Meteorological causes and the course of the storms, with evaluation of wind extremes). Meteorol. Zpr. 2008, 61, 65–71. [Google Scholar]
- Hujslová, J.; Šimandl, P. Bouře Herwart v Česku (The storm Herwart in Czechia). Meteorol. Zpr. 2018, 71, 60–63. [Google Scholar]
- Brázdil, R.; Stucki, P.; Szabó, M.; Řezníčková, L.; Dolák, L.; Dobrovolný, P.; Tolasz, R.; Kotyza, O.; Chromá, K.; Suchánková, S. Windstorms and forest disturbances in the Czech Lands: 1801–2015. Agric. Forest Meteorol. 2018, 250–251, 47–63. [Google Scholar] [CrossRef]
- Krška, K. Zima 1928/29 v Česku se zřetelem k povaze extrémů a dobové literatuře (Winter 1928/29 in Czechia with respect to the nature of extremes and the period literature). Meteorol. Zpr. 2009, 62, 5–9. [Google Scholar]
- Jsou to jatka, volali zdravotníci. Pád letadla v Suchdole nepřežily desítky lidí (It is Carnage, Declared the Paramedics. Dozens of People Were Killed in a Plane Crash in Suchdol). Available online: https://zdarsky.denik.cz/zpravy-z-ceska/havarie-letadla-v-suchdole.html (accessed on 31 May 2022).
- V Újezdu u Brna odhalili pomník jedné z nejhorších leteckých katastrof (The Memorial to One of the Largest Plane Disasters Was Unveiled at Újezd u Brna). Available online: https://ct24.ceskatelevize.cz/archiv/1095541-v-ujezdu-u-brna-odhalili-pomnik-jedne-z-nejhorsich-leteckych-katastrof (accessed on 30 June 2022).
- Letecká badatelna. D-47A, Vřesovice okr. Hodonín, 30.11.1952 (Air research. D-47A, Vřesovice, the Hodonín district, 30 November 1952). Available online: http://www.leteckabadatelna.cz/havarie-a-sestrely/detail/276/ (accessed on 18 November 2022).
- Z černé kroniky, Spadlá zeď usmrtila tři chlapce (From black chronicle, Collapsed wall killed three boys). Rudé Právo, 7 July 1969; p. 2.
- Ob. Prázdninová tragédie (Holiday tragedy). Svobodné Slovo, 7 July 1969; p. 2.
- Čtk. Zahynuli ve stanu (Lost their lives in a tent). Lidová Demokracie, 7 July 1969; p. 3.
- Llasat, M.C.; Barnolas, M.; Ĺopez, L.; Altava-Ortiz, V. An analysis of the evolution of hydrometeorological extremes in newspapers: The case of Catalonia, 1982–2006. Nat. Hazards Earth Syst. Sci. 2009, 9, 1201–1212. [Google Scholar] [CrossRef]
- Zêzere, J.; Pereira, S.; Tavales, A.; Bateira, C.; Trigo, R.; Quaresma, I.; Santos, P.; Santos, M.; Verde, J. DISASTER: A GIS database on hydro-geomorphologic disasters in Portugal. Nat. Hazards 2014, 72, 503–532. [Google Scholar] [CrossRef]
- Vinet, F.; Boissier, L.; Saint-Martin, C. Flashflood-related mortality in southern France: First results from a new database. In 3rd European Conference on Flood Risk Management (FLOODrisk 2016). E3S Web Conf. 2016, 7, 06001. [Google Scholar] [CrossRef]
- Aceto, L.; Pasqua, A.A.; Petrucci, O. Effects of damaging hydrogeological events on people throughout 15 years in a Mediterranean region. Adv. Geosci. 2017, 44, 67–77. [Google Scholar] [CrossRef]
- Petrucci, O.; Salvati, P.; Aceto, L.; Bianchi, C.; Pasqua, A.A.; Rossi, M.; Guzzetti, F. The vulnerability of people to damaging hydrogeological events in the Calabria Region (Southern Italy). Int. J. Environ. Res. Public Health 2018, 15, 48. [Google Scholar] [CrossRef]
- Grimalt-Gelabert, M.; Rosselló-Geli, J.; Bauzà-Llinàs, J. Flood related mortality in a touristic island: Mallorca (Balearic Islands) 1960–2018. J. Flood Risk Manag. 2020, 13, e12644. [Google Scholar] [CrossRef]
- Bláhová, A. Časoprostorová variabilita hydrometeorologických extrémů v ČR na základě novinových článků, 1941–1960 (Spatiotemporal Variability of Hydrometeorological Extremes in the Czech Republic Based on Newspaper Articles, 1941–1960). Master’s Thesis, Masarykova Univerzita, Brno, Czech Republic, 2021. [Google Scholar]
- Opatřil, M. Analýza hydrometeorologických extrémů na území ČR na základě novinových článků, 1921–1940 (Analysis of Hydrometeorological Extremes in the Czech Republic Area Based on Newspaper Articles, 1921–1940). Master’s Thesis, Masarykova Univerzita, Brno, Czech Republic, 2023. [Google Scholar]
- Badoux, A.; Andres, N.; Techel, F.; Hegg, C. Natural hazard fatalities in Switzerland from 1946 to 2015. Nat. Hazards Earth Syst. Sci. 2016, 16, 2747–2768. [Google Scholar] [CrossRef]
- Sálusová, D.; Zavázal, P.; Kovář, J.; Makovičková, J.; Nováková, H.; Švec, J. České zemědělství očima statistiky (Czech Agriculture from View of Statistics); Český Statistický Úřad: Praha, Czech Republic, 2003.
- Holle, R.L. A summary of recent national-scale lightning fatality studies. Weather Clim. Soc. 2016, 8, 35–42. [Google Scholar] [CrossRef]
- Brázdil, R.; Zahradníček, P.; Chromá, K.; Dobrovolný, P.; Dolák, L.; Řehoř, J.; Zahradník, P. Severity of winters in the Czech Republic during the 1961–2021 period and related environmental impacts and responses. Int. J. Climatol. 2023, 43, 2820–2842. [Google Scholar] [CrossRef]
- Sharma, S.; Blagrave, K.; Watson, S.R.; O’Reilly, C.M.; Batt, R.; Magnuson, J.J.; Clemens, T.; Denfeld, B.A.; Flaim, G.; Hori, Y.; et al. Increased winter drownings in ice-covered regions with warmer winters. PLoS ONE 2020, 15, e0241222. [Google Scholar] [CrossRef] [PubMed]
- Zahradníček, P.; Brázdil, R.; Štěpánek, P.; Trnka, M. Reflections of global warming in trends of temperature characteristics in the Czech Republic, 1961–2019. Int. J. Climatol. 2021, 41, 1211–1229. [Google Scholar] [CrossRef]
- Zahradníček, P.; Brázdil, R.; Řehoř, J.; Lhotka, O.; Dobrovolný, P.; Štěpánek, P.; Trnka, M. Temperature extremes and circulation types in the Czech Republic, 1961–2020. Int. J. Climatol. 2022, 42, 4808–4829. [Google Scholar] [CrossRef]
- Brázdil, R.; Řezníčková, L.; Havlíček, M.; Elleder, L. Floods in the Czech Republic. In Changes in Flood Risk in Europe; IAHS Special Publication 10; Kundzewicz, Z.W., Ed.; IAHS Press and CRC Press/Balkema: Wallingford, UK, 2012; pp. 178–198. [Google Scholar] [CrossRef]
- Blöschl, G.; Kiss, A.; Viglione, A.; Barriendos, M.; Böhm, O.; Brázdil, R.; Coeur, D.; Demarée, G.; Carmen Llasat, M.; Macdonald, N.; et al. Current European flood-rich period exceptional compared with past 500 years. Nature 2020, 583, 560–566. [Google Scholar] [CrossRef] [PubMed]
- Pereira, S.; Diakakis, M.; Deligiannakis, G.; Zêzere, J.L. Comparing flood mortality in Portugal and Greece (Western and Eastern Mediterranean). Int. J. Disaster Risk Reduct. 2017, 22, 147–157. [Google Scholar] [CrossRef]
- Han, Z.; Sharif, H.O. Analysis of flood fatalities in the United States, 1959–2019. Water 2021, 13, 1871. [Google Scholar] [CrossRef]
- Paprotny, D.; Sebastian, A.; Morales-Nápoles, O.; Jonkman, S.N. Trends in flood losses in Europe over the past 150 years. Nat. Commun. 2018, 9, 1985. [Google Scholar] [CrossRef]
- Franzke, C.L.E.; Torelló i Sentelles, H. Risk of extreme high fatalities due to weather and climate hazards and its connection to large-scale climate variability. Clim. Chang. 2020, 162, 507–525. [Google Scholar] [CrossRef]
- Terti, G.; Ruin, I.; Anquetin, S.; Gourley, J.J. A situation-based analysis of flash flood fatalities in the United States. Bull Am. Meteorol. Soc. 2017, 98, 333–345. [Google Scholar] [CrossRef]
- Ahmadalipour, A.; Moradkhani, H. A data-driven analysis of flash flood hazard, fatalities, and damages over the CONUS during 1996–2017. J. Hydrol. 2019, 578, 124106. [Google Scholar] [CrossRef]
- Vinet, F.; Cherel, J.-P.; Weiss, K.; Lewandowski, M.; Boissier, L. Flood related mortality in the French Mediterranean region (1980–2020). LHB Hydrosci. J. 2022, 108, 2097022. [Google Scholar] [CrossRef]
- Hadjij, I.; Sardou, M.; Missoum, H.; Maouche, S. Flood-related deaths in Northwestern Algeria from 1966 to 2019. Arab. J. Geosci. 2021, 14, 1923. [Google Scholar] [CrossRef]
- Diakakis, M.; Deligiannakis, G. Vehicle-related flood fatalities in Greece. Environ. Hazards 2013, 12, 278–290. [Google Scholar] [CrossRef]
- Enríquez-de-Salamanca, Á. Victims crossing overflowing watercourses with vehicles in Spain. J. Flood Risk Manag. 2020, 13, e12645. [Google Scholar] [CrossRef]


Disclaimer/Publisher’s Note: The statements, opinions and data contained in all publications are solely those of the individual author(s) and contributor(s) and not of MDPI and/or the editor(s). MDPI and/or the editor(s) disclaim responsibility for any injury to people or property resulting from any ideas, methods, instructions or products referred to in the content. |
© 2023 by the authors. Licensee MDPI, Basel, Switzerland. This article is an open access article distributed under the terms and conditions of the Creative Commons Attribution (CC BY) license (https://creativecommons.org/licenses/by/4.0/).
Share and Cite
Brázdil, R.; Chromá, K.; Dolák, L.; Zahradníček, P.; Řehoř, J.; Dobrovolný, P.; Řezníčková, L. The 100-Year Series of Weather-Related Fatalities in the Czech Republic: Interactions of Climate, Environment, and Society. Water 2023, 15, 1965. https://doi.org/10.3390/w15101965
Brázdil R, Chromá K, Dolák L, Zahradníček P, Řehoř J, Dobrovolný P, Řezníčková L. The 100-Year Series of Weather-Related Fatalities in the Czech Republic: Interactions of Climate, Environment, and Society. Water. 2023; 15(10):1965. https://doi.org/10.3390/w15101965
Chicago/Turabian StyleBrázdil, Rudolf, Kateřina Chromá, Lukáš Dolák, Pavel Zahradníček, Jan Řehoř, Petr Dobrovolný, and Ladislava Řezníčková. 2023. "The 100-Year Series of Weather-Related Fatalities in the Czech Republic: Interactions of Climate, Environment, and Society" Water 15, no. 10: 1965. https://doi.org/10.3390/w15101965