Article

An Assessment of the Impacts of Snowmelt Rate and Continuity Shifts on Streamflow Dynamics in Three Alpine Watersheds in the Western U.S.

School of Geography and Planning, Sun Yat-Sen University, Guangzhou 510275, China
*
Author to whom correspondence should be addressed.
Water 2022, 14(7), 1095; https://doi.org/10.3390/w14071095
Submission received: 25 February 2022 / Revised: 24 March 2022 / Accepted: 27 March 2022 / Published: 30 March 2022

Abstract

:
In semiarid to arid regions of the western U.S., river flow availability and variability are highly subject to shifts in snow accumulation and ablation in alpine watersheds. This study aims to examine how shifts in snowmelt rate (SMR) and snow continuity, an indicator of the consistent existence of snow on the ground, affect snow-driven streamflow dynamics in three alpine watersheds in the U.S. Great Basin. To achieve this end, the coupled hydro-ecological simulation system (CHESS) is used to simulate river flow dynamics, and multiple snow metrics are calculated to quantify the variation of SMR and snow continuity, the latter of which is measured by snow persistence (SP), snow residence time (SRT), and snow season length (SSL). Then, a new approach is proposed to partition streamflow into snow-driven and rain-driven streamflow. The statistical analyses indicate that the three alpine watersheds experienced a downward trend in SP, SRT, SSL, and SMR during the study period of 1990–2016 due to regional warming. As a result, the decrease in SMR and the decline in snow continuity shifted the occurrence day of 25% and 50% of the snow-driven cumulative discharge, as well as peak discharge, toward an earlier occurrence. Moreover, the magnitudes of snow-driven annual streamflow, summer baseflow, and peak discharge also decreased due to the declined snow continuity and the reduced SMR. Overall, by using multiple snow and flow metrics, and by partitioning streamflow into snow-driven and rain-driven flow via the newly proposed approach, we found that SMR and snow continuity determine the streamflow hydrographs and magnitudes in the three alpine watersheds. Given that warming can significantly affect snow dynamics in alpine watersheds in semiarid to arid regions, this has important implications for water resource management in the snow-dominated region when facing future climate warming.

1. Introduction

Water is an extremely valuable resource for aquatic and terrestrial ecosystems worldwide with powerful hydrologic mechanisms. Since arid and semiarid regions receive little precipitation, surface runoff in those areas is more sensitive to climate change and human activity due to their vulnerability caused by limited water resources [1]. In water-limited areas, such as the semiarid to arid regions of the western U.S., supplementary water resources are often stored as seasonal snow cover in winter and spring, indicating the importance of snow variations on streamflow hydrology. As a natural reservoir of water, snow-oriented water contributes to about 70% of alpine streamflow formation and anomalies [2,3,4]. In addition, montane snowpack in semiarid and arid regions serves as a buffer against a warming environment by depressing and homogenizing streamflow temperature across river networks [5], which shoulder the responsibility for freshwater provision and agricultural irrigation for downstream users, thus affecting the availability and effective utilization of water [6,7,8]. The magnitude and timing of basin-scale discharge is closely related to temporal variety of snowfall and snowmelt [9]. In terms of water demands of environmental and social factors such as crops, streamflow timing is as critical as the quantity of streamflow fed by snowpack [10].
Furthermore, as the key indicators of climate change, snow cover and snowmelt are sensitive to shifts in surface temperature and precipitation. A small temperature change can alter snow accumulation, especially in semiarid to arid regions where landscapes are relatively fragile [11,12,13]. Therefore, it is urgent to explore the impacts of snow variation on hydrological processes for the scientific basis of water resource management. The global climate is changing intensively due to increasing emissions of greenhouse gases and the subsequent effects on the hydrologic cycle [14,15]. Numerous studies have indicated that snowfall and snowmelt have experienced high inter-annual and spatial variation in the watersheds located in arid to semiarid regions influenced by global warming. For example, 56% of Colorado’s river basins in the western U.S. have recorded a below-average 1 April snow water equivalent (SWE) in 2010 compared to the multi-year average from 1981 to 2010, and this percentage raised to 69% in 2021 due to warmer temperatures [10]; www.nrcs.usda.gov, accessed on 18 August 2021. The snow extent and accumulation in the mountains of the western U.S. have fallen to unprecedented low levels in recent decades [16,17].
Similarly, shrinking glaciers and accelerating snowmelt have been observed in the Tianshan Mountains of China since the mid-19th century, and nearly 50% of their whole glacier volume is projected to disappear by the 2050s [18,19]. Air temperature perturbation was found to alter some snow processes, including higher sublimation losses of snowpack and more precipitation falling as the liquid–solid transition phase in the mountainous Copiapó River basin in northern Chile from 2001 to 2016 [20]. In addition, the reduction in precipitation arriving as snow, an earlier snowmelt, and a shorter frost duration (days ≤ 0 °C) have been documented at a regional scale in western North America [4,21,22]. Shrestha et al. indicated that enhanced wetness and warming will lead to an earlier maximum snow water equivalent (SWE) and declines in SWE both in subarctic northwestern Canada on the annual and monthly scales by the end of this century [23]. Snow accumulation and ablation are crucial processes affecting snow-driven streamflow dynamics, and snow cover loss alters the hydrograph, thus putting more pressure on the ecological environment, especially in semiarid to arid regions [24].
Many studies have witnessed a reduction in streamflow and attributed such a reduction of streamflow to the shrinkages of snow ranges and declining amounts of snowfall [1,25]. Barnhart et al. suggested that a decrease in snowmelt rate (SMR) due to warming determines streamflow [4]. However, Tang et al. indicated that the magnitude of annual streamflow in snow-dominated watershed depends largely on the amount of annual total precipitation [26]. Under the influence of rainfall, most existing studies relate snow dynamics to total streamflow instead of snow-driven streamflow and overlook the effects of rainfall on snow-driven streamflow, which might make it difficult to identify the temporal variation of runoff processes dominated by snowmelt. Another inadequacy is using a single or a few flow metrics to measure temporal dynamics of snow and streamflow in snowfall-fed watersheds.
To diminish the effect of rainfall on snowmelt streamflow, Burke and Kasahara classified quickflow into different types based on the input source as rain, snow and a rain–snow combination [5]. Julander and Clayton estimated the streamflow during the summer months in northern Utah to derive snow-related streamflow hydrology processes [27]. Zheng et al. separated Panchromatic Remote-Sensing Instrument for Stereo Mapping (PRISM) precipitation data into snowfall or rainfall based on PRISM temperature data and focused on the correlations between snow metrics and peak runoff [28]. Those studies ignore the temporal difference of rain-driven and snow-driven discharge, which may not provide a comprehensive understanding of the impacts of shifts in different aspects of snow on snow-driven streamflow in snow-dominated mountain watersheds.
Since the streamflow response in alpine catchments to shifts in the snow is a complicated and spatially heterogeneous process and runoff characteristics caused by rainfall and snowmelt are completely different, it is urgent to determine the contributions of different hydrological components (e.g., rain and snow) of streamflow and comprehensively explore and understand the complex responses of streamflow to shifts in different aspects of snow variation under the background of climate change [6,29].
To compensate for the potential inadequacy mentioned above, as well as to better understand the snow process changes and associated streamflow shifts, this study aims at utilizing multiple snow and streamflow metrics to clarify the influencing mechanism of snow continuity and melt rate on the timing and magnitude of streamflow in alpine watersheds in semiarid to arid regions (i.e., the Incline Creek watershed, the Twin River watershed, and the Cleve Creek watershed of the Great Basin) by excluding the effects of rainfall based on our streamflow partition method.
To this end, the following objectives are defined:
(1)
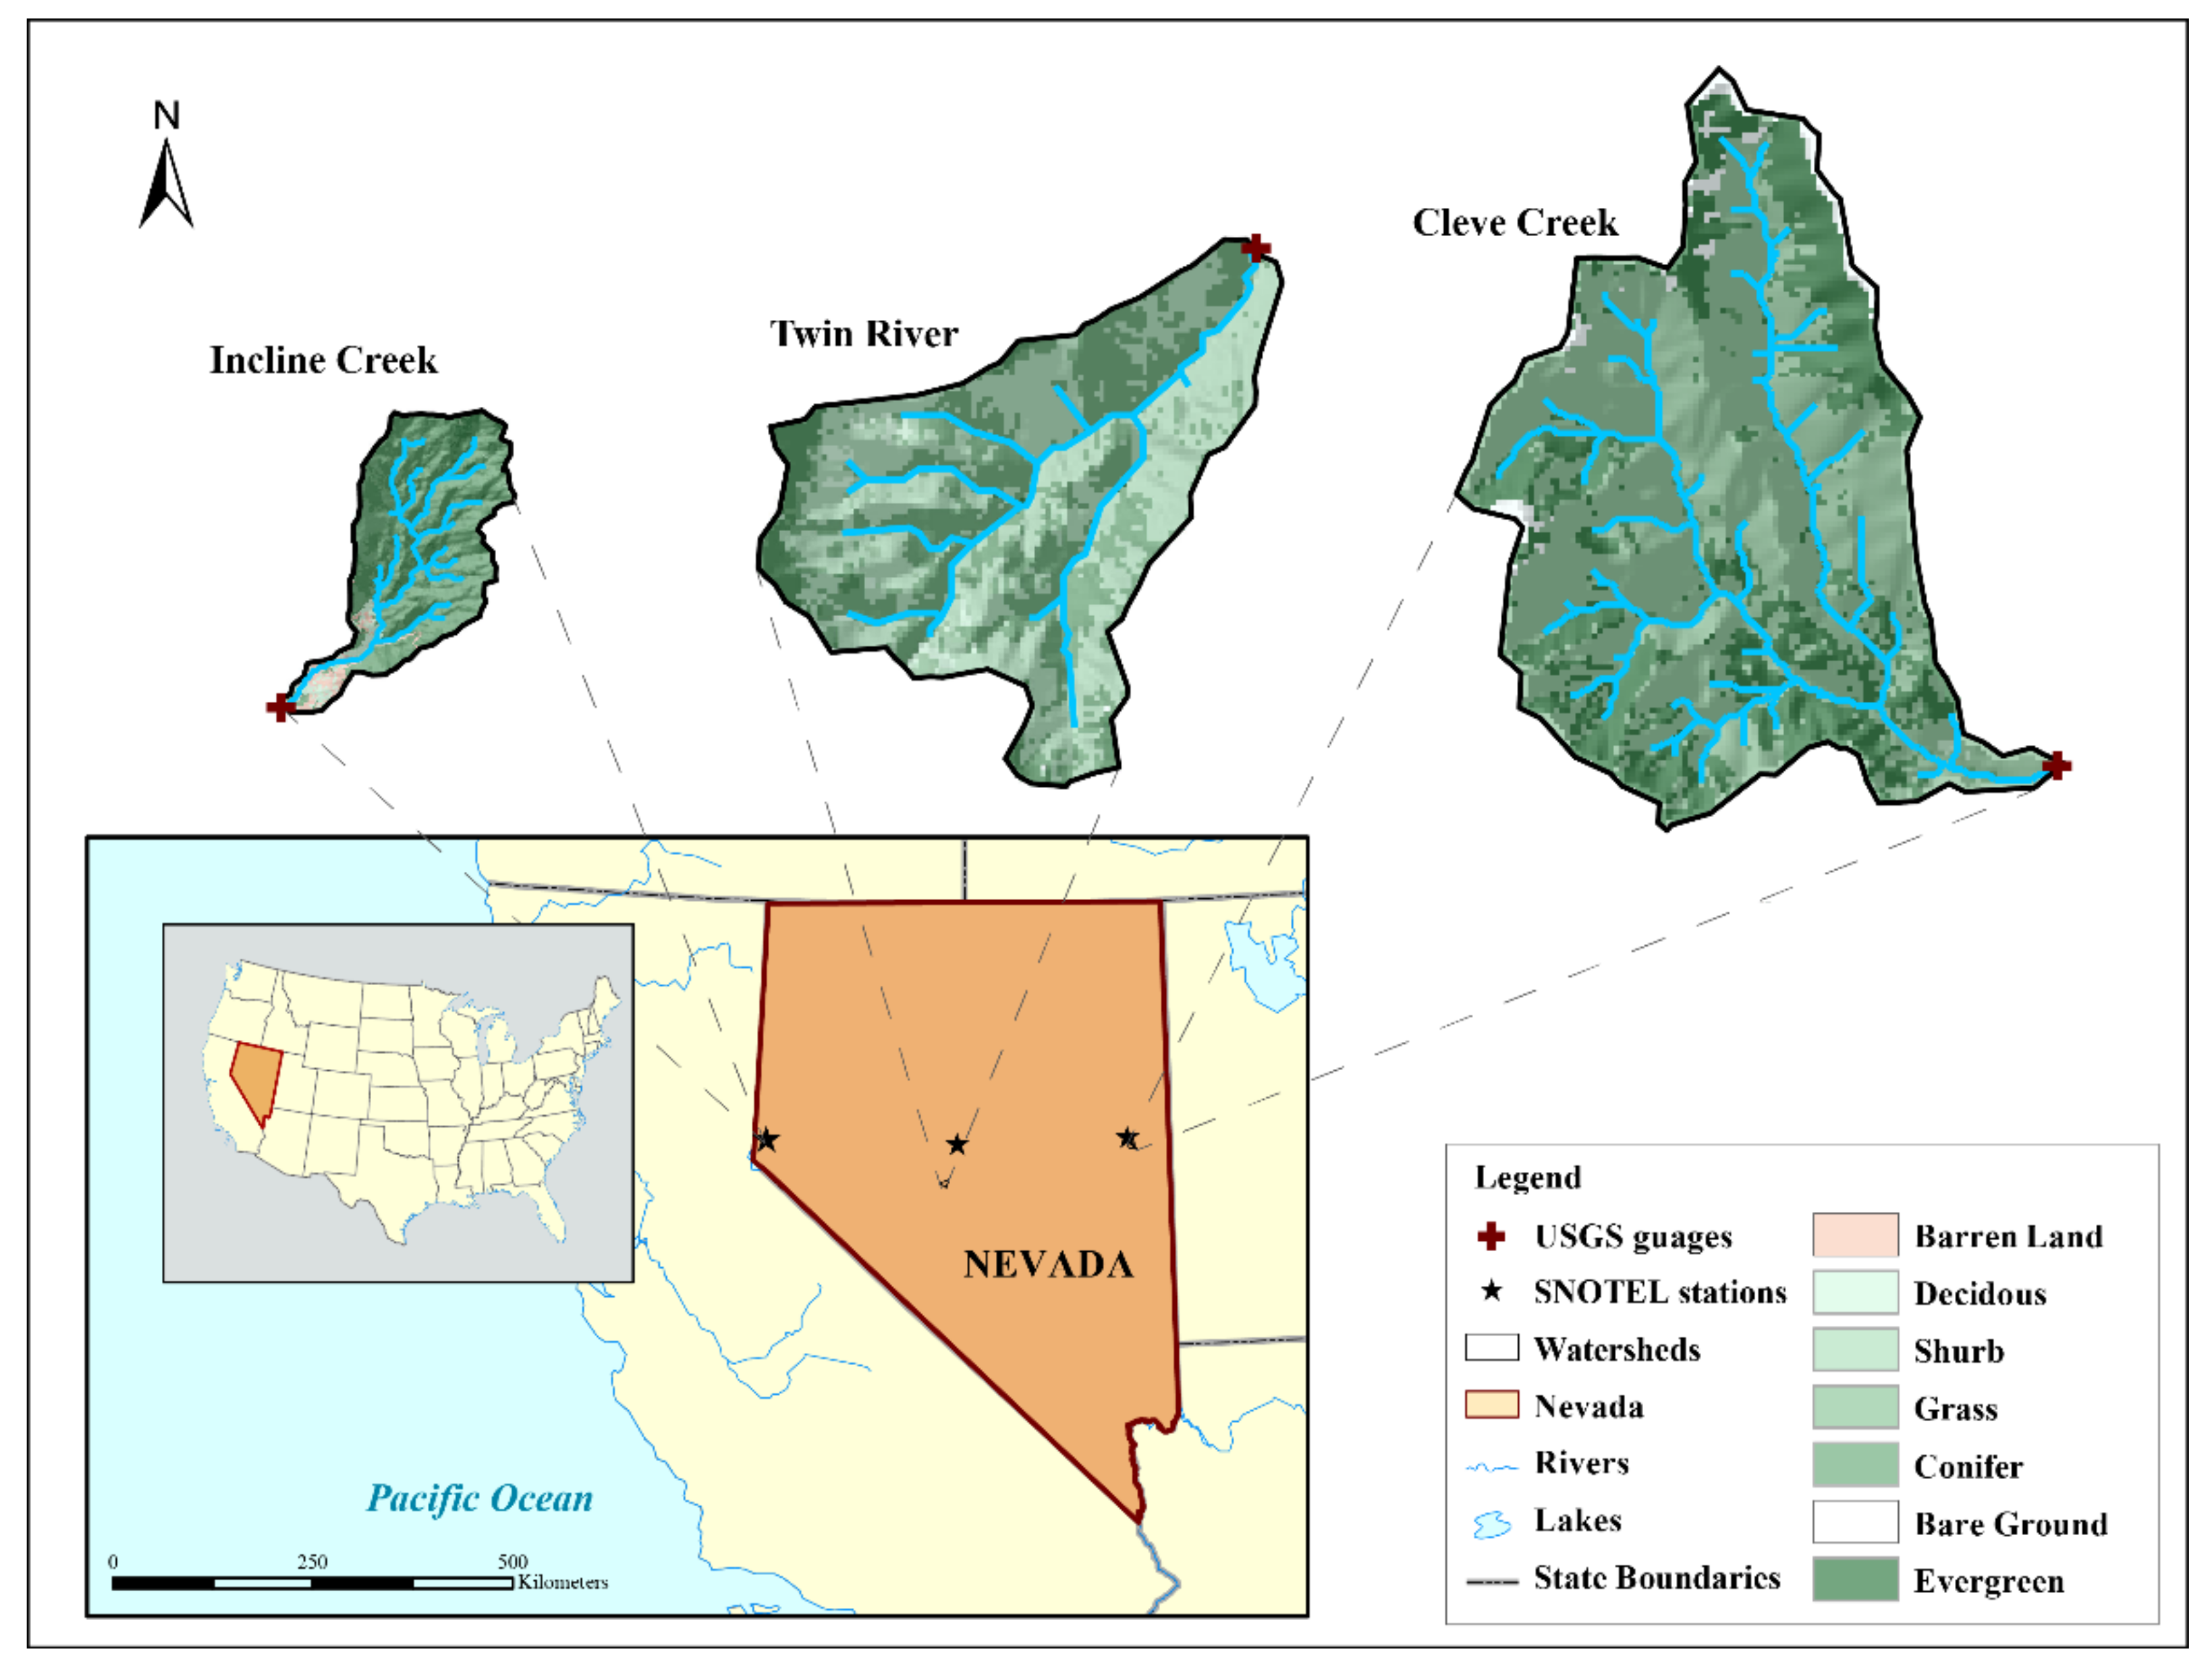
We implement the distributed ecohydrological model coupled hydro-ecological simulation system (CHESS) to examine daily shifts in snowfall and snow-driven streamflow in three alpine watersheds of the U.S. Great Basin.
(2)
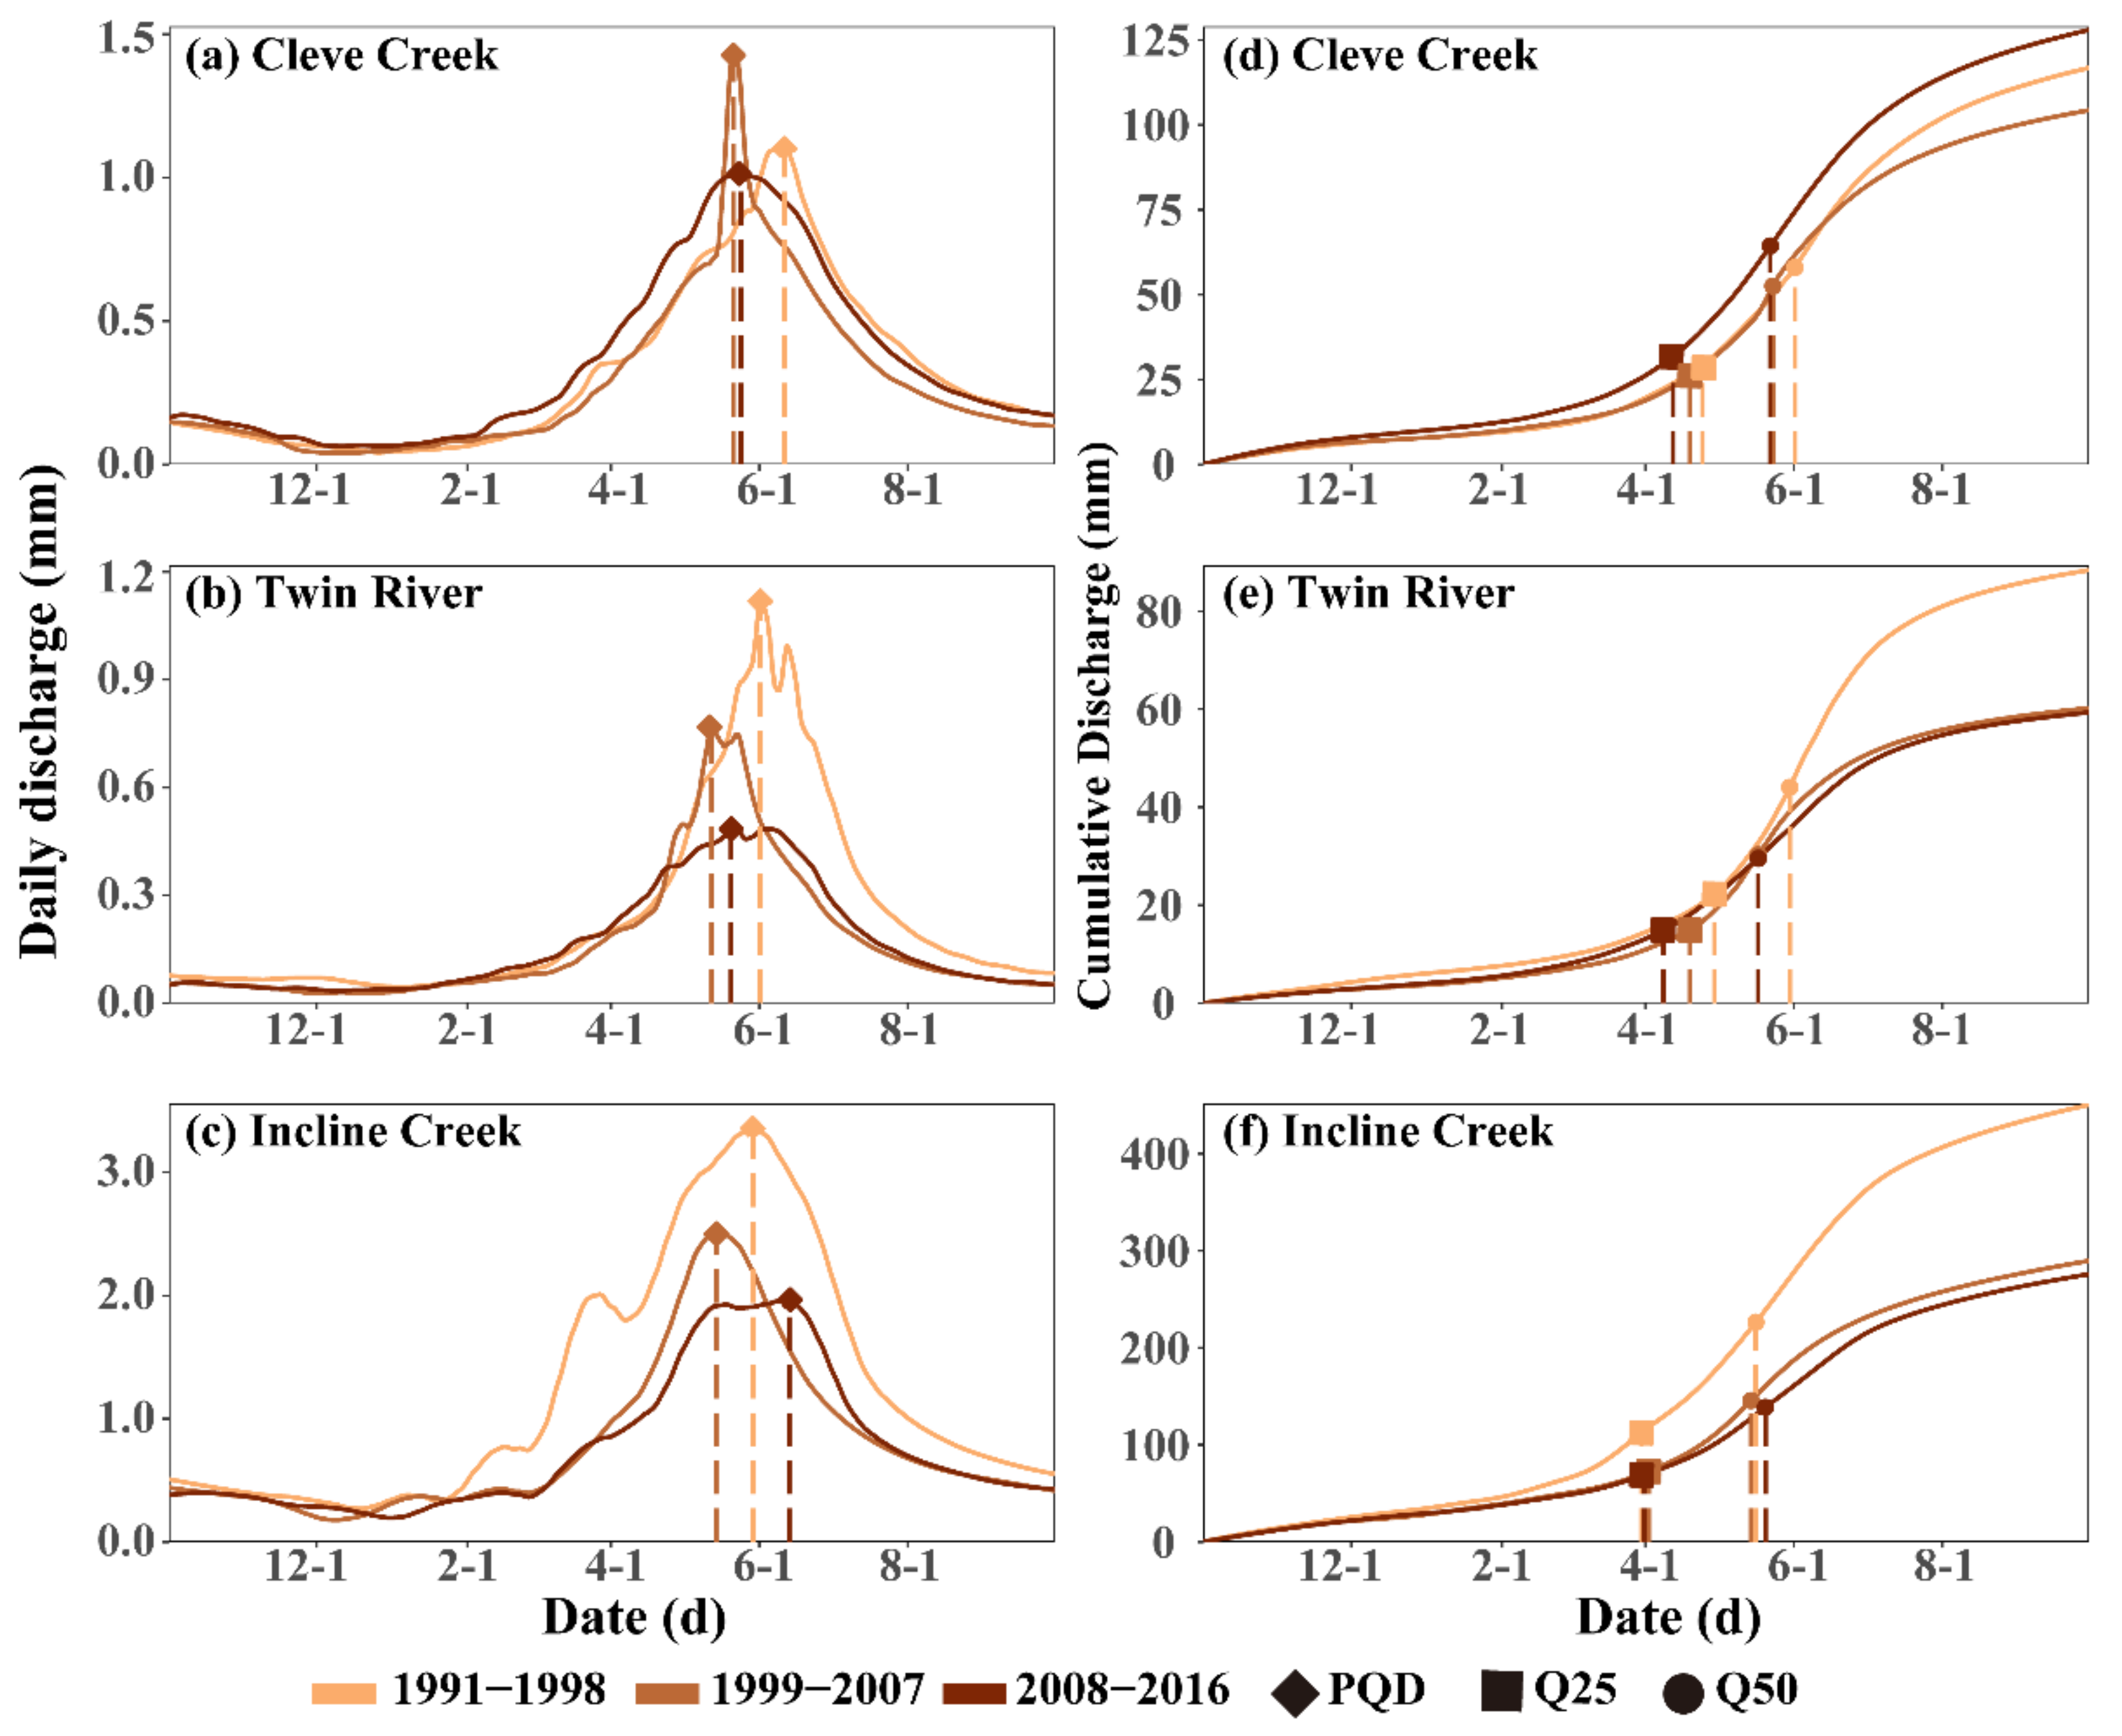
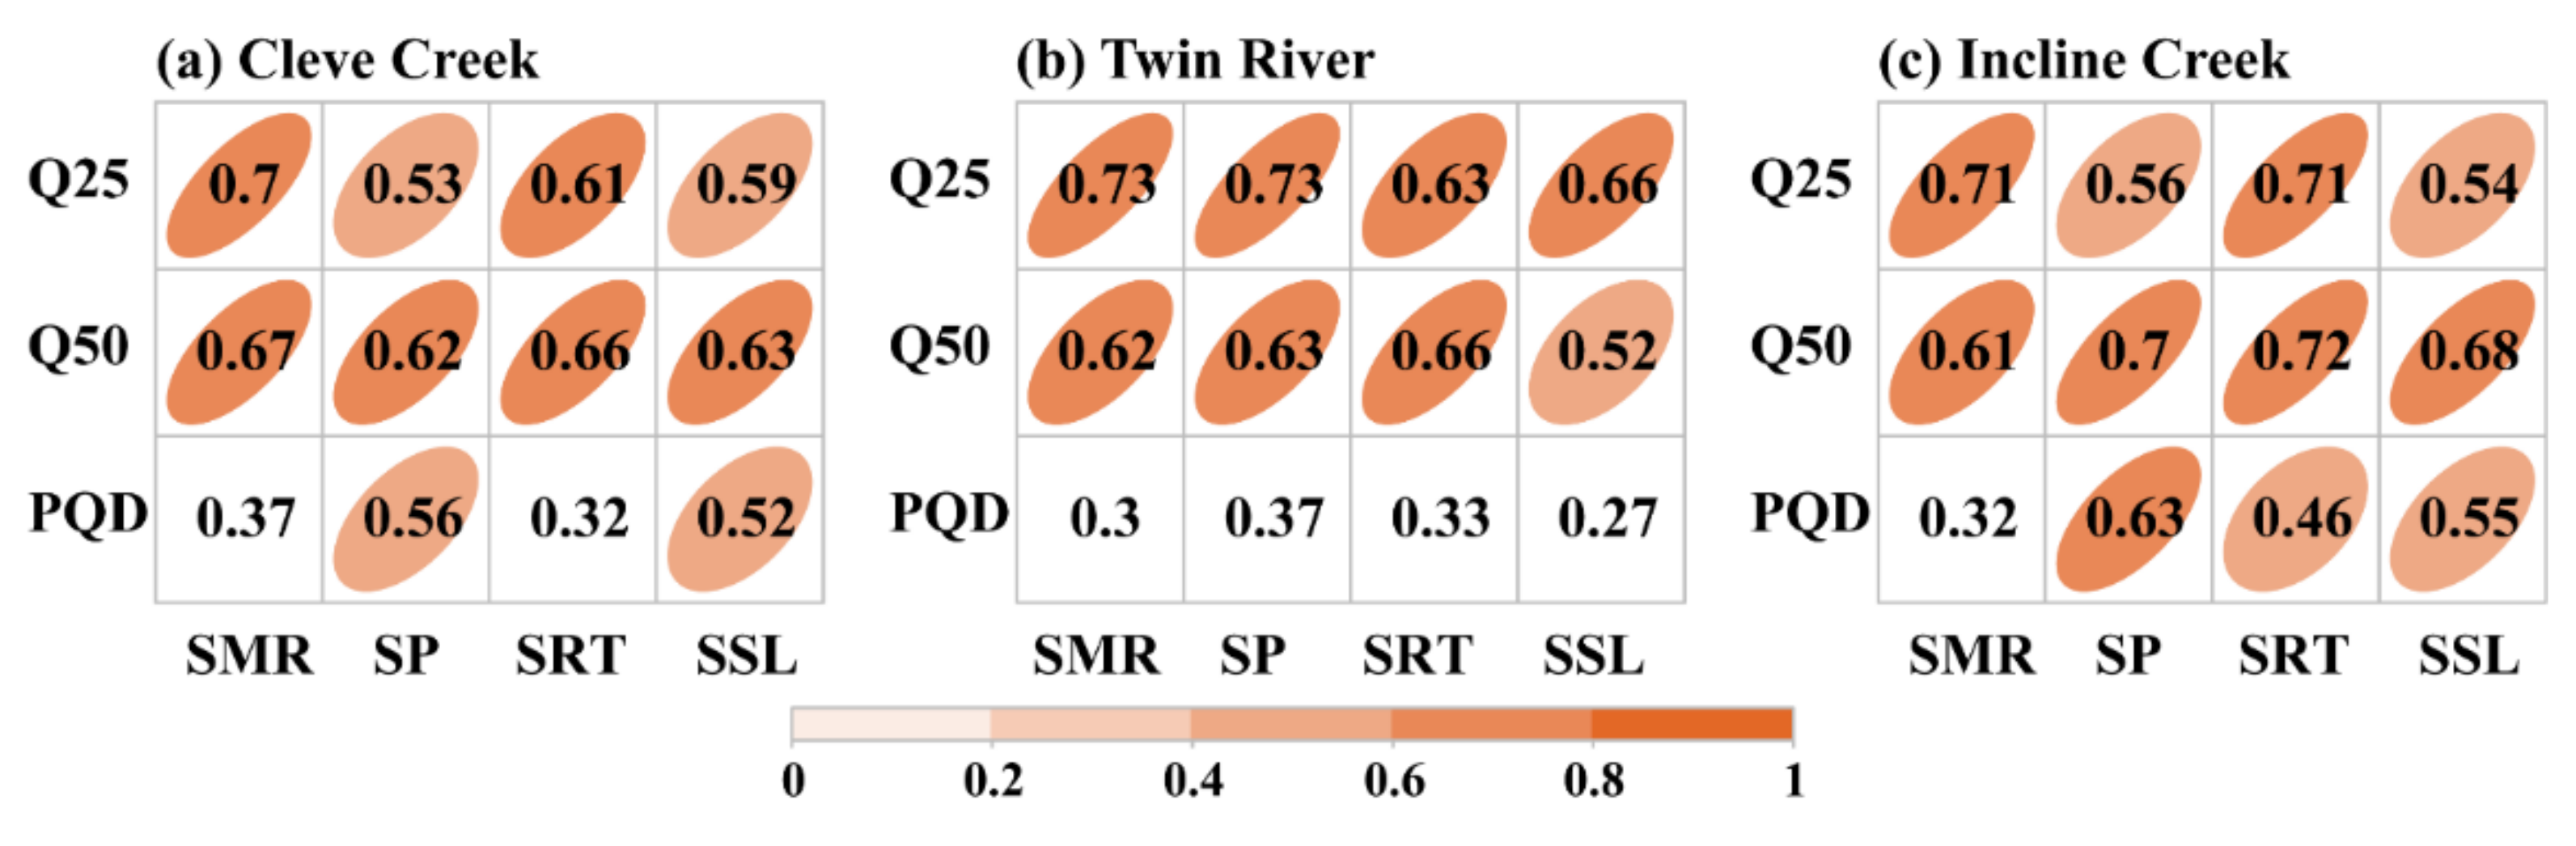
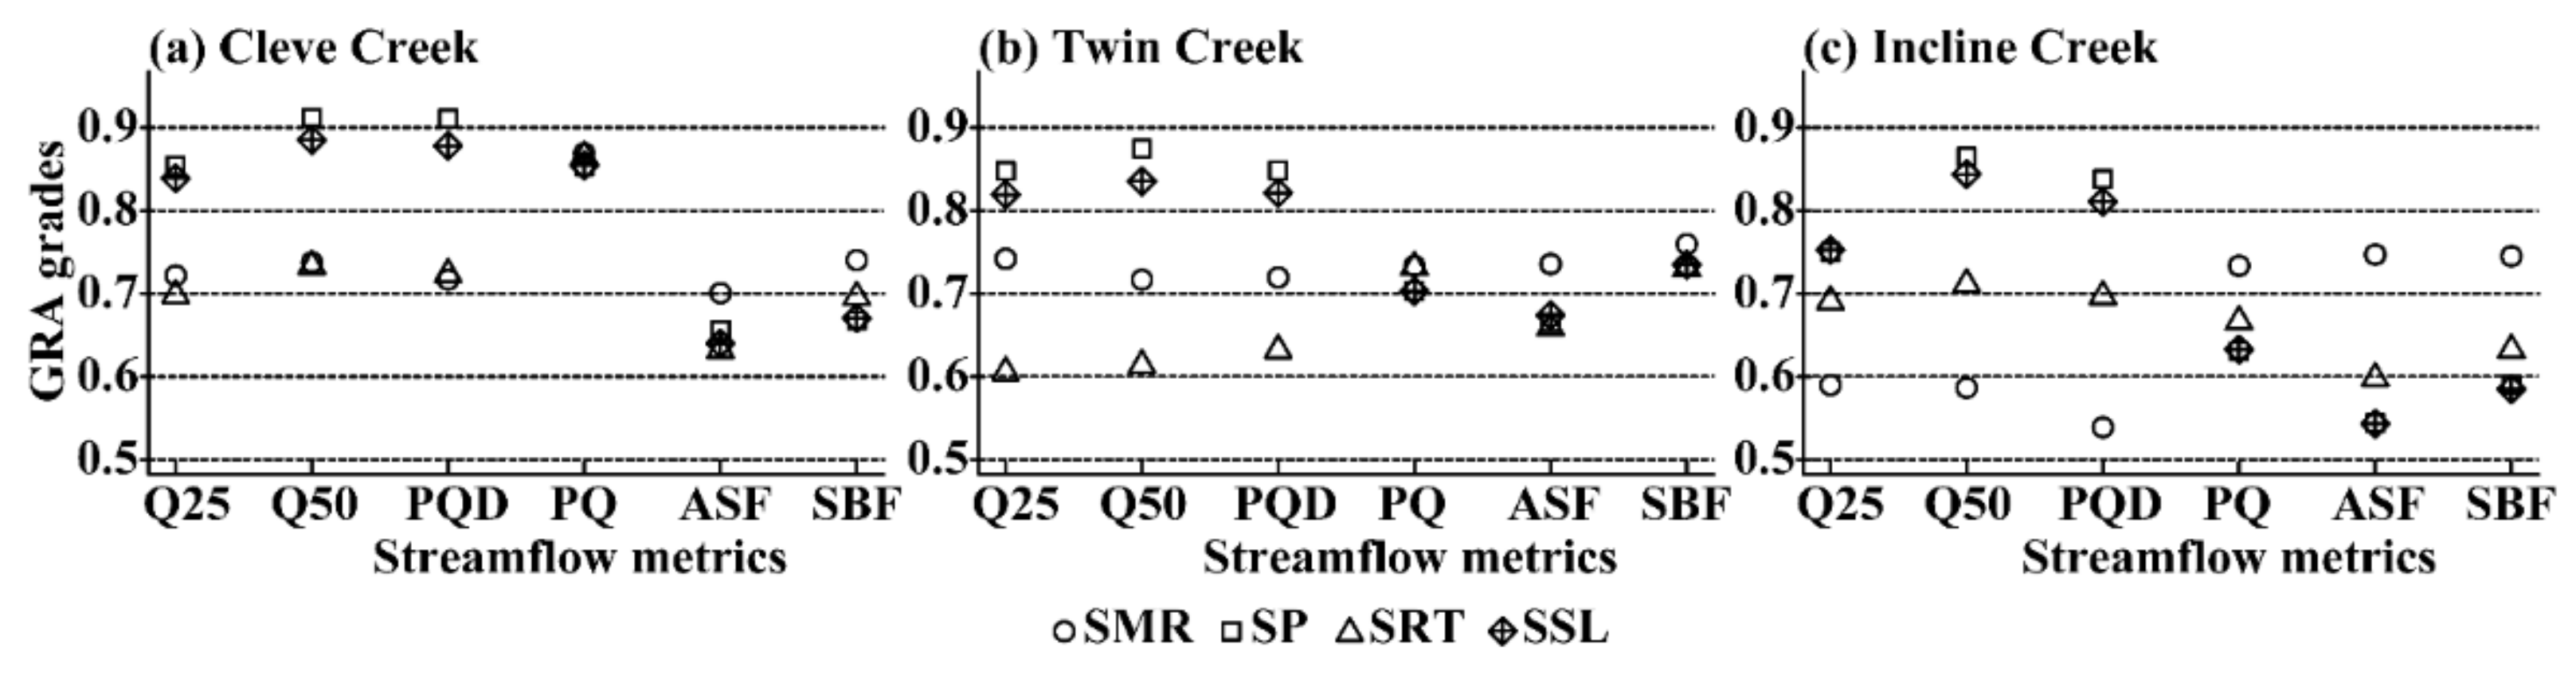
We quantify how the shifts in snow variation affect the magnitudes and timing of snow-driven streamflow. We used four snow metrics, snowmelt rate (SMR), snow persistence (SP), snow residence time (SRT), and snow season length (SSL), to measure the snowmelt and consistent existence of snow on the ground. For snow-driven streamflow, we used peak discharge (PQ), annual streamflow (ASF), and summer baseflow (SBF) to measure the shift of streamflow magnitudes. The timing of PQ, 25%, and 50% of annual cumulative streamflow are used to measure the streamflow timing. The use of multiple snow and flow metrics and the partition of streamflow into snow-driven and rain-driven flow helps to provide a comprehensive understanding of the effects of shifts in different aspects of snow variation on the streamflow hydrograph in snow-dominated mountain watersheds, thus increasing the certainty of analytical results.
(3)
We propose a new method that partitions streamflow into snow-driven and rain-driven streamflow to eliminate the effects of rainfall in understanding the snow-driven streamflow hydrology.
The results of the present study provide valuable information for runoff management in arid and semiarid regions, especially in those understudied watersheds. The identification of the extent to which the watershed responds to changes in snow regime can provide scientific underpinnings for sustainable and robust snow water management and allow relevant parties to enact the required ecosystem protection schemes [30,31]. Thus, correct snowfall and streamflow simulation and projection are extremely important to forecasting precise water resources [32].

2. Materials and Methods

2.1. Study Sites

This study focuses on three alpine watersheds—the Cleve Creek, Twin River, and Incline Creek watersheds—located at similar latitudes from east to west in the Great Basin of Nevada (Figure 1), which reflect the different rain shadow effects of the Sierra Nevada on the driest region in the western U.S. [33]. The climate in these watersheds belongs to a semiarid to arid climate, characterized by a hot and dry summer and cold and snowy winter. Like semiarid and arid climates in other climatic regions, the precipitation received in these alpine watersheds is predominantly snow in winter and spring [34]. Because annual potential evapotranspiration is often higher than total precipitation in semiarid and arid regions, streamflow in these watersheds is dominated by snow accumulation and melting processes in winter and spring at higher evaluations [16]. In addition, the semiarid regions of the world are often thought of as being particularly vulnerable to climate change; in addition, they are already climatically stressed with relatively high temperatures, low rainfall, and long dry seasons. This makes the hydrological process in these regions more sensitive to temperature change compared with regions featuring different climates. Lastly, the dominant flora in these watersheds consist of shrubs (e.g., sagebrush and rabbitbrush) and evergreen trees (e.g., Pinyon pine and Utah juniper), which are typical vegetation in the western U.S. [35]. The similarity in the land cover is valuable for minimizing the effects of the differences in land covers on the streamflow hydrograph, thus maximizing the common features of snow change effects on the streamflow hydrograph across the watersheds, enabling the study results to possibly be extrapolated to other similar regions worldwide. To expand the applications of CHESS in regions without gauging, the authors detected the Twin River watershed as one of the study regions under the influence of the distance between Snowpack Telemetry (SNOTEL) stations and the watershed. The long-term time-series of high-quality daily streamflow observations from the U.S. Geological Survey (USGS) gauges are available and valuable for calibrating and evaluating model simulations in these watersheds (Table S1; waterdata.usgs.gov, access on 18 August 2021). Therefore, these three watersheds are selected in the present study.
The drainage area varies from 17.5 to 82.3 km2 across three watersheds (Table S1). Additionally, the average elevations are spatially different, ranging from 2337 m in the Incline Creek watershed to 2827 m in the Twin River watershed [26]. Annual total precipitation averages 712 mm in the Twin River watershed, 765 mm in the Cleve Creek watershed, and 858 mm in the Incline Creek watershed (Table S1). The annual mean temperature is about 2.9 °C in the Cleve Creek watershed, 5.9 °C in the Twin River watershed, and 7.1 °C in the Incline Creek watershed, showing an increasing trend over the past 30 years in the three watersheds.

2.2. Model Selection and Simulation of Snow Dynamics

CHESS [26,35,36] is leveraged to explore snow variations and associated shifts in streamflow in the three watersheds under ongoing climate change. CHESS is designed to simulate the coupling of land surface hydro-ecological processes, such as the generation and routing of surface and subsurface flow. The specific representation of hydro-ecological processes is referred to in Tague and Band and partially available in Tang et al. [26,35,37]. Since this study focuses on snow variation and its effects on river flow, the calculations of snowfall, snow accumulation, and melt are briefly introduced. In CHESS, snowfall, snow accumulation, and melt are modeled to occur independently at grid level (90 m resolution). Based on air temperature, the partition of snowfall from precipitation is as follows:
S Fall = 0 T i > T max Pre i × T max T i T max T min T min < T T max Pre i T i T min
where i is a given day, T i is the mean air temperature on day i, Pre i represents the total precipitation on day i, T max is the maximum temperature at which precipitation falls as snow, and T min is the minimum temperature at which precipitation falls as liquid rain.
Snowmelt ( S M ) is the sum of melts driven by solar radiation ( M R ), air temperature ( M T ), and precipitation ( M P ), respectively:
S M = M R + M T + M P
In more detail, a quasi-energy budget approach is used to calculate snowmelt from solar irradiation ( M R ), which takes melt from latent heat and vapor into account and depends on the snowpack energy deficit (SED):
SED i = max [ SED i 1 + T i , SED max ]
where SED i 1 is the energy deficit of the previous day, and SED max is the regional specific maximum energy deficit set as a climate input parameter. Part of the snow loss caused by radiation can occur as sublimation when SED < 0. Radiation-associated snowmelt is calculated as follows:
M R = K direct + K diffuse + L λ f ρ water   SED 0 K direct + K diffuse + L λ f + λ ν ρ water   SED < 0
where λ f and λ ν are the latent heat of fusion and vaporization; K direct and K diffuse are the direct and diffuse shortwave radiation absorbed by snowpack, respectively; L is longwave radiation; and ρ water is water density.
Snowmelt resulting from temperature and advection often occurs when snowpack reaches an isothermal temperature of 0 °C. An estimate of melt from latent and sensible heat following an empirical formula with air temperature influenced by wind speed under the effects of forest cover fraction (F) over snowpack can be determined as follows:
M T = β MT T air 1 - 0 . 8 F
where β MT is an empirical temperature melt coefficient that is set as a climate region-specific input parameter.
The advection-induced melt due to warming contributed by incoming precipitation is computed as follows:
M P = p s ρ water λ water               T air 0   0             T air < 0
where p s is the net throughfall entering snowpack, and λ water is the heat capacity of water.

2.3. Model Driving Data, Protocol, Calibration, and Evaluation

Time series synoptic data at the daily step are required to run CHESS. They include daily total precipitation (mm) and daily minimum and maximum temperature (°C). These data for the 1981–2016 period was acquired from three nearby Natural Resource Conservation Service SNOTEL stations (Figure 1 and Table S1) (http://www.wcc.nrcs.usda.gov, access on 18 August 2021). To eliminate the elevational impacts on the quality of climate driving data between the SNOTEL stations and the three watersheds under study, the appropriate lapse rate was used to adjust the aforementioned synoptic data [26]. In addition, annual mean atmospheric CO2 concentrations derived from the National Oceanic and Atmospheric Administration (NOAA) Global Monitoring Laboratory (www.esrl.noaa.gov, access on 18 August 2021) were collected to run CHESS. In case of missing data in a station, the corresponding available data from the nearest station were used to compensate. Then, the authors carefully and manually assessed the quality of the filled data by checking the consistency of post-filled data for each station using a double mass curve.
Specifically, time series daily weather records from 1981 to 2016 were used as model inputs, of which data between 1981 and 1989 were used to spin up model simulations to stabilize soil moisture and vegetation with the local climate. Considering the integrity and accuracy of the observed records from the USGS gauges and SNOTEL stations, the simulated results for 1990–2016 are used in this study. The observed streamflow and derived baseflow were used to calibrate the model simulation from 1990 through 2000 and evaluated from 2001 to 2016, respectively (Figures S1 and S2). Furthermore, the Nash–Sutcliffe (NS) coefficient was implemented to evaluate the modeled SWE in the three watersheds (Figure S3). The high NS value suggests that CHESS performed well in capturing the variability and magnitudes of streamflow and SWE in the three watersheds.

2.4. Snow and Streamflow Metrics

To give a comprehensive analysis of the effects of snow accumulation, duration, and ablation on the flow hydrographs in the three watersheds, four snow metrics are considered: (1) snowmelt rate (SMR), (2) snow persistence (SP), (3) mean snow residence time (SRT), and (4) snow season length (SSL) (Table 1).
The calculation of SMR follows Barnhart et al. [20]:
SMR i = Δ SWE i N i
where i represents a water year, Δ SWE i = SWE i 1 SWE i , and N i is the number of days when Δ SWE i < 0 . When Δ SWE i is greater than zero, SMR is treated as zero.
Following Luce et al. and Stewart et al., SRT is expressed as follows [38,39]:
SRT = CT melt CT ac
where CT ac and CT melt correspondingly represent the weighted mean dates of accumulation depth and snowmelt depth. Snow accumulation indicates any positive increase in SWE, while snowmelt suggests any decrease in SWE. They were calculated as follows:
CT ac = t i ac i ac i
CT melt = t i melt i melt i
where t i is the number of days that had passed since 1 October (the first day of the water year), ac i is the increment in the snowpack on the day i, and melt i is the decrement in the snowpack on the day i. In addition, SSL is the maximal unbroken period from the first day with snow cover to the last day in a water year; SP is calculated as the percentage of the total number of days with SWE recorded following Equation (11):
SP i = D SWE > 0 D i × 100 %
where D SWE > 0 and D i are the days with recorded SWE and the total number of days in water year i.
To characterize the dynamics of alpine streamflow in depth, the modeled streamflow, which consists of baseflow and overland flow following the runoff yielding process mechanism in CHESS, was further partitioned into the corresponding snow-driven and rain-driven flow. Due to different replenishment processes, different approaches were used for partitioning baseflow and overland flow into snow-driven and rain-driven flows. The key to partition is to determine the accumulated interval lengths of baseflow and overland flow events driven by snowmelt or rainfall.
Given the lag-effects of snowmelt and rainfall on baseflow in the following seasons—for example, the autumn baseflow can be relevant to snowmelt in spring and summer—the accumulated time of baseflow was set as 180 days to contain all the preseason snowmelt and rainfall recharges [26]. For baseflow ( F b ) on a given day, the ratio of 180-day accumulated snowmelt ( m acc , 180 ) and rainfall ( r acc , 180 ) before the given day was first calculated. Then, the baseflow was partitioned into snow-driven ( F m , b ) and rain-driven baseflow ( F r , b ) as follows:
F m , b = m acc , 180 / m acc , 180 + r acc , 180 × F b F r , b = r acc , 180 / m acc , 180 + r acc , 180 × F b
Because overland flow ( F o ) is relevant to the drainage area and rainfall or snowmelt process, the number of days (N) after which direct runoff ceases from a snowmelt or rainfall event was first calculated using the methods suggested by Sloto et al., and Pettyjohn et al., as shown in Equation (13) [41,42]:
N = ( 2.59 A ) 0.2
where A is the drainage area in square kilometers. Then, the accumulated interval length (n) was determined based on N using the fixed interval method of HYSEP, which is an odd integer between 3 and 11 and is nearest to 2N [42].
Following Equation (13), the accumulated interval n of surface flow was calculated, which was 5 days in the Cleve Creek and Twin River watersheds and 3 days in the Incline Creek watershed. Then, the n-day accumulated snowmelt ( m acc , n ) and rainfall ( r acc , n ) were calculated, and overland flow was partitioned into snow-driven ( F m , o ) and rain-driven ( F r , o ) overland flow as follows:
F r , o = r acc , n / m acc , n + r acc , n × F o F m , o = m acc , n / m acc , n + r acc , n × F o
where n is the accumulated interval length in a watershed, and m acc , n and r acc , n represent the accumulated snowmelt and rainfall for n days before a given day. Thus, the snow-driven streamflow is the sum of the partitioned snow-driven baseflow and overland flow. Likewise, the rain-driven streamflow is the sum of the partitioned rain-driven baseflow and overland flow.
Six flow metrics that measure the timing and quantity of streamflow variation are calculated based on snowmelt-driven streamflow. The flow timing indices are the occurrence days of 25% (Q25) and 50% (Q50) of cumulative annual snow-driven streamflow as well as the day of peak discharge (PQD) (Table 1). The flow quantity indices are PQ, ASF, and SBF (Table 1). Q25 indicates the spring onset of streamflow or the earlier snow-driven streamflow, and Q50 represents the center mass of flow timing (CT) of annual snow-driven streamflow [16,43].

2.5. Statistic Analysis

The NS coefficient is employed to estimate the performance of the model simulation (Figures S1–S3) [44]. The Mann–Kendall time-series analysis is used to detect records spanning a period to assess whether or not there is a detectable trend from the year-to-year variability, and the two-tailed p value is used to determine whether the ebb and flow of snow and flow metrics are significant at the 0.05 level [45]. Sen’s slope, a non-parametric test, is used to estimate the slope of the Mann–Kendall analysis [46,47,48]. Sen’s slope is insensitive to singular values or outliers and thus is used to quantify the trends of flow timing and volume as well as snow indices using the following equation:
β = median x j x i j i , 1990 i < j < 2016
where β represents the Theil–Sen median, while x i and x j refer to the data value in years i and j. The sign of β symbolizes the trend direction. The Pearson correlation coefficient and linear regression analysis are utilized in the present study to describe the correlation between snow and snow-driven flow variables. The p value is used to test the significance of the relationship at the 0.05 level.
The Grey Relational Analysis (GRA) is applied to investigate the interrelationships among snow metrics and associated hydrological shifts [49]. The GRA is built on the grey system theory proposed by Deng and is useful for scaling the complicated relationships between multiple factors and variables according to the degree of the trends of variables [49,50,51]. The details of the GRA procedure are described as follows.
(1)
Preparing the reference sequence and specific comparative sequence;
(2)
Standardizing the variables sequence;
x j k = x j k 1 n j = 1 n x j k
where j = 1, …, n and k = 1, …, m, x j k denote a specific comparative sequence.
(3)
Calculating the grey relational coefficients;
ζ y 0 k , x j k = Δ min + ρ Δ max Δ 0   j k + ρ Δ max
where y 0 k denotes a dimensionless reference sequence, and ρ is the distinguishing coefficient with the value of 0.5:
Δ oj k = y o k x j k
Δ max = max j i max y 0 k x j k
Δ min = min j i min y 0 k x j k
(4)
Quantifying the grey relational grade. A higher GRA grade suggests a stronger relationship between y 0 and x i .
ζ y 0 , x i = 1 n j = 1 n ζ y 0 k , x i k
In addition, the structural equation model (SEM) is applied to analyze the causation between the variation in the snow and flow metrics. The SEM is a multivariate statistical tool that builds models to separate pathways of influence based on the covariance among metrics [52]. It enables the detection of direct and indirect effects that one variable may have on another and estimates the strengths of these multiple effects [53].

3. Results

3.1. The Variability and Trends of Snow and Flow Metrics

Table 2 shows the trends of four snow metrics and six flow metrics during 1990–2016 in the three watersheds. The SMR, mean SRT, and SSL had downward trends, as suggested by the signs of Sen’s slope (β) in the three watersheds, but those trends are significant (p < 0.05) only in the Twin River watershed. For example, SMR decreased by a rate ranging from 0.02 mm/year in the Cleve Creek watershed to 0.05 mm/year in the Incline Creek watershed. During the study period across the three watersheds, the SRT decreased from 0.02 day/year in the Cleve Creek watershed to 1.1 days/year in the Twin River watershed during the study period. In contrast, SP was relatively stable (Sen’s slope ≈ 0). Average, minimum and maximum value of the snow and streamflow metrics during period 1990−2016 are listed in Table S4.
The flow timing metrics declined in the Cleve Creek and Twin River watershed but increased in the Incline Creek watershed, in which the occurrence days of 25% and 50% of accumulative ASF (Q25 and Q50) were delayed by a rate of 0.15 and 0.26 day/year during the study period, respectively. Further analysis indicated that the PQD, Q25, and Q50 occurred earlier during the study period except for in Incline Creek (Figure 2). For example, compared to the 1991–1998 period, the average PQD, Q25, and Q50 in the 2008–2016 period shifted 6, 14, and 9 days earlier in the Cleve Creek watershed (Figure 2a,d) as well as 9, 17, and 12 days earlier in the Twin River watershed (Figure 2b,e). When it comes to the average elapsed time between Q25 and Q50, it extended from 37 days in the first period to 42 days in the third period in the Cleve Creek, from 35 days to 40 days in the Twin River, and from 47 days to 59 days in the Incline Creek watershed.
For the flow quantity metrics, PQ, ASF, and SBF experienced downward trends in the Twin River and the Incline Creek watersheds (Table 2). For example, the PQ, ASF, and SBF of the Twin River decreased by a rate of 0.03, 0.98, and 0.21 mm/year during the study period. For Cleve Creek, the PQ, ASF, and SBF increased, respectively, by a rate of 0.004, 1.08, and 0.02 mm/year during the 1991–2016 period (Table 2).

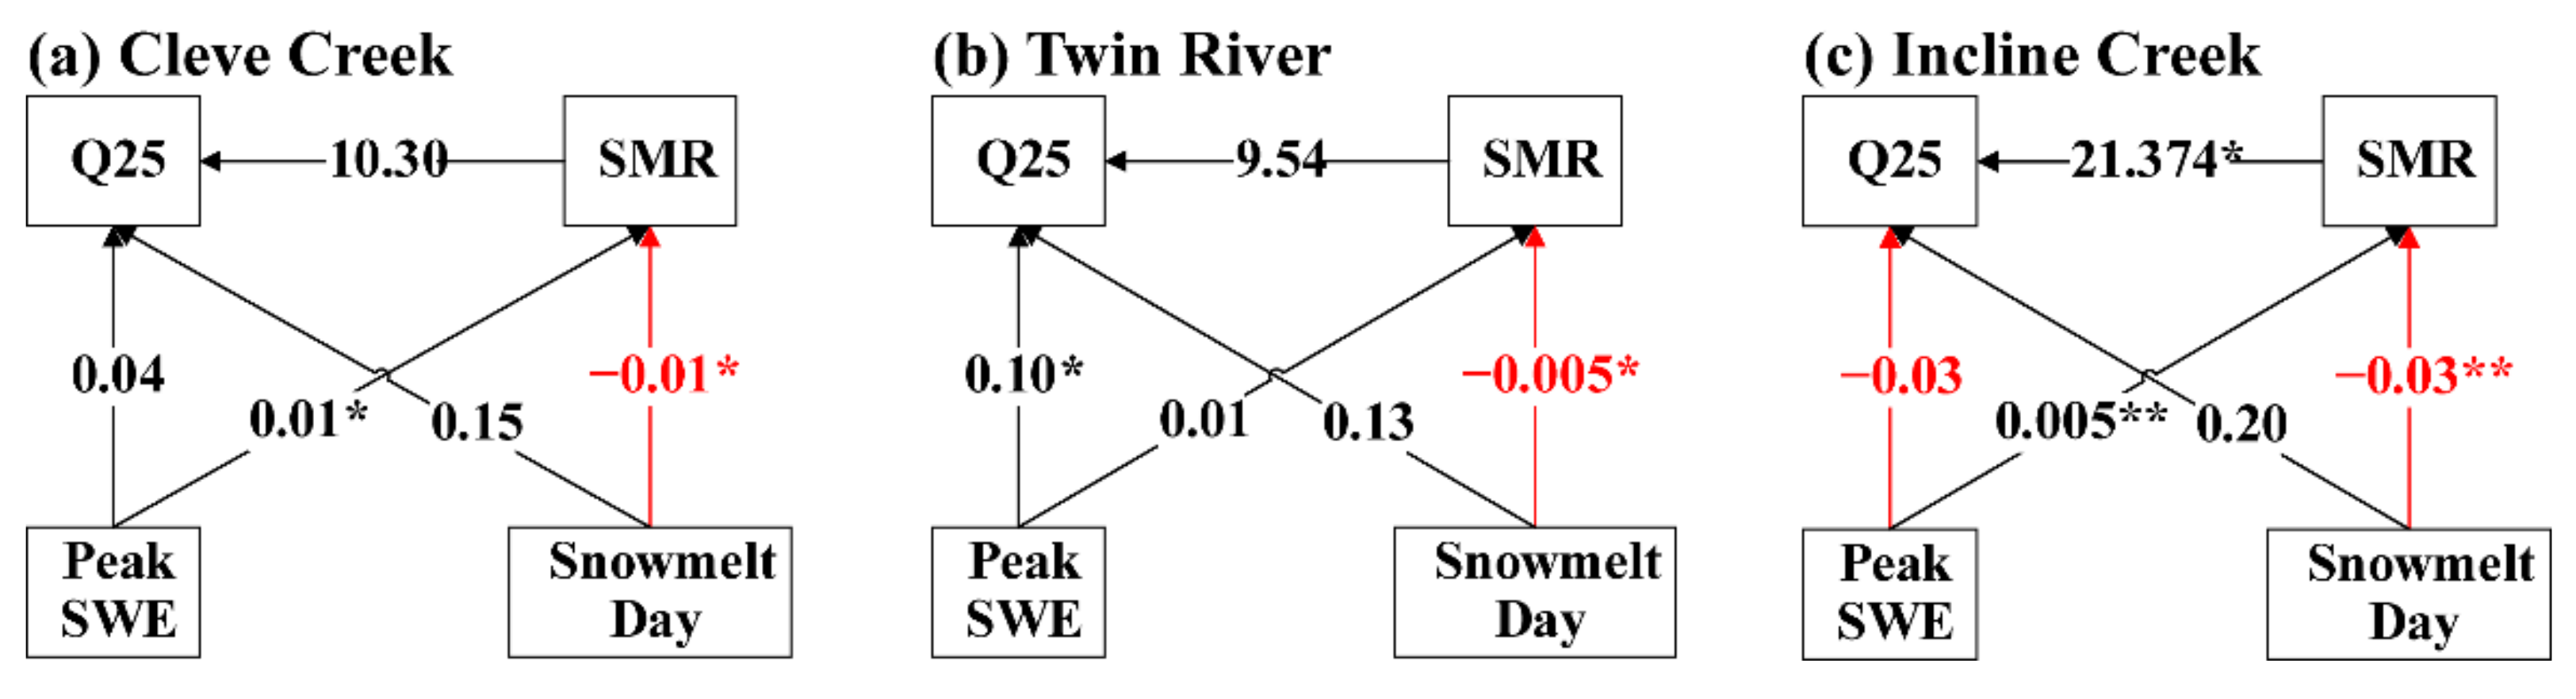
3.2. The Relationships between Each Snow and Flow Timing Metric

Figure 3 and Table S3 show the correlation and regression results between four snow and three flow timing metrics. The flow timing metrics are positively correlated with each snow metric in the three watersheds. Especially for Q25 and Q50, the correlations with four snow metrics are significant (p < 0.05) in all watersheds. For example, when SMR decreases by 1 mm/day, Q25 and Q50 are estimated to shift ahead by 17 and 8 days in the Cleve Creek watershed, 23 and 12 days in the Twin River watershed, and 17 and 7 days in the Incline Creek watershed, respectively (Table S3). PQD is also positively correlated with each snow timing metric in the three watersheds, but most of the correlations are not significant at the 0.05 level (Figure 3). Moreover, the strengths of correlations between PQD and four snow metrics are consistently lower in three watersheds when compared to those with Q25 and Q50, respectively. The GRA indicates that snow variables influence the flow timing metrics because the GRA grades are all greater than 0.5 in the three watersheds (Figure 4). The SP and SSL have higher grades for Q25, Q50, and PQD (about 0.85), while SMR and SRT have comparatively lower grades.
Figure 5 and Figure S5 show the results of causation analysis using the SEM. Among SMR, peak SWE, and snowmelt days, SMR is the best indicator to explain the variation in the timing of Q25 and Q50. For SMR, the standardized total effects are 10.30 and 1.98 for the Cleve Creek watershed, 9.54 and 0.93 for the Twin River watershed, and 21.37 and 10.57 for the Incline Creek watershed, respectively. In addition, the causation analysis indicates that the peak SWE in the three watersheds has positive effects on SMR, whereas the snowmelt days have negative effects on it.

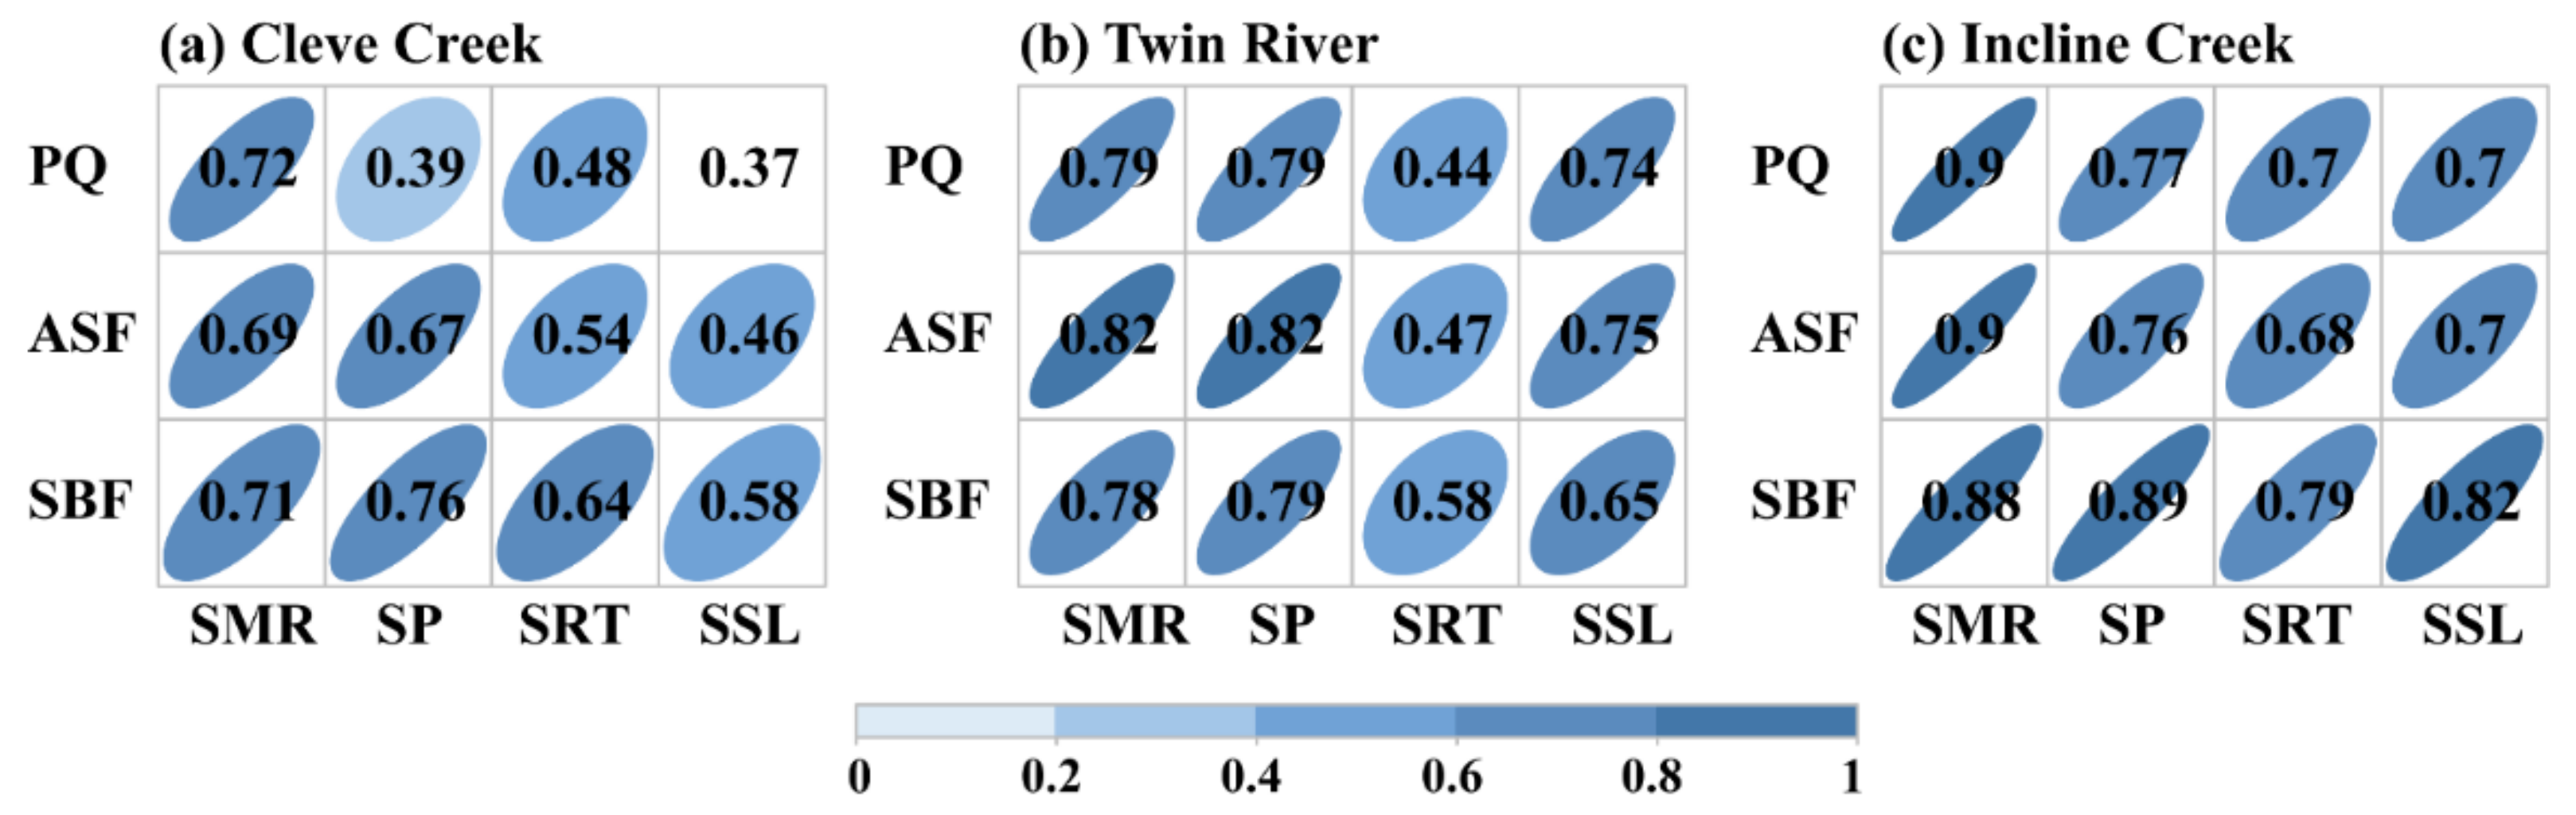
3.3. The Relationships among Snow Metrics and Annual Streamflow

The relationships between four snow metrics and annual snow-driven streamflow (ASF) are depicted in Figure 6 and Table S3. ASF was significantly correlated with SMR and SP in the three watersheds. It was also significantly correlated with SRT except for the Twin River. For example, ASF tends to increase by 102 mm as SMR increases by 1 mm/day, 20 mm as SP increases 1%, and 4.6 mm as SRT increases by 1 (dimensionless) in the Incline Creek watershed. ASF is significantly (p < 0.05) correlated with SSL in the three watersheds. In addition, the strength of correlations between ASF and SMR is the strongest (>0.69) and the lowest (<0.75) with SSL across three watersheds. For instance, the correlation coefficient between ASF and SMR is 0.69 for the Cleve Creek watershed, 0.82 for the Twin River watershed, and 0.90 for the Incline Creek watershed. In contrast, it is 0.46 for Cleve Creek, 0.75 for Twin River, and 0.7 for Incline Creek (Figure S4). The GRA grades between SMR and ASF are around 0.7, which are comparatively higher than those with SP, SRT, and SSL. This indicates that SMR exerts a greater influence on ASF (Figure 4).

3.4. The Relationships among Snow Metrics and Snow-Driven Summer Baseflow

The SBF was significantly correlated with each snow metric in the three watersheds (Figure 6 and Table S3). SBF tended to increase by 11 mm in the Cleve Creek watershed, 8 mm in the Twin River watershed, and 17 mm in the Incline Creek watershed if the SMR increased by 1 mm/day in the three watersheds. Like ASF, SBF is more strongly correlated with SMR and SP than with SRT and SSL in the three watersheds. For example, the correlation coefficient between SBF and SMR is 0.71 in the Cleve Creek watershed, 0.78 in the Twin River watershed, and 0.88 in the Incline Creek watershed. In contrast, the correlation coefficient between SBF and SSL is 0.58 in the Cleve Creek watershed, 0.65 in the Twin River watershed, and 0.82 in the Incline Creek watershed (Figure S4). Like ASF, the GRA grades between SMR and SBF are higher (>0.7) than with the other three snow metrics (Figure 4).

3.5. The Relationships among Snow Metrics and Peak Discharge

A significant positive relationship exists between PQ and the four snow metrics in the three watersheds (Figure 6 and Table S3). For example, PQ tended to increase by 1.6 mm in the Cleve Creek, 1.0 mm in the Twin River, and 1.7 mm in the Incline Creek if the SMR increased by 1 mm/day in the three watersheds. Like ASF, the correlation between PQ and SMR is stronger, while it is weaker with three metrics that measure snow continuity (SP, SRT, and SSL; Figure S4). For example, the correlation coefficient between PQ and SMR is 0.72 in the Cleve Creek, 0.79 in the Twin River, and 0.9 in the Incline Creek watershed. In contrast, it is less than 0.79 with three snow-continuity metrics (Figure S4). The GRA grades between PQ and the four snow metrics are less variable than the other five flow variables (Figure 4).

4. Discussion

4.1. The Trends in Snow and Flow Metrics

The daily mean, minimum, and maximum temperature showed an upward trend in the three watersheds (Table S2). Under a warmer condition, the snow fraction, defined as the portion of precipitation falling as snowfall, had a decreasing trend in the three watersheds (Figure S4), suggesting that more precipitation falls into liquid or liquid–solid transition phases rather than snow due to an increment in the latent heat of fusion predominantly driven by regional warming [54,55]. As a result, snowpack experienced a significant declining trend in the study period, as demonstrated in the western U.S. in the past few decades [16,56]. In addition, the warmer air temperature causes more days with temperatures above the freezing point. This thus increases the sensitivity of snowpack to air temperature perturbations, which eventually reduces the snow continuity [20]. Against this background, the decline in SMR can result from less snowpack and longer snowmelt days [4,56]. On the other hand, if the relatively decreasing magnitude of snowpack is greater than that of total snowmelt days, it also reduces SMR (See Equation (7)). This explains why most snow metrics experienced a downward trend under the warming condition. The decreasing trends in Q25 and Q50 indicate an earlier stage of accumulative streamflow in a water year, which results from more precipitation falling as rainfall in winter that can directly increase subsurface flow generation and the shortening of snow continuity and implies that the duration to convert snowmelt in spring and early summer into the runoff is shortened. Tennant et al. found that the Q25 of the Salmon River in Idaho at low elevations can come 30–50 days earlier than in higher elevations [57]. Compared to Q50 (Table 2 and Figure S6), the decreasing rate of Q25 is greater than that of Q50 in the Cleve Creek and Twin River, resulting in a longer hydrological process [43]. The changing magnitudes of the elapsed time between Q25 and Q50 vary in the three watersheds due to different basin sizes. The smaller the watershed size is, the more dramatic the change [32,57].
The authors found that PQ experienced an inconspicuous earlier arrival, consistent with previous research under global warming [16,58], indicating that the timing of PQ during spring occurred earlier distinctly in snow-dominated watersheds due to the warming landscape. The earlier arrival of the PQD can be attributed to a larger fraction of precipitation falling as rainfall and suggests an increase in winter floods due to wintertime temperature increase [58,59]. The rain-driven hydrograph is characterized by a bimodal distribution at the annual scale, with one peak occurring in winter and another in summer in most watersheds (Figure 7). The input of streamflow was mostly rain during fall months, with snowmelt input picking up between May and June [60]. Moreover, the annual amount of snow-dominated streamflow tended to generally decrease across three periods in the three watersheds under a warmer temperature. To be more specific, the percentage of snow-driven streamflow decreased from 59% between 1991 to 1998 to 55% between 2008 to 2016 in the Cleve Creek watershed, from 66% to 55% in the Twin River watershed, and from 59% to 52% in the Incline Creek.
The decreasing trends of ASF, SBF, and PQ in the three watersheds align with previous studies. Safeeq et al. indicated that summer streamflow in the watersheds of the western U.S. is most sensitive to global warming [34]. These watersheds drain slowly through deep groundwater and receive precipitation as snow. They also detected declining streamflow in late fall and winter in both snow and rain-dominated watersheds. However, the declining trends in streamflow mostly occur when watersheds drain rapidly. Asarian and Walker found that the decreasing trends in streamflow outnumbered the increasing trends for most months in Northwestern California and Southwestern Oregon [61]. PQ is expected to decrease in relatively warmer regions under a warming climate [62]. However, global environmental factors, such as the El Niño-Southern Oscillation phase, can cause a wet or dry winter for the study regions, which are located near the inflection point of the ENSO dipole in the western U.S. As a result, the regional environmental factors outperformed the global ones in controlling runoff [1,63]. Therefore, an increasing trend in ASF and SBF is observed in the Cleve Creek watershed (Table 2).

4.2. Effect of Snow Variations on the Timing of Streamflow

The high GRA grades and significantly positive relationships of Q25 and Q50 with snow metrics indicate that the streamflow timing is sensitive to both the SMR and snow continuity. The earlier onset of the Q25 and Q50 of annual snow-driven streamflow can attribute to two mechanisms: first, warming-induced snow-mass loss reduces the duration of snow cover and shortens snow continuity, leading to an increasingly concentrated streamflow [20]. Pederson et al. also indicated that Q25 and Q50 are sensitive to March–April–May atmospheric circulation, where an earlier arrival of streamflow timing is strongly related to a shorter duration of snow cover during the period from the end of winter to the beginning of spring [16]. For example, the additional simulation in the Cleve Creek suggests that the ratio of seasonal streamflow volume to the total ASF increased for winter and spring, while it decreased for summer and autumn under a 1 °C warming scenario when compared to the reference simulation (Figure 8), suggesting the concentration of timing in streamflow under a warmer condition. More specifically, the increased temperature enlarges the surface absorbed solar radiation and evapotranspiration combined with lower atmospheric moisture content and further results in the decline of precipitation in summer in arid to semiarid areas in the western U.S. [43]. Second, warming causes snowmelt to occur earlier, and a larger fraction of precipitation falls as liquid rain, thus increasing antecedent soil moisture condition. This enhances flow generation in winter and spring, which is accompanied by a more rapid surface runoff response and contributes to the earlier onset of the Q25 and Q50 of annual snow-driven streamflow [64,65]. For instance, Liu et al. reported that streamflow peaked 2–4 weeks earlier in catchments with mixed rain–snow than in snow-dominated catchments in the southern Sierra Nevada of California, which is largely due to a higher antecedent soil moisture if more snow falls as rain under warming condition [66].
The stronger correlation between SMR and three flow timing metrics indicates that SMR is the dominant factor affecting the intra-annual distribution of streamflow, followed by snow continuity metrics (SP, SRT, and SSL). These findings agree well with Foy et al. and Fang et al., suggesting that snowmelt is the principal controlling factor for flow timing in mountain watersheds in the western U.S. [67,68]. However, the less significant relationships between the PQD and four snow metrics need to be determined to establish if the onset of snow accumulation, daily SMR, or the snowpack volume can alter PQ shifts [28]. For example, the average PQD in Cleve Creek and Twin River was delayed in the 2008–2016 period compared to the 1999–2007 period (Figure 2a,b).

4.3. Effect of Snow Variation on Annual Snow-Driven Streamflow

A previous study showed that 98–99% of streamflow in similar watersheds in Utah, U.S. can originate from melting snow and associated processes [27]. The positive relationships between annual snow-driven streamflow and each snow metric are attributed to two mechanisms: first, if the snow stays longer on the surface, the area covered by snow will increase and the land surface will absorb less solar radiation. This will result in longer and more persistent snowpack transferring into water resources for river replenishment [5]. Second, the water loss via evapotranspiration under cooler conditions will be lower than under warmer conditions, which facilitates subsurface flow generation and increases ASF. The additional simulation for the Cleve Creek watershed demonstrated the mechanisms by which a warming scenario can shorten snow continuity and reduce the snowmelt-driven streamflow volume (Figure S6), which are in line with previous studies showing that ASF is positively correlated with SP, and snow loss can lead to an earlier snowmelt timing and a decline in ASF in mountain watersheds of the western U.S. [25,60]. For example, Barnhart et al. found that greater snowmelt can promote percolation below the root zone by altering the water delivery rate’s balance and subsequently increasing streamflow [4]. This justifies the idea that ASF declined as the SMR decreases in both the Twin River and Incline Creek watersheds (Table 2). In contrast, when SMR is low, water loss suffers more from evapotranspiration, reducing runoff volume.

4.4. Effect of Snow Variation on the Quantity of Summer Baseflow

Summer baseflow (SBF) contains the falling limb of the snowmelt hydrograph and characterizes the dry and stable flow conditions [69]. In semiarid and arid regions, summer rainfall in alpine watersheds is low and likely evaporates before or after reaching the ground. High evapotranspiration (from active vegetation and high temperature) and small rainfall amounts in the basins during summer tend to promote losses to soil moisture and surface runoff rather than adding input to streamflow [27]. Thus, SBF heavily depends on snow melting and continuity during the snow season via two mechanisms [27]. First, the groundwater recharges by snowmelt, and its delayed release is an important mechanism for sustaining the baseflow of alpine watersheds [70,71]. Second, changes in snow continuity such as decreases in SP, SRT, and SSL may reduce hydrological connectivity and groundwater recharge, thus decreasing summertime low flow (Figure S6). These explain why SBF in the three watersheds is positively correlated with both SMR and three snow continuity metrics, as demonstrated in other studies [24,39]. For example, Flint et al. found that if the SMR in the Sierra Nevada of California exceeds the bedrock permeability, it will cause underground lateral flow and an increasing SBF [72]. Tang et al. indicated that spring snowmelt is a dominant factor in generating SBF in alpine watersheds in the western U.S. [26]. In this study, the partition shows that the snow-driven flow accounts for over 65% of total summer flow in Cleve Creek, 66% in Twin River, and 72% in Incline Creek (Figure 7), demonstrating the role of snowmelt in summer flow generation. Because SMR was found to decrease due to extended snowmelt days and reduced snowpack in the three watersheds, this caused SBF to decrease (Figure S6).

4.5. Effect of Snow Variation on the Magnitude of Peak Discharge

A previous study has indicated that the snow contribution to PQ is highly correlated with SP in snowmelt-dominated watersheds, and SP can serve as an important indicator to predict the magnitude of PQ [73]. A shorter SP corresponds to later occurrence of snow and smaller snow storage, which would cause lower streamflow during the snowmelt season [28]. Affected by higher air temperature, the depth of snowpack and the area of snow cover tends to decrease. As a result, the total volume of snow available for melting on a given day tends to decrease. This explains why PQ is positively correlated with SMR (defined as the ratio of annual ablation volume to ablation snowmelt days). In addition, the shortening of SP and SSL due to warming has the potential to advance the timing of PQ [23]. The positive relationships of PQ with snowmelt and continuity are consistent with Zheng et al., suggesting that peak snow accumulation, snow-free days, and snowmelt slope are all strongly correlated with PQ, particularly in the inland basins of the western U.S., which are likely to experience a larger decrease in PQ under warming conditions since climate regimes in these semiarid and arid regions are most susceptible to dominant precipitation phase transitions from snow to rain [28,62]. Nevertheless, Davenport et al. indicated that the largest peak value of rain-driven streamflow could be more than 2.5 times the size of the largest snow melt-driven peaks [54]. Therefore, the magnitude of PQ can vary as the snow regime shifts (Figure 6).

5. Conclusions

The effects of warming on streamflow in mountain watersheds in semiarid and arid regions have attracted widespread social and environmental concern worldwide. By considering multiple snow and flow metrics, and by partitioning streamflow into snow-driven and rain-driven streamflow based on the newly proposed method, this study explores the responses of snow-driven streamflow to different aspects of snow variation in three alpine watersheds in the Great Basin.
The results of the present study show that the SMR, SP, mean SRT, and SSL experienced downward trends in the three alpine watersheds during 1990–2016. Changes in snow continuity and SMR greatly affect the intra-annual variability and quantity of snow-driven streamflow. Specifically, the decline in snow continuity and the decrease in SMR caused an earlier onset of Q25, Q50, and PQD, as well as a reduction in ASF, SBF, and PQ. Compared to three snow-continuity metrics, SMR plays a dominant role in shifting the timing and quantity of snow-driven streamflow. Because warming tends to reduce the length of snow continuity, which leads to an earlier onset and reduction of snow-driven streamflow, it poses a great threat to the future availability of water resources in the semiarid and arid region.
In addition, the obtained results suggest that it is possible to use SMR and snow continuity metrics to predict the changes in magnitudes and timing of snow-driven streamflow and SBF in alpine watersheds in semiarid and arid regions, which is valuable for scientific wildfire, ecosystem, and downstream water resource management. The employment of multiple metrics and the method of separating total streamflow into snowmelt-driven and rain-driven streamflow are helpful for identifying the dominant factors determining streamflow variations in alpine watersheds under a warmer climate. Overall, to minimize the negative impacts of warming and other extreme weather–climate events, such as the ENSO, on water resources in snow-dominated alpine watersheds, and further, on social and economic development, water resource managers in similar semiarid and arid regions should consider the effects of warming on snow dynamics in the snow-dominated alpine watersheds. As a future step, we would consider the application of MODIS snow products to evaluate the snowpack output of CHESS and analyze the spatiotemporal variety influence of multi snow metrics on the magnitude and timing of streamflow.

Supplementary Materials

The following supporting information can be downloaded at https://www.mdpi.com/article/10.3390/w14071095/s1, Figure S1: Calibration (for 1990–2000 period) and evaluation (for 2001–2016 period) of observed daily streamflow (red line) and simulated streamflow (black dotted line) in the three watersheds; Figure S2: Calibration (for 1990–2000 period) and evaluation (for 2001–2016 period) of observed daily baseflow (red line) and simulated baseflow (black dotted line) in the three watersheds; Figure S3: Observed daily SWE (red line) and simulated SWE (black dotted line) in the three watersheds; Figure S4: Trends of snow fraction, peak SWE, and snowmelt days in (a) Cleve Creek, (b) Twin River, and (c) Incline Creek during 1990–2016; Figure S5: Structural equation model examining the multivariate effects on Q50; Figure S6: Differences in metrics between simulation under warming scenarios with daily minimum and maximum temperature increasing by 1 °C and that under the reference scenario in the Cleve Creek watershed during 1990 to 2016. Red line represents a multi-year average difference; Table S1: Information about the three mountain watersheds, USGS gauges, and SNOTEL stations used in this study; Table S2: Trends of daily mean, minimum, and maximum temperature in three watersheds during the 1990–2016 period; Table S3: General shifts of streamflow timing metrics with snow metrics during period 1990–2016; Table S4: Average, minimum, and maximum value of the snow and streamflow metrics during period 1990–2016.

Author Contributions

Conceptualization, writing—original draft preparation, methodology, validation, data collection and investigation, X.C.; conceptualization, writing—review and editing, funding acquisition, supervision and project administration, G.T.; formal analysis, visualization, validation and software, T.C.; validation and writing—review and editing, X.N. All authors have read and agreed to the published version of the manuscript.

Funding

This study was funded by the National Natural Science Foundation of China (No. 42171025).

Institutional Review Board Statement

Not applicable.

Informed Consent Statement

Not applicable.

Data Availability Statement

The data displayed in this study is available in the current manuscript.

Acknowledgments

We extend our appreciation to the National Natural Science Foundation of China for funding this research work through project number (No. 42171025). We thank the Snowpack Telemetry (SNOTEL) and US Geological Survey (USGS) for providing available observation data. We highly appreciate the valuable comments from the editors and anonymous reviewers, which greatly improved our manuscript.

Conflicts of Interest

The authors declare no conflict of interest.

References

  1. Yang, W.C.; Jin, F.M.; Si, Y.J.; Li, Z. Runoff change controlled by combined effects of multiple environmental factors in a headwater catchment with cold and arid climate in northwest China. Sci. Total Environ. 2021, 756, 143995. [Google Scholar]
  2. Hamlet, A.F.; Mote, P.W.; Clark, M.P.; Lettenmaier, D.P. Effects of Temperature and Precipitation Variability on Snowpack Trends in the Western United States. J. Clim. 2005, 18, 4545–4561. [Google Scholar] [CrossRef]
  3. Stewart, I.T. Changes in snowpack and snowmelt runoff for key mountain regions. Hydrol. Processes 2009, 23, 78–94. [Google Scholar]
  4. Barnhart, T.B.; Molotch, N.P.; Livneh, B.; Harpold, A.A.; Knowles, J.F.; Schneider, D. Snowmelt rate dictates streamflow. Geophys. Res. Lett. 2016, 43, 8006–8016. [Google Scholar]
  5. Cline, T.J.; Schindler, D.E.; Walsworth, T.E.; French, D.W.; Lisi, P.J. Low snowpack reduces thermal response diversity among streams across a landscape. Limnol. Oceanogr. Lett. 2020, 5, 254–263. [Google Scholar]
  6. Shen, Y.; Fink, M.; Kralisch, S.; Chen, Y.; Brenning, A. Trends and variability in streamflow and snowmelt runoff timing in the southern Tianshan Mountains. J. Hydrol. 2018, 557, 173–181. [Google Scholar]
  7. Burke, A.R.; Kasahara, T. Subsurface lateral flow generation in aspen and conifer-dominated hillslopes of a first order catchment in northern Utah. Hydrol. Processes 2011, 25, 1407–1417. [Google Scholar]
  8. Mote, P. Climate-Driven Variability and Trends in Mountain Snowpack in Western North America. J. Clim. 2006, 19, 6209–6220. [Google Scholar]
  9. Shrestha, M.; Wang, L.; Koike, T.; Tsutsui, H.; Xue, Y.; Hirabayashi, Y. Correcting basin-scale snowfall in a mountainous basin using a distributed snowmelt model and remote-sensing data. Hydrol. Earth Syst. Sci. 2014, 18, 747–761. [Google Scholar] [CrossRef] [Green Version]
  10. Lukas, J.; Barsugli, J.; Wolter, K.; Rangwala, I.; Doesken, N. Climate Change in Colorado: A Synthesis to Support Water Resources Management and Adaptation; Western Water Assessment, University of Colorado Boulder: Boulder, CO, USA, 2014. [Google Scholar]
  11. Brown, R.D. Northern hemisphere snow cover variability and change, 1915–1997. J. Clim. 2000, 13, 2339–2355. [Google Scholar] [CrossRef]
  12. Abbott, B.W.; Gruau, G.; Zarnetske, J.P.; Moatar, F.; Barbe, L.; Thomas, Z.; Fovet, O.; Kolbe, T.; Gu, S.; Pierson-Wickmann, A.; et al. Unexpected spatial stability of water chemistry in headwater stream networks. Ecol. Lett. 2018, 21, 296–308. [Google Scholar] [CrossRef] [PubMed]
  13. Bao, A.; Chen, X.; Li, L. Theories and methods of snowmelt runoff and its application in arid regions. Arid. Land Geogr. 2010, 33, 684–691. [Google Scholar]
  14. Isaak, D.J.; Luce, C.H.; Rieman, B.E.; Nagel, D.E.; Peterson, E.E.; Horan, D.L.; Parkes, S.; Chandler, G.L. Effects of climate change and wildfire on stream temperatures and salmonid thermal habitat in a mountain river network. Ecol. Appl. 2010, 20, 1350–1371. [Google Scholar] [CrossRef] [PubMed] [Green Version]
  15. Pachauri, R.K.; Allen, M.R.; Barros, V.R.; Broome, J.; Cramer, W.; Christ, R.; Church, J.A.; Clarke, L.; Dahe, Q.; Dasgupta, P.; et al. Climate Change 2014 Synthesis Report. Contribution of Working Groups I, II, and III to the Fifth Assessment Report of the Intergovernmental Panel on Climate Change; IPCC: Geneva, Switzerland, 2014. [Google Scholar]
  16. Pederson, G.; Gray, S.; Ault, T.; Marsh, W.; Fagre, D.; Bunn, A.; Woodhouse, C. Climatic Controls on the Snowmelt Hydrology of the Northern Rocky Mountains, USA. J. Clim. 2010, 24, 1666–1687. [Google Scholar] [CrossRef]
  17. Ashfaq, M.; Ghosh, S.; Kao, S.-C.; Bowling, L.C.; Mote, P.; Touma, D.; Rauscher, S.A.; Diffenbaugh, N.S. Near-term acceleration of hydroclimatic change in the western U.S. J. Geophys. Res. Atmos. 2013, 118, 10676–10693. [Google Scholar] [CrossRef]
  18. Sorg, A.; Bolch, T.; Stoffel, M.; Solomina, O.; Beniston, M. Climate change impacts on glaciers and runoff in Tien Shan (Central Asia). Nat. Clim. Chang. 2012, 2, 725–731. [Google Scholar] [CrossRef]
  19. Fujita, K. Influence of precipitation seasonality on glacier mass balance and its sensitivity to climate change. Ann. Glaciol. 2008, 48, 88–92. [Google Scholar] [CrossRef] [Green Version]
  20. Jara, F.; Lagos-Zuniga, M.; Fuster, R.; Mattar, C.; McPhee, J. Snow Processes and Climate Sensitivity in an Arid Mountain Region, Northern Chile. Atmosphere 2021, 12, 520. [Google Scholar] [CrossRef]
  21. Harpold, A.; Brooks, P.; Rajagopal, S.; Heidbuchel, I.; Jardine, A.; Stielstra, C. Changes in snowpack accumulation and ablation in the intermountain west. Water Resour. Res. 2012, 48. [Google Scholar] [CrossRef] [Green Version]
  22. Berghuijs, W.R.; Woods, R.A.; Hrachowitz, M. A precipitation shift from snow towards rain leads to a decrease in streamflow. Nat. Clim. Chang. 2014, 4, 583–586. [Google Scholar] [CrossRef] [Green Version]
  23. Shrestha, R.R.; Cannon, A.J.; Schnorbus, M.A.; Alford, H. Climatic Controls on Future Hydrologic Changes in a Subarctic River Basin in Canada. J. Hydrometeorol. 2019, 20, 1757–1778. [Google Scholar] [CrossRef]
  24. Godsey, S.E.; Kirchner, J.W.; Tague, C.L. Effects of changes in winter snowpacks on summer low flows: Case studies in the Sierra Nevada, California, USA. Hydrol. Processes 2014, 28, 5048–5064. [Google Scholar] [CrossRef]
  25. Hammond, J.C.; Saavedra, F.A.; Kampf, S.K. How Does Snow Persistence Relate to Annual Streamflow in Mountain Watersheds of the Western U.S. with Wet Maritime and Dry Continental Climates? Water Resour. Res. 2018, 54, 2605–2623. [Google Scholar] [CrossRef]
  26. Tang, G.; Li, S.; Yang, M.; Xu, Z.; Liu, Y.; Gu, H. Streamflow response to snow regime shift associated with climate variability in four mountain watersheds in the US Great Basin. J. Hydrol. 2019, 573, 255–266. [Google Scholar] [CrossRef]
  27. Julander, R.P.; Clayton, J.A. Determining the proportion of streamflow that is generated by cold season processes versus summer rainfall in Utah, USA. J. Hydrol. Reg. Stud. 2018, 17, 36–46. [Google Scholar] [CrossRef]
  28. Zheng, X.; Wang, Q.; Zhou, L.; Sun, Q.; Li, Q. Predictive Contributions of Snowmelt and Rainfall to Streamflow Variations in the Western United States. Adv. Meteorol. 2018, 2018, 3765098. [Google Scholar] [CrossRef]
  29. Brown, M.E.; Racoviteanu, A.E.; Tarboton, D.G.; Gupta, A.S.; Nigro, J.; Policelli, F.; Habib, S.; Tokay, M.; Shrestha, M.; Bajracharya, S.; et al. An integrated modeling system for estimating glacier and snow melt driven streamflow from remote sensing and earth system data products in the Himalayas. J. Hydrol. 2014, 519, 1859–1869. [Google Scholar] [CrossRef] [Green Version]
  30. Sankey, T.; Donald, J.; McVay, J.; Ashley, M.; O’Donnell, F.; Lopez, S.M.; Springer, A. Multi-scale analysis of snow dynamics at the southern margin of the North American continental snow distribution. Remote Sens. Environ. 2015, 169, 307–319. [Google Scholar] [CrossRef]
  31. Day, C.A. Modelling impacts of climate change on snowmelt runoff generation and streamflow across western US mountain basins: A review of techniques and applications for water resource management. Prog. Phys. Geogr. Earth Environ. 2009, 33, 614–633. [Google Scholar] [CrossRef]
  32. Di Marco, N.; Avesani, D.; Righetti, M.; Zaramella, M.; Majone, B.; Borga, M. Reducing hydrological modelling uncertainty by using MODIS snow cover data and a topography-based distribution function snowmelt model. J. Hydrol. 2021, 599, 126020. [Google Scholar] [CrossRef]
  33. Tang, G.; Arnone, J.A., III; Verburg, P.S.J.; Jasoni, R.L.; Sun, L. Trends and climatic sensitivities of vegetation phenology in semiarid and arid ecosystems in the US Great Basin during 1982–2011. Biogeosciences 2015, 12, 6985–6997. [Google Scholar] [CrossRef] [Green Version]
  34. Safeeq, M.; Grant, G.E.; Lewis, S.L.; Tague, C.L. Coupling snowpack and groundwater dynamics to interpret historical streamflow trends in the western United States. Hydrol. Processes 2013, 27, 655–668. [Google Scholar] [CrossRef]
  35. Tang, G.; Carroll, R.W.H.; Lutz, A.; Sun, L. Regulation of precipitation-associated vegetation dynamics on catchment water balance in a semiarid and arid mountainous watershed. Ecohydrology 2016, 9, 1248–1262. [Google Scholar] [CrossRef]
  36. Tang, G.; Hwang, T.; Pradhanang, S.M. Does consideration of water routing affect simulated water and carbon dynamics in terrestrial ecosystems? Hydrol. Earth Syst. Sci. 2014, 18, 1423–1437. [Google Scholar] [CrossRef] [Green Version]
  37. Tague, C.L.; Band, L.E. RHESSys: Regional hydro-ecologic simulation system-an object-oriented approach to spatially distributed modeling of carbon, water and nutrient cycling. Earth Interact. 2004, 8, 19. [Google Scholar] [CrossRef]
  38. Luce, C.H.; Lopez-Burgos, V.; Holden, Z. Sensitivity of snowpack storage to precipitation and temperature using spatial and temporal analog models. Water Resour. Res. 2014, 50, 9447–9462. [Google Scholar] [CrossRef]
  39. Stewart, I.T.; Cayan, D.R.; Dettinger, M.D. Changes toward earlier streamflow timing across western North America. J. Clim. 2005, 18, 1136–1155. [Google Scholar] [CrossRef]
  40. Choi, G.; Robinson, D.A.; Kang, S. Changing Northern Hemisphere Snow Seasons. J. Clim. 2010, 23, 5305–5310. [Google Scholar] [CrossRef]
  41. Sloto, R.A.; Crouse, M.Y. HYSEP: A Computer Program for Streamflow Hydrograph Separation and Analysis: U.S. Geological Survey Water-Resources Investigations Report 96–4040; U.S. Geological Survey: Lemoyne, PA, USA, 1996. Available online: https://pubs.er.usgs.gov/publication/wri964040 (accessed on 5 February 2022).
  42. Pettyjohn, W.A.; Henning, R. Preliminary Estimate of Regional Effective Ground-Water Recharge Rates in Ohio; Water Resources Center; Ohio State University: Columbus, OH, USA, 1979. [Google Scholar]
  43. Rauscher, S.A.; Pal, J.S.; Diffenbaugh, N.S.; Benedetti, M.M. Future changes in snowmelt-driven runoff timing over the western US. Geophys. Res. Lett. 2008, 35, L16703. [Google Scholar] [CrossRef] [Green Version]
  44. Nash, J.E.; Sutcliffe, J.V. River flow forecasting through conceptual models part I—A discussion of principles. J. Hydrol. 1970, 10, 282–290. [Google Scholar] [CrossRef]
  45. Gocic, M.; Trajkovic, S. Analysis of changes in meteorological variables using Mann-Kendall and Sen’s slope estimator statistical tests in Serbia. Glob. Planet. Chang. 2013, 100, 172–182. [Google Scholar] [CrossRef]
  46. Jiang, W.; Yuan, L.; Wang, W.; Cao, R.; Zhang, Y.; Shen, W. Spatio-temporal analysis of vegetation variation in the Yellow River Basin. Ecol. Indic. 2015, 51, 117–126. [Google Scholar] [CrossRef]
  47. Sen, P.K. Estimates of the regression coefficient based on Kendall’s Tau. J. Am. Stat. Assoc. 1968, 63, 1379–1389. [Google Scholar] [CrossRef]
  48. Afzal, M.; Mansell, M.G.; Gagnon, A.S. Trends and variability in daily precipitation in Scotland. Procedia Environ. Sci. 2011, 6, 15–26. [Google Scholar] [CrossRef] [Green Version]
  49. Deng, J. Control problems of grey systems. Syst. Control. Lett. 1982, 1, 288–294. [Google Scholar]
  50. Morán, J.; Granada, E.; Míguez, J.L.; Porteiro, J. Use of grey relational analysis to assess and optimize small biomass boilers. Fuel Processing Technol. 2006, 87, 123–127. [Google Scholar] [CrossRef]
  51. Liu, P.J.; Zhao, Z.L.; Yan, X.J.M.; Research, E. Grey Relational Analysis on the Effects of Rainfall Factors on Runoff and Sediment in the Sloping Farmland with Different Plants in the Central South of Shandong Province. Meteorol. Environ. Res. 2011, 2, 52–55. [Google Scholar]
  52. Grace, J.B. Structural Equation Modeling and Natural Systems; Cambridge University Press: Cambridge, UK, 2006. [Google Scholar]
  53. Bendixen, M.; Lonsmann Iversen, L.; Anker Bjork, A.; Elberling, B.; Westergaard-Nielsen, A.; Overeem, I.; Barnhart, K.R.; Khan, S.A.; Box, J.E.; Kroon, A.; et al. Delta progradation in Greenland driven by increasing glacial mass loss. Nature 2017, 550, 101–104. [Google Scholar] [CrossRef]
  54. Davenport, F.V.; Herrera-Estrada, J.E.; Burke, M.; Diffenbaugh, N.S. Flood Size Increases Nonlinearly Across the Western United States in Response to Lower Snow-Precipitation Ratios. Water Resour. Res. 2020, 56, e2019WR025571. [Google Scholar] [CrossRef] [Green Version]
  55. Jepsen, S.M.; Harmon, T.C.; Meadows, M.W.; Hunsaker, C.T. Hydrogeologic influence on changes in snowmelt runoff with climate warming: Numerical experiments on a mid-elevation catchment in the Sierra Nevada, USA. J. Hydrol. 2016, 533, 332–342. [Google Scholar] [CrossRef]
  56. Mote, P.; Li, S.; Lettenmaier, D.; Xiao, M.; Engel, R. Dramatic declines in snowpack in the western US. NPJ Clim. Atmos. Sci. 2018, 1, 2. [Google Scholar] [CrossRef]
  57. Tennant, C.J.; Crosby, B.T.; Godsey, S.E. Elevation-dependent responses of streamflow to climate warming. Hydrol. Processes 2015, 29, 991–1001. [Google Scholar] [CrossRef]
  58. Kumar, M.; Chen, X.; Winstral, A.; Wang, R.; Marks, D. Assessment of the Timing of Daily Peak Streamflow during the Melt Season in a Snow-Dominated Watershed. J. Hydrometeorol. 2016, 17, 2225–2244. [Google Scholar]
  59. Champagne, O.; Arain, M.A.; Leduc, M.; Coulibaly, P.; McKenzie, S. Future shift in winter streamflow modulated by the internal variability of climate in southern Ontario. Hydrol. Earth Syst. Sci. 2020, 24, 3077–3096. [Google Scholar] [CrossRef]
  60. Hammond, J.C.; Kampf, S.K. Subannual Streamflow Responses to Rainfall and Snowmelt Inputs in Snow-Dominated Watersheds of the Western United States. Water Resour. Res. 2020, 56, e2019WR026132. [Google Scholar] [CrossRef]
  61. Asarian, J.E.; Walker, J.D. Long-Term Trends in Streamflow and Precipitation in Northwest California and Southwest Oregon, 1953–2012. J. Am. Water Resour. Assoc. 2016, 52, 241–261. [Google Scholar] [CrossRef]
  62. Wang, R.; Kumar, M.; Link, T.E. Potential trends in snowmelt-generated peak streamflows in a warming climate. Geophys. Res. Lett. 2016, 43, 5052–5059. [Google Scholar] [CrossRef] [Green Version]
  63. Hatchett, B.J.; Boyle, D.P.; Garner, C.B.; Kaplan, M.L.; Putnam, A.E.; Bassett, S.D. Magnitude and frequency of wet years under a megadrought climate in the western Great Basin, USA. Quat. Sci. Rev. 2016, 152, 197–202. [Google Scholar] [CrossRef]
  64. Musselman, K.N.; Clark, M.P.; Liu, C.H.; Ikeda, K.; Rasmussen, R. Slower snowmelt in a warmer world. Nat. Clim. Chang. 2017, 7, 214–219. [Google Scholar] [CrossRef]
  65. McGlynn, B.L.; McDonnell, J.J.; Seibert, J.; Kendall, C. Scale effects on headwater catchment runoff timing, flow sources, and groundwater-streamflow relations. Water Resour. Res. 2004, 40, W07504. [Google Scholar] [CrossRef] [Green Version]
  66. Liu, F.; Hunsaker, C.; Bales, R.C. Controls of streamflow generation in small catchments across the snow-rain transition in the Southern Sierra Nevada, California. Hydrol. Processes 2013, 27, 1959–1972. [Google Scholar] [CrossRef]
  67. Foy, C.; Arabi, M.; Yen, H.; Gironás, J.; Bailey, R.T. Multisite Assessment of Hydrologic Processes in Snow-Dominated Mountainous River Basins in Colorado Using a Watershed Model. J. Hydrol. Eng. 2015, 20, 04015017. [Google Scholar] [CrossRef]
  68. Fang, Z.; Carroll, R.W.H.; Schumer, R.; Harman, C.; Wilusz, D.; Williams, K.H. Streamflow partitioning and transit time distribution in snow-dominated basins as a function of climate. J. Hydrol. 2019, 570, 726–738. [Google Scholar] [CrossRef]
  69. Kormos, P.R.; Luce, C.H.; Wenger, S.J.; Berghuijs, W.R. Trends and sensitivities of low streamflow extremes to discharge timing and magnitude in Pacific Northwest mountain streams. Water Resour. Res. 2016, 52, 4990–5007. [Google Scholar] [CrossRef] [Green Version]
  70. Hood, J.L.; Hayashi, M. Characterization of snowmelt flux and groundwater storage in an alpine headwater basin. J. Hydrol. 2015, 521, 482–497. [Google Scholar] [CrossRef]
  71. Beaulieu, M.; Schreier, H.; Jost, G. A shifting hydrological regime: A field investigation of snowmelt runoff processes and their connection to summer base flow, Sunshine Coast, British Columbia. Hydrol. Processes 2012, 26, 2672–2682. [Google Scholar] [CrossRef]
  72. Flint, A.L.; Flint, L.E.; Dettinger, M.D. Modeling Soil Moisture Processes and Recharge under a Melting Snowpack. Vadose Zone J. 2008, 7, 350–357. [Google Scholar] [CrossRef]
  73. Kampf, S.K.; Lefsky, M.A. Transition of dominant peak flow source from snowmelt to rainfall along the Colorado Front Range: Historical patterns, trends, and lessons from the 2013 Colorado Front Range floods. Water Resour. Res. 2016, 52, 407–422. [Google Scholar] [CrossRef] [Green Version]
Figure 1. The geographic locations and topographies of the Incline Creek, Twin River, and Cleve Creek watersheds located in the Great Basin of Nevada.
Water 14 01095 g001
Figure 2. The occurrence of Q25 and Q50 and the peak discharge in three watersheds. (ac) for PQ in Cleve Creek, Twin River and Incline Creek, and (df) for Q25 and Q50 in t in Cleve Creek, Twin River and Incline Creek.
Water 14 01095 g002
Figure 3. Correlation between snow indices (SMR, SP, SRT, and SSL) and streamflow timing variables (Q25, Q50, and PQD) at the watershed scale. The correlation is significant at the 0.05 significance level with colors.
Water 14 01095 g003
Figure 4. GRA grades between snow metrics (SMR, SP, SRT, and SSL) and flow metrics (Q25, Q50, PQD, PQ, ASF, and SBF).
Water 14 01095 g004
Figure 5. Structural equation model examining the multivariate effects on Q25. The black and red arrows represent positive and negative effects, respectively. The asterisk symbols * and ** indicate that effects are significant at the 0.01 and 0.05 levels, respectively.
Water 14 01095 g005
Figure 6. Correlation coefficients between snow indices (SMR, SP, SRT, and SSL) and streamflow timing variables (PQ, ASF, and SBF) at the watershed scale. The correlation is significant at the 0.05 significance level with colors.
Water 14 01095 g006
Figure 7. Annual streamflow and partitioned snow-driven and rain-driven streamflow during (1) 1991–1998, (2) 1999–2007 and (3) 2008–2016.
Water 14 01095 g007
Figure 8. Differences in the fraction of seasonal streamflow out of the total annual streamflow between simulation under 1 °C warming scenario (daily minimum and maximum temperature increased by 1 °C relative to the reference simulation) and that under the reference simulation in the Cleve Creek watershed during 1990 to 2016.
Water 14 01095 g008
Table 1. Definition of snow and flow metrics.
TypeNameDefinition
Snow metricsSMRRatio of annual ablation volume to ablation snowmelt days [4]
SPFraction of time that snow is present on the ground [25]
SRTDistance between the center of snow accumulating timing and snowmelt timing [38,39]
SSLThe continuous interval with an unbroken snow cover in a water year [25,40]
Flow
metrics
Q25Day of 25% of water year’s cumulative discharge
Q50Day of 50% of water year’s cumulative discharge
PQDDay of peak discharge in each water year
PQPeak discharge (mm)
ASFAnnual streamflow (mm)
SBFSummer base flow (mm)
Note: The snow metrics SMR, SP, SRT, and SSL are abbreviations for snowmelt rate, snow persistence, mean snow residence time, and snow season length, respectively. The flow metrics Q25, Q50, PQD, PQ, ASF, and SBF are abbreviations for 25% of cumulative annual discharge, 50% of cumulative annual discharge, day of peak discharge, peak discharge, annual streamflow, and summer baseflow, respectively.
Table 2. Trends of snow and flow metrics in three watersheds.
MetricsCleve Creek Trend (T)Twin River
Trend (T)
Incline Creek Trend (T)
SMR (mm/d)−0.02−0.04 **−0.05
SP (%)0.1−0.2−0.1
SRT−0.02−1.08 *−0.66
SSL (d)−0.67−1.19 *−0.67
Q25−0.39−0.960.15
Q50−0.30−0.630.26
PQD−0.25−0.550.10
PQ (mm)0.004−0.03−0.08
ASF (mm)1.08−0.98−2.05
SBF (mm)0.02−0.21−1.12
Note: The asterisk symbols * and ** indicate that trends are significant at the 0.05 and 0.01 levels, respectively.
Publisher’s Note: MDPI stays neutral with regard to jurisdictional claims in published maps and institutional affiliations.

