
Proposal of a Water-Quality Index for High Andean Basins: Application to the Chumbao River, Andahuaylas, Peru

 ,
, 
 , ,
, , 
 and
and
Abstract
:1. Introduction
2. Materials and Methods
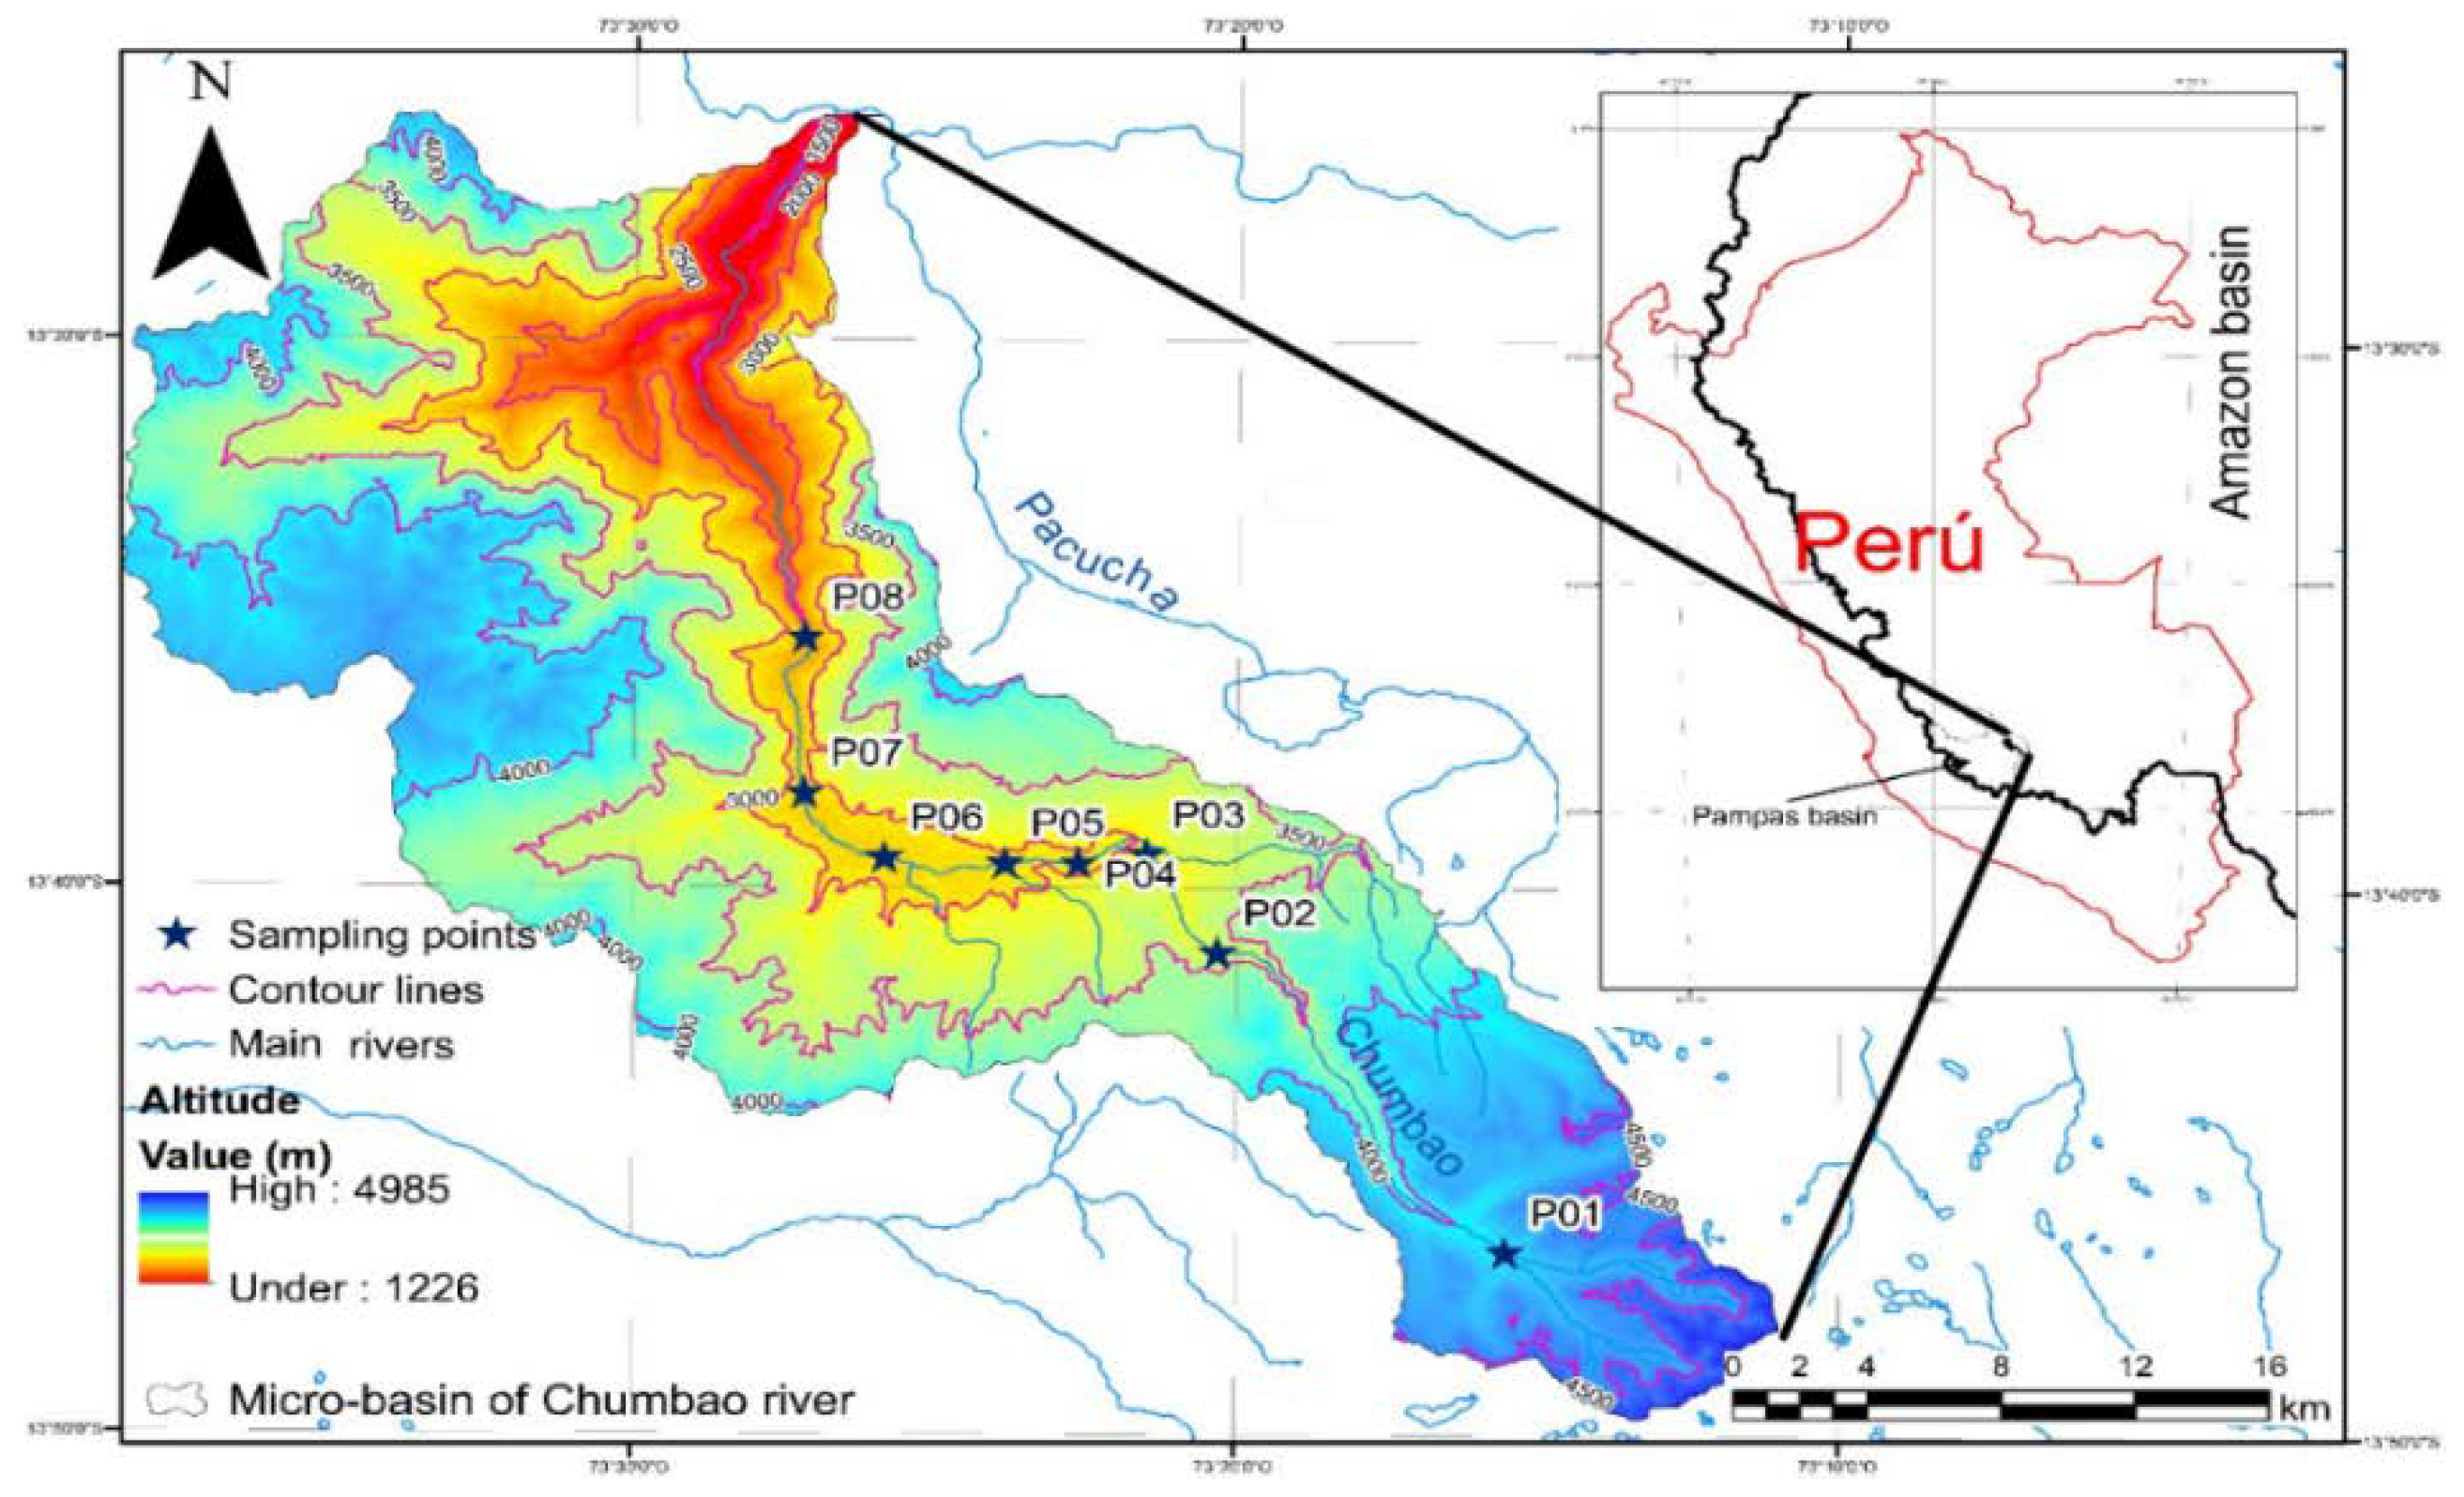
2.1. Study Area
2.2. Sampling and Analysis
2.3. Delphi Method Application
2.3.1. Selection of Experts
2.3.2. Selection of Water-Quality Parameters
2.3.3. Assignment of Weights to Parameters
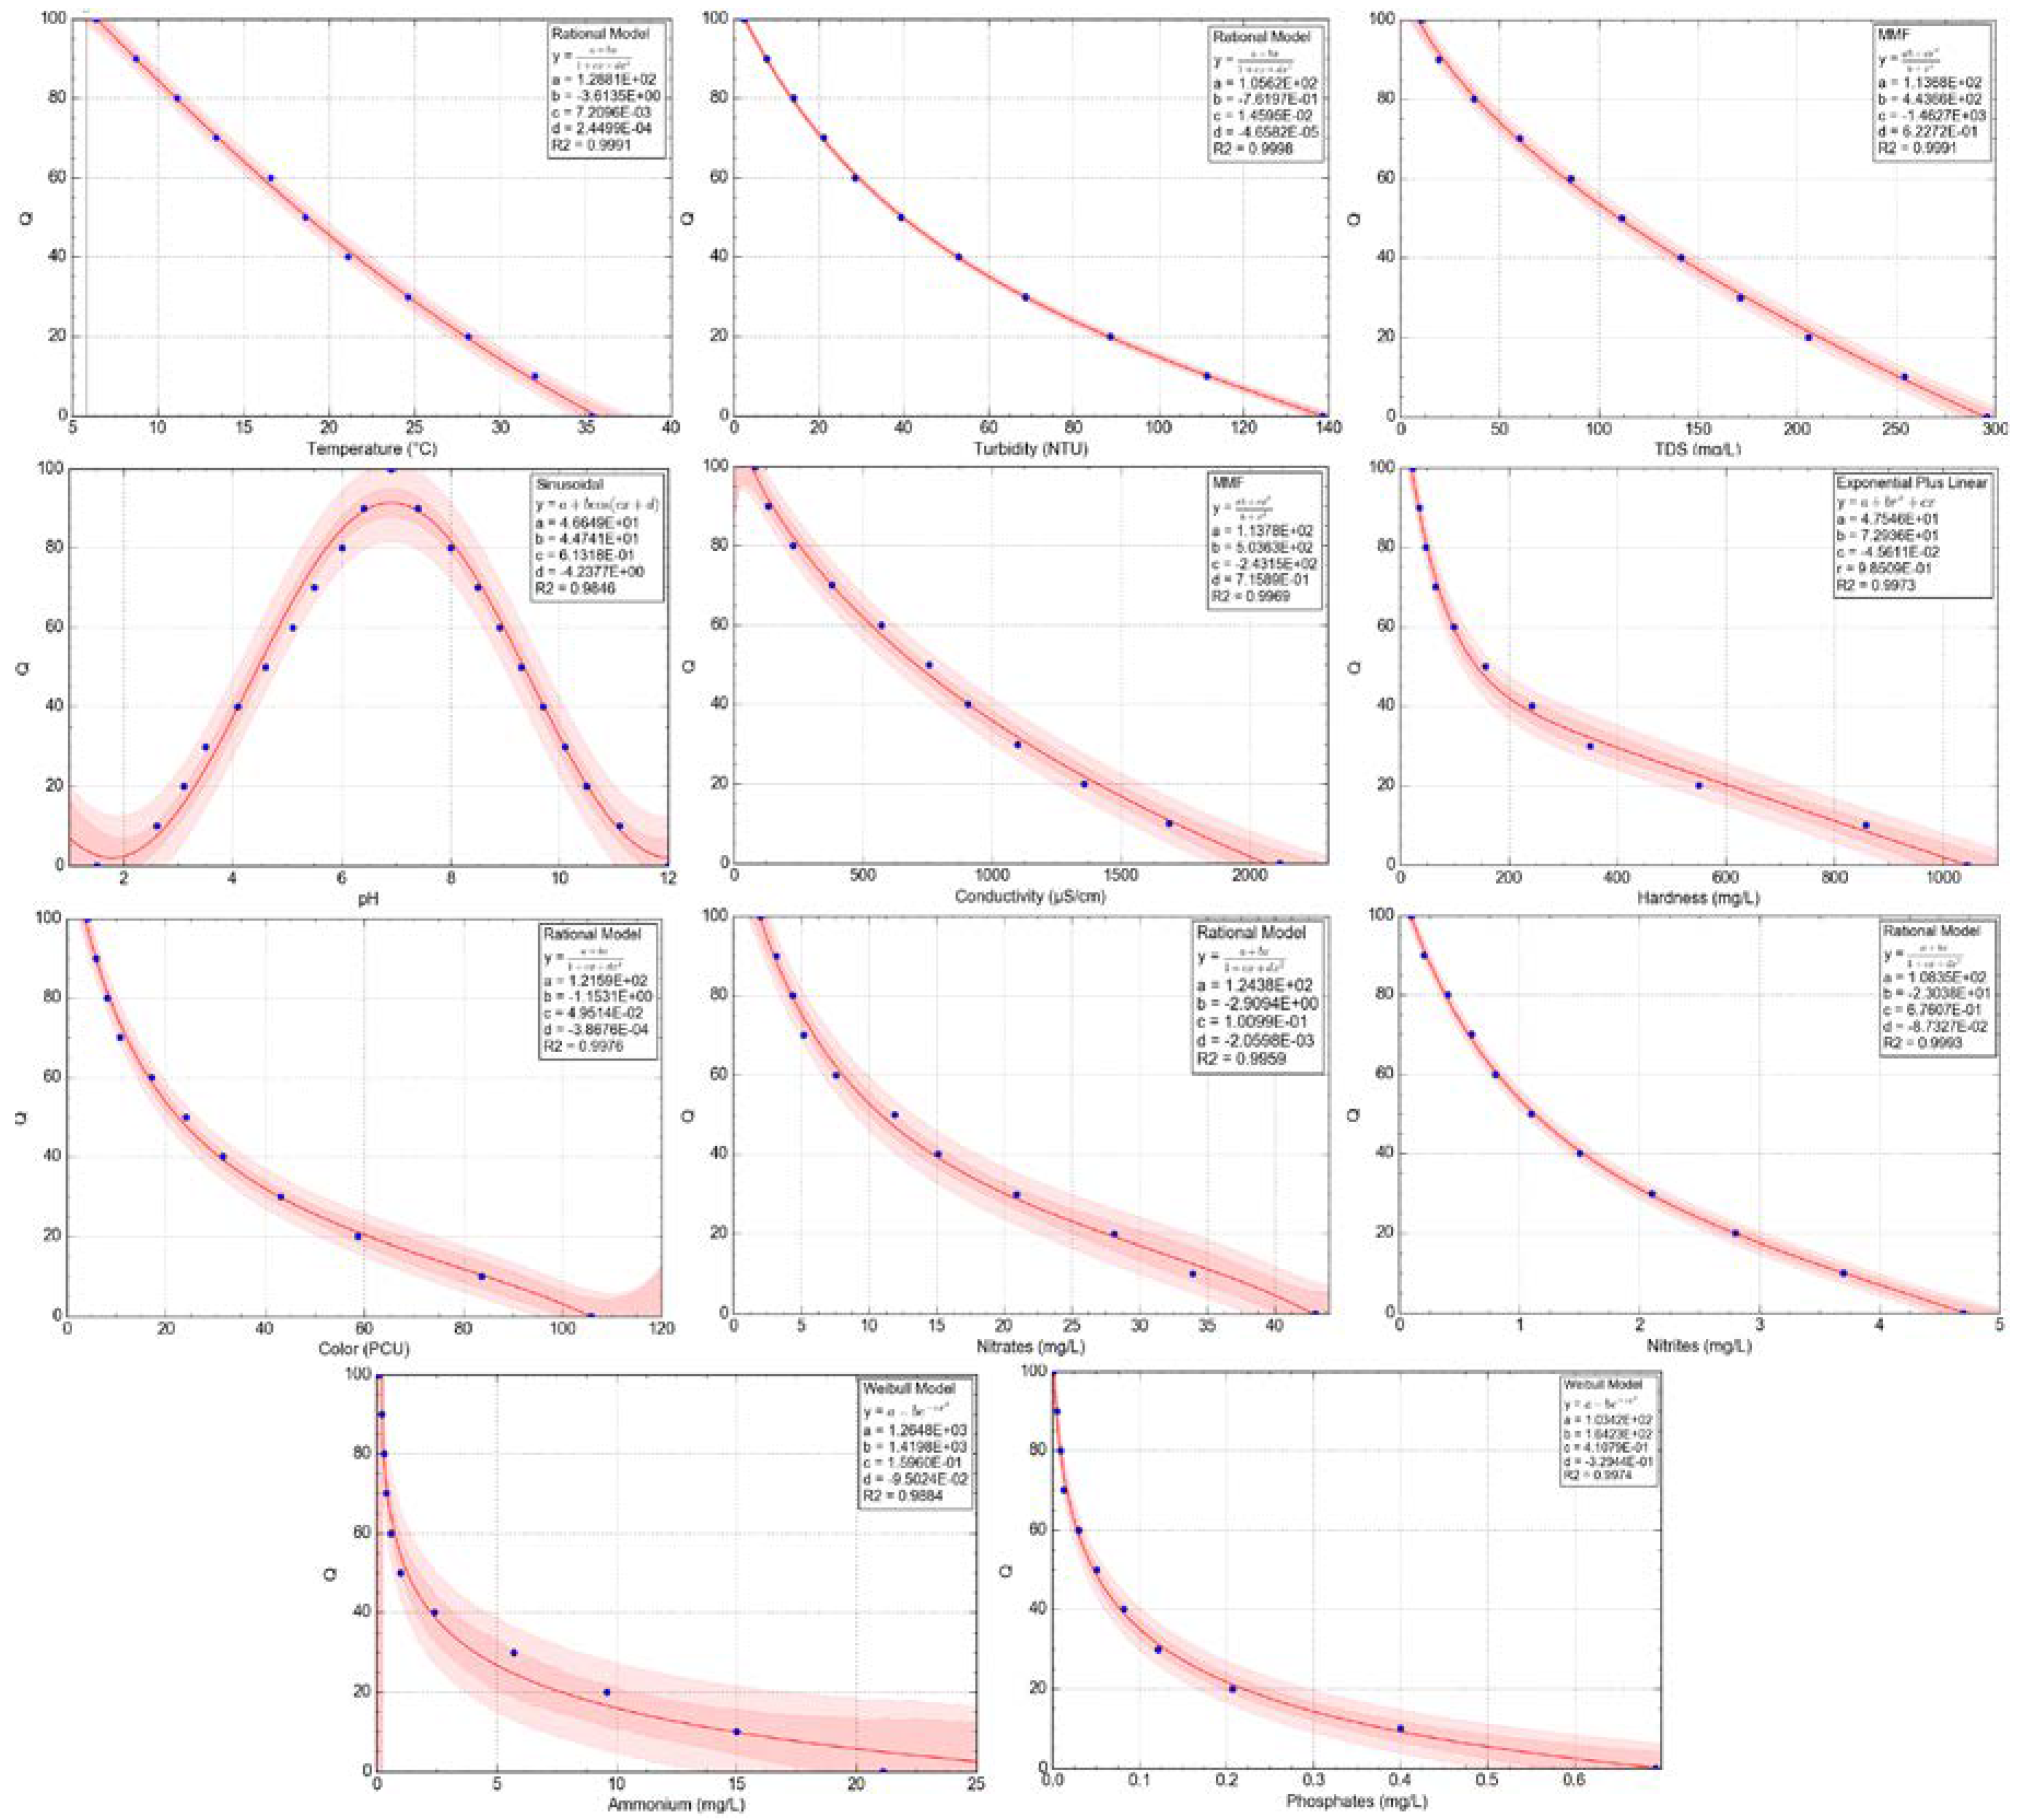
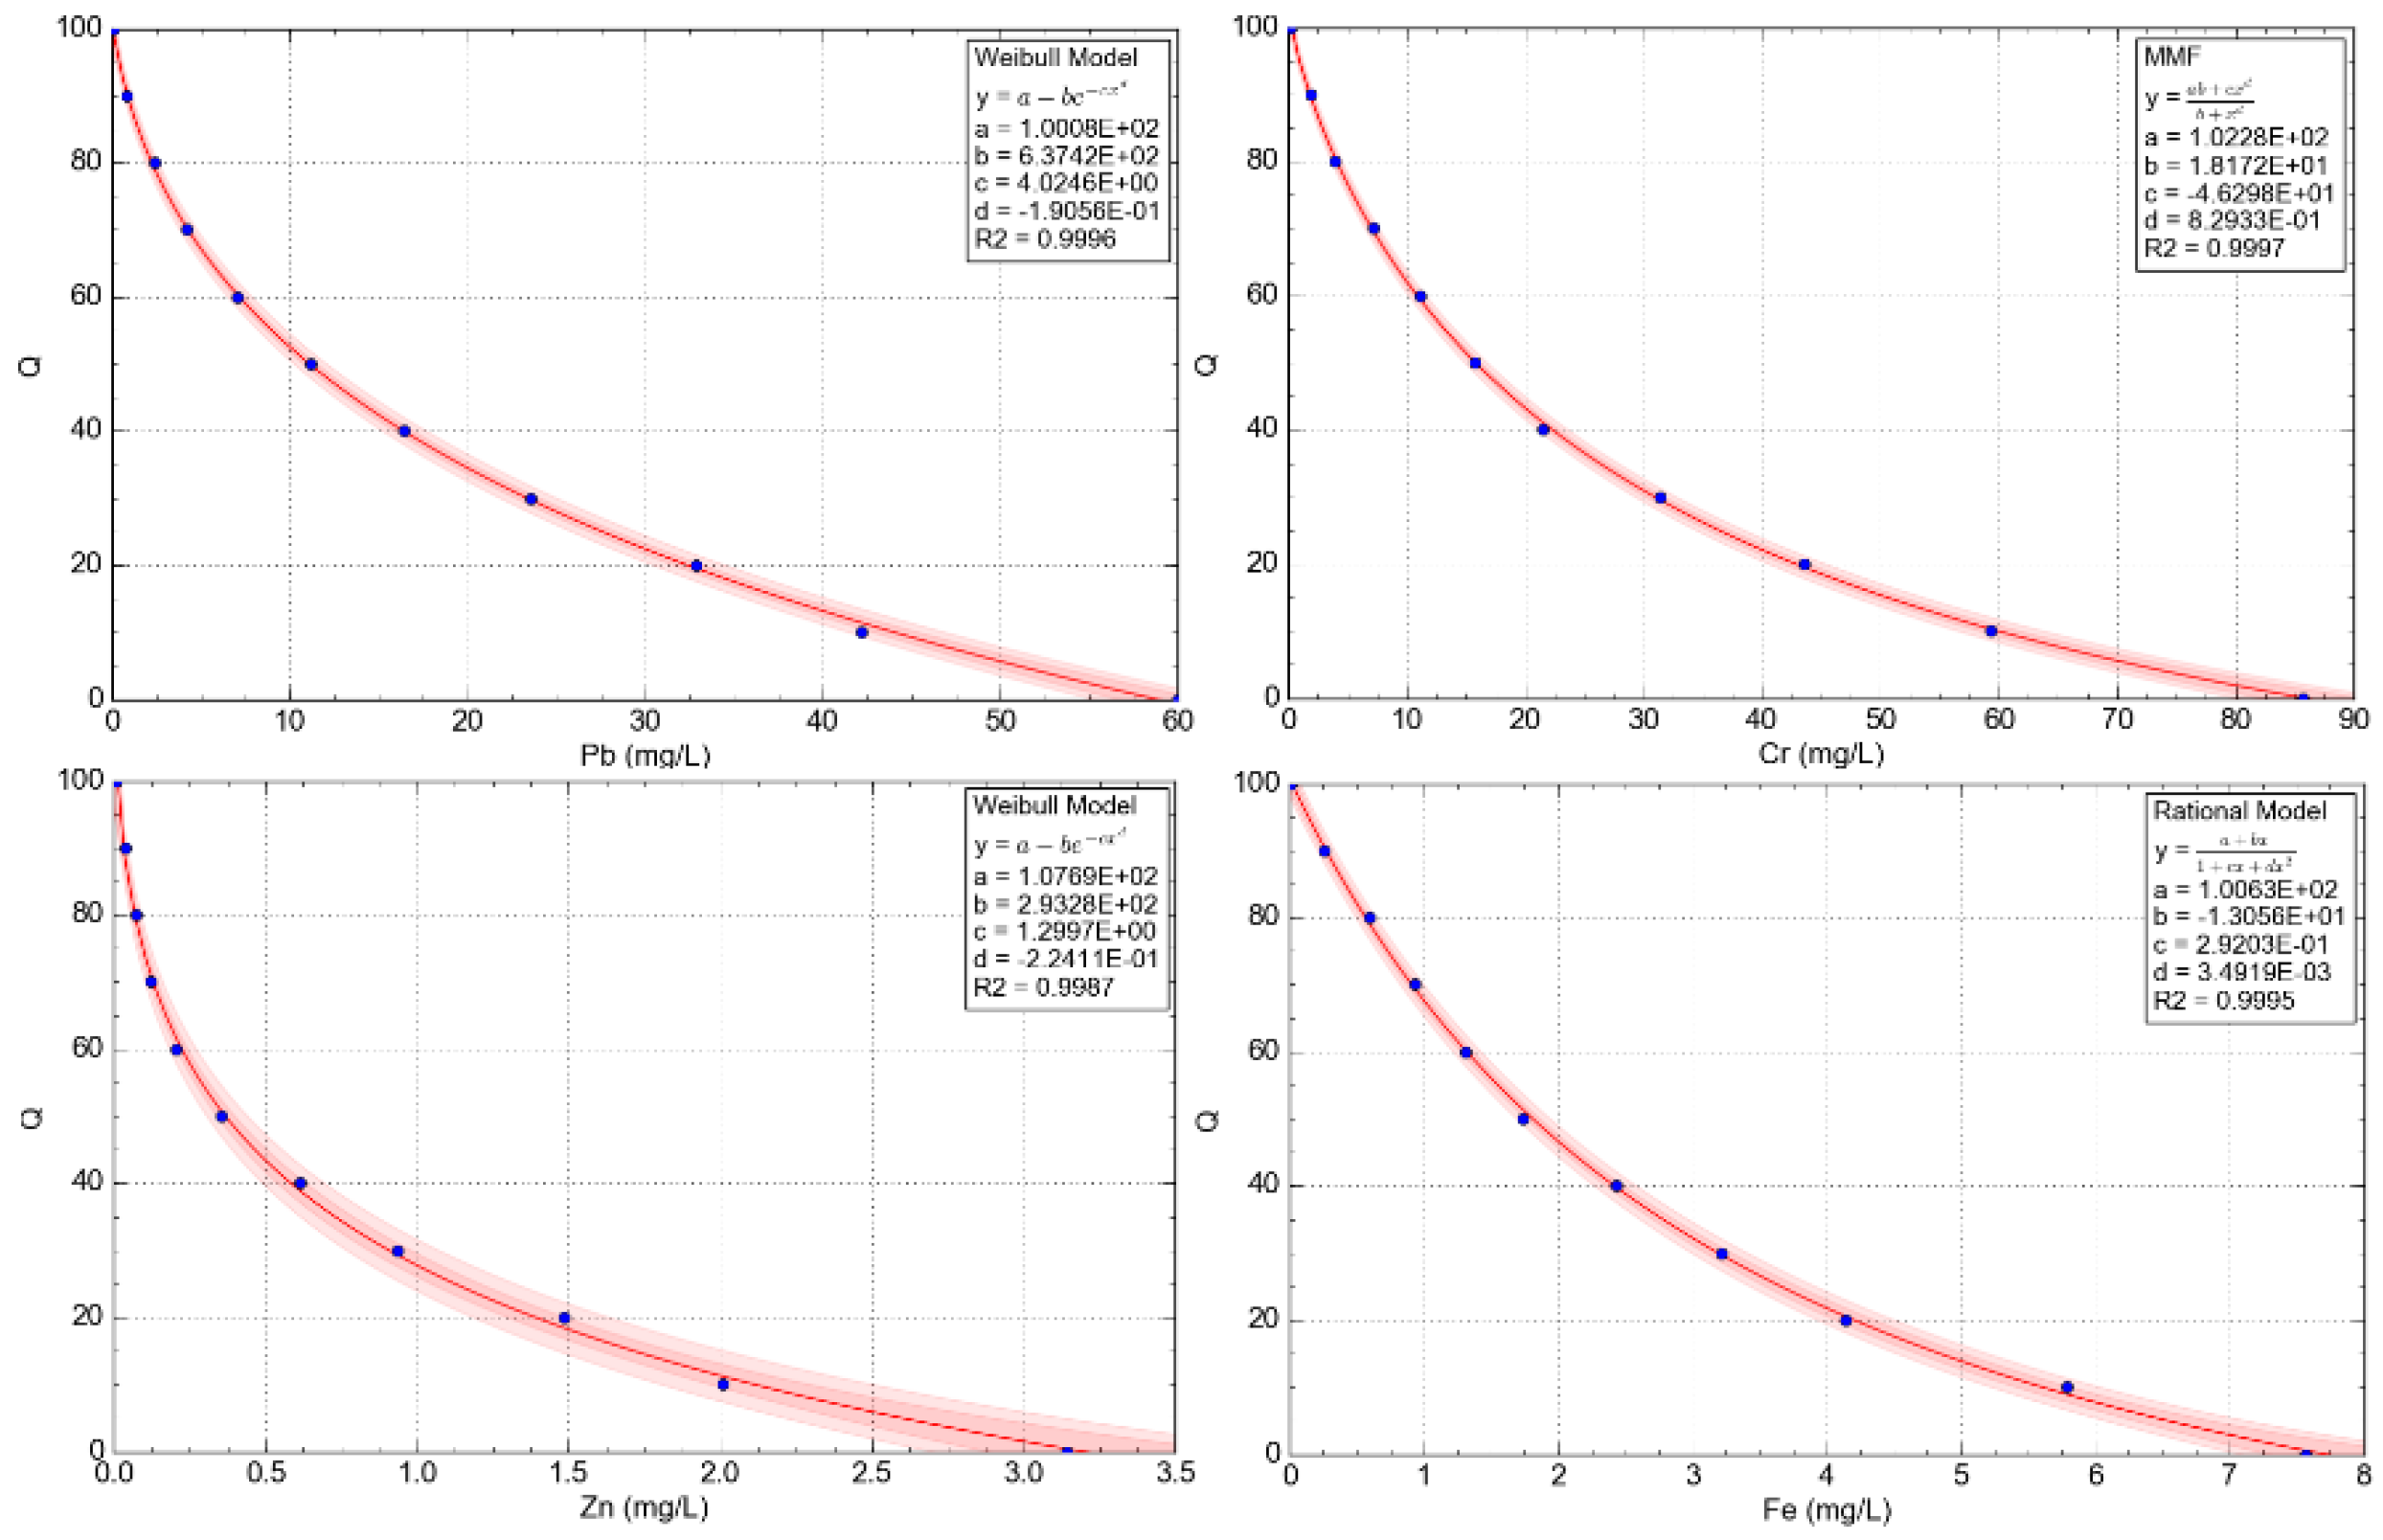
2.3.4. Assignment of Nominal Value to Parameters
2.4. Quality Index Construction
3. Results and Discussion
3.1. Delphi Method Application

| Parameters | Proposal | WQI Reference Weights | |||||||
|---|---|---|---|---|---|---|---|---|---|
| Inclusion Percentage | Total Weighting Score | C.V. (%) | Weight (Wi) | UWQI [40] | Tigris River [43] | IAP–Brazil [64] | Dinius-NSF [68] | UWQI-UE [90] | |
| Physicochemical | |||||||||
| Temperature | 100.0 | 20 | 24.2 | 0.064 | 0.100 | 0.077 | |||
| Turbidity | 100.0 | 32 | 11.7 | 0.102 | 0.0696 | 0.087 | 0.080 | ||
| TDS | 85.7 | 23 | 14.9 | 0.073 | 0.091 | 0.080 | |||
| pH | 100.0 | 33 | 10.4 | 0.105 | 0.0911 | 0.100 | 0.120 | 0.077 | 0.029 |
| Conductivity | 100.0 | 27 | 17.9 | 0.086 | 0.0692 | 0.116 | 0.079 | ||
| Hardness | 100.0 | 24 | 15.6 | 0.076 | 0.0587 | 0.051 | 0.065 | ||
| Color | 85.7 | 29 | 16.7 | 0.092 | 0.063 | ||||
| Nitrates | 100.0 | 33 | 10.4 | 0.105 | 0.0909 | 0.190 | 0.090 | 0.086 | |
| Nitrites | 85.7 | 30 | 17.6 | 0.096 | 0.093 | ||||
| Ammonium | 85.7 | 30 | 17.6 | 0.096 | 0.1035 | ||||
| Phosphates | 100.0 | 33 | 10.4 | 0.105 | |||||
| Metals | |||||||||
| Lead | 85.7 | 33 | 10.4 | 0.300 | |||||
| Chrome | 71.4 | 24 | 22.9 | 0.218 | |||||
| Zinc | 100.0 | 25 | 15.0 | 0.227 | |||||
| Iron | 85.7 | 28 | 25.0 | 0.255 | |||||
| Organic material | |||||||||
| COD | 71.4 | 34 | 7.8 | 0.205 | 0.072 | ||||
| OD | 100.0 | 33 | 10.4 | 0.199 | 0.145 | 0.170 | 0.109 | 0.114 | |
| BOD55 | 100.0 | 35 | 0.0 | 0.211 | 0.072 | 0.100 | 0.097 | 0.057 | |
| Thermotolerant Coliforms | 100.0 | 34 | 7.8 | 0.205 | 0.150 | 0.116 | |||
| Total Coliforms | 100.0 | 30 | 11.4 | 0.181 | 0.090 | 0.114 | |||
| Calcium | 0.0726 | ||||||||
| Chloride | 0.0742 | 0.074 | |||||||
| Chlorophyll a | 0.0358 | ||||||||
| Fluoride | 0.0949 | 0.086 | |||||||
| Magnesium | 0.0710 | ||||||||
| Manganese | 0.0910 | ||||||||
| Sulphate | 0.0774 | ||||||||
| Alkalinity | 0.063 | ||||||||
| Cadmium | 0.086 | ||||||||
| Cyanide | 0.086 | ||||||||
| Mercury | 0.086 | ||||||||
| Selenium | 0.086 | ||||||||
| Arsenic | 0.113 | ||||||||
| Total phosphorus | 0.100 | 0.057 | |||||||
| Total nitrogen | 0.100 | ||||||||
| Sodium | 0.058 | ||||||||
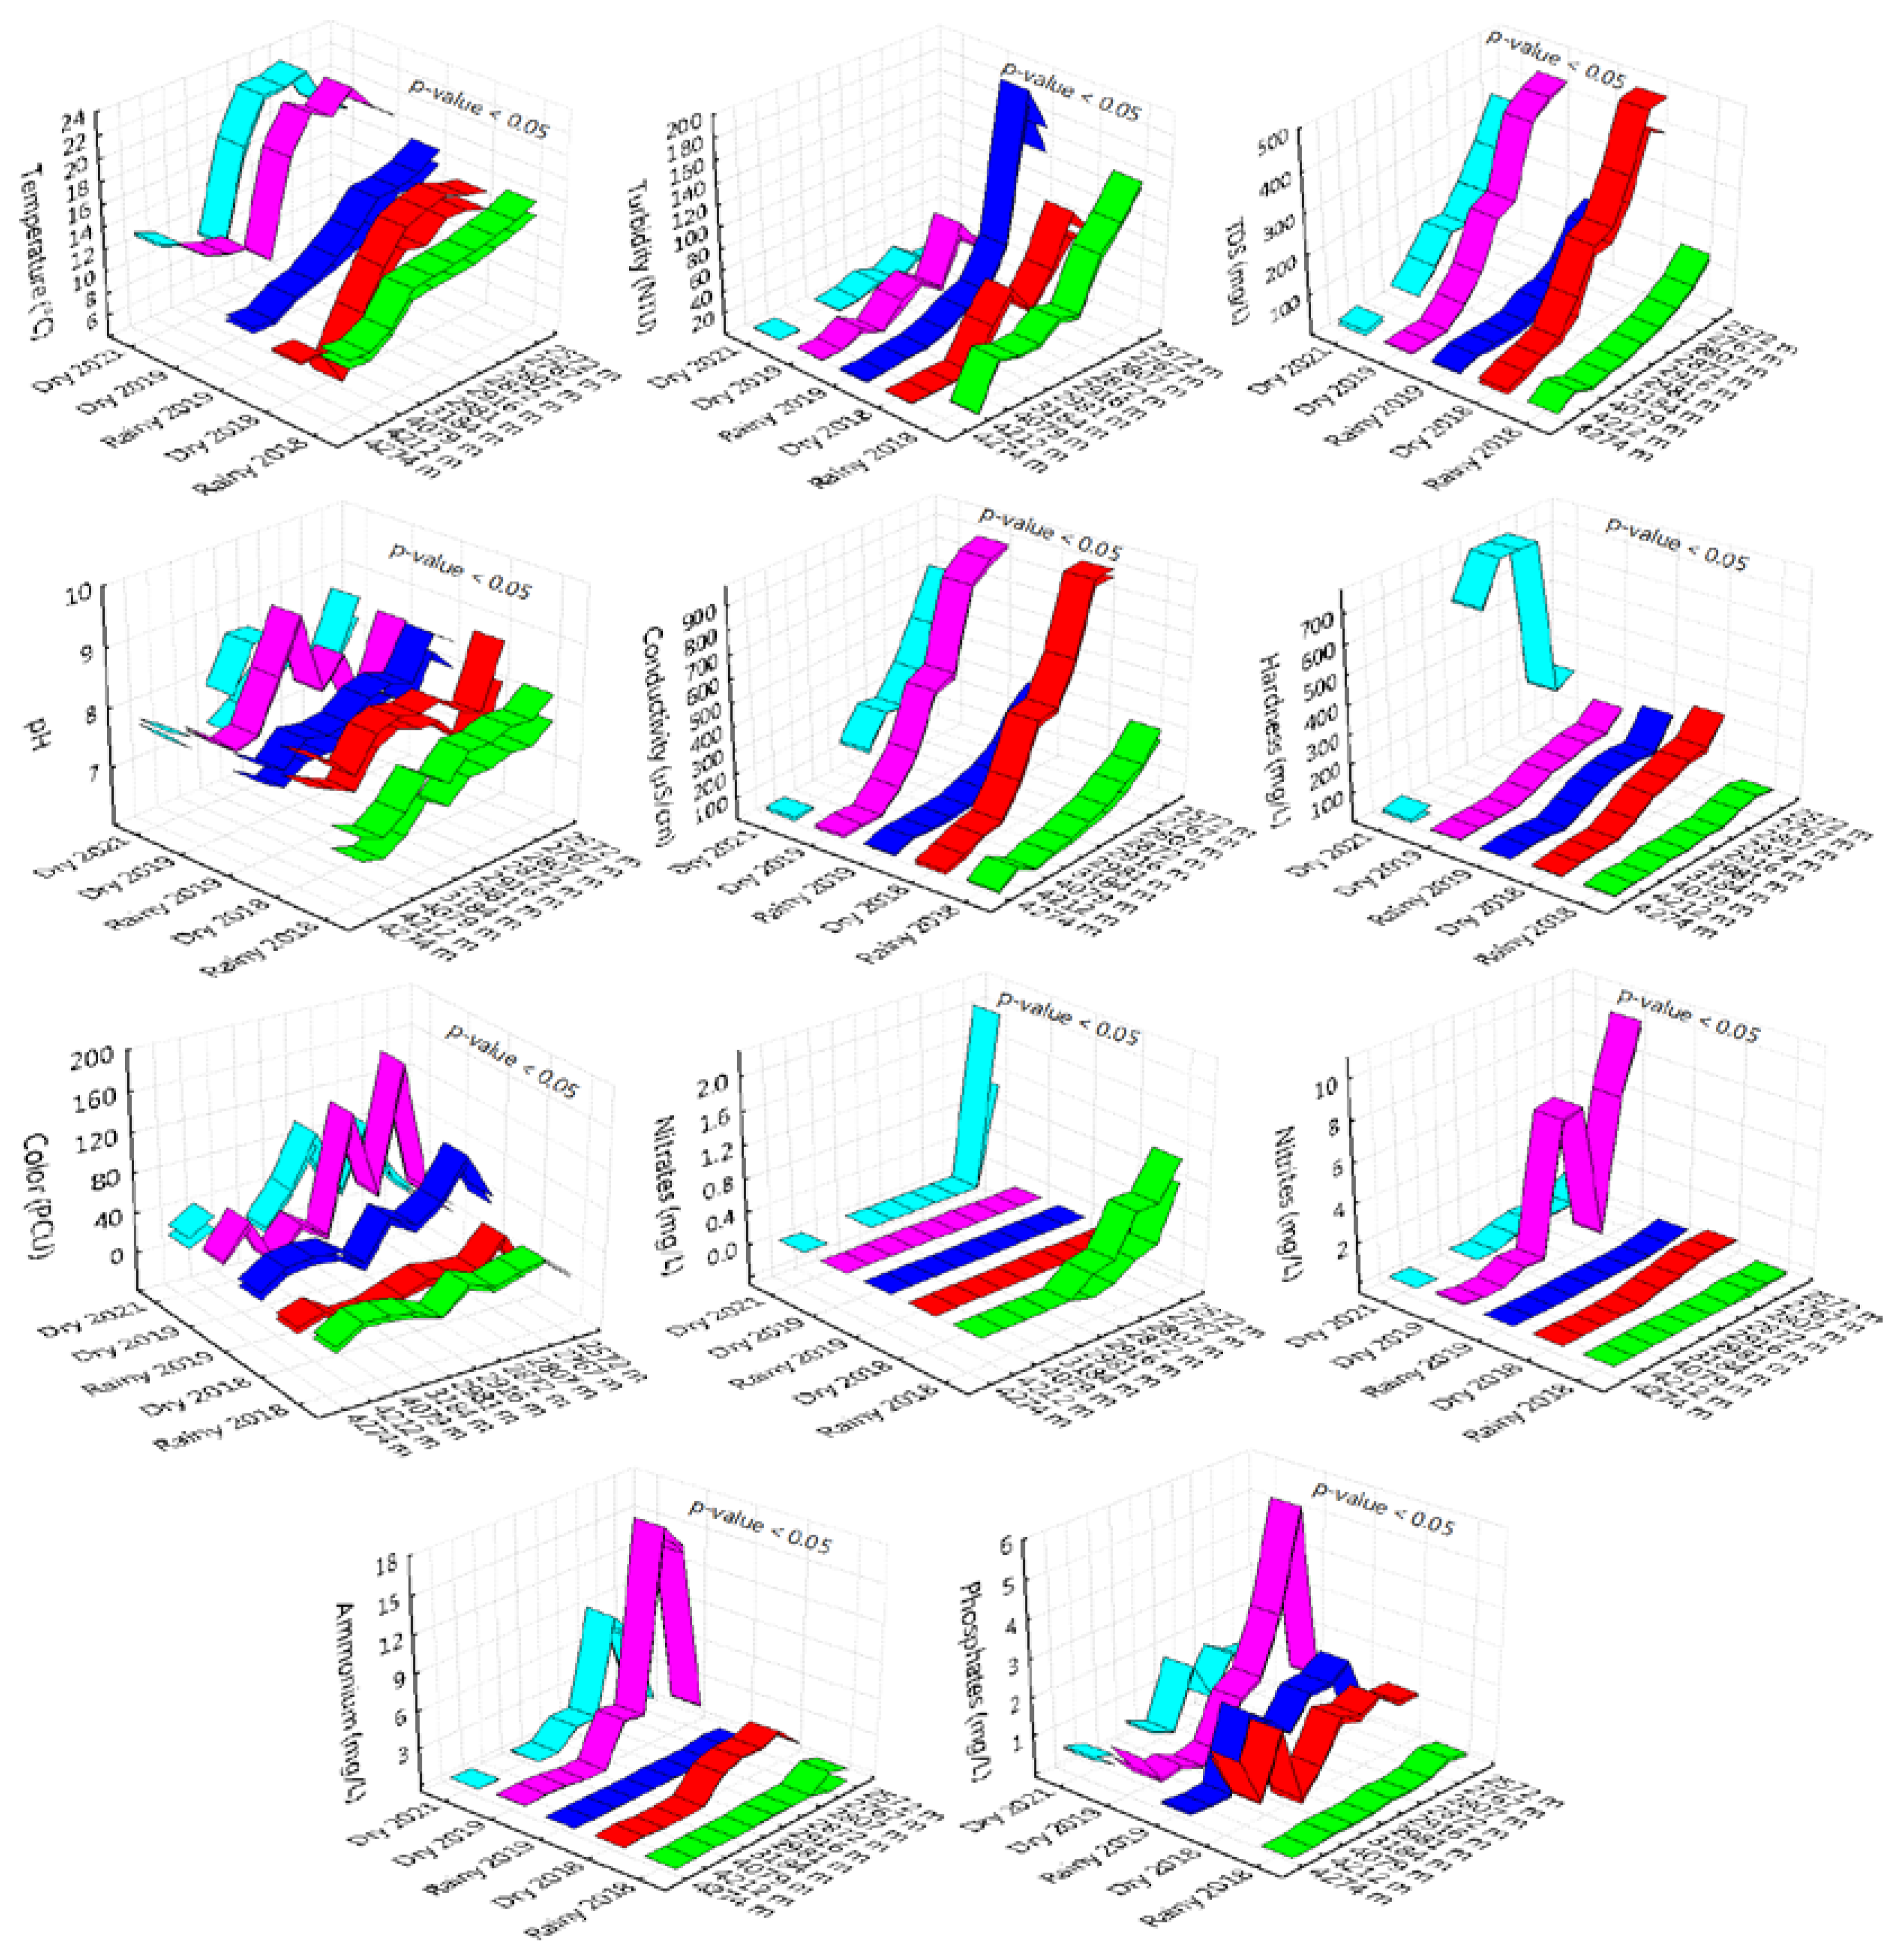
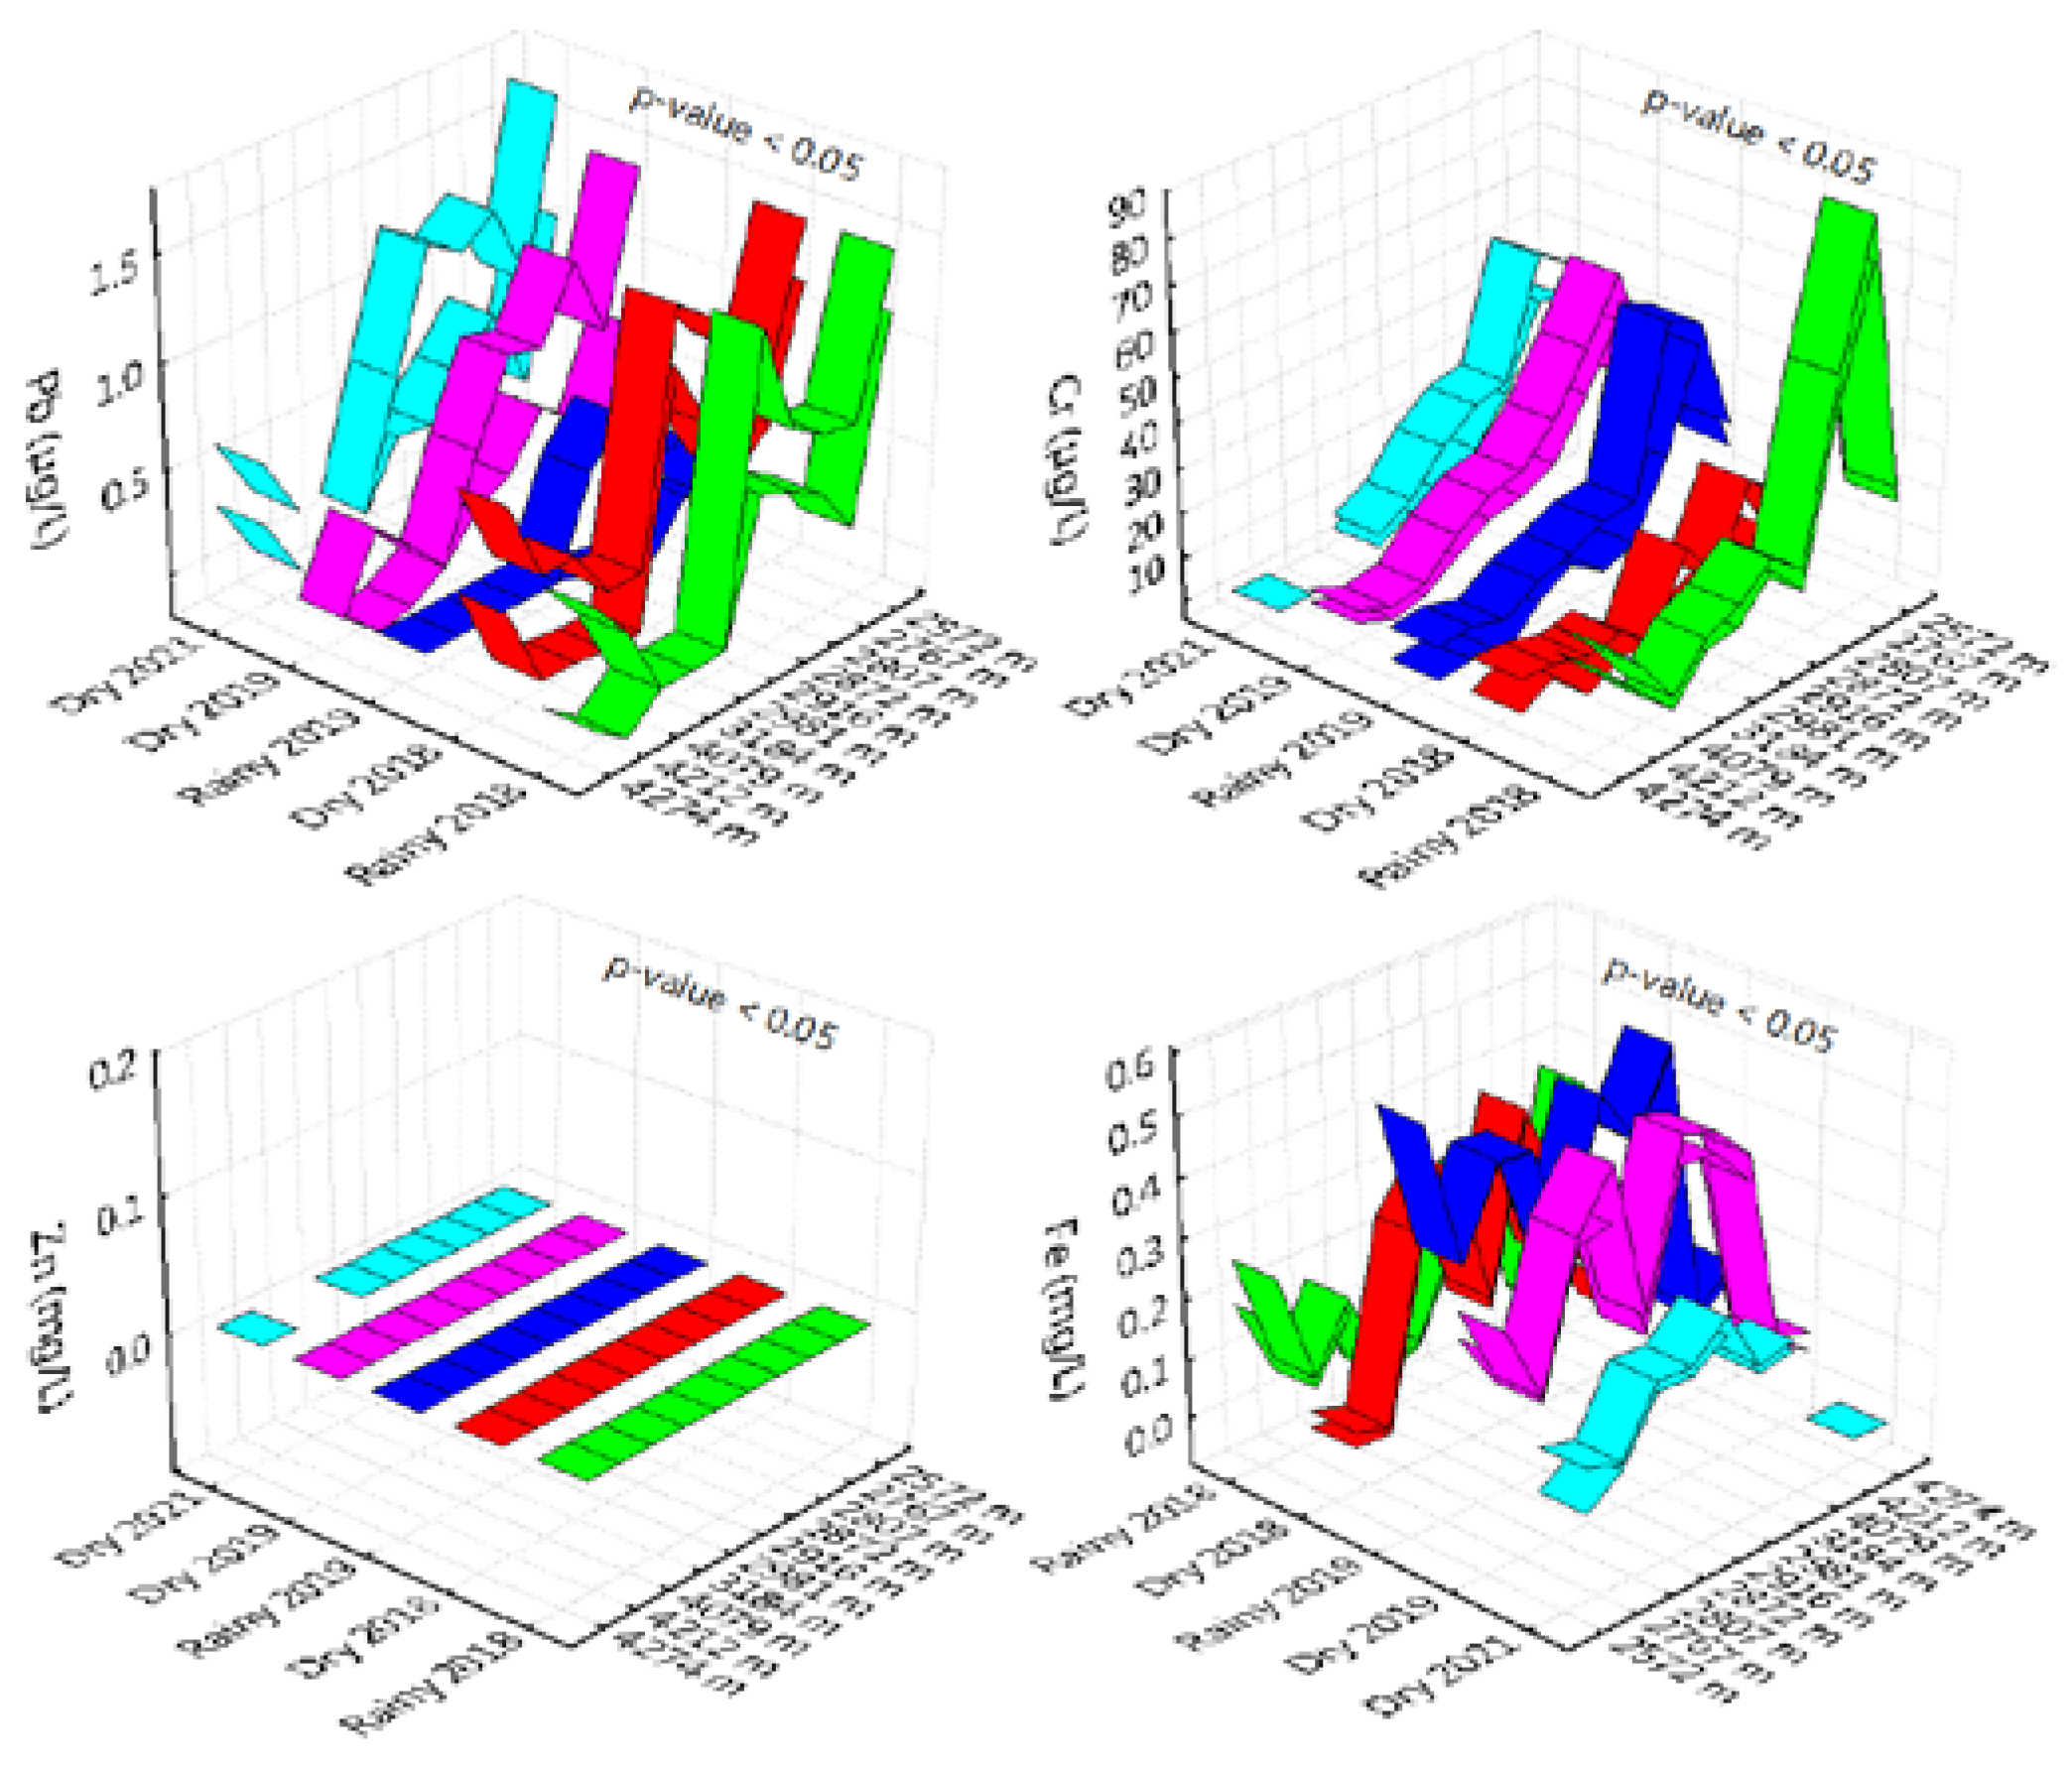
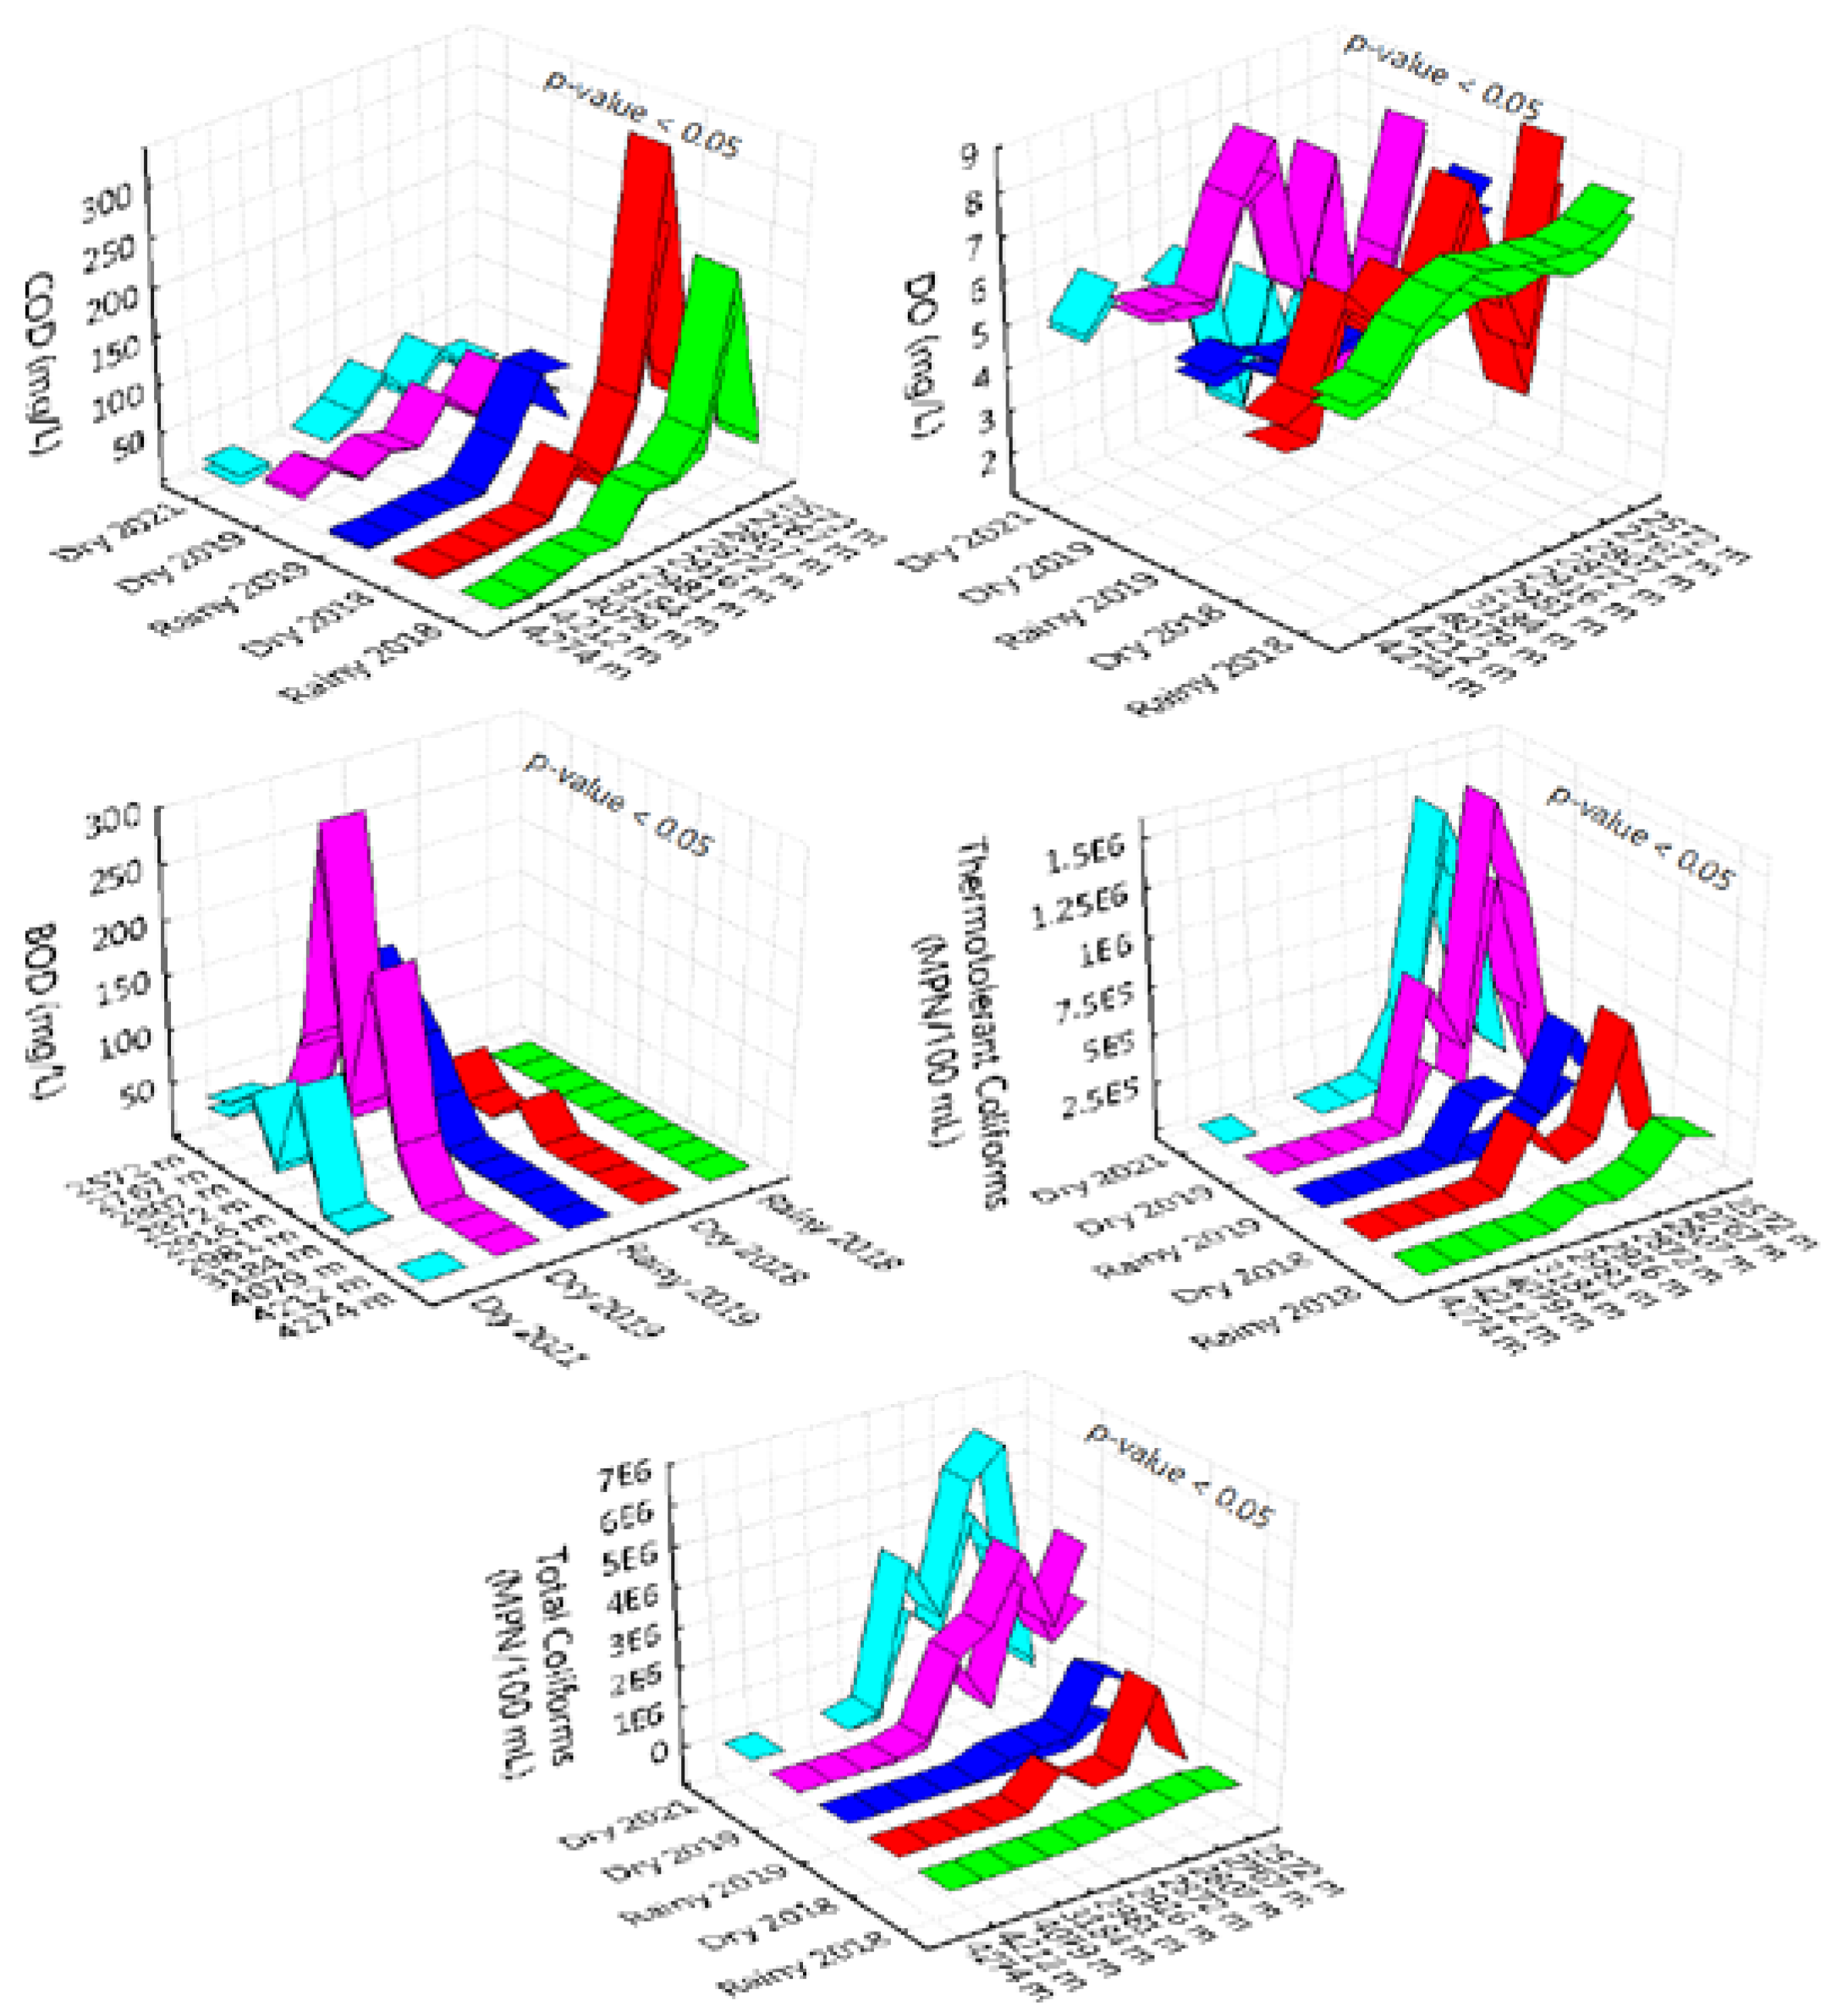
3.2. Characteristics of the Quality Parameters of the Chumbao River
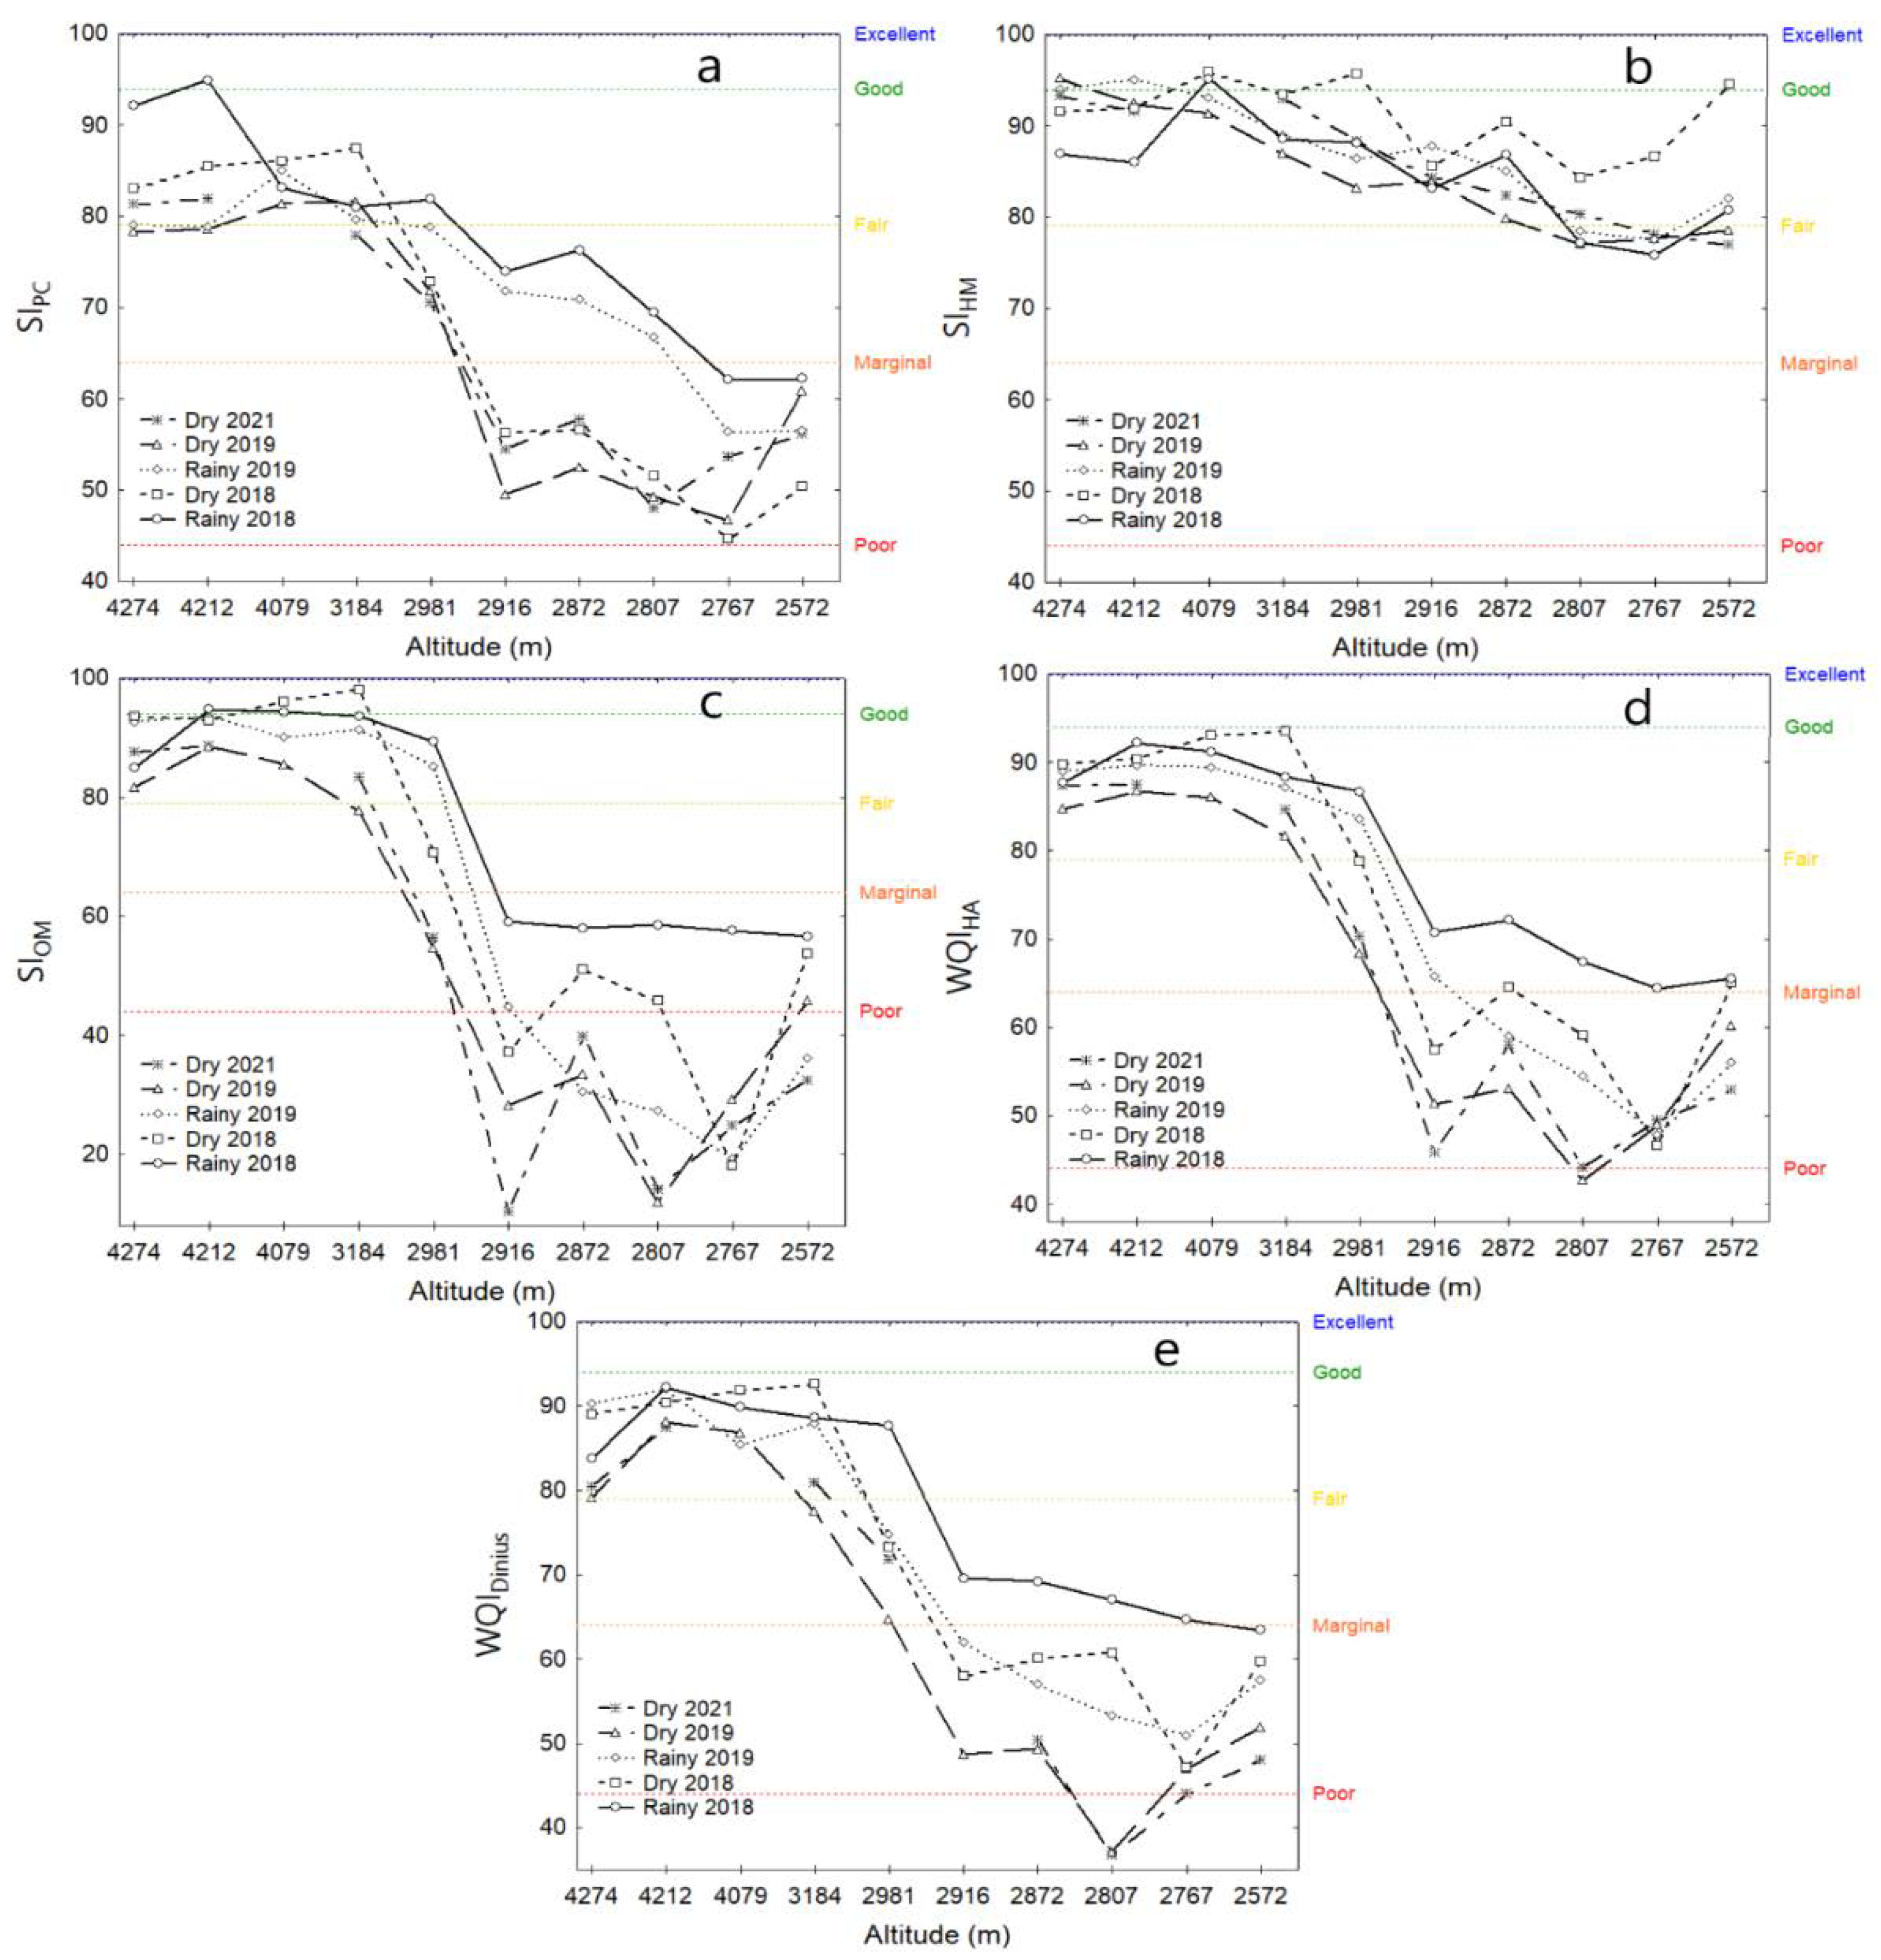
3.3. High Andean Water-Quality Index
4. Conclusions
Author Contributions
Funding
Institutional Review Board Statement
Informed Consent Statement
Data Availability Statement
Acknowledgments
Conflicts of Interest
References
- Sengül, S.; Ispirli, M.N. Predicting Snowmelt Runoff at the Source of the Mountainous Euphrates River Basin in Turkey for Water Supply and Flood Control Issues Using HEC-HMS Modeling. Water 2022, 14, 284. [Google Scholar] [CrossRef]
- Panagoulia, D. Hydrological response of a medium-sized mountainous catchment to climate changes. Hydrol. Sci. J. 1991, 36, 525–547. [Google Scholar] [CrossRef]
- Hadi Pour, S.; Wahab, A.A.; Shahid, S.; Wang, X. Spatial Pattern of the Unidirectional Trends in Thermal Bioclimatic Indicators in Iran. Sustainability 2019, 11, 2287. [Google Scholar] [CrossRef] [Green Version]
- Choque-Quispe, D.; Froehner, S.; Ligarda-Samanez, C.A.; Ramos-Pacheco, B.S.; Peralta-Guevara, D.E.; Palomino-Rincón, H.; Choque-Quispe, Y.; Solano-Reynoso, A.M.; Barboza-Palomino, G.I.; Taipe-Pardo, F.; et al. Insights from Water Quality of High Andean Springs for Human Consumption in Peru. Water 2021, 13, 2650. [Google Scholar] [CrossRef]
- Quispe-Coica, F.A.; Fernández, S.; Acharte, L.; Pérez-Foguet, A. Status of water quality for human consumption in high-Andean rural communities: Discrepancies between techniques for identifying trace metals. Multidiscip. Sci. J. 2020, 3, 162–180. [Google Scholar] [CrossRef]
- Ligarda-Samanez, C.A.; Choque-Quispe, D.; Ramos-Pacheco, B.S.; Peralta-Guevara, D.E.; Moscoso-Moscoso, E.; Palomino-Rincón, H.; Huamán, M.L. The influence of anthropogenic activities on the concentration of pesticides, physicochemical and microbiological properties in the Chumbao River, Andahuaylas, Perú. Int. J. Adv. Sci. Eng. Inf. Technol. 2021, 11, 1977–1985. [Google Scholar] [CrossRef]
- Choque-Quispe, D.; Ligarda-Samanez, C.A.; Solano-Reynoso, A.M.; Ramos-Pacheco, B.S.; Quispe-Quispe, Y.; Choque-Quispe, Y.; Kari-Ferro, A. Water quality index in the high-Andean micro-basin of the Chumbao River, Andahuaylas, Apurímac, Peru. Tecnol. Cienc. Agua 2021, 12, 37–73. [Google Scholar] [CrossRef]
- Patel, S.V.; Chavda, P.; Tyagi, S. Carrying out assessment of groundwater quality of villages of Bhavnagar district of Gujarat, India. Environ. Claims J. 2019, 31, 79–92. [Google Scholar] [CrossRef]
- Najafi Saleh, H.; Valipoor, S.; Zarei, A.; Yousefi, M.; Asghari, F.B.; Mohammadi, A.A.; Amiri, F.; Ghalehaskar, S.; Khaneghah, A.M. Assessment of groundwater quality around municipal solid waste landfill by using Water Quality Index for groundwater resources and multivariate statistical technique: A case study of the landfill site, Qaem Shahr City, Iran. Environ. Geochem. Health 2020, 42, 1305–1319. [Google Scholar] [CrossRef]
- Bora, M.; Goswami, D.C. Water quality assessment in terms of water quality index (WQI): Case study of the Kolong River, Assam, India. Appl. Water Sci. 2017, 7, 3125–3135. [Google Scholar] [CrossRef] [Green Version]
- Annapoorna, H.; Janardhana, M.R. Assessment of groundwater quality for drinking purpose in rural areas surrounding a defunct copper mine. Aquat. Procedia 2015, 4, 685–692. [Google Scholar] [CrossRef]
- Choque-Quispe, D.; Ramos-Pacheco, B.S.; Ligarda-Samanez, C.A.; Solano-Reynoso, A.M.; Correa-Cuba, O.; Quispe-Quispe, Y.; Choque-Quispe, Y. Water pollution index of high Andean micro-basin of the Chumbao River, Andahuaylas, Peru. Rev. Fac. Ing. Univ. Antioq. 2021. [Google Scholar] [CrossRef]
- Kharake, A.C.; Raut, V.S. An assessment of water quality index of Godavari river water in Nashik city, Maharashtra. Appl. Water Sci. 2021, 11, 101. [Google Scholar] [CrossRef]
- Naveen, B.P.; Mahapatra, D.M.; Sitharam, T.G.; Sivapullaiah, P.V.; Ramachandra, T.V. Physico-chemical and biological characterization of urban municipal landfill leachate. Environmental Pollution 2017, 220, 1–12. [Google Scholar] [CrossRef] [PubMed]
- Barakat, A.; El Baghdadi, M.; Rais, M.; Aghezzaf, B.; Slassi, M. Assessment of spatial and seasonal water quality variation of Oum Er Rbia River (Morocco) using multivariate statistical techniques. Int. Soil Water Conserv. Res. 2016, 4, 284–292. [Google Scholar] [CrossRef]
- Shabbir, R.; Ahmad, S.S. Water resource vulnerability assessment in Rawalpindi and Islamabad, Pakistan using Analytic Hierarchy Process (AHP). J. King Saud Univ.-Sci. 2016, 28, 293–299. [Google Scholar] [CrossRef] [Green Version]
- Ji, L.; Li, Y.; Zhang, G.; Bi, Y. Anthropogenic Disturbances Have Contributed to Degradation of River Water Quality in Arid Areas. Water 2021, 13, 3305. [Google Scholar] [CrossRef]
- Kumari, R.; Sharma, R.C. Assessment of water quality index and multivariate analysis of high altitude sacred Lake Prashar, Himachal Pradesh, India. Int. J. Environ. Sci. Technol. 2016, 16, 6125–6134. [Google Scholar] [CrossRef]
- Ewaid, S.H. Water quality evaluation of Al-Gharraf river by two water quality indices. Appl. Water Sci. 2017, 7, 3759–3765. [Google Scholar] [CrossRef] [Green Version]
- Trikoilidou, E.; Samiotis, G.; Tsikritzis, L.; Kevrekidis, T.; Amanatidou, E. Evaluation of Water Quality Indices Adequacy in Characterizing the Physico-Chemical Water Quality of Lakes. Environ. Processes 2017, 4, 35–46. [Google Scholar] [CrossRef]
- Zhaoshi, W.; Zhang, D.; Cai, Y.; Xiaolong, W.; Lu, Z.; Yuwei, C. Water quality assessment based on the water quality index method in Lake Poyang: The largest freshwater lake in China. Sci. Rep. 2017, 7, 17999. [Google Scholar] [CrossRef]
- Akumtoshi, L.; Singh, M.R.; Puro, N. Assessment of water quality Status of Doyang River, Nagaland, India, using Water Quality Index. Appl. Water Sci. 2020, 10, 46. [Google Scholar] [CrossRef] [Green Version]
- Judran, N.H.; Kumar, A. Evaluation of water quality of Al-Gharraf River using the water quality index (WQI) Model. Earth Syst. Environ. 2020, 6, 1581–1588. [Google Scholar] [CrossRef]
- Bilgin, A. Evaluation of surface water quality by using Canadian Council of Ministers, of the Environment Water Quality Index (CCME WQI) method and discriminant analysis method: A case study Coruh River Basin. Environ. Monit. Assess. 2018, 190, 554. [Google Scholar] [CrossRef] [PubMed]
- Mutea, F.G.; Nelson, H.K.; Au, H.V.; Huynh, T.G.; Vu, U.N. Assessment of Water Quality for Aquaculture in Hau River, Mekong Delta, Vietnam Using Multivariate Statistical Analysis. Water 2021, 13, 3307. [Google Scholar] [CrossRef]
- Nihalani, S.; Meeruty, A. Water quality index evaluation for major rivers in Gujarat. Environ. Sci. Pollut. Res. 2021, 28, 63523–63531. [Google Scholar] [CrossRef] [PubMed]
- Fathi, E.; Zamani-Ahmadmahmoodi, R.; Zare-Bidaki, R. Water quality evaluation using water quality index and multivariate methods, Beheshtabad River, Iran. Appl. Water Sci. 2018, 8, 210. [Google Scholar] [CrossRef] [Green Version]
- Thapa, R.; Gupta, S.; Kaur, H. Introducing an irrigation water quality index (IWQI) based on the case study of the Dwarka River basin, Birbhum, West Bengal, India. Sustain. Water Resour. Manag. 2020, 6, 86. [Google Scholar] [CrossRef]
- Singh, S.K.; Singh, P.; Gautam, S.K. Appraisal of urban lake water quality through numerical index, multivariate statistics and earth observation data sets. Int. J. Environ. Sci. Technol. 2016, 13, 445–456. [Google Scholar] [CrossRef] [Green Version]
- Sener, S.; Sener, E.; Davraz, A. Evaluation of water quality using water quality index (WQI) method and GIS in Aksu River (SWTurkey). Sci. Total Environ. 2017, 15, 131–144. [Google Scholar] [CrossRef]
- Nadikatla, S.K.; Mushini, V.S.; Mudumba, P.S.M. Water quality index method in assessing groundwater quality of Palakonda mandal in Srikakulam district, Andhra Pradesh, India. Appl. Water Sci. 2020, 10, 30. [Google Scholar] [CrossRef] [Green Version]
- Barakat, A.; Meddah, R.; Afdali, M.; Touhami, F. Physicochemical and microbial assessment of spring water quality for drinking supply in Piedmont of Béni-Mellal Atlas (Morocco). Phys. Chem. Earth Parts ABC 2018, 104, 39–46. [Google Scholar] [CrossRef]
- López-Gómez, E. The Delphi method in current educational research: A theoretical and methodological review. Educación XX1 2018, 21, 17–40. [Google Scholar]
- Smith, L.M.; Case, J.L.; Smith, H.M.; Harwell, L.C.; Summers, J.K. Relating ecoystem services to domains of human well-being: Foundation for a U.S. index. Ecol. Indic. 2013, 28, 79–90. [Google Scholar] [CrossRef]
- Hasson, F.; Keeney, S. Enhancing rigour in the Delphi technique research. Technol. Forecast. Soc. Chang. 2011, 78, 1695–1704. [Google Scholar] [CrossRef]
- Linstone, H.A.; Turoff, M. Delphi: A brief look backward and forward. Technol. Forecast. Soc. Chang. 2011, 78, 1712–1719. [Google Scholar] [CrossRef]
- Coleman, S.; Hurley, S.; Koliba, C.; Zia, A.; Exler, S. Building adaptive capacity with the delphi method and mediated modeling for water quality and climate change adaptation in Lake Champlain Basin. AGU Fall Meet. Abstr. 2014, 2014, H41D-0846. [Google Scholar]
- Yang, J.S. Development of drought vulnerability index using delphi method considering climate change and trend analysis in Nakdong river basin. J. Korean Soc. Civ. Eng. 2013, 33, 2245. [Google Scholar] [CrossRef] [Green Version]
- Lumb, A.; Sharma, T.C.; Bibeault, J.F. A Review of Genesis and Evolution of Water Quality Index (WQI) and Some Future Directions. Water Qual. Expo. Health 2011, 3, 11–24. [Google Scholar] [CrossRef]
- Banda, T.; Kumarasamy, M. Development of Water Quality Indices (WQIs): A Review. Polish J. Environ. Stud. 2020, 29, 2011–2021. [Google Scholar] [CrossRef]
- Musa, H.; Yacob, M.; Abdullah, A.; Ishak, M. Delphi Method of Developing Environmental Well-being Indicators for the Evaluation of Urban Sustainability in Malaysia. Procedia Environ. Sci. 2015, 30, 244–249. [Google Scholar] [CrossRef] [Green Version]
- Steurer, J. The Delphi method: An efficient procedure to generate knowledge. Skelet. Radiol. 2011, 40, 959–961. [Google Scholar] [CrossRef] [PubMed] [Green Version]
- Ewaid, S.H.; Abed, S.A.; Al-Ansari, N.; Salih, R.M. Development and Evaluation of a Water Quality Index for the Iraqi Rivers. Hydrology 2020, 7, 67. [Google Scholar] [CrossRef]
- Azhar, S.C.; Aris, A.Z.; Yusoff, M.K.; Ramli, M.F.; Juahir, H. Classification of river water quality using multivariate analysis. Procedia Environ. Sci. 2015, 30, 79–84. [Google Scholar] [CrossRef] [Green Version]
- Garcia, C.A.B.; Garcia, H.L.; Mendonca, M.C.S.; da Silva, A.F.; Alves, J.d.P.H.; da Costa, S.S.L.; Araujo, R.G.O.; Silva, I.S. Assessment of water quality using principal component analysis: A case study of the açude da Macela-Sergipe-Brazil. Water Resour. 2017, 7, 8. [Google Scholar]
- Chu, K.; Liu, W.; She, Y.; Hua, Z.; Tan, M.; Liu, X.; Gu, L.; Jia, Y. Modified principal component analysis for identifying key environmental indicators and application to a large-scale tidal flat reclamation. Water 2018, 10, 69. [Google Scholar] [CrossRef] [Green Version]
- De Carvalho, B.E.; Marques, R.C.; Netto, O.C. Delphi technique as a consultation method in regulatory impact assessment (RIA)—The Portuguese water sector. Water Policy 2017, 19, 423–439. [Google Scholar] [CrossRef]
- Saha, P.D. Water quality characteristics of different industrial wastewater by Delphi water quality index method. Int. J. Environ. Eng. 2014, 6, 1–14. [Google Scholar] [CrossRef]
- Liu, Z.; Zhu, H.; Cui, X.; Wang, W.; Luan, X.; Chen, L.; Cui, Z.; Zhang, L. Groundwater quality evaluation of the Dawu water source area based on water quality index (WQI): Comparison between Delphi method and multivariate statistical analysis method. Water 2021, 13, 1127. [Google Scholar] [CrossRef]
- Akinbile, C.O.; Omoniyi, O. Quality assessment and classification of Ogbese river using water quality index (WQI) tool. Sustain. Water Resour. Manag. 2018, 4, 1023–1030. [Google Scholar] [CrossRef] [Green Version]
- Mladenović-Ranisavljević, I.I.; Žerajić, S.A. Comparison of different models of water quality index in the assessment of surface water quality. Int. J. Environ. Sci. Technol. 2018, 15, 665–674. [Google Scholar] [CrossRef]
- Javid, A.; Maghsadi, N.; Rodbari, A.A. Using the IRWQIGT index to determine toxicity levels in groundwater resources: A case study of Semnan Province. Water Wastewater 2016, 27, 75–83. [Google Scholar]
- Benvenuti, T.; Kieling-Rubio, M.A.; Klauck, C.R.; Rodrigues, M.A.S. Evaluation of water quality at the source of streams of the Sinos River Basin, southern Brazil. Braz. J. Biol. 2015, 75, 98–104. [Google Scholar] [CrossRef] [PubMed] [Green Version]
- Venkatramanan, S.; Chung, S.Y.; Kim, T.H.; Prasanna, M.V.; Hamm, S.Y. Assessment and Distribution of Metals Contamination in Groundwater: A Case Study of Busan City, Korea. Water Qual. Expo. Health 2015, 7, 219–225. [Google Scholar] [CrossRef]
- Tyagi, S.; Sharma, B.; Singh, P.; Dobhal, R. Water Quality Assessment in Terms of Water Quality Index. Am. J. Water Resour. 2013, 1, 34–38. [Google Scholar] [CrossRef]
- ANA. Autoridad Nacional del Agua (ANA) and Ministerio de Agricultura y Riego-Protocolo Nacional Para el Monitoreo de Calidad de los Recursos Hidricos Superficiales; Tech. Rep. 010-2016-ANA; Ministerio de Agricultura y Riego: Lima, Perú, 2016.
- APHA. Standard Methods for the Examination of Water and Wastewater, 22nd ed.; American Public Health Association (APHA): Washington, DC, USA, 2012. [Google Scholar]
- ISO. Water Quality—Enumeration of Escherichia Coli and Coliform Bacteria—Part 2: Most Probable Number Method—ISO 9308-2:2012; ISO: Geneva, Switzerland, 2014. [Google Scholar]
- Hallowell, M.R.; Gambatese, J.A. Population and Initial Validation of a Formal Model for Construction Safety Risk Management. J. Constr. Eng. Manag. 2010, 136, 981–990. [Google Scholar] [CrossRef] [Green Version]
- Hashemi, F.; Siong, H.C. Extracting Urban Sustainability Indicators for Tehran Metropolis by Fuzzy Delphi Method. Middle-East J. Sci Res. 2014, 22, 1411–1421. [Google Scholar] [CrossRef]
- MINAM. Estándares de Calidad Ambiental (ECA), Decreto Supremo N 004-2017-MINAM-Perú (10 p.); Ministerio del Ambiente: Lima, Perú, 2017.
- Boyacıoğlu, H.; Boyacıoğlu, H. Detection of seasonal variations in surface water quality using discriminant analysis. Environ. Monit. Assess. 2010, 162, 15–20. [Google Scholar] [CrossRef]
- UNEP. Global Drinking Water Quality Index Development and Sensitivity Analysis Report; UNEP: Ontario, ON, Canada, 2007. [Google Scholar]
- CETESB. Relatório de Qualidade das Águas Interiores no Estado de São Paulo, Anexo V; Companhia de Tecnologia de Saneamento Ambiental: São Paulo, Brazil, 2006.
- CVC. Corporación Autónoma Regional Del Valle Del Cauca, Estudio de la Calidad del Agua del Río Cauca y sus Principales Tributarios Mediante la Aplicación de Índices de Calidad y Contaminación; Reporte del Proyecto; CVC: Valle del Cauca, Colombia, 2004. [Google Scholar]
- CCME. Canadian Council of Ministers of the Environment For the protection of aquatic life. In Canadian Environmental Quality Guidelines, 1999; Canadian Council of Ministers of the Environment: Winnipeg, MB, Canada, 2007. [Google Scholar]
- León, L. Índices de Calidad del Agua (ICA), Formas de estimarlos y Aplicación en la Cuenca Lerma-Chapala; Instituto Mexicano de Tecnología del Agua: Morelos, México, 1998. [Google Scholar]
- Dinius, S.H. Design of an Index of Water Quality. JAWRA J. Am. Water Resour. Assoc. 1987, 23, 833–843. [Google Scholar] [CrossRef]
- Queralt, R. La calidad de las aguas en los ríos. Tecnol. Agua 1982, 4, 49–57. [Google Scholar]
- Brown, R.M.; McClelland, N.I.; Deininger, R.A.; Tozer, R.G. Water quality index-do we dare? Water Sew. Works 1970, 117, 339–343. [Google Scholar]
- Sutadian, A.D.; Muttil, N.; Yilmaz, A.G.; Perera, B. Development of river water quality indices—A review. Environ. Monit. Assess. 2016, 188, 58. [Google Scholar] [CrossRef] [Green Version]
- Sharma, P.; Meher, P.K.; Kumar, A.; Gautam, Y.P.; Mishra, K.P. Changes in water quality index of Ganges river at different locations in Allahabad. Sustain. Water Qual. Ecol. 2014, 3, 67–76. [Google Scholar] [CrossRef]
- Abdel-Satar, A.M.; Ali, M.H.; Goher, M.E. Indices of water quality and metal pollution of Nile River, Egypt. Egypt. J. Aquat. Res. 2017, 43, 21–29. [Google Scholar] [CrossRef]
- Vatkar, Y.S.; Vatkar, N.S.; Vatkar, A.S. Assessment of WQI by Weighted Arithmetic Index Method for Engineering Colleges in Kolhapur City, Maharashtra, India. Int. J. Eng. Sci. Comput. 2016, 6, 2919. [Google Scholar]
- Abtahi, M.; Golchinpour, N.; Yaghmaeian, K.; Rafiee, M.; Jahangiri-Rad, M.; Keyani, A.; Saeedi, R. A modified drinking water quality index (DWQI) for assessing drinking source water quality in rural communities of Khuzestan Province, Iran. Ecol. Indic. 2015, 53, 283–291. [Google Scholar] [CrossRef]
- CONAMA. Classification of the water bodies, Resolução CONAMA Nº 357; CONAMA: Brasília, Brazil, 2005.
- RAS. Reglamento Técnico del Sector de Agua Potable y Saneamiento Básico; Ministerio de Desarrollo Económico: Bogotá, Colombia, 2000.
- WHO. Guidelines for Drinking-Water Quality, 4th ed.; Recommendations, 564; World Health Organization: Geneva, Switzerland, 2011.
- PREQB. Puerto Rico Water Quality Inventory and List of Impaired Waters, 2004–305 (b) /303 (d) Final Report; Puerto Rico Enviromental Quality Board: Puerto Rico, PR, USA, 2004. [Google Scholar]
- CETESB. Variáveis de Qualidade de Agua; Companhia Ambiental do Estado de São Paulo: São Paulo, Brazil, 2009.
- Uddin, M.G.; Moniruzzaman, M.; Khan, M. Evaluation of groundwater quality using CCME water quality index in the Rooppur Nuclear Power Plant Area, Ishwardi, Pabna, Bangladesh. Am. J. Environ. Prot. 2017, 5, 33–43. [Google Scholar] [CrossRef] [Green Version]
- Mostafaei, A. Application of multivariate statistical methods and water quality index to evaluation of water quality in the Kashkan River. Environ. Manag. 2014, 53, 865–881. [Google Scholar] [CrossRef]
- Damo, R.; Icka, P. Evaluation of water quality index for drinking water. Polish J. Environ. Stud. 2013, 22, 1045–1051. [Google Scholar]
- Espejo, L.; Kretschmer, N.; Oyarzún, J.; Meza, F.; Núñez, J.; Maturana, H.; Soto, G.; Oyarzo, P.; Garrido, M.; Suckel, F.; et al. Application of water quality indices and analysis of the surface water quality monitoring network in semiarid North-Central Chile. Environ. Monit. Assess. 2012, 184, 5571–5588. [Google Scholar] [CrossRef]
- Ivanova, I.; Savichev, O.; Trifonov, N.; Kolubaeva, Y.V.; Volkova, N. Major-Ion Chemistry and Quality of Water in Rivers of Northern West Siberia. Water 2021, 13, 3107. [Google Scholar] [CrossRef]
- Solangi, G.S.; Siyal, A.A.; Babar, M.M.; Siyal, P. Application of water quality index, synthetic pollution index, and geospatial tools for the assessment of drinking water quality in the Indus Delta, Pakistan. Environ. Monit. Assess. 2019, 191, 731. [Google Scholar] [CrossRef] [PubMed]
- Dhawde, R.; Surve, N.; Macaden, R.; Wennberg, A.C.; Seifert-Dähnn, I.; Ghadge, A.; Birdi, T. Physicochemical and Bacteriological Analysis of Water Quality in Drought Prone Areas of Pune and Satara Districts of Maharashtra, India. Environments 2018, 5, 61. [Google Scholar] [CrossRef] [Green Version]
- Eguren, G.; Rivas-Rivera, N.; García, C.; Böcking, B.; Bandeira, S. Water quality index for agricultural systems in Northwest Uruguay. Environ. Monit. Assess. 2018, 190, 710. [Google Scholar] [CrossRef]
- Sivaranjani, S.; Rakshit, A.; Singh, S. Water Quality Assessment with Water Quality Indices. Int. J. Bioresour. Sci. 2015, 2, 85–94. [Google Scholar] [CrossRef] [Green Version]
- Boyacioglu, H. Development of a water quality index based on a European classification scheme. Water SA 2007, 33, 101–106. [Google Scholar] [CrossRef] [Green Version]
- Opafola, O.T.; Oladepo, K.T.; Ajibade, F.O.; David, A.O. Potability assessment of packaged sachet water sold within a tertiary institution in southwestern Nigeria. J. King Saud Univ.-Sci. 2020, 32, 1999–2004. [Google Scholar] [CrossRef]
- Kahal, A.Y.; Alfaifi, H.J.; Abdelrahman, K.; Zaidi, F.K. Physio-chemical properties of groundwater and their environmental hazardous impact: Case study of Southwestern Saudi Arabia. J. King Saud Univ.-Sci. 2021, 33, 101292. [Google Scholar] [CrossRef]
- Bharti, N.; Katyal, S. Water quality indices used for surface water vulnerability assessment. Int. J. Environ. Sci. 2011, 2, 154–173. [Google Scholar]
- Ahmed, S.; Khurshid, S.; Madan, R.; Abu, A.; Naushad, M. Water Quality Assessment of Shallow Aquifer based on Canadian Council of Ministers of the Environment Index and its Impact on Irrigation of Mathura District, Uttar Pradesh. J. King Saud Univ.-Sci. 2019, 32, 1218–1225. [Google Scholar] [CrossRef]
- Macwan, E.; Patel, R.L. Drinking Water Quality Index. Int. J. Latest Technol. Eng. Manag. Appl. Sci. 2018, 7, 25–28. [Google Scholar]
- Salla, M.R.; Paredes-Arquiola, J.; Solera, A.; Álvarez, J.A.; Pereira, C.E.; Alamy, J.E.; De Oliveira, A.L. Integrated modeling of water quantity and quality in the Araguari River basin, Brazil. Lat. Am. J. Aquat. Res. 2014, 42, 224–244. [Google Scholar] [CrossRef]
- Aldana, M.L.; Zacarias, E.E. Water quality index of cucabaj river located in the municipality of Santa Cruz del Quiché, Quiché and influence in treatment costs purification. Cienc. Tecnol. Salud 2014, 1, 21–34. [Google Scholar] [CrossRef]
- Rizk, R.; Juzsakova, T.; Ali, M.B.; Rawash, M.A.; Domokos, E.; Hedfi, A.; Almalki, M.; Boufahja, F.; Shafik, H.M.; Rédey, A. Comprehensive environmental assessment of heavy metal contamination of surface water, sediments and Nile Tilapia in Lake Nasser, Egypt. J. King Saud Univ.-Sci. 2022, 34, 101748. [Google Scholar] [CrossRef]
- Pino, E.; Tacora, P.; Steenken, A.; Alfaro, L.; Valle, A.; Chávarri, E.; Mejía Marcacuzco, J.A. Effect of environmental and geological characteristics on water quality in the Caplina river basin, Tacna, Perú. Tecnol. Cienc. Agua 2017, 8, 77–99. [Google Scholar] [CrossRef]
- Perrin, J.L.; Raïs, N.; Chahinian, N.; Moulin, P.; Ijjaali, M. Water quality assessment of highly polluted rivers in a semi-arid Mediterranean zone Oued Fez and Sebou River (Morocco). J. Hydrol. 2014, 510, 26–34. [Google Scholar] [CrossRef]


| Sampling Points | Coordinates | Altitude (m) | Characteristic of the Area | |
|---|---|---|---|---|
| S | W | |||
| Paccoccocha lagoon | 13°46′45.2″ | 73°13′50.0″ | 4274 | Snowmelt and rainwater collector; native fish breeding |
| Pampahuasi lagoon | 13°44′57.6″ | 73°14′35.7″ | 4212 | Snowmelt and rainwater collector; native fish breeding |
| P1 | 13°46′38.4″ | 73°15′32.3″ | 4079 | Water collecting basin/native flora and fauna |
| P2 | 13°41′10.9″ | 73°20′19.7″ | 3184 | Water collection basin/limited agriculture, and grazing |
| P3 | 13°39′23.4″ | 73°21′30.7″ | 2981 | Limited urbanization, agriculture, and intense grazing. |
| P4 | 13°39′33.2″ | 73°22′38.2″ | 2916 | Increasing urbanization, limited agriculture, and grazing, limited urban industry |
| P5 | 13°39′37.0″ | 73°23′52.7″ | 2872 | High urbanization and limited urban industry |
| P6 | 13°39′27.4″ | 73°25′50.8″ | 2807 | High urbanization, limited agriculture, and grazing |
| P7 | 13°38′17.0″ | 73°27′10.6″ | 2767 | Limited urbanization, agriculture, and intense grazing |
| P8 | 13°35′26.4″ | 73°27′008″ | 2572 | Agriculture and intense grazing |
| Parameter | Method | Unit | Reference | Place |
|---|---|---|---|---|
| Temperature | Selective electrode | °C | Hanna Multiparameter-HI 9828 | On field |
| Turbidity | Selective electrode | NTU | Hanna Multiparameter-HI 9828 | On field |
| TDS (Total dissolved solids) | Selective electrode | mg/L | Hanna Multiparameter-HI 9828 | On field |
| Conductivity | Selective electrode | µS/cm | Hanna Multiparameter-HI 9828 | On field |
| True color | Spectrometric-Pt-CO method | PCU | 2120-C, Standard Methods [57] | In laboratory |
| pH | Selective electrode | - | Hanna Multiparameter-HI 9828 | On field |
| Hardness | EDTA titration | mg CO32−/L | 2340-C, Standard Methods [57] | In laboratory |
| Nitrates | Selective electrode | mg NO3−/L | 4500- NO3− D, Standard Methods [57] | In laboratory |
| Nitrites | Colorimetric | mg NO2−/L | 4500- NO2− B, Standard Methods [57] | In laboratory |
| Ammonia | Selective electrode | mg NH3-N/L | 4500- NH3 D, Standard Methods [57] | In laboratory |
| Phosphates | Spectrometric, ascorbic acid method | mg P/L | 4500- P B, Standard Methods [57] | In laboratory |
| Chemical Oxygen Demand (COD) | Closed Reflux, Colorimetric Method | mg O2/L | 5220 B, Standard Methods [57] | In laboratory |
| Dissolved oxygen (DO) | Selective electrode | mg O2/L | Hanna Multiparameter-HI 9828 | On field |
| Biochemical Oxygen Demand (BOD) | 5-Day BOD Test | mg O2/L | 5210 D, Standard Methods [57] | In laboratory |
| Thermotolerant Coliforms, Total coliforms | Colorimetric | MPN/100 mL | Colilert-18/Quanti-Tray Method 9308-2:2014 [58] | In laboratory |
| Parameters | Criteria Interval | Reference Value | |
|---|---|---|---|
| Min | Max | ||
| Temperature (°C) | 0 | 40 | [61] |
| Turbidity (NTU) | 0 | 300 | [61,76,77,78] |
| TDS (mg/L) | 0 | 600 | [61,78] |
| pH | 1 | 13 | [61,76,77,79] |
| Conductivity (µS/cm) | 20 | 3000 | [61,78,80] |
| Hardness (mg/L) | 5 | 1500 | [61,78] |
| Color (PCU) | 2 | 150 | [61,76,77] |
| Nitrates (mg/L) | 1 | 60 | [61,76,78] |
| Nitrites (mg/L) | 0 | 10 | [46,61,78] |
| Ammonium (mg/L) | 0 | 30 | [61,76,79] |
| Phosphates (mg/L) | 0 | 1.5 | [61] |
| Lead (µg/L) | 0 | 150 | [61,76,78] |
| Chrome (µg/L) | 0 | 150 | [61,76,78] |
| Zinc (mg/L) | 0 | 5 | [61,76,78] |
| Iron (mg/L) | 0 | 15 | [61,76,78] |
| COD (mg/L) | 0 | 300 | [61] |
| DO (mg/L) | 0 | 15 | [61,76,77,78] |
| BOD (mg/L) | 2 | 140 | [61,76] |
| Thermotolerant Coliforms (MPN/100 mL) | 10 | 50,000 | [61,76,77,78] |
| Total Coliforms (MPN/100 mL) | 100 | 150,000 | [61,76,77] |
| Subindex | Equation | |
|---|---|---|
| Physicochemical—PC: Temperature, Turbidity, TDS, pH, Conductivity, Hardness, Color, Nitrates, Nitrites, Ammonium, Phosphates | (1) | |
| Heavy metals—HM: Lead, Chrome, Zinc, Iron | (2) | |
| Organic matter—OM: COD, DO, BOD, Thermotolerant Coliforms, Total Coliforms | (3) |
| Quality Range | Scale | Description |
|---|---|---|
| 95–100 | Excellent | The water quality is not under any threat and it is not degraded and close to natural levels. |
| 80–94 | Good | The water quality is under a little threat and it is rarely seen under desired levels. |
| 65–79 | Fair | The overall water quality is protected; however, it is under threat in some cases and sometimes not in the desired conditions. |
| 45–64 | Marginal | The water quality is frequently under threat and degradation and often not in the desired conditions |
| 0–44 | Poor | Water quality departs from its desirable level |
| Parameters | Rainy 2018 | Dry 2018 | Rainy 2019 | Dry 2019 | Dry 2021 | Parameters | Rainy 2018 | Dry 2018 | Rainy 2019 | Dry 2019 | Dry 2021 | ||
|---|---|---|---|---|---|---|---|---|---|---|---|---|---|
| Temperature (°C) | Max | 16.13 | 16.30 | 17.31 | 22.96 | 22.81 | Color (PCU) | Max | 41.00 | 40.00 | 97.00 | 172.0 | 94.00 |
| Min | 9.67 | 4.99 | 8.86 | 10.86 | 10.42 | Min | 12.00 | 0.00 | 14.00 | 10.00 | 8.00 | ||
| Avg | 13.14 | 11.85 | 12.64 | 17.61 | 17.55 | Avg | 26.73 | 11.47 | 42.80 | 56.50 | 41.41 | ||
| SD | 2.05 | 3.81 | 2.87 | 4.31 | 4.45 | SD | 9.20 | 11.24 | 22.52 | 51.48 | 29.69 | ||
| CV (%) | 15.63 | 32.12 | 22.69 | 24.47 | 25.38 | CV (%) | 34.41 | 98.02 | 52.62 | 91.11 | 71.71 | ||
| p-value | 0.00 | 0.00 | 0.00 | 0.00 | 0.00 | p-value | 0.00 | 0.00 | 0.00 | 0.00 | 0.00 | ||
| Turbidity (NTU) | Max | 141.60 | 100.20 | 194.60 | 63.80 | 17.30 | Nitrates (mg/L) | Max | 1.10 | 0.00 | 0.00 | 0.00 | 1.70 |
| Min | 0.00 | 0.40 | 0.30 | 0.60 | 0.30 | Min | 0.00 | 0.00 | 0.00 | 0.00 | 0.00 | ||
| Avg | 55.72 | 35.22 | 47.97 | 20.11 | 4.98 | Avg | 0.21 | 0.00 | 0.00 | 0.00 | 0.18 | ||
| SD | 43.99 | 33.88 | 65.55 | 18.93 | 5.21 | SD | 0.32 | 0.00 | 0.00 | 0.00 | 0.51 | ||
| CV(%) | 78.94 | 96.20 | 136.64 | 94.13 | 104.64 | CV(%) | 151.13 | - | - | - | 289.49 | ||
| p-value | 0.00 | 0.00 | 0.00 | 0.00 | 0.00 | p-value | 0.00 | - | - | - | 0.00 | ||
| TDS (mg/L) | Max | 155.00 | 471.00 | 178.00 | 453.00 | 356.80 | Nitrites (mg/L) | Max | 0.17 | 0.88 | 0.54 | 10.08 | 1.24 |
| Min | 12.00 | 12.00 | 12.00 | 12.00 | 13.00 | Min | 0.00 | 0.00 | 0.00 | 0.00 | 0.00 | ||
| Avg | 54.43 | 196.40 | 60.70 | 194.00 | 136.20 | Avg | 0.03 | 0.33 | 0.11 | 3.24 | 0.35 | ||
| SD | 42.67 | 166.04 | 53.80 | 174.81 | 113.41 | SD | 0.05 | 0.37 | 0.17 | 3.82 | 0.40 | ||
| CV (%) | 78.40 | 84.54 | 88.63 | 90.11 | 83.27 | CV (%) | 187.46 | 112.23 | 147.73 | 117.75 | 113.51 | ||
| p-value | 0.00 | 0.00 | 0.00 | 0.00 | 0.00 | p-value | 0.00 | 0.00 | 0.00 | 0.00 | 0.00 | ||
| pH | Max | 8.15 | 8.67 | 8.73 | 9.34 | 8.59 | Ammonium (mg/L) | Max | 0.67 | 3.06 | 0.32 | 17.12 | 8.93 |
| Min | 6.91 | 7.39 | 7.40 | 7.51 | 7.35 | Min | 0.00 | 0.00 | 0.00 | 0.02 | 0.01 | ||
| Avg | 7.53 | 7.97 | 7.95 | 8.10 | 7.92 | Avg | 0.11 | 1.16 | 0.07 | 4.10 | 2.17 | ||
| SD | 0.35 | 0.31 | 0.36 | 0.57 | 0.36 | SD | 0.18 | 1.19 | 0.10 | 6.18 | 3.16 | ||
| CV(%) | 4.62 | 3.94 | 4.50 | 7.04 | 4.56 | CV (%) | 162.16 | 103.22 | 140.10 | 150.75 | 145.75 | ||
| p-value | 0.00 | 0.00 | 0.00 | 0.00 | 0.00 | p-value | 0.00 | 0.00 | 0.00 | 0.00 | 0.00 | ||
| Conductivity (µS/cm) | Max | 311.00 | 917.00 | 340.00 | 906.00 | 714.10 | Phosphates (mg/L) | Max | 0.44 | 2.21 | 2.08 | 5.62 | 1.71 |
| Min | 24.00 | 23.00 | 23.00 | 23.00 | 22.00 | Min | 0.00 | 0.11 | 0.03 | 0.04 | 0.21 | ||
| Avg | 110.03 | 383.90 | 118.47 | 387.63 | 270.34 | Avg | 0.14 | 1.37 | 1.05 | 1.43 | 0.88 | ||
| SD | 84.61 | 327.46 | 102.97 | 348.84 | 229.70 | SD | 0.13 | 0.63 | 0.78 | 1.67 | 0.54 | ||
| CV (%) | 76.90 | 85.30 | 86.92 | 89.99 | 84.97 | CV (%) | 98.78 | 45.81 | 73.84 | 116.39 | 61.28 | ||
| p-value | 0.00 | 0.00 | 0.00 | 0.00 | 0.00 | p-value | 0.00 | 0.00 | 0.00 | 0.00 | 0.00 | ||
| Hardness (mg/L) | Max | 68.40 | 256.60 | 201.80 | 171.10 | 750.00 | |||||||
| Min | 8.70 | 11.55 | 6.30 | 10.60 | 15.00 | ||||||||
| Avg | 31.18 | 97.78 | 68.22 | 66.05 | 424.30 | ||||||||
| SD | 19.23 | 78.02 | 60.30 | 51.29 | 295.60 | ||||||||
| CV (%) | 61.67 | 79.79 | 88.40 | 77.66 | 69.67 | ||||||||
| p-value | 0.00 | 0.00 | 0.00 | 0.00 | 0.00 | ||||||||
| Parameters | Rainy 2018 | Dry 2018 | Rainy 2019 | Dry 2019 | Dry 2021 | |
|---|---|---|---|---|---|---|
| Pb (ug/L) | Max | 1.40 | 1.40 | 0.40 | 1.20 | 1.50 |
| Min | 0.00 | 0.00 | 0.00 | 0.00 | 0.10 | |
| Avg | 0.46 | 0.62 | 0.08 | 0.40 | 0.64 | |
| SD | 0.46 | 0.46 | 0.12 | 0.37 | 0.40 | |
| CV(%) | 99.96 | 74.99 | 151.86 | 90.80 | 61.97 | |
| p-value | 0.00 | 0.00 | 0.00 | 0.00 | 0.00 | |
| Cr (ug/L) | Max | 83.00 | 17.00 | 48.00 | 51.00 | 48.00 |
| Min | 2.00 | 0.00 | 0.00 | 3.00 | 0.00 | |
| Avg | 25.10 | 5.67 | 15.77 | 19.50 | 17.67 | |
| SD | 22.69 | 5.42 | 14.91 | 14.24 | 16.62 | |
| CV(%) | 90.41 | 95.58 | 94.58 | 73.04 | 94.09 | |
| p-value | 0.00 | 0.00 | 0.00 | 0.00 | 0.00 | |
| Zn (mg/L) | Max | 0.00 | 0.00 | 0.00 | 0.00 | 0.00 |
| Min | 0.00 | 0.00 | 0.00 | 0.00 | 0.00 | |
| Avg | 0.00 | 0.00 | 0.00 | 0.00 | 0.00 | |
| SD | 0.00 | 0.00 | 0.00 | 0.00 | 0.00 | |
| CV(%) | - | - | - | - | - | |
| p-value | - | - | - | - | - | |
| Fe (mg/L) | Max | 0.35 | 0.46 | 0.61 | 0.51 | 0.30 |
| Min | 0.00 | 0.03 | 0.09 | 0.08 | 0.00 | |
| Avg | 0.15 | 0.21 | 0.41 | 0.33 | 0.17 | |
| SD | 0.11 | 0.14 | 0.17 | 0.15 | 0.10 | |
| CV(%) | 75.85 | 68.29 | 41.26 | 47.15 | 61.54 | |
| p-value | 0.00 | 0.00 | 0.00 | 0.00 | 0.00 | |
| Parameters | Rainy 2018 | Dry 2018 | Rainy 2019 | Dry 2019 | Dry 2021 | |
|---|---|---|---|---|---|---|
| COD (mg/L) | Max | 225.00 | 310.0 | 330.00 | 66.00 | 55.00 |
| Min | 0.00 | 0.00 | 0.00 | 13.00 | 8.00 | |
| Avg | 45.73 | 51.33 | 59.43 | 32.43 | 25.00 | |
| SD | 63.13 | 87.60 | 95.98 | 16.85 | 16.29 | |
| CV(%) | 138.03 | 170.65 | 161.49 | 51.95 | 65.16 | |
| p-value | 0.00 | 0.00 | 0.00 | 0.00 | 0.00 | |
| DO (mg/L) | Max | 7.94 | 8.53 | 7.12 | 8.72 | 5.81 |
| Min | 5.86 | 3.50 | 4.56 | 2.18 | 1.80 | |
| Avg | 7.09 | 6.20 | 5.29 | 6.24 | 4.06 | |
| SD | 0.60 | 1.47 | 0.77 | 1.84 | 1.43 | |
| CV(%) | 8.48 | 23.75 | 14.59 | 29.48 | 35.17 | |
| p-value | 0.00 | 0.00 | 0.00 | 0.00 | 0.00 | |
| BOD5 (mg/L) | Max | 0.90 | 29.00 | 124.00 | 292.00 | 105.00 |
| Min | 0.00 | 0.00 | 0.00 | 0.00 | 0.00 | |
| Avg | 0.17 | 5.94 | 30.88 | 66.27 | 31.51 | |
| SD | 0.30 | 11.40 | 41.66 | 93.22 | 35.46 | |
| CV(%) | 182.62 | 191.88 | 134.92 | 140.67 | 112.53 | |
| p-value | 0.00 | 0.00 | 0.00 | 0.00 | 0.00 | |
| Thermotolerant Coliforms (MPN/100 mL) | Ma× | 2.7 × 10⁵ | 6.9 × 10⁵ | 4.0 ×10⁵ | 1.5 ×10⁶ | 1.4 × 10⁶ |
| Min | 0.00 | 0.00 | 0.00 | 0.00 | 0.00 | |
| Avg | 7.1 × 10⁴ | 1.2 × 10⁵ | 8.6 ×10⁴ | 2.9 ×10⁵ | 2.7 × 10⁵ | |
| SD | 9.6 × 10⁴ | 2.2 × 10⁵ | 1.2 × 10⁵ | 4.5 × 10⁵ | 4.4 × 10⁵ | |
| CV(%) | 133.95 | 176.03 | 134.50 | 154.02 | 165.27 | |
| p-value | 0.00 | 0.00 | 0.00 | 0.00 | 0.00 | |
| Total Coliforms (MPN/100 mL) | Ma× | 3.3 × 10⁵ | 2.2 × 10⁶ | 1.4 × 10⁶ | 4.1 × 10⁶ | 5.1 × 10⁶ |
| Min | 1570.00 | 0.00 | 0.00 | 900.00 | 1100.00 | |
| Avg | 1.1 × 10⁵ | 3.4 × 10⁵ | 2.6 × 10⁵ | 1.3 × 10⁶ | 1.7 × 10⁶ | |
| SD | 1.2 × 10⁵ | 6.6 × 10⁵ | 3.8 × 10⁵ | 1.4 × 10⁶ | 2.0 × 10⁶ | |
| CV(%) | 110.46 | 192.83 | 148.67 | 109.76 | 118.31 | |
| p-value | 0.00 | 0.00 | 0.00 | 0.00 | 0.00 | |
Publisher’s Note: MDPI stays neutral with regard to jurisdictional claims in published maps and institutional affiliations. |
© 2022 by the authors. Licensee MDPI, Basel, Switzerland. This article is an open access article distributed under the terms and conditions of the Creative Commons Attribution (CC BY) license (https://creativecommons.org/licenses/by/4.0/).
Share and Cite
Choque-Quispe, D.; Froehner, S.; Palomino-Rincón, H.; Peralta-Guevara, D.E.; Barboza-Palomino, G.I.; Kari-Ferro, A.; Zamalloa-Puma, L.M.; Mojo-Quisani, A.; Barboza-Palomino, E.E.; Zamalloa-Puma, M.M.; et al. Proposal of a Water-Quality Index for High Andean Basins: Application to the Chumbao River, Andahuaylas, Peru. Water 2022, 14, 654. https://doi.org/10.3390/w14040654
Choque-Quispe D, Froehner S, Palomino-Rincón H, Peralta-Guevara DE, Barboza-Palomino GI, Kari-Ferro A, Zamalloa-Puma LM, Mojo-Quisani A, Barboza-Palomino EE, Zamalloa-Puma MM, et al. Proposal of a Water-Quality Index for High Andean Basins: Application to the Chumbao River, Andahuaylas, Peru. Water. 2022; 14(4):654. https://doi.org/10.3390/w14040654
Chicago/Turabian StyleChoque-Quispe, David, Sandro Froehner, Henry Palomino-Rincón, Diego E. Peralta-Guevara, Gloria I. Barboza-Palomino, Aydeé Kari-Ferro, Lourdes Magaly Zamalloa-Puma, Antonieta Mojo-Quisani, Edward E. Barboza-Palomino, Miluska M. Zamalloa-Puma, and et al. 2022. "Proposal of a Water-Quality Index for High Andean Basins: Application to the Chumbao River, Andahuaylas, Peru" Water 14, no. 4: 654. https://doi.org/10.3390/w14040654