Article

Wavelet Analysis of Dam Injection and Discharge in Three Gorges Dam and Reservoir with Precipitation and River Discharge

1
Department of Geography & Anthropology, Louisiana State University, Baton Rouge, LA 70803, USA
2
School of Automation, University of Electronic Science and Technology of China, Chengdu 610054, China
*
Authors to whom correspondence should be addressed.
Water 2022, 14(4), 567; https://doi.org/10.3390/w14040567
Submission received: 25 January 2022 / Revised: 10 February 2022 / Accepted: 11 February 2022 / Published: 13 February 2022

Abstract

:
The Yangtze River has been the primary support of the resources and transportation of China. The Three Gorges Dam and Reservoir on the Yangtze River is one of the world’s largest dams. The influence caused by the dam and reservoir on the river system has been overwhelming and destructive. For better water resource use and flood-prevention planning, more understanding is needed regarding the dam’s impact on river discharge, regional precipitation, and frequency of extreme rainfall events. This study aims to analyze the changes in river discharge and regional precipitation records before and after the construction of the Three Gorges Dam. This research examines temporal correlations among these data by collecting daily dam injection and dam discharge records, the precipitation from ground stations, and river discharge. The time series are analyzed with the wavelet analysis. The precipitation datasets decrease in wavelet magnitude after 1998 when the dam was built in the wavelet analysis. The annual cycle, shown as a bright year line through the time range, still exists in the analysis result after 1998, but the magnitude of the annual cycle has reduced. The river discharge shows a decrease of wavelet magnitude at the three downstream locations. The possible explanation of this pattern could be the human-controlled dam discharge. The constant water level maintained in the reservoir by human control would slow down the flow speed and stabilize it.

1. Introduction

Determined by the Yangtze River Basin’s structure and functions, water resources, aquatic ecology, water environment, and flooding disasters reflect the interactions among the environmental changes [1]. The Yangtze River Basin sits in the subtropical monsoon region. It originates from the high mountain plateau terrain in Southwest China and connects the East China Sea on the east coast, where the terrain is low and flat. Therefore, the climatic and topographical conditions in the Yangtze River basin vary greatly. The river’s upper reaches are mainly glacial ice/snow meltwater, and the water volume is small and seasonal. In the lower reaches, flooding events caused by storms and heavy rainfall are the major threats related to the river. Rainwater generally accounts for 70–80% of annual runoff [2,3]. In addition, storm surges and some tsunamis from the coast sometimes put excessive water into the interior land, causing coastal flooding [4,5].
Along with the essential functions provided for local communities and the economy, the Yangtze River is also well known for its long history of flooding disasters that are destructive to lives and the economy [6]. As a result, around 50,000 dams have been built in the Yangtze River basin since the 1960s for flood control and prevention, including the Three Gorges Dam (TGD) [7].
Among all the dams, the Three Gorges Dam is the largest and most impactful dam in China because of its enormous capacity and size [8]. Since the Three Gorges Reservoir’s completion in 2002, the storage increased from 10 billion tons to 20 billion tons in 2003. It further increased to 30 billion tons in 2006 and reached 39.3 billion tons of water in 2008. The water storage increased by about 10 billion tons during each water injection in one to two months. After each significant water storage increase, the reservoir started a cyclical fluctuation period. Water was stored to a high level through autumn and winter, drained to a low level to free up flood capacity in spring, and maintained to a low level for flood protection in summer. The average water level difference between the autumn–winter and spring–summer periods is around 30 m. The impacts of this super dam reservoir on the local level around the reservoir, on the river system and river condition, and the ecosystem and soil condition along the Yangtze River, both upstream and downstream, have been explored and discussed in other studies [9,10,11,12,13,14,15,16,17].
However, the dam’s influence on the weather pattern downstream at a mesoscale (5 km to 100 km) or larger scales has not been meticulously discussed. During the discharging season, there will be a discharge of around 8 billion tons of water in 20 to 30 days, which may lead to a massive disruption of the hydro cycle and precipitation pattern [18]. It could cause significant city flooding in those large cities along the Yangtze River. The dam’s influence on the river basin’s seasonal and monthly precipitation should be brought to light [19].
Previous studies of the Three Gorges Dam could be summarized into three types by their focus on different impacts on (1) meteorological characteristics around the reservoir; (2) the biodiversity and ecosystem in the reservoir and river system; and (3) resilience of the dam to climate change and extreme disasters.
Over the years, human activities, such as dam construction and engineering, industrial and agricultural pollution, overfishing, waterway regulation, bank slope hardening, sand excavation, and quarrying, have severely degraded the Yangtze River Basin’s ecosystem. Notably, the fast economic and population growth have compromised biodiversity, fishery resource conservation, water quality, air quality, and sediment load [20,21,22,23]. Overgrazing of alpine meadows, excessive vegetation reclamation, invasive exotic fish species, and other ecological disasters have been observed in recent decades. At the same time, human constructions of large projects and the destruction of vegetation cover caused severe degradation of various ecosystems [24,25,26]. Densely constructed hydropower stations in the upper reaches of the Yangtze River have changed flow velocity and sediment transport of the river, which have a profound impact on the migration and habitats of some rare and endemic fish species [13,14,20]. The ecosystems in desertification areas are particularly vulnerable. The Yangtze River’s middle reaches are densely distributed with rivers and lakes and rich in water resources, but unreasonable reclamation has caused the lake wetland area to shrink dramatically [25,27]. The lower reaches of the Yangtze River are from Hukou to the estuary, with polluting enterprises scattered along the river, and the water ecology and water environment have deteriorated [28].
For better water resource use and flood-prevention planning, it is needed to understand more about the dam’s impact on river discharge, regional precipitation, and frequency of extreme rainfall events. This study aims to analyze the changes in river discharge and regional precipitation records before and after the construction of the Three Gorges Dam. By considering the river system as a whole and the coastal end, this study will examine the impact of a super dam on a continental scale, which has not been discussed before. This research examines strong temporal correlations among these data by collecting daily records of the dam injection and discharge, the precipitation from gauge stations, and river discharge in the river system. The time-series data are analyzed with the wavelet analysis, which decomposes the data to different frequencies s. The frequency decomposition examines any correlation/coherence among these three datasets in time.
The work of this paper is as follows:
  • In this study, three datasets related to the Three Gorges Dam and Reservoir were explored using wavelet analysis.
  • The basic periodic pattern and characteristics are presented and discussed.
  • This study states several essential results and conclusions that would be interesting to the academic society and future studies.

2. Materials and Methods
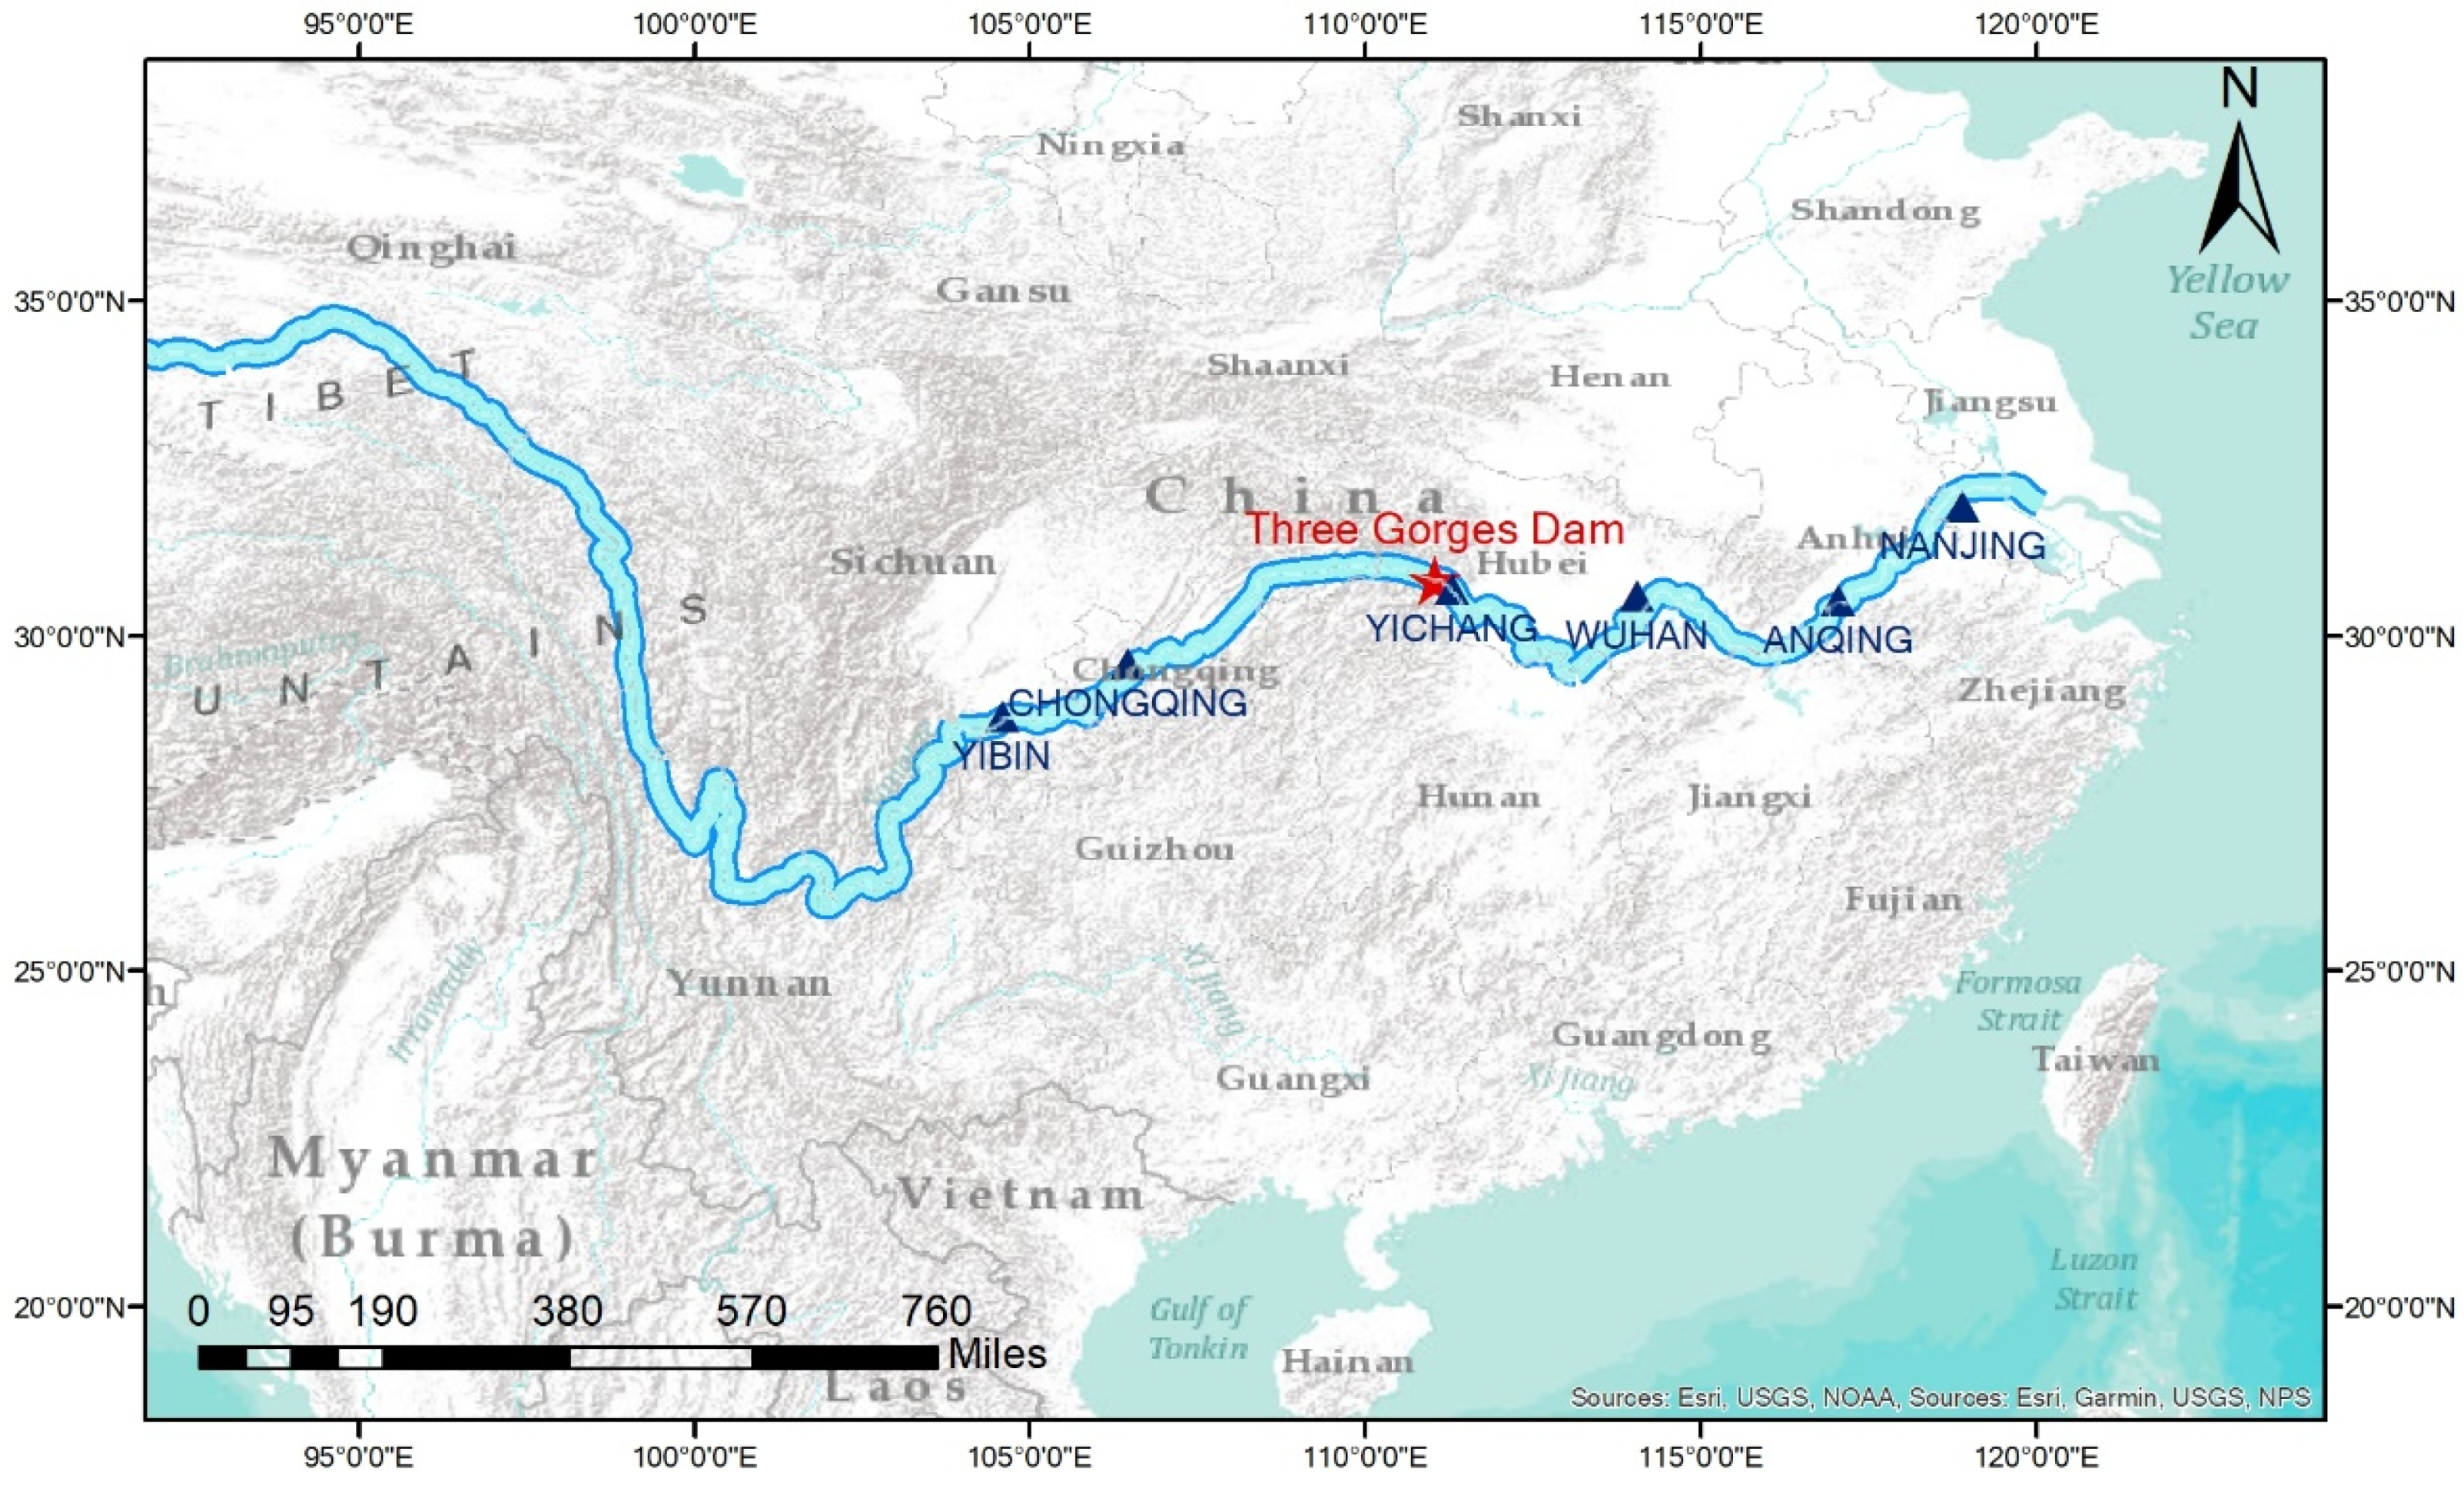
2.1. Data Sources

This section summarizes and analyzes the three different data types using their basic statistic properties and descriptions. The Ground Level Station Measurement of Daily Precipitation between 1975 to 2020 from the China Meteorological Data Service Center was collected as the primary source. The precipitation data were collected from the Climate Data Online of the National Oceanic and Atmospheric Administration (NOAA). The selected data are the daily summary data from 6 different stations (YiBin, ChongQing, YiChang, WuHan, AnQing, and NanJing Station). Among these 6 stations, 2 (the YiBin Station and the ChongQing Station) are upstream from the Three Gorges Dam, and 3 of them (the WuHan Station, the AnQing Station, and the NanJing Station) are downstream from the Three Gorges Dam. The YiChang Station is next to the dam reservoir (Figure 1).
The data range is from 1 January 1975 until 31 July 2020. The primary data properties and descriptions are presented in this section. In order to estimate and testify the possible relationship between the station precipitation and the dam discharge, three different stations were selected because they are the closest to the Yangtze River. The ground precipitation data cover the year from 1975 to 2020. To examine the possible influence of the dam construction, the year 1998, when the dam construction was finished and started injection, was selected as a separator for data grouping. Since it has been 23 years after the injection, the dataset was separated into two groups with the same 23-year time span. The precipitation data are from 1975–1987 and 1988–2020, so the dam’s influence on the long-term precipitation could be easily identified.
The second dataset is the river discharge raster data. The river discharge was collected from the Global Flood Awareness System (GloFAS), which is part of the Copernicus Emergency Management Service (CEMS) (DOI: 10.24381/cds.a4fdd6b9). This raster data contains data from 1 January 1993 until 31 December 2018, with a 0.1 × 0.1-degree latitude-longitude resolution. The hydrological river routing model simulates this dataset with modeled gridded runoff data. The dataset’s data value is the volume rate of water flow in the river channel averaged over a time step through a cross-section. The value is an average of over 24 h. According to the 6 ground stations’ latitude and longitude, the data were sampled to demonstrate the dataset’s fundamental characteristics and examined against the precipitation data. The discussion and distribution of the data description will correspond with and use the name of the ground stations.
According to the selected locations’ overall statistic descriptions, there is a definite increase in general river discharge and variation. Among the 6 locations, the 2 most upstream locations, the YiBin and ChongQing station, and the 2 most downstream locations, the AnQing and Nanjing, show high similarity (Figure 2).
The third dataset is the dam operation data, which contains the dam’s basic information, including the amount of water injected into the reservoir and the amount of water discharged from the dam gate (Figure 3). The basic information on the Three Gorges Dam was collected from the China Three Gorges Corporation. The selected data are the average dam injection speed from 1998 to 2018 and the discharge speed from 2003 to 2018.

2.2. Wavelet Analysis

Wavelet analysis is a tool for studying multi-scale frequency characteristics in time series. Decomposing the time series to different scales can reveal the main variability patterns and frequency of change and how these patterns and frequencies change over time. Wavelet analysis has been widely used in science, engineering, and mathematics, especially in geophysics, remote sensing [29,30,31,32], and signal analysis [33,34].
Compared with the Fourier transform, wavelet analysis can better deal with non-stationary changes at different frequencies [32,35]. The wavelet function is suitable for the sharply changing area of non-stationary signals. It can extract the local stationary characteristics of the signal and obtain periodic changes under a specific ratio.
Due to the time-frequency characteristics of wavelets, wavelets are mainly used for time-frequency and time-scale analysis. The changes in precipitation and river flow are combined frequencies from daily to seasonal. Therefore, the wavelet can decompose these frequencies to various scales and enables them to be analyzed separately.
Wavelet transform has two types: continuous wavelet transform (CWT) and discrete wavelet transform (DWT). Continuous wavelet transform has better signal feature extraction ability, so it is widely used in geophysical research to extract time series intermittent wave features [33,34,35]. In this study, the continuous wavelet transforms (CWT) with the Morlet wavelet as the mother wavelet is the primary method. The reason for using Morlet as the mother wavelet in this study is that the Morlet can identify the sinusoidal signal from the time series, both sudden and constant. The CWT process is as follows:
W n ( s ) = n = 0 N 1 x n ψ [ ( n n ) δ t s ] .  
where W n is the power spectra; x n represents the time series for analysis; ψ represents the mother wavelet, which is the Morlet wavelet in this study; and δt is the sampling interval. n represents the translational value, n is the local time index, s represents the wavelet scale, represents a complex conjugation, N is the localized time index, and δ t represents the selected constant time spacing.

3. Results

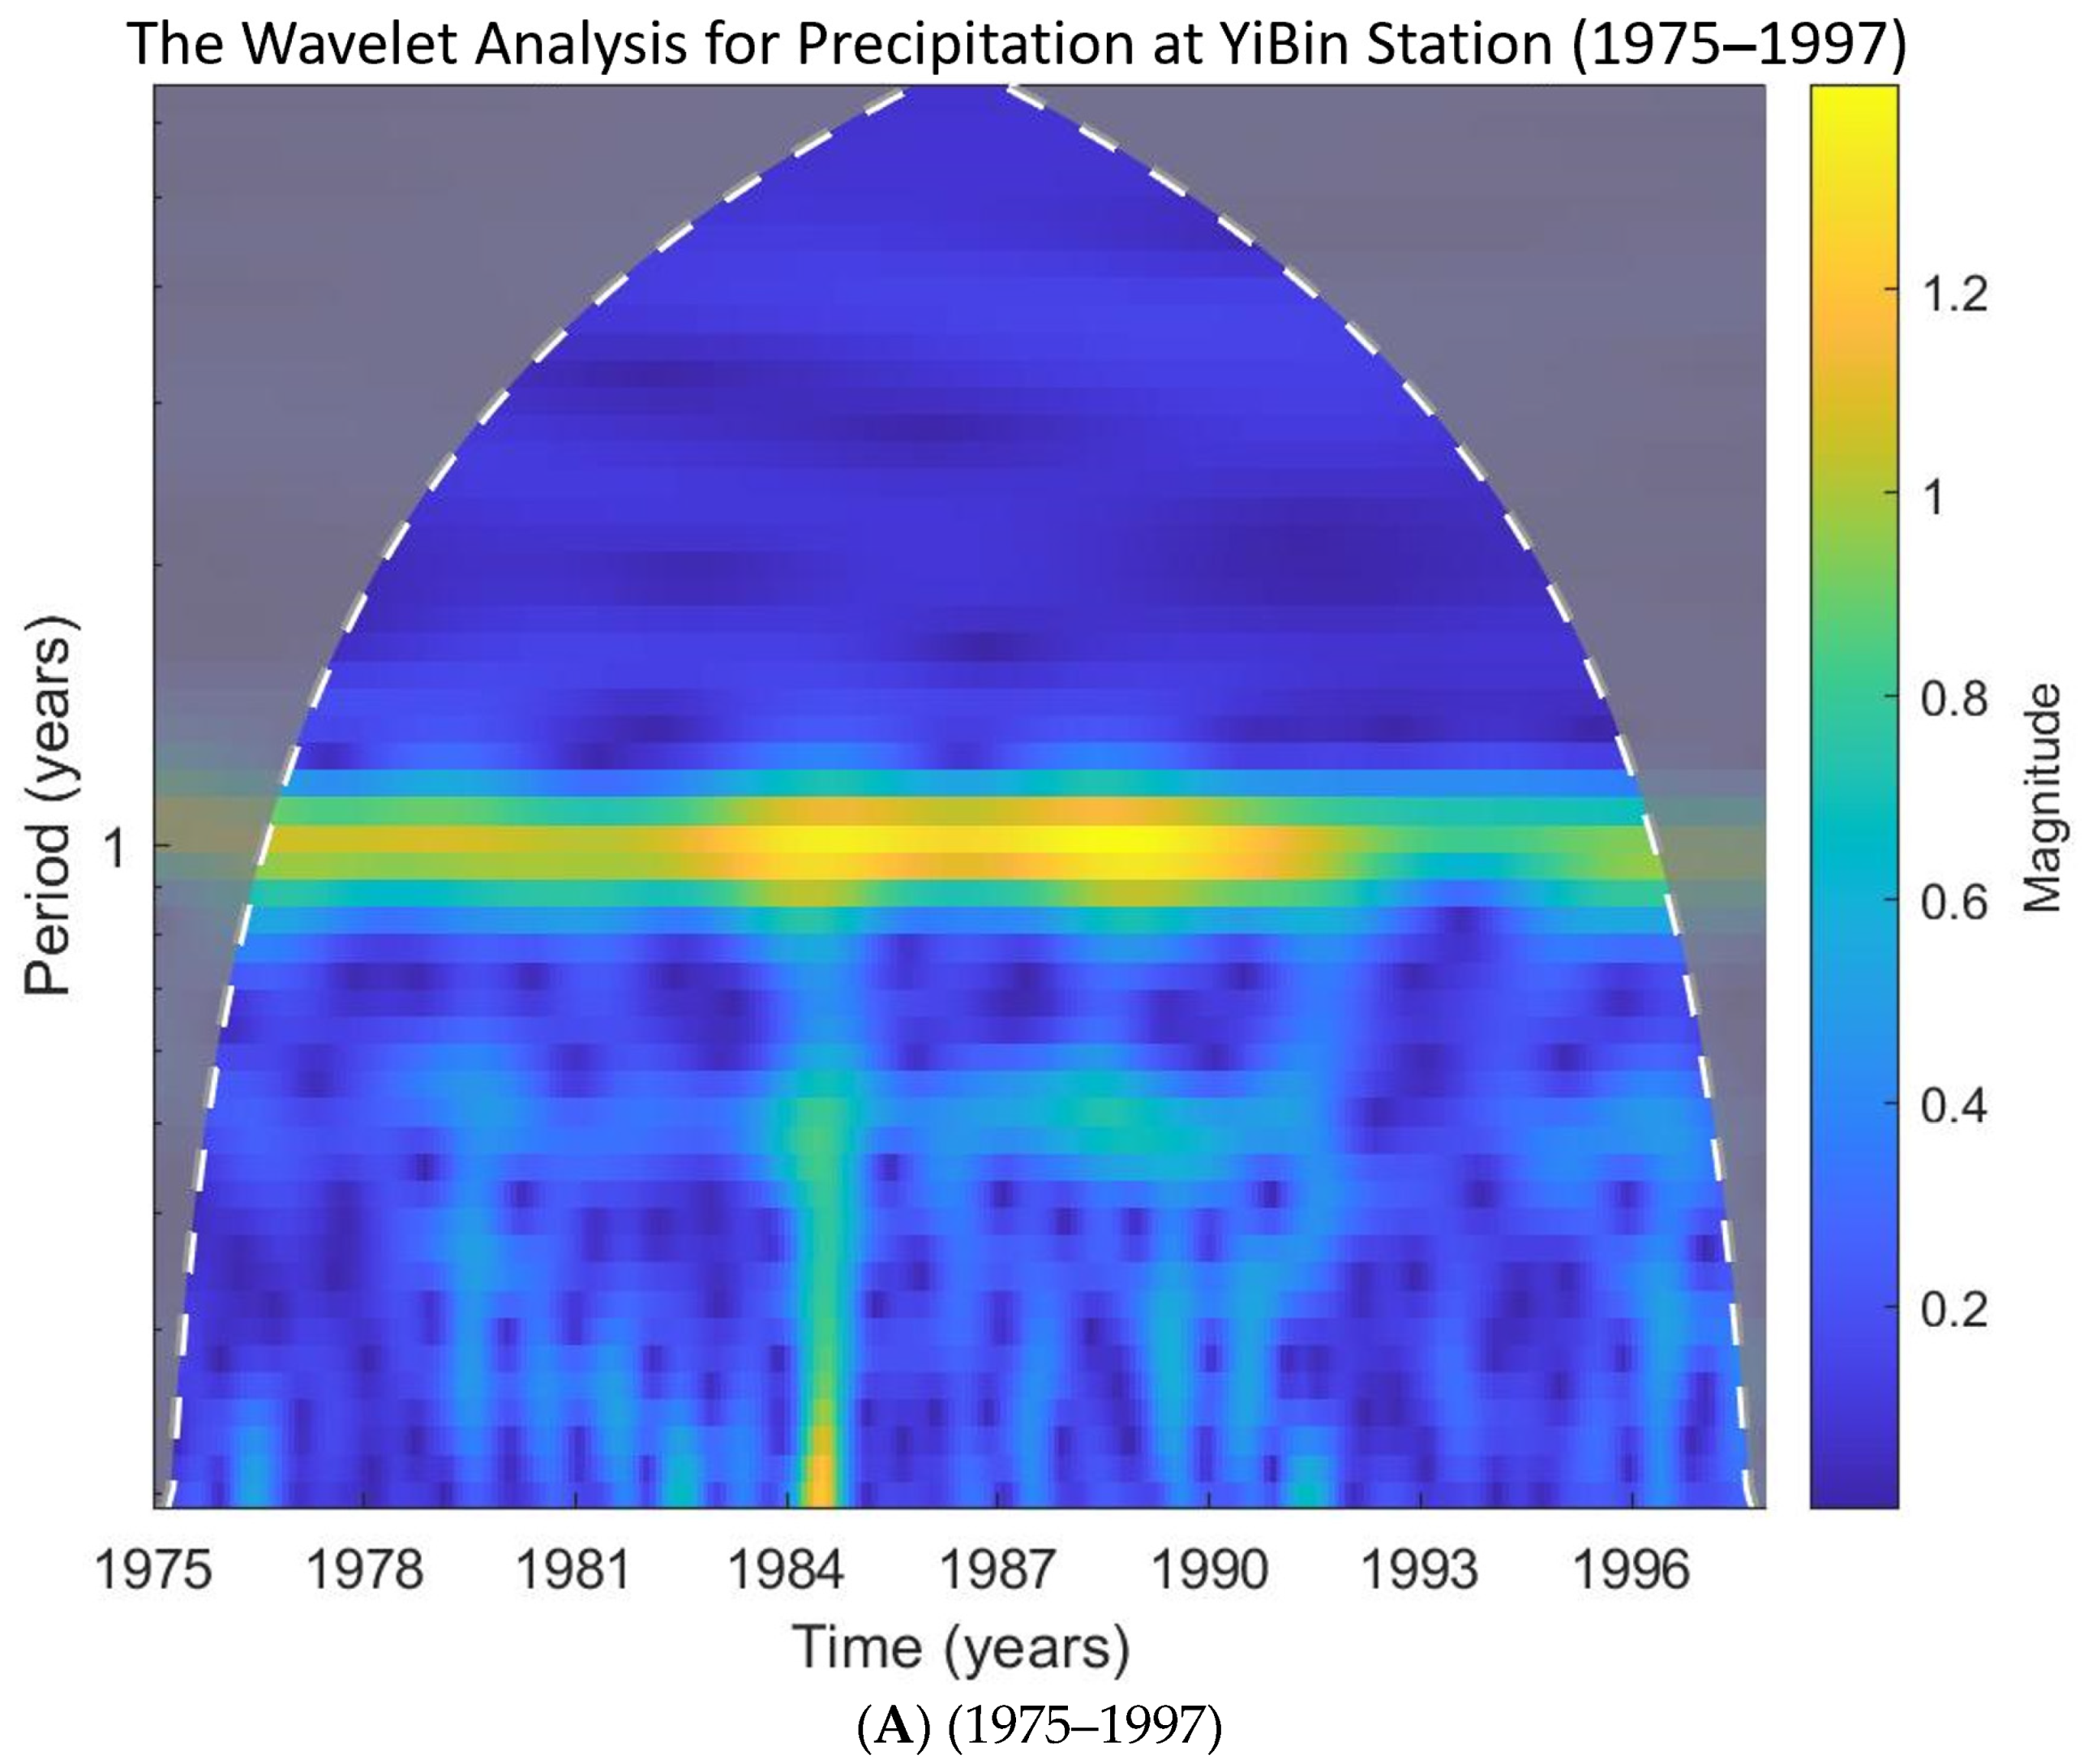
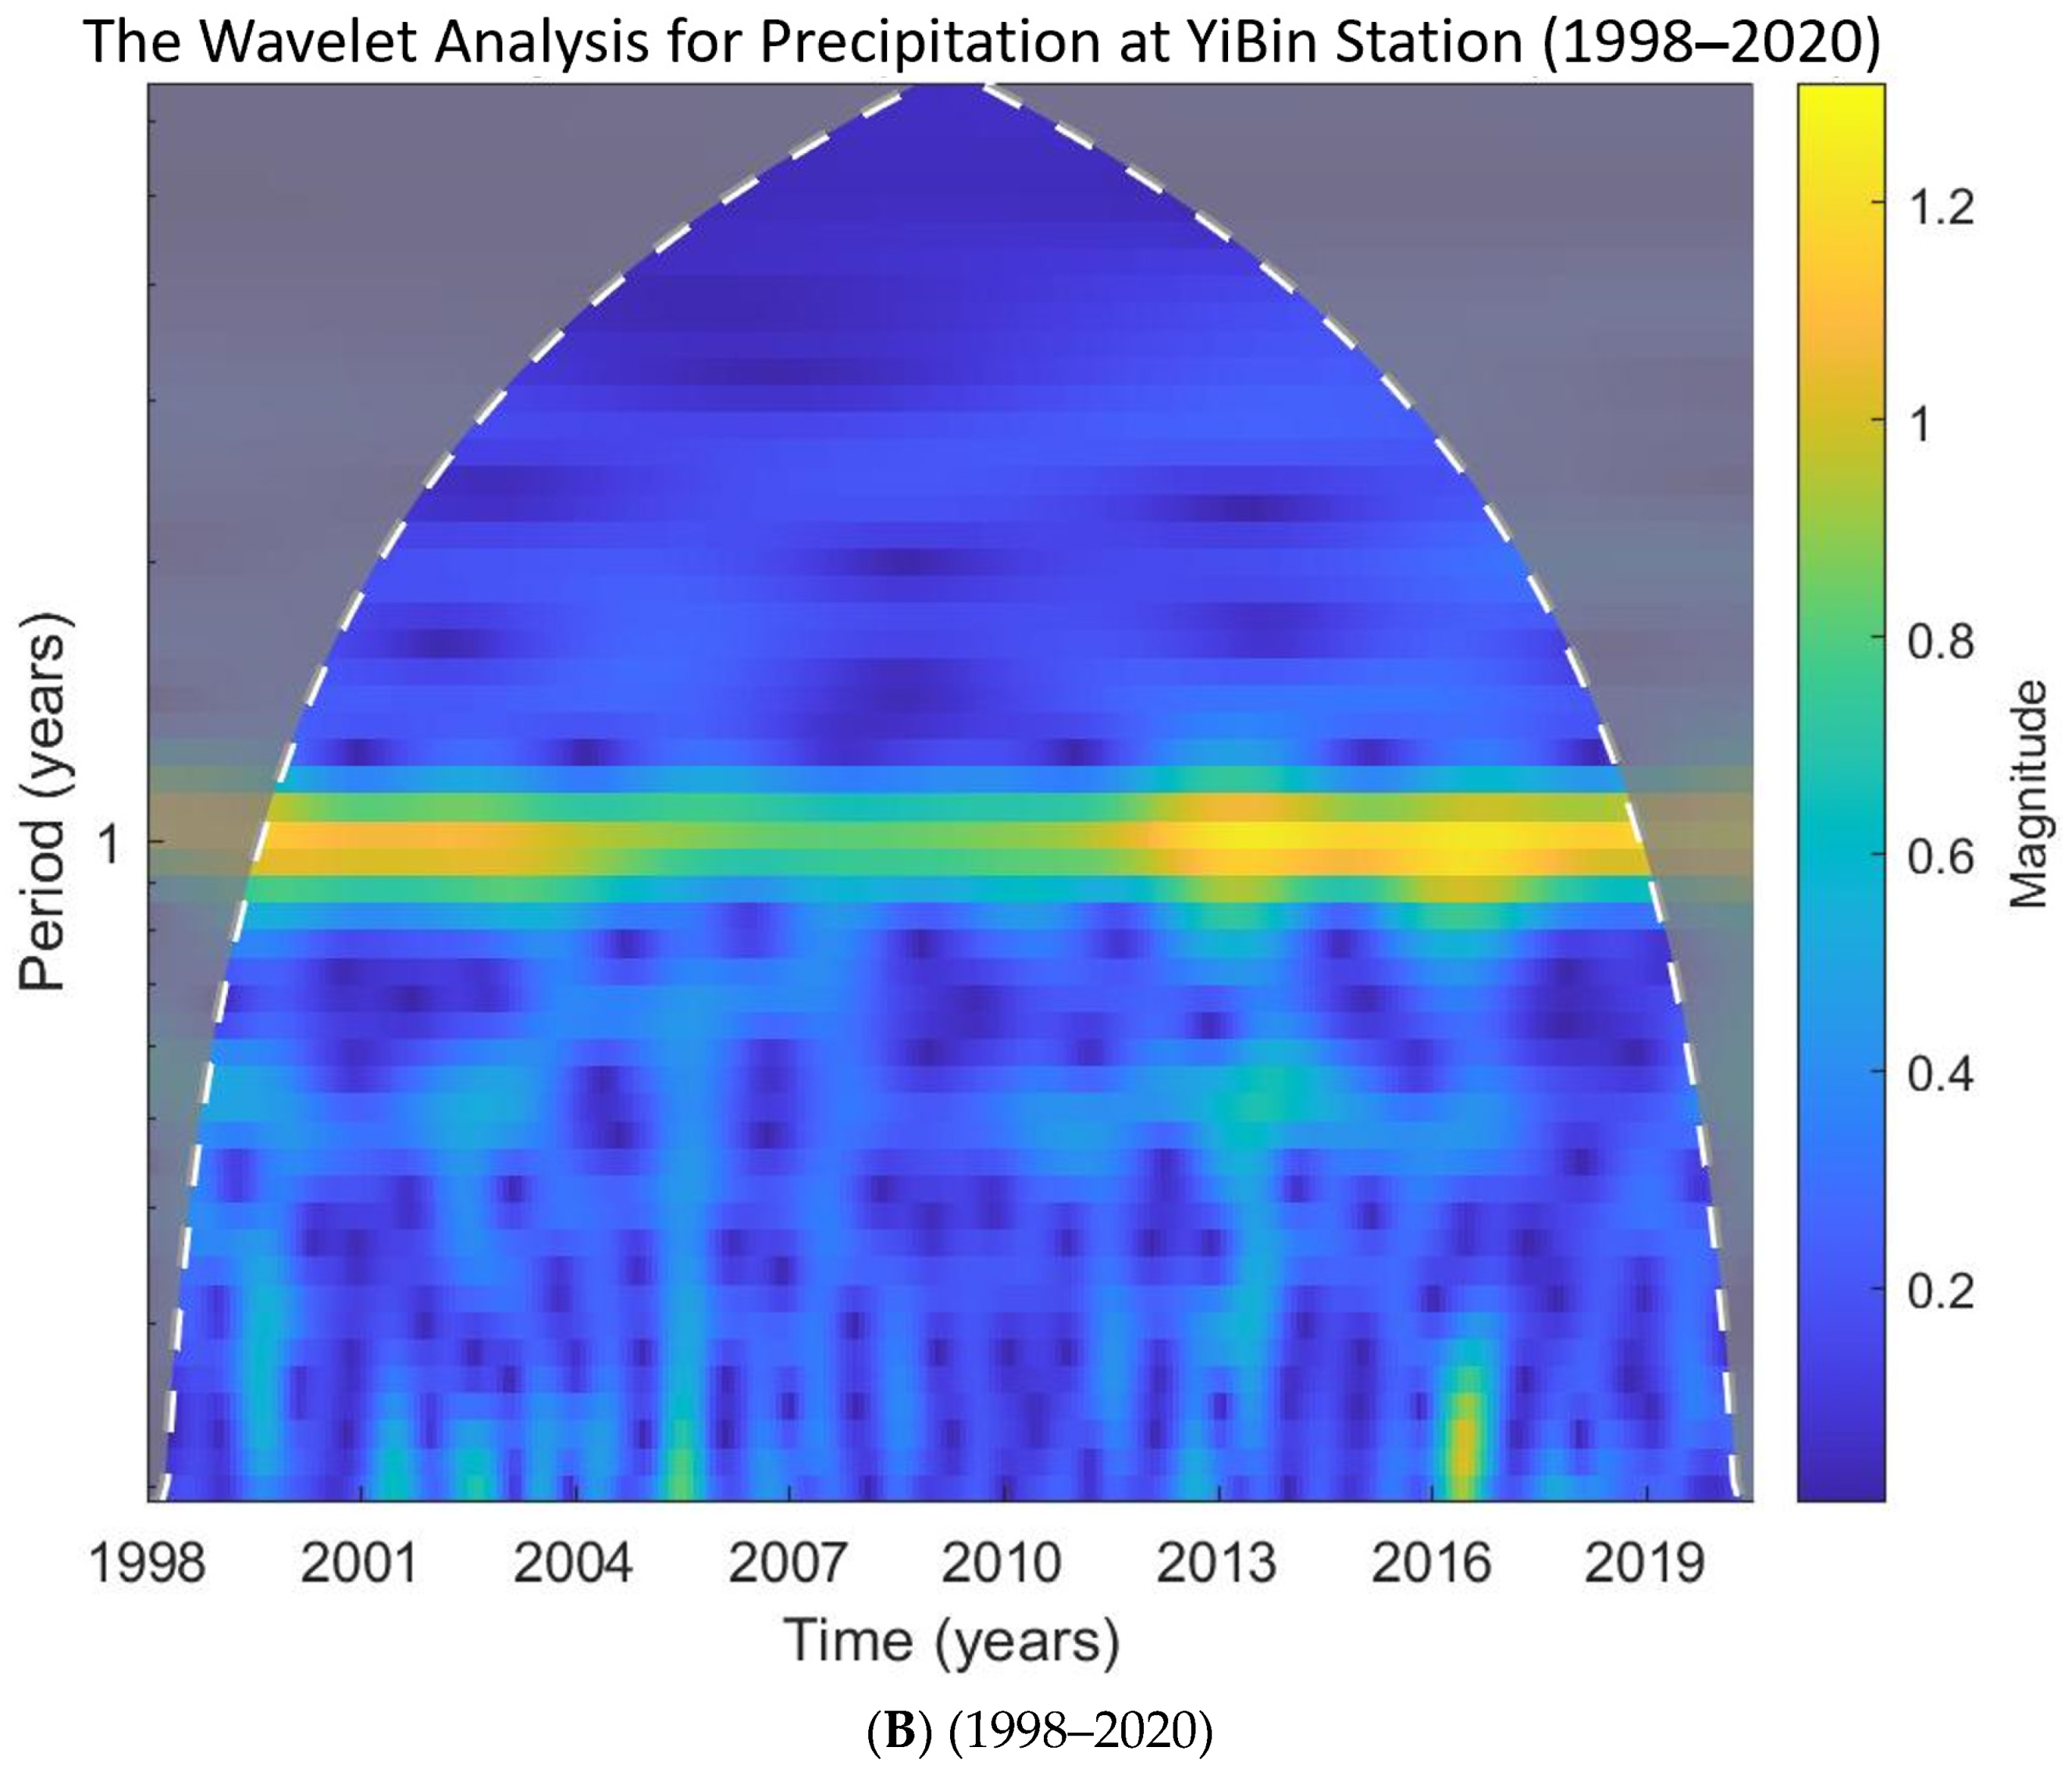
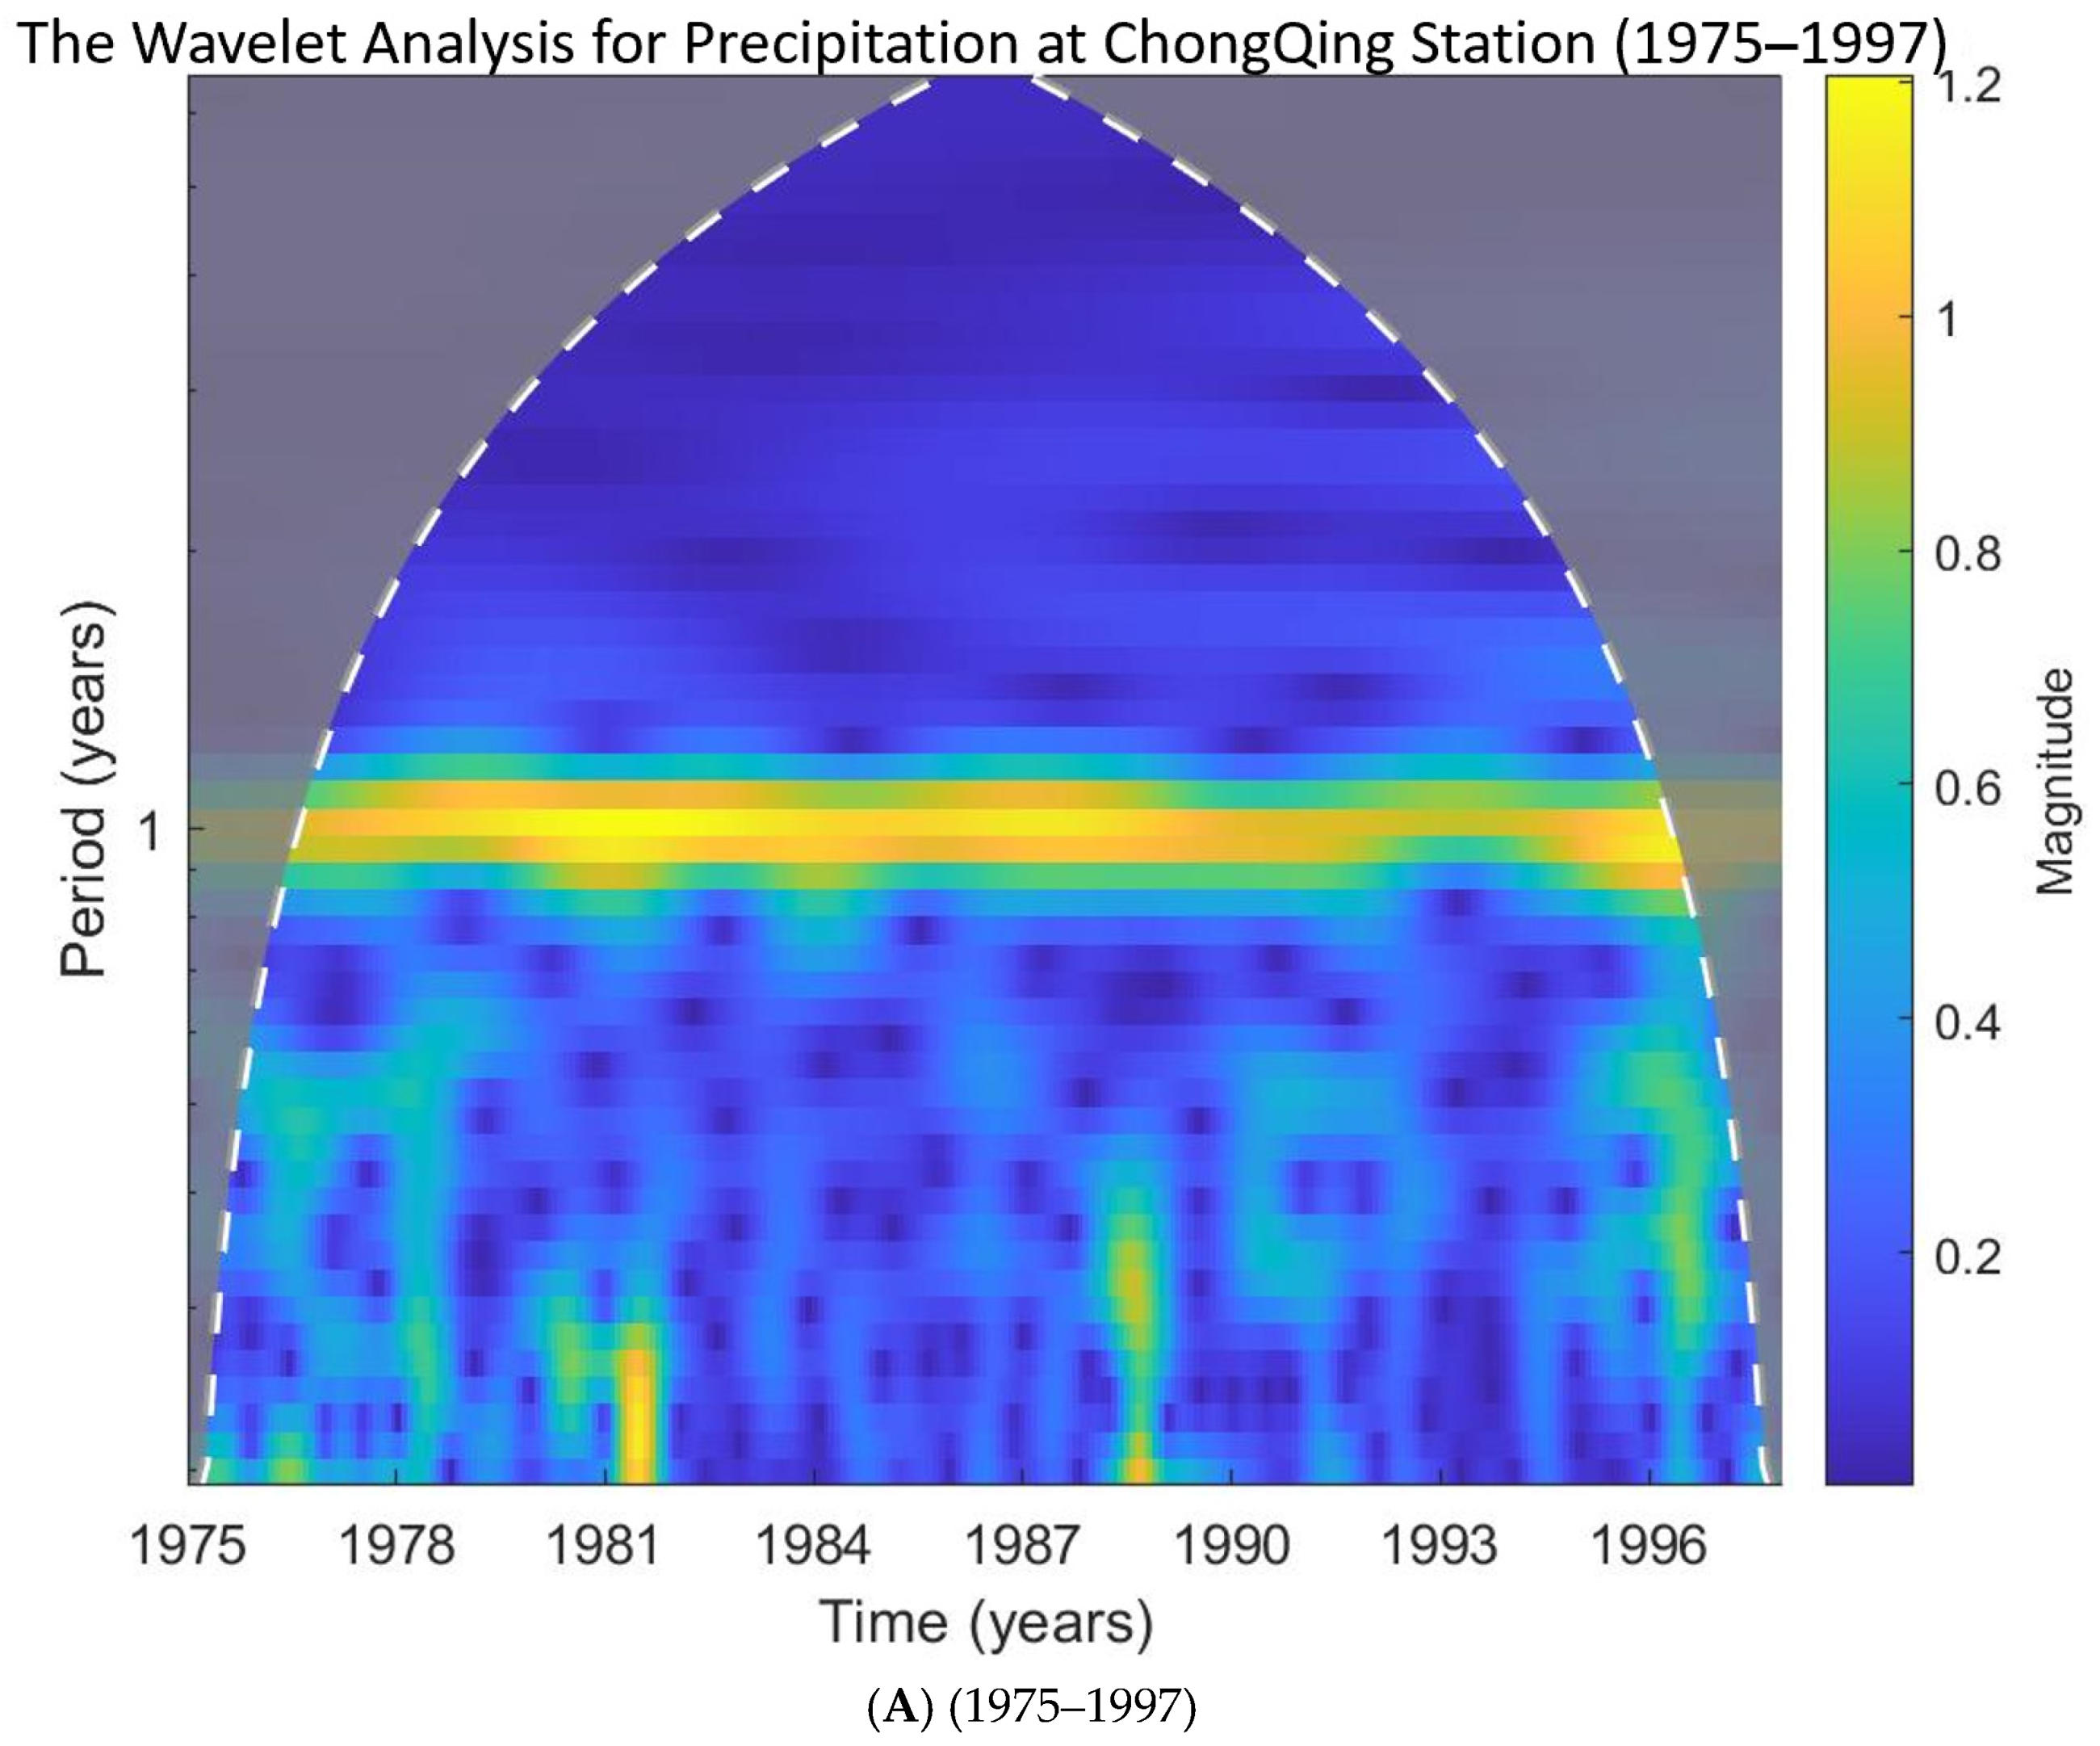
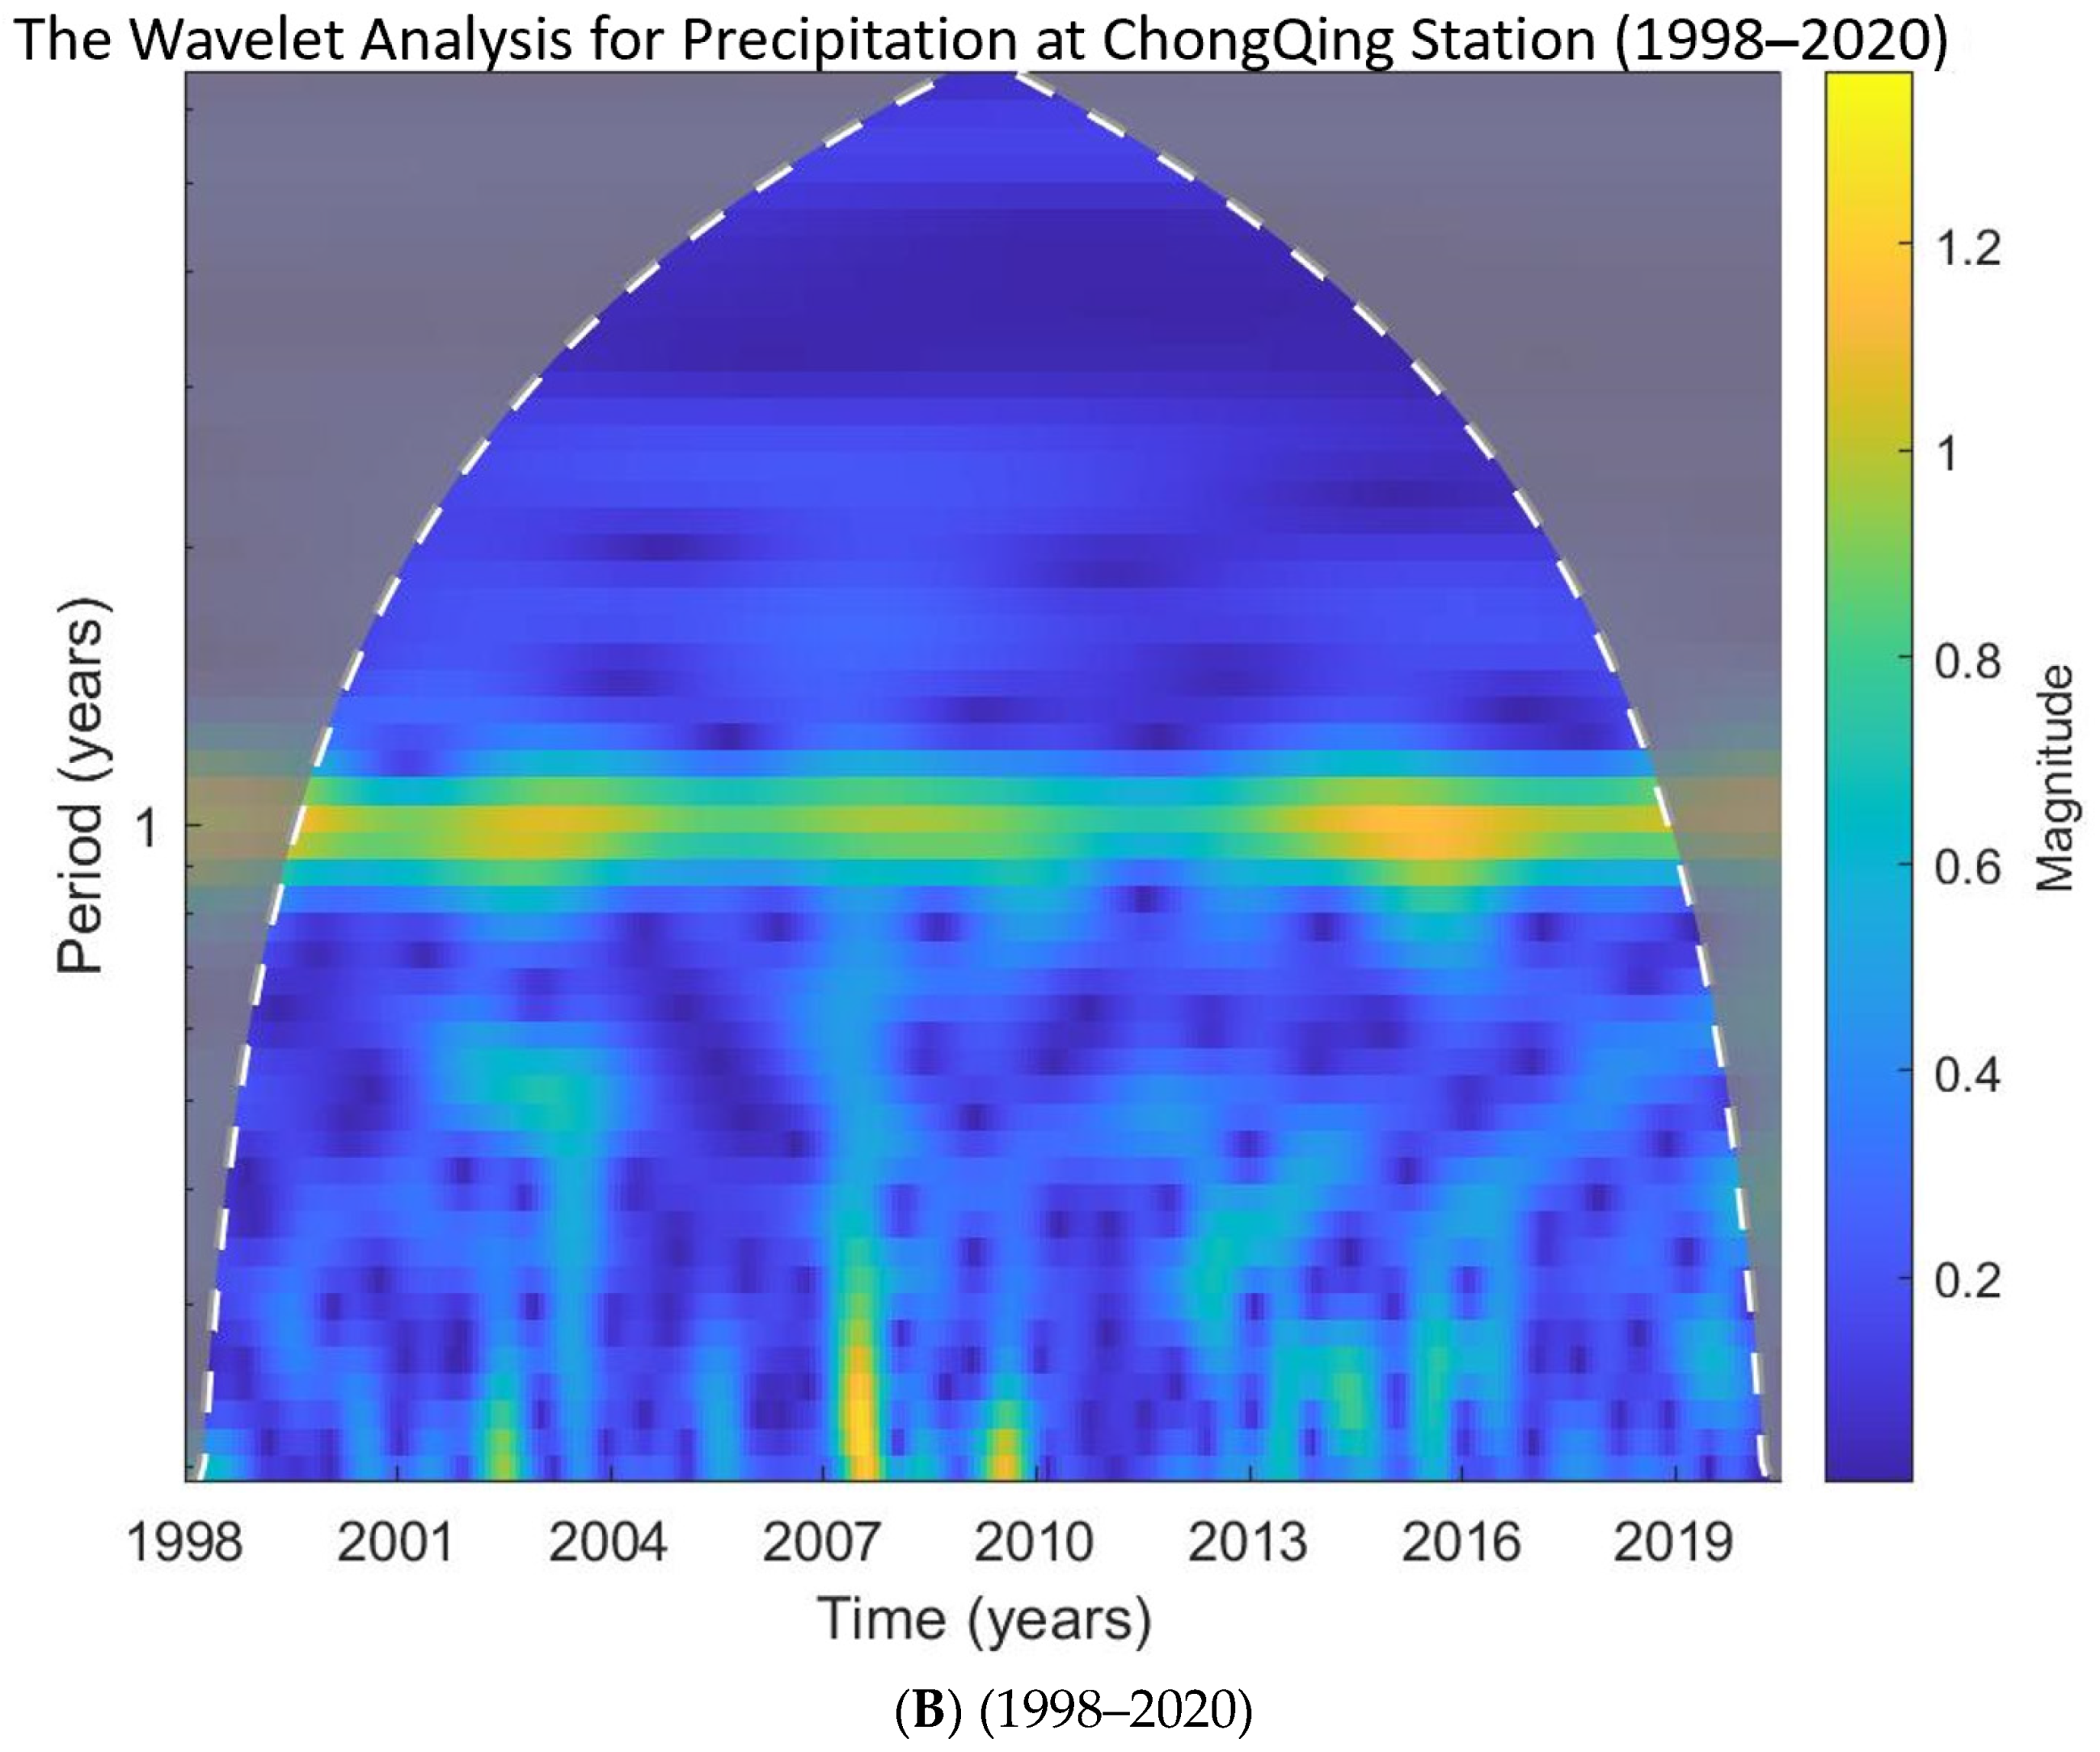
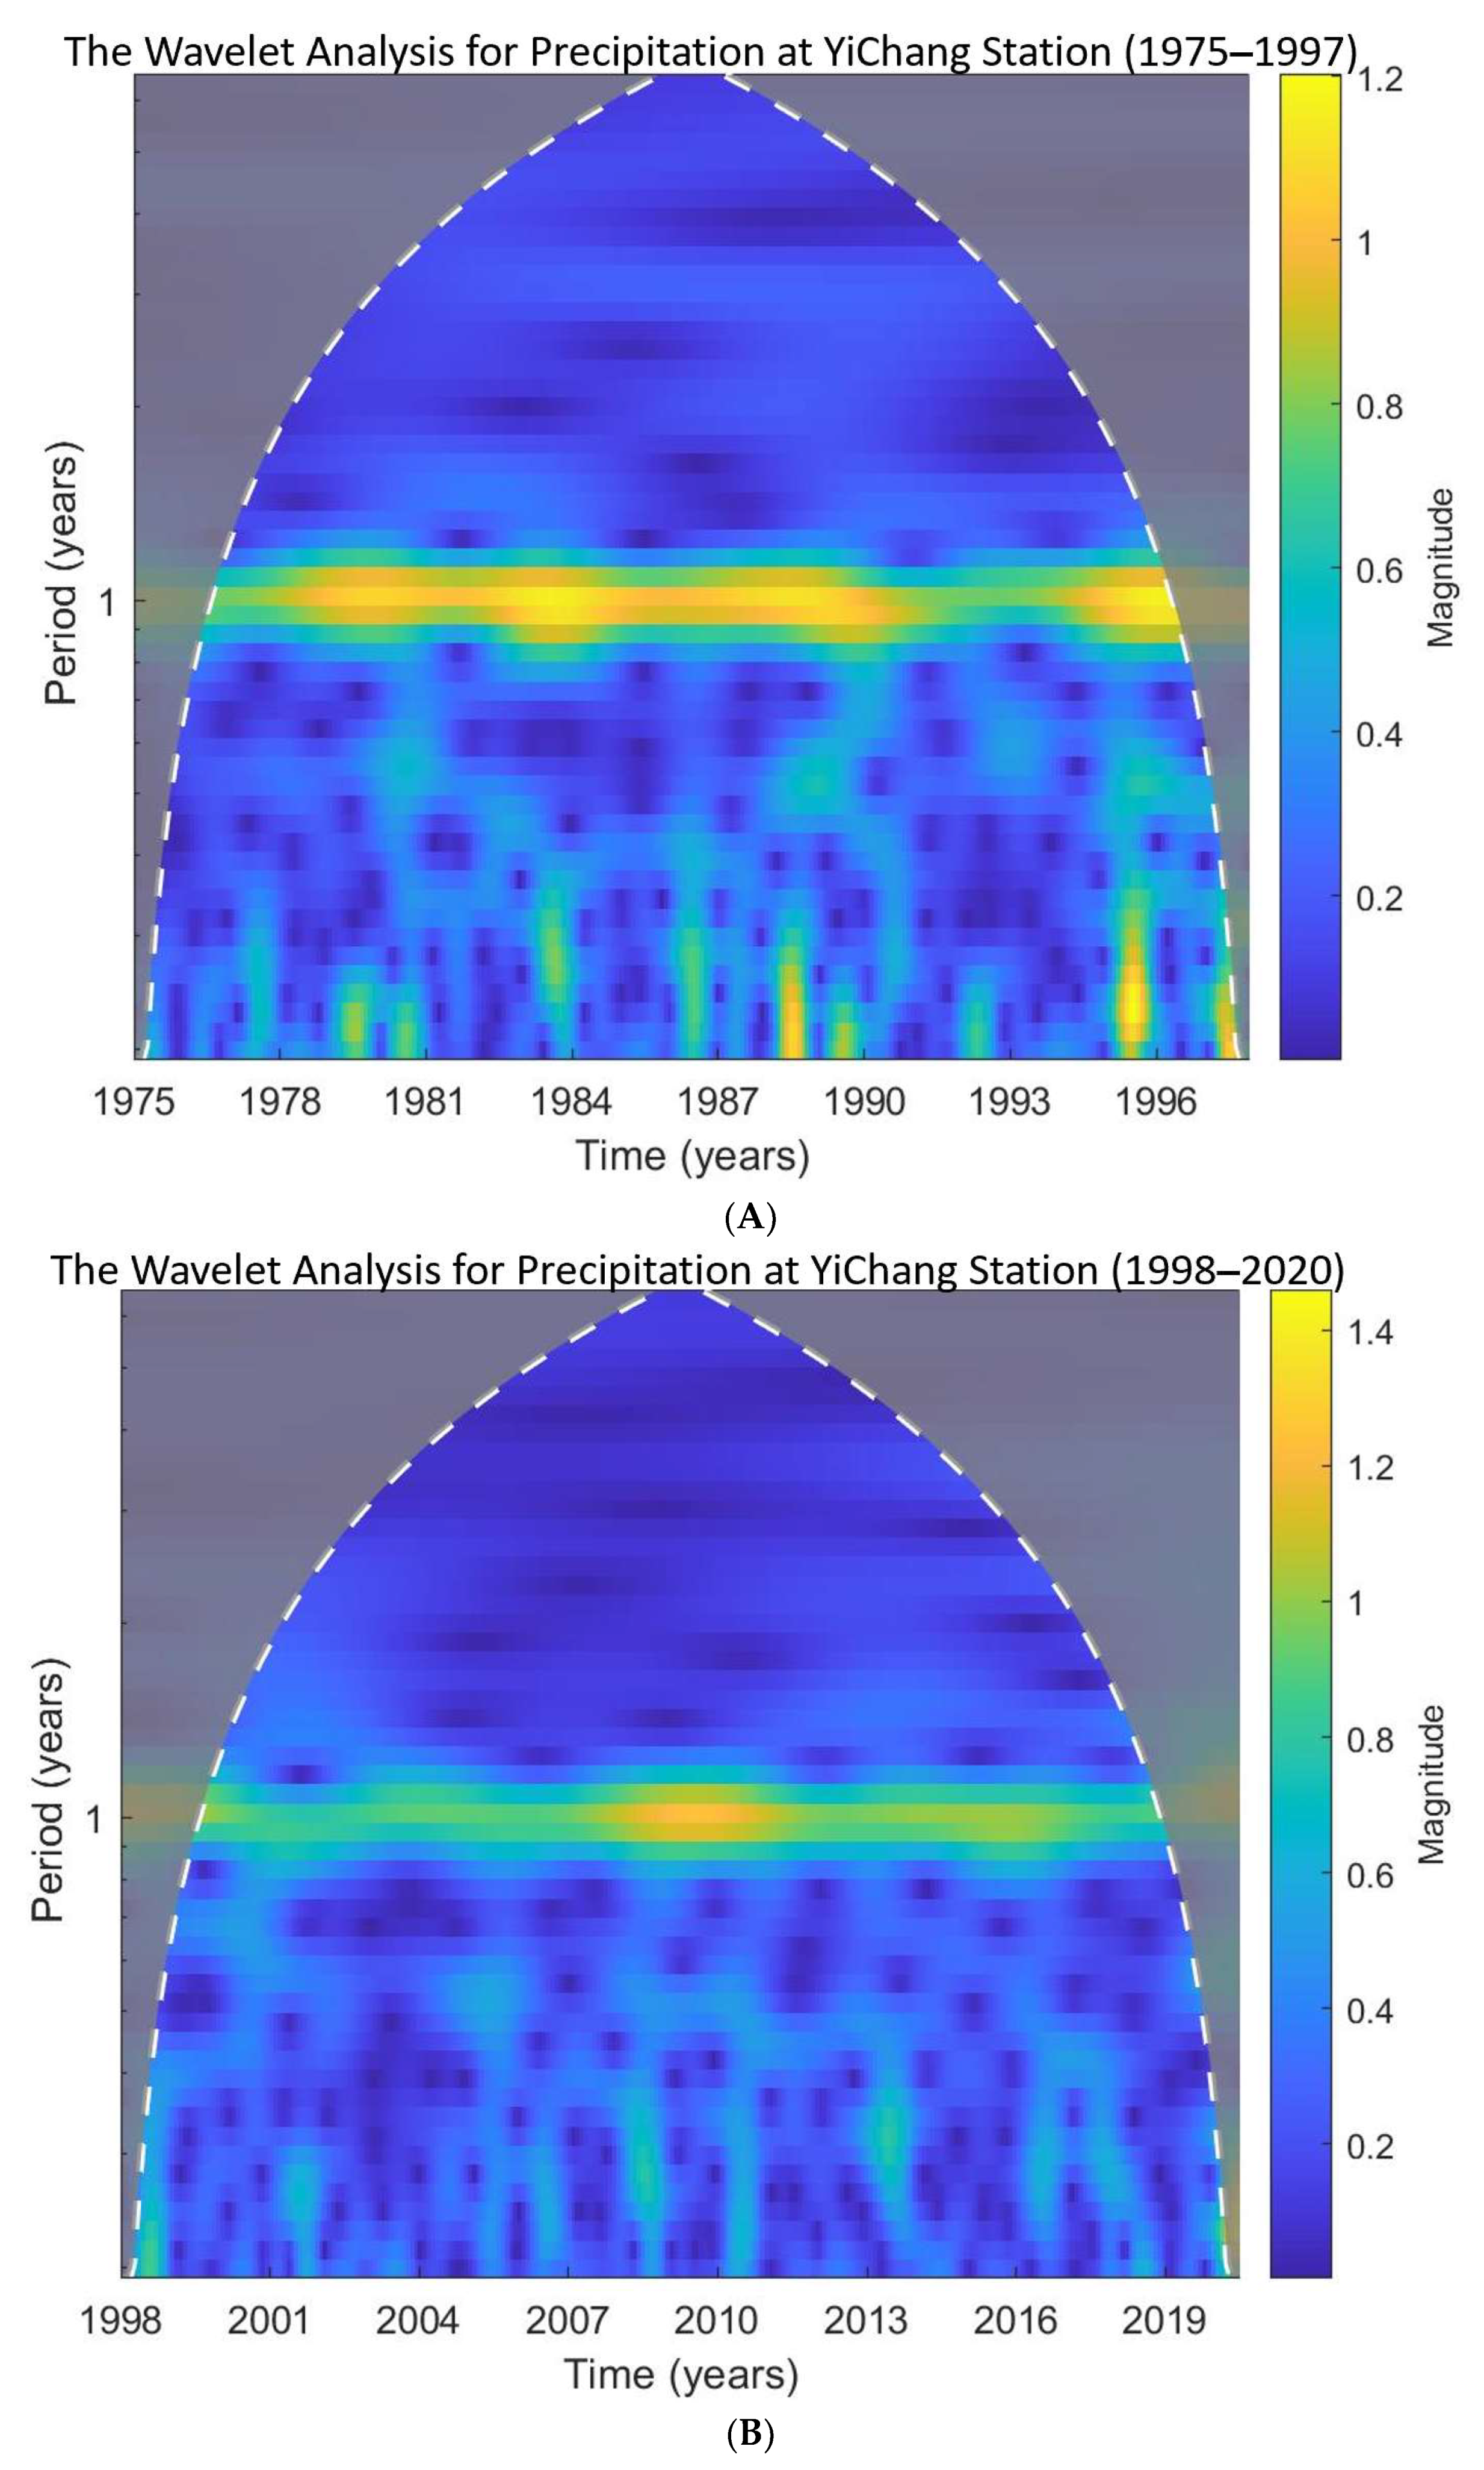
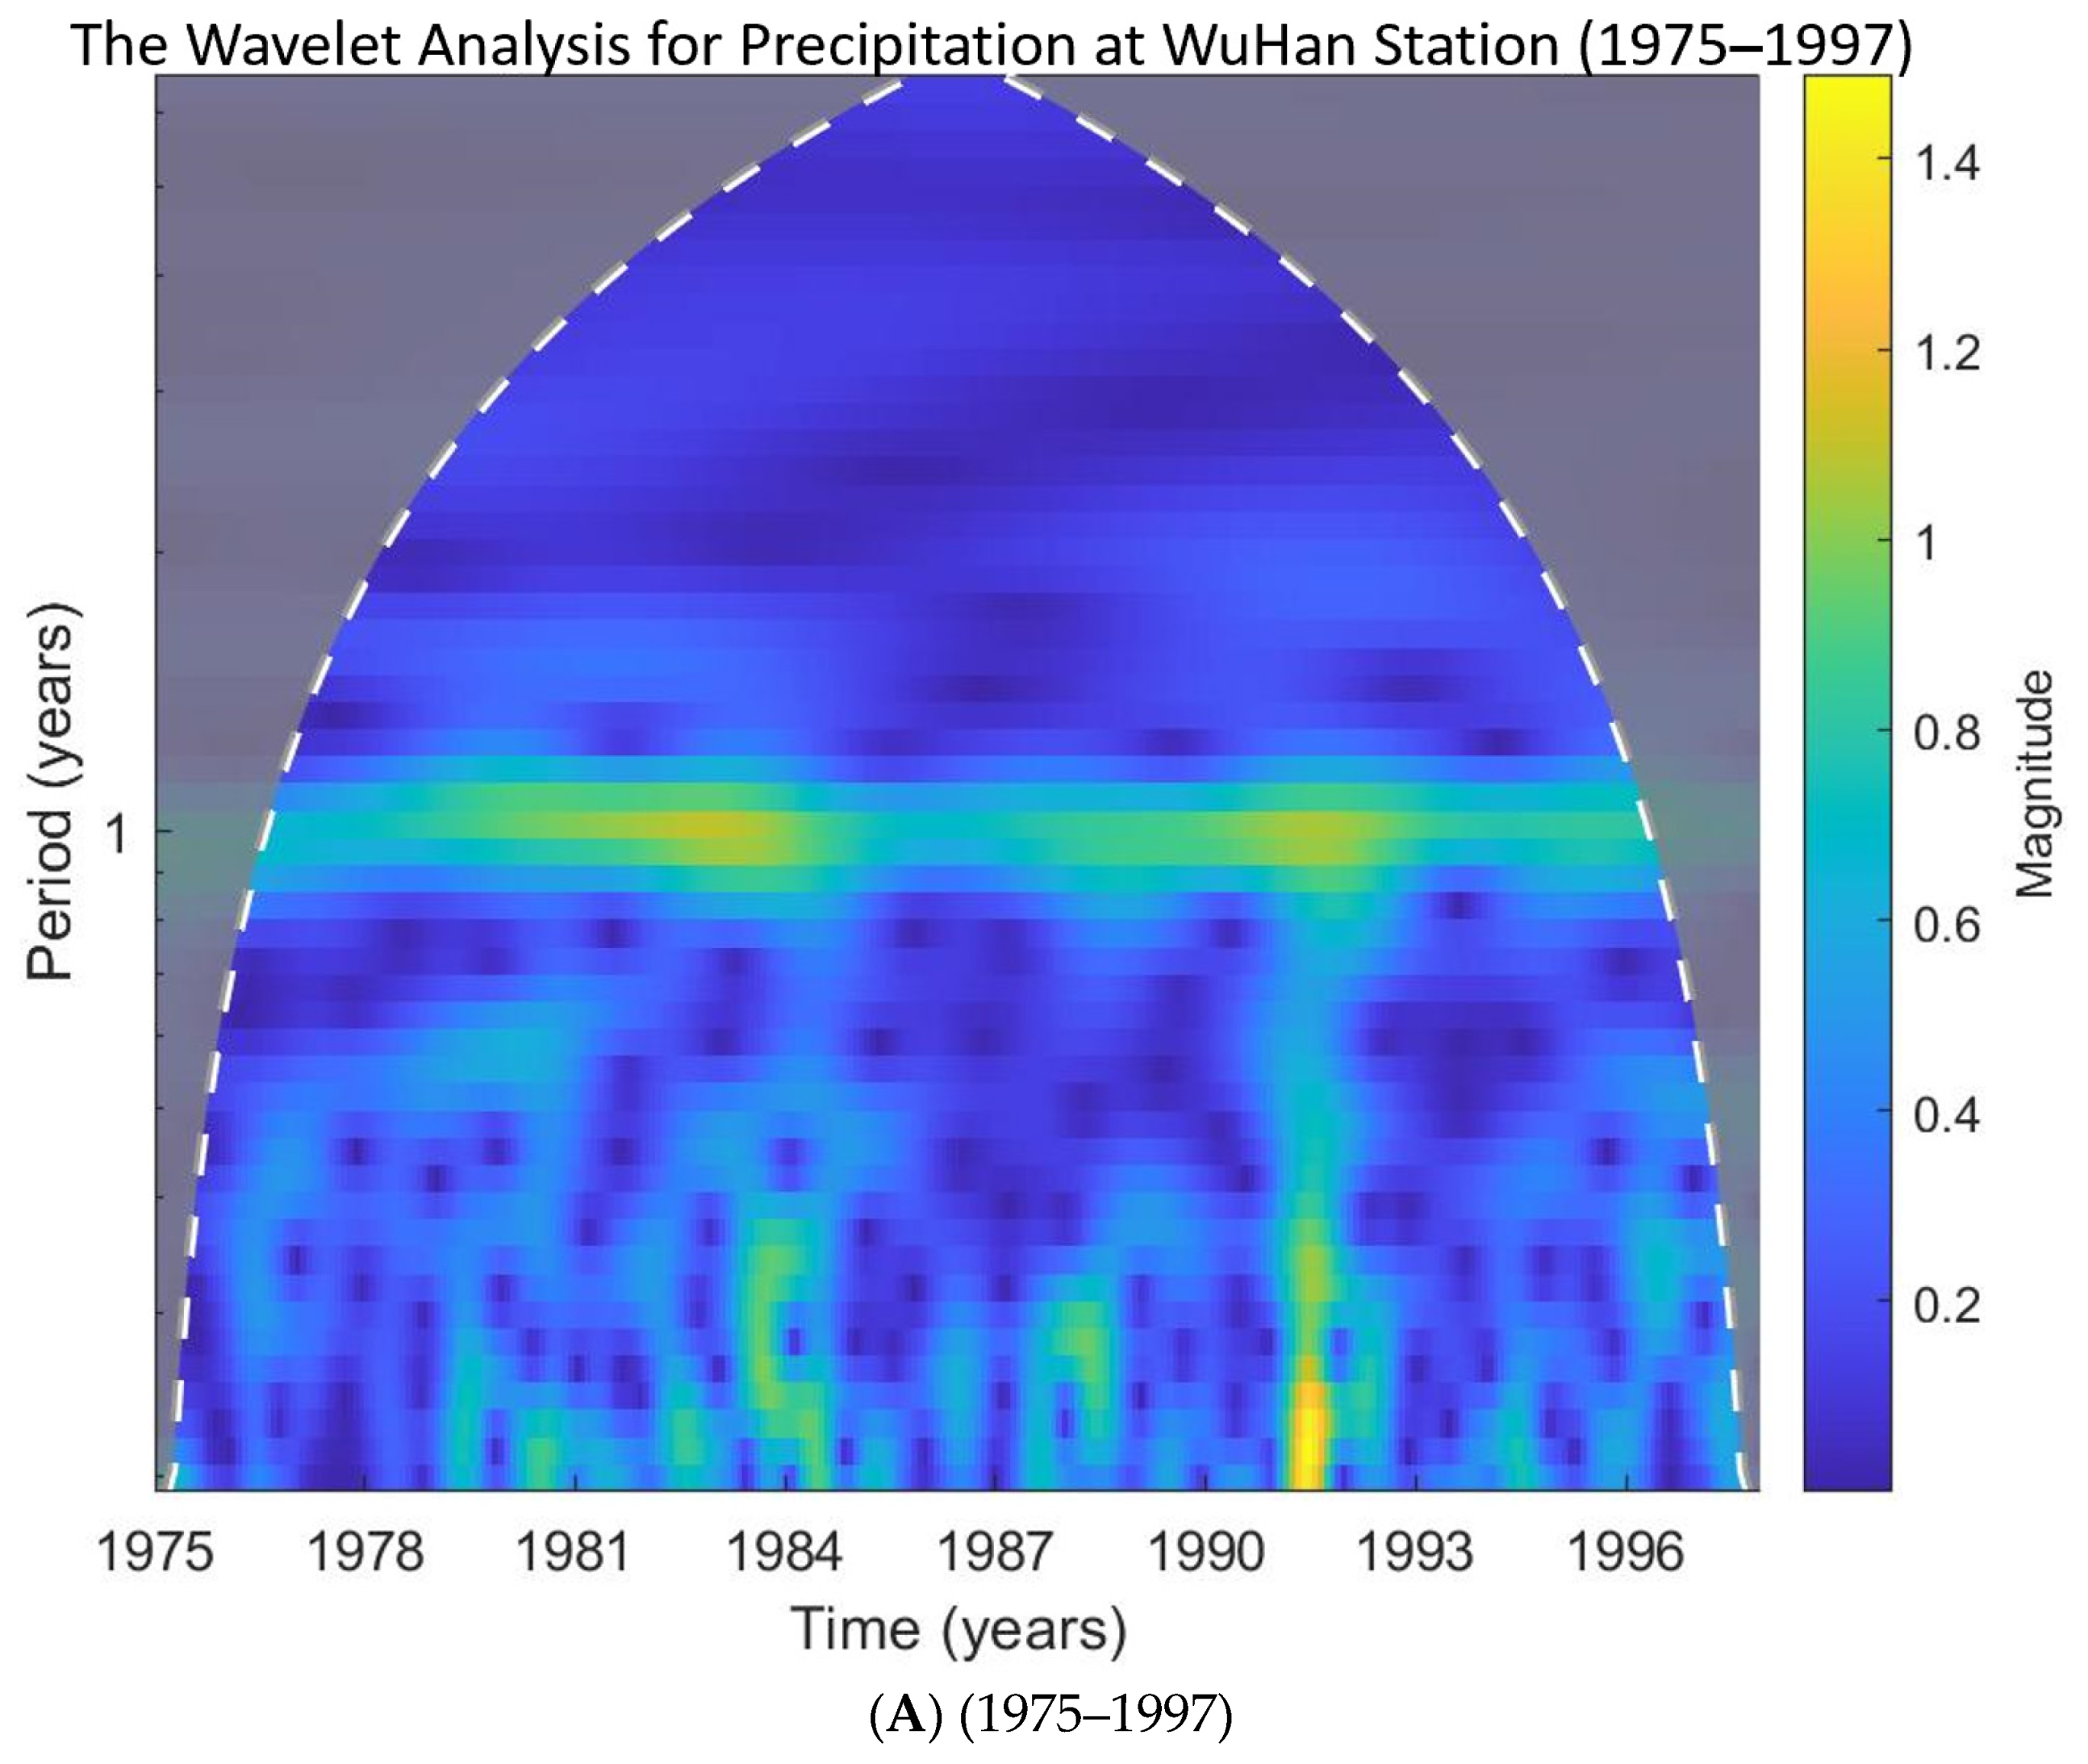
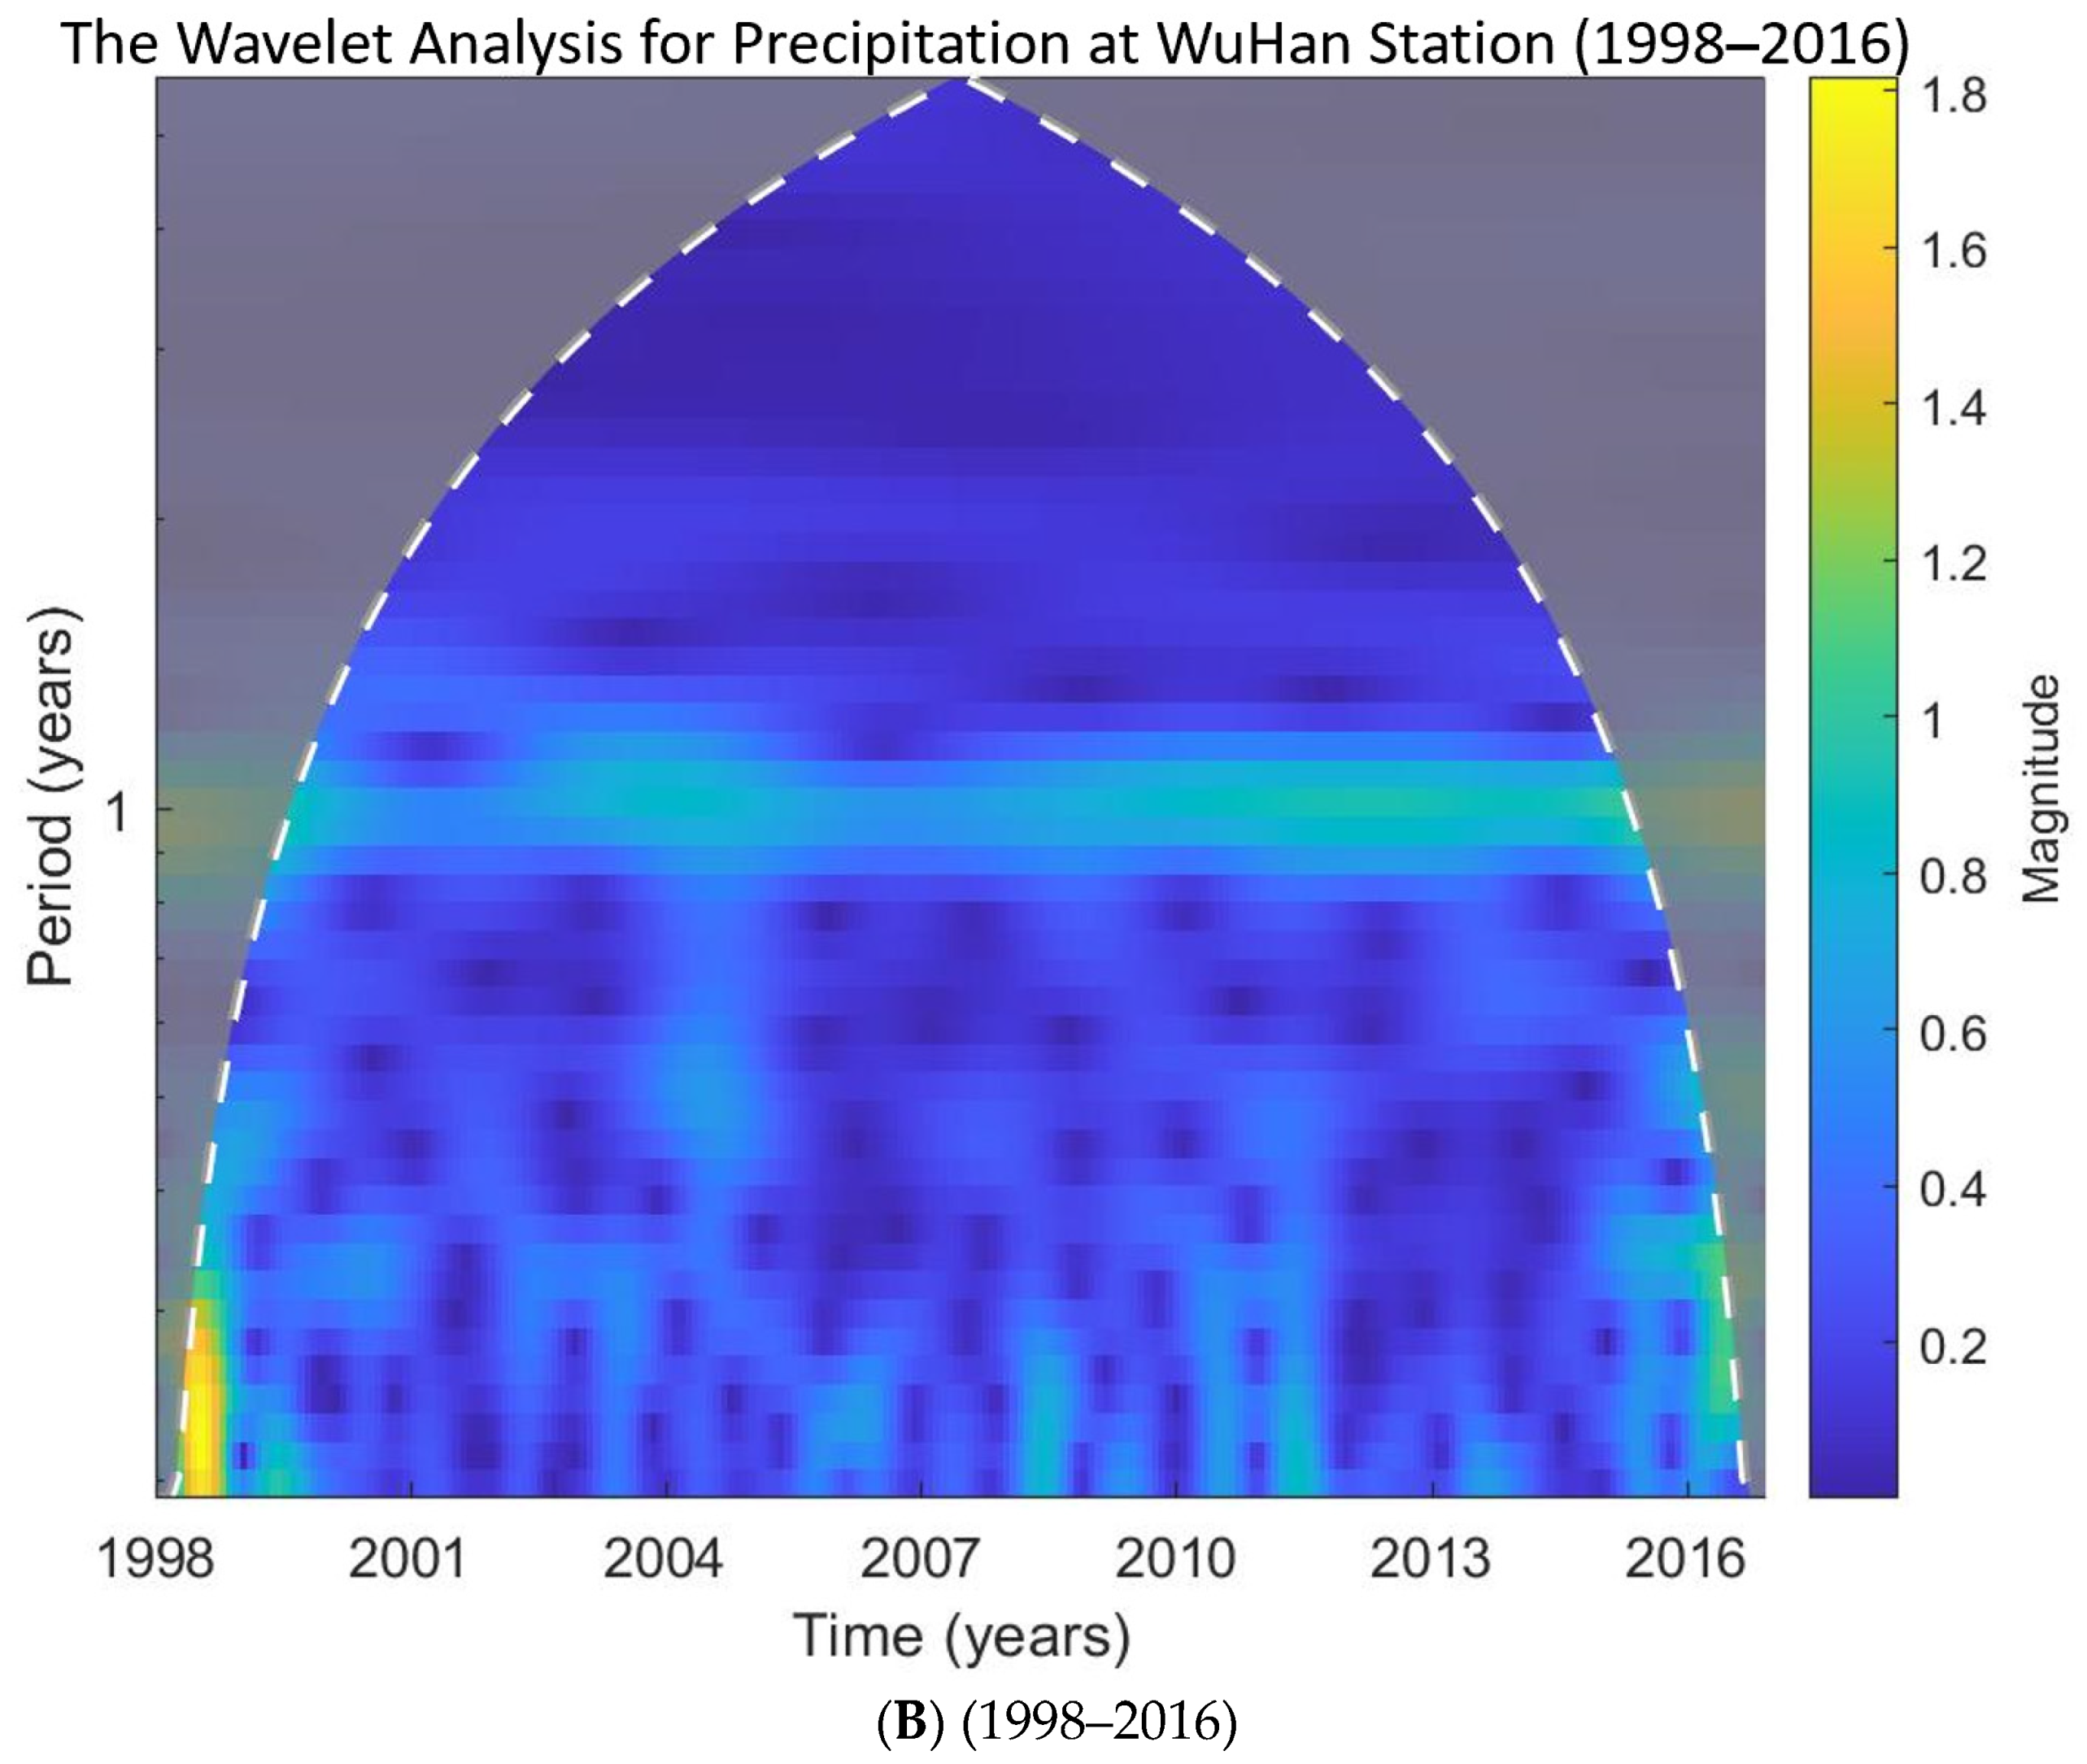
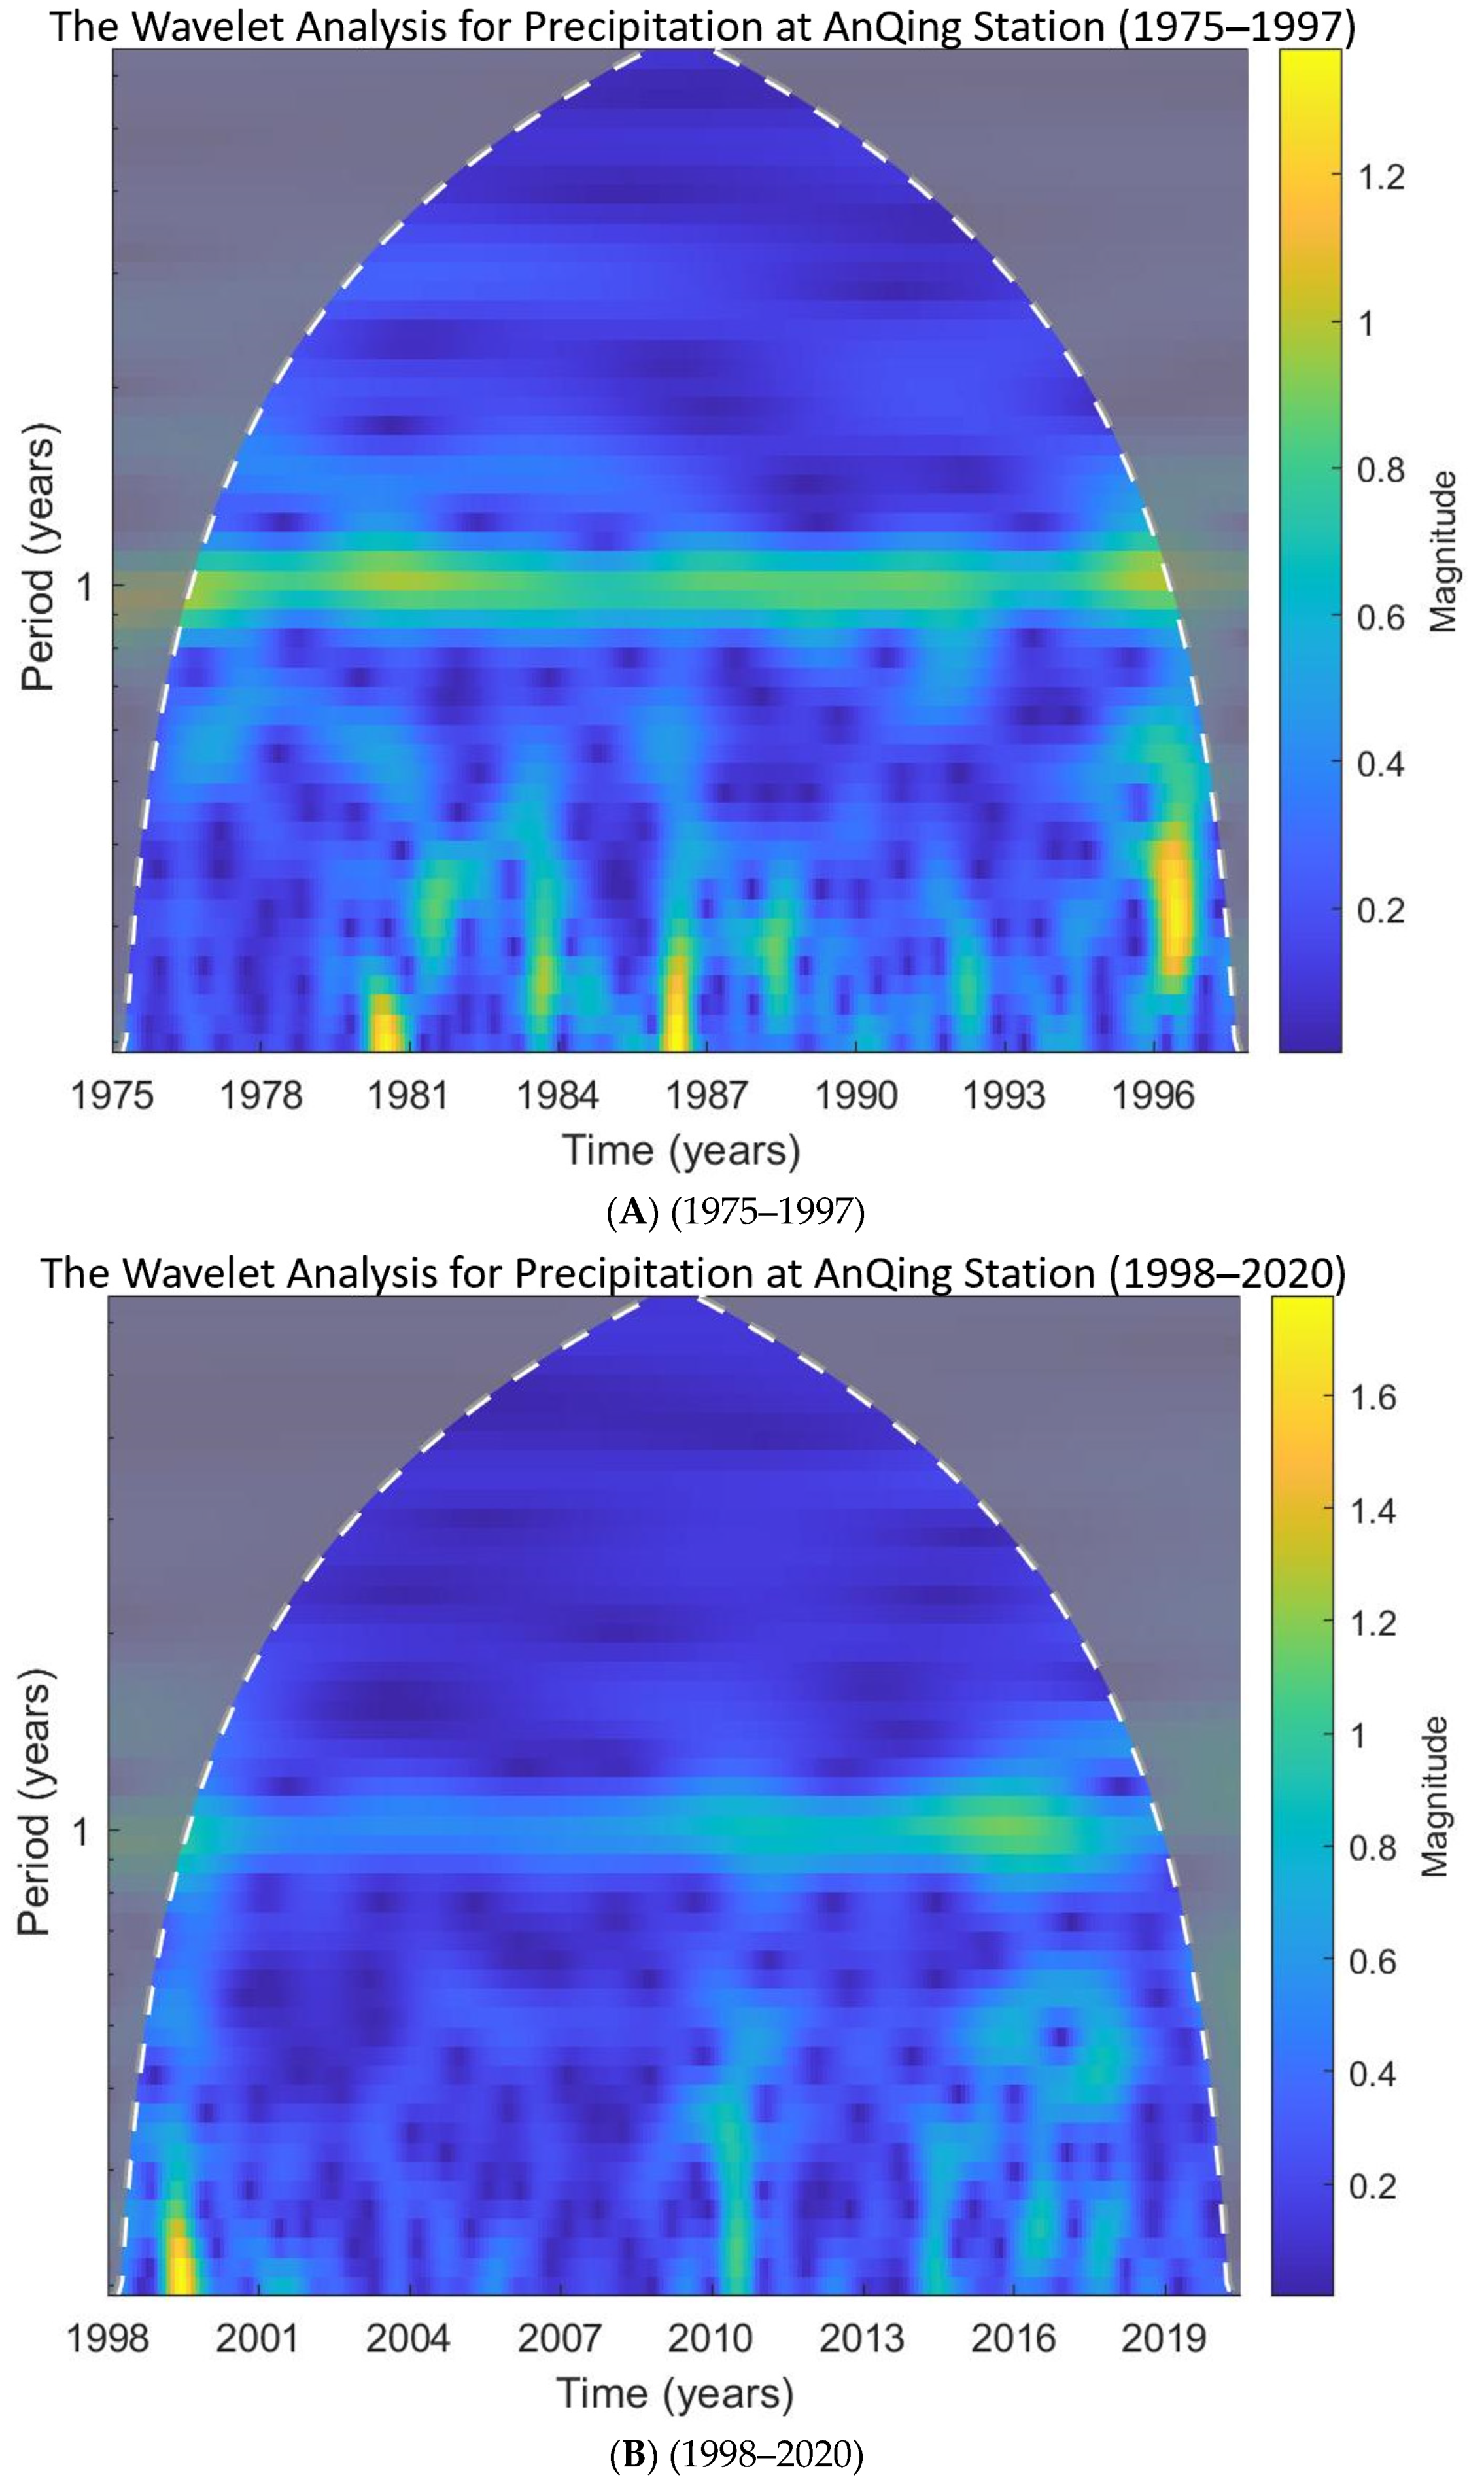
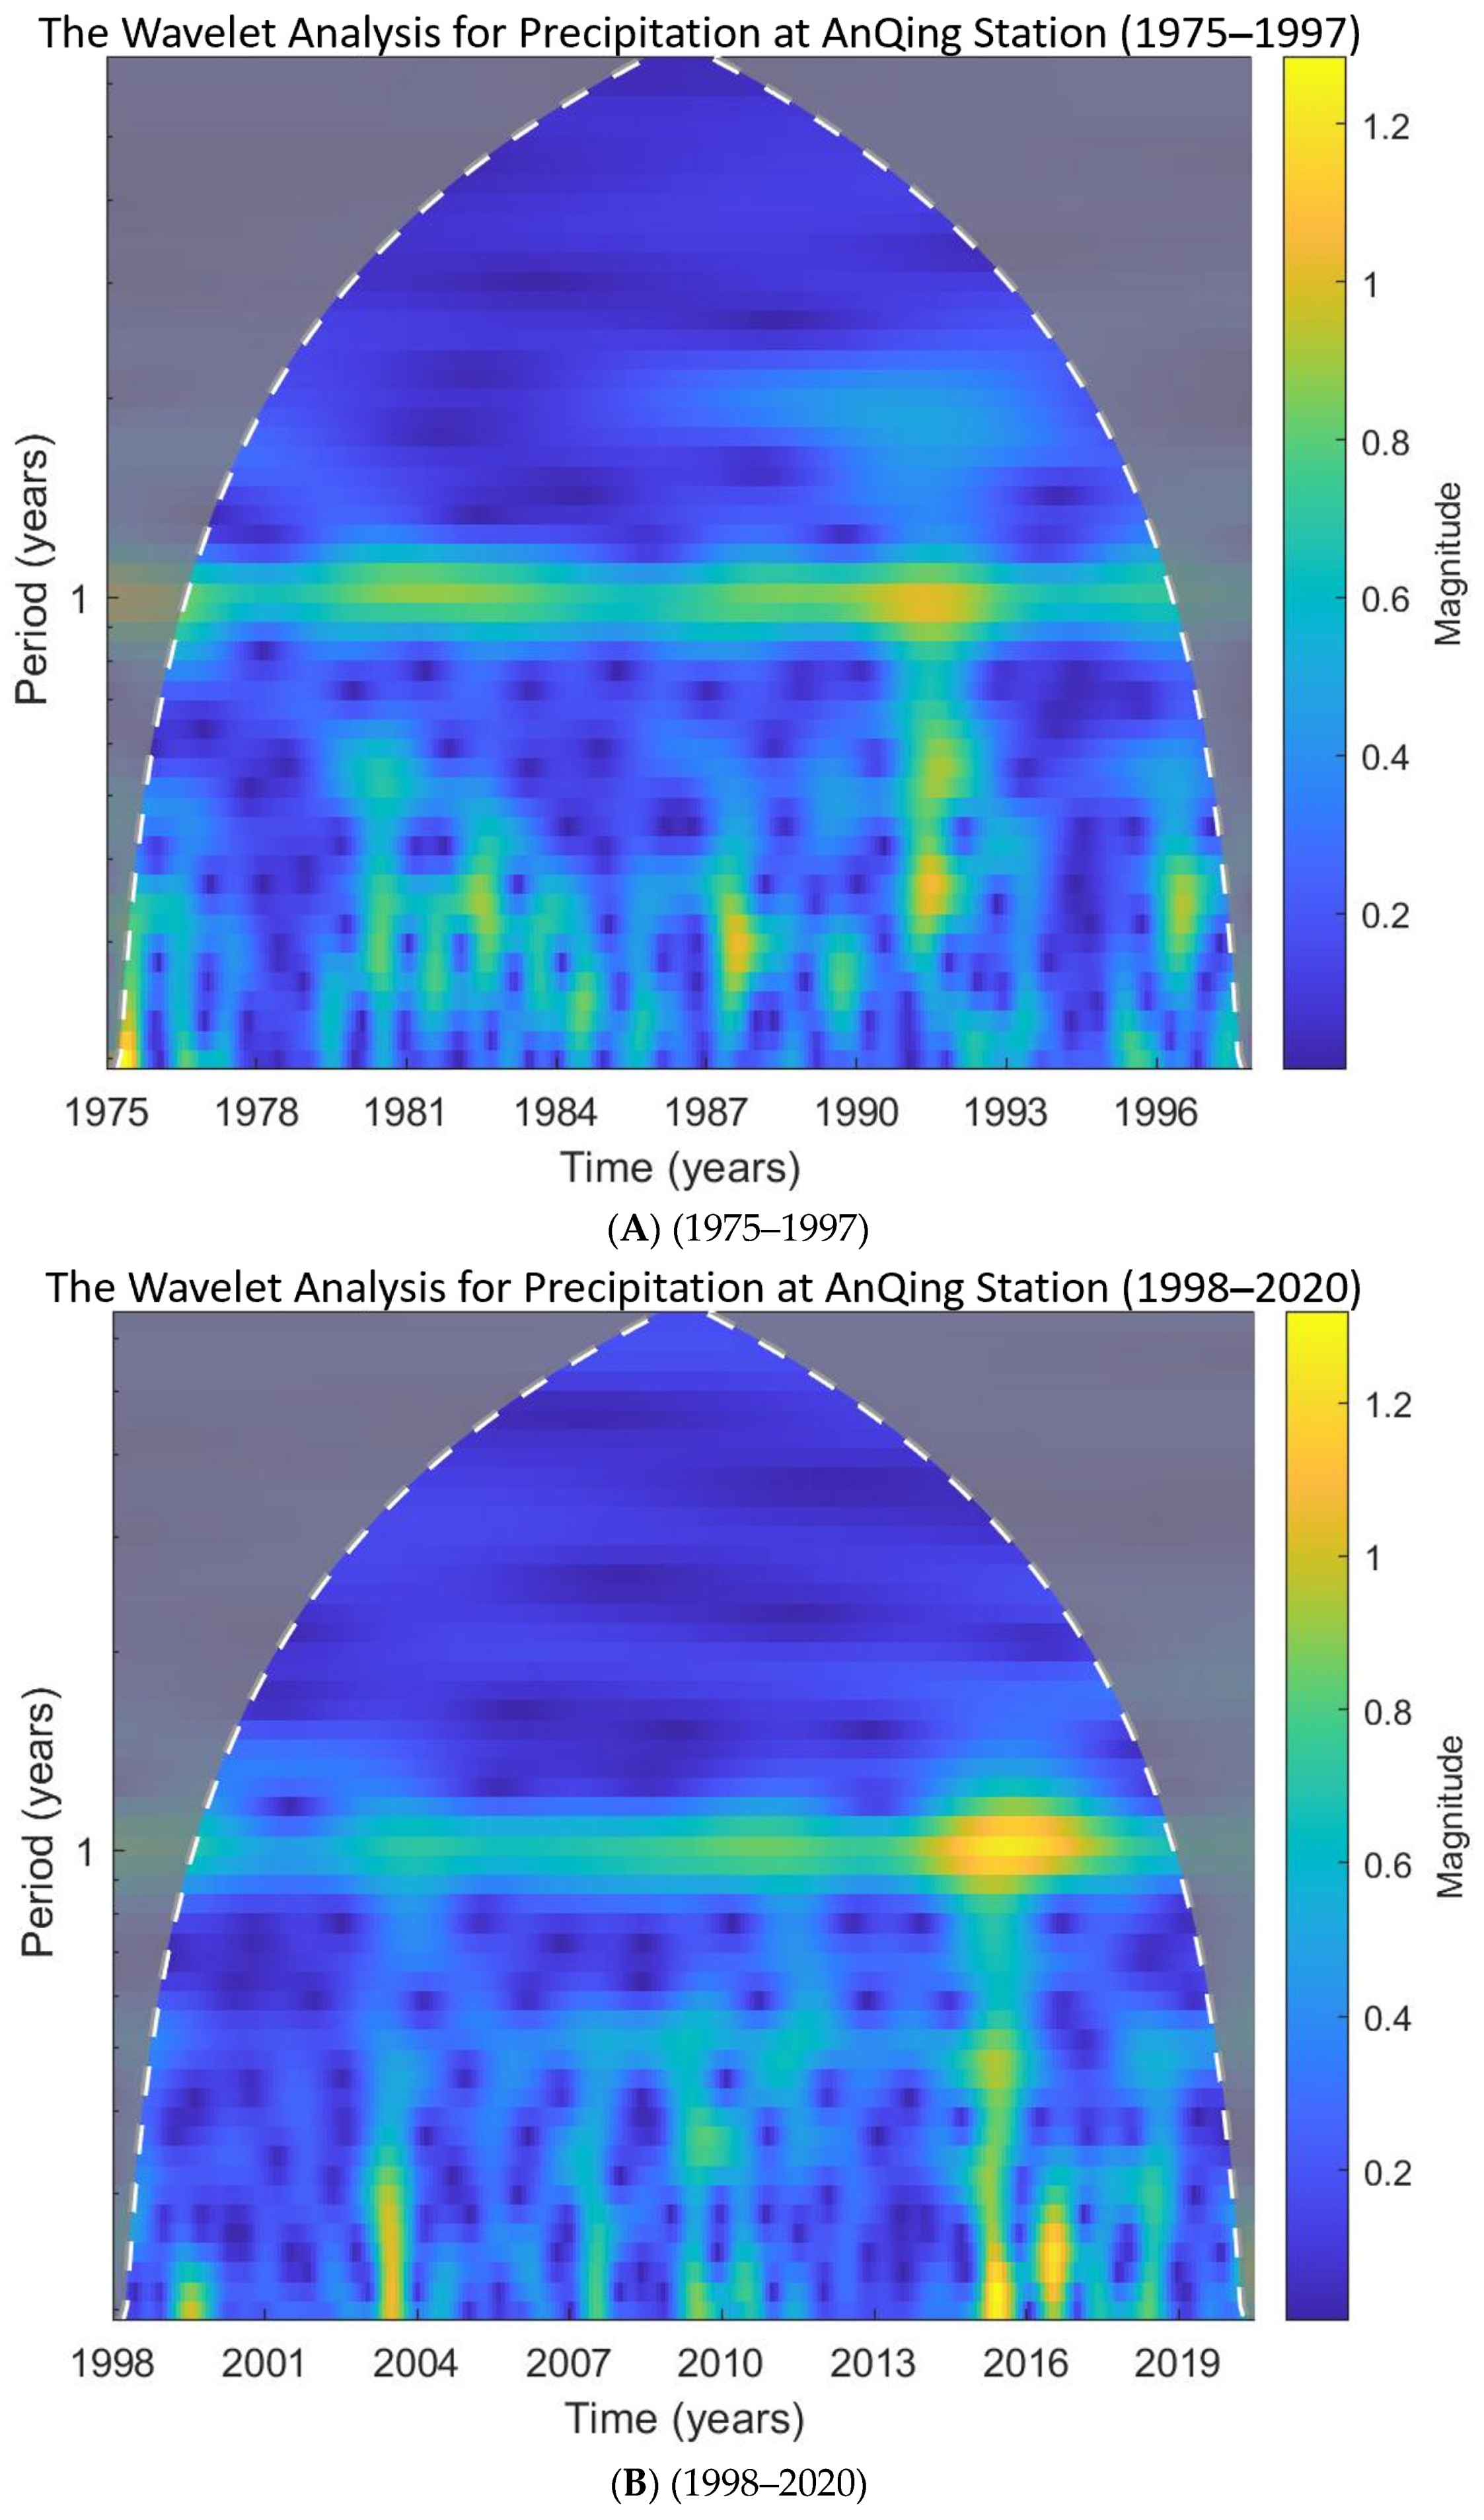
3.1. The Wavelet Analysis Results of the Station Precipitation

Precipitation datasets from all periods show an annual cycle (continuous yellow horizontal line at the half-height of the y-axis) in the wavelet analysis. However, the upstream stations have more noticeable and persistent annual cycles than those downstream stations. Figure 4 and Figure 5 show that the upstream stations, including the ChongQing station and YiBin station, show an outstanding annual cycle. Moreover, both show a more robust cycle in 1975–1997 than in 1998–2020. In the 1975–1997 period, this station shows a decrease in annual periodicity after 1992 (after 15 on the x-axis). In the 1998–2020 period, the station increased annual periodicity after 2014 (after 15 on the x-axis). The ChongQing station has the most constant annual cycle in the 1975–1997 period, while the 1998–2020 period also has the least robust annual cycle.
The YiChang Station, located near the reservoir, shows the most robust annual cycle in the monthly precipitation (Figure 6). In addition, the number of bright spots decreases in the 1998–2020 period on the lower half of the graphs. For the first period (1975–1997), the wavelet analysis figures have a clear annual cycle with a bright yellow color, representing a robust wavelet magnitude over 1. This robust annual magnitude represents the constant seasonal change every year, and the change will be gradual and be a bell shape. These two figures also have several bright spots in the area with a cycle smaller than annual. These bright yellow lines on the annual cycle and the bright spots below the annual line are not shown in the last period. This changing color from yellow to green shows that the seasonal change amplitude becomes smaller and more sudden and angular in the last period.
The downstream stations are more complicated compared with the upstream stations. The WuHan station shows a decrease in periodicity on the annual scale and cycles with a period smaller than one year from the first to the last period (Figure 7). The WuHan station had a bright spot in 1998 at the beginning of the 1998–2016 period with a small seasonal (1/4 of a year) period. It also has a relatively bright spot in 2016 at the end of the 1998–2016 period.
Overall, this station has the least wavelet magnitude in the second period. In the wavelet analysis graph of 1998–2016, the annual cycle appears as a green line, which indicates a weak annual cycle. In the bottom half of this figure, where the period is smaller than one year, The wavelet magnitude is relatively small, shown as bright blue and dark blue, but these stripes with bright blue and dark blue color form a scattered pattern seasonal level (1/4 year).
The AnQing station (Figure 8) also shows decreased wavelet magnitude for the annual cycle. This station has several bright spots on the seasonal and half-year cycles besides the annual cycle. The brightest spot is in 1999, with a seasonal cycle (0.25 years). There is a bright vertical line around the 13 on the x-axis, with three bright spots with the seasonal cycle in 2014, 2016, and 2017. There are also two bright spots with a half-year cycle in 2015 and 2017. The NanJing station shows a different trend compared to the other five stations. The NanJing station (Figure 9) shows an increase of wavelet magnitude at the annual level from 1975–1997 till 1998–2020.
The brightness and the amount of the bright spot with a period smaller than annual also increase. This increase has been further developed from 1975–1997 to 1998–2020. The 1998–2020 period analysis has three very bright spots around 2016. There is a bright spot from 2015 to 2017 on the annual level. There are two bright spots on the seasonal level in 2015 and 2016. The bright spot in 2016 may correlate with the same year’s bright spot at the WuHan station and AnQing station.

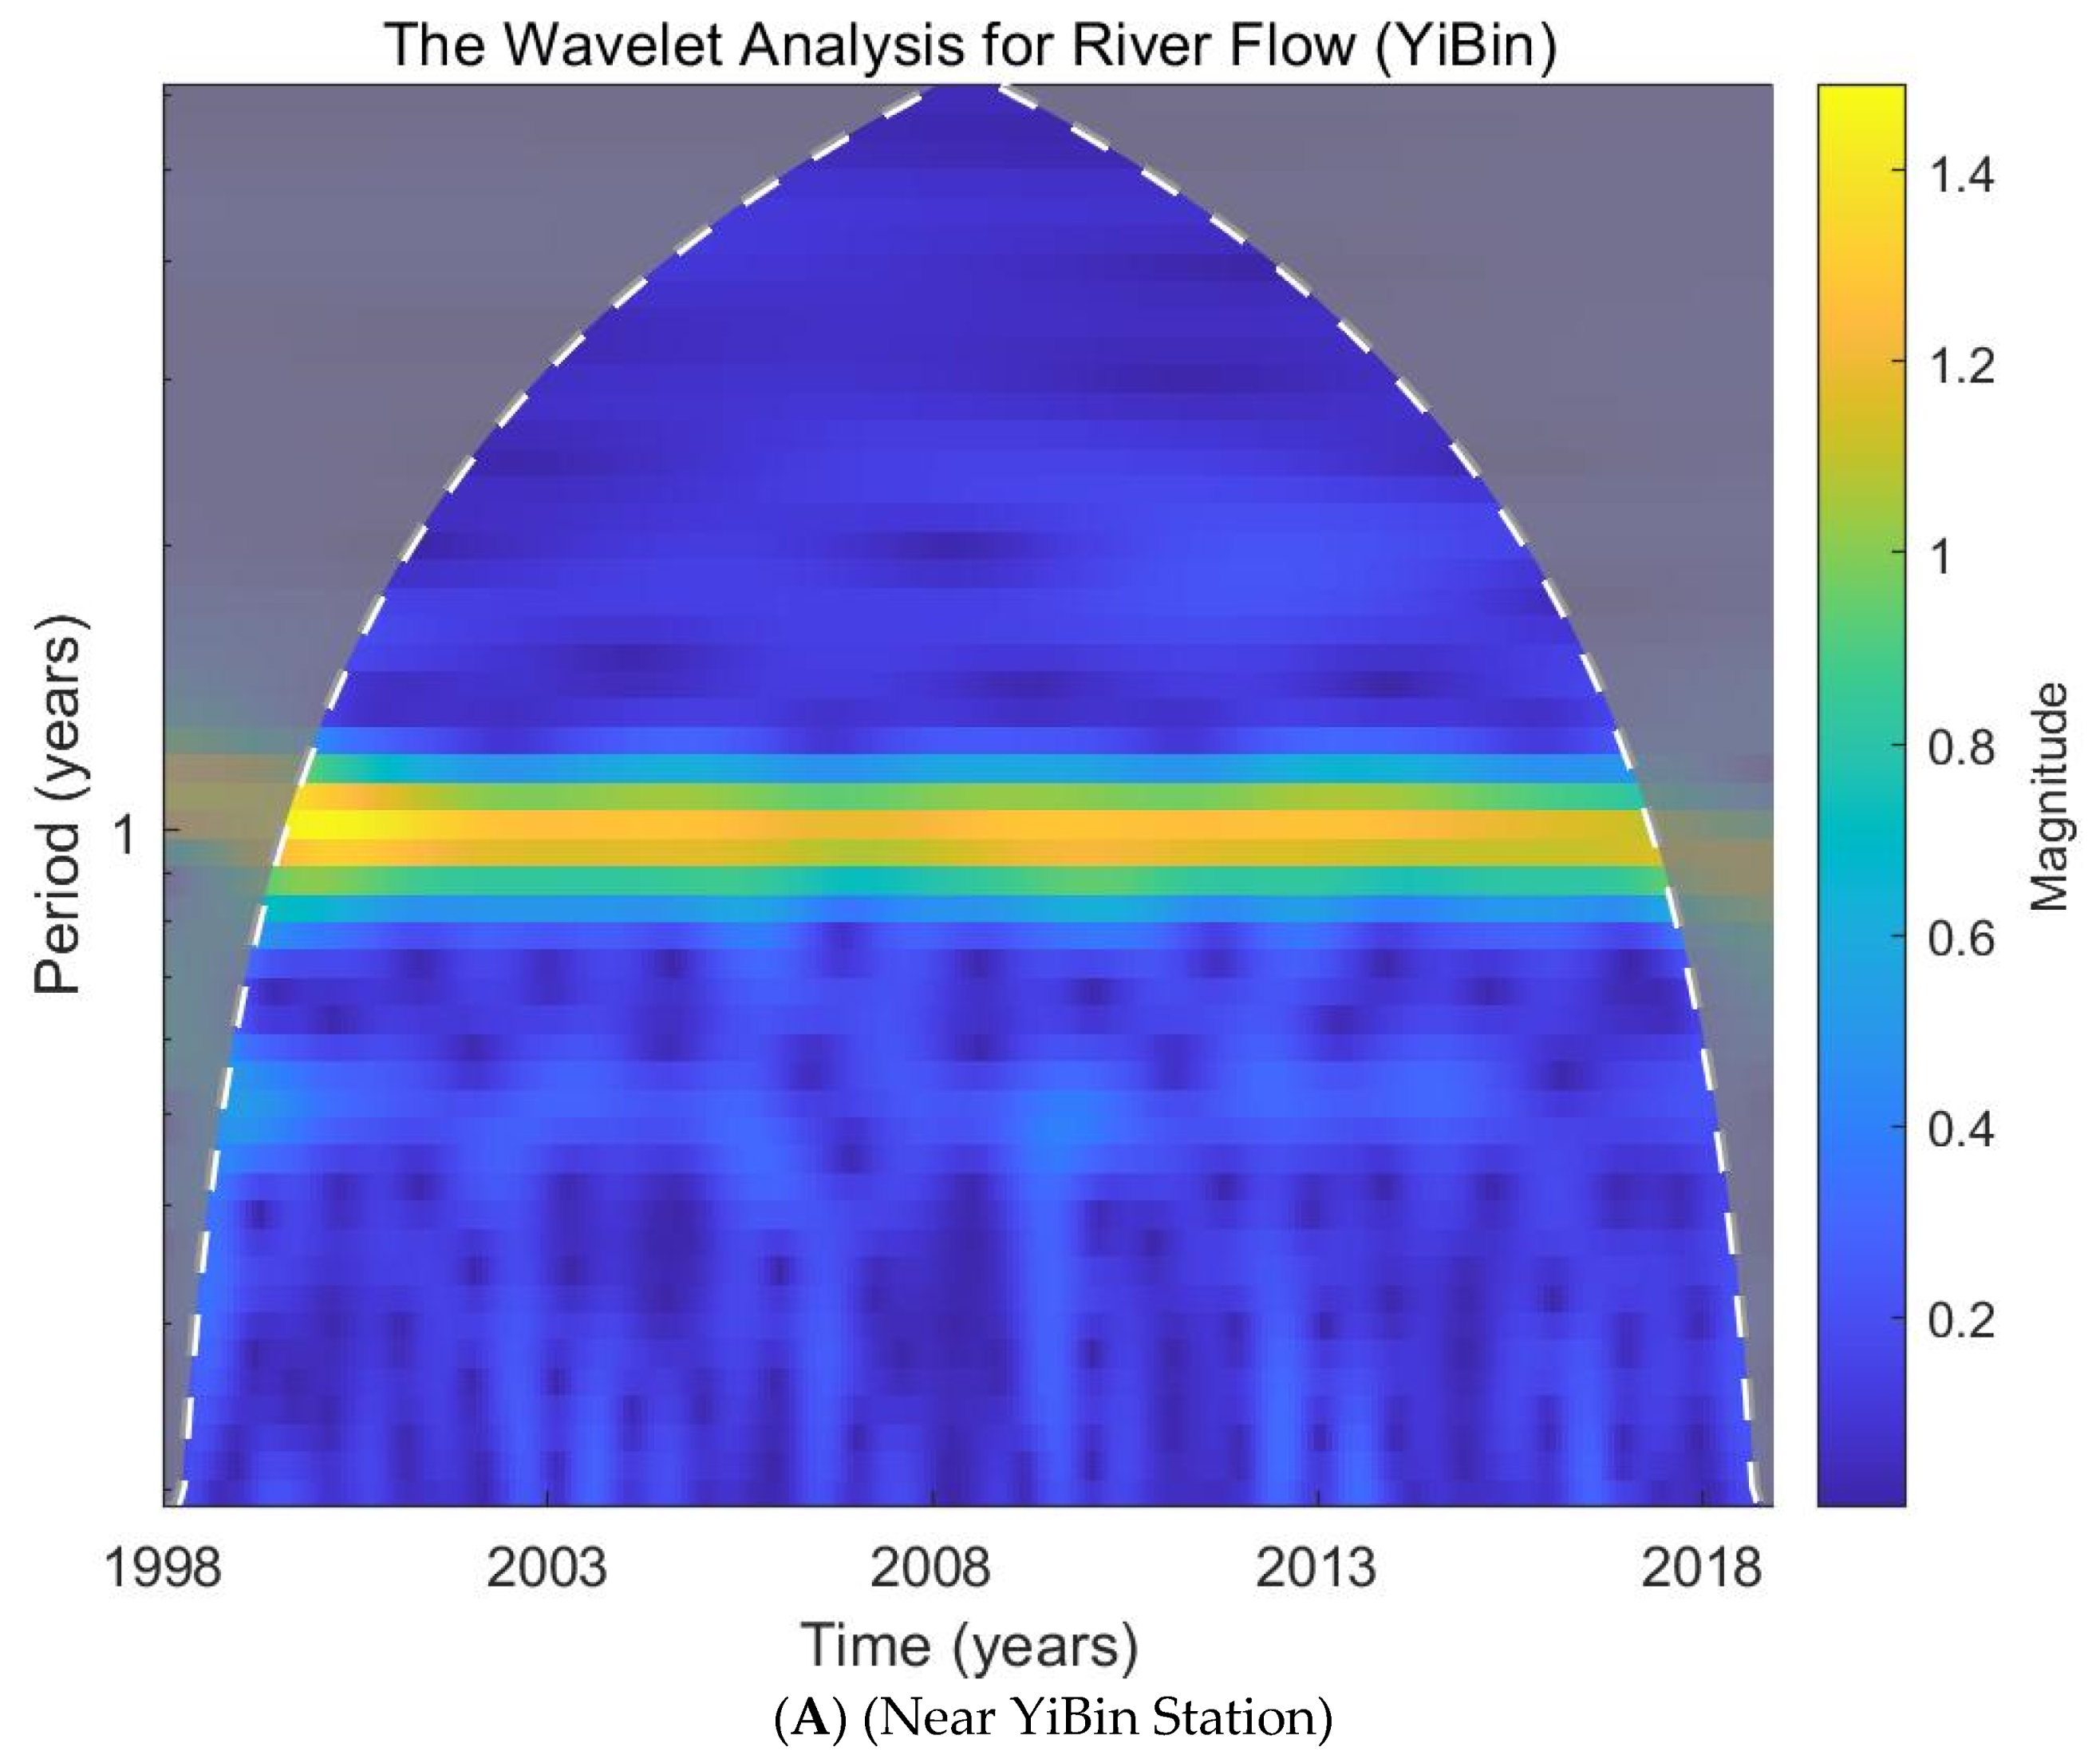
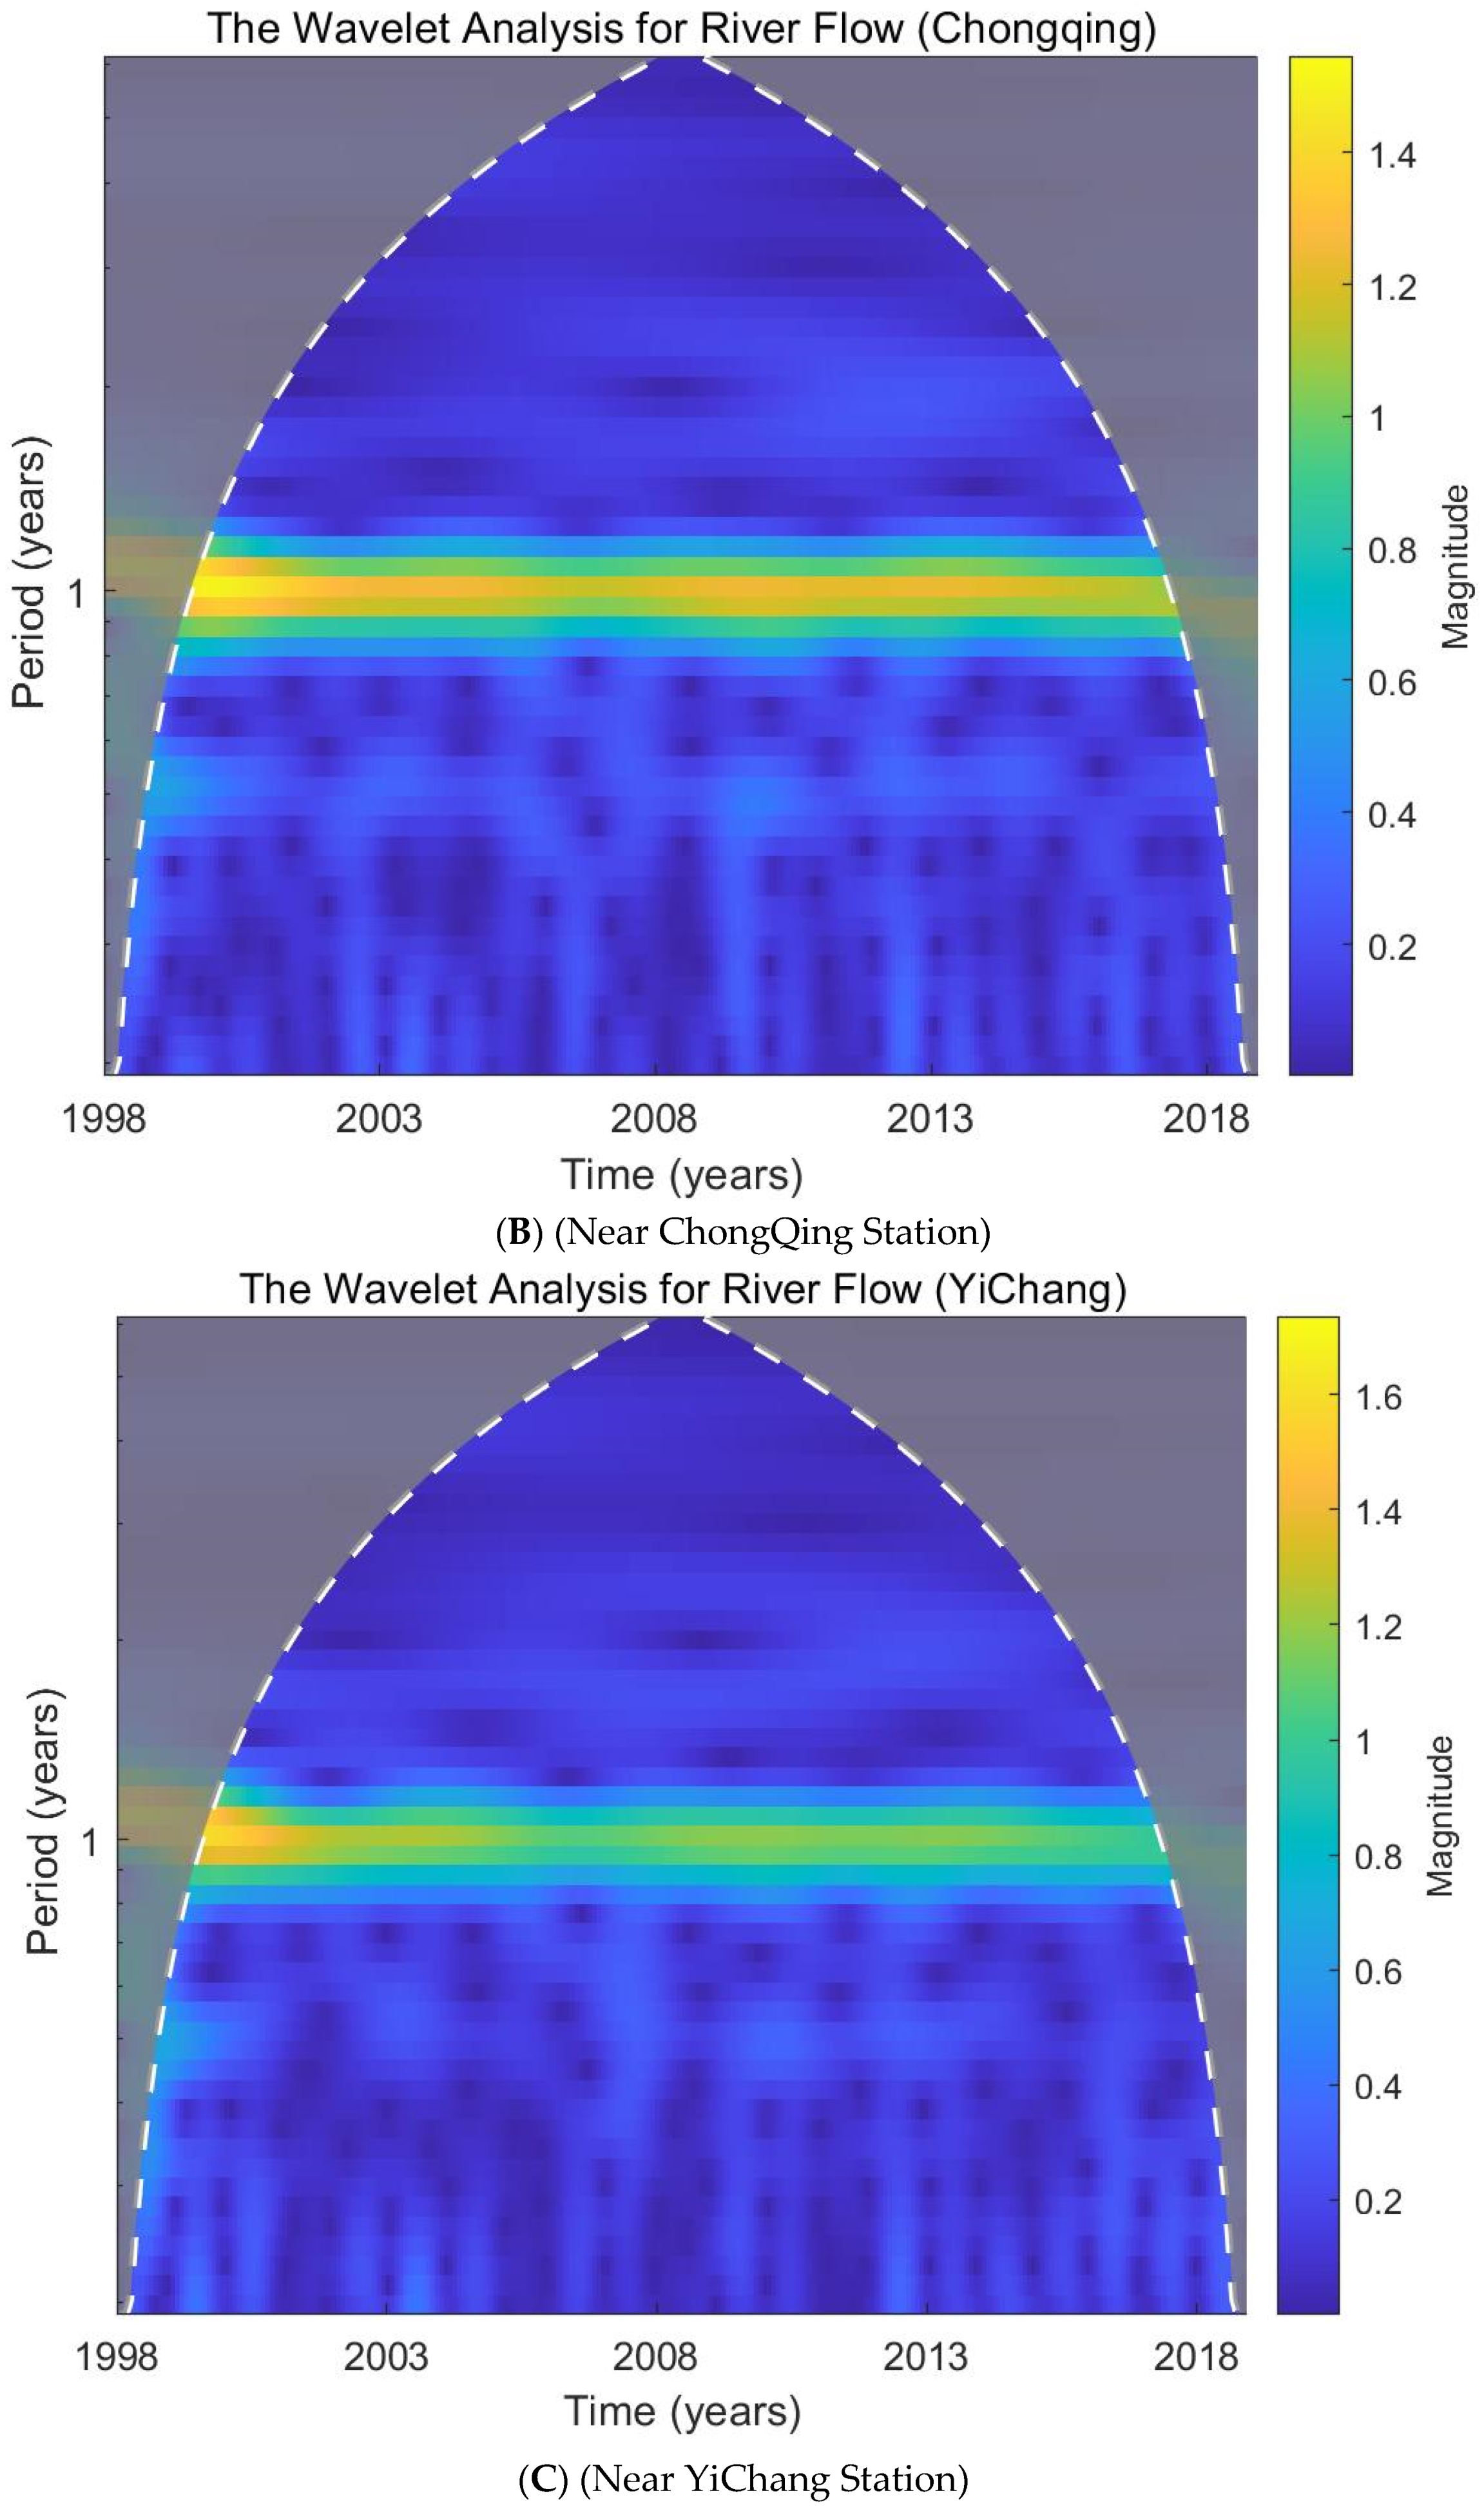
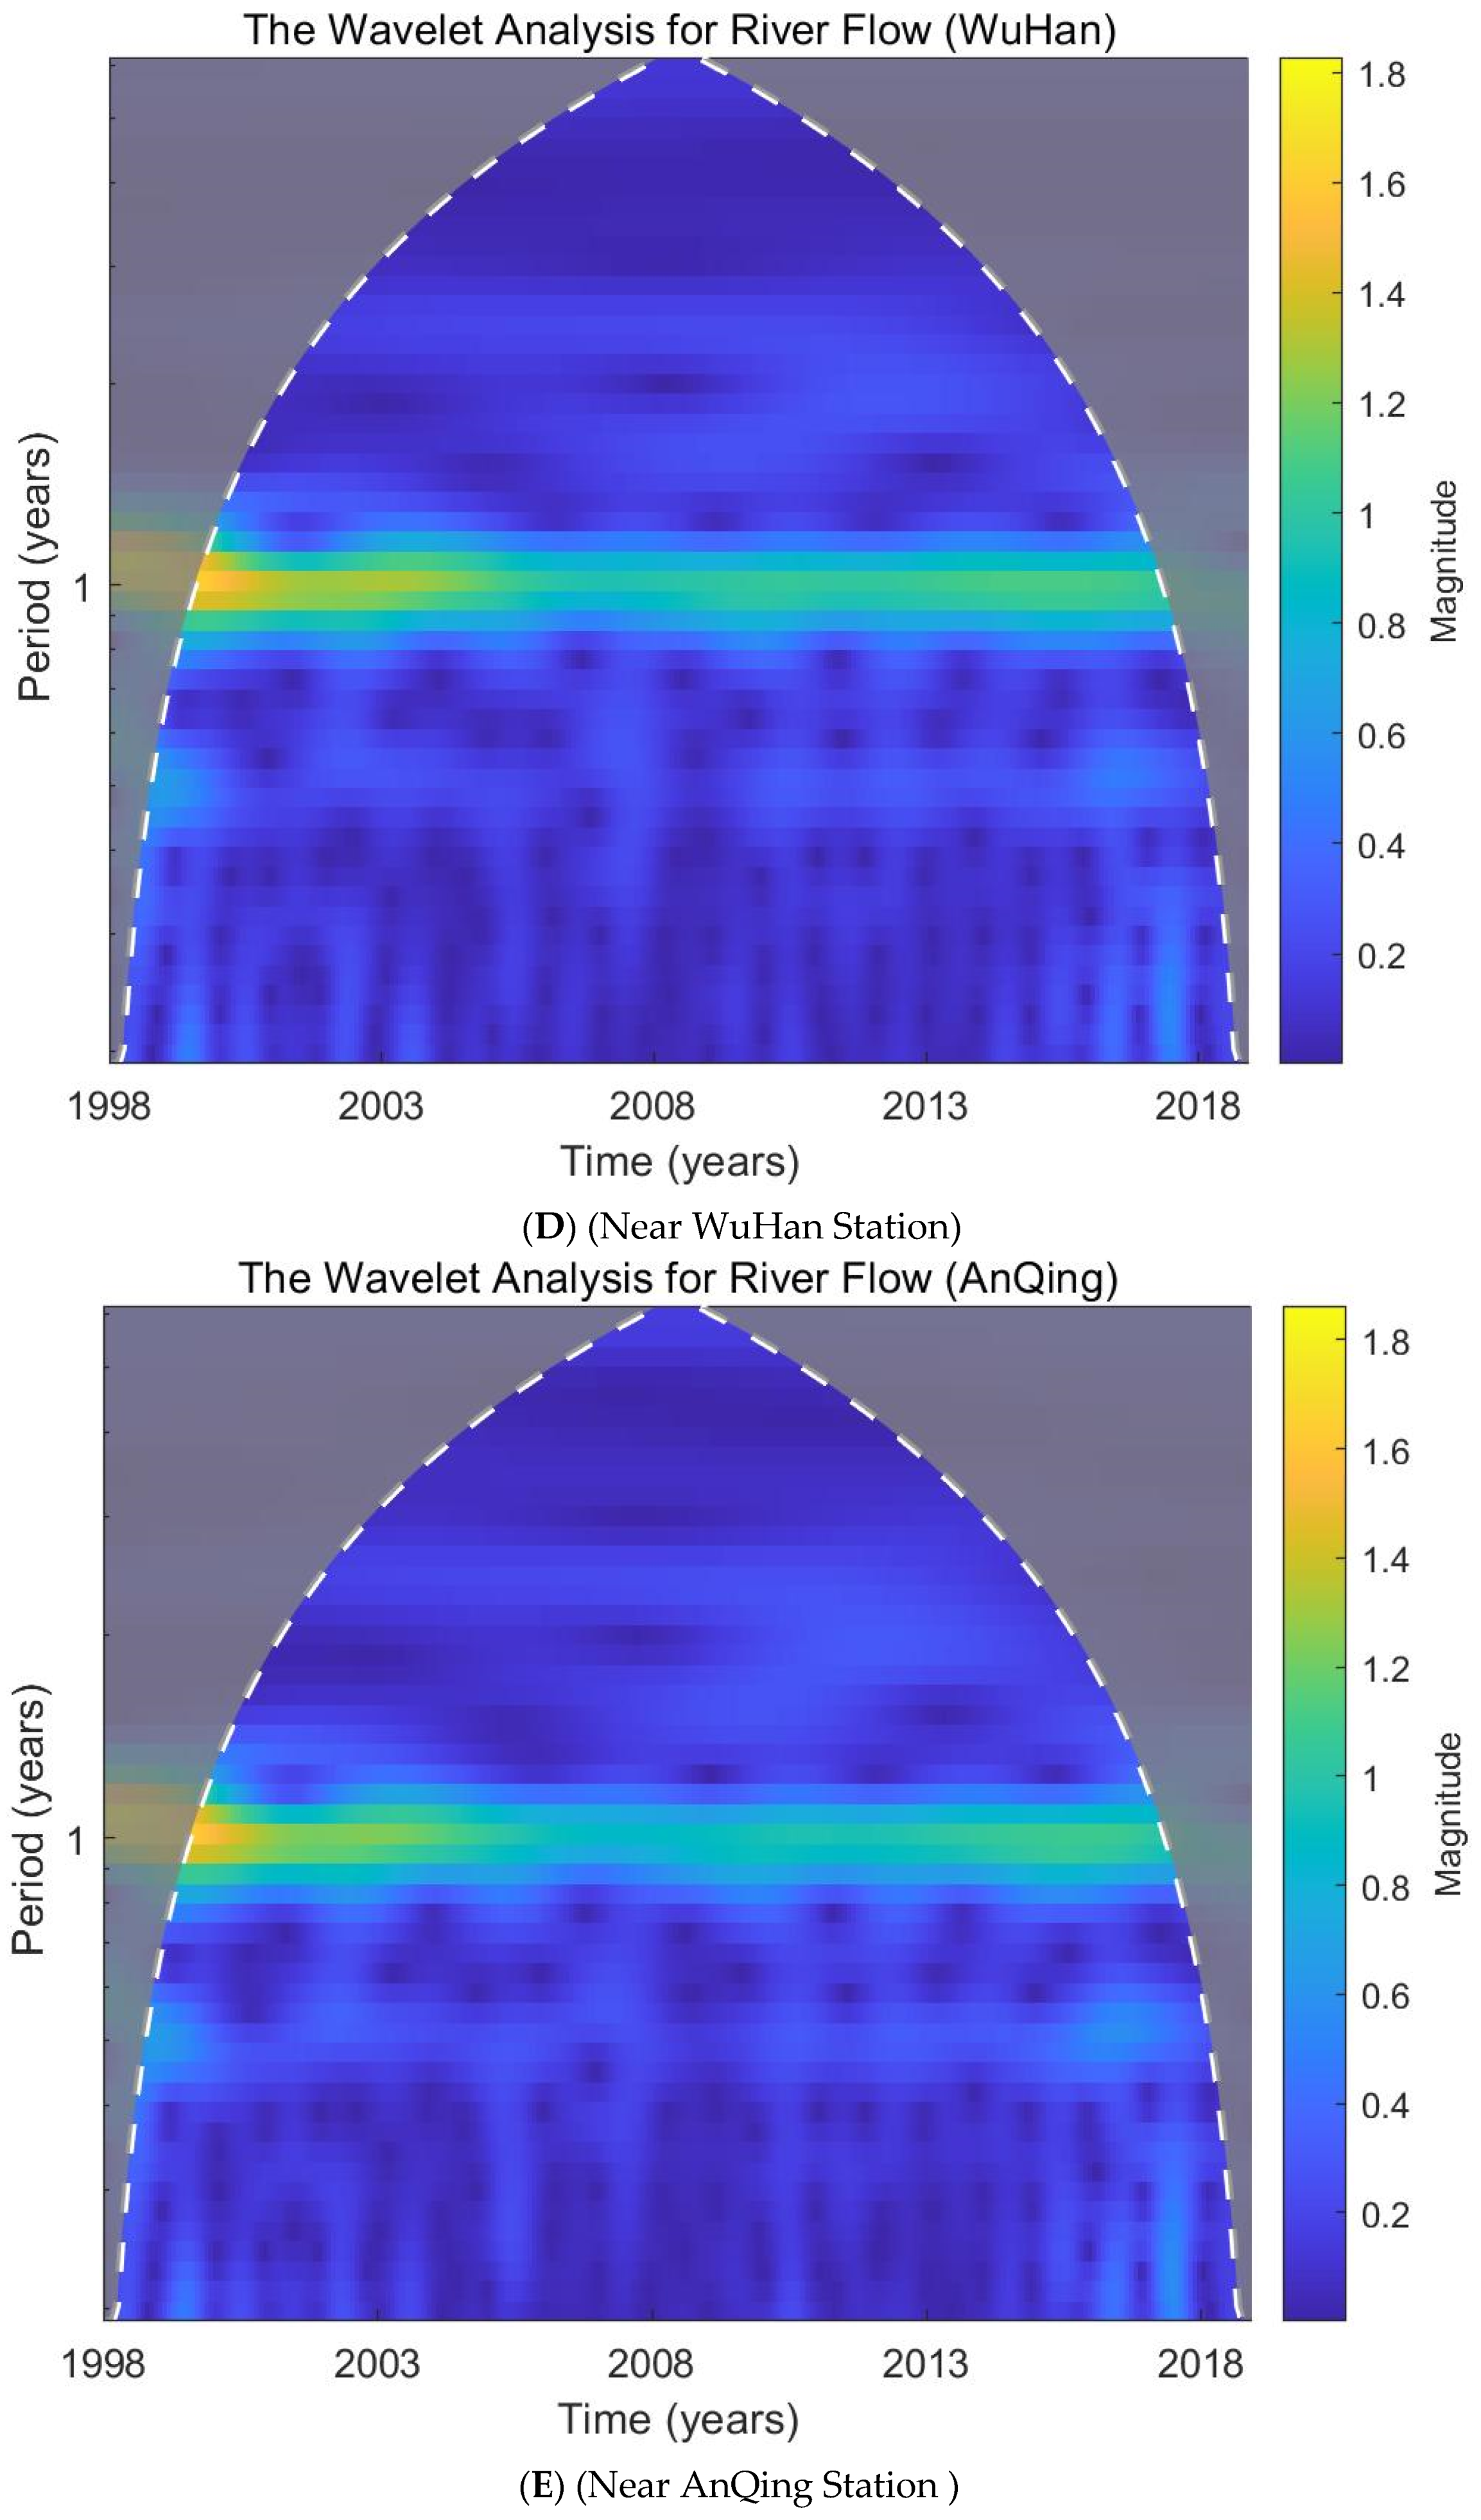
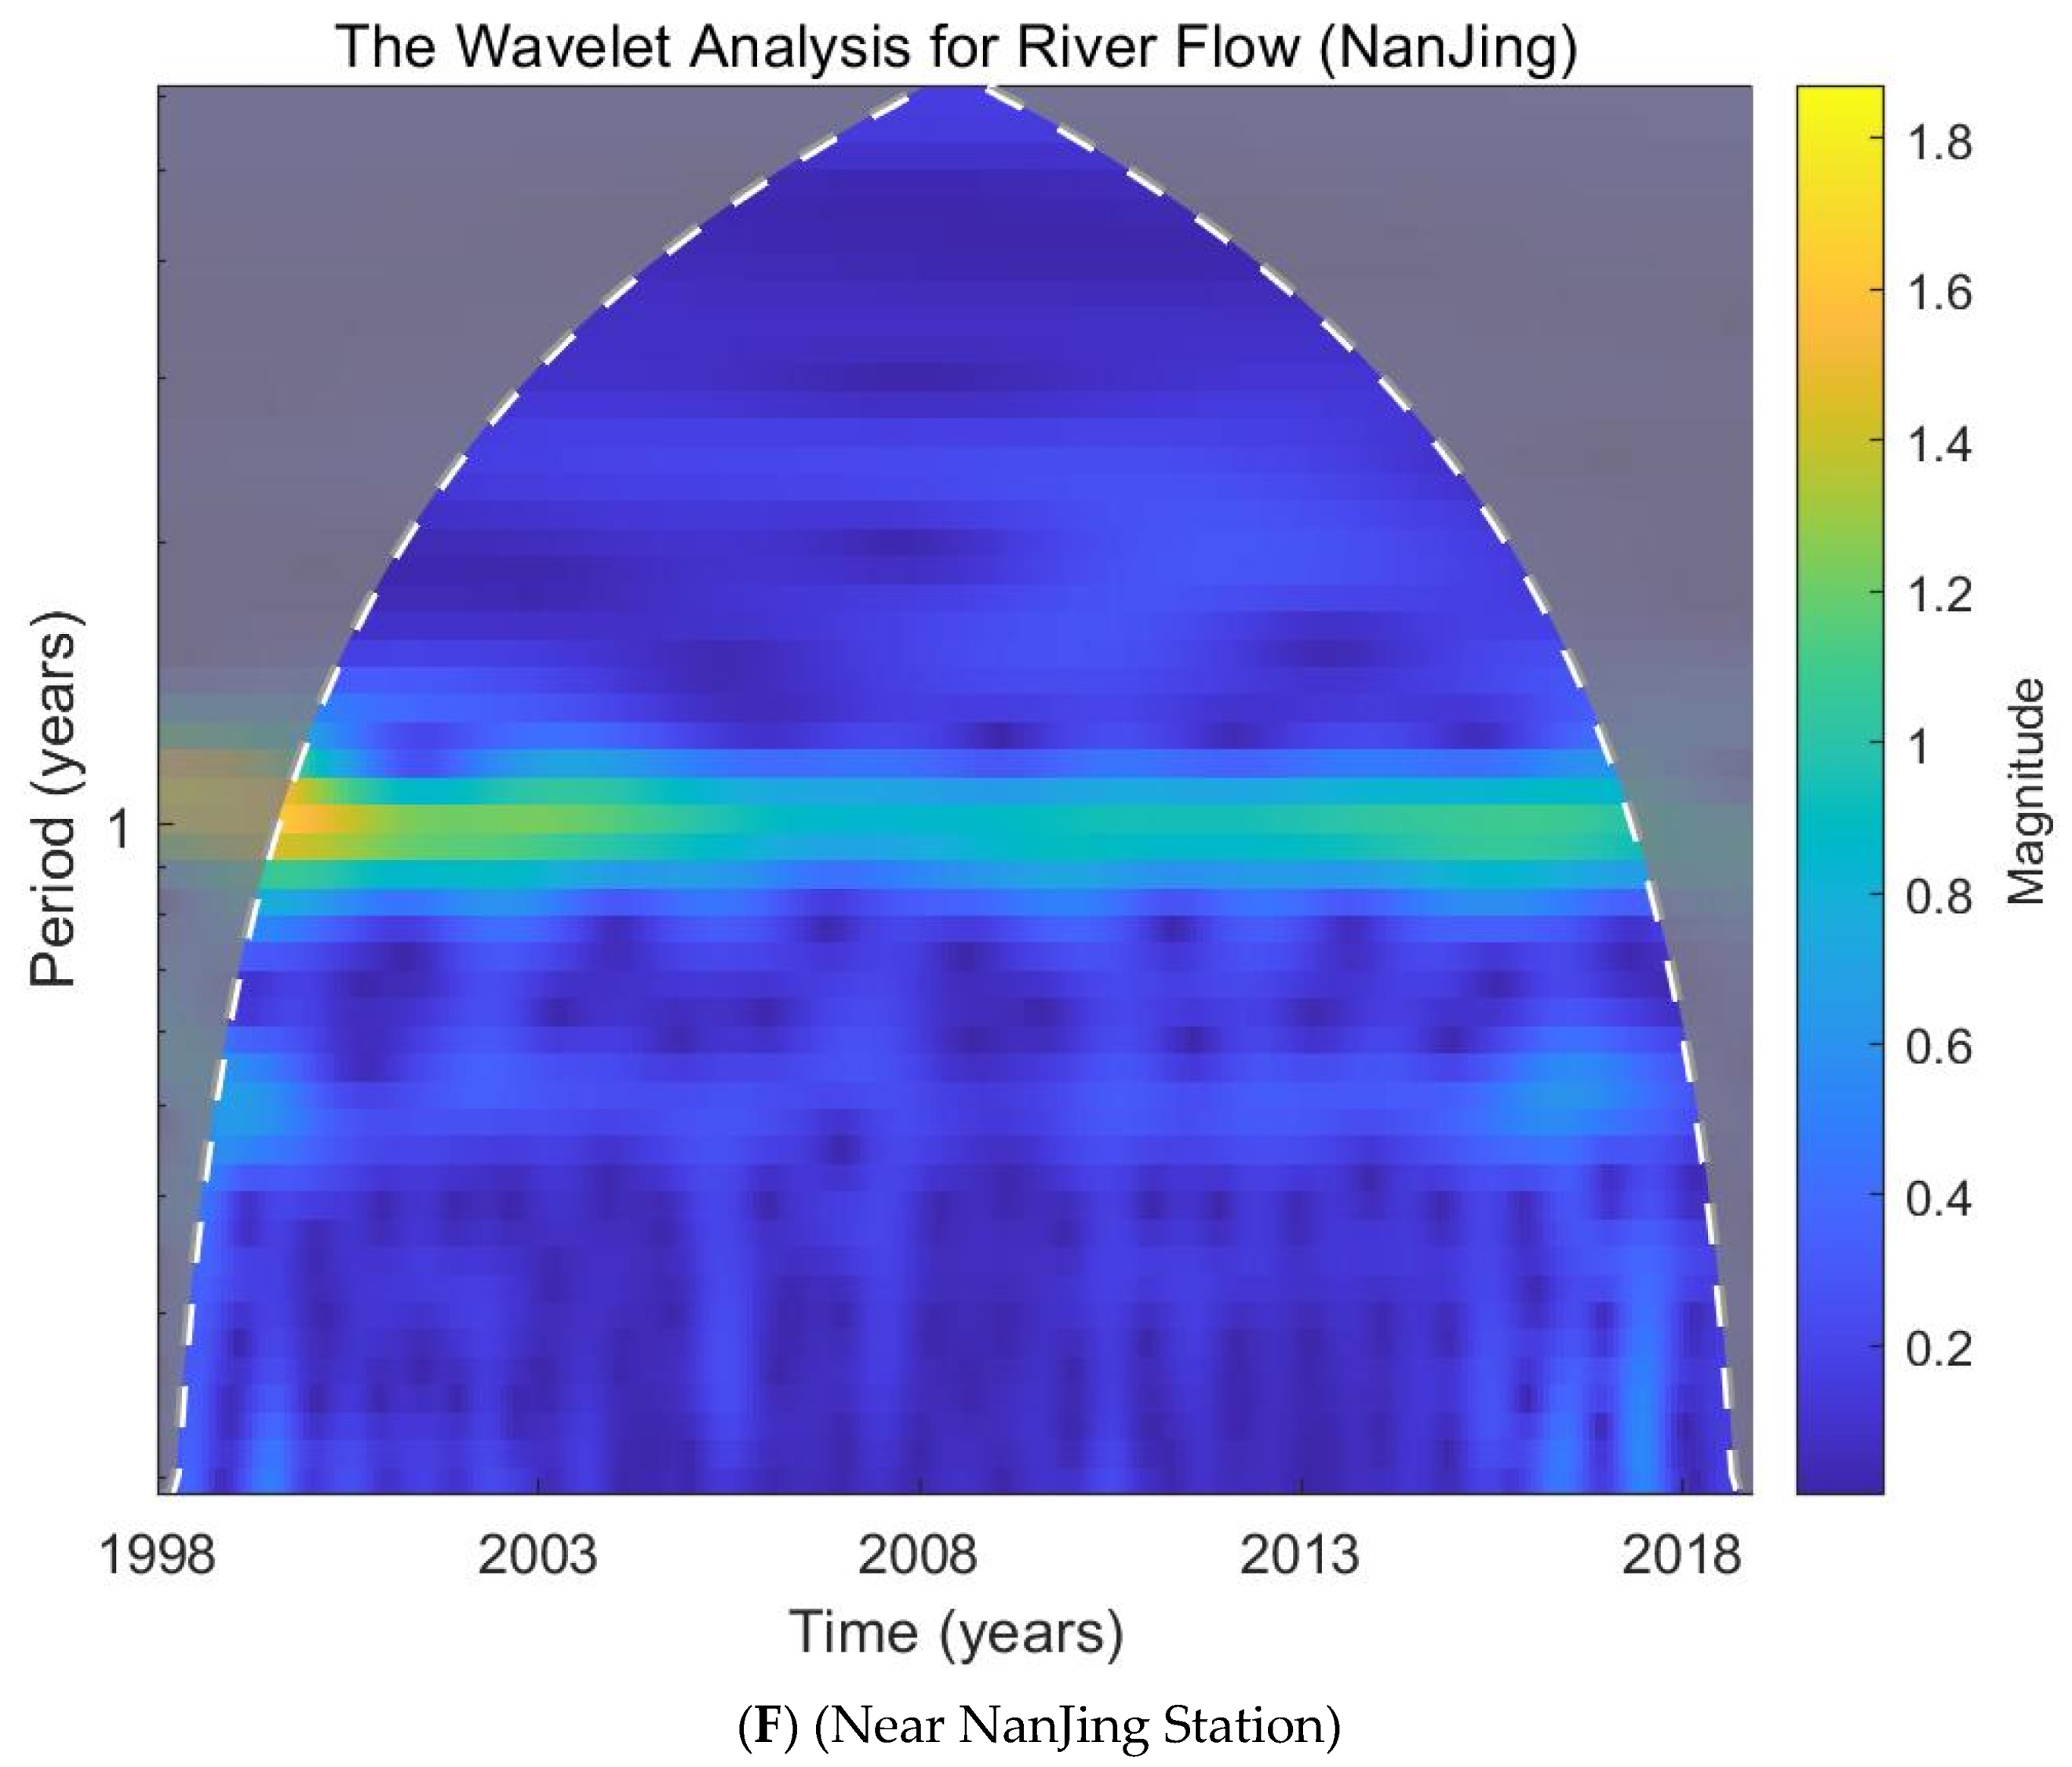
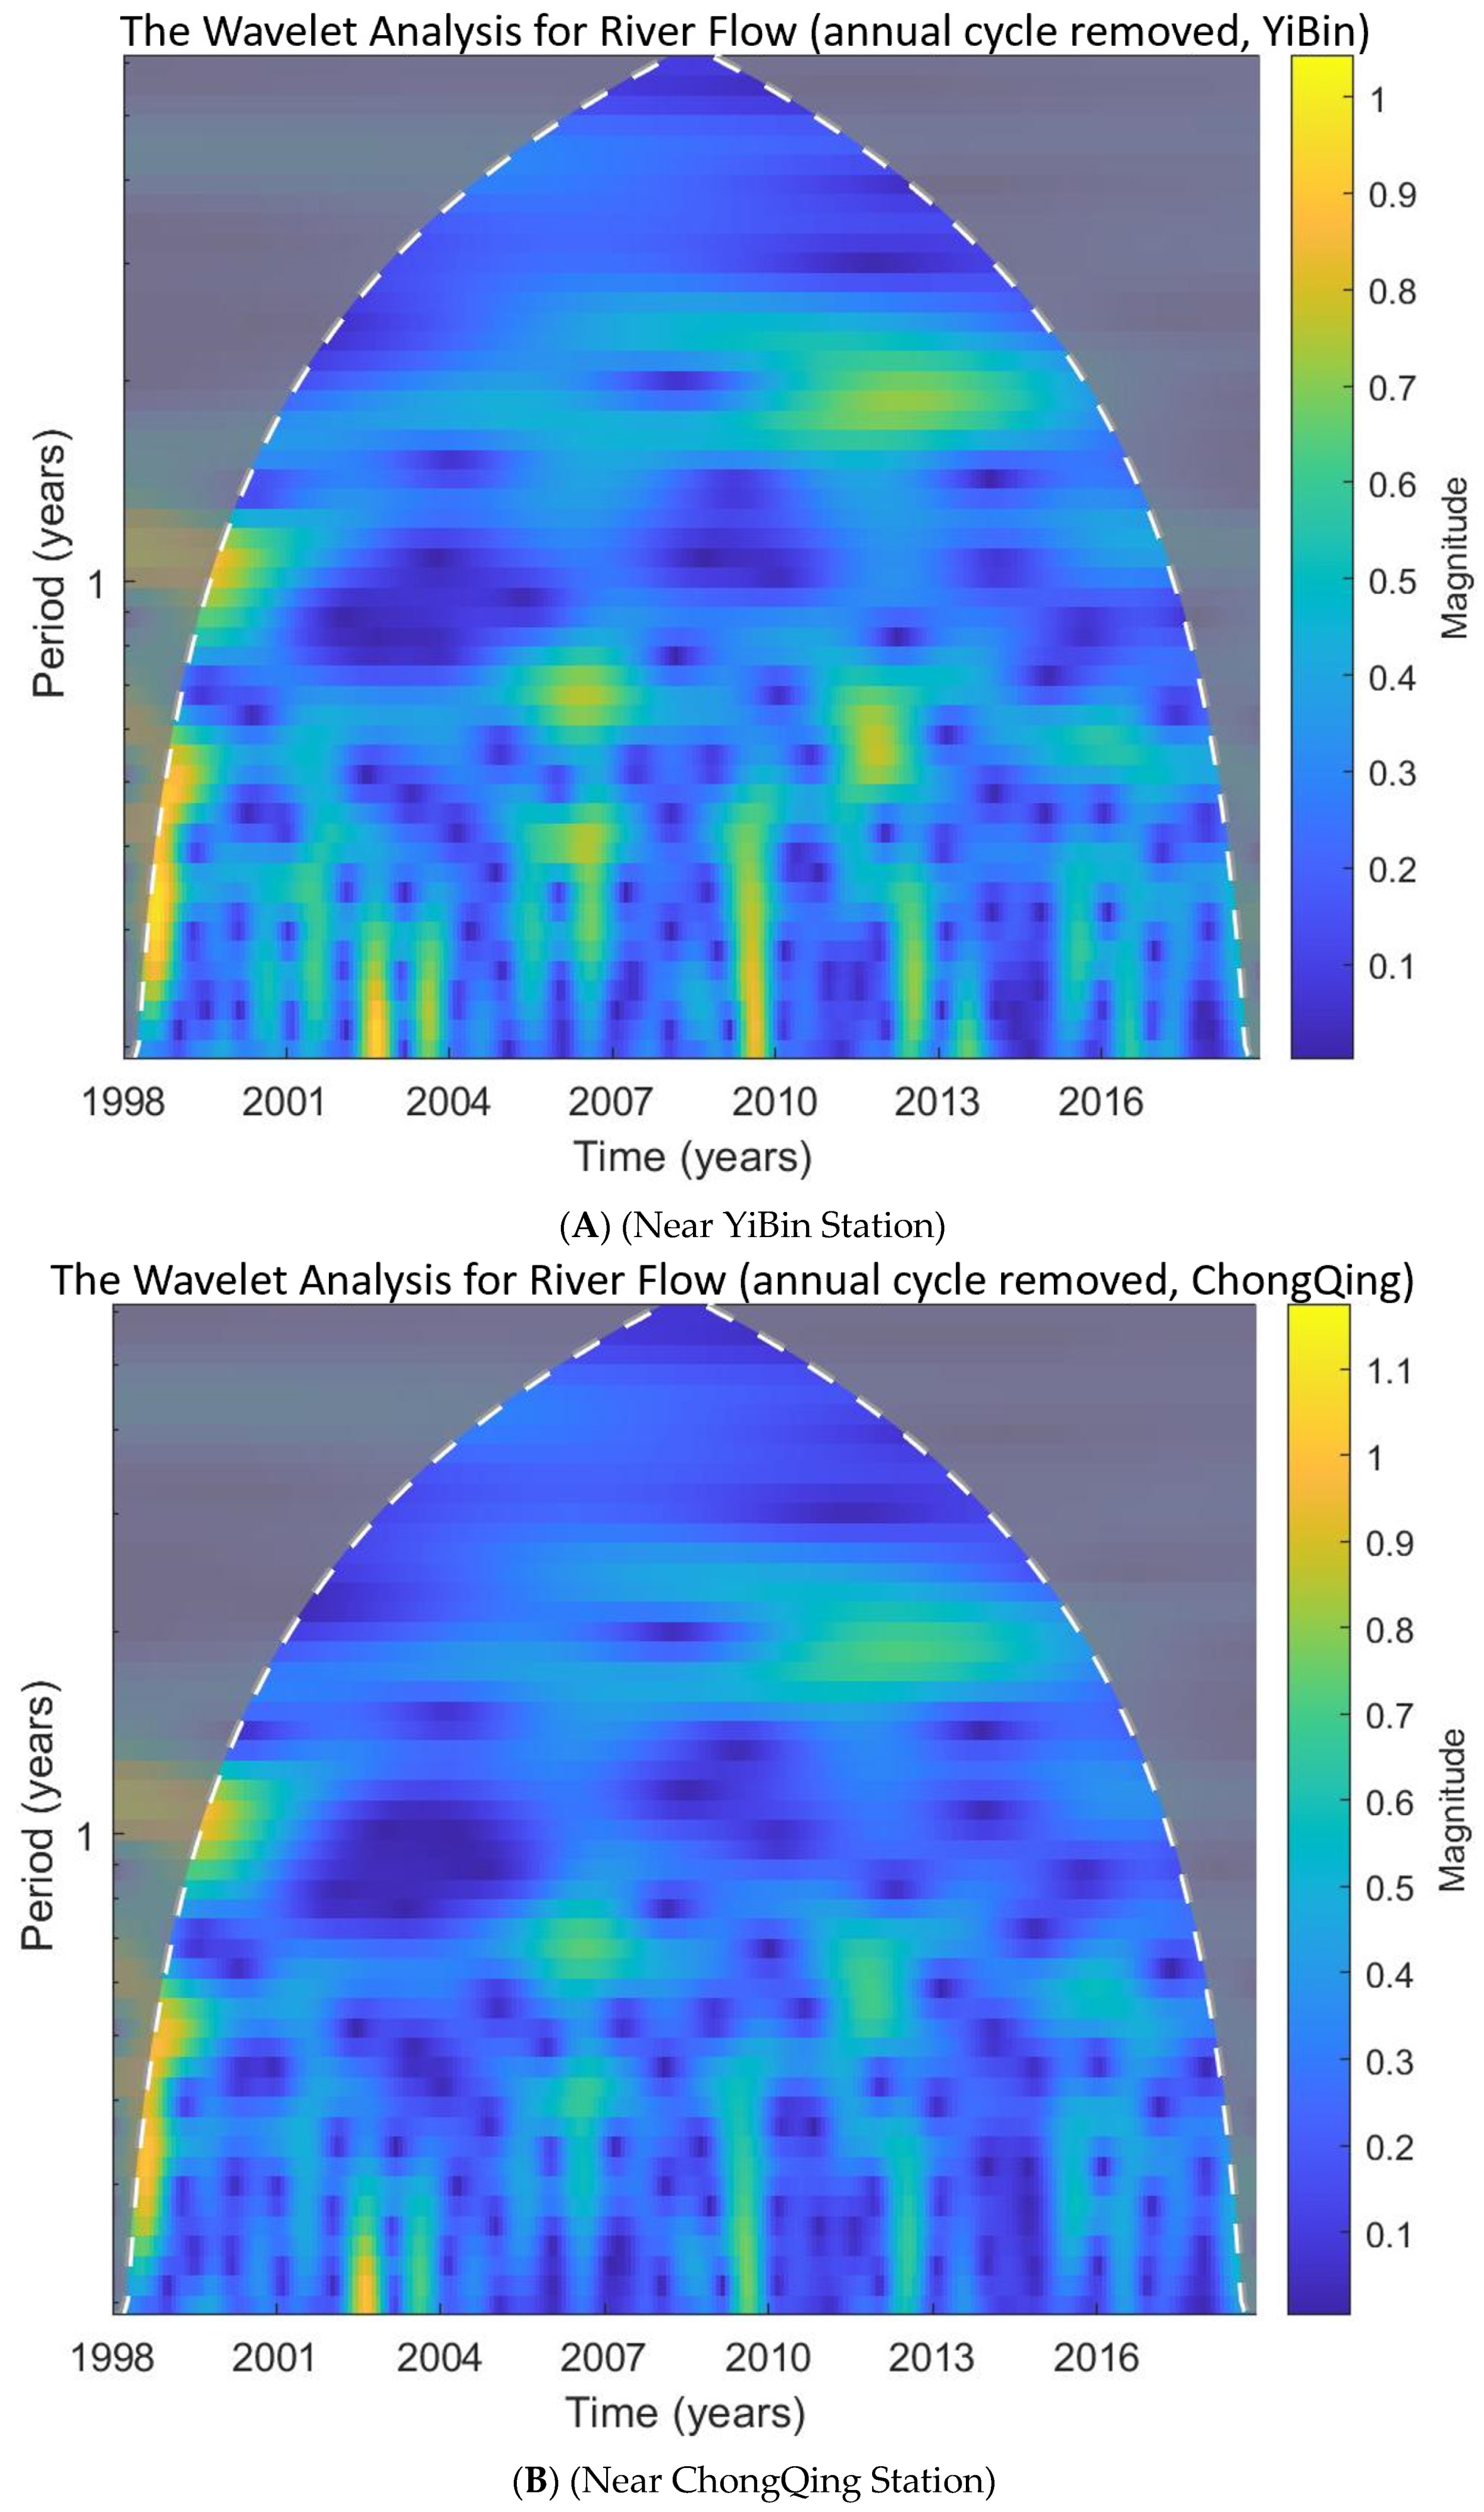
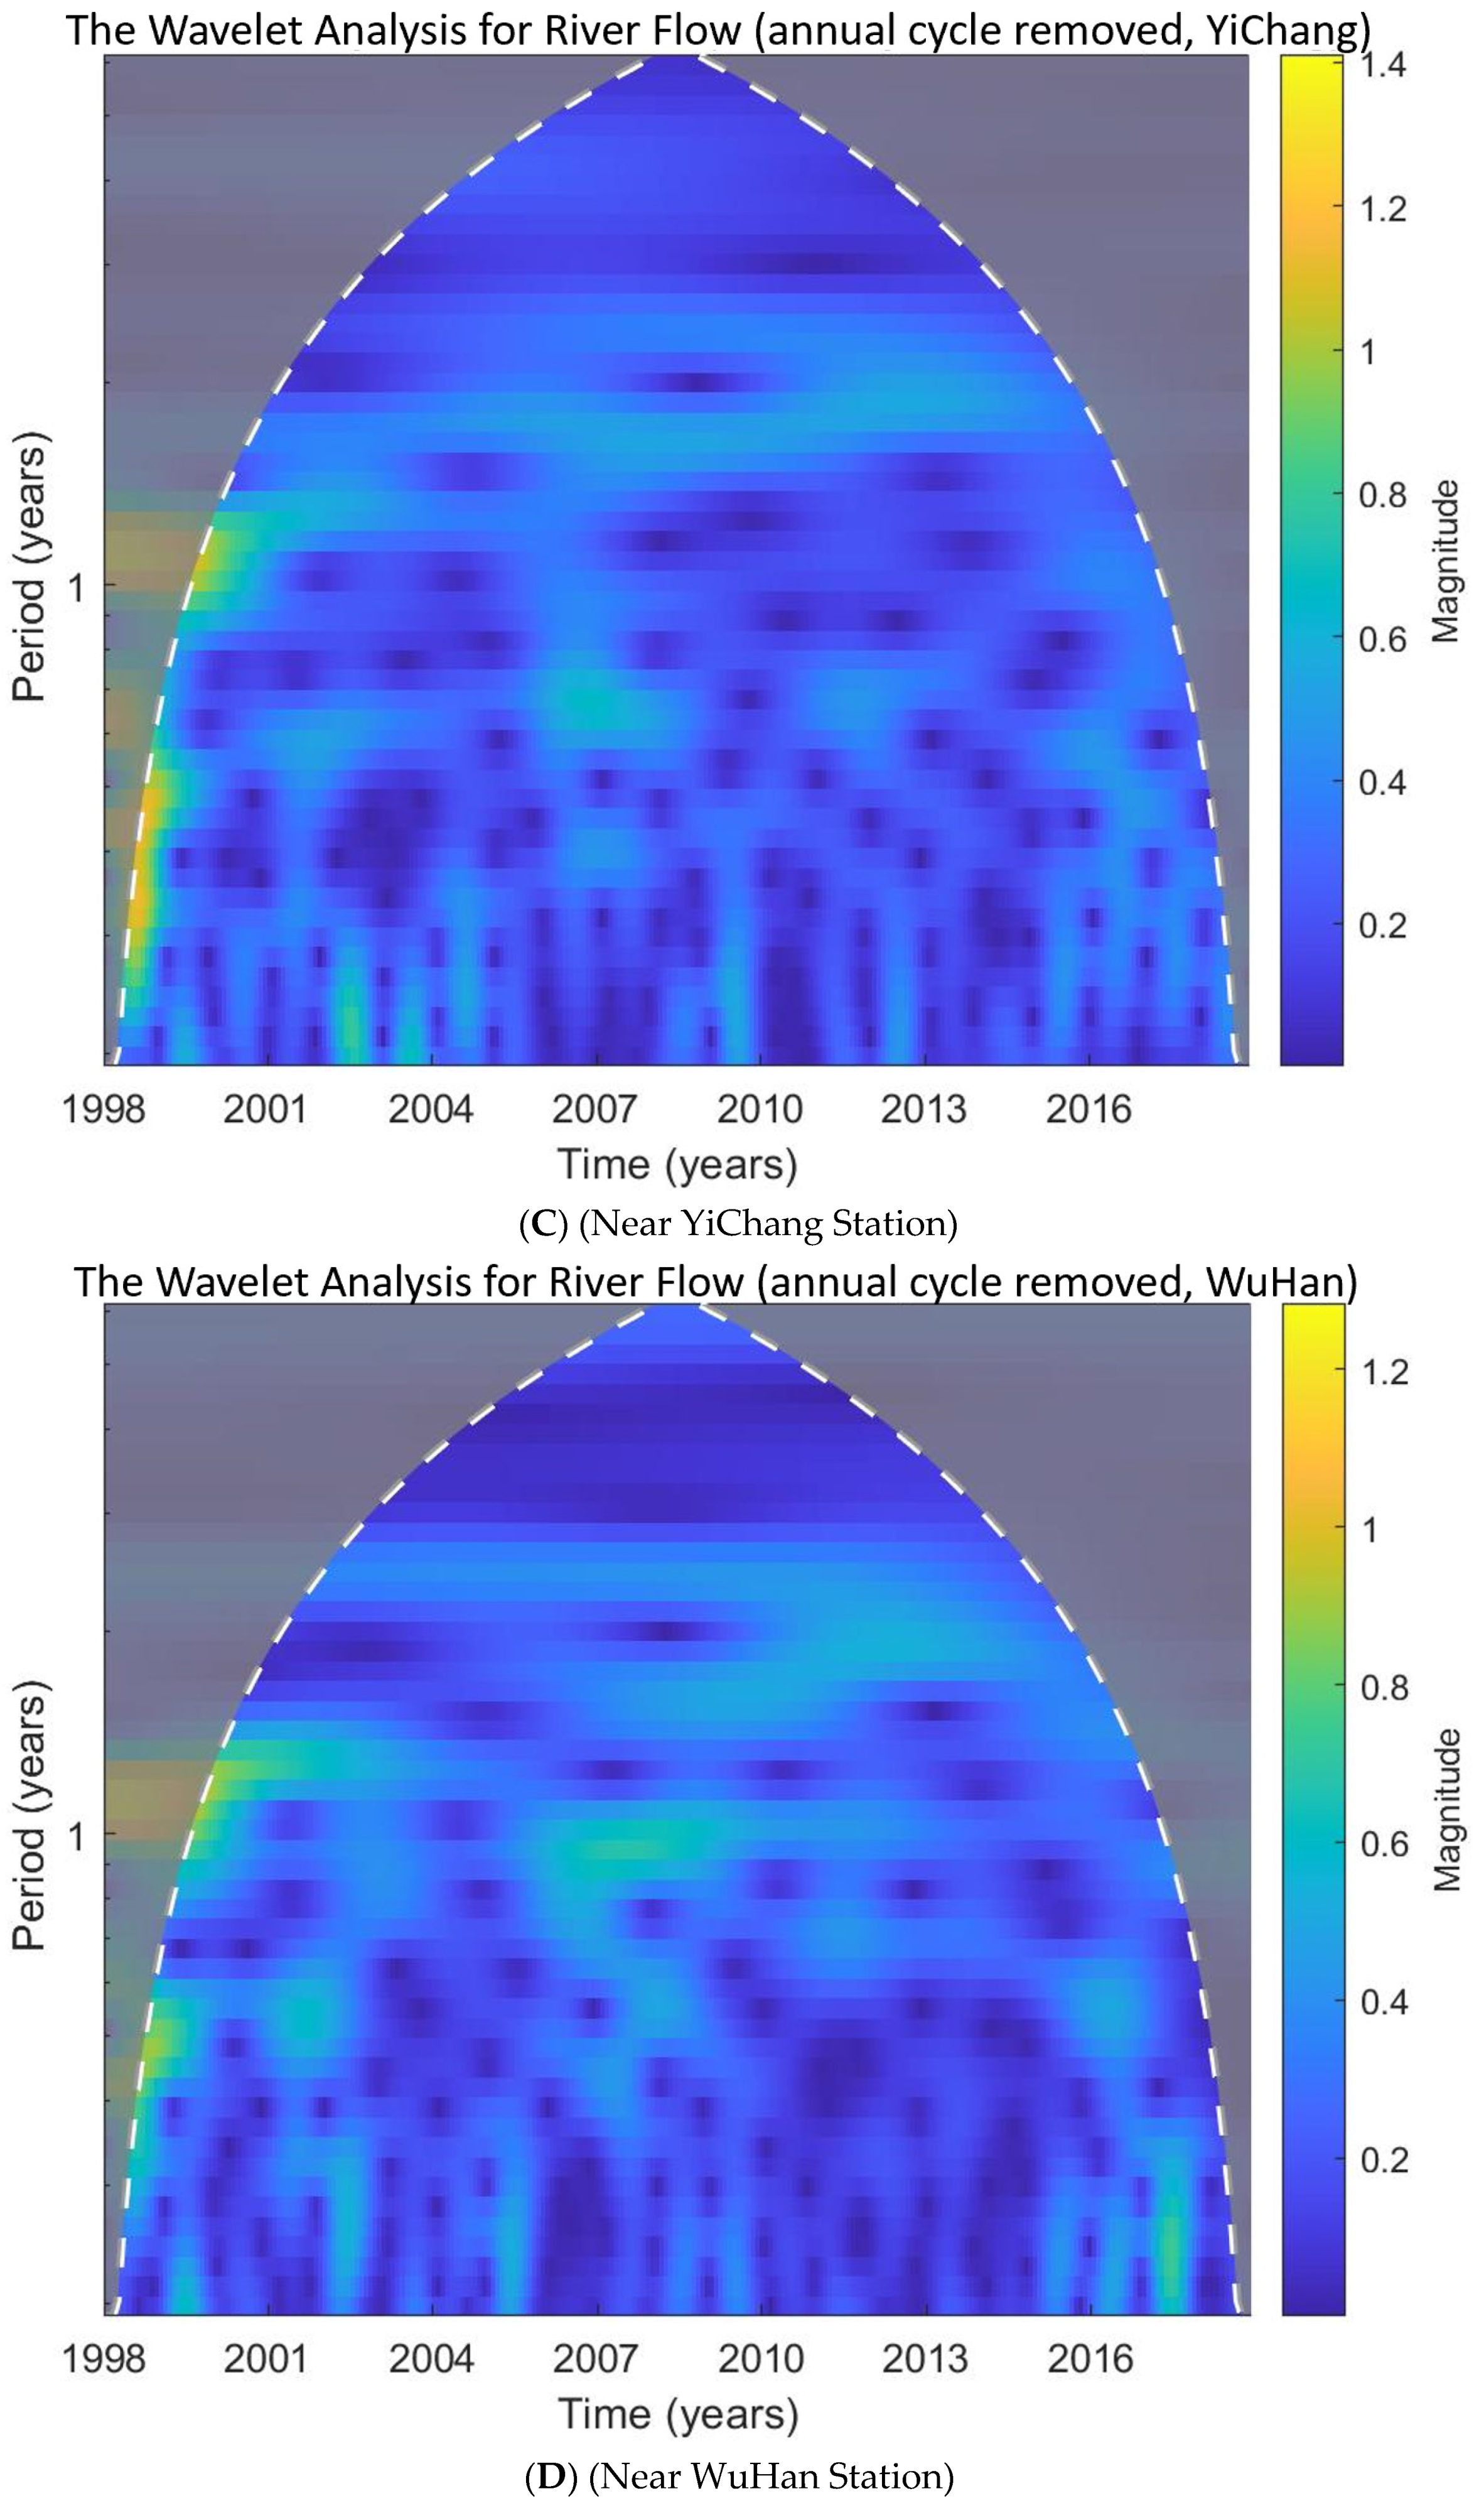
3.2. The Analysis Results of the River Discharge near Station

Since the river discharge data are raster, the wavelet analysis uses the time series extracted from the raster pixel at the latitude and longitude of the six ground-level precipitation stations from 1998. Overall, all the six selected locations’ monthly river discharge analysis results show a steady and concentrated annual cycle. The results from different locations (Figure 10) have different bright spots along the line, representing high wavelet magnitude at the annual cycle. For example, the YiChang station, located next to the reservoir, shows a bright spot at the beginning of the time scale. The downstream stations have similar bright spots corresponding to the start of reservoir injection.
With the idea to identify other possible porotic characteristics in the river discharge other than the annual cycle, the wavelet analysis was performed on the six times series after removing their 23-year average annual trend to identify more detailed patterns.
The wavelet analysis result of the river discharge near YiBin station after removing the annual cycle (Figure 11A) shows a scattered green and dark blue pattern at the seasonal (1/4 year) level with four bright spots at 1998, 2002, 2003, and 2009. This shows a relatively higher wavelet magnitude at the green spots than dark blue. There are also several bright spots on the half-year period level in 2006 and 2012. Besides these high magnitudes at the high-frequency level, there is a bright spot at the period scale above the annual line in 2012.
For the river discharge near ChongQing station (Figure 11B), the wavelet analysis result also shows a scattered green pattern on the seasonal period level with bright spots in years 1998, 2002, 2003, and 2009, which are the same years that the YiBin station shows a high wavelet magnitude with a seasonal period. In addition, the river discharge near ChongQing station also shows a high magnitude in 2006 and 2012 at the half-year scale and a bright spot in 2012 with a period greater than one year.
After removing the annual cycle, the river discharge analysis near the YiChang station (Figure 11C) shows a scattered green and blue pattern at the seasonal period level. The bright spot in the first year with a periodic cycle from seasonal (1/4) to one year also shows a high wavelet magnitude after removing the annual cycle. This station’s overall magnitude is lower than the previous station even though wavelet magnitude change patterns over time are similar. The bright spots in 2002, 2003, and 2009 are still visible yet with a much smaller magnitude.
The analysis result of the river discharge near WuHan station after removing the monthly average (Figure 11D) shows a less scattered pattern on the seasonal level than the previous three locations. The locations of the bright spot are also not the same. There are bright spots in 1999, 2003, 2005, and 2017 at the seasonal level (y = 0.25) and 2000 and 2008 at the annual level (y = 1). The precipitation data from this station also show seasonal solid and annual patterns at the beginning of the time scale.
The wavelet analysis result of the river discharge near the AnQing station after removing the monthly average (Figure 11E) shows a less obvious scattered pattern on the seasonal period level with fewer bright spots. There are two noticeable bright spots with a seasonal period in 2005 and 2019. These are the same years when the WuHan station has its bright spots. Besides the bright spots on the seasonal level, there is still a bright spot at 2008 on the annual level. At the beginning of the period, the bright spot covers from seasonal to annual level shows a smaller magnitude than the previous stations.
For the river discharge near the NanJing station, the dataset’s wavelet analysis result (Figure 11F) shows a similar scattered pattern as the rest of the stations. A less noticeable color change from one year to the next. There are still bright spots in 2005 and 2017 at the seasonal level (y = 0.25) and 2008 at the annual level (y = 1).

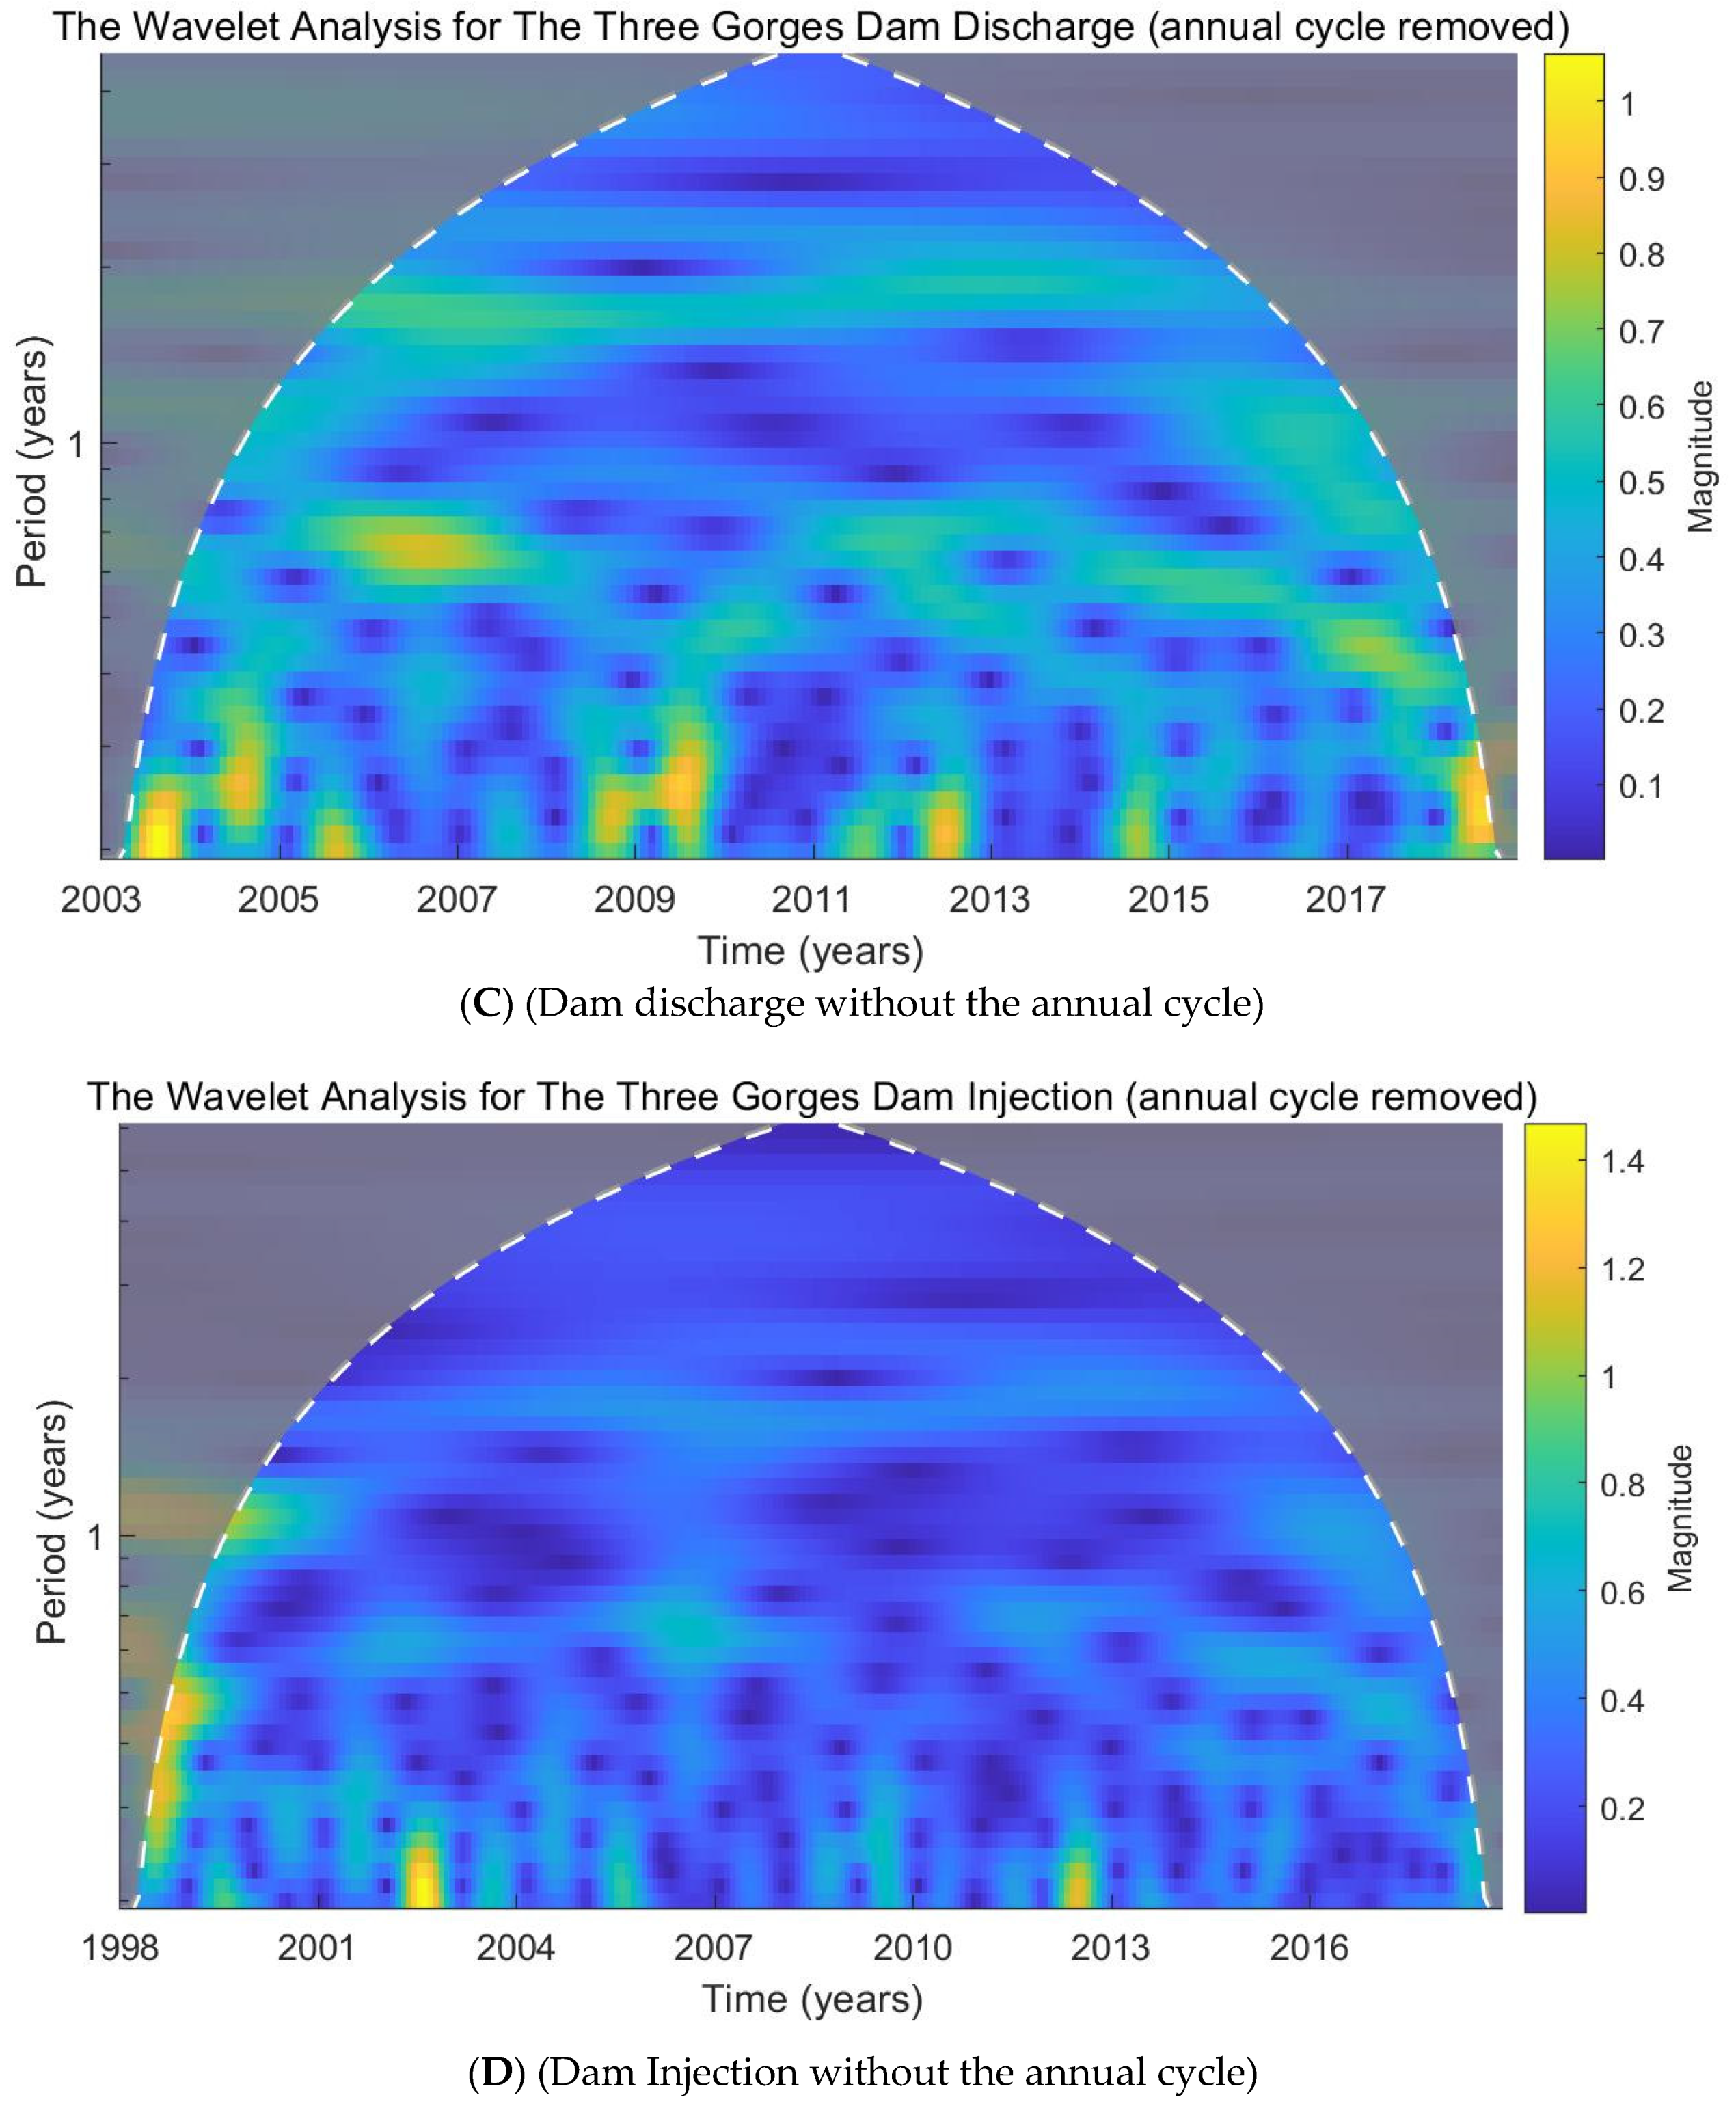
3.3. The Analysis Results of the Dam Injection and Discharge

The dam injection and discharge (Figure 12A,B) display a clear and steady annual cycle with no noticeable bright spots in the analysis result. Therefore, the wavelet analysis was also performed on the dataset after removing the monthly average to remove the annual cycle’s influence and identify other periods with a high wavelet magnitude. After removing the annual cycle (Figure 12C), the wavelet analysis results for the dam discharge have several bright spots along the scale with a seasonal period (1/4 year).
Besides the bright spots with a yellow color, there is a definite scattered color change on the seasonal scale, while the number of the change corresponds to the number of years in the time scale. This scattered pattern is not noticeable in the analysis results before removing the annual cycle. This scattered pattern could also be found in the dam injection (Figure 12D) after removing the annual cycle. Besides the scattered change on the seasonal level, the dam injection data also had a bright spot on the half-year scale at the beginning of the dataset in 1998.

4. Discussion

The studies around the Three Gorges Dam have been focused on its local impact [18,23,36], the sediment transportation [17,24,26,28], ecologic damage [13,14,20,36,37,38], and thermal impact [10,39,40]. The disturbances the dam could cause on the river dynamic and system are underestimated. Most believe that the dam’s effects are limited due to the self-regulation of the river system [23]. However, the same rule could be applied to the other side: that the impact is magnified if the impact is large enough to break the river’s regulation limit. Since the current beliefs of how large the impact area is still within a local and limited range, the possible damages may be larger than expected. This study compared the data’s wavelet decompositions from different stations. A possible explanation of the stations’ differences and similarities was also inferred regarding the Three Gorges Dam reservoir impact.
All precipitation datasets from the different stations show a scattered pattern at the seasonal level, indicating that one or two seasons have more periodic characteristics than other seasons. The light green to dark blue change indicates that there is a periodical to none-periodical change in the data. It means some months of the year would display a periodic change, while others appear more random. There is one deviation from systematic to random every year. Besides the generally scattered pattern, the bright spots at the seasonal level are coherent in all the stations.
When comparing the analysis results of precipitations with the dam discharge result, it is clear that the pattern of dam discharge from Figure 12C is similar to the seasonal patterns in the precipitations results and the river discharge results. However, the similarity is less when comparing the precipitation and river discharge results with the dam injection result. This difference proves that the dam discharge impacts the precipitation and river flow instead of the other way around. If the precipitation was the factor that caused dam water level rise, which led to an increase in dam discharge, then the dam injection should share a similar pattern with the precipitation. This idea also applies to whether the dam, the river, and the precipitation are all influenced by climate change. If they are all impacted by a common factor, the dam injection should be more similar to the river and precipitation since they have less manual control.
The precipitation results also show a more evident difference between before and after dam construction at the upstream locations than downstream locations. This pattern is likely influenced by the distance from the dam and the oceanic influence [23,39]. The weather pattern would have a heavier oceanic and monsoon influence closer to the coast. Therefore, the influence of the dam is very minimal for the last two stations. However, the similarity between the results from the two coastal stations and the dam discharge shows that the dam still has enough impact on them.
The wavelet magnitude of the river charges declines from upstream to downstream beside the seasonal changes each year. Furthermore, the bright spots coincide in the graph for different years, indicating the inter-connected river discharge between upstream and downstream. The three downstream stations are under the East Asian monsoon’s influence, during which heavy precipitations influence the local river discharge [4,5]. Despite the monsoon’s influence, the river discharge patterns show substantial spatial similarity from upstream to downstream after removing the monthly average from the dataset. The river system’s interconnection and coherent nature would be the primary factor in why the dam’s estimated area should be larger than the proposed 100-km radius [18]. Even when the East Asian monsoon has a dominant influence on the coast of China, the river discharge determined by the dam would still have enough force to alter the coast weather.
The dam injection and discharge wavelet analysis display human manipulation of water storage in the reservoir. The discharge data shows a higher magnitude at the annual cycle than the injection data. After the annual cycles were removed, the discharge data has more bright spots in the wavelet decomposition graph than the injection. The reservoir water level is managed through dam discharge control for water use and flood prevention. Therefore, there is more seasonality in the discharge data than the injection. This pattern also proves that the similarity between the dam discharge and other datasets could be taken as proof that the dam impacts the precipitation and river. Since the dam discharge is very manually controlled, the pattern is not natural compared to the injection pattern. However, the river and precipitation are more similar to dam discharge than dam injection.
The precipitation results from stations near the dam are cohesive with previous studies that aim at the same super dam and reservoir [40,41]. Therefore, the dam and reservoir have changed the surrounding area’s climate condition. However, there has been no discussion on its influence on the far end of the river system and with the coastal monsoon [18]. This paper’s results clearly show that the dam and reservoir have also impacted the precipitation patterns on the far end of the Yangtze River, both upstream and downstream. The impact on climate could be a combination of multiple factors, including the temperature change caused by the land cover [42] and the river velocity and discharge impact by the dam discharge [2,21,25,40,41].

5. Conclusions

In this study, three datasets related to the Three Gorges Dam and Reservoir were explored. The dataset’s basic periodic pattern and characteristics are presented and discussed. There are serval essential results and conclusions that would be interesting to the academic society and future studies.
In the general statistical analysis, the changing pattern on the precipitation after the dam and reservoir construction shows a high possibility that the reservoir changed the landscape and climate condition, causing the precipitation to change along the whole river basin. The vast water of the reservoir may change the heat and water exchange pattern nearby. The river discharge datasets show similarities at different locations downstream of the reservoir. Despite the seasonal impact by the East Asian monsoon in the downstream area, such changes in the precipitation by the dam’s construction are unexpectedly significant.
The precipitation datasets decreased wavelet magnitude after 1998 when the dam was built in the wavelet analysis. The annual cycle, shown as a bright year line through the time range, still exists in the analysis result after 1998, but the magnitude of the annual cycle has reduced. The river discharge shows a decrease of wavelet magnitude at the three downstream locations. The possible explanation of this pattern could be the human-controlled dam discharge. The constant water level maintained in the reservoir by human control would slow down the flow speed and stabilize it.
In short, this study confirms the significant influence of the Three Gorges Dam and Reservoir on the Yangtze River basin through analyses of the correlation pattern of precipitation and river discharge from different locations along the river. It also finds that the dam’s influence on the climate is more significant than expected and reported in previous studies. Of course, with the limitation of data type and source and the complexity of the weather dynamic, the proposed conclusions are just assumptions made based on previous literature and the result of this study. Its purpose is to raise the question and discussion around the influence of a super dam. Based on this study’s result and conclusion, the research on other dams and using other climate parameters could be further discussed. Furthermore, more parameters shall be added in future studies, such as soil moisture, groundwater table, and air humidity.

Author Contributions

Conceptualization, L.W. and W.Z.; methodology, L.Y.; software, L.Y.; validation, B.D.K., K.K. and L.W.; formal analysis, L.Y.; data curation, L.Y.; writing—original draft preparation, L.Y.; writing—review and editing, L.W.; supervision, L.W. All authors have read and agreed to the published version of the manuscript.

Funding

This research received no external funding.

Institutional Review Board Statement

Not Applicable.

Informed Consent Statement

Not Applicable.

Data Availability Statement

The data used in this study are open-sources data provided by the Climate Data Online of the National Oceanic and Atmospheric Administration (NOAA) (https://www.ncdc.noaa.gov/cdo-web/ accessed on 3 July 2020), from the Global Flood Awareness System (GloFAS) (https://cds.climate.copernicus.eu/cdsapp#!/dataset/10.24381/cds.a4fdd6b9 accessed on 3 July 2020), and the China Three Gorges Corporation (https://www.ctg.com.cn/sxjt/sqqk/index.html accessed on 3 July 2020).

Conflicts of Interest

The authors declare no conflict of interest.

References

  1. Yin, H.; Li, C. Human impact on floods and flood disasters on the Yangtze River. Geomorphology 2001, 41, 105–109. [Google Scholar] [CrossRef]
  2. Yu, F.; Chen, Z.; Ren, X.; Yang, G. Analysis of historical floods on the Yangtze River, China: Characteristics and explanations. Geomorphology 2009, 113, 210–216. [Google Scholar] [CrossRef]
  3. Li, X.; Zheng, W.; Lam, N.; Wang, D.; Yin, L.; Yin, Z. Impact of land use on urban water-logging disaster: A case study of Beijing and New York cities. Environ. Eng. Manag. J. (EEMJ) 2017, 16. [Google Scholar] [CrossRef]
  4. Du, J.-L.; Yang, S.-L.; Feng, H. Recent human impacts on the morphological evolution of the Yangtze River delta foreland: A review and new perspectives. Estuar. Coast. Shelf Sci. 2016, 181, 160–169. [Google Scholar] [CrossRef]
  5. Feng, L.; Hu, C.; Chen, X.; Song, Q. Influence of the Three Gorges Dam on total suspended matters in the Yangtze Estuary and its adjacent coastal waters: Observations from MODIS. Remote Sens. Environ. 2014, 140, 779–788. [Google Scholar] [CrossRef]
  6. Jiang, T.; Kundzewicz, Z.W.; Su, B. Changes in monthly precipitation and flood hazard in the Yangtze River Basin, China. Int. J. Climatol. A J. R. Meteorol. Soc. 2008, 28, 1471–1481. [Google Scholar] [CrossRef]
  7. Yang, S.; Milliman, J.; Li, P.; Xu, K. 50,000 dams later: Erosion of the Yangtze River and its delta. Glob. Planet. Chang. 2011, 75, 14–20. [Google Scholar] [CrossRef]
  8. Guo, H.; Hu, Q.; Zhang, Q.; Feng, S. Effects of the three gorges dam on Yangtze river flow and river interaction with Poyang Lake, China: 2003–2008. J. Hydrol. 2012, 416, 19–27. [Google Scholar] [CrossRef]
  9. Nakayama, T.; Shankman, D. Impact of the Three-Gorges Dam and water transfer project on Changjiang floods. Glob. Planet. Chang. 2013, 100, 38–50. [Google Scholar] [CrossRef]
  10. Song, Z.; Liang, S.; Feng, L.; He, T.; Song, X.P.; Zhang, L. Temperature changes in three gorges reservoir area and linkage with three gorges project. J. Geophys. Res. Atmos. 2017, 122, 4866–4879. [Google Scholar] [CrossRef]
  11. Lai, X.; Jiang, J.; Yang, G.; Lu, X. Should the Three Gorges Dam be blamed for the extremely low water levels in the middle–lower Yangtze River? Hydrol. Processes 2014, 28, 150–160. [Google Scholar] [CrossRef]
  12. Wilmsen, B.; Webber, M.; Yuefang, D. Development for whom? Rural to urban resettlement at the Three Gorges Dam, China. Asian Stud. Rev. 2011, 35, 21–42. [Google Scholar] [CrossRef]
  13. Wu, G.; De Leeuw, J.; Skidmore, A.K.; Prins, H.H.; Best, E.P.; Liu, Y. Will the Three Gorges Dam affect the underwater light climate of Vallisneriaáspiralis L. and food habitat of Siberian crane in Poyang Lake? Hydrobiologia 2009, 623, 213–222. [Google Scholar] [CrossRef]
  14. New, T.; Xie, Z. Impacts of large dams on riparian vegetation: Applying global experience to the case of China’s Three Gorges Dam. Biodivers. Conserv. 2008, 17, 3149–3163. [Google Scholar] [CrossRef]
  15. Wen, Z.; Wu, S.; Chen, J.; Lü, M. NDVI indicated long-term interannual changes in vegetation activities and their responses to climatic and anthropogenic factors in the Three Gorges Reservoir Region, China. Sci. Total Environ. 2017, 574, 947–959. [Google Scholar] [CrossRef]
  16. Dai, Z.; Du, J.; Li, J.; Li, W.; Chen, J. Runoff characteristics of the Changjiang River during 2006: Effect of extreme drought and the impounding of the Three Gorges Dam. Geophys. Res. Lett. 2008, 35. [Google Scholar] [CrossRef]
  17. Yang, S.L.; Zhang, J.; Xu, X. Influence of the Three Gorges Dam on downstream delivery of sediment and its environmental implications, Yangtze River. Geophys. Res. Lett. 2007, 34. [Google Scholar] [CrossRef]
  18. Wu, L.; Zhang, Q.; Jiang, Z. Three Gorges Dam affects regional precipitation. Geophys. Res. Lett. 2006, 33. [Google Scholar] [CrossRef] [Green Version]
  19. Wang, F.; Zhang, Y.; Huo, Z.; Peng, X.; Araiba, K.; Wang, G. Movement of the Shuping landslide in the first four years after the initial impoundment of the Three Gorges Dam Reservoir, China. Landslides 2008, 5, 321–329. [Google Scholar] [CrossRef]
  20. Fu, C.; Wu, J.; Chen, J.; Wu, Q.; Lei, G. Freshwater fish biodiversity in the Yangtze River basin of China: Patterns, threats and conservation. Biodivers. Conserv. 2003, 12, 1649–1685. [Google Scholar] [CrossRef]
  21. Li, X.; Sha, J.; Wang, Z.-L. Influence of the Three Gorges Reservoir on climate drought in the Yangtze River Basin. Environ. Sci. Pollut. Res. 2021, 28, 29755–29772. [Google Scholar] [CrossRef]
  22. Zeng, Y.; Zhou, Z.; Yan, Z.; Teng, M.; Huang, C. Climate change and its attribution in three gorges reservoir area, China. Sustainability 2019, 11, 7206. [Google Scholar] [CrossRef] [Green Version]
  23. Li, Y.; Wu, L.; Chen, X.; Zhou, W. Impacts of Three Gorges Dam on regional circulation: A numerical simulation. J. Geophys. Res. Atmos. 2019, 124, 7813–7824. [Google Scholar] [CrossRef]
  24. Liu, J.; Xu, K.; Li, A.; Milliman, J.; Velozzi, D.; Xiao, S.; Yang, Z. Flux and fate of Yangtze River sediment delivered to the East China Sea. Geomorphology 2007, 85, 208–224. [Google Scholar] [CrossRef]
  25. Li, L.; Lu, X.; Chen, Z. River channel change during the last 50 years in the middle Yangtze River, the Jianli reach. Geomorphology 2007, 85, 185–196. [Google Scholar] [CrossRef]
  26. Yang, S.; Milliman, J.; Xu, K.; Deng, B.; Zhang, X.; Luo, X. Downstream sedimentary and geomorphic impacts of the Three Gorges Dam on the Yangtze River. Earth-Sci. Rev. 2014, 138, 469–486. [Google Scholar] [CrossRef]
  27. Du, Y.; Xue, H.-P.; Wu, S.-J.; Ling, F.; Xiao, F.; Wei, X.-H. Lake area changes in the middle Yangtze region of China over the 20th century. J. Environ. Manag. 2011, 92, 1248–1255. [Google Scholar] [CrossRef]
  28. Xu, K.; Milliman, J.D. Seasonal variations of sediment discharge from the Yangtze River before and after impoundment of the Three Gorges Dam. Geomorphology 2009, 104, 276–283. [Google Scholar] [CrossRef]
  29. Torrence, C.; Compo, G.P. A practical guide to wavelet analysis. Bull. Am. Meteorol. Soc. 1998, 79, 61–78. [Google Scholar] [CrossRef] [Green Version]
  30. Zheng, W.; Li, X.; Yin, L.; Yin, Z.; Yang, B.; Liu, S.; Song, L.; Zhou, Y.; Li, Y. Wavelet analysis of the temporal-spatial distribution in the Eurasia seismic belt. Int. J. Wavelets Multiresolut. Inf. Processing 2017, 15, 1750018. [Google Scholar] [CrossRef]
  31. Baliunas, S.; Frick, P.; Sokoloff, D.; Soon, W. Time scales and trends in the central England temperature data (1659–1990): A wavelet analysis. Geophys. Res. Lett. 1997, 24, 1351–1354. [Google Scholar] [CrossRef]
  32. Daubechies, I. The wavelet transform, time-frequency localization and signal analysis. IEEE Trans. Inf. Theory 1990, 36, 961–1005. [Google Scholar] [CrossRef] [Green Version]
  33. Morlet, J.; Arens, G.; Fourgeau, E.; Glard, D. Wave propagation and sampling theory—Part I: Complex signal and scattering in multilayered media. Geophysics 1982, 47, 203–221. [Google Scholar] [CrossRef] [Green Version]
  34. Morlet, J.; Arens, G.; Fourgeau, E.; Giard, D. Wave propagation and sampling theory—Part II: Sampling theory and complex waves. Geophysics 1982, 47, 222–236. [Google Scholar] [CrossRef]
  35. Grinsted, A.; Moore, J.C.; Jevrejeva, S. Application of the cross wavelet transform and wavelet coherence to geophysical time series. Nonlinear Processes Geophys. 2004, 11, 561–666. [Google Scholar] [CrossRef]
  36. Bergkamp, G.; McCartney, M.; Dugan, P.; McNeely, J.; Acreman, M. Dams, ecosystem functions and environmental restoration. Themat. Rev. II 2000, 1, 1–187. [Google Scholar]
  37. Wu, J.; Huang, J.; Han, X.; Gao, X.; He, F.; Jiang, M.; Jiang, Z.; Primack, R.B.; Shen, Z. The three gorges dam: An ecological perspective. Front. Ecol. Environ. 2004, 2, 241–248. [Google Scholar] [CrossRef]
  38. Hester, E.T.; Doyle, M.W. Human Impacts to River Temperature and Their Effects on Biological Processes: A Quantitative Synthesis 1. JAWRA J. Am. Water Resour. Assoc. 2011, 47, 571–587. [Google Scholar] [CrossRef]
  39. Ge, F.; Mao, K.; Jiang, Y.; Wang, L.; Xu, T.; Gao, C.; Zuo, Z. Regional climate change after the commissioning of the Three Gorges Dam: A case study for the middle reaches of the Yangtze River. Clim. Res. 2018, 75, 33–51. [Google Scholar] [CrossRef]
  40. Cai, H.; Piccolroaz, S.; Huang, J.; Liu, Z.; Liu, F.; Toffolon, M. Quantifying the impact of the Three Gorges Dam on the thermal dynamics of the Yangtze River. Environ. Res. Lett. 2018, 13, 054016. [Google Scholar] [CrossRef]
  41. Su, Z.; Hao, Z.; Ho, M.; Lall, U.; Sun, X.; Chen, X.; Yan, L. The effect of Three Gorges Dam and rainfall on summer flow risk over Yangtze River Basin. Hydrol. Earth Syst. Sci. Discuss. 2017, 1–28. [Google Scholar] [CrossRef] [Green Version]
  42. Zheng, W.; Li, X.; Yin, L.; Wang, Y. Spatiotemporal heterogeneity of urban air pollution in China based on spatial analysis. Rend. Lincei 2016, 27, 351–356. [Google Scholar] [CrossRef]
Figure 1. The Three Gorges Dam and Selected Precipitation Stations.
Water 14 00567 g001
Figure 2. The Overall Statistic Descriptions for the River Discharge Near the Six Stations.
Water 14 00567 g002
Figure 3. Water Level and Monthly Average Dam Injection and Discharge of the Three Gorges Dam.
Water 14 00567 g003
Figure 4. The Wavelet Analysis Result for Monthly Precipitation at Yibin Station.
Water 14 00567 g004aWater 14 00567 g004b
Figure 5. The wavelet analysis result for monthly precipitation at ChongQing Station.
Water 14 00567 g005aWater 14 00567 g005b
Figure 6. The Wavelet Analysis Result for Monthly Precipitation at Yichang Station.
Water 14 00567 g006
Figure 7. The Wavelet Analysis Result for Monthly Precipitation at Wuhan Station.
Water 14 00567 g007aWater 14 00567 g007b
Figure 8. The Wavelet Analysis Result for Monthly Precipitation at Anqing Station.
Water 14 00567 g008
Figure 9. The Wavelet Analysis Result for Monthly Precipitation at Nanjing Station.
Water 14 00567 g009
Figure 10. The wavelet analysis result for river discharge with the annual cycle.
Water 14 00567 g010aWater 14 00567 g010bWater 14 00567 g010cWater 14 00567 g010d
Figure 11. The wavelet analysis result for river discharge without the annual cycle.
Water 14 00567 g011aWater 14 00567 g011bWater 14 00567 g011c
Figure 12. The wavelet analysis result for monthly Dam.
Water 14 00567 g012aWater 14 00567 g012b
Publisher’s Note: MDPI stays neutral with regard to jurisdictional claims in published maps and institutional affiliations.

