Article

Surface Water Change Detection via Water Indices and Predictive Modeling Using Remote Sensing Imagery: A Case Study of Nuntasi-Tuzla Lake, Romania

1
Faculty of Mathematics and Computer Science, Ovidius University of Constanta, 900527 Constanta, Romania
2
Faculty of Civil Engineering, Transilvania University of Brasov, 900152 Brasov, Romania
*
Authors to whom correspondence should be addressed.
Water 2022, 14(4), 556; https://doi.org/10.3390/w14040556
Submission received: 25 December 2021 / Revised: 3 February 2022 / Accepted: 8 February 2022 / Published: 12 February 2022

Abstract

:
Water body feature extraction using a remote sensing technique represents an important tool in the investigation of water resources and hydrological drought assessment. Nuntasi-Tuzla Lake, a component of the Danube Delta Natural Reserve, is located on the Romanian Black Sea littoral. On account of an event in summer 2020, when the lake surface water decreased significantly, this study aims to identify the variation of the Nuntasi-Tuzla Lake surface water over a long-term period in correlation with human intervention and climate change. To this end, it provides an analysis in the period 1965–2021 via hydrological drought indices and data mining classification. The latter approach is based on several water indices derived from Landsat TM/ETM+/OLI and MODIS full-time series datasets: Normalized Difference Vegetation Index (NDVI), Normalized Difference Vegetation Index (NDVI), Modified NDWI (MNDWI), Weighted Normalized Difference Water Index (WNDWI), and Water Ratio Index (WRI). The experimental results indicate that the proposed classification methods can extract relevant features from waterbodies using remote sensing imagery with a high accuracy. Moreover, the study shows a similarity in the evolution of surface water cover identified with the data mining classification and the drought periods detected in the flow data series for the Nuntasi and Sacele Rivers that supply the Nuntasi-Tuzla Lake. Overall, the results of our investigation show that human intervention and hydrological drought had an extensive impact on the long-term changes in surface water of the Nuntasi-Tuzla Lake.

1. Introduction

Climatic changes can induce modification of lake surfaces and riverbeds with severe implications for agricultural and economic activities [1,2,3]. The scientific literature demonstrates the “sensitivity” of physical, chemical, and biological lakes’ properties to climate change and human intervention [4,5,6]. Since 1960 permanent surface water has been shrinking, drying or has completely disappeared: Aral Lake, Urmia Lake (70% of its surface between 2012–2017 [7]), Chad Lake, Lop Nur, etc. [4,5]. Lake surface area was used by Benson and Paillet [8] in order to establish an indicator of lakes’ hydrological response to climatic change. In comparison with classic methods, Remote Sensing (RS) technology presents a viable alternative to improve the observation of lake water surface in hydrological studies.
Initially, the NDVI (Normalized Difference Vegetation Index) was an indicator used to efficiently monitor vegetation condition [9] and drought activity [10,11]. This index was used also to extract water features [12]. McFetters [13] developed a new method to delineate water bodies based on the spectral characteristics of water which refers to the capability of a water body to absorb near infrared radiation (NIR) and allows visible green light to penetrate the water body. This new indicator, NDWI (Normalized Difference Water Index) was modified by Xu [14] in order to resolve the issue of the zero (0) threshold agreed by McFetters as the separation between water body and background. Xu [14] proposed a modified NDWI (MNDWI) index using the middle infrared band (MIR) instead of NIR. According to the author [14], MNDWI can more accurately distinguish water from non-water features. One other well-known multiband water index is the water ratio index (WRI). Due to the domination of the spectral characteristics of the green and red bands compared with the NIR and MIR bands, the WRI shows values greater than 1 for water [15]. Guo et al. [16] proposed a new index: the weighted normalized difference water index (WNDWI), that weighted average NIR and SWIR (shortwave infrared) bands. According to the authors, the new index improves the accuracy of water extraction by correctly classifying turbid water as a water body and vegetation in the shadow area as non-water body [16]. Acharya [17,18] proposed a combination of different indices in order to improve water extraction.
In the summer of 2020, Nuntași-Tuzla Lake (1050 ha), located on the Romanian Black Sea littoral (Figure 1), dried out.
In this context, the purpose of this paper is to: (i) analyze the hydrological data in order to understand the response of surface water to climate change or/and human intervention and (ii) evaluate the performance of the most commonly used water indices using time series Landsat data in order to capture the variation in surface water during 1984–2021 period. These results will contribute to a better understanding of the lake’s evolution in the context of global changes.

2. Materials and Methods
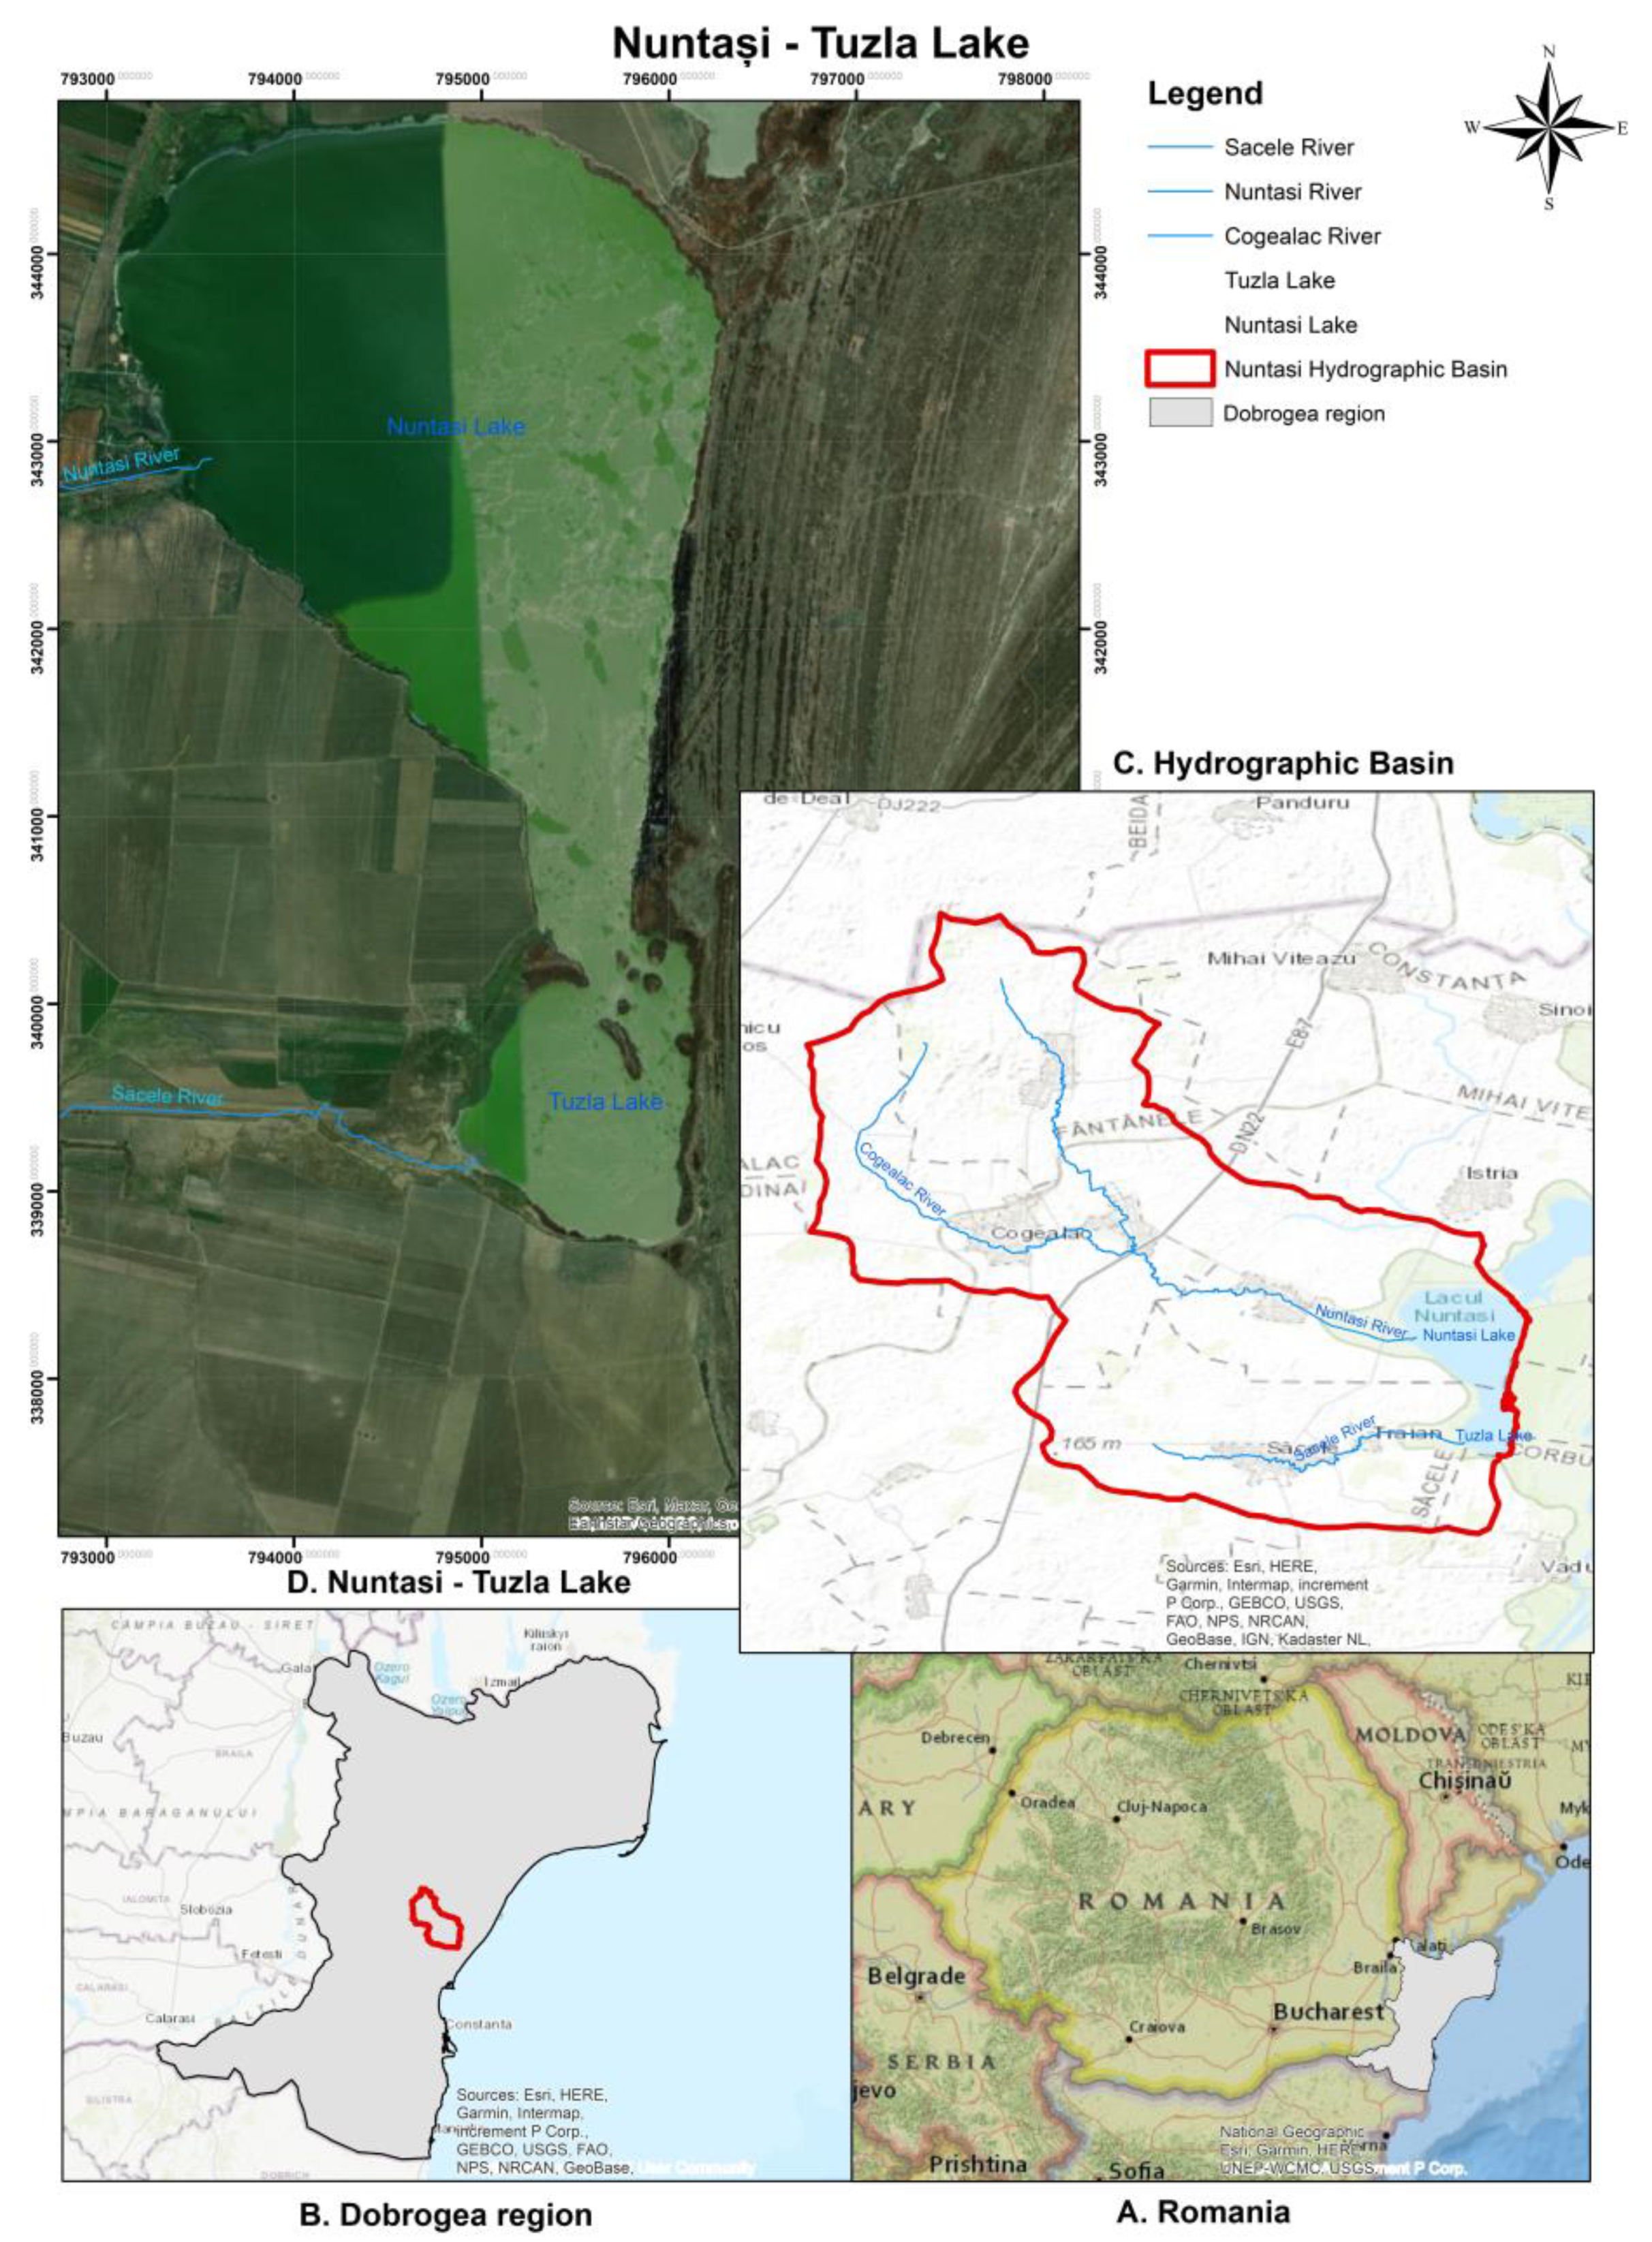
2.1. Study Area

The Nuntasi-Tuzla Lake is situated in the well-known Histria region (Histria or Istros acropolis is the first urban settlement, founded by ancient Milesian in the 7th century BC). From a geomorphological point of view, the Histria region is a coastal lowland developed at the contact between the Central Dobrogea plateau and the Black Sea [19]. The average altitude is 25 m with a slope that decreases towards the sea. Geologically, green schist covered with a loess layer of varying thickness (2–15 m) represents the basement. The climate of the region is temperate continental with marine influences (precipitation of 400 mm and 11 °C average temperature). From a hydrological point of view, the lake is part of the Razim-Sinoe lagunar complex, a component of the Danube Delta Natural Reserve. Today, the Razim-Sinoe complex (Figure 2), initially a marine bay (the former Halmyris gulf), is composed of the following lakes: Razim, Sinoe, Golovita, Zmeica, Babadag, Nuntasi-Tuzla, Istria, and Ceamurlia si Agighiol.
Concerning the lake’s genesis, the latest scientific arguments clearly demonstrate that neo-tectonic activity was the main factor that led to the Nuntasi-Tuzla and Istria lakes’ development 1200–1600 years ago [19]. The other lakes were separated from the Black Sea by sand-belts [17], which formerly had outlets allowing the penetration of sea water. The lakes were interconnected by small creeks.
According to Breier [20], Nuntasi-Tuzla Lake has the following morphometric features: the length is 2 km, the breadth varies between 1.7 and a maximum of 3 km, the depth of the lake varies between 2.15 m and 6.15 m, and the surface area is 1050 hectares. The Nuntasi-Tuzla Lake is supplied by two rivers: Nuntasi and Sacele. From the economic point of view, according to town hall documents, agriculture and fisheries are the predominant economic sectors in the region. The mud baths were a great tourist attraction at the beginning of the 20th century due to its therapeutic qualities. Nowadays, the most important touristic attraction in the region is Histria ancient city.
In a recent work [21], we described the irrigation system built in 1971–1975 and operable till 1990. After this year, the demand for irrigation decreased to 20% of its capacity.
In order to ensure water demand, the Razim-Sinoe lagoons were transformed into a large freshwater reservoir. The three greatest hydraulic works were constructed in that period: (i) closure of the natural gateway between the lagoons and Black Sea, (ii) closure—via sluices of the connections between the lakes and (iii) resizing of three canals which supply the reservoir with fresh water from the Danube (St George Arm) so as to ensure a total discharge of 260 mc/s (for a probability of occurrence of 1%) with an average of 80 mc/s [21]. These works led to important changes in the hydrological regime of the region and to a great disturbance of the ecological balance of all the lakes. Nuntasi-Tuzla Lake was connected to Istria Lake by a canal and sluice. This canal was silted up with alluvium.
A detailed description of all human intervention in this area is provided in Section 3.1.

2.2. Data Sets

2.2.1. Hydrological Datasets

Two hydrological parameters are monitored at the two hydrometric stations (Nuntasi and Sacele). This study is based on two time data series: annual average discharge for Nuntasi and Sacele spanning the 1965–2020 period, and daily discharge for the period 2008–2020. The annual average discharge was used in order to investigate changes in the time series. The time series data were collected by the National Administration “Romanian Water” Dobrogea-Littoral Branch at the hydrometric station situated in the Nuntasi-Tuzla lake basin.

2.2.2. Remote Sensing Datasets

The time-series datasets of Landsat surface reflectance are acquired directly from the GEE (Google Earth Engine) platform for the period 1984–2021 in the following way: (i) from 1984 to 1999, and from 2003 to 2011, the data were collected from Landsat 4–5 Thematic Mapper (TM); (ii) for 2000, 2001 and 2002, Landsat 7 Enhanced Thematic Mapper (ETM+) images were collected; and (iii) for 2013–2021, the data were collected from Landsat 8 Operational Land Imager (OLI). The datasets belong to Landsat Collection 1—Level 1 corrected data, which have the highest radiometric and positional quality and are suitable for time-series analysis. The spatial resolution of all Landsat scenes is 30 m.
Due to Landsat 7 ETM+ data gaps from 2012, the time-series dataset of the moderate-resolution imaging spectroradiometer (MODIS) TERRA surface reflectance (MOD09GA) was used to determine the surface water for the seasons of 2012. MODIS images with 500 m spatial resolution were acquired from the GEE platform. The study area is entirely contained within path 181 and row 29 for all Landsat TM/ETM+/OLI and Modis images (Figure 1).

2.3. Methods

The methodology used in this paper consists of three parts: A. a literature investigation to understand human intervention in the Nuntasi-Tuzla Lake basin; B. a hydrological analysis of two tributaries (Nuntasi and Sacele) concerning hydrological drought occurrence, which refers to (i) detecting changes in time series data through KhronoStat software and (ii) calculating hydrological drought; and C. RS analysis, which refers to: (i) processing of the Landsat and MODIS datasets so that only the images with Cloud Cover of less than 30% are investigated (ii) calculation of RS indices (RSI) NDVI, NDWI, MNDWI, WNDWI, WRI and their average for each season of each year of the period considered; (iii) in order to extract the water surface features, a decision tree was built. We chose the Classification and Regression Tree (CART) model developed by Breiman et al. [22], as a very popular statistical learning tool for analyzing large complex data.

2.3.1. Hydrological Analysis
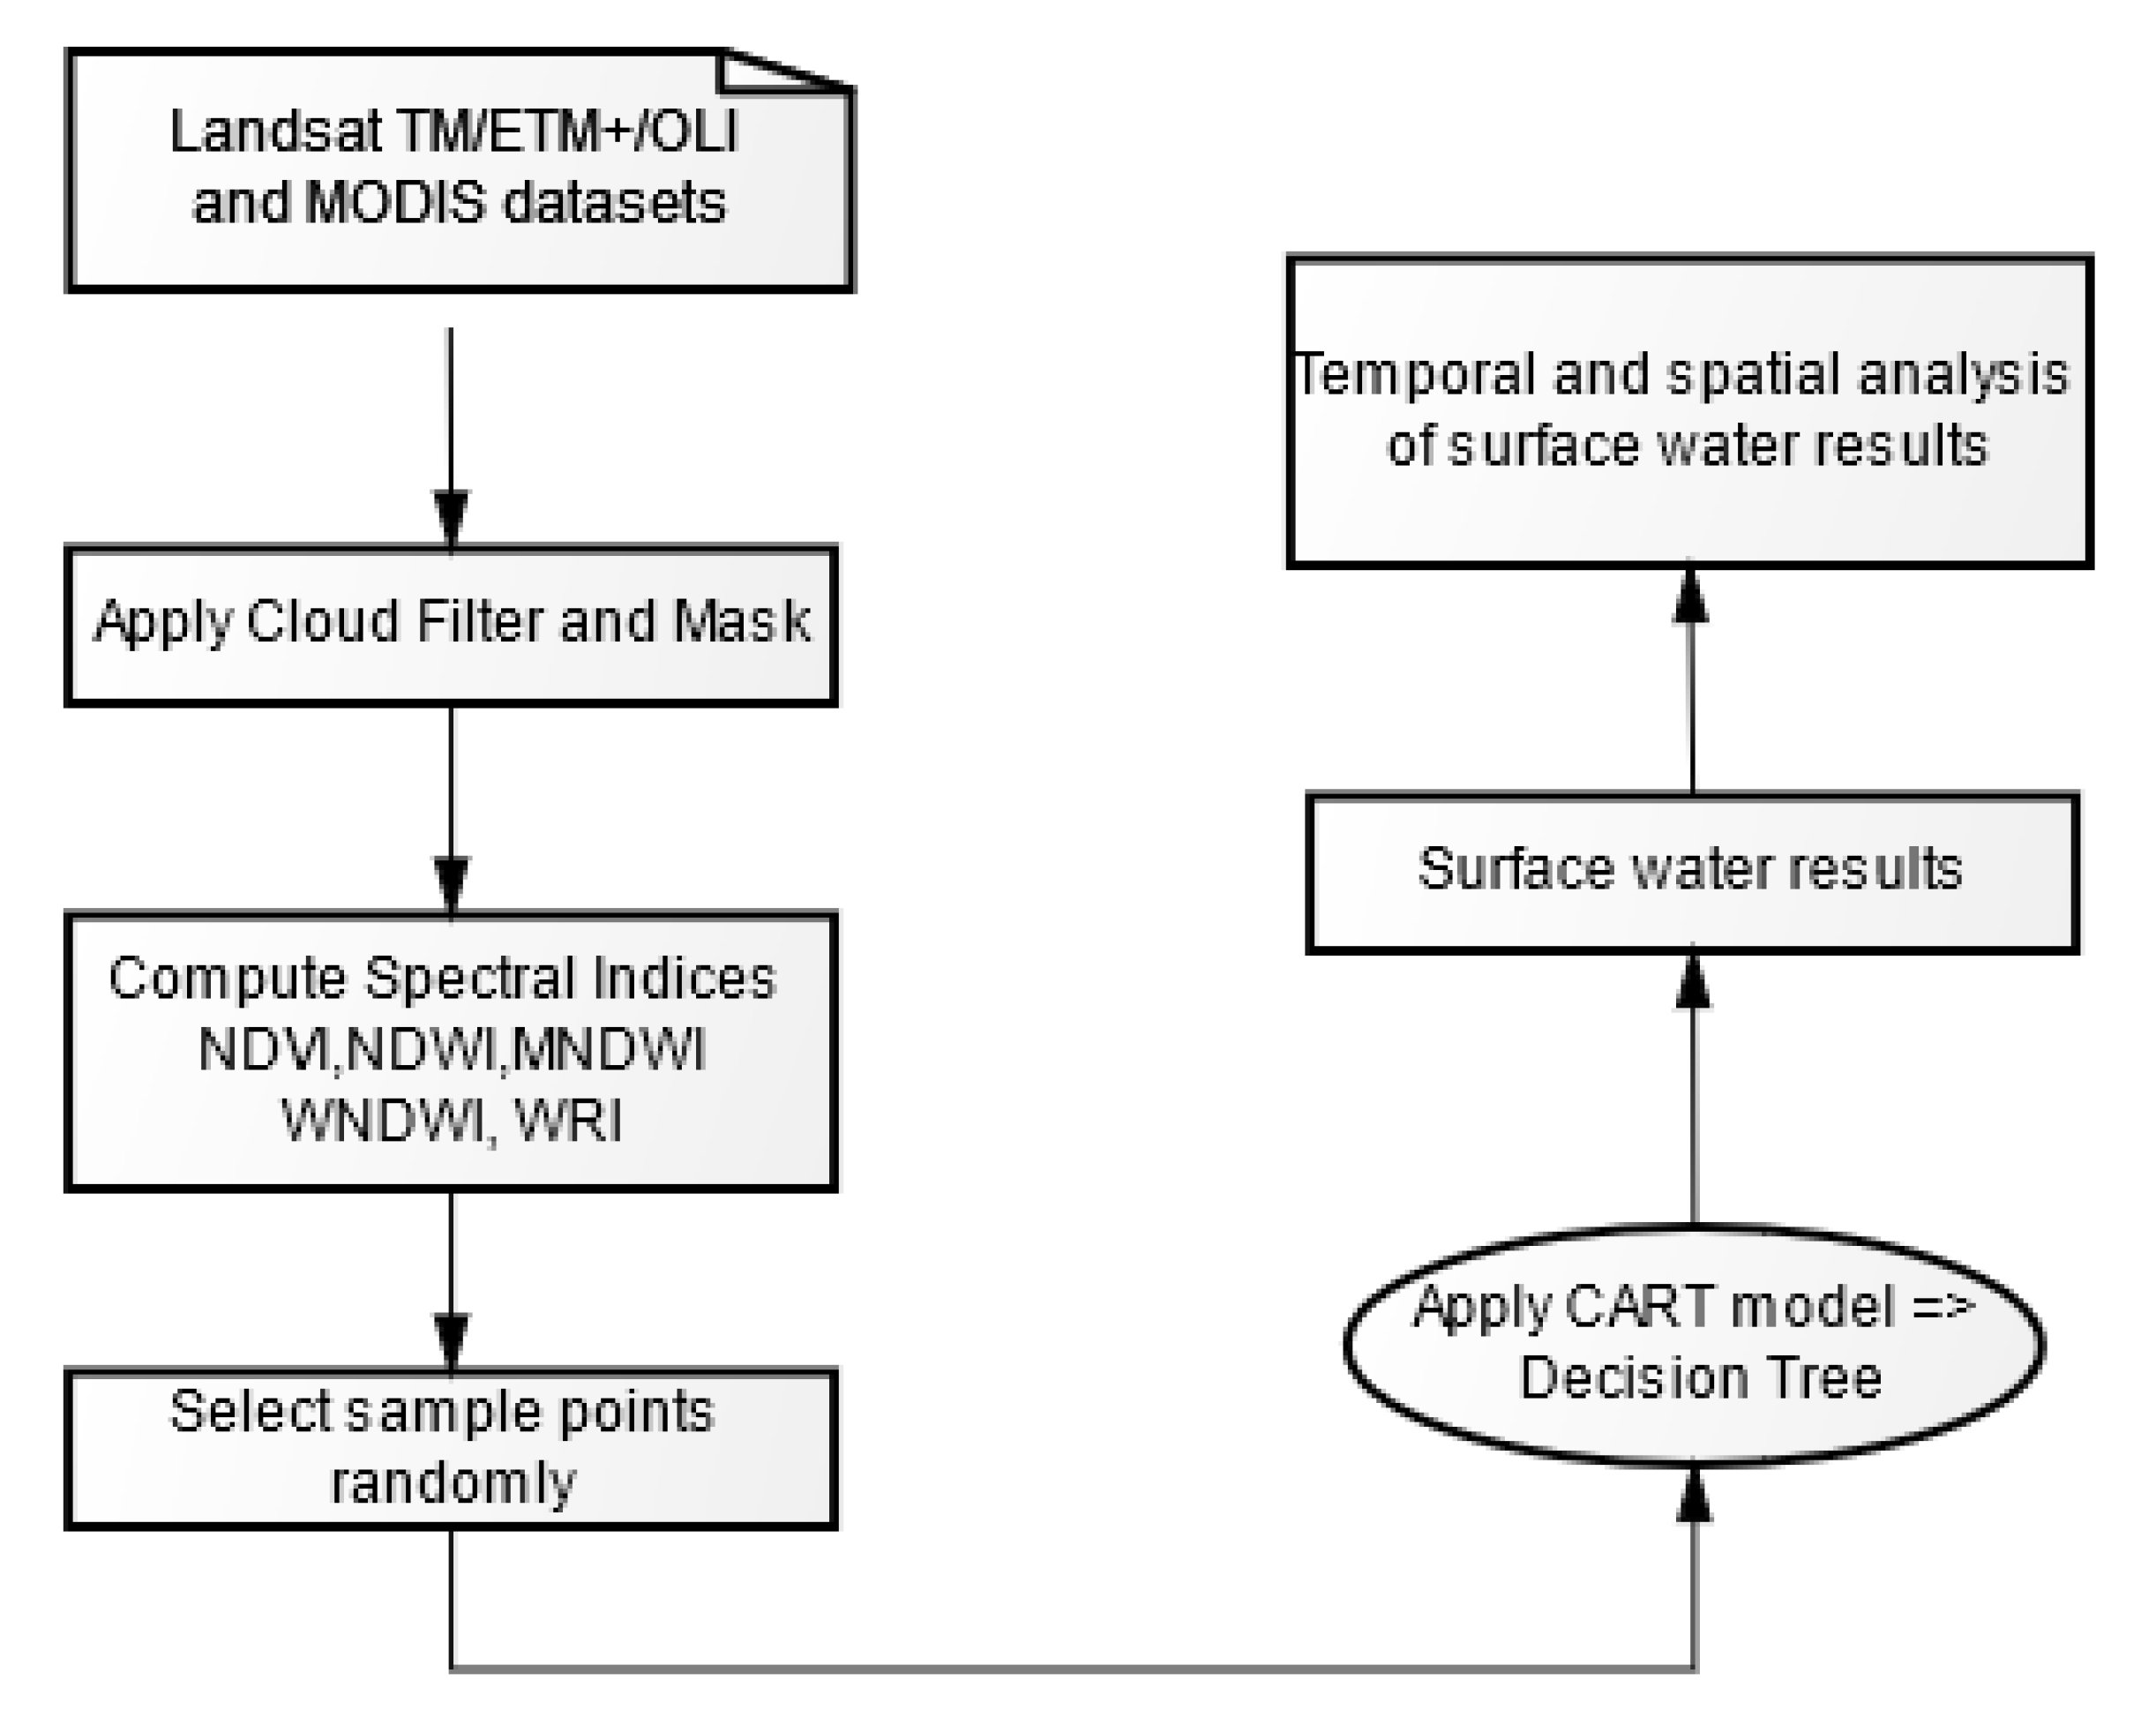
KhronoStat (HydroSciences, Montpellier, France) is statistical software able to identify the sudden changes in a hydro or climatic data series using a set of statistical tests: the Pettitt rank-based test (non-parametric test), Buishand “U” test, Lee and Heghinian Bayesian method (parametric test) and Hubert procedure segmentation. The Buishand “U” and Lee and Heghinian tests are applicable if the time series investigated are normal. The Hubert procedure is the only one able to detect multiple breaks. The series is divided into “m” segments and, in order to limit the segmentation, the averages of two contiguous segments must be significantly different. This constraint is satisfied by Sheffe’s test [23,24].
Considering hydrological drought analysis, an overview of the principal scientific literature [25,26,27,28] demonstrates that methodologies to characterize hydrological droughts can be divided into two categories (Figure 3): (i) determine the low flow index (a percentile from flow duration curve (FDC); annual minimum flow (MAM); base flow index (BFI); and (ii) deficit characteristics by Threshold Level Method—TLM and SPA—Sequent Peak Algorithm. The biggest disadvantage of the first category of methods is that it cannot give any information about the length of the drought period or about the beginning or end of the drought, while the methods in the second category offer a number of characteristics relating to the drought duration, the volume of severity, the intensity of the event (ratio of the volume and duration of drought), and the minimum of each event.
Based on the SPA method, two droughts could be pooled if the reservoir has not totally “recovered” after the first drought event. Our interest is to find minor droughts also and not only major ones. For this study, we decided to use the TLM method. The TLM method, well known as the “method-of-crossing theory”, was introduced by Yevjevich in 1967 [29]. First, a threshold level, Qo, is chosen. The deficit begins where the flow values are below this Qo level and ends where the flow is above Qo value. We propose to use as threshold a value in the range of Q70%–Q95% resulting from the FDC analysis. To conclude, in order to evaluate the hydrological drought in the Nuntasi and Sacele Rivers, the methodology proposed is: (i) in order to select the driest period, an analysis of annual discharge time series data (1965–2020) will be performed with KhronoStat software which detects a sudden change in time series data; (ii) an assessment threshold value with the FDC curve; (iii) hydrological drought assessment with TLM methods using daily discharge data.

2.3.2. RS Analysis

Using the special spectral reflectance (RS) properties of water, it is possible to differentiate between water and other surface materials. A multiple RS indices algorithm based on supervised classification was used to identify the surface water cover of Nuntasi Tuzla Lake. The spectral indices measurements acquired from Landsat TM/ETM+/OLI and MODIS datasets from 1984–2021 were analyzed by the algorithm that trains the randomly chosen samplings to construct a binary decision tree, and finally decodes this in order to classify the surface water (Figure 4). The algorithm was fully implemented and run on the GEE platform.
Cloud filtering and masking of remote sensing data is a necessity to monitor the land surface cover more accurately. We used the cloud flag from the Level 1 Quality Assessment (QA) band of the Landsat datasets to limit the cloud cover at less than 30% in each selected image. Then, cloudy pixels were masked and not taken into consideration during the modeling of the surface water. This method is considered robust against errors [30,31]. After applying the cloud filter, we selected 233 Landsat RS images covering three seasons (spring, summer and autumn) of each year for the period investigated (Table 1). Similarly, the MOD09GA dataset for each season of 2012 was selected. In winter, most of the RS images did not pass the cloud filter, thus we decided to omit this season from our research.
The RSI indices extracted from the full-time Landsat and MODIS surface reflectance dataset (Table 2) were then averaged as seasonal RSI from 1984 to 2021. For example, seasonal RSI in summer 2020 is taken from the RSI indices summed from 1 June to 31 August 2020 divided by the valid data (number of RS images) from the same period.
In the formula, Green denotes the reflectance of the green band (Band 3 of the Landsat OLI data, Band 2 of the Landsat TM/ETM+ imagery, Band 4 of the MODIS data), Red represents the reflectance of the red band (Band 4 of the Landsat OLI data, Band 3 of the Landsat TM/ETM+ imagery, Band 1 of the MODIS data), NIR designates the reflectance of the near-infrared band (Band 5 for Landsat OLI, Band 4 for Landsat TM/ETM+, Band 2 of the MODIS data), MIR indicates the reflectance of the middle-infrared band (Band 6 for Landsat OLI and MODIS, Band 5 for Landsat TM/ETM) and SWIR stands for the reflectance of the SWIR1 band, which corresponds to Band 6 for Landsat OLI and MODIS data, and Band 5 for Landsat TM/ETM+ datasets.
The CART models lie on the supervised branch of the machine learning (ML) algorithms and may be used for both classification and regression problems. They find homogeneous subsets by recursively partitioning the input data, based on independent variable splitting criteria employing variance-minimizing algorithms. Being a non-parametric algorithm, intuitive and with a significant ability to characterize complex interactions among variables, the CART models have been widely used in different practical remote sensing applications [32,33]. For this study, we employed the CART algorithm provided by the GEE, with the seasonal averaged values of the RS indices (NDVI, NDWI, MNDWI, WNDWI and WRI) for each year as the input data. The surface water results for each season of the period investigated were then predicted based on the trained classification model.
To evaluate the performance of the RSI indices and the trained classification algorithm, three Landsat images for each period studied were randomly selected (Table 3).
In order to represent the water and the land features in the study area, we used the stratified random sampling method to select 240 test samples (120 water and 120 non-water samples). The water samples consist of river, lake and sea water pixels, and the non-water samples are composed of soil, vegetation and built-up area pixels. The validation of the accuracy assessment has been achieved by referring to the original satellite images and Google Earth images.

3. Results and Discussion

3.1. Human Intervention

A review of the principal scientific literature [27,34,35,36,37,38,39,40] concerning human intervention in the Nuntasi-Tuzla Lake region demonstrates huge landscape modification that began more than a century ago. Two series of works were carried out in the region: the first began in the period 1903–1905 and the second started in 1970. The first series was carried out for fisheries and finalized in four stages [37]: (i) 1903–1916, when a link between the Sf Gheorghe arm and the Razim-Sinoe Lake was made in order to improve the fresh water circulation [41]; work began in 1905 with the Dunavat canal and was continued with the Dranov (1912) and Crasnicol canals; (ii) in 1930–1948 and (iii) 1950–1963, a great number of canals were excavated in order to connect the Danube with the lakes (Lipoveni, Fundea, Mustaca canals) and these lakes with each other; (iv) in 1963–1985, the existing canals were broadened and deepened [37] and a water gate at Portita mouth was built [39]. In 1963, a study was conducted concerning the territorial planning of the Dranov-Razelm-Sinoie Lacuster Complex [40]. This document recommended the closure of the Razim Sinoe Lagoon complex and the transformation of this system into an irrigation reservoir. In this context, in the period 1971–1975 the Portita mouth was closed by a dam [28] and a series of hydraulic works were made to control the communication between Razim Lake and the Black Sea through Sinoe Lake. From 1971 to 1976, the irrigation system was built and consisted of six subsystems. The Sinoe irrigation subsystem, of which the study area is a part, came into operation in 1976. The Sinoe SPA (Supply Pumping Station) covered a surface of 57,162 ha and had a flow rate of 46.1 mc/s. The distribution network had a length of 157.3 km [36]. The irrigation system was in operation from 1976 to 1990. After this year, water demand for irrigation decreased. Under the new property law, a conservation process for the irrigation system began [41,42], resulting in their destruction (over 75% of these arrangements were inoperable in 2016 [42,43]. According with the National Agency for Land Improvement, in 2021 only 10,930 ha were contracted (19%) in the study area and only 1250 ha have been irrigated. All this human intervention modified the hydrological condition of the Nuntasi-Tuzla ecosystem. The former Research and Design Institute for Water Management (the current Aquaproiect Company) shows a high demineralization of lake water from 57.8 g/L (1934) to 1.6 g/L (1982), a decrease in production of therapeutic mud, which was 0 in 1980, and an increase in the fresh water supply through the two tributaries, from 5 mil/mc in 1977 to 15 mil/mc in 1980 [44]. Braier [20] specified in her study that the salinity of this lake decreased due to the freshwater input and to the fact that the connection between this lake and the Istria lake was interrupted.

3.2. Hydrological Drought Analysis

Unfortunately, there are no meteorological or hydrological drought studies for this region. The idea to investigate this area appeared when, in 2020, the Istria town hall informed the authorities that Lake Nuntasi-Tuzla had dried up.
The Nuntasi Tuzla Lake is supplied by the Nuntasi and Sacele Rivers and we assume that there is a breakpoint in the time series data based on the variation of annual discharge presented in Figure 5, which shows a descending trend. As we showed in Section 2.2.1, in order to detect changes in the time series data, we used the annual discharge series for the 1965 to 2020 period. The multiannual average discharge for Nuntasi River is 0.348 m3/s, and is 0.081 m3/s for the Sacele River. It should also be specified that, for the Nuntasi River, the values for 2015 and 2017 are missing.
The hydrological data are not normally distributed, even after several transformations. For the Nuntasi and Sacele annual discharge series, Buishand and Lee and Heghinian tests were not performed. The Pettitt test rejected the null hypothesis H0 = no break for all confidence levels (90%, 95% and 99%) and admitted a break in 1997. The Hubert segmentation procedure detected four break points (1980, 1989, 1997 and 2006). For the Sacele discharge series, the Pettitt test rejected the null hypothesis for all confidence levels and admitted a break point in 2003, whilst the Hubert segmentation detected two break points, one in 1996 and one in 2003. For both Nuntasi and Sacele annual discharge, the breakpoints detected by the Pettitt and Hubert tests corresponded (1997 for the Nuntasi time series and 2003 for Sacele, respectively). As shown in the following table (Table 4), the average calculated for each subseries period detected by the Hubert procedure corresponded to the different stages of hydraulic work implemented in the study region and described in the previous Section 3.1. For the Nuntasi River, during the maximum operating period (1981–1989) of the irrigation system, the average annual discharge is 1.4 times greater than that from the previous period (1965–1980). This increase is due to the infiltration resulting from the irrigation water. The drill installed in the region by the former Land Improvement Office provided an increasing in the aquifers level [36]. Moreover, after 1989 the multiannual discharge for the period 1990–1997 returned to the baseline (1965–1980) and continued to decrease, reaching a dangerous level (6.75 times less than the average annual discharge for the 1965–1980 period). The same behavior was seen in the Sacele River, but the decrease was only by 3.1 times. Based on this situation, in order to detect hydrological drought using the two procedure described in the Section 2.3 (TLM and SPA, respectively) we used the daily discharge time series data for the 2007–2020 period.
Firstly, we construct the FDC by plotting the empirical cumulative frequency (EFQ) of the river daily discharge against exceedance frequency. Figure 6 shows the FDC for the Nuntasi River.
The difference between Q95%, Q90%, Q80% and Q75% is small (Table 5). In this context we chose as threshold (Qo) the value corresponding to Q90% for both rivers.
For a threshold value of 0.03 (Q90%), the TLM identified not only major droughts but also minor droughts (Figure 7). There are 11 periods of hydrological drought in total (Table 6) and the driest years are 2013 and 2020 with 16% and 20% deficit, respectively, of the period investigated. For the Sacele river, only two hydrological drought periods have been detected, in 2019 (4 days) and 2020 (4 days).

3.3. Remote Sensing Analysis

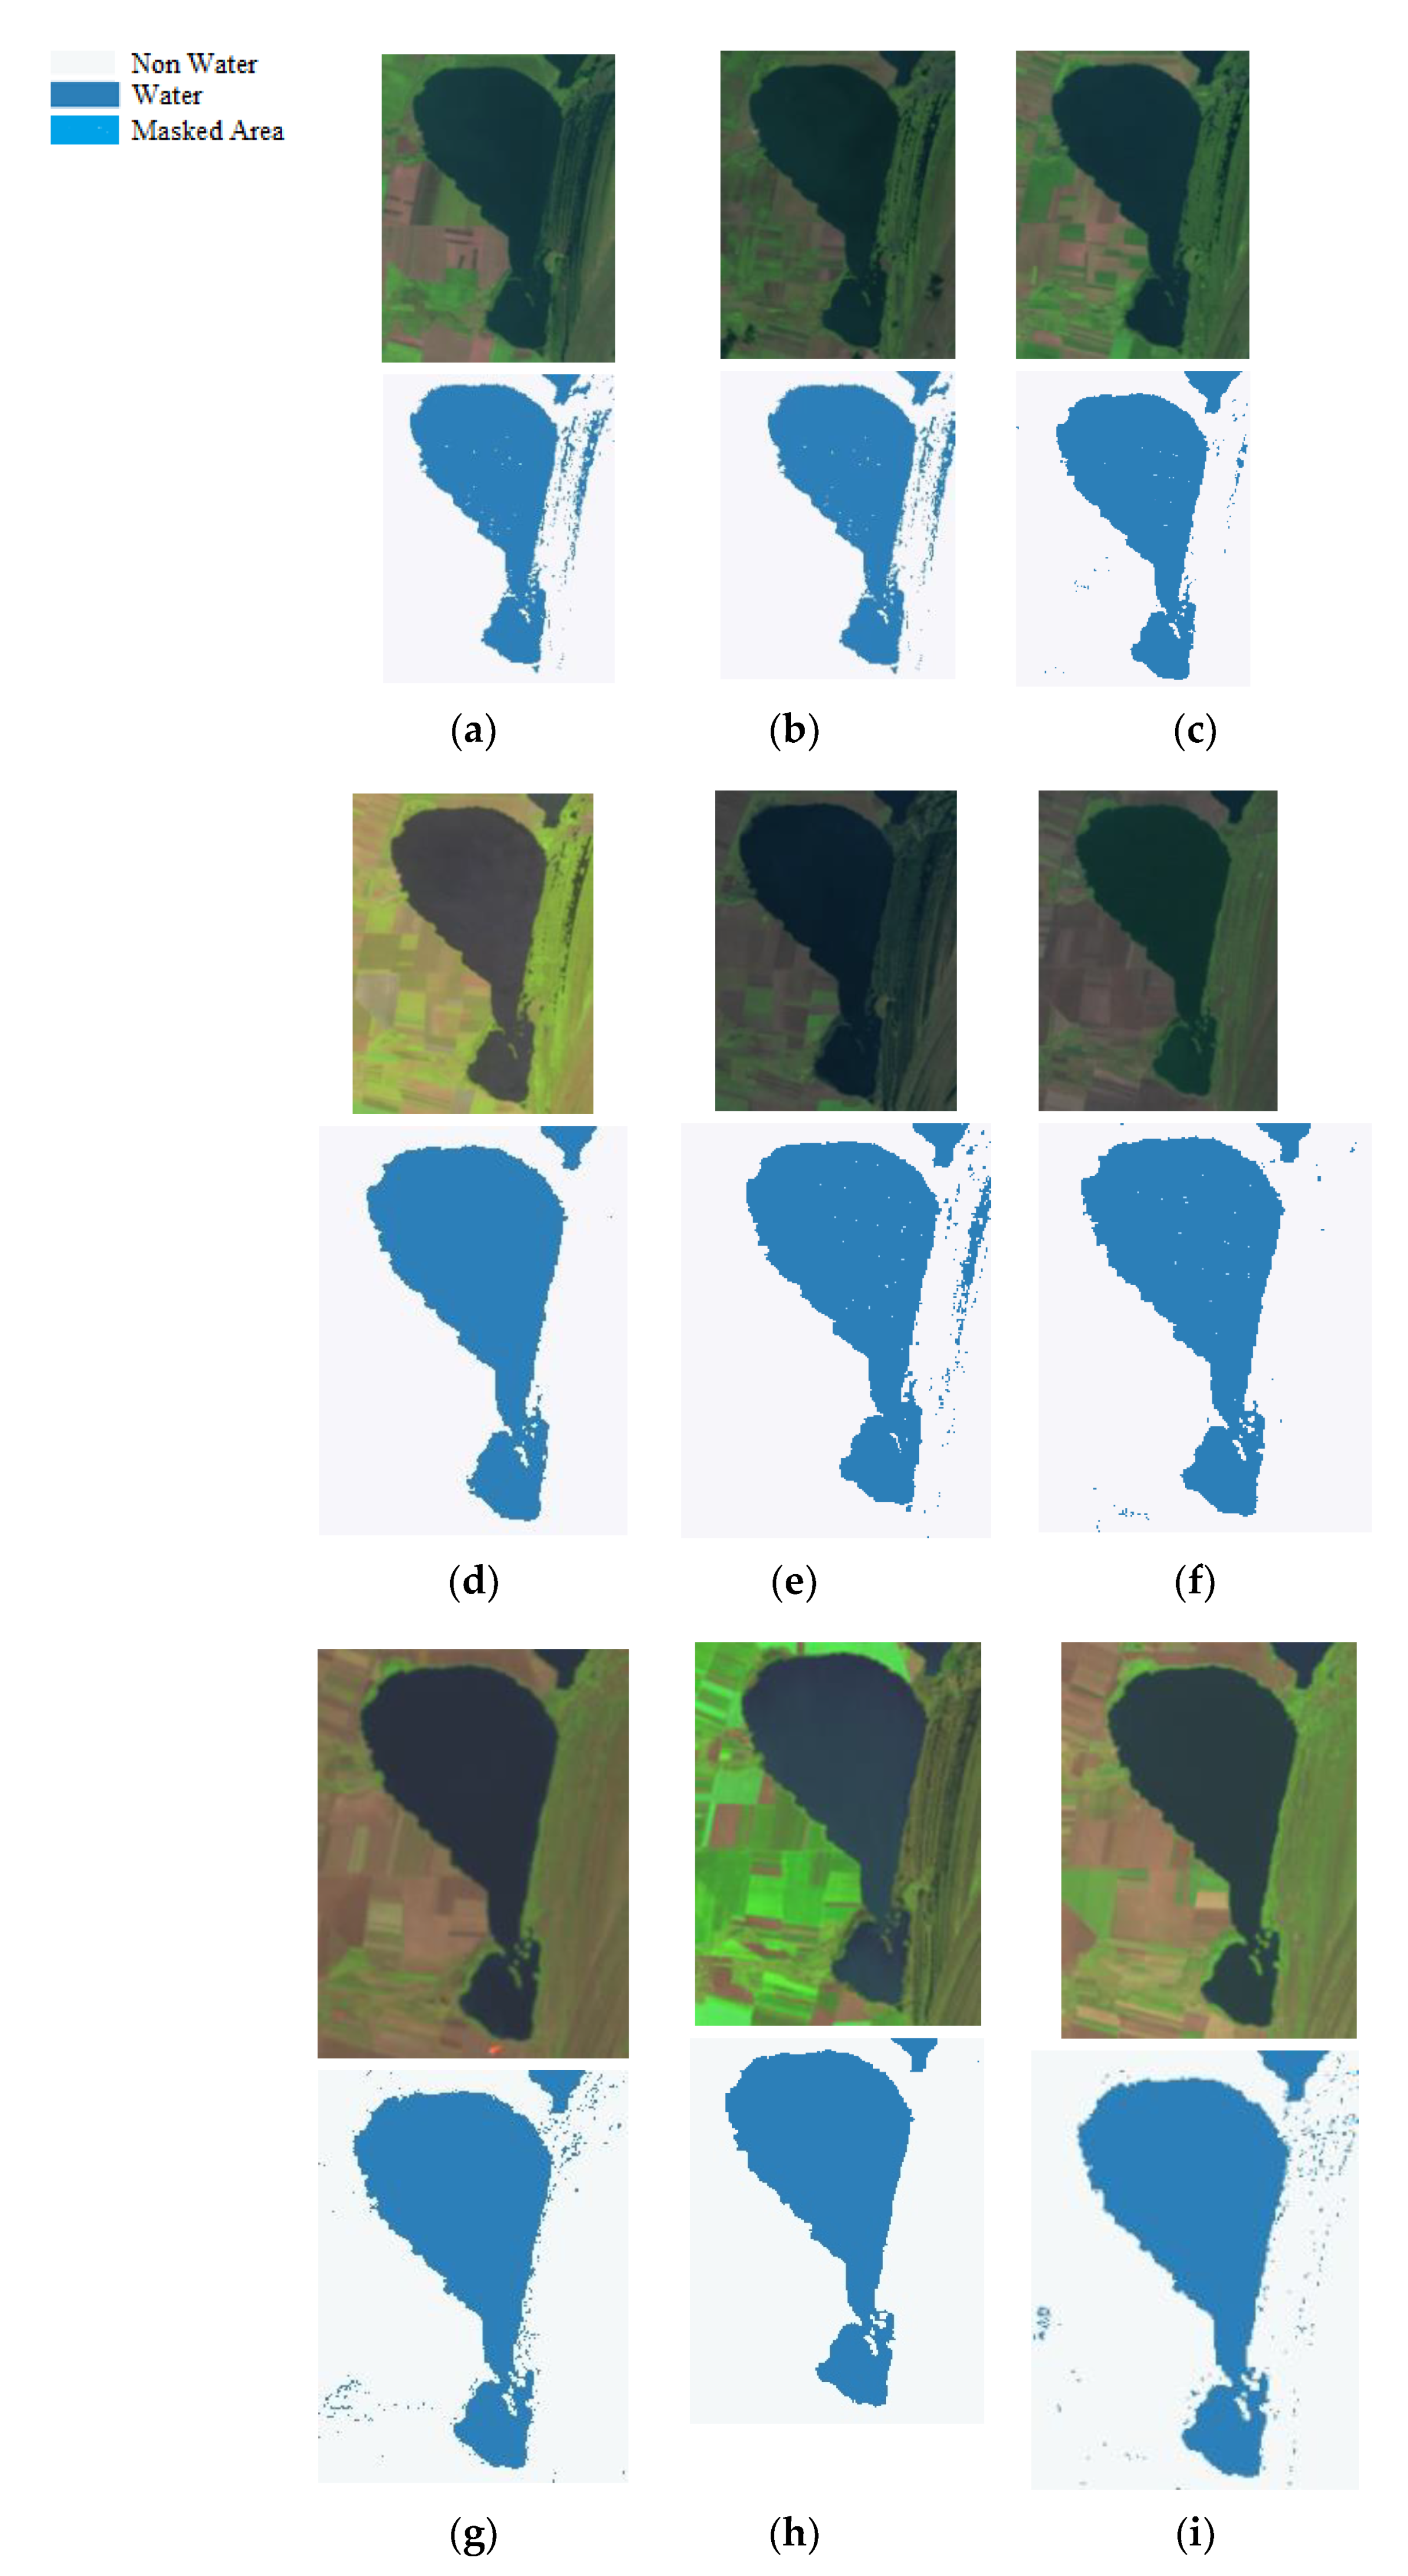
3.3.1. Accuracy Assessment

Table 7 presents the confusion matrix of seasonal surface water detection results for the selected imagery introduced in Table 3. The overall accuracy (OA), Kappa coefficient, producer accuracy (PA) and user accuracy (UA) [45] of the surface water mapping are above 90%. On that account, the approach presented in this paper can be considered one of the optimal methods for surface water extraction for the study area (Figure 8).
Similarly, an accuracy verification procedure was applied on MODIS extracted surface water results (Table 8). The confusion matrix provided accuracies of higher than 90%, proving that the trained classification algorithm could effectively detect surface water from the MODIS dataset.
Further, in order to evaluate the effectiveness of the surface water detection results from the MODIS dataset for 2012, a correlation analysis was performed for the period 2000–2011 between the MODIS and Landsat results. The multiple correlation coefficient of surface water between Landsat and MODIS was 0.97 and the coefficient of determination (R-squared) was 0.95 (Figure 9), showing that the surface water results from the MODIS dataset closely correspond to those from Landsat. On that account, the surface water detected from MODIS can effectively be used for seasonal change analysis of the surface water cover in the study area.

3.3.2. Seasonal Water Surface Variation

Figure 10 shows the variation of the seasonal average surface water from 1984 to 2021 of Nuntasi-Tuzla Lake.
The largest seasonal average value from 1984–1999 period was recorded in autumn 1995 (Figure 11a), and the minimum was determined in autumn 1989 (Figure 11b). For the 2000–2012 period, the maximum average surface water was estimated in summer 2001 (Figure 11c), and the minimum in summer 2012 (Figure 11d). For the last period considered, 2013–2021, the largest seasonal average surface water was determined in spring 2019 (Figure 11e), and the smallest in autumn 2020 (Figure 11f). Figure 12a,b show the lake surface maps overlaid to produce lake surface area changes maps for the periods investigated.
The Hubert test detected five subseries in the seasonal water surface data series (in summer 1991, spring 2012, spring 2013, summer 2019 and summer 2020) which coincide with the detection in the flow data series of the Nuntasi and Sacele Rivers and full irrigation system operation.
The seasonal average surface water was approximately 992 ha from 1984 to summer 1991, and increased by 4%, on average, after 1991. It did not then suffer significant changes until spring 2012 (Figure 10). Figure 12c shows the maximum growth of surface water area, 11.34%, from the smallest area in autumn 1989 to the largest in summer 2001. In summer 2012, the extracted surface water area decreased by 16.57% compared to the previous season, and it further reduced considerably till summer 2013 (Figure 11g), when the lake surface reached 670 ha, approximately. Figure 12d shows the decrease in surface water area from spring 2013 to summer 2013. Following 2014, the seasonal average surface water area increased steadily until spring 2019 (Figure 11e). Figure 12e shows the decrease in water area from spring 2019 to autumn 2019.
On average, the surface water from 2013 to spring 2020 decreased by about 9.26% compared to values from 2000 to 2012 and by 8.86% compared to the 1984–1999 period. In summer and autumn of 2020, it dramatically decreased by 18.76% and 57.83%, respectively, compared to the average surface water of previous years.
It is noted that the periods with the lowest values for lake surface coincide with the prolonged drought periods determined according to the TLM method (Table 6).

4. Conclusions

The main purpose of this study was to detect via remote sensing techniques the long-term variation of the Nuntasi-Tuzla Lake surface water during the 1984–2021 period in correlation with human intervention and climate change. We have reached several conclusions:
(i)
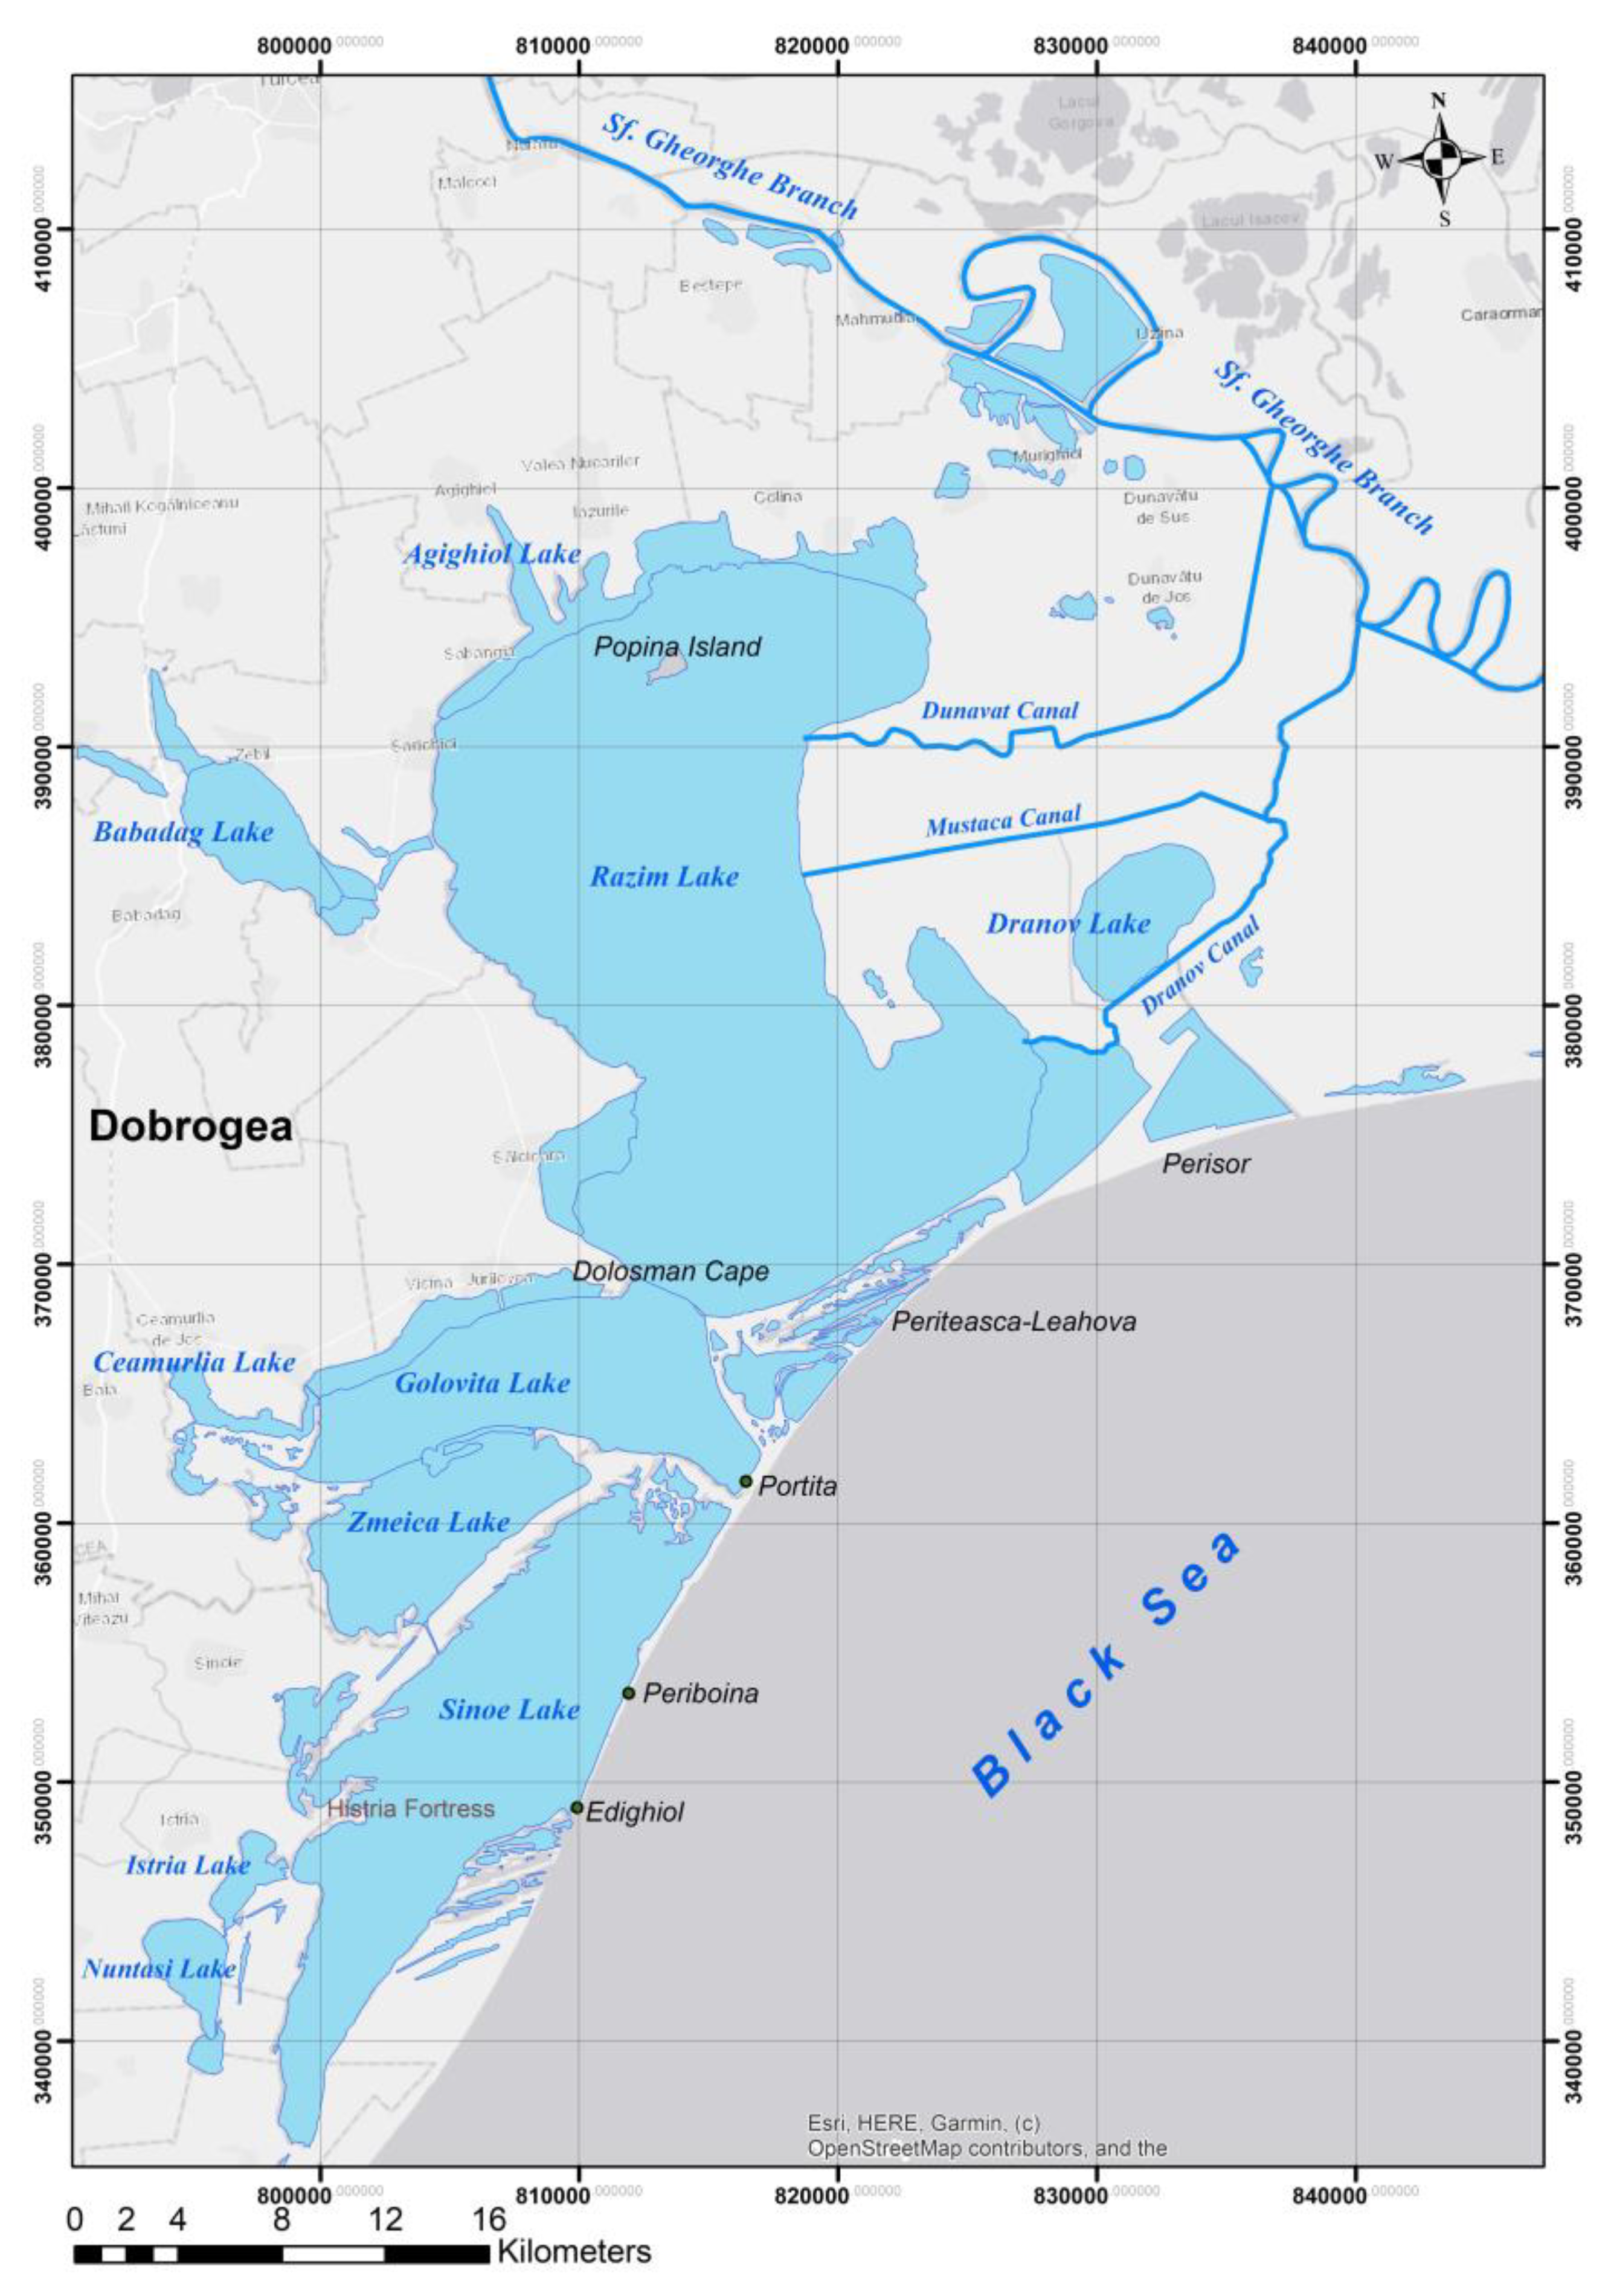
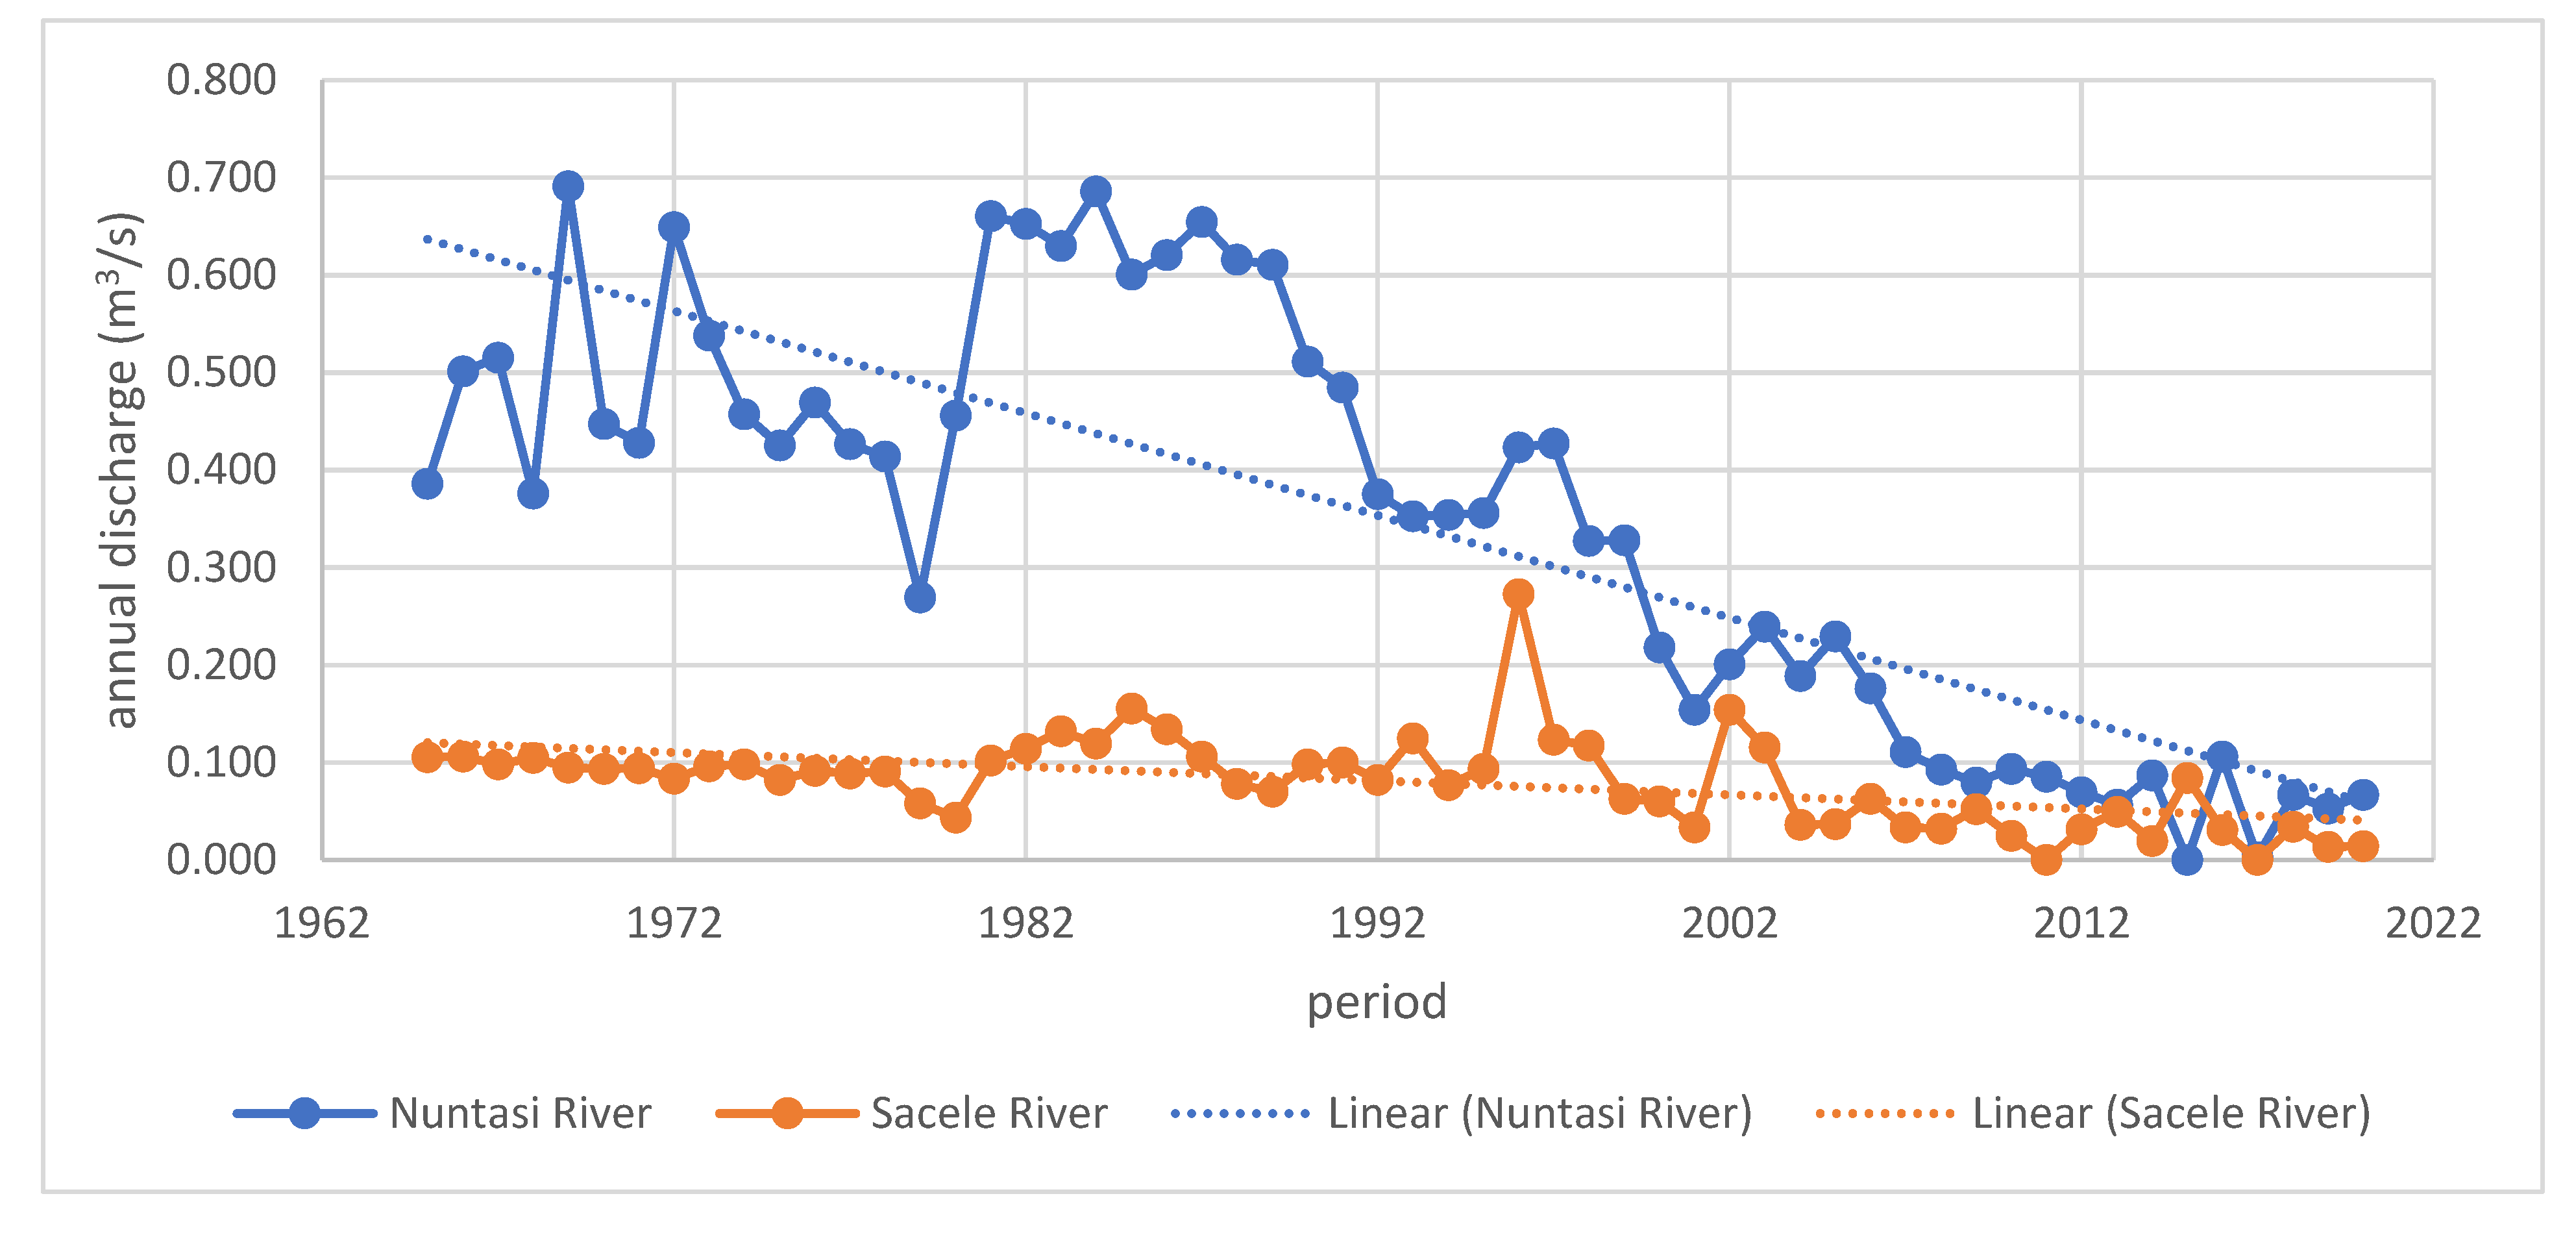
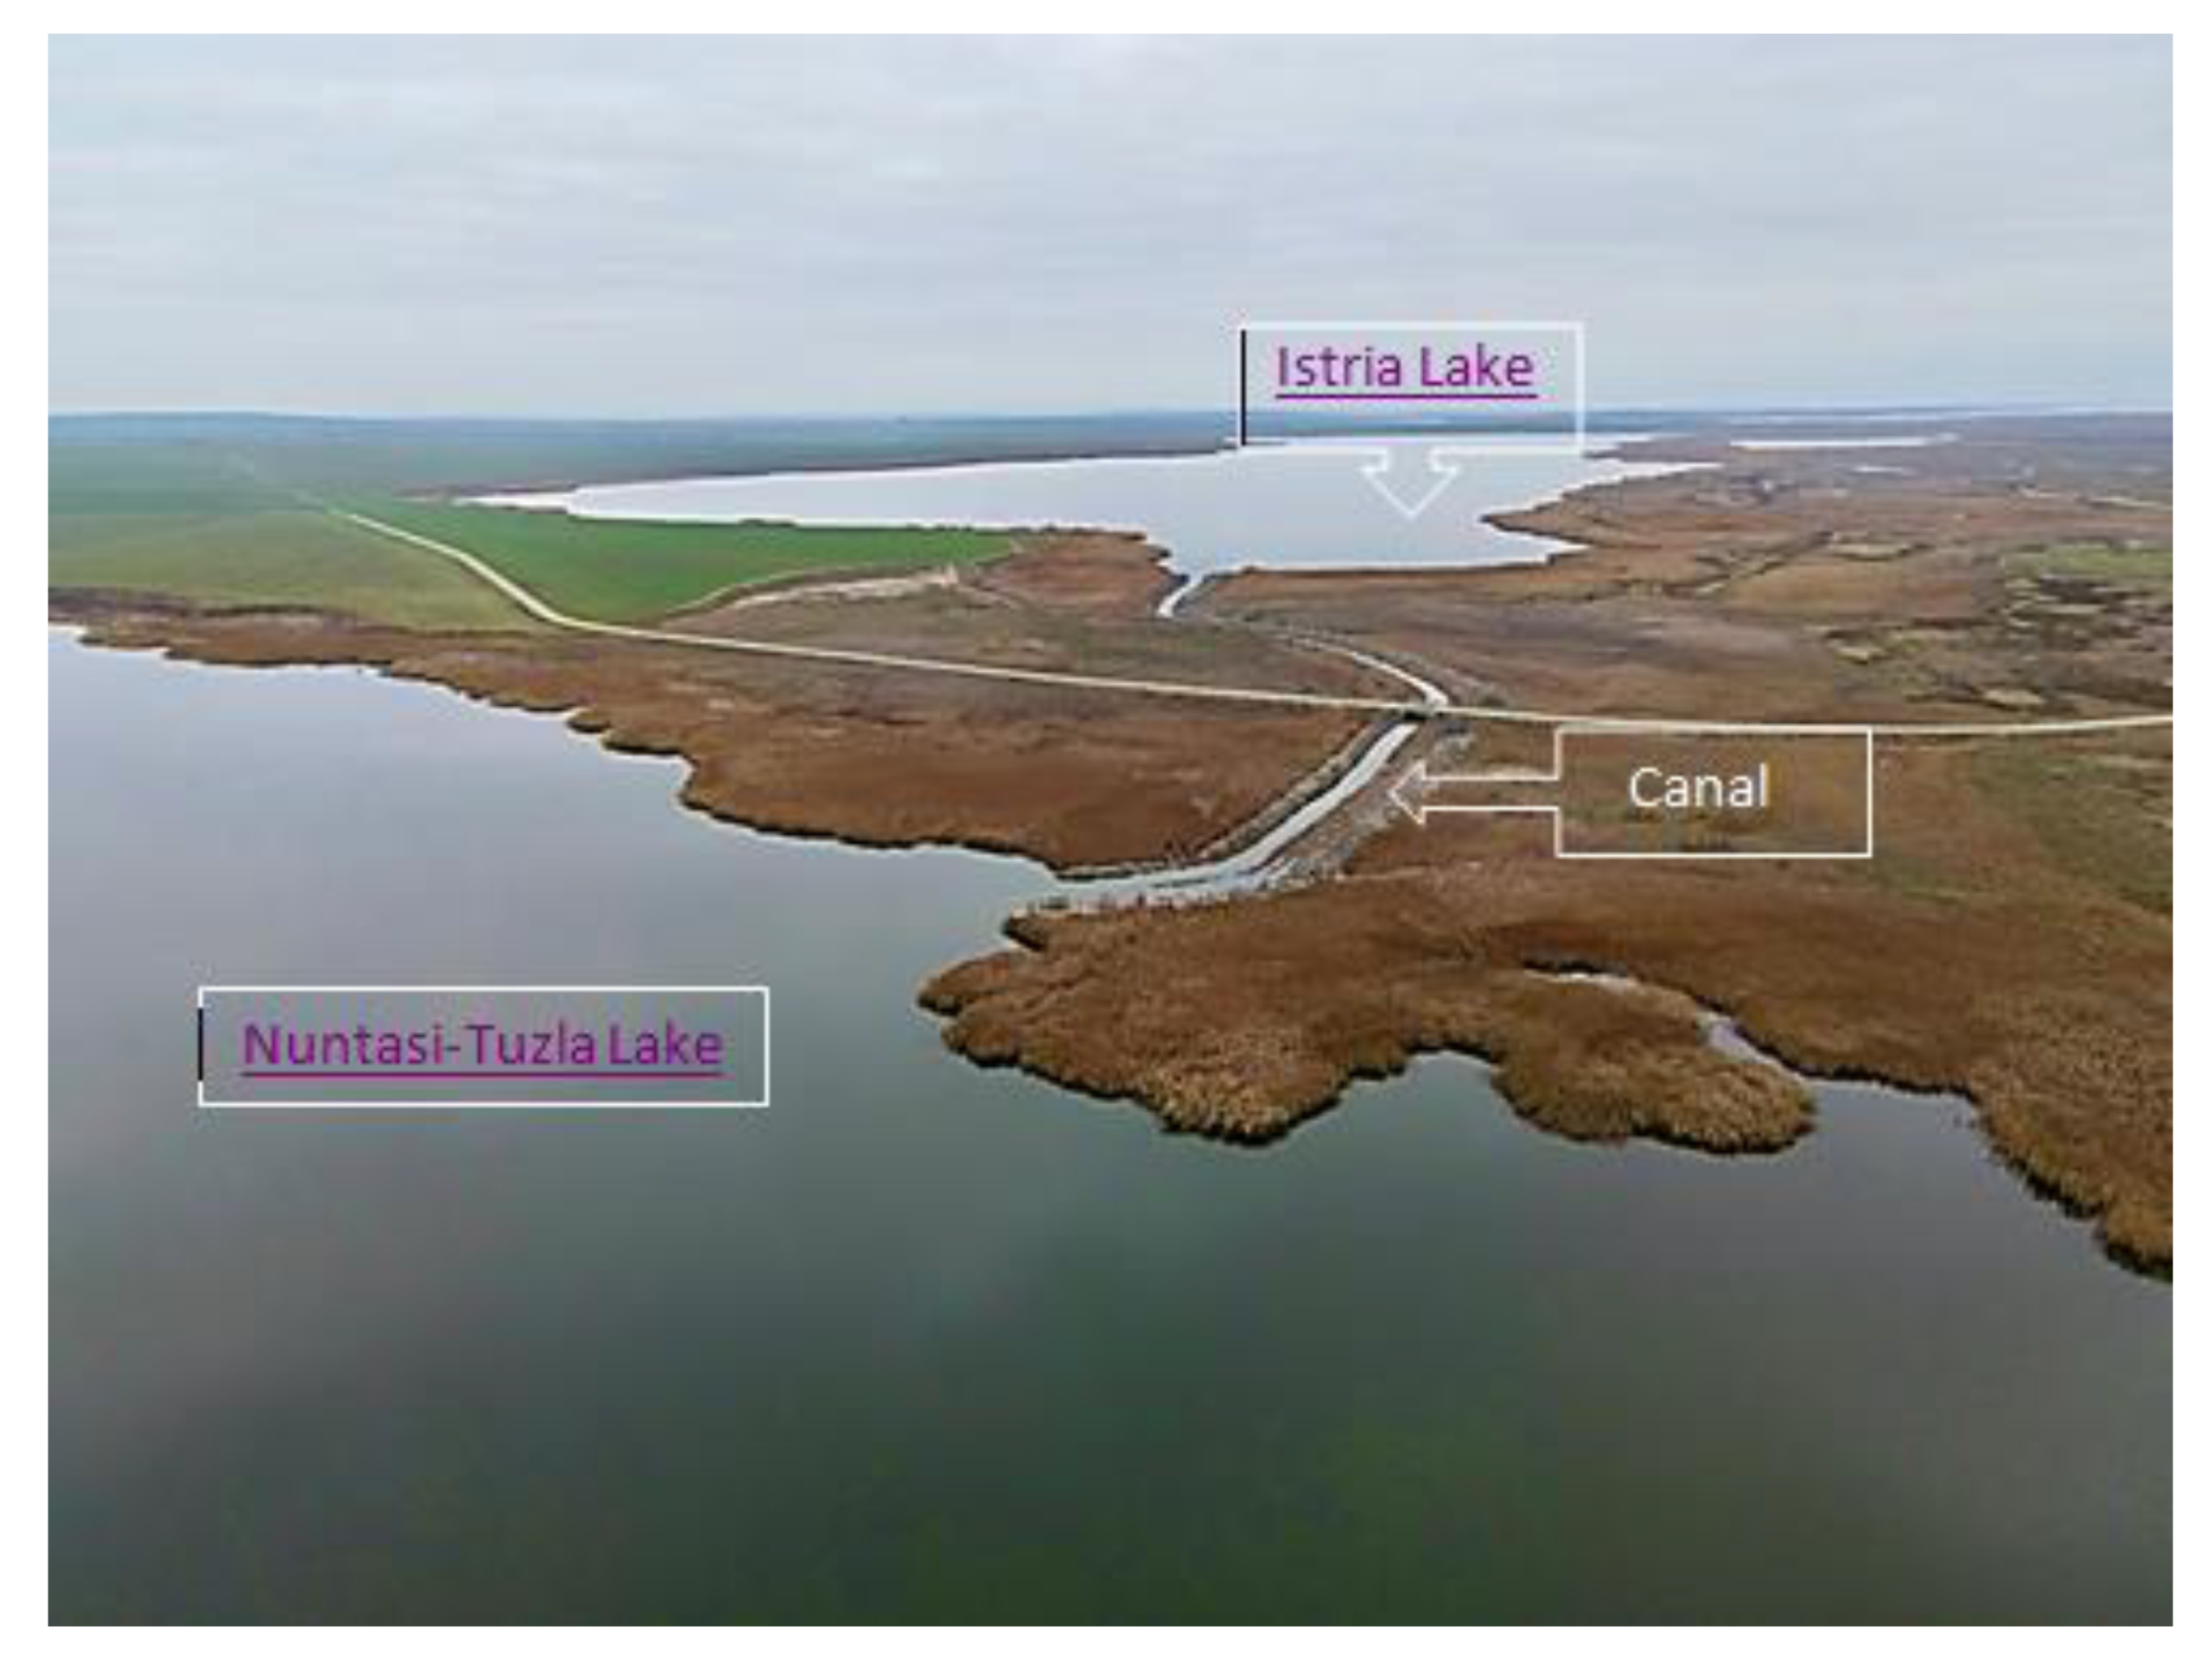
In natural conditions, the lake system is connected to the Black Sea via the Portita, Periboina and Edighiol outlets (Figure 2) and with the St George Arm of the Danube River via a system of canals and marshes. The nine lakes which compose the Razim Sinoe System are interconnected by the above mentioned system of canals. Human intervention has led to a deterioration of the ecosystem of the entire Razim Sinoe system, which has been isolated from the Black Sea, and the connections between the lakes have been cut by sluices. In this context, the water became freshwater. The cannal between Nuntasi-Tuzla Lake and Istria Lake has been silted since 1976. In view of the fact that the Dobrogea region is the driest region of Romania [35] and in order to ensure agricultural development, the state authorities from the period 1968–1975 built an important irrigation system in this region. In the irrigation period, the two tributaries (Nuntasi and Sacele rivers) have supplied the lake constantly, but after 1990, when the irrigation was stopped, the river flow decreased over time reaching its lowest level in the 2004 (2007)–2020 period. In a recent publication, the authors [21] showed that “the precipitation increased starting with 2012 but the evapotranspiration losses are much larger than the precipitation increase”. We can conclude that the budget is negative. It is apparent that the surface lake may be a subject of irreversible changes.
(ii)
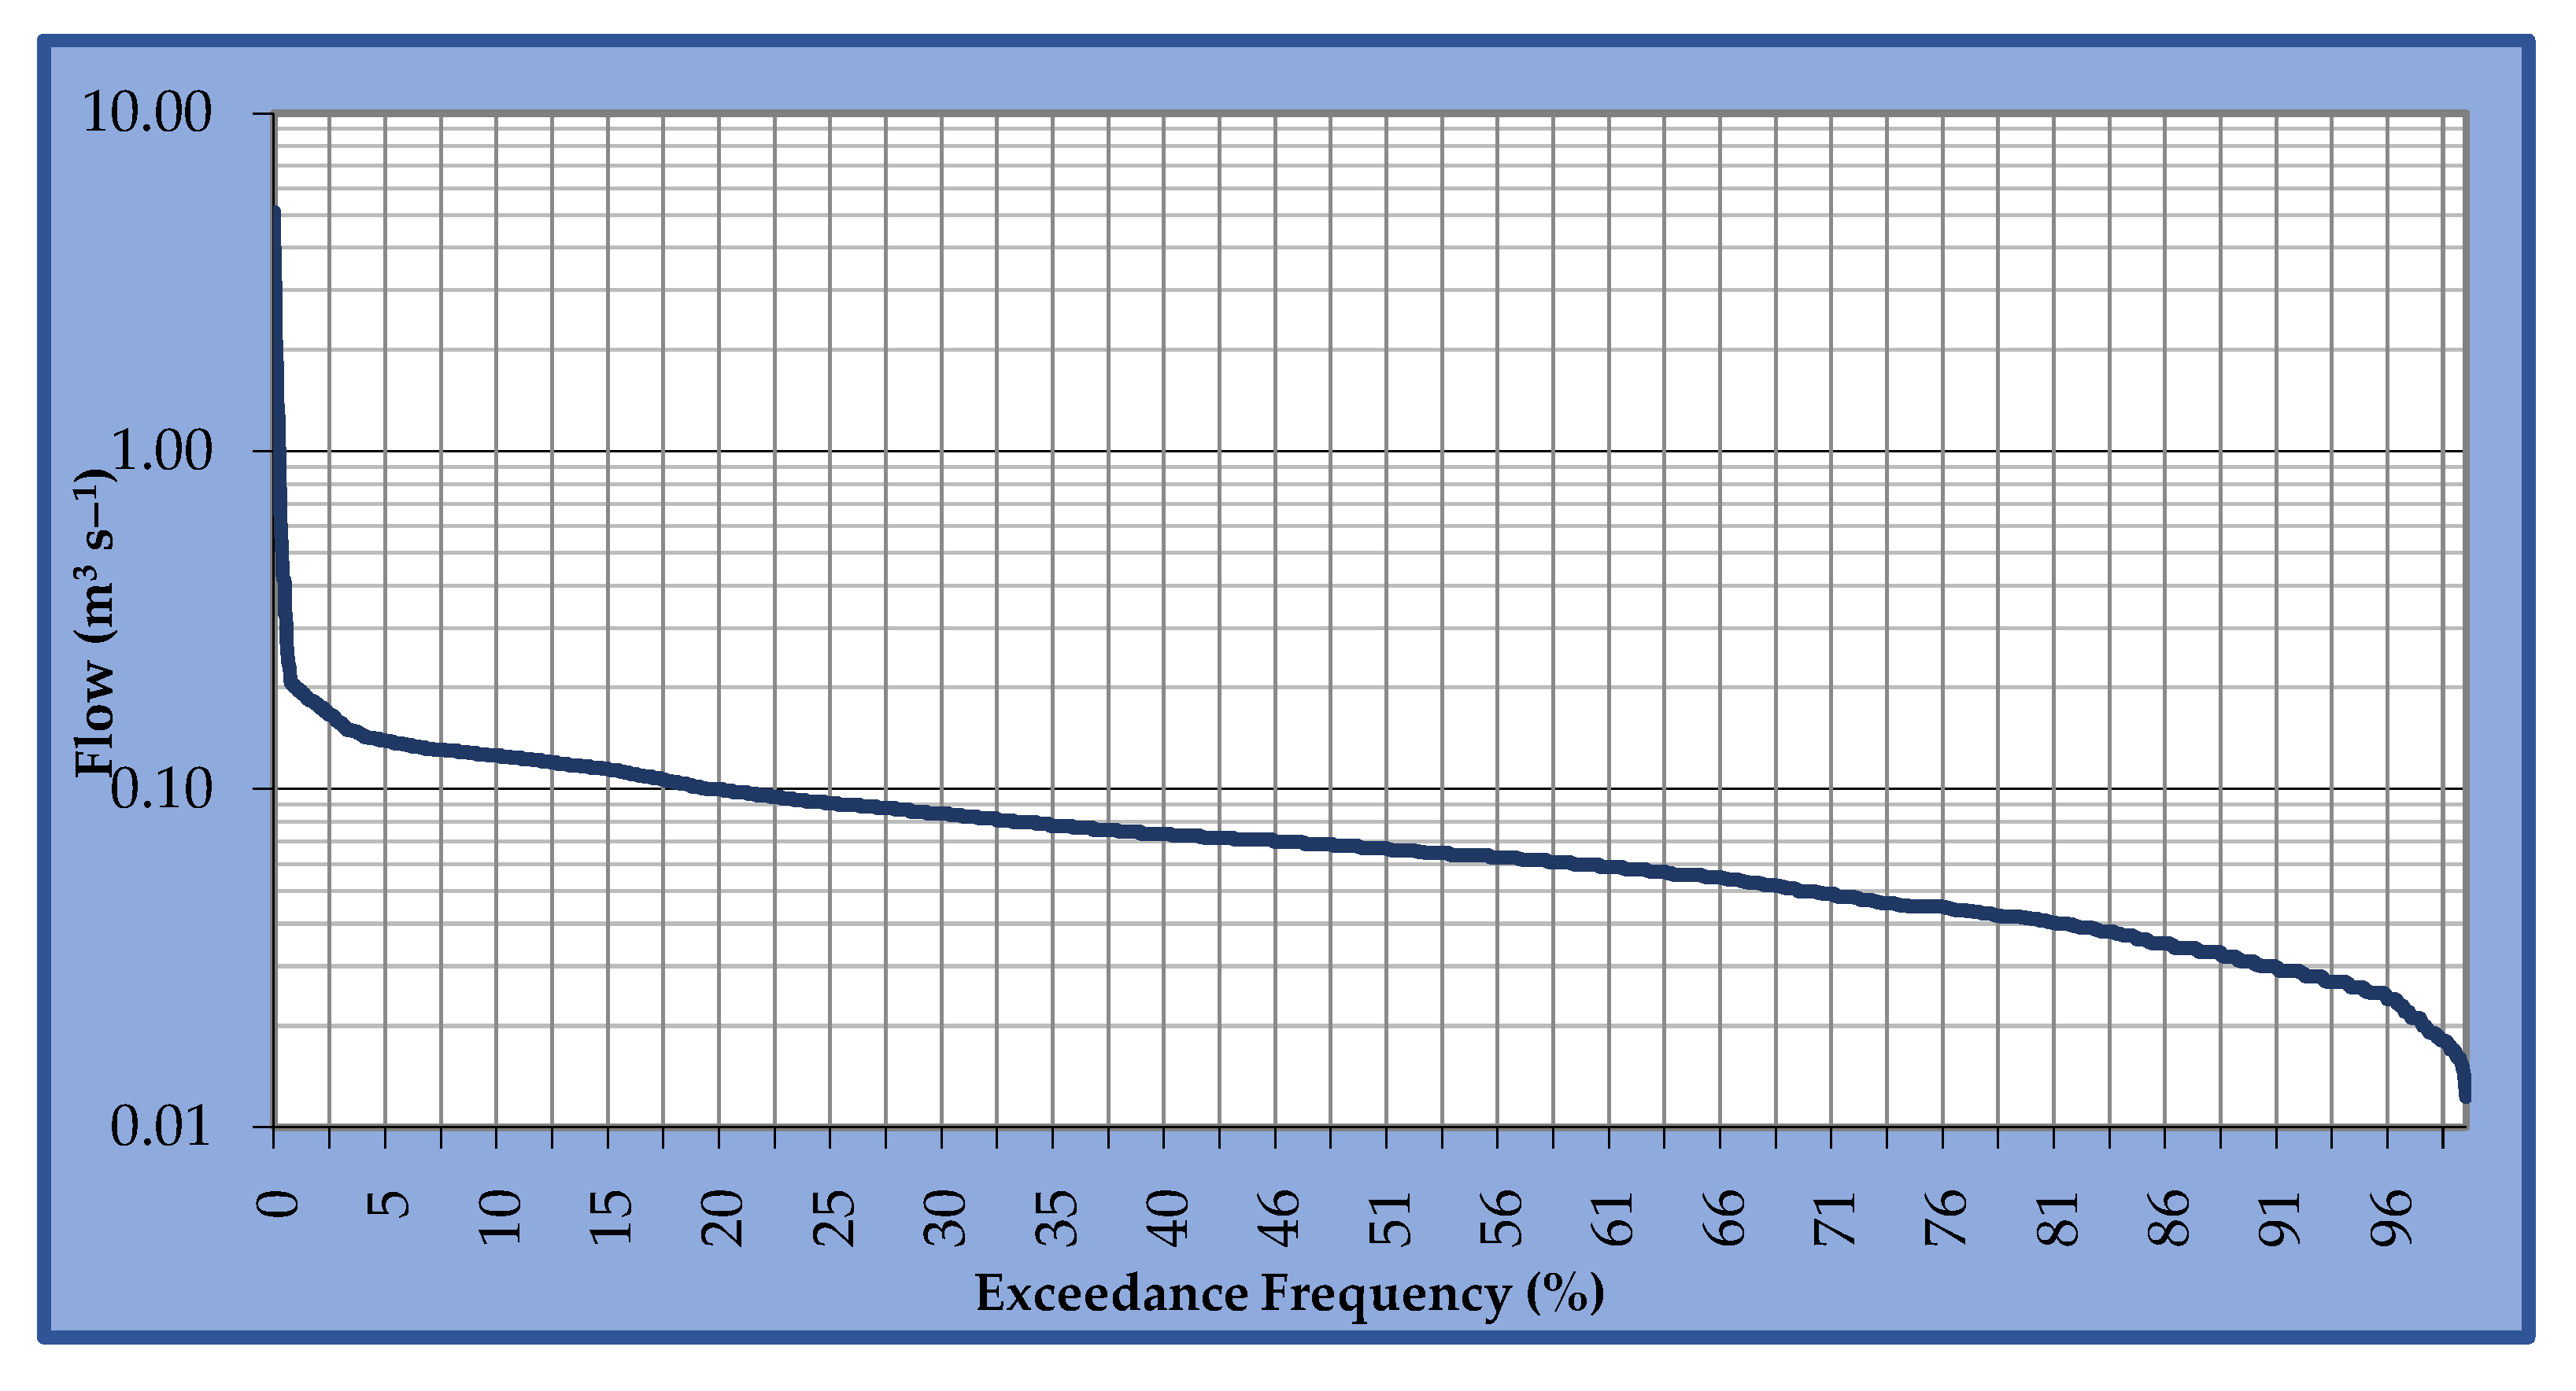
The analysis of the daily flows of the two rivers during the 2007–2020 period detected several important drought events. Among these, two drought periods with long duration were determined, in 2013 and 2020. In this context, we further investigated if there was any influence of flow decreasing on the lake water surface and if there have been any other similar situations in the past.
(iii)
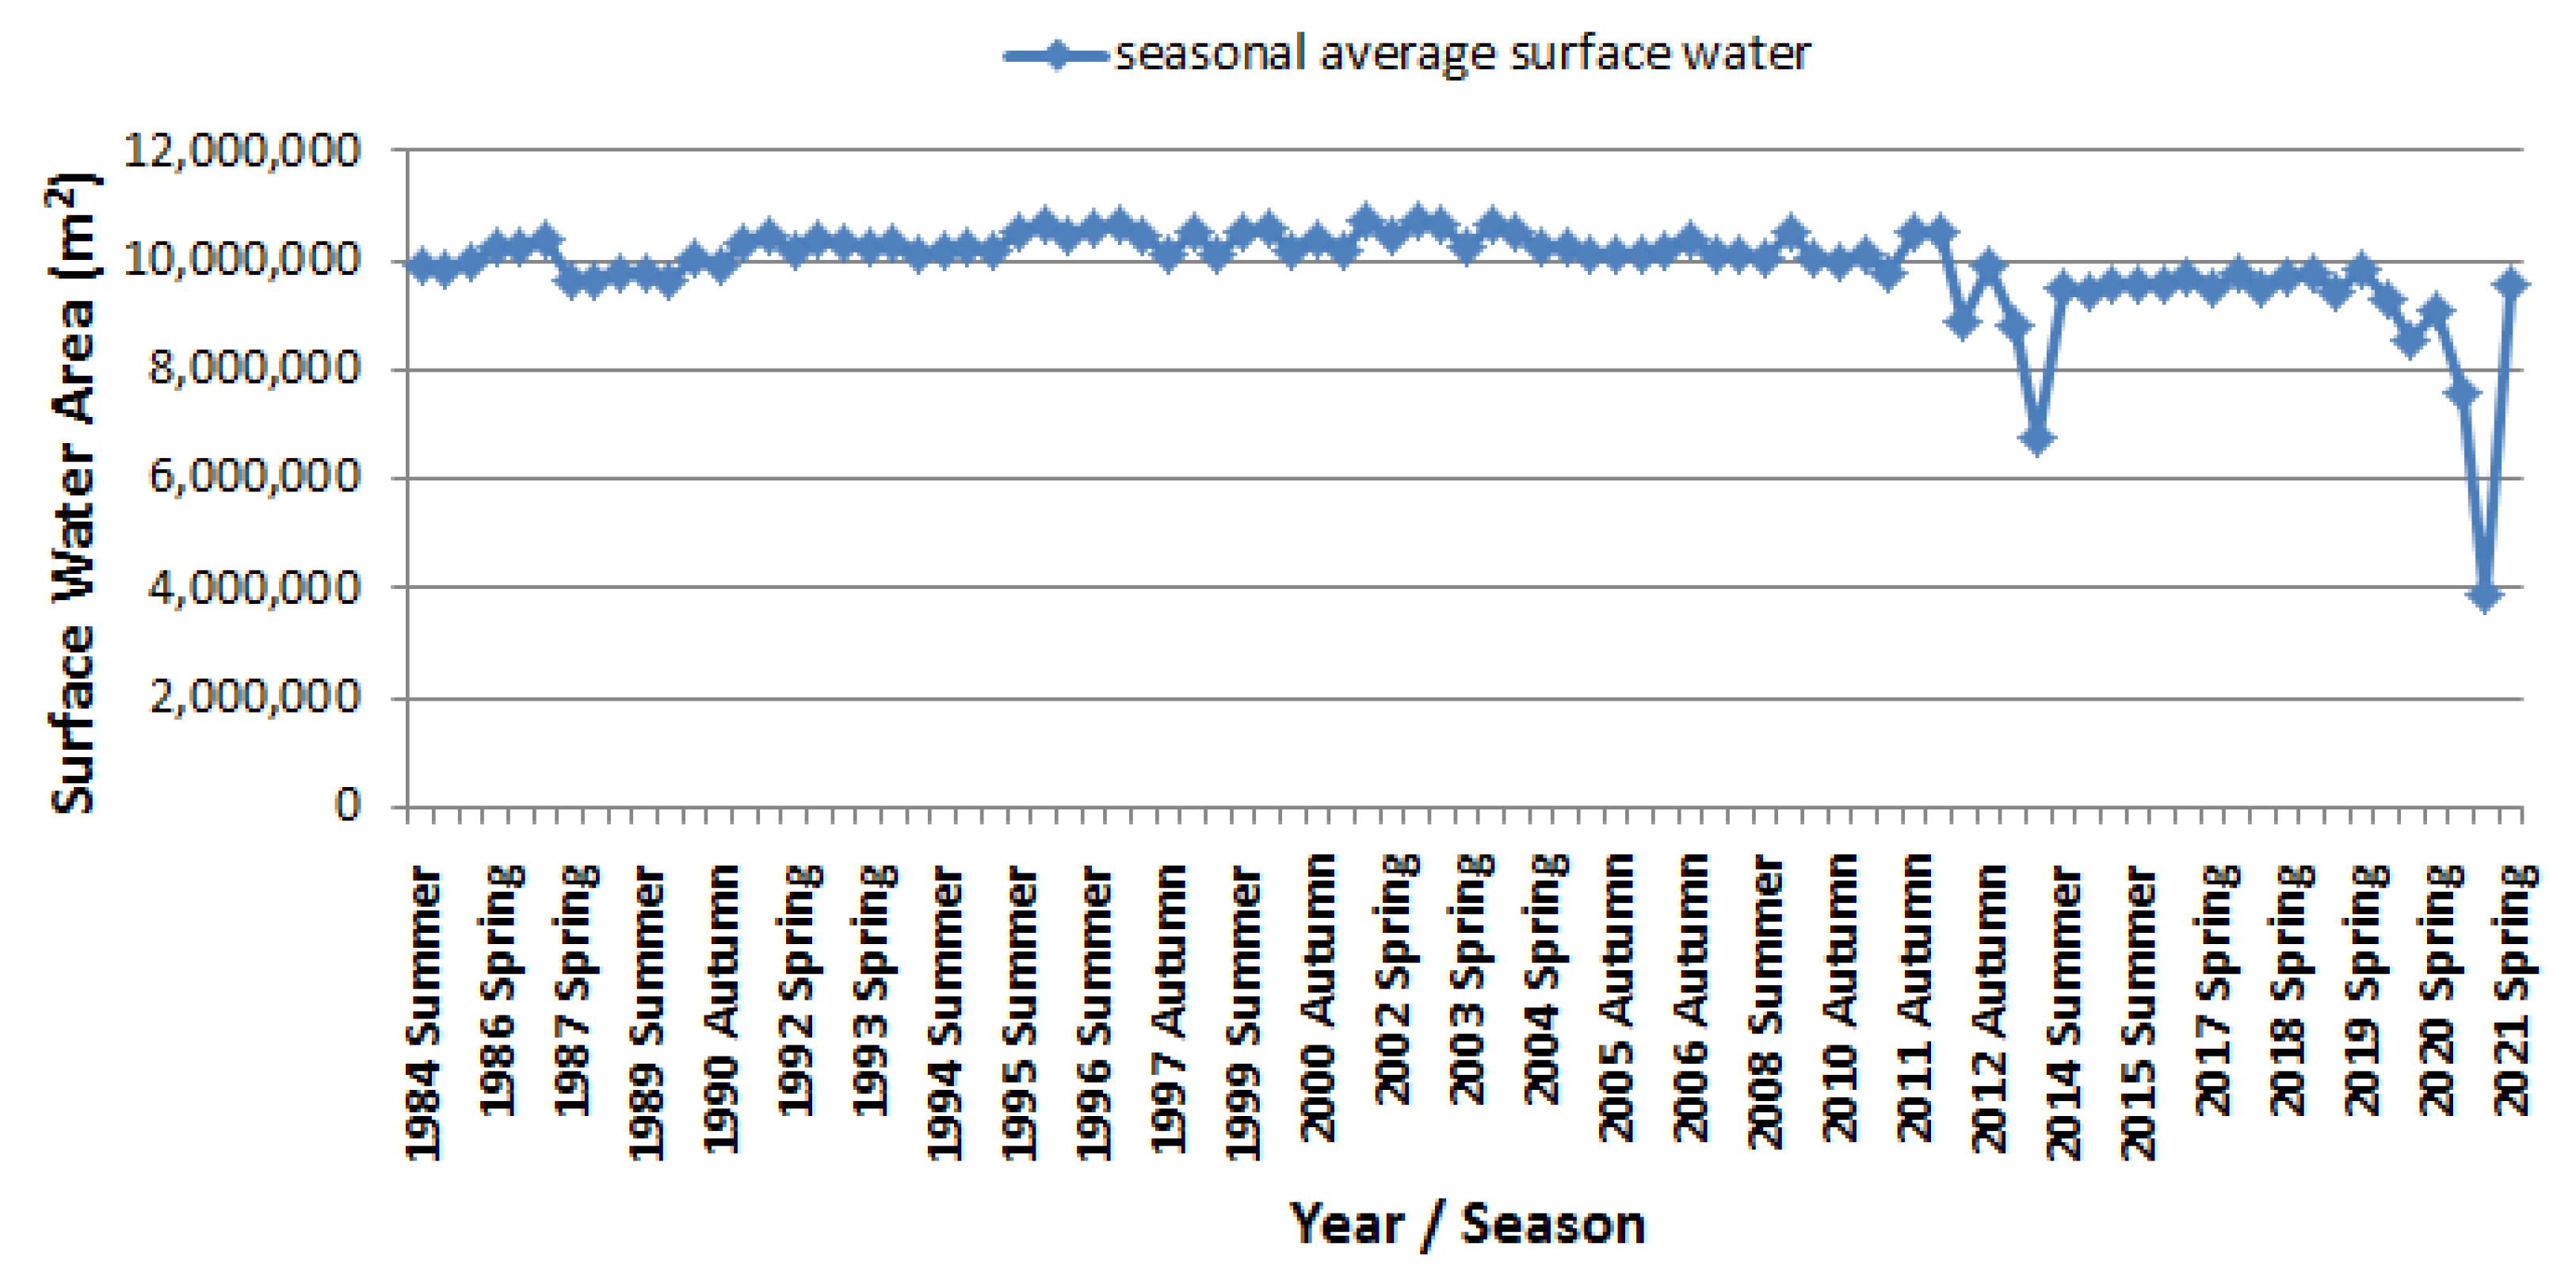
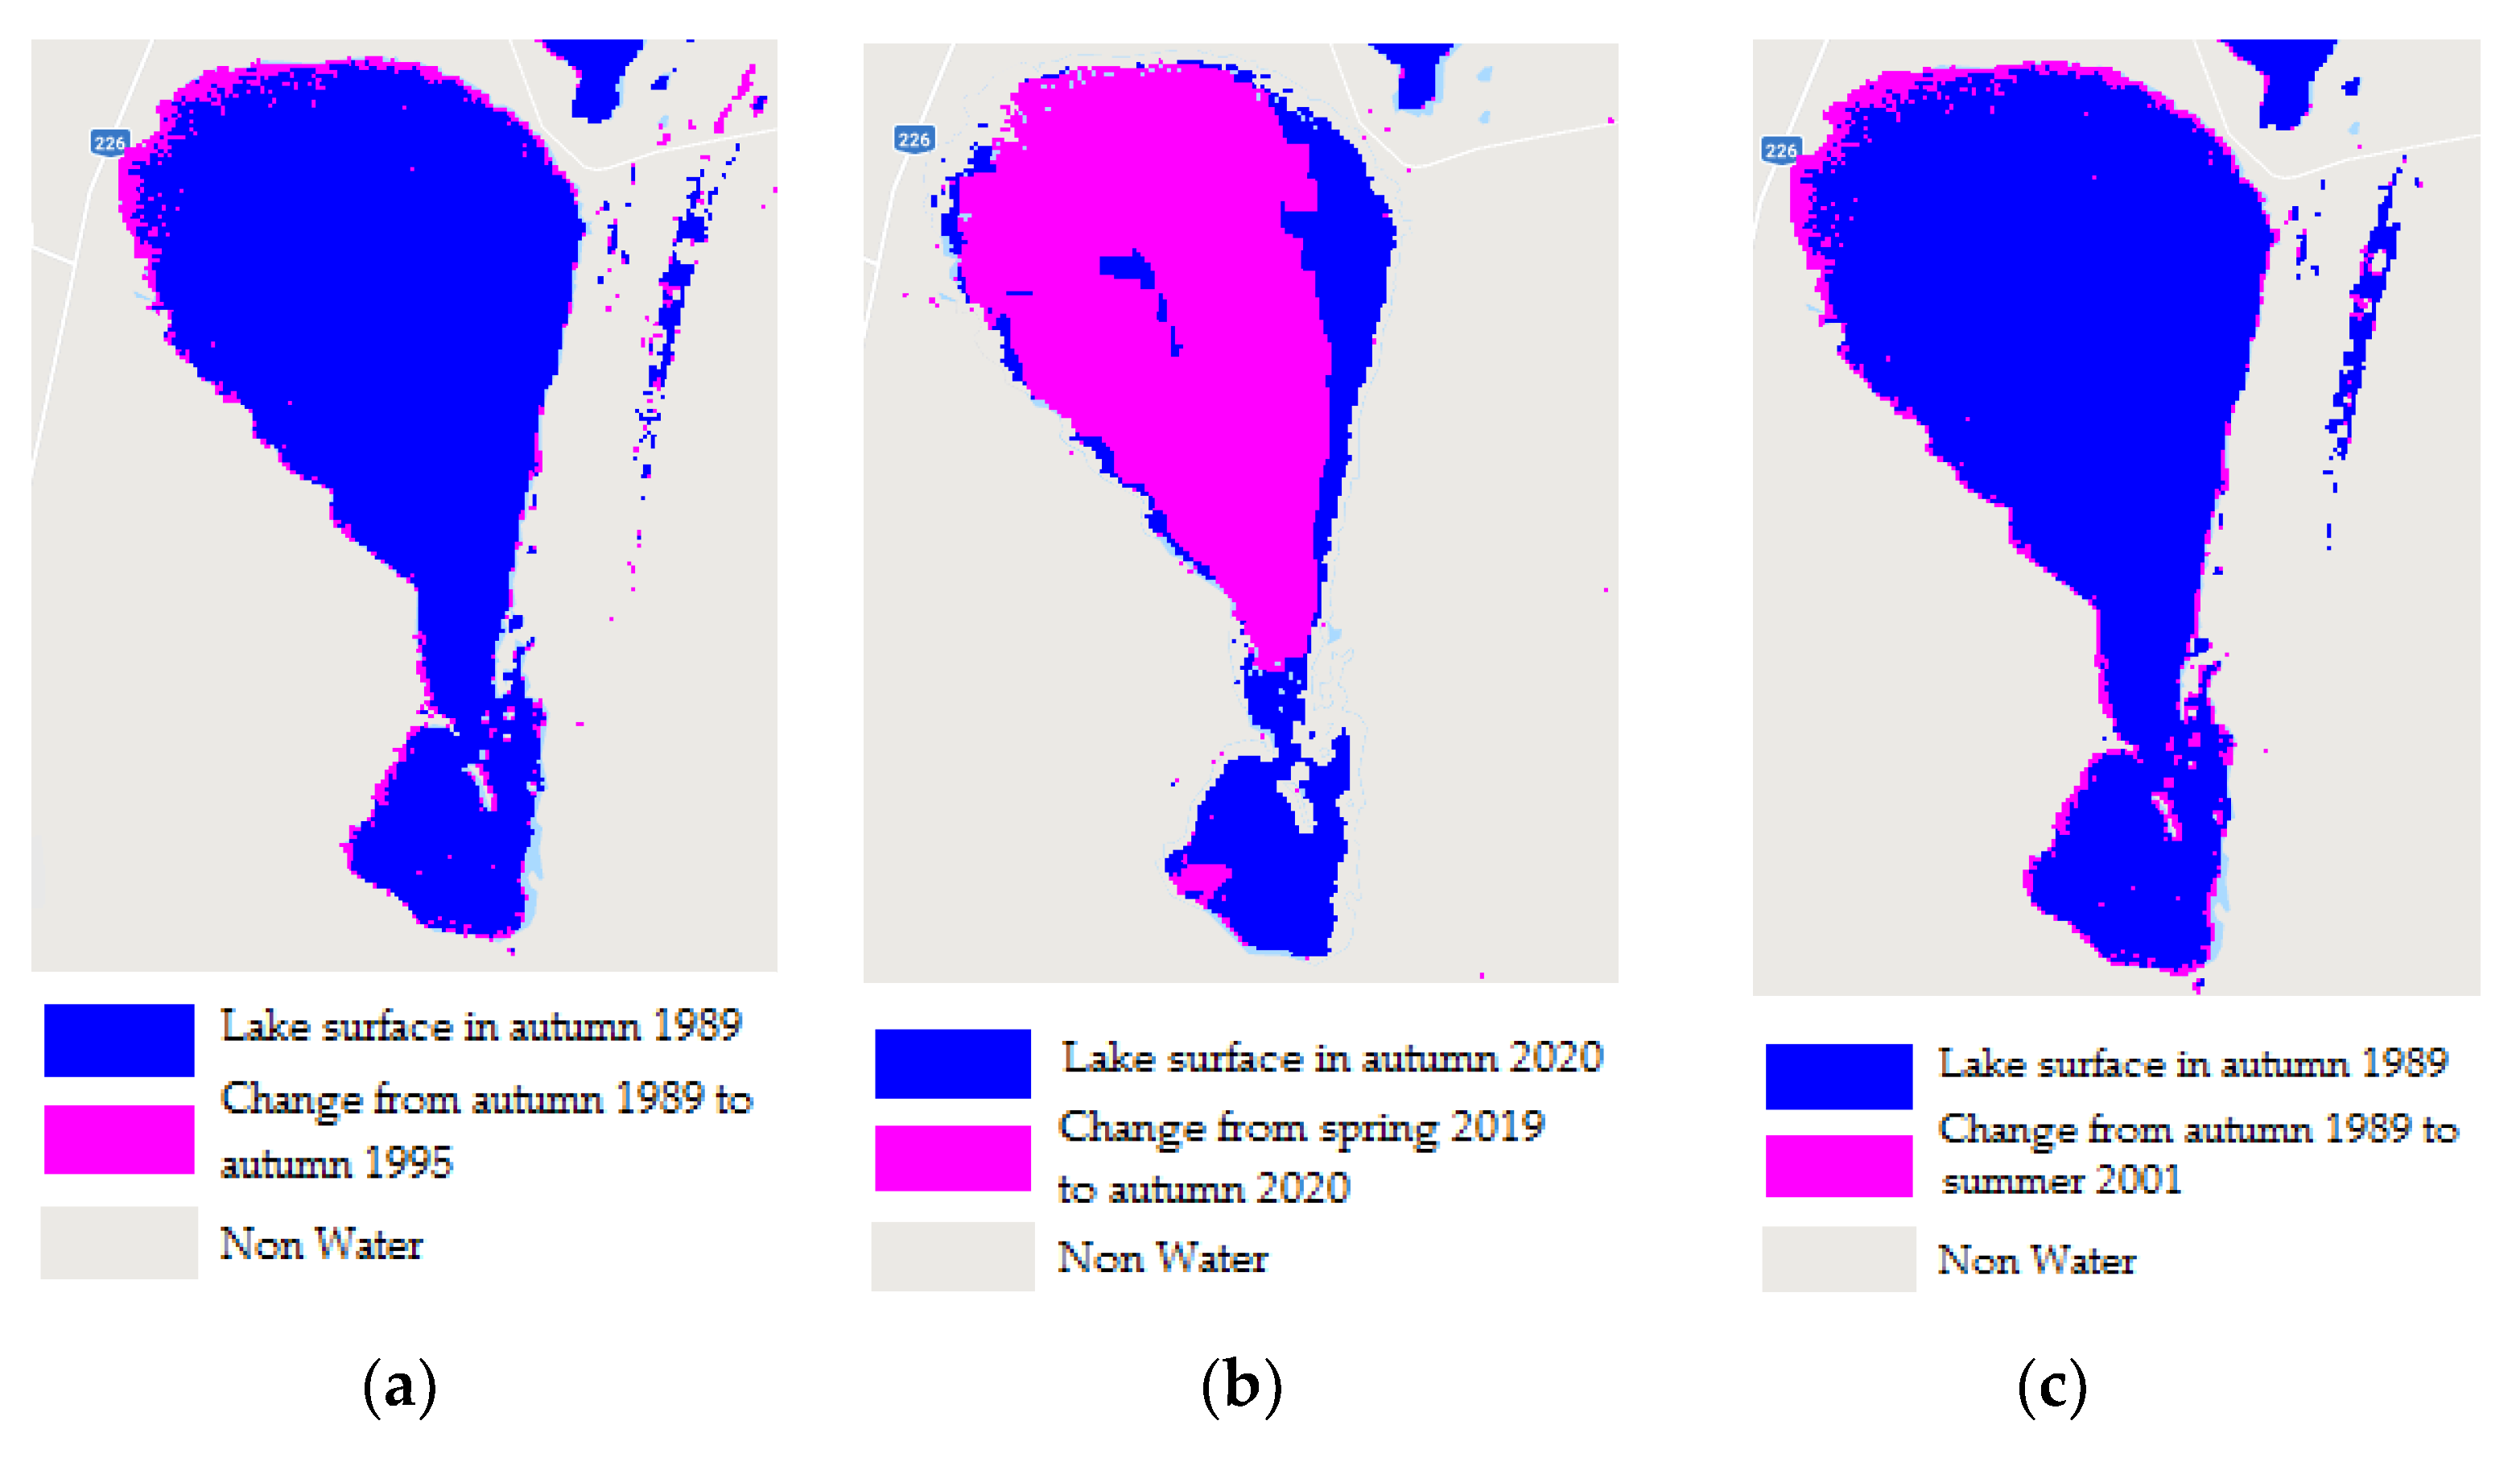
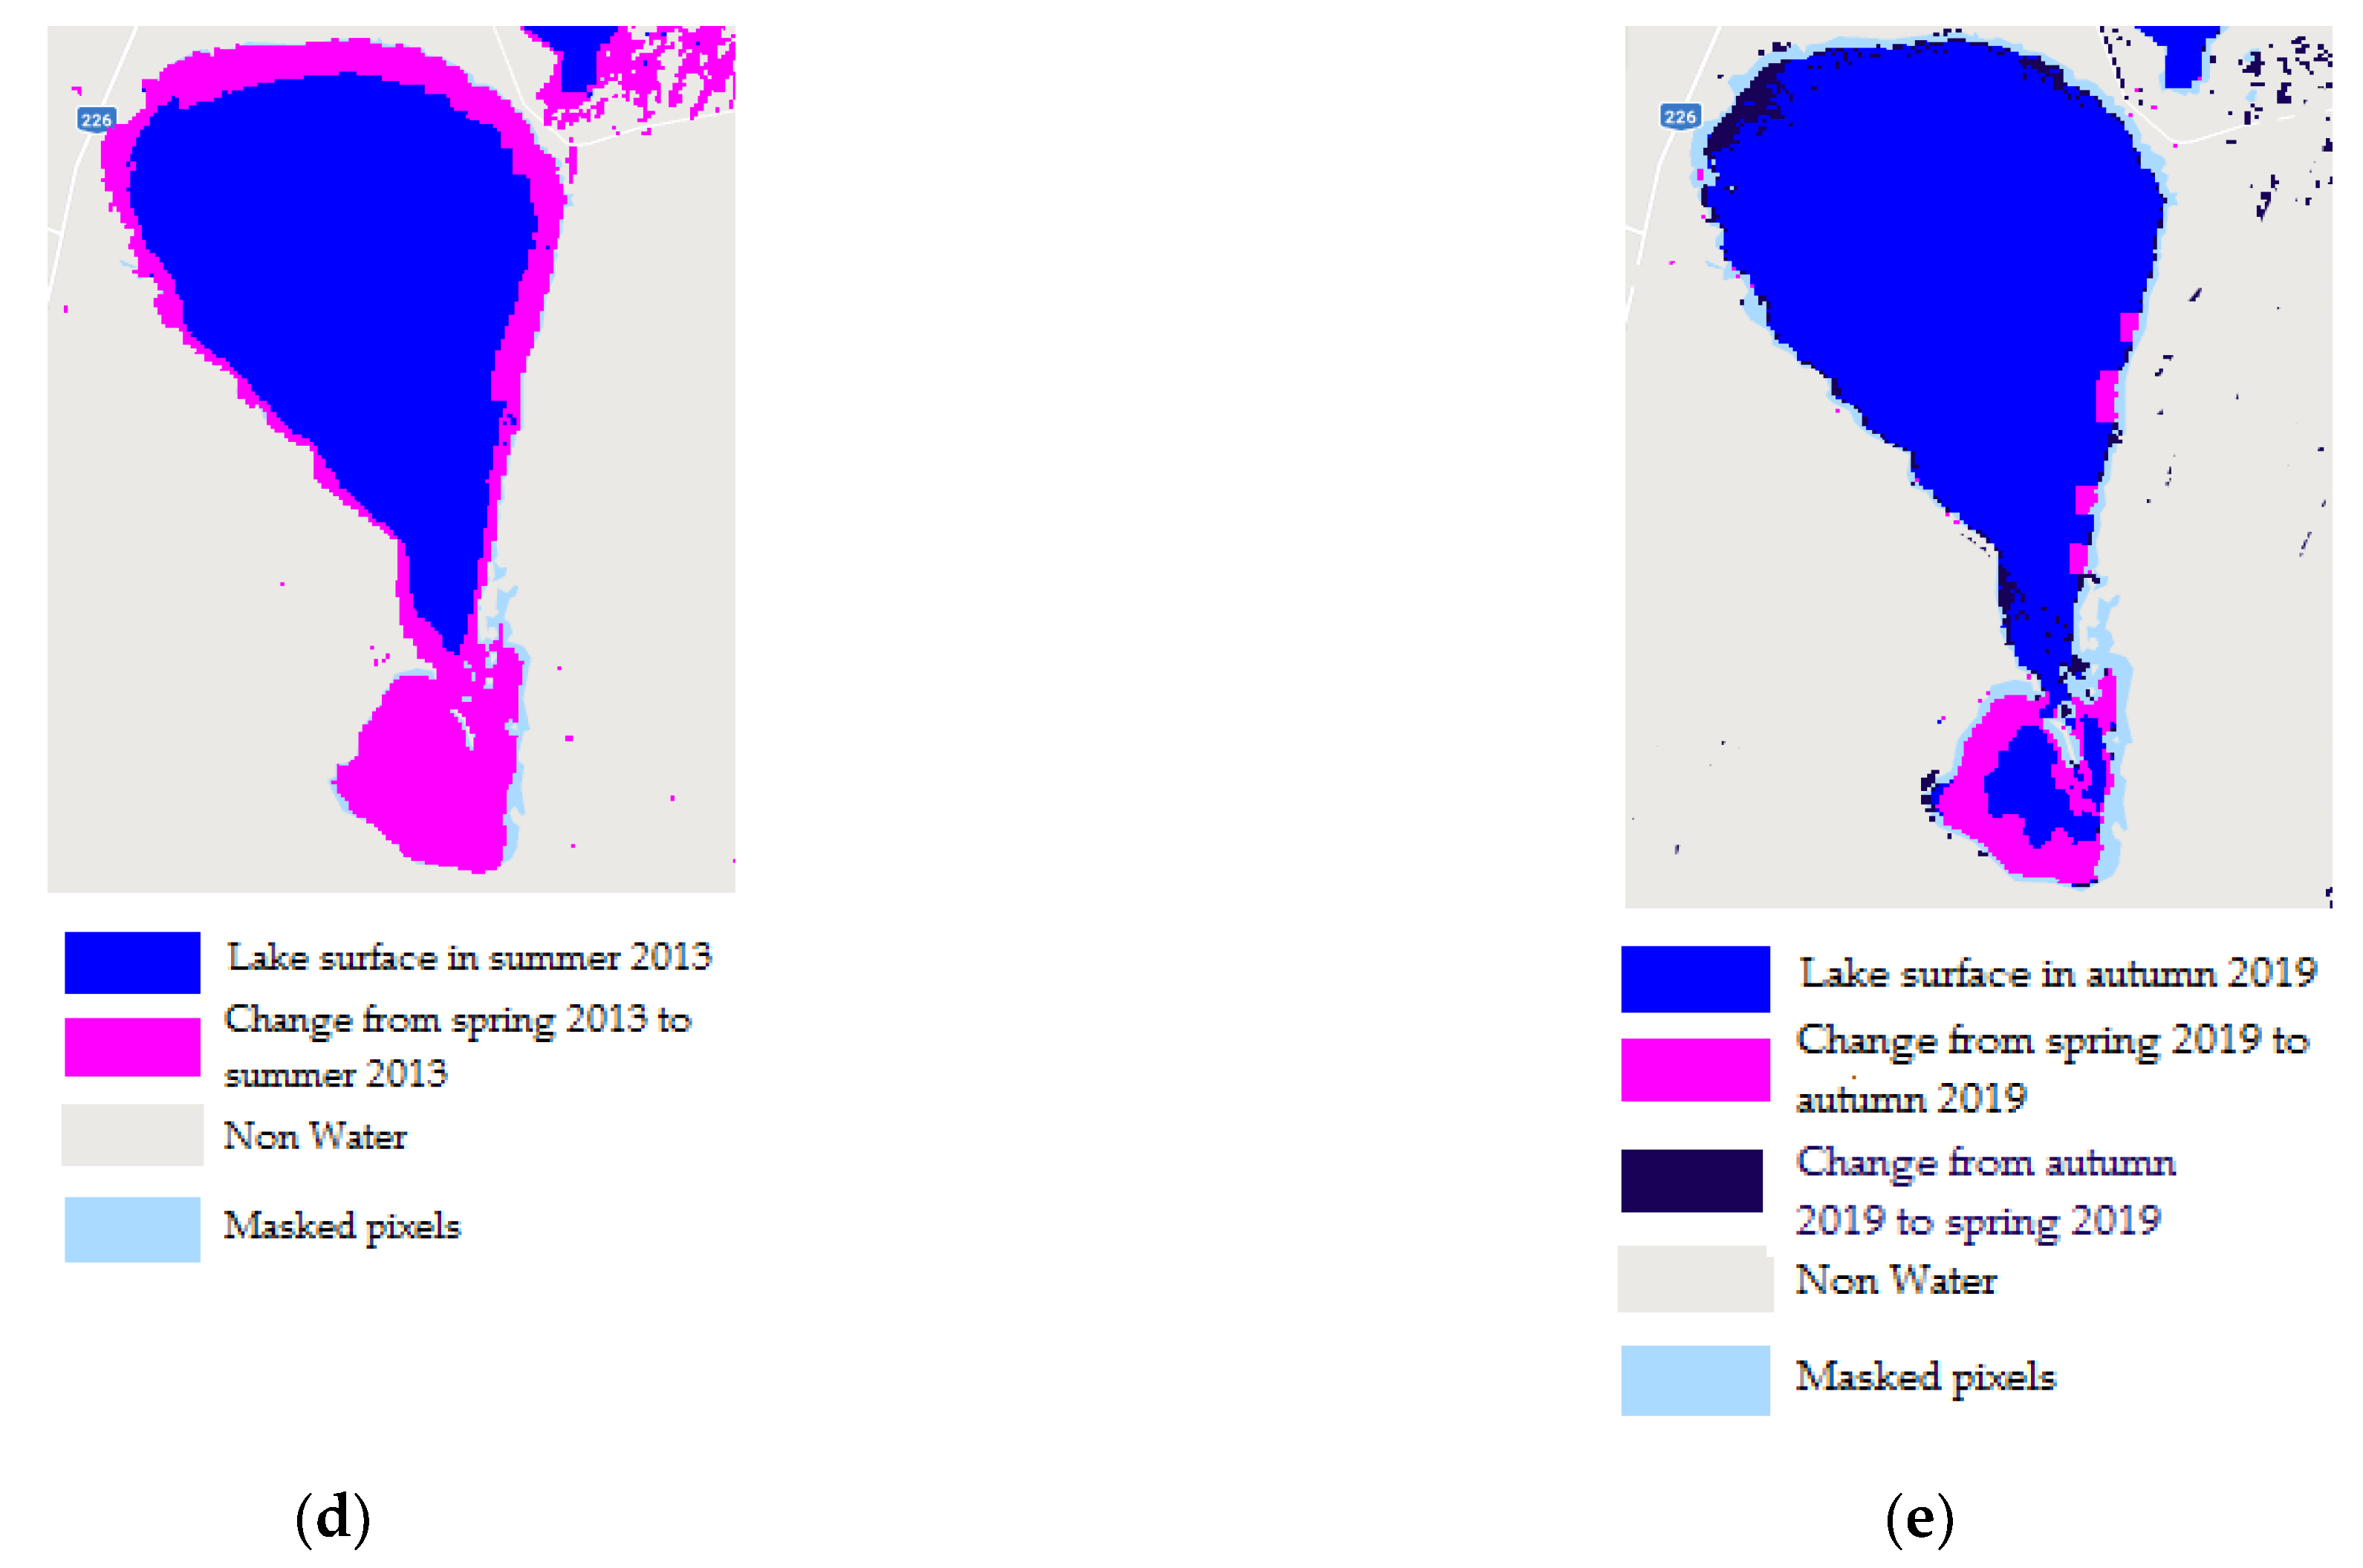
Using the CART model with the seasonal averaged values of RS indices (NDVI, NDWI, MNDWI, WNDWI and WRI) as the input data, we assessed the seasonal water lake surface variation during the period 1984–2021 with over 90% mapping accuracy, user accuracy and overall accuracy. The results of the proposed classification method revealed that the evolution of surface lake water is correlated with human intervention and the hydrological drought identified with the TLM method. Significant decrease during the 2003–2020 period was identified in the surface water lake’s evolution, thus the hydrological drought identified in 2011, 2012, 2013 and 2020 corresponds with the lowest values for water lake surface. In our opinion, the method based on remote sensing data and the CART model is calibrated, due to the results obtained. Unfortunately, we have only a short series of daily records, which limits this study.
Overall, the findings of this study provide some insights into the evolution of the Nuntasi Tuzla Lake and the factors driving it through a long period of time, which may be further used to formulate scientific measures to prevent other drought disasters similar to that of August 2020. Future work may imply improvement of the surface water changes’ detection method, by investigating other spectral indices and comparing with state-of-the-art classification methods. Although the CART model is a very intuitive and powerful classifier, it often involves longer time to train and fails to meet the best performance if the problem has many uncorrelated variables. Other classification methods, such as support vector machines (SVM) or multilayer perceptron (MLP) neural network, which work well with large input data, can be adopted to identify surface water in Landsat satellite images.
According to the Romanian Water National Administration—Littoral Branch (ABADL), an extensive restoration campaign started in September 2020 and the canal between Istria and Nuntasi-Tuzla lakes was restored (Figure 13).
A fragile equilibrium was reestablished and in spring of 2021 a group of flamingo birds was spotted.
An Integrated Drought Management Programme (IDMP) was launched in 2013 by GWP (Global Water Partnership) for Central and Eastern Europe. The main objective [21] is to support the responsible authorities to prepare and integrate the Drought Management plan (DMP) within the future Basin Management Plan (BMP). In this context, more efforts are needed to validate the method proposed in this study.

Author Contributions

Conceptualization, C.Ș. and C.M.; Methodology, C.Ș. and C.M.; Software, C.Ș.; Validation, C.M. and G.D.; Formal analysis, C.M.; Investigation, C.M. and C.Ș.; Resources, G.D.; Data curation, G.D.; Writing—original draft preparation, C.M.; Writing—review and editing, C.Ș.; Visualization, G.D.; Supervision, C.M.; All authors have read and agreed to the published version of the manuscript.

Funding

This research received no external funding.

Institutional Review Board Statement

Not applicable.

Informed Consent Statement

Not applicable.

Data Availability Statement

Not applicable.

Conflicts of Interest

The authors declare no conflict of interest.

References

  1. Peng, Y.; He, G.; Wang, G.; Cao, H. Surface Water Changes in Dongting Lake from 1975 to 2019 Based on Multisource Remote-Sensing Images. Remote Sens. 2021, 13, 1827. [Google Scholar] [CrossRef]
  2. Bărbulescu, A.; Dumitriu, C.Ș.; Maftei, C. On the Probable Maximum Precipitation method. Rom. J. Phys. 2022, 67, 801. [Google Scholar]
  3. Bărbulescu, A.; Postolache, F.; Dumitriu, C.S. Estimating the Precipitation Amount at Regional Scale Using a New Tool, Climate Analyzer. Hydrology 2021, 8, 125. [Google Scholar] [CrossRef]
  4. Cui, B.-L.; Xiao, B.; Li, X.-Y.; Wang, Q.; Zhang, Z.-H.; Zhan, C. Exploring the geomorphological processes of Qinghai Lake and surrounding lakes in the northeastern Tibetan Plateau, using Multitemporal Landsat Imagery (1973–2015). Glob. Planet. Chang. 2017, 152, 167–175. [Google Scholar] [CrossRef] [Green Version]
  5. Adrian, R.; O’Reilly, C.M.; Zagarese, H.; Baines, S.B.; Hessen, D.O.; Keller, W.; Livingstone, D.M.; Sommaruga, R.; Straile, D.; van Donk, E.; et al. Lakes as sentinels of climate change. Limnol. Oceanogr. 2009, 54, 2283–2297. [Google Scholar] [CrossRef]
  6. Maftei, C.; Buta, C.; Carazeanu Popovici, I. The Impact of Human Interventions and Changes in Climate on the Hydro-Chemical Composition of Techirghiol Lake (Romania). Water 2020, 12, 2261. [Google Scholar] [CrossRef]
  7. Conserving Iran and Iraq’s Wetlands, UNEP. 2018. Available online: http://www.unep.org/news-and-stories/story/conserving-iran-and-iraqs-wetlands (accessed on 16 June 2021).
  8. Benson, L.V.; Paillet, F.L. The Use of Total Lake-Surface Area as an Indicator of Climatic Change: Examples from the Lahontan Basin. Quat. Res. 1989, 32, 262–275. [Google Scholar] [CrossRef]
  9. Rouse, W.; Haas, R.H.; Schell, J.A.; Deering, D. Monitoring Vegetation Systems in the Great Plains with ERTs; NASA: Washington, DC, USA, 1974; p. 309. [Google Scholar]
  10. Peters, A.J.; Walter-Shea, E.A.; Ji, L.; Vliia, A.; Hayes, M.; Svoboda, M.D. Drought Monitoring with NDVI-Based Standardized Vegetation Index. Photogram. Eng. Remote Sens. 2002, 68, 71–75. [Google Scholar]
  11. Mishra, A.K.; Singh, V.P. A review of drought concepts. J. Hydrol. 2010, 391, 202–216. [Google Scholar] [CrossRef]
  12. Rokni, K.; Ahmad, A.; Selamat, A.; Hazini, S. Water Feature Extraction and Change Detection Using Multitemporal Landsat Imagery. Remote Sens. 2014, 6, 4173–4189. [Google Scholar] [CrossRef] [Green Version]
  13. McFeeters, S.K. The use of the Normalized Difference Water Index (NDWI) in the delineation of open water features. Int. J. Remote Sens. 1996, 17, 1425–1432. [Google Scholar] [CrossRef]
  14. Xu, H. Modification of normalised difference water index (NDWI) to enhance open water features in remotely sensed imagery. Int. J. Remote Sens. 2006, 27, 3025–3033. [Google Scholar] [CrossRef]
  15. Shen, L.; Li, C. Water body extraction from Landsat ETM+ imagery using adaboost algorithm. In Proceedings of the 2010 18th International Conference on Geoinformatics, Beijing, China, 18–20 June 2010; pp. 1–4. [Google Scholar]
  16. Guo, Q.; Pu, R.; Li, J.; Cheng, J. A weighted normalized difference water index for water extraction using Landsat imagery. Int. J. Remote Sens. 2017, 38, 5430–5445. [Google Scholar] [CrossRef]
  17. Acharya, T.D.; Subedi, A.; Yang, I.T.; Lee, D.H. Combining Water Indices for Water and Background Threshold in Landsat Image. Proceedings 2017, 2, 143. [Google Scholar] [CrossRef] [Green Version]
  18. Acharya, T.D.; Subedi, A.; Lee, D.H. Evaluation of Water Indices for Surface Water Extraction in a Landsat 8 Scene of Nepal. Sensors 2018, 18, 2580. [Google Scholar] [CrossRef] [Green Version]
  19. Preoteasa, L.; Vespremeanu-Stroe, A.; Hanganu, D.; Katona, A.; Timar-Gabor, A. Coastal changes from open coast to present lagoon system in Histria region (Danube delta). J. Coast. Res. 2013, 65, 564–569. [Google Scholar] [CrossRef]
  20. Breier, A. Lacurile de pe Litoralul Romanesc al Marii Negre. Studiu Hidrogeografic; Editura Academiei Republicii Socialiste România: București, Romania, 1976. [Google Scholar]
  21. Maftei, C.; Dobrica, G.; Cerneaga, C.; Buzgaru, N. Drought Land Degradation and Desertification—Case Study of Nuntasi-Tuzla Lake in Romania. In Water Safety, Security and Sustainability: Threat Detection and Mitigation; Vaseashta, A., Maftei, C., Eds.; Springer International Publishing: Cham, Switzerland, 2021; pp. 583–597. [Google Scholar] [CrossRef]
  22. Breiman, L.; Friedman, J.H.; Olshen, R.A.; Stone, C.J. Classification and Regression Trees; Routledge: Boca Raton, FL, USA, 2017. [Google Scholar] [CrossRef]
  23. Maftei, C.; Barbulescu, A. Statistical analysis of precipitation time series in the Dobrudja region. Mausam 2012, 63, 553–564. [Google Scholar] [CrossRef]
  24. Dumitriu, C.S.; Dragomir, F.-L. Modeling the Signals Collected in Cavitation Field by Stochastic and Artificial Intelligence Methods. In Proceedings of the 2021 13th International Conference on Electronics, Computers and Artificial Intelligence (ECAI), Pitesti, Romania, 1–3 July 2021; pp. 1–4. [Google Scholar] [CrossRef]
  25. Vogt, J.V.; Somma, F. Drought and Drought Mitigation in Europe; Springer: Dordrecht, Netherlands, 2000. [Google Scholar] [CrossRef]
  26. Fatulová, E.; Majerčáková, O.; Houšková, B.; Bardarska, G.; Alexandrov, V.; Kulířová, P.; Gayer, J.; Molnár, P.; Fiala, K.; Tamás, J.; et al. Guidelines for Preparation of the Drought Management Plans: Development and Implementation of Risk-Based Drought Management Plans in the Context of the EU Water Framework Directive—As Part of the River Basin Management Plans; Global Water Partnership Central and Eastern Europe: Bratislava, Slovakia, 2015. [Google Scholar]
  27. Smakhtin, V.; Hughes, D.A.; International Water Management Institute. Review, Automated Estimation and Analyses of Drought Indices in South Asia; International Water Management Institute: Colombo, Sri Lanka, 2004. [Google Scholar]
  28. Tallaksen, L.; van Lanen, H.A.J.; Hydrological Drought. Processes and Estimation Methods for Streamflow and Groundwater. Elsevier. 2004; Available online: https://research.wur.nl/en/publications/hydrological-drought-processes-and-estimation-methods-for-streamf (accessed on 13 August 2021).
  29. Yevjevich, V.M. An objective approach to definitions and investigations of continental hydrologic droughts. J. Hydrol. 1969, 7, 353. [Google Scholar] [CrossRef] [Green Version]
  30. Mateo-García, G.; Gómez-Chova, L.; Amorós-López, J.; Muñoz-Marí, J.; Camps-Valls, G. Multitemporal Cloud Masking in the Google Earth Engine. Remote Sens. 2018, 10, 1079. [Google Scholar] [CrossRef] [Green Version]
  31. Bărbulescu, A.; Dumitriu, C.Ș.; Dragomir, F.L. Detecting Aberrant Values and Their Influence on the Time Series Forecast. In Proceedings of the International Conference on Electrical, Computer, Communications and Mechatronics Engineering (ICECCME), Mauritius, Mauritius, 7–8 October 2021. [Google Scholar] [CrossRef]
  32. Pencue-Fierro, E.L.; Solano-Correa, Y.T.; Corrales-Mũnoz, J.C.; Figueroa-Casas, A. A Semi-Supervised Hybrid Approach for Multitemporal Multi-Region Multisensor Landsat Data Classification. IEEE J. Sel. Top. Appl. Earth Obs. Remote Sens. 2016, 9, 5424–5435. [Google Scholar] [CrossRef]
  33. Duan, H.; Deng, Z.; Deng, F.; Wang, D. Assessment of Groundwater Potential Based on Multicriteria Decision Making Model and Decision Tree Algorithms. Math. Probl. Eng. 2016, 1, 2064575. [Google Scholar] [CrossRef] [Green Version]
  34. Gastescu, P. The Danube Delta: Geographical characteristics and ecological recovery. GeoJournal 1993, 29, 57–67. [Google Scholar] [CrossRef]
  35. Aurel, L.; Liliana, M. Drought Management in the Agriculture of Dobrogea Province, 2013, 65–70. Available online: https://mpra.ub.uni-muenchen.de/53403/1/MPRA_paper_53403.pdf (accessed on 24 December 2021).
  36. Grumezea, N.; Kleps, C.; Tusa, C. Evolutia Nivelului si Chimismului Apei Freatice din Amenajarile de Irigatii in Interrelatie cu Mediul Inconjurator; Intreprinderea Poligrafica Oltenia: București, Romania, 1990. [Google Scholar]
  37. Pons, L.J. Natural resources. In Conservation Status of the Danube Delta; IUCN: Newbury, Berkshire, UK, 1992; Volume 4, pp. 23–36. [Google Scholar]
  38. Bretcan, P.; Murărescu, O.; Samoilă, E.; Popescu, O. The Modification of the Ecological Conditions in the Razim-Sinoaie Lacuster Complex as an Effect of the Anthropic Intervention. Presented at the XXIVth Conference of the Danubian Countries on the Hydrological Forecasting and Hydrological Bases of Water Management, Bled, Slovenia, 2–4 June 2008. [Google Scholar]
  39. Vadineanu, A.; Cristofor, S.; Ignat, G.; Romanca, G.; Ciubuc, C.; Florescu, C. Changes and opportunities for integrated management of the Razim-Sinoe Lagoon System. Int. J. Salt Lake Res. 1997, 6, 135–144. [Google Scholar] [CrossRef]
  40. Bretcan, P.; Murărescu, O.; Samoilă, E.; Popescu, O. Water Management in the Razim—Sinoie Lacustrine Complex. Presented at the International Symposium on Water Management and Hydraulic Engineering, Ohrid/Macedonia, 1–5 September 2009; pp. 791–801. [Google Scholar]
  41. Turnock, D. Water resource management problems in Romania. GeoJournal 1979, 3, 609–622. [Google Scholar] [CrossRef]
  42. Proiect de Deabilitare si Reforma a Irigatiilor. Available online: http://old.madr.ro/pages/strategie/proiect-de-reabilitare-si-reforma-a-irigatiilor.pdf (accessed on 13 August 2021).
  43. Ministerul Agriculturii şi Dezvoltării Rurale. Strategia Națională de Reabilitare și Extindere a Infrastructurii de Irigaţii din România. 2019. Available online: https://www.madr.ro/download (accessed on 13 August 2021).
  44. Rusu, G. Sinteza Cercetarilor in Perioada 1975–1982 Pentru Lacurile Techirghiol, Nuntasi si Istria; ICPGA: Bucuresti, Romania, 1982. [Google Scholar]
  45. Foody, G.M. Status of Land Cover Classification Accuracy Assessment. Remote Sens. Environ. 2002, 80, 185–201. [Google Scholar] [CrossRef]
Figure 1. Map of the study area, the Nuntasi-Tuzla Lake.
Water 14 00556 g001
Figure 2. Map of the Razim-Sinoe Lake system.
Water 14 00556 g002
Figure 3. Methods to characterize hydrological drought.
Water 14 00556 g003
Figure 4. Flowchart of surface water detection based on a Decision Tree Classification.
Water 14 00556 g004
Figure 5. Variation of annual average discharge of the Nuntasi and Sacele Rivers.
Water 14 00556 g005
Figure 6. Flow Duration Curve for the Nuntasi River.
Water 14 00556 g006
Figure 7. The TLM results for the Nuntasi station (2013): (a) zoom for 13 June 2013–30 August 2013 period; (b) zoom for 3 August 2020–20 October 2020 period.
Water 14 00556 g007
Figure 8. Earth Explorer Images (Source: https://earthexplorer.usgs.gov/ (accessed on 05 December 2021)) and seasonal surface water extraction maps for image (a) D1 (b) D2 (c) D3 (d) D4 (e) D5 (f) D6 (g) D7 (h) D8 (i) D9.
Water 14 00556 g008
Figure 9. Correlation of surface water between Landsat and MODIS.
Water 14 00556 g009
Figure 10. Variation in the seasonal average surface water area for the investigated period.
Water 14 00556 g010
Figure 11. Seasonal surface water extraction maps (a) autumn 1995 (b) autumn 1989 (c) summer 2001 (d) summer 2012 (e) spring 2019 (f) autumn 2020 (g) summer 2013.
Water 14 00556 g011aWater 14 00556 g011b
Figure 12. Lake Nuntasi-Tuzla average surface area changes map in the period (a) autumn 1989–autumn 1995 (b) spring 2019–autumn 2020 (c) autumn 1989–summer 2001 (d) spring 2013–summer 2013 (e) spring 2019–autumn 2019.
Water 14 00556 g012aWater 14 00556 g012b
Figure 13. Nuntasi Tuzla Lake restauration (ABADL source) in September 2020.
Water 14 00556 g013
Table 1. Number of Landsat RS images investigated.
PeriodSpringSummerAutumn
1984–1999155025
2000–2012
2000–31 May 2003986
1 June 2003–2011112913
2013–2021192721
Table 2. RSI used for water surface extraction [1,12,16].
RSI FormulaObservation
NDVINDVI = (NIR − Red)/(NIR + Red)Water has negative value
NDWINDWI = (Green − NIR)/(Green + NIR)Water has positive value
MNDWIMNDWI = (Green − MIR)/(Green + MIR)Water has positive value
WNDWIWNDWI = (Green – a ∙ NIR − (1 − a) ∙ SWIR)/(Green + a ∙ NIR + (1 − a) ∙ SWIR)a [0;1] 1
WRIWRI = (Green + Red)/(NIR + MIR)Water is >1
1 weighted coefficient; if a = 0 than WNDWI = MNDWI, if a = 1 than WNDWI = NDWI. For our study, the weighted coefficient a was set to 0.50, as the tests show that this value allows a high overall accuracy of the index performance [17].
Table 3. Selected scenes of Landsat TM/ETM+/OLI surface reflectance imagery used for accuracy assessment.
DataSatelliteDateCloud Cover (%)
D1Landsat 5 TM16 July 19882.00
D2Landsat 5 TM3 September19944.00
D3Landsat 5 TM28 May 199914.00
D4Landsat 7 ETM+7 June 20000.00
D5Landsat 5 TM22 March 20040.00
D6Landsat 5 TM18 September 20113.00
D7Landsat 8 OLI10 September 201410.30
D8Landsat 8 OLI08 May 20150.83
D9Landsat 8 OLI29 July 20161.16
Table 4. Average of the subseries detected via the Hubert segmentation procedure.
Hydrometric StationSubseries PeriodAverage (m3/s)Observation
Nuntasi1965–19800.466hydraulic work construction and irrigation system operation
1981–19890.637
1990–19970.410gradual disrupting of irrigation system
1998–20060.229
2007–20200.069
Sacele1965–19960.103
1997–20030.095id.
2004–20200.033
Table 5. Threshold values determined by FDC.
Hydrometric StationEFQ (%)Qo (m3 s−1)
Nuntasi950.03
900.03
800.04
750.05
Sacele950.01
900.01
800.02
750.02
Table 6. Drought characteristics obtained with TLM and SPA for the Nuntasi station.
Date StartDate EndLength Period (Days)
7/20/20087/22/20083
9/28/20119/30/20113
9/27/20129/29/20123
6/13/20136/30/201318
7/2/20137/2/20131
7/23/20138/30/201339
8/15/20198/16/20192
8/29/20199/1/20194
8/3/20209/14/202043
9/16/20209/30/202015
10/7/202010/20/202014
Table 7. Summary of accuracy assessments for Landsat dataset.
Data No.ClassUA (%)PA (%)OA (%)Kappa
D1Water95.74100.0098.210.96
Non-Water100.0097.31
D2Water100.0098.1199.090.98
Non-Water98.27100.00
D3Water98.36100.0099.010.98
Non-Water100.0097.61
D4Water96.77100.0098.030.96
Non-Water100.0095.23
D5Water100.0098.3699.090.98
Non-Water98.03100.00
D6Water98.50100.0099.060.98
Non-Water100.0098.00
D7Water98.07100.0099.030.98
Non-Water100.0098.11
D8Water98.21100.0099.030.98
Non-Water100.0097.95
D9Water97.95100.0099.090.98
Non-Water100.0098.38
Table 8. Summary of accuracy assessments for MODIS dataset.
Date ClassUA (%)PA (%)OA (%)Kappa
20 August 2012 Water95.7595.5595.740.91
Non-Water95.9495.91
23 September 2012 Water96.0798.0096.660.94
Non-Water97.9195.91
Publisher’s Note: MDPI stays neutral with regard to jurisdictional claims in published maps and institutional affiliations.

