
Permafrost Degradation and Its Hydrogeological Impacts
by
 , , , , , , , ,
Huijun Jin
1,2,3 ,
,
Yadong Huang
1,2,*,
Victor F. Bense
1,4,
Qiang Ma
1,5,*,
Sergey S. Marchenko
1,6,
Viktor V. Shepelev
7,
Yiru Hu
8,
Sihai Liang
9,
Valetin V. Spektor
7,
Xiaoying Jin
3,
Xinyu Li
8 and
Xiaoying Li
3 1
State Key Laboratory of Frozen Soils Engineering, Northwest Institute of Eco-Environment and Resources, Chinese Academy of Sciences, Lanzhou 730000, China
2
School of Resources and Environment, University of Chinese Academy of Sciences, Beijing 100049, China
3
Institute of Cold-Regions Science and Engineering, School of Civil Engineering, Northeast Forestry University, Harbin 150040, China
4
Department of Environmental Sciences, Wageningen University, 6700AA Wageningen, The Netherlands
5
School of Hydraulic and Electric Power, Heilongjiang University, Harbin 150040, China
6
Permafrost Lab, Geophysical Institute, University of Alaska Fairbanks, Fairbanks, AK 99775, USA
7
Melnikov Permafrost Institute, Russian Academy of Sciences, 677010 Yakutsk, Russia
8
School of Civil Engineering, Harbin Institute of Technology, Harbin 150090, China
9
China School of Water Resources and Environment, China University of Geosciences, Beijing 100083, China
*
Authors to whom correspondence should be addressed.
Water 2022, 14(3), 372; https://doi.org/10.3390/w14030372
Submission received: 21 December 2021
/
Revised: 20 January 2022
/
Accepted: 21 January 2022
/
Published: 26 January 2022
(This article belongs to the Special Issue Hydrological Impacts of Degrading Permafrost and Changing Climate)
Abstract
:Under a warming climate, permafrost degradation has resulted in profound hydrogeological consequences. Here, we mainly review 240 recent relevant papers. Permafrost degradation has boosted groundwater storage and discharge to surface runoffs through improving hydraulic connectivity and reactivation of groundwater flow systems, resulting in reduced summer peaks, delayed autumn flow peaks, flattened annual hydrographs, and deepening and elongating flow paths. As a result of permafrost degradation, lowlands underlain by more continuous, colder, and thicker permafrost are getting wetter and uplands and mountain slopes, drier. However, additional contribution of melting ground ice to groundwater and stream-flows seems limited in most permafrost basins. As a result of permafrost degradation, the permafrost table and supra-permafrost water table are lowering; subaerial supra-permafrost taliks are forming; taliks are connecting and expanding; thermokarst activities are intensifying. These processes may profoundly impact on ecosystem structures and functions, terrestrial processes, surface and subsurface coupled flow systems, engineered infrastructures, and socioeconomic development. During the last 20 years, substantial and rapid progress has been made in many aspects in cryo-hydrogeology. However, these studies are still inadequate in desired spatiotemporal resolutions, multi-source data assimilation and integration, as well as cryo-hydrogeological modeling, particularly over rugged terrains in ice-rich, warm (>−1 °C) permafrost zones. Future research should be prioritized to the following aspects. First, we should better understand the concordant changes in processes, mechanisms, and trends for terrestrial processes, hydrometeorology, geocryology, hydrogeology, and ecohydrology in warm and thin permafrost regions. Second, we should aim towards revealing the physical and chemical mechanisms for the coupled processes of heat transfer and moisture migration in the vadose zone and expanding supra-permafrost taliks, towards the coupling of the hydrothermal dynamics of supra-, intra- and sub-permafrost waters, as well as that of water-resource changes and of hydrochemical and biogeochemical mechanisms for the coupled movements of solutes and pollutants in surface and subsurface waters as induced by warming and thawing permafrost. Third, we urgently need to establish and improve coupled predictive distributed cryo-hydrogeology models with optimized parameterization. In addition, we should also emphasize automatically, intelligently, and systematically monitoring, predicting, evaluating, and adapting to hydrogeological impacts from degrading permafrost at desired spatiotemporal scales. Systematic, in-depth, and predictive studies on and abilities for the hydrogeological impacts from degrading permafrost can greatly advance geocryology, cryo-hydrogeology, and cryo-ecohydrology and help better manage water, ecosystems, and land resources in permafrost regions in an adaptive and sustainable manner.
1. Introduction
Permafrost has occurred extensively on the Earth’s surfaces in the past and at present, and will occur in the future, with an areal extent of about 20–23 million km2 for the existing permafrost [1,2,3]. Due to its minimal hydraulic conductivity as an aquitard, permafrost has controlled or strongly affected groundwater dynamics at varied spatiotemporal scales in the Quaternary, particularly since the Late Pleistocene, e.g., [4,5,6,7,8]. Groundwater flows also exert strong influences on the formation, distribution, and evolution of permafrost and taliks/aquifers mainly by heat advection and convection along preferential flow paths (e.g., [9,10,11,12,13]). This interplay, in addition to feedback from physical, chemical, and biogeochemical processes, creates complex permafrost–groundwater interactive dynamics in permafrost regions, such as those in the Circum-Arctic regions and on the Qinghai–Tibet Plateau (QTP), and in other high-plateau and alpine regions.
Under a warming climate, permafrost has been degrading globally, at alarming rates in some regions (e.g., [14,15,16]), particularly in regions of thin, warm, and discontinuous permafrost, such as southern Siberia, Southcentral Alaska, Xing’an-Baikalia, and Northeast China, or in the vicinity of the southern/lower limits of permafrost (e.g., [17,18,19,20,21,22]). Permafrost degradation can modify or alter the hydrothermal and ecosystem dynamics at local and regional scales in northern and alpine regions [23,24]. Permafrost thaw over the last few decades and its impacts may have modified the thermal regimes in the otherwise heat-conduction-dominated system (e.g., [25,26,27]), facilitating permafrost degradation and climate warming. Thus, a better understanding of the hydrogeological changes induced by climate warming and permafrost thaw is key to predicting and evaluating the changing ecosystem structures, dynamics, and serviceability at varied scales [28,29], especially for improving our ability to quantify and predict carbon (C) and nitrogen (N) fluxes [30,31,32,33,34,35,36].
During the last 20 years, rapidly advancing technologies, such as remote sensing, geographic information systems, global positioning systems, depth/machine learning, airborne and ground-based geophysical methods, and numerical predictive models, have provided more capable, effective, and efficient tools for understanding the complex and interactive hydrothermal and hydro-chemical links between surface and subsurface water systems and permafrost-related groundwaters/aquifers and ground ice. Although substantial and rapid progress has been made in studies on cryo-hydrogeology under the dual impacts of climate change and human activities, the knowledge gaps remain large. For example, critical limitations still remain in key data coverage, surface and subsurface characterization, and process-based and integrated predictive models, while pressing needs mandate better and more in-depth understanding of cryo-hydrogeology because of increasing concerns for resources development, environmental management, water and ecological safety, and C neutralization and public health security.
On the basis of pooling and analyzing about 240 recent (2000–2021) publications and with a global perspective, this paper reviews the progress in permafrost degradation and its hydrogeological impacts. It also aims at identifying inadequacies and priorities for near-future studies. After a brief introduction in Section 1, this review mainly focuses on permafrost–groundwater systems (Section 2), permafrost degradation (Section 3), and the changing configurations of cryo-hydrogeological systems and hydrogeological impacts (Section 4). Then, based on the earlier sections and comprehensive and integrative analyses, research inadequacies and priorities are identified and proposed in Section 5. Section 6 concludes the paper. However, the cryo-hydrogeological structures and functions under a changing climate and environment and increasing human activities are multifaceted. Due to the limited length, this review include neither much on the chemical and C and N fluxes (to the atmosphere or to water systems) of groundwater systems nor much on surface hydrological, terrestrial, and ecological processes, unless it is directly connected with permafrost–groundwater systems.
2. Permafrost–Groundwater Systems
2.1. Hydraulic Properties of Freezing, Frozen, Thawing, and Thawed Aquifers
The freezing of soil water and groundwater drastically lowers soil permeability, resulting in the formation of a near-surface aquitard [37]. This complicates the cryo-hydrogeological structure, reduces groundwater recharge, storage and discharge, and impairs hydraulic connectivity [38,39,40]. Conversely, the thawing of permafrost boosts groundwater storage and recharge and improves hydraulic connectivity [41,42]. Additionally, permafrost thaw will enhance water cycling [25]. Ice-saturated, frozen soils have a very low permeability, but a porous soil can freeze and still allow partial water infiltration or exfiltration [40,43]. However, ice-rich or -oversaturated soils greatly restrict the flow of groundwater. Under certain circumstances, soil moisture may migrate along hydrothermal gradients, forming excess ice [44]. In discontinuous permafrost zones, local factors substantially affect water permeability, talik formation, and flow generation, discharge, and paths [45,46,47,48,49,50].
To date, there is no consensus on the classification of groundwater in permafrost zones. The relevant standards, criteria, and bases for groundwater classification differ significantly (e.g., [51]). Most of the studies on the environmental factors for controlling or affecting the formation, distribution, and evolution of groundwaters in permafrost regions need a systematic approach. Because of the predominant role of permafrost among these factors, the generally adopted classification system of groundwater in permafrost regions was based on the spatial relationship between the aquifer and permafrost layer, in which three types and seven sub-types of groundwater are identified (Figure 1; [51,52]) and revised as follows:
Generally, we distinguish two types of groundwaters: supra- and sub-permafrost waters. At some favorable hydrothermal layers or locations, intra-permafrost water may occur in taliks. In the continuous permafrost zone, limited supra-permafrost water (SPW) is generally restricted to the active layer and/or the supra-permafrost subaerial talik (SST), and the movement of sub-permafrost groundwater is also much limited. However, preferential flows occur in taliks due to the contrasting hydraulic properties of frozen and unfrozen soils (e.g., [44,53]). The endo-permafrost water (EPW) can occur when large amounts of unfrozen water in warming and extremely warm (e.g., >−0.1 °C) soils are enriching and connecting [5,45]. Of course, under a warming climate and in regions of degrading permafrost, groundwater systems and other terrestrial processes will undergo dramatic, extensive, and rapid changes, substantially altering the groundwater and surface flow dynamics (Figure 1) [5,16,25,29,32,54,55].
2.2. Groundwater Occurrence Relative to Permafrost
SPW occurs atop the uppermost permafrost layer, and generally it is shallow due to the limitation of the active layer thickness (ALT): the seasonally thawed and frozen layer over the permafrost layer. However, the aquifer of SPW can be thickened substantially by the developing SST [10]. SPW discharges laterally to rivers/streams and lakes/ponds, but hardly ever downwards to sub-permafrost waters in regions of thick, continuous permafrost. However, hydrothermal or chemical taliks can be hydraulic channels between supra- and sub-permafrost waters. SPW can be of limited value for water supply because of its strong seasonality, small volume, and proneness to superficial contaminations. Because of the presence of frozen confining units, SPW can be further classified into two sub-types (A1 and A2 in Figure 1), based primarily on the length of aquitard presence. The intra-permafrost water between frozen layers is generally isolated from seasonal variations and relatively stable in dynamics. Its occurrence and recharge depend on the nature of the taliks. It can also be further classified into three sub-types, as follows (B1, B2 and B3 in Figure 1) [51]. Intra-permafrost water (B2 in Figure 1) occurs in taliks bounded by permafrost from above and below; groundwater of open taliks (B3) occurs between permafrost layers which bind the talik sub-vertically; isolated groundwater relates to the final freezing stages of small closed water-bearing taliks (B1). Sub-permafrost waters can be classified into two sub-types (C1 and C2 in Figure 1): that is in direct contact with permafrost (C1) and that which is not (C2). EPW (B1) occurs in very warm (e.g., >−0.5 °C) permafrost soils. The unfrozen water content is generally low in permafrost soils. However, with rising temperatures, particularly when approaching the melting point of ground ice, the unfrozen water content increases sharply in frozen soils. In extremely warm (e.g., >−0.1 °C) permafrost soils, sufficient unfrozen water may connect but yet be unable to drain because of unfavorable outflowing conditions; the endo-permafrost water is thus formed [5,45,46]. When the ground keeps warming, meltwater may eventually drain and flow laterally, participating in short-term hydrogeological cycling.
Generally associated with dry, sparsely vegetated sandy deposits covered by forests, such as in Central Yakutia, Outer Baikalia, and the Xing’anling Mountains, SSTs have been identified in the past (e.g., [56,57,58,59,60,61,62]). In recent decades, water-bearing SSTs have become an important cryo-hydrogeological phenomenon, leading to profound hydrological, ecological, and engineering impacts in the Arctic and Boreal zones and high-plateau and alpine regions (e.g., [10]). Under a warming and wetting climate, SSTs have become increasingly relevant for monitoring and evaluating the formation and evolution of geocryological, ecohydrological, and cryo-hydrogeological conditions in the Arctic–Boreal zones and high-plateau and alpine regions, particularly in zones of discontinuous and marginal permafrost, such as in southern Siberia and Xing’anling-Baikalia, northern parts of North America, and on the QTP. However, the distribution, origin, and evolutionary processes of SSTs and their hydrogeological, ecological, and engineering impacts are still poorly understood.
In the meantime, as a special case of Sub-type B1, which is also surrounded by permafrost in all directions, the EPW can form under a warming climate due to the rapidly rising temperature of warm and ice-rich permafrost [45]. Ground warming can result in the appearance of a large quantity of unfrozen water in very warm (>−0.5 °C) and ice-rich and/or icy permafrost soils, forming the EPW [46]. Frozen soils rich in unfrozen water and endo-permafrost water could be important in evaluating the potential for runoff generation and water supplies from warm (>−1 °C) permafrost with excess ice. Of course, not all meltwater of ground ice or excess ice can drain and generate runoff, even with conducive topography and soil hydraulic properties and at very high temperatures of permafrost soils.
2.3. Hydraulic Conductivity of Frozen Soils
The active layer undergoes seasonal freezing and thawing, resulting in dramatic physical, chemical, and biological changes in SPW dynamics. Generally, SPW is phreatic because of the moving water table under the direct control of the atmosphere and the permafrost table. However, with the progressive downward ground freezing from the ground surface, SPW in the narrowing active layer becomes partially artesian before its complete drainage or freeze in situ upon freeze up. Permafrost soils have low permeability because of the presence of pore ice and the ensued low hydraulic conductivity. The permeability of frozen soils depends on the soil types, temperatures, and moisture contents and saturation. At subzero temperatures within a few tenths of 0 °C, soil hydraulic coefficients range from 10−9 to 10−5 cm s−1 and decrease slowly below −0.5 °C; frost-susceptible soils still have significant hydraulic conductivity well below 0 °C (Figure 2) [63,64,65,66].
As the aquifer freezes, more mobile and soluble salts and micro-components are excluded from the zone of ice formation into the unfrozen zone. This lowers the mineralization of the solid phase of groundwater and significantly increases solute concentrations in the liquid phase. Favorable conditions are thus provided for the formation of cryopegs, substantially altering the nature and degree of ground freezing and disrupting the initial hydro-chemical zonality. Repeated freeze–thaw cycles modify the physical properties of water-bearing materials, increasing their fracturing and effective porosity and forming higher saturation zones at the frozen–unfrozen interfaces. Ground freezing and thawing changes not only the hydrochemistry and hydraulic properties, but also the groundwater storage and hydrothermal dynamics [67].
3. Permafrost Degradation
Permafrost mainly presents in three poles (Arctic, QTP and periphery mountain ranges—the Third Pole, and Antarctica) and other alpine regions [1,2,3,68]. To varied extents, permafrost affects terrestrial ecosystem dynamics, water and carbon cycles, engineered infrastructures, and socioeconomic development [16,29,69]. Under a warming climate over the last 60 years, permafrost has been degrading across northern and highland regions, as evidenced by its shrinking areal extent, rising temperature, reducing thickness, the extensively melting of ground ice and subsequent thermokarsting (e.g., [1,69,70,71]), extensive subsidence of the ground surface, and thaw settlement of ice-rich foundation soils, with profound consequences (e.g., [19,70,72]). For example, the global average of the mean annual ground temperature (MAGT) rose by 0.29 ± 0.12 °C during 2007–2016 [14]. Permafrost studies have been flourishing due to increasing concerns on the feedbacks of permafrost C to climate systems and ecological impacts from degrading permafrost (e.g., [6,34,73]), sustainable water supplies in Central Asia, and the engineering ramifications (e.g., [29]). These studies can be classified into five types: (1) distribution and thermal state of permafrost; (2) hydrothermal dynamics of the active layer; (3) landscape changes and geohazards induced by degrading permafrost (e.g., [72,74,75,76]); (4) geo-ecological, eco-hydrological, and hydrological impacts from degrading permafrost; and (5) adaptive and mitigative measures to changing frost hazards. This section briefly reviews regional permafrost degradation.
3.1. Arctic and Boreal Regions
Permafrost has warmed over the last four decades with considerable spatiotemporal variability (e.g., [15,55,72]). MAGT and ALT are key indicators for changing ground hydrothermal regimes. Greater increases in MAGT are found in cold (<−1 °C) permafrost, with a typical rise of 1–3 °C in MAGT (e.g., [77]). In warm (≥−1 °C) permafrost, only appreciable change in MAGTs has been observed. Thawing of ice- and organic-rich permafrost has already started at some undisturbed sites.
Permafrost warming in northern Eurasia has been similar to that in northern Alaska and Canada [71]. In the continuous permafrost zone of the Russian European North and western Siberian Arctic, MAGTs have been rising at rates of 0.03–0.06 °C a−1 since 1970 in colder permafrost but with less pronounced warming in warmer and icier permafrost [71,78]. On the Alaskan North Slope and in the Canadian High Arctic, MAGT has increased by 1–2 °C during the last 30 years. Since 2000, warming of Nordic permafrost has been observed at rates of 0.01–0.08 °C a−1, with slower rates in regions of discontinuous permafrost (e.g., [79,80,81]). Recently, permafrost thaw has been accelerating in northern Norway [82].
ALT is characterized by large variability, from <0.5 m in regions of ice-rich permafrost in the High Arctic to >2 m in zones of subarctic/boreal discontinuous and mountain/plateau permafrost. During the last decade, at many locations in interior Alaska, there was no freeze up of the active layer. The proximity of the exceptionally ice- and organic-rich soil horizons to the ground surface, typical for the Arctic and Boreal zones, makes ground thermal regimes very sensitive to disturbances from the development of landscape processes, strongly impacting the stability of ecosystems and infrastructures [83,84,85]. In many regions, SSTs have been formed or are forming (e.g., [10]). The permafrost table at all sites has lowered, up to 8 m in the discontinuous permafrost zone in the western Russian Arctic [71].
3.2. Third Pole and Central Asia
As the world’s largest area of elevational permafrost, or ~15% of the total permafrost area in the Northern Hemisphere, permafrost in the Third Pole and Central Asia occupies about 3.5 million km2 [86,87,88,89,90]. On the QTP, MAGTs rose by 0.1–0.5 °C in the continuous permafrost zone during the 1990s–2010s; meanwhile, the lower limit of elevational permafrost elevated by 40–80 m during the last 50 years [5,87,88,91,92]. In the Tianshan (or Tien Shan) and Qilian mountains and western Mongolian Altai and Eastern Sayan mountains, during the 1980s–2010s, permafrost warmed by 0.2–0.4 °C in pristine ecosystems and by up to 0.6–0.8 °C in anthropically disturbed areas [86,87,89,93].
Generally, in the northern Tien Shan and Mongolian Altai mountains, average ALT has increased by 20–25% in comparison with that in the early 1970s [87,94]. ALT varies from 2.5 to 4.0 m, up to 5 m at some sites. Since the late 1990s, at some locations close to the lower limit of elevational permafrost, the permafrost table has been lowered to 6–8 m in depth, forming the SST. Across the QTP, MAGTs, typically measured at depths of 10–25 m, range from −3.3 to −0.3 °C and ALT, 1.0–3.5 m [92,95]. Additionally, a deepening active layer on the eastern QTP has resulted in a vertical detachment of permafrost, with the permafrost table at 4–7 m but the maximum depth of seasonal frost only at 2–3 m [5].
The latest results indicate a permafrost extent on the QTP of 1.06 × 10⁶ km2 (40%), implying a shrinkage from 1.60 × 10⁶ km2 in 1975 to 1.41 × 10⁶ km2 in 2002 and 1.26 × 10⁶ km2 in 2006 [68,92,96]. Projected changes for permafrost extent during the 21st century vary greatly under different scenarios of climate warming [97,98,99,100]. Ground warming trends in the active layer during 1980–2015 were 0.0439, 0.045, 0.040, and 0.026 °C a−1 at depths of 0–0.1, 0.1–0.4, 0.4–1.0, and 1.0–2.0 m, respectively [101]. However, an accelerated thickening of the active layer occurred during 1981–2018, with an average rate of ~2 cm a−1. Ground warming rates at the depth of 10 m during 2005–2017 ranged from 0.002 to 0.031 °C a−1, with an average of 0.015 °C a−1.
3.3. Xing’an-Baikal Region in East-Central Asia
In the latitudinal permafrost region in Northeast China, in general, permafrost has been retreating northwards since the Last Glacial Maximum (23–19 ka BP) [6,102,103]. Moreover, occurrence and growth of permafrost mainly depend on the favorable conditions of local environments, such as dense vegetation and thick organic and wet soils [4,104]. Located on the southern margin of the Eurasia permafrost body, the ecosystem-dominated (driven, modified, or protected) Xing’an-Baikal permafrost is sensitive to climate warming [21,22]. Boreal vegetation and organic-rich soil layers have important influences on the underlying permafrost (e.g., [105,106]).
Based on complex interactions of climatic and ecological processes in permafrost formation and degradation, permafrost is divided into five patterns: ‘climate-driven’, ‘climate-driven, ecosystem-modified’, ‘climate-driven, ecosystem-protected’, ‘ecosystem-driven’, and ‘ecosystem-protected’ permafrost [3,83] (Table 1). This classification is mainly based on the resilience of permafrost to climate warming and natural disturbances, such as wildfires and land reclamation [83]. Permafrost in the Da and Xiao Xing’anling mountains in Northeast China is generally warm, thin, and sensitive to fire and anthropogenic disturbances [22,93,105]. The distribution of discontinuous and sporadic permafrost relies on both climate and local factors [83]. Therefore, according to the new classification, from north to south, permafrost in the Xing’anling mountains can be divided into ‘climate-driven, ecosystem-modified or -protected’ and ‘ecosystem-driven or -protected’ [68]. Under a warming climate and increasing human activities and wildfires, permafrost in Northeast China has been degrading more rapidly, and the southern limit of latitudinal permafrost has been moving northwards during the last 60 years, and will do so more during the next 40–50 years under a warming of 1.0–1.5 °C, reducing the permafrost extent to 35% of that in the 1970s–1980s [4,6,21,22,99,102,103]. However, the responses of permafrost to climate warming are complicated by interactive biophysical factors [3]. Strong negative feedbacks from the coupled vegetation–soil processes enhance the resilience of permafrost to climate warming and external disturbances, but otherwise those positive feedbacks from thaw settlement and the ensued pooling, makes the Xing’an-Baikal permafrost more vulnerable [29,84,107]. Therefore, both climate warming and external disturbances have important effects on the Xing’an-Baikal permafrost [21,86,94].
3.4. Other Regions: Alps, Nordic, and Southern Hemisphere
During the recent decades, a long-term regional warming of permafrost of 0.5–1.0 °C has been revealed from borehole data from Svalbard to the Alps. In Scandinavia and Svalbard, a decadal warming of 0.4–0.7 °C has occurred and has been continuing in near-surface permafrost [108,109]. Based on borehole temperatures at 16 coarse-grained sites at elevations of 1580–3400 m a.s.l., the previous warmest four-year period ever in measured air temperatures has led to surface and ground warming in Swiss permafrost regions and to a slightly increased ALT in ice-rich permafrost since 2003 [110]. Temperature data from three 100-m-deep boreholes in alpine permafrost zones in Svalbard and Scandinavia have revealed a ground-surface warming of 0.5–1.0 °C over the past decade.
Active rock glaciers and other types of permafrost [111,112] are monitored in several countries in South America, with a total area of 100,000 km2. At >3500 m a.s.l., Andean permafrost varies significantly in MAGT, ice content, distribution, and climatic vulnerability. Continuous permafrost is found at various elevations with a mean annual air temperature of <−2 °C and annual precipitation at ≤800 mm in the central Andes. Additionally, permafrost occurs in groups of rock glaciers, with a lower limit of elevational permafrost at 3700–3800 m a.s.l. However, permafrost degradation has recently restarted. Thus, a gradual increase in thaw penetration between 1992–2007 at rates of 15–25 cm a−1 was observed for two rock glaciers, Mendoza, Argentina [111]. Permafrost degradation directly affects Andean River runoff and could temporarily enhance the regional water supply [112]. There are 24 Circum-Arctic Active-Layer-Monitoring Southern Hemisphere sites in Antarctica. Thermokarsting has accelerated in the Garwood Valley, Antarctica, with the rate of thermokarst erosion ~10 times higher than the average rate of that in the Holocene [113].
Thus, data from Global Terrestrial Network-Permafrost and Circum-Arctic Active Layer Monitoring networks show a general ground warming over the last four decades, with the highest warming rates in zones of continuous, cold permafrost, while warmer permafrost regions show a less pronounced warming (Table 2).
Some locations have experienced the lowering of the permafrost table and SST development. Permafrost thawing has occurred in natural, undisturbed conditions. Thawing of Holocene and Little Ice Age permafrost has been observed at many locations (e.g., [5,6,102,103]). There are some indications of the restart of the degradation of older Late-Pleistocene permafrost at some undisturbed locations across North America and Eurasia, resulting in enhanced post-cryogenic processes, such as thermokarsting, thermal erosion, and thaw slumps, affecting the stability of ecosystems and infrastructures [16,29]. Alpine permafrost degradation could lead to the activation of permafrost-related hazards, such as thaw slumps, mudflows, detachment failures, debris flows, and landslides [50,123,124].
In short, it is evident that: (1) permafrost is warming at 0.002–0.05 °C a−1; (2) there are some places without a noticeable increase, but, and only occasionally, few known sites for cooling; (3) ALT is increasing at some locations, and there are some locations in West Siberia, Alaska, and Central Asia where the active layer no longer freezes up every year; (4) long-term permafrost thawing has already started at some locations in undisturbed conditions; and (5) the nature and rate of permafrost degradation differ substantially. During recent decades, permafrost hydrogeology has been changing rapidly due to greater warming at high latitudes and high elevations. Several reviews have been published on related topics, such as the evolution of groundwater flow systems in areas of degrading permafrost [25], controlling of permafrost degradation on hydrological regimes [26], climate-change impacts on groundwater [27], hydrological impacts of thawing Circum-Arctic permafrost [75], and cryo-hydrogeology in China [18,45]. However, our understanding remains inadequate on cryo-hydrogeology, especially in Central and high-elevational Asia, the key components of Asian Water Towers. Thus, the hydrogeological impacts of degrading permafrost await systematic, in-depth, and coordinated studies and more accurate and model predictions and timely evaluation because of their pivotal roles in the water balance and supplies for the Asian Water Towers and regional ecological safety and water security [5,50,88].
4. Change Configurations of Groundwater Systems and Hydrological Impacts
Hydrogeological cycles in permafrost regions, or cryo-hydrogeological cycles, differ from those in non-permafrost regions. The thickness of the vadose zone and laws for governing moisture and water movement and hydrothermal processes are closely related to and vary greatly due to the complex multi-phase dynamic processes of multi-porous soils and the subsequent complicated and coupled systems of surface and subsurface waters changing with temperatures. In cold permafrost zones, ground freezing and thawing at various spatiotemporal scales controls or strongly affects the phase changes, movement, distribution, and cycles of groundwater and the formation, growth, and melting of ground ice [125]. Therefore, most of those groundwater flow theories and models, especially those commercial models, for temperate zones cannot be directly applied to cryo-hydrogeological structures and functions. Additionally, because of remoteness, difficult logistics and prohibitive costs, field data and parameters for cryo-hydrogeological systems are sparse, and the paucity of these key data makes cryo-hydrogeology one of most challenging branches in water science.
4.1. Impacts on Hydrogeological Structures
With a high spatiotemporal variability in aquifers and flow dynamics, groundwater in permafrost regions is controlled or directly affected by the distribution and hydrothermal dynamics of the active layer, permafrost, and taliks of various origins and states, and groundwater is mostly recharged by precipitation, snow and ice melt, surface waters, and various types of other groundwaters. SPW occurs generally above the permafrost table and is directly connected to the atmosphere (phreatic) or seasonally artesian upon the two-directional ground freezing from the ground surface and from the permafrost table. Thus, climate change and surficial environmental disturbances can directly and rapidly affect the dynamics of SPW, the focus for most of cryo-hydrogeological research [16,18,75]. Sub-permafrost water is usually confined by the overlying permafrost layer(s). Thermokarst lakes, icings, springs, and pingos are commonly related to the discharge of sub-permafrost waters. With permafrost degradation, hydraulic connectivity is improving due to the expansion of open taliks, opening of closed taliks, and vertically and laterally declined permafrost continuity. Șerban et al. (2020, 2021) found dramatic changes of thermokarst lakes/ponds and groundwater changes across permafrost landscapes in the Headwater Area of Yellow River on the northeastern QTP [126,127]. However, most of these dramatically changing, but otherwise smaller, thermokarst ponds and their hydrological impacts were often ignored in estimating water budgets. Jones and Arp (2015) observed catastrophic drainage of thermokarst lakes north of the Teshekpuk Lake in Arctic Alaska due to wedge-ice melting and thermal erosion [128]. In regions of degrading permafrost, rapidly and extensively emerging open taliks (sinkholes) boost infiltration of surface waters and precipitation (sink-holing effect), resulting in reduced summer streamflows and peak-flows and elevated winter baseflow, as well as shifted seasonal regimes of streamflows and distributive features of surface and subsurface waters (e.g., [129,130]). This involves seasonal shifts in streamflow, decreased maximum and/or minimum of monthly streamflow, and flattened hydrographs, as indicated by a widespread augmentation in winter baseflow in northern catchments (e.g., [131,132]) and on uplands (e.g., [130,133]). Ye et al. (2009) noted a good correlation between permafrost coverage and the ratio of maximum/minimum monthly streamflows (Qmax/Qmin) in the Lena River Basin, Eastern Siberia, Russia [134]. Ma et al. (2020) also suggested a similar relation between permafrost coverage and the ratio of Qmax/Qmin in the Source Area of the Yellow River (SAYR) on the northeastern QTP, with a threshold permafrost extent of 40% for a significant streamflow impact [130].
Flattening hydrographs, increasing groundwater storage, and extending flow paths have been observed in many northern regions and on uplands. Direct observations are sparse for hydrogeological changes in association with permafrost degradation [135]. However, evidently more active groundwater flow systems resulting from degrading permafrost may have augmented the groundwater discharge, particularly in winter, to surface run-off systems [25,130]. Records of streamflows in permafrost basins have been analyzed for understanding changes in baseflow contribution to annual total streamflow, and rising streamflows and baseflows or their ratio in annual discharge, have been interpreted as an indicator for a reactivation of groundwater flow systems resulting from permafrost degradation (e.g., [99,136,137,138]).
In its simplest form (Figure 3), under a warming climate, annual hydrographs will be flattened over time as groundwater flow is increasingly acting as a water cycle pathway in river catchments. When the net water balance does not change, and hence the total discharge through the system remains stable, this volume, as represented by the areas underneath these curves, remain unchanged. In such a system, the ratio of Qmax/Qmin will decline. Using this measure to indirectly detect hydrogeological changes and monthly average discharge, a steady decline of the ratio Qmax/Qmin since the 1930s was first reported for parts of the Lena River Basin [134] and since 1960 for the SAYR, the northeastern QTP [67,130]. Because of seasonal increases in winter baseflow, declines in discharge from late summer or autumn into winter should also be less rapid. Such changes in baseflow recession for the autumn–winter transition were quantified for several catchments with contrasting permafrost conditions in Siberia [139], in Siberian Arctic basins [135], and for four sub-basins in the SAYR on the northeastern QTP [130].
By introducing the Kendall-τ test, St Jacques and Sauchyn (2009) made a sophisticated hydrograph analysis in the Northwest Territories, Canada, attributing the increased winter baseflow and mean annual streamflow to permafrost thaw and resultant enhanced infiltration and deeper flow paths, as well as intensifying hydrological cycling under a warming climate [129]. Using daily discharge data from the Yukon River, Alaska, Walvoord and Striegl (2007) applied more sophisticated techniques for separating baseflow and quickflow components in river hydrographs [140]. The authors of the latter paper also concluded that there was an increased baseflow in many places across the Yukon River Basin. In the meantime, during 1936–2019, the streamflows of the Ob, Yenisei, and Lena rivers increased by ~7.7%, 7.4%, and 22.0%, respectively, mostly due to increased precipitation and possibly also due to permafrost thaw under a warming climate [141]. While river discharge records could contain quantitative insight into changing baseflow conditions, the interpretation of such changes has to stem from groundwater activation related to permafrost thaw and is not unambiguous for areas with marked hydrometeorological changes, such as increases in precipitation, evaporation, or groundwater storage. Therefore, this remains a challenge.
Where the water table rises, or even the elastic storage changes over larger depth intervals in deep aquifers, groundwater storage will significantly increase and can be detected by gravimetric data (e.g., Gravity Recovery and Climate Experiment, or GRACE). On the basis of GRACE data for Arctic permafrost regions, groundwater storage increased in the Lena and Yenisei basins, decreased in the Mackenzie basin, and remained stable in the Ob watershed; it is hypothesized that these changes are linked to talik development in the continuous permafrost zone and the reduction in permafrost extent in the discontinuous permafrost zone [142]. GRACE data also indicate significant changes (9.06 ± 0.01 mm a−1, or 21.89 ± 0.02 billion m3) in water storage in the Source Area of the Three Rivers (Yellow, Yangtze, and Lancang/Mekong) on the northeastern QTP during 2003–2010 despite slight increases in precipitation and runoff and a decline in evaporation; most changes occurred in the continuous permafrost zone, with a total amount of 13.94 ± 0.48 billion m3, while it was in a state of loss in other permafrost zones or regions [143]. Water storage in the mountains in Central Asia increased eastwards and went up in summer and winter but with fluctuations, while it declined in autumn due to the influences of changing precipitation to some extents [144].
In thick, continuous, and thermally stable permafrost regions, with poor hydraulic connections between supra- and sub-permafrost waters, SPW rapidly flows laterally to streams or lakes and could be partially artesian due to the early winter freezing of the active layer (Figure 3). Hydrographs in stable permafrost basins generally have a sharp summer peak and a large spring snowmelt peak in some regions. However, in regions of degraded or degrading permafrost, permafrost becomes thinner, warmer, and discontinuous, with rapidly improving hydraulic connectivity and flattened hydrographs; baseflow would rise due to enlarged groundwater storage; hydrographs would shift to the right (flow peaks may delay) because of advanced spring snow melting and ground thawing and delayed and elongated ground freezing.
One of the dominant characteristics of water mass budget, namely, groundwater storage, is changing in different ways and at various rates. Precipitation, glacier mass loss and ground-ice melt are major sources of water supply and groundwater storage controls (e.g., [50]). Analysis of reported results (Table 3) suggests a remarkably intensified hydrologic cycle over recent decades. Various ways of changing hydrogeological processes strongly depend on shifting ground freeze–thaw processes and permafrost conditions. Permafrost-change induced hydrogeological shifts during different periods of the Late Pleistocene and Holocene and have intensified again recently, leading to groundwater storage modification, such as changes in the structures of flow systems and flow paths in regions of degrading permafrost. Processes of active-layer deepening and talik formation and/or expansion can potentially provide additional room for infiltration of increased precipitation and meltwater to aquifers, boosting groundwater storage.
4.2. Impacts of Permafrost Degradation on Hydrogeological Functions
4.2.1. Changing Water Balance and Hydrogeological Cycles
In areas of degrading permafrost, accelerated groundwater cycling has led to marked hydrological changes. Permafrost-confined waters and ground ice have remained immobile often for millennia or more, with minimized recharge fluxes to sub-permafrost systems as compared to temperate climate zones. Hence, permafrost degradation would activate groundwater flow systems. Not only will groundwater discharge fluxes increase (see Section 4.1), but also the spatiotemporal characteristics of groundwater recharge will change substantially [26]. Hence, the overall water balance of river basins would shift. The ramifications of these changes for water management remain largely unclear because of great uncertainties in the net balance of these basin-wide changes, either verging towards drying or wetting conditions. Currently, locked in permafrost, the water/ice of geological ages can present in sub-permafrost aquifers; the incursion of shallow recharge waters can be detected by dating the sub-permafrost water.
4.2.2. Shifting Groundwater Dynamics: Recharge, Flow Paths, and Discharge
Permafrost degradation has greatly affected the permafrost–groundwater systems. For example, lowering the permafrost table would directly lower the SPW table. In the meantime, ground hydrothermal regimes have been modified, such as shortening the period of ground freezing and elongating that of ground thawing. These changes further impact cryo-hydrogeology and cryo-ecohydrology.
- (1)
- Hydrological impacts from changing active layer processes
Because of the constraints of frozen ground for groundwater flows, thaw depth substantially affects the soil moisture content in the active layer [160]. At the beginning of near-surface ground thawing, both soil moisture contents and evapotranspiration increase. However, with a progressively deepening thaw, evapotranspiration may decline [161]. Based on study results using isotope and multi-source models, it is evident that, on the QTP, the extensively identified ice layer at the permafrost table was mainly fed by soil moisture from the active layer [162,163]. In the Fenghuo Mountains in the Headwater Area of the Yangtze River on the interior QTP, source tracing by stable oxygen and hydrogen isotopes indicates a very important role of ground freeze–thaw depths in modulating streamflows in permafrost regions [164]. Deepening the active layer enhances soil moisture infiltration and subsequently the moisture content declines in near-surface soils, further leading to reduced vegetative cover and altered rain- and snow-fall interception and re-distribution. Degrading vegetation will also lower the presence of plant roots and soil aggregates, further reducing soil water retention. Thus, permafrost degradation weakens ecosystem modulation for streamflow dynamics and lowers near-surface soil moisture contents.
- (2)
- Impacts of permafrost degradation on streamflows
Permafrost degradation significantly affects surface runoff generation, as evidenced in groundwater movement, near-surface soil hydraulic properties, and inter-annual variations in streamflows [99,165,166]. Thawing of the permafrost as a water-confining layer can affect the migration paths and storage of groundwater and ultimately affect the discharge process of groundwater to surface waters, i.e., the process of water recession. Therefore, permafrost changes can be inferred from changes in the recession process (e.g., regression curves) [167,168]. Changes in groundwater discharge will directly affect the recharge process and amounts of surface waters. Based on studies on changes in surface runoff in the Shu’le, Hei’he, Shi’yang, and upper Yellow rivers in Northwest China, Niu et al. (2011) concluded an increased permeability of near-surface soils and enhanced modulation of groundwater, leading to altered surface runoff processes [165]. The modeling of saturated-unsaturated transport on exchanges of subsurface and surface waters on the northern QTP under a warming climate indicates more water contribution from the deepening active layer to streamflows, which would be enlarged by 1/3 during the next 40 years; however, discharge of groundwater will decline by 1/3 because of the combined influences of enlarging soil permeability and the thickening active layer [169].
- (3)
- Increasing hydraulic connections and preferential flows
Preferential groundwater flow is generally limited to taliks in permafrost regions. Taliks can develop as a result of the presence of surface water bodies. Ground-based (e.g., [170]) and air-borne resistivity measurements (e.g., [171]) are effective for mapping taliks. Although preferential flow through taliks is also widely reported across the Arctic, their origins are widely speculated (e.g., [10,53,58,172]), and their driving processes and evolutionary timescales remain uncertain.
4.2.3. Melting Ground Ice and Contributions to Streamflows on the QTP
Based on wellbores from 164 boreholes, including those along the Qinghai-Tibet Highway from Golmud, Qinghai Province, to Lhasa, Tibet Autonomous Region; in the Zhuonai Lake; Gaizê and Wenquan areas in Tibet Autonomous Region; in the Altyn Tag and West Kunlun mountains in Xinjiang, China; and maps of Quaternary sediments and permafrost distribution and thickness on the QTP [155], the water equivalent of plateau ground ice is estimated at up to 12,700 km3, or twice that of plateau glacier ice [90].
- (1)
- Ground-ice storage and ice melt in the SAYR on the northeastern QTP
Based on geomorphic and genetic types of Quaternary deposits, lithology and soil types, and soil moisture contents as revealed from 105 boreholes, the ground-ice reserve in the SAYR was estimated at 49.62 ± 17.95 km3 with a ground-ice density of 0.293 ± 0.107 m3 m−3 at depths of 3–10 m (the top 0–3 m is the active layer) [137,173,174]. According to results from field monitoring and model predictions, during the last decade, the active layer in the SAYR has been deepening at rates of 2.2–4.4 cm a−1 [175]. Thawing permafrost in the SAYR may release meltwater at a rate of about 0.16–0.32 billion m3 a−1.
- (2)
- Ground-ice storage and ice melt in the Qilian Mountains on the northeastern QTP
Based on statistics of ice contents, areal extent, thickness, and table of permafrost as revealed from 196 boreholes, ground-ice storage at depths of 3–10 m in the Qilian Mountains is estimated at 68.5 km3, with unit areal ground-ice storage at 0.82 m3 m−2 [176]. During the last decade, thawing permafrost may have released 11.8 km3 of ice-melt water. The top 10 m of permafrost is projected to thaw during the next 50 years.
- (3)
- Hydrological significance from deactivating rock glaciers
Globally, rock glaciers (RG) are widespread in mountainous regions. Their thermal states are inadequately understood, and their hydrological contributions remain largely unknown, but RGs are increasingly important under a warming climate, particularly relative to persistently and more rapidly retreating glaciers. The first near-global RG database includes more than 73,000 RGs, with a water equivalent of 83.72 ± 16.74 Gt [177]. The first comprehensive Nepalese RG inventory has estimated ice reserves of 16.72–25.08 billion m3 of water equivalent [178].
4.2.4. Groundwater Storage and Modulation Functions
Permafrost and taliks play a major role in drainage control in Arctic and alpine watersheds. Watersheds with a low areal continuity of permafrost and well-developed talik have a baseflow of about 80% of discharge. Watersheds with a high percentage of permafrost and poorly developed talik have a baseflow from 50–60% of discharge in early summer, in comparison with that of low-permafrost percentage watersheds. Lamontagne-Hallé et al. (2018) applied a coupled model for heat and groundwater flow with dynamic freeze–thaw processes and an improved set of boundary conditions to simulate the impacts of a warming climate and degrading permafrost on groundwater discharge to surface water bodies [132]. The results showed a downslope shift in discharge and an increasing winter discharge due to the formation of a lateral SST.
During the last few decades, as a result of permafrost degradation, groundwater storage in some regions on the QTP has increased to varied extents: 2.46 ± 2.24 Gt a−1 in the Jinsha River Basin, 1.86 ± 1.69 Gt a−1 in the Source Area of the Yangtze River, 1.14 ± 1.39 Gt a−1 in the SAYR, 1.52 ± 0.95 Gt a−1 in the Qaidam Basin, 1.66 ± 1.52 Gt a−1 on the interior Qiangtang Plateau, and 5.37 ± 2.17 Gt a−1 in the upper Hindus River Basin (Table 3) [151]. Zhang et al. (2017a) also found increases in plateau lake-water volume at 7.72 ± 0.63 Gt a−1 and plateau groundwater storage at 5.01 ± 1.59 Gt a−1 [144]; among these increased streamflows on the QTP, ground-ice meltwater accounted for 12% and glacier melt for 13%, while precipitation accounted for 74%. Based on variations in the recession coefficient of winter streamflows in the Hexi Corridor to the northeast of the QTP during the last 50 years, Niu et al. (2011) found an enlarging storage space for groundwater, possibly due to degrading permafrost [165].
4.2.5. Thermokarsting and Thermokarst Lakes and Ponds
Many sinkholes, thermokarst ponds, and depressions have been observed. Complex groundwater flows affected by extensive thermokarsting challenge accurate measurement and quantitative prediction of groundwater dynamics, quantity, and quality, and thwart these endeavors for the remediation of contaminated groundwater. A better understanding of thermokarst hydrogeology in discontinuous permafrost regions will benefit regulatory agencies and communities in the north and uplands relying on clean and safe water resources.
Recently, thermokarst ponds have drained, overflowed, and/or shrunk, or migrated or expanded (e.g., [75,179]). Based on satellite data, the total areal extent of thermokarst lakes in the Siberian continuous permafrost zone enlarged by 12% during 1975–2005, accompanied by a 4% increase in the number of such lakes [180]. Active-layer detachment slides may result upon the rapid thaw of the ice-rich transient layer, due to poor drainage, critical pore-water pressure, and effective stress in thawed fine-grained soils at the thaw front, with low hydraulic conductivity on ice-rich permafrost slopes [123,181]. Thaw slumping has also been accelerating under a warming climate, with varied impacts on landscape, ecosystems, carbon fluxes, and engineered infrastructures. In addition, thaw gullies are formed by thermal erosion along the active layer and permafrost table (e.g., [182]), typically associated with ice-wedge polygon networks by preferential flow, resulting in rapid lake drainage, the development of large gully networks, or giant thermo-erosional sinkholes or tunnels [183]. Thermokarst lakes and ponds, as well as drained lake basins, abound in tundra, boreal, and alpine permafrost regions, and they are related with taliks of all stages. Globally, the water surface and volumes of these lakes are on the rise, with marked climate and environmental implications, such as carbon emissions and shifts in hydrogeological environment and ecological successions. More and frequent development or drainage of thermokarst lakes is deemed unavoidable under a warming climate and the subsequent degrading of permafrost, as manifested during the Late Pleistocene to Holocene transition and Holocene Megathermal period [184,185,186].
These activating thermokarsts may greatly and rapidly improve hydraulic connections among different layers of supra-, intra-, and sub-permafrost waters and surface waters, altering water systems and greenhouse gas balances. Rapid thermokarsting affects hydrogeology at point to watershed scales, such as, in some extreme conditions, partial/seasonal or complete/perennial closure of small basins, particularly in headwater areas of major rivers in arid regions. However, hydrothermal and hydro-chemical exchanges among lake and river waters and groundwater and ground and lake ice are very complicated and await further, in-depth studies.
4.3. Changing Configurations of Hydrogeological Systems in Different Regions
4.3.1. Low-Latitude Elevational Permafrost Regions
On the QTP, extensively present SPW has important roles in permafrost degradation and frost hazard occurrences. Plateau aquifers of SPW are widely identified in Quaternary deposits and fractured and weathered bedrocks, where permafrost controls the supplies, flow, and discharge of groundwaters [45]. In the meantime, groundwater dynamics are also affected by topography, geomorphology, tectonics, and surface water bodies. Consequently, SPW in each geomorphologic unit displays strong regional differentiations. In addition, permafrost thickens with rising elevation, altering groundwater dynamics and the seasonal variability of SPW in aquifer thickness, flow velocity, water temperature, hydrochemistry, and groundwater kinetics [46]. The aquifer thickness of SPW is generally associated with ALT (generally at 1–3 m) and the burial depth of the permafrost table due to the extensive occurrence of SSTs. In particular, in the vicinity of rivers and lakes, aquifer thickness and groundwater storage are large. Local topography controls the spatial distribution of an SPW aquifer, with large groundwater storage in lowlands and an absence of a unified aquifer in uplands and upper slopes strongly affected by surface runoff and evapotranspiration and the resultant low water availability. Thus, a plateau aquifer of SPW generally forms in the warm season from April to November in a year, and SPW cycles every 1–4 years.
Studies on plateau SPW are focused on three areas: the Qinghai–Tibet Engineering Corridor from Golmud to Lhasa, SAYR, and Qilian Mountains. Along the Qinghai–Tibet Engineering Corridor with five paralleling lifelines, the occurrence of SPW has key impacts on engineering stability and the evolution of permafrost environments [91,92]. In the SAYR with numerous intermontane basins and thermokarst lakes, rich runoffs, and thousands of lakes and taliks, ample ground and surface waters enrich the unique basin cryo-hydrogeology [5,91,187,188]. As a key water supply, SPW controls the near-surface water cycles in the SAYR. In the Qilian Mountains, many inland rivers and their flow dynamics are strongly affected by complex terrestrial processes, alpine glaciers, and ample groundwater storage. Extensively occurring SPW plays an indispensable role in water division and the interactive exchange of groundwater and surface water flows.
4.3.2. High-Latitude Permafrost Regions
- (1)
- Da Xing’anling Mountains in Northeast China
The Da Xing’anling Mountains are on the margin of the Eurasia permafrost body, with ridge elevations generally at 1100–1500 m a.s.l. and SPW in intermontane and river valleys. As a result of moderate annual precipitation (400–600 mm), the area is densely covered by forests and wetlands in the Heilongjiang-Amur River Basin [189,190]. Groundwater occurrence is controlled or affected by tectonics, lithology, weathering, and geomorphology [191]. SPW is mainly found in river valleys in the northern Da Xing’anling Mountains, where the aquifer thickness and water storage increase with deepening thaw depth. SPW is mainly fed by precipitation; it is fed by surface waters in thaw season and discharges to surface waters in freezing and dry seasons [46,192].
In addition to topographical and geomorphological influences, SPW in weathered rock zones is also affected by surface roughness and ecosystems above the bedrock as aquitard. A thin and water-poor aquifer layer implies large seasonal fluctuations in SPW dynamics. The moderately water-rich aquifers of Jurassic volcanic conglomerates are mainly found in regions of low hills on the northern flanks of the Yile’huli Mountain knots; those of water-poor aquifers of Jurassic volcanic rocks, in middle hills on the southern flanks and water divides of the Yile’huli Mountain knots [46].
- (2)
- Russia
Extensive permafrost in Russia occupies about one-half of Russian land territories. Thus, the dynamics of SPW are closely related to changes in the air temperature across the vast territories of various types [166]. SPW is extensively found in the Lena River Basin in Eastern Siberia, where the permafrost extent is about 40–50%, with a mix of supra- and intra-permafrost waters with a residence time of generally 1–55 years, and permafrost degradation will greatly boost groundwater recharge [134,193]. The table of SPW is mainly controlled or affected by snow melt, precipitation, and ground freeze–thaw processes. However, with persistent climate warming and degrading permafrost, SSTs have been increasing [10].
High-latitudinal permafrost zones generally have some anthropogenic activities and taliks. These will impact SPW through urban residential centers, engineering corridors, and mining and farming activities. Technogenic impacts have greatly impacted the hydrogeology and hydro-chemistry of groundwater in northern Russia, although technogenic impacts are generally localized.
- (3)
- North America
In Alaska and northern Canada, studies on SPW are mainly focused on several major basins, such as Yukon, Mackenzie, and other Circum-Arctic river basins. The 3300 km long Yukon River winds across NW Canada and Alaska, where permafrost varies greatly in areal extent and thickness. Because of climate warming and permafrost thawing, the ratio of groundwater to river discharge has been rising at rates of 0.7–0.9% per year during the past 30 years [140,194]. In particular, SPW accounts for 90% of river discharge during the spring thaw season, thus indicating the key role of SPW in river hydrology. Although the groundwater discharge to river and groundwater storage have been enlarging in the Yukon River basin, the contribution ratio of SPW to baseflow is reduced. In addition, lakes and groundwater are closely related with talik formation and expansion under a warming climate because of the enhanced permafrost thaw and boosted SPW flow rates. Seasonal freeze–thaw cycles affect the movement and freezing of SPW and exchange of lake water between supra- and sub-permafrost waters. On slopes, SPW also drains laterally and vertically, such as those in the Wolf Creek, where vertical infiltration and evaporation are evident on the southern slopes, but SPW is stored more on the northern slopes because of the impedance of groundwater downward infiltration by the underlying permafrost.
In the Canadian Arctic, runoff is generally supplied by snowmelt and rainfall and discharged by evaporation and lateral runoff, such as surface and subsurface flows. Subsurface flow is strongly related with hydraulic conductivity, ALT, and water table. Wetlands and pingos are generally supplied by SPW, such as on the Cornwallis Island in Northwest Canada, where ground thawing in the active layer has great impacts on the slope runoffs and SPW discharge. Wetlands are extensively developed due to the ample supply from precipitation and SPW. Due to the sorting, fine grains are found in the frost mound center, but the intra-mound trenches are coarse-grained, where preferential flows of SPW occur with saturated hydraulic conductivities of 90–1000 m d−1 in comparison with those of 0.1–1.0 m d−1 in the mound centers [195].
4.4. Ecological Impacts and Adaption
Permafrost degradation has been reshaping or modifying northern and highland ecosystems, and the soil–vegetation systems in particular. More interests are focused on the topic not only due to the direct ecosystematic responses to permafrost degradation, but also to indirect scopes to understand carbon cycles and fluxes upon permafrost thaw, particularly abrupt permafrost thaw (e.g., [16,29,35,196,197,198,199]). Permafrost degradation results in a loss of some boreal forests, shifts in plant composition and productivity, plant diversity, and changes in vegetation communities from terrestrial to wetlands, or from alpine meadows to alpine steppes or further to alpine deserts, through the changing dynamics of permafrost ecohydrology, soil nutrients, and soil biogeochemistry in a deepening active layer [16,29]. These changes, in turn, have important implications for the hydrothermal regimes of near-surface permafrost and the active layer through the interception of snowfall and solar radiation by vegetation and through changes in evapotranspiration. Understanding the mechanisms for the impacts of permafrost degradation on vegetation is crucial for proper simulation and better prediction of ecological successions and carbon cycles in permafrost regions under a warming climate (e.g., [34,200]).
Permafrost degradation and its hydrological and ecological consequences have been widely documented. For example, Yang et al. (2010) reviewed recent progress in studies of permafrost degradation and its environmental impacts on the QTP, with foci on the consequent land desertification and soil biochemical changes [74]. Yang et al. (2010) reviewed the impacts of permafrost degradation on alpine and Arctic ecosystems, particularly elaborating the effects on ecosystem structures and functions [74]. Walvoord and Kurylyk (2016) reviewed the hydrological impacts of thawing permafrost in the Pan-Arctic regions [75]. With foci on the environmental consequences of permafrost degradation, Oliva et al. (2018) reviewed the progress in studies on thermal regimes of permafrost and cryo-hydrochemistry, and their impacts on landscapes [201]. However, the mechanisms for the impacts of degrading permafrost on vegetation remain a challenge for permafrost ecologists. Inadequate attention has been paid to how permafrost degradation would affect vegetation in Arctic and Boreal zones and high-plateau and alpine regions [29]. Although there have been some regional and thematic research and papers on the ecological impacts of degrading permafrost, the mechanisms for the impacts of permafrost degradation on vegetation have not yet been investigated systematically and in-depth. Under a warming climate, these impact mechanisms are crucial for many stakeholders. The review of Jin et al. (2021b) focused on the impacts of degrading permafrost on vegetation and its mechanisms [29].
In addition, a large quantity of organic carbon (~1832 Pg; 1 Pg = 1015 Pg) is stored in permafrost regions [34,202], about 2.5 times that in the atmosphere [203]. Under a warming climate, permafrost degradation alters the carbon budget in permafrost regions [32,204]. As a major constituent of the lateral and longitudinal export of terrestrial carbon to aquatic systems (e.g., soil solution (~0.4 Pg C year−1) and rivers/streams (~0.06 Pg C year−1)), dissolved organic carbon (DOC) will shift organic carbon fluxes in permafrost regions [73]. Major DOC sources include vegetation leachates [205], surface organic soil [206], and permafrost soils [207]. Soil organic carbon in the Circum-Arctic permafrost regions is estimated as 472 ± 27 Pg C in topsoil at 0–1 m in depth [208]. Based on a DOC extraction experiment in a laboratory, Prokushkin et al. (2009) suggested 1% (~4.72 Pg C) of surface organic soil is DOC [209]. Fritz et al. (2015) noted a stock of ~45.2 Tg C (1 Tg = 1012 g) DOC in Arctic Yedoma soils [210]. In discontinuous permafrost regions, the expansion of open taliks and declining areal continuity of permafrost will benefit the infiltration of summer rainfall [75]. Thus, elongated and deepened flow paths will impact the lateral and longitudinal transport of DOC export [207,209]. Climate warming and permafrost thaw will further complicate DOC export in individual catchments. Moore et al. (1998) predicted a decrease in DOC export in Canadian peatlands under 2 × CO2 General Circulation Model scenarios [211]. Frey and Smith (2005) suggested a marked increase in DOC export in West Siberia by 2100 [212]. Walvoord and Striegl (2007) projected a DOC decline due to an enhancement in groundwater fraction of annual flow [140]. Tank et al. (2016) noted an increased DOC export in the Mackenzie basin based on a 39-year record [213]. However, in-stream DOC and annual exports vary to a relatively small extent at 1–60 mg L−1 and 0.1–10 g C m−2 year−1, respectively [73].
4.5. Engineering Impacts and Mitigative Strategies
Groundwater can affect engineering stability due to the interruptions of cryo-hydrogeology by building new facilities or operating existing engineering structures, secondary frost hazards as induced by engineering works, and the accelerated permafrost degradation as facilitated by engineering-enhanced groundwater flows. SPW is the most involved and thus more studied among all three types of groundwater in permafrost regions (e.g., [214]).
With increasing anthropogenic and engineering impacts under a warming climate, the presence of SPW and its carried heat evidently affect the thermal budgets of foundation soils, directly impacting engineering stability and safety [72]. Infiltration of SPW, permafrost degradation, and engineering stability interact intensively, but their quantitative relationships await further explorations. From the literature review, most related studies are on the effects of SPW on roads, railroads, and airports/runways. For highways, partial SPW will enter the roadbed upon rising groundwater table. With the elapsing operation times of highways, SPW (generally 2–4 °C in temperature) infiltration and preferential flows in the active layer and roadbed will further degrade the underlying and ambient permafrost, resulting in the formation and/or expansion of SSTs and the subsequent differential thaw settlement of roadbeds and railbeds and cracks on road surfaces.
Permafrost has evidently degraded along the Alaska Highway since the 1970s under a climate warming of 1.5–2.0 °C [215,216]. Numerical modeling indicates that, after 50 years, permafrost thaw will deepen by 8 m under roadbeds due to groundwater infiltration, and the ground temperature will rise by 2.1 °C in highway subgrades. SPW has also impacted the stability of Qinghai–Tibet Railway. Studies indicate that SPW ponding and runoff along the Qinghai–Tibet Railway result in lateral thermal erosion: nine years after railbed construction, a 5.5-m-thick 0 °C layer occurred, resulting in an accumulative thaw settlement of the foundation soils by 16 cm [217,218]. The Aufeis formation and underground icing in some of the pile foundations of powerlines along the Qinghai–Tibet Engineering Corridor has also revealed the activities of the groundwater, resulting in some unexpected damage [214]. Airports and runways in permafrost regions have also been affected by SPW, resulting in destabilizing runways because of the interactive hydrothermal coupling of groundwater drainage and subsequent thaw settlement or frost heaving [219]. Under a warming climate, the hydrothermal, hydraulic, and hydro-chemical properties of SPW and aquifers will be impacted. These impacts will further affect the buried pipelines, foundation soils, road surfaces and subgrades, and other infrastructures.
4.6. Socioeconomic Impacts and Adaption
4.6.1. Changing Water Quality and Public Health Threats
While Arctic and alpine freshwater ecosystems adapt to past climate variations, large, rapid, and accelerating changes in the 21st century may exceed their adaptability, leading to significant changes. Permafrost thaw has redistributed surface waters, exacerbated by organic pollutants. Recent studies have documented permafrost-thaw-induced changes in water quality in the Northwest Territories, Canada, including increased turbidity or total dissolved solids, conductivity, and nutrient levels, but declined DOC, possibly due to deeper and elongated groundwater flow paths with longer residence and weathering times [220,221,222]. Ground-ice meltwater releases a large amount of nutrients, leading to the eutrophication of water bodies containing nitrate and nitrite; humans and animals chronically drinking contaminated water are also pathogenically poisoned; water becomes stench because of dead algae and biological activities and oxidation [223,224]. At the same time, the warming climate and thawing permafrost promote the transport of permanent organic pollutants and polycyclic aromatic hydrocarbons into the atmosphere, accelerating their cycling [225,226]. Upon permafrost thaw, biological pollutants are more likely to spread, such as Escherichia coli in the water and helix virus, infecting fish and other aquatic life, through the food chain, posing a greater risk of human infections with these pathogens [227]. However, these impacts of permafrost thaw on water quality may not be uniform. Only a few recent studies in permafrost areas have included direct field measurements of groundwater flow models [75], and no study has combined hydro-geochemistry field data and groundwater flow modeling [228], probably due to scarce field data and the complexity of models linking groundwater flow, reactive transport, and degrading permafrost. Integrating groundwater flow models with geochemical evolution will help us to better understand the hydrogeological impacts of permafrost degradation.
4.6.2. Changing Microbial Environments and Heavy Metal Pollutants
Microorganisms in thawing permafrost are largely ignored in climate change studies, because of very limited understanding of carbon cycles and microbial responses to thawing permafrost through processes such as respiration, fermentation, methanogenesis, and CH4 oxidation [34,229,230]. Rapid permafrost collapse and thawing in the Arctic are accelerating carbon release and might double the climate warming by greenhouse gases released from tundra [197]. Thawing of permafrost, which could spawn superbugs, has increased surface runoff and ground temperatures, making antibiotics and disinfectants more widespread with water and rain. Increased concentrations of antibiotics and disinfectants in waters make bacteria more resistant, creating superbugs. Superbugs can be transmitted to people through the food chain, and long-term consumption of meat with drug-resistant bacteria, or antibiotic residues, will increase the bacterial resistance in people. Thawing permafrost releases the trapped archaea, such as anthrax, and deadly viruses, such as the pathogens of smallpox and the Black Death, which contaminate the ice and meltwater.
Heavy metals, such as mercury (Hg), deposit onto the soil surface from the atmosphere, where they bond with organic matter in the active layer; microbial decomposition then consumes the organic matter, releasing Hg [231]. During the Late Quaternary, sedimentation buried Hg bound to organic material and froze a huge amount of Hg [232]. High soil Hg concentrations from permafrost soils in northern Alaska suggest the Arctic tundra as a globally important Hg sink, and Arctic rivers annually transport large amounts of Hg to the Arctic Ocean (e.g., [232,233,234,235]). Schuster et al. (2018) estimated that the northern permafrost regions contain 1656 ± 962 Gg Hg [236], with 793 ± 461 Gg Hg in permafrost and 143 Gg of Hg in Arctic tundra [232,237]. Thus, massive Hg stock is vulnerable to rapidly thawing permafrost, posing a large environmental risk. Other external disturbances, such as wildfires and anthropic activities, may induce largescale release and pollution of Hg from and in the permafrost and Arctic soils and waters (e.g., [232,238]). Approximately 21.7 Gg of Hg was stored in surficial permafrost (0–3 m) on the QTP, with 16.58 Gg of Hg in the active layer [239]. Thus, plateau permafrost regions have a large mercury pool sensitive to permafrost degradation. Existing Hg budgets may have greatly underestimated permafrost Hg, indicating an urgent need to systematically re-evaluate permafrost Hg and its release potential and rate [236].
5. Research Inadequacies and Priority
5.1. Research Objectives
Based on previous reviews, it is evident that we need a better understanding of cryo-hydrogeological processes and dynamics, to build and enhance the ability to predict the groundwater movement at desired spatiotemporal scales, and to have the ability to effectively and accurately evaluate and properly adapt to the changing cryo-hydrogeological environment. Fortunately, many rapidly developing computing, communicating, and mapping and modeling technologies and methods provide us with unprecedented powerful tools. Thus, we may identify the inadequacies on cryo-hydrogeology and prospect those priorities in studying the hydrogeological impacts of permafrost degradation.
5.2. Research Contents
In the past few decades, many interesting cryo-hydrogeological topics have become research foci, such as the SST and preferential flows in taliks, EPW, sinkholes, thermokarst lakes/ponds, active layer detachment failure and landslides, retrogressive slumps and carbon emissions from rapid permafrost thaw, increasing DOC and dissolved organic nitrogen (e.g., [32]), freshening Arctic-Basin waters (e.g., more freshwater from melting ground ice), eco-hydrogeological impacts from deepening active layers and permafrost tables, threatened Asian Water Towers, and impacts of degrading permafrost on public health security. These topics are not only of interest to geocryologists and hydrogeologists, they are also of concern to experts in climate changes and adaption, cold regions engineers, permafrost hydrologists and ecologists, and managers of public safety and land planners, to just name a few. It would be too cumbersome to fully expand these topics in this short review. Rather, we will give some reviews on the research methods.
5.3. Impacts of Permafrost Degradation on Hydrogeological Functions
Rapid progress has been made in cryo-hydrogeology, which is attracting more attention with respect to multi-scale observations, subsurface characterization, numerical modeling, and multi-disciplinary integration. However, it remains a great challenge to gain the predictive capability of the many interrelated consequences of a changing climate and degrading permafrost. Implementation plans should prioritize changes in the coupled flow systems and flow generation and pathways through monitoring, experiments, remote sensing and geophysics, predictive cryo-hydrogeology models, and through evaluating the impacting mechanisms and trends of degrading permafrost on hydrogeology.
Hydrogeological heterogeneity and topography strongly affect thaw rates and patterns of permafrost. Thus, studies on permafrost need to better understand hydrogeological structures, groundwater conditions, and permafrost features. As the most direct and accurate method, field observations can identify and monitor dynamically changing characteristics of hydrogeology, hydrometeorology, and geocryology, and their interdependent and interactive relationships, and obtain point data on hydrothermal conditions mainly by field investigations, borehole drilling and pumping tests, and sampling for hydro-geochemistry. Therefore, field observations can directly help close the gaps for data scarcity and model, predict, and evaluate future situations at point to regional scales. Regionally, impressive progress has been made in field observations on cryo-hydrogeology. Geophysical methods are brought in for featuring permafrost and closing/bridging the data gaps at point to regional scales, such as using electrical resistivity tomography, electrical resistivity imaging, electromagnetic induction, ground penetration radar, airborne electromagnetic surveys, and direct measurements of unfrozen-water content, such as by proton magnetic resonance sounding.
Recent foci in cryo-hydrogeology have been on ground-ice/water storage, origins and age, runoff variations, carbon cycle and heavy metals, and the hydrothermal budgets of thermokarst lakes. Isotope tracing provides valuable tools towards further and better understanding of rapidly changing cryo-hydrogeological structures, functions, and environments. Multiple isotopes and chemical tracing integrated with remote sensing, air-borne and surface geophysics, and numerical models will be the mainstreams for future cryo-hydrogeology. Remote sensing, geographic information systems, and global positioning systems have been widely used in geocryology and cryo-hydrogeology. High-resolution mapping can be used for measuring landscape-averaged subsidence, documenting polygon successions due to ice-wedge decay and trough development, permafrost zoning by multi-source-data-integrated modeling, determining lake changes and lateral drainage, studying landscape effects of wildfires in the permafrost environment, and identifying and mapping permafrost landforms and surface features and indicators of thawing ice-rich permafrost. Remote sensing techniques not only can detect surface waters, but also, in combination with field observations, can better understand the roles of permafrost in catchment hydrology. Remote sensing is unveiling processes and causal connections governing permafrost degradation. It can also facilitate the monitoring of changes in inaccessible areas at large scales and reveal complex spatiotemporal variations, thereby helping to improve process interpretations.
At present, modeling and forecasting of cryo-hydrogeology still rely on conceptual and/or mechanistic models. With rapidly developing hydro-geophysical methods and instruments and numerical modeling, cryo-hydrogeology is moving towards more systematic investigations and forecasts on soil moisture movement and contents, active layer processes, runoff generation and discharge, groundwater movement and ground ice dynamics, and carbon and other solute fluxes under a warming climate. Most studies are still focused on high latitudes. Modeling studies indicate that groundwater flow movement can enhance the connectivity of the active layer, sub-permafrost waters, and lake taliks and alter flow paths and flow recharge–discharge relations. Most cryo-hydrogeological studies are based on mechanistical analyses considering heat conduction with ice–water phase changes and convection and rely on numerical models. However, modeling of groundwater flow systems in permafrost regions needs better understanding on the three-dimensional distribution of permafrost and supra-, intra-, and sub-permafrost waters. These model studies basically lack substantial support from field-measured data. Conceptual models can adapt to the complex processes and conditions, including the soil heterogeneity, hydrothermal coupling, complex temperature boundaries, variations in freeze–thaw processes and physical-hydraulic properties. The drawbacks of numerical models are also evident, such as murky model mechanisms. On the other hand, mechanistic models emphasize the determination of boundary conditions and hydrogeological parameterization. Additionally, model studies are mainly conducted at high latitudes, with relatively simple boundary conditions; similar studies are hardly applicable in elevational permafrost regions with greatly varied permafrost types, rugged terrains, and complex terrestrial processes. Thus, cryo-hydrogeologic models are still largely empirical, and, at a local scale, empirical models cannot effectively describe the water conversion in permafrost regions, e.g., [55,240,241,242,243]. Some better process models are the permafrost and energy balance (PERMEBAL) model. However, studies on hydrogeological processes and impacts from permafrost degradation are still inadequate. Key issues are the proper parameterization of frozen ground and freeze–thaw processes, model applicability on rugged terrains, and effective coupling of surface and subsurface waters and the formation and melting of ground ice. Breakthroughs in cryo-hydrogeology models may provide a powerful tool.
5.4. Key Regions for Cryo-Hydrogeology Research
Permafrost has been degrading at a global scale despite of some recent ground cooling and active-layer thinning at some sites. Key regions for research on permafrost degradation and its hydrogeological impacts include the Arctic and Boreal peatlands, wetlands, and forests, and high-plateau and alpine regions [55]. First of all, Arctic river basins, as well as those large river basins with extensive presences in Arctic and subarctic zones, such as Yukon, Lena, Ob, Yenisei, are of primary concern because of increasing winter baseflows and enhanced contribution of cold freshwater to the Arctic basin, which may significantly tip the balance of the thermohaline conveyor belt. In addition, the headwater or source areas of some major rivers, such as those in central and middle Asia (e.g., Yangtze, Yellow, Indus, Amur, Ob, Yenisei, Lena, and Yukon), and many others, have attracted much and extensive attention due to the diminishing water supplies under a warming climate. The declining water supplies from the upper streams dominated by mountain cryosphere are threatening the basin-wide or regional water, ecological, and public health safety.
The principal trends for lowland wetlands are wetter soil environments and probably better ecological conditions for boreal wetlands and peatlands, and, for slopes and uplands, drier soil environments and harsher ecosystematic conditions, because of improving drainage and hydraulic connectivity due the degrading permafrost and warming, drying climate [29]. However, the physical, chemical, and biological mechanisms for these changes remain evasive (e.g., [240,243]). The Asian Water Towers on the Third Pole over more than three million km2 of land surfaces in central and middle Asia are crucial to the living and wellbeing of more than three billion people and numerous other species. Thus, it is of great priority to study and understand the trends and mechanisms of these changes in association with high-plateau and alpine cryo-hydrogeology in the Third Pole, where numerous important rivers originate and feed on melting mountain cryosphere. Although inadequately observed and poorly understood, alpine cryo-hydrogeology is key to understanding the groundwater cycling at basin-wide, regional, and continental scales.
6. Conclusions
To date, these studies are inadequate in the comprehensiveness of the study methods and insufficient in desired spatiotemporal series and resolution, multi-source data assimilation and integration, as well as cryo-hydrogeology models with the capability of coupling surface and groundwater/ground ice and of predicting future changes. Observations of hydrogeological changes have often been causally linked to thawing permafrost, but process-based models have often been overly simplified or generalized because of inadequate baseline permafrost and talik hydrogeological characterization, a lack of historical observational data, and simplifications in the structure and process of representation for cryo-hydrogeological simulations. Due to the large subsurface heterogeneity of permafrost landscapes and varied thaw patterns and rates of changes, associations between various modes of permafrost degradation and hydrogeological changes are not readily scalable.
Therefore, it is crucial to study dynamic changes in recharge, flow paths, and discharge and the connectivity of permafrost-controlled, coupled surface and subsurface water/ice flow systems using the latest technologies, such as those in isotopic hydrogeology. New programs should prioritize studying the spatiotemporal distribution of and changes in environmental isotopes in precipitation, different layers of river and lake waters, groundwater and ground ice, and water movement in zones with varied stages of degrading permafrost, in order to evaluate the ensuing spatiotemporal changes in hydraulic connections and water storage. Additionally, investigations should also prioritize the radiative isotope tracing of groundwater/ice and talik aquifers in order to better understand the distribution of formation ages of permafrost soils, groundwater/ice, and the evolutionary processes of the coupled flow systems and to comprehensively evaluate the hydraulic connections by taking into account the spatiotemporal scales of those changes. Interdisciplinary and integrated innovations in applications of stable and radiative isotope tracing and modeling techniques in cryo-hydrogeology, geocryology, hydrochemistry, and isotope geochemistry can provide key supports for understanding the mechanisms for changes in, and for the prudent exploitation of, water resources.
Author Contributions
Conceptualization, H.J.; writing—original draft preparation, H.J., Y.H., V.F.B., Q.M., S.S.M., V.V.S. (Viktor V. Shepelev), Y.H., S.L., V.V.S. (Valetin V. Spektor), X.J., X.L. (Xinyu Li) and X.L. (Xiaoying Li); writing—review and editing, H.J., Y.H., V.F.B., Q.M., S.S.M., V.V.S. (Viktor V. Shepelev), Y.H., S.L., V.V.S. (Valetin V. Spektor), X.J., X.L. (Xiaoying Li) and X.L. (Xinyu Li); visualization, H.J., Y.H., Q.M. and S.S.M.; supervision, H.J.; project administration, H.J.; funding acquisition, H.J. All authors have read and agreed to the published version of the manuscript.
Funding
This research was funded by the Chinese Academy of Sciences (CAS) Strategic Priority Research Program “Changing permafrost hydrology in the Qilian Mountains and the Source Area of the Yellow River and its impacts on water supplies and security” (Grant No. XDA20100103) and the National Natural Science Foundation of China (Grant Nos. U20A2082 and 41871052).
Institutional Review Board Statement
Not applicable.
Informed Consent Statement
Not applicable.
Data Availability Statement
Related data are available upon reasonable request.
Acknowledgments
The authors are also very appreciative of the two unidentified reviewers of MDPI Water for their generous efforts and insightful comments on the manuscript. They have greatly helped in improving the quality of the paper. The authors also thank Ning Jia with the Harbin Institute of Technology for helping with Figure 2.
Conflicts of Interest
The authors declare no conflict of interest.
References
- Gruber, S. Derivation and analysis of a high-resolution estimate of global permafrost zonation. Cryosphere 2012, 6, 221–233. [Google Scholar] [CrossRef] [Green Version]
- Obu, J.; Westermann, S.; Bartsch, A.; Berdnikov, N.; Christiansen, H.H.; Dashtseren, A.; Delaloye, R.; Elberling, B.; Etzelmüller, B.; Kholodov, A.; et al. Northern Hemisphere permafrost map based on TTOP modelling for 2000–2016 at 1 km2 scale. Earth-Sci. Rev. 2019, 193, 299–316. [Google Scholar] [CrossRef]
- Ran, Y.; Li, X.; Cheng, G.; Nan, Z.; Che, J.; Sheng, Y.; Wu, Q.; Jin, H.; Luo, D.; Tang, Z.; et al. Mapping the permafrost stability over the Tibetan Plateau for 2005–2015. Sci. China Ser. D Earth Sci. 2021, 64, 62–79. [Google Scholar] [CrossRef]
- Jin, H.; Chang, X.; Wang, S. Evolution of permafrost on the Qinghai-Tibet Plateau since the end of the Pleistocene. J. Geophys. Res. 2007, 112, F02S09. [Google Scholar] [CrossRef] [Green Version]
- Jin, H.; He, R.; Cheng, G.; Wu, Q.; Wang, S.; Lv, L.; Chang, X. Change in frozen ground and eco-environmental impacts in the Sources Area of the Yellow River (SAYR) on the northeastern Qinghai-Tibet Plateau, China. Environ. Res. Lett. 2009, 4, 045206. [Google Scholar] [CrossRef]
- Jin, H.; Vandenberghe, J.; Luo, D.; Harris, S.A.; He, R.; Chen, X.; Jin, X.; Wang, Q.; Zhang, Z.; Spektor, V.; et al. Quaternary permafrost in China: A preliminary framework and some discussions. Quaternary 2020, 3, 32. [Google Scholar] [CrossRef]
- Koch, J.C.; Ewing, S.A.; Striegl, R.; McKnight, D.M. Rapid runoff via shallow throughflow and deeper preferential flow in a boreal catchment underlain by frozen silt (Alaska, USA). Hydrogeol. J. 2013, 21, 93–106. [Google Scholar] [CrossRef]
- Koch, J.C.; Kikuchi, C.P.; Wickland, K.P.; Schuster, P. Runoff sources and flow paths in a partially burned, upland boreal catchment underlain by permafrost. Water Resour. Res. 2014, 50, 8141–8158. [Google Scholar] [CrossRef]
- Sjöberg, Y.; Coon, E.; Sannel, A.B.K.; Pannetier, R.; Harp, D.; Frampton, A.; Painter, S.L.; Lyon, S.W. Thermal effects of groundwater flow through subarctic fens: A case study based on field observations and numerical modeling. Water Resour. Res. 2016, 52, 1591–1606. [Google Scholar] [CrossRef] [Green Version]
- Lebedeva, L.S.; Bazhin, K.I.; Khristoforov, I.I.; Abramov, A.A.; Pavlova, N.A.; Efremov, V.S.; Ogonerov, V.V.; Tarbeeva, A.M.; Fedorov, M.P.; Nesterova, N.V.; et al. Surface and ground water in permafrost region: Subprapermafrost subaerial taliks, Central Yakutia, Shestakovka River Basin. Kriosf. Zemli 2019, 23, 40–50. [Google Scholar]
- Lemieux, J.-M.; Fortier, R.; Molson, J.; Therrien, R.; Ouellet, M. Topical Collection: Hydrogeology of a cold-region watershed near Umiujaq (Nunavik, Canada). Hydrogeol. J. 2020, 28, 809–812. [Google Scholar] [CrossRef] [Green Version]
- Lemieux, J.-M.; Fortier, R.; Murray, R.; Dagenais, S.; Cochand, M.; Delottier, H.; Therrien, R.; Molson, J.; Pryet, A.; Parhizkar, M. Groundwater dynamics within a watershed in the discontinuous permafrost zone near Umiujaq (Nunavik, Canada). Hydrogeol. J. 2020, 28, 833–851. [Google Scholar] [CrossRef]
- Kurylyk, B.L.; Walvoord, M.A. Permafrost hydrogeology. In Arctic Hydrology, Permafrost and Ecosystems; Yang, D., Kane, D.L., Eds.; Springer: Cham, Switzerland, 2021; pp. 493–523. [Google Scholar]
- Biskaborn, B.K.; Smith, S.L.; Noetzli, J.; Matthes, H.; Vieira, G.; Streletskiy, D.A.; Schoeneich, P.; Romanovsky, V.E.; Lewkowicz, A.G.; Abramov, A.; et al. Permafrost is warming at a global scale. Nat. Commun. 2019, 10, 2041–2723. [Google Scholar] [CrossRef] [PubMed] [Green Version]
- Anisimov, O.; Reneva, S. Permafrost and changing climate: The Russian perspective. AMBIO 2006, 35, 169–175. [Google Scholar] [CrossRef]
- Jin, H.; Wu, Q.; Romanovsky, V.E. Editorial: Impacts from degrading permafrost. Adv. Clim. Chang. Res. 2021, 12, 1–6. [Google Scholar] [CrossRef]
- Sjöberg, Y.; Marklund, P.; Pettersson, R.; Lyon, S.W. Geophysical mapping of palsa peatland permafrost. Cryosphere 2015, 9, 465–478. [Google Scholar] [CrossRef] [Green Version]
- Chang, J.; Ye, R.; Wang, G. Review: Progress in permafrost hydrogeology in China. Hydrogeol. J. 2018, 26, 1387–1399. [Google Scholar] [CrossRef]
- Hjort, J.; Karjalainen, O.; Aalto, J.; Westermann, S.; Romanovsky, V.E.; Nelson, F.E.; Etzelmüller, B.; Luoto, M. Degrading permafrost puts Arctic infrastructure at risk by mid-century. Nat. Commun. 2018, 9, 5147. [Google Scholar] [CrossRef]
- Kajalainen, O.; Aalto, J.; Luoto, M.; Westermann, S.; Romanovsky, V.E.; Nelson, F.E.; Etzelmüller, B.; Hjort, J. Circumpolar permafrost maps and geohazard indices for near-future infrastructure risk assessments. Sci. Data 2019, 6, 190037. [Google Scholar] [CrossRef] [Green Version]
- Li, X.; Jin, H.; Sun, L.; Wang, H.; He, R.; Huang, Y.; Chang, X. Climate warming over 1961–2019 and impacts on permafrost zonation in Northeast China. J. For. Res. 2021, 1–21. [Google Scholar] [CrossRef]
- Zhang, Z.; Wu, Q.; Hou, M.; Tai, B.; An, Y. Permafrost change in Northeast China in the 1950s–2010s. Adv. Clim. Chang. Res. 2021, 12, 18–28. [Google Scholar] [CrossRef]
- Streletskiy, D.A.; Sherstiukov, A.; Frauenfeld, O.W.; Nelson, F.E. Changes in the 1963–2013 shallow ground thermal regime in Russian permafrost regions. Environ. Res. Lett. 2015, 10, 125005. [Google Scholar] [CrossRef]
- Jin, X.; Jin, H.; Wu, X.; Luo, D.; Sheng, Y.; Li, X.; He, R.; Wang, Q.; Knops, J.M.H. Permafrost degradation leads to decrease in biomass and species richness on the northeastern Qinghai-Tibet Plateau. Plants 2020, 9, 1453. [Google Scholar] [CrossRef] [PubMed]
- Bense, V.F.; Ferguson, G.; Kooi, H. Evolution of shallow ground- water flow systems in areas of degrading permafrost. Geophys. Res. Lett. 2009, 36, L22401. [Google Scholar] [CrossRef] [Green Version]
- Bense, V.F.; Kooi, H.; Ferguson, G.; Read, T. Permafrost degradation as a control on hydrogeological regime shifts in a warming climate. J. Geophys. Res. Earth Surf. 2012, 117, 1–18. [Google Scholar] [CrossRef] [Green Version]
- Kurylyk, B.L.; MacQuarrie, K.T.B.; McKenzie, J.M. Climate change impacts on groundwater and soil temperatures in cold and temperate regions: Implications, mathematical theory, and emerging simulation tools. Earth Sci. Rev. 2014, 138, 313–334. [Google Scholar] [CrossRef]
- Jorgenson, M.T.; Harden, J.; Kanevskiy, M.; O’Donnell, J.; Wickland, K.; Ewing, S.; Manies, K.; Zhuang, Q.; Shur, Y.; Striegl, R. Reorganization of vegetation, hydrology and soil carbon after permafrost degradation across heterogeneous boreal landscapes. Environ. Res. Lett. 2013, 8, 035017. [Google Scholar] [CrossRef]
- Jin, X.; Jin, H.; Iwahana, G.; Marchenko, S.S.; Luo, D.; Li, X.; Liang, S. Impacts of climate-induced permafrost degradation on vegetation: A review. Adv. Clim. Chang. Res. 2021, 12, 29–47. [Google Scholar] [CrossRef]
- Schuur, E.A.G.; McGuire, A.D.; Schädel, C.; Grosse, G.; Harden, J.W.; Hayes, D.J.; Hugelius, G.; Koven, C.D.; Kuhry, P.; Lawrence, D.M.; et al. Climate change and the permafrost carbon feedback. Nature 2015, 520, 171–179. [Google Scholar] [CrossRef]
- Ebel, B.A.; Koch, J.C.; Walwoord, M.A. Soil physical, hydraulic, and thermal properties in interior Alaska, USA: Implications for hydrologic response to thawing permafrost conditions. Water Resou. Res. 2019, 55, 4427–4447. [Google Scholar] [CrossRef]
- Walvoord, M.A.; Voss, C.I.; Ebel, B.A.; Minsley, B.J. Development of perennial thaw zones in boreal hillslopes enhances potential mobilization of permafrost carbon. Environ. Res. Lett. 2019, 14, 015003. [Google Scholar] [CrossRef]
- Oblogov, G.E.; Vasiliev, A.A.; Streletskaya, I.D.; Zadorozhnaia, N.; Kuznetsova, A.O.; Kanevskiy, M.; Semenov, P. Methane content and emission in the permafrost landscapes of Western Yamal, Russian Arctic. Geosciences 2020, 10, 412. [Google Scholar] [CrossRef]
- Jin, H.; Ma, Q. Impacts of permafrost degradation on carbon stocks and emissions: A review. Atmosphere 2021, 12, 1425. [Google Scholar] [CrossRef]
- Martens, J.; Wild, B.; Muschitiello, F.; O’Regan, M.; Jakobsson, M.; Semiletov, I.P.; Dudarev, O.V.; Gustafsson, Ö. Remobilization of dormant carbon from Siberian-Arctic permafrost during three past warming events. Sci. Adv. 2020, 6, eabb6546. [Google Scholar] [CrossRef]
- Martens, J.; Romankevich, E.; Semiletov, I.; Wild, B.; van Dongen, B.; Vonk, J.; Tesi, T.; Shakhova, N.; Dudarev, O.V.; Kosmach, D.; et al. CASCADE—The Circum-Arctic Sediment CArbon DatabasE. Earth Syst. Sci. Data. 2021, 13, 2561–2572. [Google Scholar] [CrossRef]
- Larsbo, M.; Holten, R.; Stenrød, M.; Eklo, O.M.; Jarvis, N. A dual-permeability approach for modeling soil water flow and heat transport during freezing and thawing. Vadose Zone J. 2019, 18, 190012. [Google Scholar] [CrossRef]
- Stadler, D.; Flühler, H.; Jansson, P.-E. Modelling vertical and lateral water flow in frozen and sloped forest soil plots. Cold Reg. Sci. Technol. 1997, 26, 181–194. [Google Scholar] [CrossRef]
- Jiang, R.; Li, T.; Liu, D.; Fu, Q.; Hou, R.; Li, Q.; Cui, S.; Li, M. Soil infiltration characteristics and pore distribution under freezing-thawing conditions. Cryosphere 2021, 15, 2133–2146. [Google Scholar] [CrossRef]
- Stuurop, J.C.; van der Zee, S.E.M.; Voss, C.I.; French, H.K. Simulating water and heat transport with freezing and cryosuction in unsaturated soil: Comparing an empirical, semi-empirical and physically-based approach. Adv. Water Resour. 2021, 149, 103846. [Google Scholar] [CrossRef]
- Watanabe, K.; Kugisaki, Y. Effect of macropores on soil freezing and thawing with infiltration. Hydrol. Process. 2017, 31, 270–278. [Google Scholar] [CrossRef]
- Evans, S.G.; Ge, S.; Voss, C.I.; Molotch, N.P. The role of frozen soil in groundwater discharge predictions for warming alpine watersheds. Water Resour. Res. 2018, 54, 1599–1615. [Google Scholar] [CrossRef]
- Mohammed, A.A.; Kurylyk, B.L.; Cey, E.E.; Hayashi, M. Snowmelt infiltration and macropore flow in frozen soils: Overview, knowledge gaps, and a conceptual framework. Vadose Zone J. 2018, 17, 180084. [Google Scholar] [CrossRef]
- Mohammed, A.A.; Pavlovskii, I.; Cey, E.E.; Hayashi, M. Effects of preferential flow on snowmelt partitioning and groundwater recharge in frozen soils. Hydrol. Earth Syst. Sci. Discuss. 2019, 23, 5017–5031. [Google Scholar] [CrossRef] [Green Version]
- Cheng, G.; Jin, H. Permafrost and groundwater on the Qinghai-Tibet Plateau and in northeast China. Hydrogeol. J. 2012, 21, 5–23. [Google Scholar] [CrossRef]
- Cheng, G.; Jin, H. Groundwater in the permafrost regions on the Qinghai-Tibet Plateau and it changes. Hydrogeol. Eng. Geol. 2013, 40, 1–11, (In Chinese with English abstract). [Google Scholar]
- Connon, R.F.; Quinton, W.L.; Craig, J.R.; Hayashi, M. Changing hydrologic connectivity due to permafrost thaw in the lower Liard River valley, NWT, Canada. Hydrol. Process. 2014, 28, 4163–4178. [Google Scholar] [CrossRef]
- Carpino, O.A.; Berg, A.; Quinton, W.L.; Adams, J.R. Climate change and permafrost thaw-induced boreal forest loss in northwestern Canada. Environ. Res. Lett. 2018, 13, 084018. [Google Scholar] [CrossRef]
- Haynes, K.M.; Connon, R.F.; Quinton, W.L. Hydrometeorological measurements in peatland-dominated, discontinuous permafrost at Scotty Creek, Northwest Territories, Canada. Geosci. Data J. 2019, 6, 85–96. [Google Scholar] [CrossRef]
- Gao, H.; Wang, J.; Yang, Y.; Pan, X.; Ding, Y.; Duan, Z. Permafrost hydrology of the Qinghai-Tibet Plateau: A review of processes and modeling. Front. Earth Sci. 2021, 8, 576838. [Google Scholar] [CrossRef]
- Shepelev, V.V. Suprapermafrost Waters in the Cryolithozone; Academic Publishing House “Geo”: Novosibirsk, Russia, 2011. [Google Scholar]
- Zhou, Y.; Qiu, G.; Guo, D.; Cheng, G.; Li, S. Geocryology in China; Science Press: Beijing, China, 2000. (In Chinese) [Google Scholar]
- Jarafov, E.; Coon, T.C.; Harp, D.R.; Wilson, C.J.; Painter, S.L.; Atchley, A.L.; Romanovsky, V.E. Modeling the role of preferential snow accumulation in through talik development and hillslope groundwater flow in a transitional permafrost landscape. Environ. Res. Lett. 2018, 13, 105006. [Google Scholar] [CrossRef]
- Devoie, É.G.; Craig, J.R.; Connon, R.F.; Quinton, W.L. Taliks: A tipping point in discontinuous permafrost degradation in peatlands. Water Resour. Res. 2019, 55, 9838–9857. [Google Scholar] [CrossRef]
- McKenzie, J.M.; Kurylyk, B.L.; Walvoord, M.A.; Bense, V.F.; Fortier, D.; Spence, C.; Grenier, C. Invited perspective: What lies beneath a changing arctic? Cryosphere 2021, 15, 479–484. [Google Scholar] [CrossRef]
- Katasonova, E.G.; Tolstov, A.N. The geocryological features of quick sands (tukulans) on the right bank of the Viluy River. In Permafrost Mountain Rocks in Different Regions of the USSR; AS USSR Press: Moscow, Russia, 1963; pp. 166–179. [Google Scholar]
- Boitsov, A.V.; Shepelev, V.V. The permafrost-hydrogeological conditions of the Makhatta massif of quick sands (Central Yakutia). In Hydrogeological Studies of the Permafrost Zone; Melnikov Permafrost Institute, Siberia Branch, Russian Academy of Sciences: Yakutsk, Russia, 1976; pp. 25–34. [Google Scholar]
- Boitsov, A.V. Conditions of formation and the regime of slope taliks in Central Yakutia. In Hydrogeological Studies; Melnikov Permafrost Institute, SB RAS: Yakutsk, Russia, 1985; pp. 44–55. [Google Scholar]
- Boitsov, A.V. The Conditions of Formation and the Regime of Ground Waters of Supra-Permafrost and Intra-Permafrost Runoff in Central Yakutia. Ph.D. Thesis, Melnikov Permafrost Institute, Siberia Branch, Russian Academy of Sciences, Yakutsk, Russia, 1985. (In Russian). [Google Scholar]
- Boitsov, A.V. Geocryology and the Ground Waters of the Permafrost Zone; Tyumen State University Press: Tyumen, Russia, 2011; p. 177. (In Russian) [Google Scholar]
- Shepelev, V.V.; Boitsov, A.V.; Oberman, N.G. Monitoring of the Ground Waters of the Permafrost Zone; Melnikov Permafrost Institute, Siberia Branch, Russian Academy of Sciences: Yakutsk, Russia, 2002; p. 172. (In Russian) [Google Scholar]
- Anisimova, N.P. The Ground Waters of Central Yakutia and the Perspectives of their Use; SB RAS Press: Geoaffiliate, Russia, 2003; p. 117. (In Russian) [Google Scholar]
- Burt, T.P.; Williams, P.J. Hydraulic conductivity in frozen soils. Earth Surf. Process. 1976, 9, 411–416. [Google Scholar] [CrossRef]
- Tarnawski, V.R.; Wagner, B. On the prediction of hydraulic conductivity of frozen soils. Can. Geotech. J. 2011, 33, 176–180. [Google Scholar] [CrossRef]
- Watanabe, K.; Osada, Y. Comparison of hydraulic conductivity in frozen saturated and unfrozen saturated soils. Vadose Zone J. 2016, 15, vzj2015.11.0154. [Google Scholar] [CrossRef]
- Watanabe, K.; Osada, Y. Simultaneous measurement of unfrozen water content and hydraulic conductivity of partially frozen soil near 0 °C. Cold Reg. Sci. Technol. 2017, 142, 79–84. [Google Scholar] [CrossRef]
- Ma, R.; Sun, Z.; Hu, Y.; Chang, Q.; Wang, S.; Xing, W.; Ge, M. Hydrological connectivity from glaciers to rivers in the Qinghai-Tibet Plateau: Roles of suprapermafrost and subpermafrost groundwater. Hydrol. Earth Sys. Sci. 2017, 21, 4803–4823. [Google Scholar] [CrossRef] [Green Version]
- Ran, Y.; Jorgenson, M.T.; Li, X.; Jin, H.; Wu, T.; Li, R.; Cheng, G. Biophysical permafrost map indicates ecosystem processes dominate permafrost stability in the Northern Hemisphere. Env. Res. Lett. 2021, 16, 095010. [Google Scholar] [CrossRef]
- Streletskiy, D.A.; Anisimov, O.; Vasiliev, A. Permafrost degradation. In Snow and Ice-Related Hazards, Risks and Disasters; Elsevier: Amsterdam, The Netherlands, 2015; pp. 303–304. [Google Scholar]
- Gruber, S. Ground subsidence and heave over permafrost: Hourly time series reveal interannual, seasonal and shorter-term movement caused by freezing, thawing and water movement. Cryosphere 2020, 14, 1437–1447. [Google Scholar] [CrossRef]
- Vasiliev, A.A.; Drozdov, D.S.; Gravis, A.G.; Malkova, G.V.; Nyland, K.E.; Streletskiy, D.A. Permafrost degradation in the Western Russian Arctic. Environ. Res. Lett. 2020, 15, 045001. [Google Scholar] [CrossRef]
- Streletskiy, D.A.; Suter, L.; Shiklomanov, N.; Porfiriev, B.N.; Eliseev, D.O. Assessment of climate change impacts on buildings, structures and infrastructure in the Russian regions on permafrost. Environ. Res. Lett. 2019, 14, 025003. [Google Scholar] [CrossRef]
- Ma, Q.; Jin, H.; Yu, C.; Bense, V. Dissolved organic carbon in permafrost regions: A review. Sci. China Earth Sci. 2019, 62, 349–364. [Google Scholar] [CrossRef] [Green Version]
- Yang, Z.; Ouyang, H.; Xu, X.; Zhao, L.; Song, M.; Zhou, C. Effects of permafrost degradation on ecosystems. Acta Ecol. Sin. 2010, 30, 33–39. [Google Scholar] [CrossRef]
- Walvoord, M.A.; Kurylyk, B.L. Hydrologic impacts of thawing permafrost—A review. Vadose Zone J. 2016, 15, vzj2016-01. [Google Scholar] [CrossRef]
- Ravanel, L.; Magnin, F.; Deline, P. Impacts of the 2003 and 2015 summer heatwaves on permafrost-affected rock-walls in the Mont Blanc massif. Sci. Total Environ. 2017, 609, 132–143. [Google Scholar] [CrossRef]
- Noetzli, J.; Christiansen, H.H.; Deline, P.; Gugliemin, M.; Isaksen, K.; Romanovsky, V.E.; Smith, S.L.; Zhao, L.; Streletskiy, D.A. Permafrost thermal state. Bull. Am. Meteorol. Soc. 2018, 99, S20–S22. [Google Scholar]
- Drozdov, D.; Rumyantseva, Y.; Malkova, G.; Rumyantseva, Y.V.; Abramov, A.A.; Konstantinov, P.Y.; Sergeev, D.O.; Shiklomanov, N.I.; Kholodov, A.L.; Ponomareva, O.E.; et al. Monitoring of permafrost in Russia and the international GTN-P project. In Proceedings of the International GTN-P Project 68th Canadian Geotechnical Conference, Québec, QC, Canada, 20–23 September 2015. [Google Scholar]
- Christiansen, H.H.; Etzelmüller, B.; Isaksen, K.; Juliussen, H.; Farbrot, H.; Humlum, O.; Johansson, M.; Ingeman-Nielsen, T.; Kristensen, L.; Hjort, J.; et al. The thermal state of permafrost in the Nordic area during the International Polar Year. Permafr. Periglac. Process. 2010, 21, 156–181. [Google Scholar] [CrossRef] [Green Version]
- Isaksen, K.; Ødegård, R.S.; Etzelmüller, B.; Hilbich, C.; Hauck, C.; Farbrot, H.; Eiken, T.; Hygen, H.O.; Hipp, T.F. Degrading mountain permafrost in southern Norway: Spatial and temporal variability of mean ground temperatures, 1999–2009. Permafr. Periglac. Process. 2011, 22, 361–377. [Google Scholar] [CrossRef]
- Farbrot, H.; Isaksen, K.; Etzelmüller, B.; Gisnås, K. Ground thermal regime and permafrost distribution under a changing climate in Northern Norway. Permafr. Periglac. Process. 2013, 24, 20–38. [Google Scholar] [CrossRef]
- Borge, A.F.; Westermann, S.; Solheim, I.; Etzelmüller, B. Strong degradation of palsas and peat plateaus in northern Norway during the last 60 years. Cryosphere 2017, 11, 1–16. [Google Scholar] [CrossRef] [Green Version]
- Shur, Y.L.; Jorgenson, M.T. Patterns of permafrost formation and degradation in relation to climate and ecosystems. Permafr. Periglac. Process. 2007, 18, 7–19. [Google Scholar] [CrossRef]
- Jorgenson, M.T.; Romanovsky, V.E.; Harden, J.; Shur, Y.; O’Donnell, J.; Schuur, E.A.G.; Kanevskiy, M.; Marchenko, S. Resilience and vulnerability of permafrost to climate change. Can. J. For. Res. 2010, 40, 1219–1236. [Google Scholar] [CrossRef] [Green Version]
- Talucci, A.C.; Loranty, M.M.; Alexander, H.D. Siberian taiga and tundra fire regimes from 2001–2020. Environ. Res. Lett. 2022, 17, 025001. [Google Scholar] [CrossRef]
- Zhang, Z.; Wu, Q.; Xun, X.; Li, Y. Spatial distribution and changes of Xing’an permafrost in China over the past three decades. Quatern. Int. 2019, 523, 16–24. [Google Scholar] [CrossRef]
- Zhao, L.; Wu, Q.; Marchenko, S.S.; Sharkhuu, N. Thermal state of permafrost and active layer in Central Asia during the international polar year. Permafr. Periglac. Process. 2010, 21, 198–207. [Google Scholar] [CrossRef] [Green Version]
- Zhao, L.; Hu, G.; Zou, D.; Wu, X.; Ma, L.; Sun, Z.; Yuan, L.; Zhou, H.; Liu, S. Permafrost changes and its effects on hydrological processes on Qinghai-Tibet Plateau. Bull. Chin. Acad. Sci. 2019, 34, 1233–1246. [Google Scholar] [CrossRef]
- Zhao, L.; Zou, D.; Hu, G.; Du, E.; Pang, Q.; Xiao, Y.; Li, R.; Sheng, Y.; Wu, X.; Sun, Z.; et al. Changing climate and the permafrost environment on the Qinghai-Tibet (Xizang) plateau. Permafr. Periglac. Process. 2020, 31, 396–405. [Google Scholar] [CrossRef]
- Cheng, G.; Zhao, L.; Li, R.; Wu, X.; Sheng, Y.; Hu, G.; Zou, D.; Jin, H.; Li, X.; Wu, Q. Dynamics, changes and impacts of permafrost on the Qinghai-Tibet Plateau. Sci. Bull. 2019, 64, 2783–2795. [Google Scholar] [CrossRef] [Green Version]
- Jin, H.; Li, S.; Cheng, G.; Wang, S.; Li, X. Permafrost and climatic change in China. Glob. Planet. Chang. 2000, 26, 387–404. [Google Scholar] [CrossRef]
- Jin, H.; Luo, D.; Wang, S.; Lü, L.; Wu, J. Spatiotemporal variability of permafrost degradation on the Qinghai-Tibet Plateau. Sci. Cold Arid Reg. 2011, 3, 281–305. [Google Scholar]
- Zhang, Z.; Wu, Q.; Jiang, G.; Gao, S.; Liu, Y. Changes in the permafrost temperatures from 2003 to 2015 in the Qinghai-Tibet Plateau. Cold Reg. Sci. Technol. 2020, 169, 102904. [Google Scholar]
- Luo, D.; Wu, Q.; Jin, H.; Marchenko, S.S.; Lü, L.; Gao, S. Recent changes in active layer thickness across the Northern Hemisphere. Env. Earth Sci. 2016, 75, 555. [Google Scholar] [CrossRef]
- Ni, J.; Wu, T.; Zhu, X.; Hu, G.; Zou, D.; Wu, X.; Li, R.; Xie, C.; Qiao, Y.; Pang, Q.; et al. Simulation of the present and future projection of permafrost on the Qinghai-Tibet Plateau with statistical and machine learning models. J. Geophys. Res.-Atmos. 2020, 126, e2020JD033402. [Google Scholar] [CrossRef]
- Ran, Y.; Li, X.; Cheng, G.; Zhang, T.; Wu, Q.; Jin, H.; Jin, R. Distribution of permafrost in China: An overview of existing permafrost maps. Permafr. Periglac. Process. 2012, 23, 322–333. [Google Scholar] [CrossRef]
- Guo, D.; Wang, H. CMIP5 permafrost degradation projection: A comparison among different regions. J. Geophys. Res. Atmos. 2016, 121, 4499–4517. [Google Scholar] [CrossRef]
- Sheng, Y.; Ma, S.; Cao, W.; Wu, J. Spatiotemporal changes of permafrost in the Headwater Area of the Yellow River under a changing climate. Land Degrad. Dev. 2019, 31, 133–152. [Google Scholar] [CrossRef]
- Wang, X.; Chen, R.; Liu, G.; Han, C.; Yang, Y.; Song, Y.; Liu, J.; Liu, Z.; Liu, X.; Guo, S.; et al. Response of low flows under climate warming in high-altitude permafrost regions in western China. Hydrol. Process. 2019, 33, 66–75. [Google Scholar] [CrossRef]
- Liu, L.; Zhao, D.; Wei, J.; Zhuang, Q.; Gao, X.; Zhu, Y.; Zhang, J.; Guo, J.; Zheng, D. Permafrost sensitivity to global warming of 1.5 °C and 2 °C in the Northern Hemisphere. Environ. Res. Lett. 2021, 16, 034038. [Google Scholar] [CrossRef]
- Hu, G.; Zhao, L.; Li, R.; Wu, X.; Wu, T.; Xie, C.; Zhu, X.; Hao, J. Estimation of ground temperatures in permafrost regions of the Qinghai-Tibetan Plateau from climatic variables. Theoret. Appl. Climatol. 2020, 140, 1081–1091. [Google Scholar] [CrossRef]
- Jin, H.; Chang, X.; Luo, D.; He, R.; Lü, L.; Yang, S.; Guo, D.; Chen, X.; Harris, S.A. Evolution of permafrost and periglacial environments in Northeast China since the Last Glaciation Maximum. Sci. Cold Arid Reg. 2016, 8, 269–296. [Google Scholar]
- Jin, H.; Jin, X.; He, R.; Luo, D.; Chang, X.; Wang, S.; Marchenko, S.S.; Yang, S.; Yi, C.; Li, S.; et al. Evolution of permafrost in China during the last 20 ka. Sci. China Earth Sci. 2019, 62, 1181–1192. [Google Scholar] [CrossRef]
- Jin, H.; Sun, G.; Yu, S.; He, J. Symbiosis of marshes and permafrost in the Da and Xiao Hinggan Mountains in Northeastern China. Chin. Geogr. Sci. 2008, 18, 62–69. [Google Scholar] [CrossRef]
- Li, X.; Jin, H.; He, R.; Huang, Y.; Wang, D.; Luo, D.; Jin, X.; Lü, L.; Wang, L.; Li, W. Effects of forest fires on the permafrost environment in the northern Da Xing’anling (Hinggan) Mountains, Northeast China. Permafr. Periglac. Process. 2019, 30, 163–177. [Google Scholar] [CrossRef]
- He, R.; Jin, H.; Li, X.; Zhou, C.; Jia, N.; Jin, X.; Wang, L.; Li, W.; Wei, C.; Chang, X.; et al. Permafrost features in the Nanwenghe Wetlands Reserve on southern slope of the Da Xing’aning-Yile’huli Mountains in Northeast China and their recent changes. Adv. Clim. Chang. Res. 2021, 12, 696–709. [Google Scholar] [CrossRef]
- Harris, C.; Arenson, L.U.; Christiansen, H.H.; Etzelmüllerd, B.; Frauenfelder, R.; Gruber, S.; Haeberli, W.; Hauck, C.; Hölzle, M.; Humlum, O.; et al. Permafrost and climate in Europe: Monitoring and modelling thermal, geomorphological and geotechnical responses. Earth Sci. Rev. 2009, 92, 117–171. [Google Scholar] [CrossRef] [Green Version]
- Isaksen, K.; Sollid, J.L.; Holmlund, P.; Harris, C. Recent warming of mountain permafrost in Svalbard and Scandinavia. J. Geophys. Res. 2007, 112, F02S04. [Google Scholar] [CrossRef]
- Swiss Permafrost Monitoring Network (PERMOS). Permafrost Monitoring Network (PERMOS). Permafrost in Switzerland 2010/2011 to 2013/2014. In Glaciological Report (Permafrost), No. 12–15 of the Cryospheric Commission of the Swiss Academy of Sciences; Noetzli, J., Luethi, R., Staub, B., Eds.; Swiss Permafrost Monitoring Network (PERMOS), Department of Geosciences, University of Fribourg: Fribourg, Switzerland, 2016; p. 85. [Google Scholar] [CrossRef]
- Swiss Permafrost Monitoring Network (PERMOS). Permafrost Monitoring Network (PERMOS). Permafrost in Switzerland 2014/2015 to 2017/2018. In Glaciological Report (Permafrost), No. 16–19 of the Cryospheric Commission of the Swiss Academy of Sciences; Noetzli, J., Pellet, C., Staub, B., Eds.; Swiss Permafrost Monitoring Network (PERMOS), Department of Geosciences, University of Fribourg: Fribourg, Switzerland, 2019; p. 104. [Google Scholar] [CrossRef]
- Trombotto, D.; Borzotta, E. Indicators of present global warming through changes in active layer-thickness, estimation of thermal diffusivity and geomorphological observations in the Morenas Coloradas rockglacier, Central Andes of Mendoza, Argentina. Cold Reg. Sci. Technol. 2009, 55, 321–330. [Google Scholar] [CrossRef]
- Schaffer, N.; MacDonell, S.; Réveillet, M.; Yáñez, E.; Valois, R. Rock glaciers as a water resource in a changing climate in the semiarid Chilean Andes. Reg. Environ. Chang. 2019, 19, 1263–1279. [Google Scholar] [CrossRef]
- Levy, J.S.; Fountain, A.G.; Dickson, J.L.; Head, J.W.; Okal, M.; Marchant, D.R.; Watters, J. Accelerated thermokarst formation in the McMurdo Dry Valleys, Antarctica. Sci. Rep. 2013, 3, 2269. [Google Scholar] [CrossRef] [Green Version]
- Brown, J.; Kholodov, A.; Romanovsky, V.; Yoshikawa, K.; Smith, S.L.; Christiansen, H.H.; Vieira, G.; Noetzli, J. The thermal state of permafrost: The IPY-IPA snapshot (2007–2009). In Proceedings of the Geo2010 Proceedings of the 63rd Canadian Geotechnical Conference and 6th Canadian Permafrost Conference, Calgary, AB, Canada, 12–16 September 2010; pp. 1228–1234. [Google Scholar]
- Romanovsky, V.E.; Smith, S.L.; Christiansen, H.H. Permafrost thermal state in the polar Northern Hemisphere during the international polar year 2007–2009: A synthesis. Permafr. Periglac. Process. 2010, 21, 106–116. [Google Scholar] [CrossRef] [Green Version]
- Romanovsky, V.E.; Smith, S.L.; Shiklomanov, N.I.; Marchenko, S.S. Terrestrial permafrost. Bull. Am. Meteorol. Soc. 2017, 98, S147–S151. [Google Scholar]
- Smith, S.L.; Romanovsky, V.E.; Lewkowicz, A.G.; Burn, C.R.; Allard, M.; Clow, G.D.; Yoshikawa, K.; Throop, J. Thermal state of permafrost in North America: A contribution to the international polar year. Permafr. Periglac. Process. 2010, 21, 117–135. [Google Scholar] [CrossRef] [Green Version]
- Smith, S.L.; Lewkowicz, A.G.; Duchesne, C.; Ednie, M. Variability and change in permafrost thermal state in northern Canada. In Proceedings of the 68th Canadian Geotechnical Conference and Seventh Canadian Conference on Permafrost, Québec, QC, Canada, 20–23 September 2015. [Google Scholar]
- Harris, S.A. Climate change and permafrost stability in the eastern Canada Cordillera: The results of 33 years of measurements. Sci. Cold Arid Reg. 2009, 1, 381–403. [Google Scholar]
- Boike, J.; Georgi, C.; Kirilin, G.; Muster, S.; Abramova, K.; Fedorova, I.; Chetverova, A.; Grigoriev, M.; Bornemann, N.; Langer, M. Thermal processes of thermokarst lakes in the continuous permafrost zone of northern Siberia—Observations and modeling (Lena River Delta, Siberia). Biogeosciences 2015, 12, 5941–5965. [Google Scholar] [CrossRef] [Green Version]
- Marchenko, S.S.; Gorbunov, A.P.; Romanovsky, V.E. Permafrost warming in the Tien Shan Mountains, Central Asia. Glob. Planet. Chang. 2007, 56, 311–327. [Google Scholar] [CrossRef]
- Vieira, G.; Bockheim, J.; Guglielmin, M.; Balks, M.; Abramov, A.A.; Boelhouwers, J.; Cannone, N.; Ganzert, L.; Gilichinsky, D.A.; Goryachkin, S.; et al. Thermal state of permafrost and active-layer monitoring in the Antarctic: Advances during the International Polar Year 2007–2009. Permafr. Periglac. Process. 2010, 21, 182–197. [Google Scholar] [CrossRef] [Green Version]
- Lewkowicz, A.G. Dynamics of active layer detachment failures, Fosheim Peninsula, Ellesmere Island, Nunavut, Canada. Permafr. Periglac. Process. 2007, 18, 89–103. [Google Scholar] [CrossRef]
- Lewkowicz, A.G.; Way, R.G. Extremes of summer climate trigger thousands of thermokarst landslides in a High Arctic environment. Nat. Commun. 2019, 10, 1329. [Google Scholar] [CrossRef] [Green Version]
- Woo, M.K. Permafrost Hydrology; Springer: Heidelberg, Germany, 2012; p. 575. [Google Scholar]
- Serban, D.R.; Jin, H.; Serban, M.; Luo, D.; Wang, Q.; Jin, X.; Ma, Q. Mapping thermokarst lakes/ponds across permafrost landscapes in the Headwater Area of Yellow River on NE Qinghai-Tibet Plateau. Int. J. Remote Sens. 2020, 41, 7042–7067. [Google Scholar] [CrossRef]
- Serban, R.; Jin, H.; Serban, M.; Luo, D. Shrinking thermokarst lakes and ponds in the Headwater Area of Yellow River on the northeastern Qinghai-Tibet Plateau, Southwest China over the last three decades. Permafr. Periglac. Process. 2021, 32, 601–617. [Google Scholar] [CrossRef]
- Jones, B.M.; Arp, C.D. Observing a catastrophic thermokarst lake drainage in northern Alaska. Permafr. Periglac. Process. 2015, 26, 119–128. [Google Scholar] [CrossRef]
- St Jacques, J.M.; Sauchyn, D.J. Increasing winter baseflow and mean annual streamflow from possible permafrost thawing in the Northwest Territories, Canada. Geophys. Res. Lett. 2009, 36, 329–342. [Google Scholar] [CrossRef]
- Ma, Q.; Jin, H.; Bense, V.F.; Luo, D.; Marchenko, S.S.; Harris, S.A.; Lan, Y. Impacts of degrading permafrost on streamflow in the source area of Yellow River on the Qinghai-Tibet Plateau, China. Adv. Clim. Chang. Res. 2020, 10, 225–239. [Google Scholar] [CrossRef]
- Spence, C.; Kokelj, S.V.; Kokelj, S.A.; McCluskie, M.; Hedstrom, N. Evidence of a change in water chemistry in Canada’s subarctic associated with enhanced winter streamflow. J. Geophys. Res. Biogeosci. 2015, 120, 113–127. [Google Scholar] [CrossRef]
- Lamontagne-Hallé, P.; McKenzie, J.M.; Kurylyk, B.L.; Zipper, S.C. Changing groundwater discharge dynamics in permafrost regions. Environ. Res. Lett. 2018, 13, 084017. [Google Scholar] [CrossRef]
- Lan, C.; Zhang, Y.; Bohn, T.J.; Zhao, L.; Li, J.; Liu, Q.; Zhou, B. Frozen soil degradation and its effects on surface hydrology in the northern Tibetan Plateau. J. Geophys. Res. Atmos. 2015, 120, 8276–8298. [Google Scholar]
- Ye, B.; Yang, D.; Zhang, Z.; Kane, D.L. Variation of hydrological regime with permafrost coverage over Lena Basin in Siberia. J. Geophys. Res. 2009, 114, D07102. [Google Scholar] [CrossRef] [Green Version]
- Makarieva, O.; Nesterova, N.; Post, D.A.; Sherstiukov, A.; Lebedeva, L. Warming temperatures are impacting the hydrometeorological regime of Russian rivers in the zone of continuous permafrost. Cryosphere 2019, 13, 1635–1659. [Google Scholar] [CrossRef] [Green Version]
- Walvoord, M.A.; Voss, C.I.; Wellman, T.P. Influence of permafrost distribution on groundwater flow in the context of climate-driven permafrost thaw: Example from Yukon Flats Basin, Alaska, United States. Water Resour. Res. 2012, 48, W07524. [Google Scholar] [CrossRef]
- Wang, S.; Sheng, Y.; Cao, W.; Li, J.; Ma, S.; Hu, X. Estimation of permafrost ice reserves in the source area of the Yellow River using landform classification. Adv. Water Sci. 2017, 28, 801–810. [Google Scholar]
- Wang, X.; Chen, R.; Yang, Y. Effects of permafrost degradation on the hydrological regime in the source regions of the Yangtze and Yellow rivers, China. Water 2017, 9, 897. [Google Scholar] [CrossRef] [Green Version]
- Watson, V.; Kooi, H.; Bense, V.F. Potential controls on cold-season river flow behavior in subarctic river basins of Siberia. J. Hydrol. 2013, 489, 214–226. [Google Scholar] [CrossRef]
- Walvoord, M.A.; Striegl, R.G. Increased groundwater to stream discharge from permafrost thawing in the Yukon River basin: Potential impacts on lateral export of carbon and nitrogen. Geophys. Res. Lett. 2007, 34, L12402. [Google Scholar] [CrossRef] [Green Version]
- Wang, P.; Huang, Q.; Pozdniakov, S.; Liu, S.; Ma, N.; Wang, T.; Zhang, Y.; Yu, J.; Xie, J.; Fu, G. Potential role of permafrost thaw on increasing Siberian river discharge. Environ. Res. Lett. 2021, 16, 034046. [Google Scholar] [CrossRef]
- Muskett, R.R.; Romanovsky, V.E. Groundwater storage changes in arctic permafrost watersheds from GRACE and in situ measurements. Environ. Res. Lett. 2009, 4, 045009. [Google Scholar] [CrossRef]
- Xu, M.; Kang, S.; Zhao, Q.; Li, J. Terrestrial water storage changes of permafrost in the Three-River Source Region of the Tibetan Plateau, China. Adv. Meteorol. 2016, 1, 4364738. [Google Scholar] [CrossRef] [Green Version]
- Zhang, P.; Chen, X.; Bao, A.; Liu, T.; Ndayisaba, F. Assessing spatio-temporal characteristics of water storage changes in the mountainous areas of Central Asia based on GRACE. Chin. Geogr. Sci. 2017, 27, 918–933. [Google Scholar] [CrossRef]
- Velicogna, I.; Tong, J.; Zhang, T.; Kimball, J.S. Increasing subsurface water storage in discontinuous permafrost areas of the Lena River basin, Eurasia, detected from GRACE. Geophys. Res. Lett. 2012, 46, 6149–6155. [Google Scholar] [CrossRef] [Green Version]
- Llovel, W.; Becker, M.; Cazenave, A.; Crétaux, J.-F.; Ramillien, G.G. Global land water storage change from GRACE over 2002–2009; inference on sea level. Comptes Rendus Geosci. 2010, 342, 179–188. [Google Scholar] [CrossRef]
- Vey, S.; Steffen, H.; Müller, J.; Boike, J. Inter-annual water mass variations from GRACE in Central Siberia. J. Geodes. 2013, 87, 287–299. [Google Scholar] [CrossRef]
- Suzuki, K.; Matsuo, K.; Hiyama, T. Satellite gravimetry-based analysis of terrestrial water storage and its relationship with run-off from the Lena River in eastern Siberia. Int. J. Remote Sens. 2016, 37, 2198–2210. [Google Scholar] [CrossRef] [Green Version]
- Ahi, G.O.; Cekim, H.O. Long-term temporal prediction of terrestrial water storage changes over global basins using GRACE and limited GRACE-FO data. Acta Geodes. Geophys. 2021, 56, 321–344. [Google Scholar] [CrossRef]
- Chen, H.; Zhang, W.; Nie, N.; Guo, Y. Long-term groundwater storage variations estimated in the Songhua River Basin by using GRACE products, land surface models, and in-situ observations. Sci. Total Environ. 2019, 649, 372–387. [Google Scholar] [CrossRef] [PubMed]
- Xiang, L.; Wang, H.; Steffen, H.; Wu, P.; Qiang, S. Groundwater storage changes in the Tibetan Plateau and adjacent areas revealed from GRACE satellite gravity data. Earth Planet. Lett. 2016, 449, 228–239. [Google Scholar] [CrossRef] [Green Version]
- Liu, G.; Wang, G. Insight into runoff decline due to climate change in China’s Water Tower. Water Sci. Technol. Water Suppl. 2012, 12, 352–361. [Google Scholar] [CrossRef]
- Qian, K. Hydrological Periods and Its Responses to Climate Change in the Source Region of Yangtze River, China. Ph.D. Thesis, China University of Geoscience, Beijing, China, 2013; pp. 55–81. (In Chinese). [Google Scholar]
- Yi, S.; Wang, Q.; Sun, W. Basin mass dynamic changes in China from GRACE based on a multibasin inversion method. J. Geophys. Res. Solid Earth. 2016, 121, 3782–3803. [Google Scholar] [CrossRef] [Green Version]
- Zou, D.; Zhao, L.; Sheng, Y.; Chen, J.; Hu, G.; Wu, T.; Wu, J.; Xie, C.; Wu, X.; Pang, Q.; et al. A new map of permafrost distribution on the Tibetan Plateau. Cryosphere 2017, 11, 2527–2542. [Google Scholar] [CrossRef] [Green Version]
- Jiao, J.; Zhang, X.; Liu, Y.; Kuang, X. Increased water storage in the Qaidam Basin, the North Tibet Plateau from GRACE gravity data. PLoS ONE 2015, 10, e0141442. [Google Scholar] [CrossRef] [Green Version]
- Zhang, Y.; Cai, W.; Chen, Q.; Yao, Y.; Liu, K. Analysis of changes in precipitation and drought in Aksu River Basin, Northwest China. Adv. Meteorol. 2015, 15, 215840. [Google Scholar] [CrossRef] [Green Version]
- Zhang, G.; Yao, T.; Shum, C.K.; Yi, S.; Yang, K.; Xie, H.; Feng, W.; Bolch, A.; Zhang, H.; Wang, W.; et al. Lake volume and groundwater storage variations in Tibetan Plateau’s endorheic basin. Geophys. Res. Lett. 2017, 44, 5550–5560. [Google Scholar] [CrossRef]
- Shi, Y.; Niu, F.; Yang, C.; Che, T.; Lin, Z.; Luo, J. Permafrost presence/absence mapping of the Qinghai-Tibet Plateau based on multi-source remote sensing data. Remote Sens. 2018, 10, 309. [Google Scholar] [CrossRef] [Green Version]
- Yamazaki, Y.; Kubota, J.; Ohata, T.; Vuglinsky, V.; Mizuyama, T. Seasonal changes in runoff characteristics on a permafrost watershed in the southern mountainous region of eastern Siberia. Hydrol. Process. 2006, 20, 453–467. [Google Scholar] [CrossRef]
- Zhang, Y.; Ohata, T.; Kadota, T. Land-surface hydrological processes in the permafrost region of the eastern Tibetan plateau. J. Hydrol. 2003, 283, 41–56. [Google Scholar] [CrossRef]
- Yang, Y.; Wu, Q.; Hou, Y.; Zhang, Z.; Zhan, J.; Gao, S.; Jin, H. Unraveling of permafrost hydrological variabilities on central Qinghai-Tibet Plateau using stable isotopic technique. Sci. Total Environ. 2017, 605, 199–210. [Google Scholar] [CrossRef] [PubMed]
- Wang, W.; Wu, T.; Zhao, L.; Li, R.; Zhu, X.; Wang, W.; Yang, S.; Qin, Y.; Hao, J. Exploring the ground ice recharge near permafrost table on the central Qinghai-Tibet plateau using chemical and isotopic data. J. Hydrol. 2018, 560, 220–229. [Google Scholar] [CrossRef]
- Li, T.; Wang, G.; Hu, H.; Liu, G.; Ren, D.; Wang, Y. Hydrological processes in a typical small permafrost watershed at the Headwaters of Yangtze River. J. Glaciol. Geocryol. 2009, 31, 82–88, (In Chinese with English abstract). [Google Scholar]
- Niu, F.; Lin, Z.; Liu, H.; Lu, J. Characteristics of thermokarst lakes and their influence on permafrost in Qinghai-Tibet Plateau. Geomorphology 2011, 132, 222–233. [Google Scholar] [CrossRef]
- Wang, K.; Zhang, T.; Yang, D. Permafrost dynamics and their hydrologic impacts over the Russian Arctic drainage basin. Adv. Clim. Chang. Res. 2021, 12, 482–498. [Google Scholar] [CrossRef]
- Lyon, S.W.; Destouni, G.; Giesler, R.; Humborg, C.; Morth, M.; Seibert, J.; Karlsson, J.; Troch, P.A. Estimation of permafrost thawing rates in a sub-arctic catchment using recession flow analysis. Hydrol. Earth Syst. Sci. 2009, 13, 595–604. [Google Scholar] [CrossRef] [Green Version]
- Woo, M.K.; Kane, D.L.; Carey, S.K.; Yang, D. Progress in permafrost hydrology in the new millennium. Permafr. Periglac. Process. 2008, 19, 237–254. [Google Scholar] [CrossRef]
- Ge, S.; McKenzie, J.; Voss, C.; Wu, Q. Exchange of groundwater and surface-water mediated by permafrost response to seasonal and long term air temperature variation. Geophys. Res. Lett. 2011, 38, L14402. [Google Scholar] [CrossRef] [Green Version]
- Gao, S.; Jin, H.; Bense, V.F.; Wang, X.; Chai, X. Application of electrical resistivity tomography for delineating permafrost hydrogeology in the headwater area of Yellow River on Qinghai-Tibet Plateau, SW China. Hydrogeol. J. 2019, 2, 1725–1737. [Google Scholar] [CrossRef]
- Minsley, B.J.; Abraham, J.D.; Smith, B.D.; Cannia, J.C.; Voss, C.I.; Jorgenson, M.T.; Walvoord, M.A.; Wylie, B.K.; Anderson, L.; Ball, L.B.; et al. Airborne electromagnetic imaging of discontinuous permafrost. Geophys. Res. Lett. 2012, 39, L02503. [Google Scholar] [CrossRef] [Green Version]
- Grasby, S.E.; Beauchamp, B.; Bense, V.F. Sulfuric acid speleogenesis associated with a glacially driven groundwater system—paleo-spring “pipes” at Borup Fjord Pass, Nunavut. Astrobiology 2012, 12, 19–28. [Google Scholar] [CrossRef]
- Li, J.; Sheng, Y.; Wu, J.; Feng, Z.; Ning, Z.; Hu, X.; Zhang, X. Mapping frozen soil distribution and modeling permafrost stability in the Source Area of the Yellow River. Sci. Geogr. Sin. 2016, 36, 588–596, (In Chinese with English abstract). [Google Scholar]
- Li, J.; Sheng, Y.; Wu, J.; Feng, Z.; Ning, Z.; Hu, X.; Zhang, X. Landform-related permafrost characteristics in the source area of the Yellow River, eastern Qinghai-Tibet Plateau. Geomorphology 2016, 269, 104–111. [Google Scholar] [CrossRef]
- Luo, D.; Jin, H.; Marchenko, S.S.; Romanovsky, V.E. Distribution and changes of the active layer thickness and temperature in the Sources Areas of the Yellow River using the GIPL model. Sci. China Earth Sci. 2014, 57, 1834–1845. [Google Scholar] [CrossRef]
- Li, X.; Gou, X.; Wang, N.; Sheng, Y.; Jin, H.; Qi, Y.; Song, X.; Hou, F.; Li, Y.; Zhao, C.; et al. The ecosystems and green development in the Qilian Mountains from ecological rehab to ecological restoration. Sci. Bull. 2019, 64, 2928–2937. [Google Scholar] [CrossRef] [Green Version]
- Jones, D.B.; Harrison, S.; Anderson, K.; Betts, R.A. Mountain rock glaciers contain globally significant water stores. Sci. Rep. 2018, 8, 1–10. [Google Scholar] [CrossRef] [Green Version]
- Jones, D.B.; Harrison, S.; Anderson, K.; Selley, H.L.; Wood, J.L.; Betts, R.A. The distribution and hydrological significance of rock glaciers in the Nepalese Himalaya. Glob. Planet. Chang. 2019, 160, 123–142. [Google Scholar] [CrossRef] [Green Version]
- Kokelj, S.V.; Jorgenson, M.T. Advances in thermokarst research. Permafr. Periglac. Process. 2013, 24, 108–119. [Google Scholar] [CrossRef]
- Smith, S.L.; Burgess, M.M.; Riseborough, D.; Nixon, F.M. Recent trends from Canadian permafrost thermal monitoring network sites. Permafr. Periglac. Process. 2005, 16, 19–30. [Google Scholar] [CrossRef]
- Lamoureux, S.F.; Lafrenière, M.J. Fluvial impact of extensive active-layer detachments, Cape Bounty, Melville Island, Canada. Arct. Antarct. Alp. Res. 2009, 4, 59–68. [Google Scholar] [CrossRef]
- Fortier, D.; Allard, M.; Shur, Y. Observation of rapid drainage system development by thermal erosion of ice wedges on Bylot Island, Canadian Arctic Archipelago. Permafr. Periglac. Process. 2007, 18, 229–243. [Google Scholar] [CrossRef]
- Godin, E.; Fortier, D. Geomorphology of a thermo-erosion gully, Bylot Island, Nunavut, Canada. Can. J. Earth Sci. 2012, 49, 979–986. [Google Scholar]
- Shilo, N.; Lozhkin, A.; Anderson, P. Radiocarbon dates of evolution cycles of thermokarst lakes on the Kolyma Lowland. Dokl. Earth Sci. 2007, 413, 259–261. [Google Scholar] [CrossRef]
- Walter, K.M.; Edwards, M.E.; Grosse, G.; Zimov, S.A.; Chapin, F.S., III. Thermokarst lakes as a source of atmospheric CH4 during the last deglaciation. Science 2007, 318, 633–636. [Google Scholar] [CrossRef] [PubMed] [Green Version]
- Lauriol, B.; Lacelle, D.; Labrecque, S.; Duguay, C.R.; Telka, A. Holocene evolution of lakes in the Bluefish Basin, Northern Yukon, Canada. Arctic 2009, 62, 212–224. [Google Scholar] [CrossRef]
- Liang, S.; Wan, L.; Li, Z.; Cao, W. The effect of permafrost on alpine vegetation in the Source Regions of the Yellow River. J. Glaciol. Geocryol. 2007, 29, 45–52, (In Chinese with English abstract). [Google Scholar]
- Li, Z.; Li, Z.; Fan, X.; Wang, Y.; Song, L.; Gui, J.; Xue, J.; Zhang, B.; Gao, W. The sources of supra-permafrost water and its hydrological effect based on stable isotopes in the third pole region. Sci. Total Environ. 2020, 715, 136911. [Google Scholar] [CrossRef] [PubMed]
- Duan, L.; Man, X.; Kurylyk, B.L.; Cai, T. Increasing winter baseflow in response to permafrost thaw and precipitation regime shifts in Northeastern China. Water 2017, 9, 25. [Google Scholar] [CrossRef] [Green Version]
- Duan, L.; Man, X.; Kurylyk, B.L.; Cai, T.; Li, Q. Distinguishing streamflow trends caused by changes in climate, forest cover, and permafrost in a large watershed in northeastern China. Hydrol. Process. 2017, 31, 1938–1951. [Google Scholar] [CrossRef]
- Wang, B. Permafrost and groundwater conditions, Huola River Basin, Northeast China. Permafr. Periglac. Process. 1990, 1, 45–52. [Google Scholar] [CrossRef]
- Ma, F.; Chen, J.; Zhan, L.; Zhang, X.; Yan, J.; Wang, W. New insights into water cycle in permafrost region of northern Greater Khingan Mountains, China. J. Radioanal. Nucl. Chem. 2021, 330, 631–642. [Google Scholar] [CrossRef]
- Hiyama, T.; Asai, K.; Kolesnikov, A.B.; Gagarin, L.A.; Shepelev, V.V. Estimation of the residence time of permafrost groundwater in the middle of the Lena River basin, eastern Siberia. Environ. Res. Lett. 2013, 8, 035040. [Google Scholar] [CrossRef]
- Lecher, A.L. Groundwater discharge in the Arctic: A review of studies and implications for biogeochemistry. Hydrology 2017, 4, 41. [Google Scholar] [CrossRef] [Green Version]
- Hodgson, R.; Young, K.L. Preferential groundwater flow through a sorted net landscape, Arctic Canada. Earth Surf. Process. Landforms. 2021, 26, 319–328. [Google Scholar] [CrossRef]
- Plaza, C.; Pegoraro, E.; Bracho, R.; Celis, G.; Crummer, K.; Hutchings, J.; Pries, C.; Mauritz, M.; Natali, S.; Salmon, V.; et al. Direct observation of permafrost degradation and rapid soil carbon loss in tundra. Nat. Geosci. 2019, 12, 627–631. [Google Scholar] [CrossRef]
- Turetsky, M.; Abbott, B.; Jones, M.; Anthony, K.; Olefeldt, D.; Schuur, E.; Koven, C.; McGuire, A.; Grosse, G.; Kuhry, P.; et al. Permafrost collapse is accelerating carbon release. Nature 2019, 569, 32–34. [Google Scholar] [CrossRef] [Green Version]
- Turetsky, M.; Abbott, B.; Jones, M.; Anthony, K.; Olefeldt, D.; Schuur, E.; Grosse, G.; Kuhry, P.; Hugelius, G.; Koven, C.; et al. Carbon release through abrupt permafrost thaw. Nat. Geosci. 2020, 13, 138–143. [Google Scholar] [CrossRef]
- Zhang, L.; Xia, X.; Liu, S.; Zhang, S.; Li, S.; Wang, J.; Wang, G.; Gao, H.; Zhang, Z.; Wang, Q.; et al. Significant methane ebullition from alpine permafrost rivers on the East Qinghai-Tibet Plateau. Nat. Geosci. 2020, 13, 349–354. [Google Scholar] [CrossRef]
- NG Editorial. When permafrost thaws. Nat. Geosci. 2020, 13, 765. [Google Scholar] [CrossRef]
- Oliva, M.; Pereira, P.; Antoniades, D. The environmental consequences of permafrost degradation under a changing climate. Sci Total Environ. 2018, 616, 435–437. [Google Scholar] [CrossRef] [PubMed]
- Mu, C.; Zhang, T.; Wu, Q.; Peng, X.; Cao, B.; Zhang, X.; Cheng, G. Editorial: Organic carbon pools in permafrost regions on the Qinghai–Xizang (Tibetan) Plateau. Cryosphere 2015, 9, 479–486. [Google Scholar] [CrossRef] [Green Version]
- Zimov, S.A.; Schuur, E.A.G.; Chapin, S.F., III. Permafrost and the global carbon budget. Science 2006, 312, 1612–1613. [Google Scholar] [CrossRef]
- Vonk, J.E.; Tank, S.E.; Bowden, W.B.; Laurion, I.; Vincent, W.F.; Alekseychik, A.P.; Amyot, M.; Billet, F.; Canário, J.; Cory, R.M.; et al. Reviews and syntheses: Effects of permafrost thaw on Arctic aquatic ecosystems. Biogeosciences 2015, 12, 7129–7167. [Google Scholar] [CrossRef] [Green Version]
- Likens, G.E.; Bormann, F.H.; Pierce, R.S.; Eaton, J.S.; Johnson, N.M. Biogeochemistry of Forested Ecosystem, 3rd ed.; Springer: New York, NY, USA, 2013. [Google Scholar]
- Prokushkin, A.S.; Pokrovsky, O.S.; Shirokova, L.S.; Korets, M.A.; Viers, J.; Prokushkin, S.G.; Amon, R.M.W.; Guggenberger, G.; McDowell, W.H. Sources and the flux pattern of dissolved carbon in rivers of the Yenisey basin draining the Central Siberian Plateau. Environ. Res. Lett. 2011, 6, 045212. [Google Scholar] [CrossRef] [Green Version]
- Michaelson, G.J.; Ping, C.L.; Kling, G.W.; Hobbie, J.E. The character and bioactivity of dissolved organic matter at thaw and in the spring runoff waters of the arctic tundra north slope, Alaska. J. Geophys. Res. Atmos. 1998, 103, 28939–28946. [Google Scholar] [CrossRef]
- Hugelius, G.; Strauss, J.; Zubrzycki, S.; Harden, J.W.; Schuur, E.A.G.; Ping, C.L.; Schirrmeister, L.; Grosse, G.; Michaelson, G.; Koven, C. Estimated stocks of circumpolar permafrost carbon with quantified uncertainty ranges and identified data gaps. Biogeosciences 2014, 11, 6573–6593. [Google Scholar] [CrossRef] [Green Version]
- Prokushkin, A.S.; Kawahigashi, M.; Tokareva, I.V. Global warming and dissolved organic carbon release from permafrost soils. In Permafrost Soils; Margesin, R., Ed.; Springer: Berlin/Heidelberg, Germany, 2009; pp. 237–250. [Google Scholar] [CrossRef]
- Fritz, M.; Opel, T.; Tanski, G.; Herzschuh, U.; Meyer, H.; Eulenburg, A.; Lantui, H. Dissolved organic carbon (DOC) in Arctic ground ice. Cryosphere 2015, 9, 737–752. [Google Scholar] [CrossRef] [Green Version]
- Moore, T.R.; Roulet, N.T.; Waddington, J.M. Uncertainty in predicting the effect of climatic change on the carbon cycling of Canadian peatlands. Clim. Chang. 1998, 40, 229–245. [Google Scholar] [CrossRef]
- Frey, K.E.; Smith, L.C. Amplified carbon release from vast West Siberian peatlands by 2100. Geophys. Res. Lett. 2005, 32, L09401. [Google Scholar] [CrossRef] [Green Version]
- Tank, S.E.; Striegl, R.G.; McClelland, J.W.; Kokelj, S.V. Multi-decadal increases in dissolved organic carbon and alkalinity flux from the Mackenzie drainage basin to the Arctic Ocean. Environ. Res. Lett. 2016, 11, 054015. [Google Scholar] [CrossRef]
- You, Y.; Yang, M.; Yu, Q.; Wang, X.; Li, X.; Yue, Y. Investigation of an icing near a tower foundation along the Qinghai-Tibet Power Transmission Line. Cold Reg. Sci. Technol. 2016, 121, 250–257. [Google Scholar] [CrossRef]
- de Grandpré, I.D.; Fortier, D.; Stephani, E. Degradation of permafrost beneath a road embankment enhanced by heat advected in groundwater. Can. J. Earth Sci. 2012, 49, 953–962. [Google Scholar] [CrossRef]
- de James, M.; Lewkowicz, A.G.; Smith, S.L.; Miceli, C.M. Multi-decadal degradation and persistence of permafrost in the Alaska Highway corridor, northwest Canada. Environ. Res. Lett. 2013, 8, 045013. [Google Scholar] [CrossRef]
- Mu, Y.; Ma, W.; Li, G.; Niu, F.; Liu, Y.; Mao, Y. Impacts of supra-permafrost water ponding and drainage on a railway embankment in continuous permafrost zone, the interior of the Qinghai-Tibet Plateau. Cold Reg. Sci. Technol. 2018, 154, 23–31. [Google Scholar] [CrossRef]
- Mu, Y.; Ma, W.; Li, G.; Niu, F.; Mao, Y.; Liu, Y. Long-term thermal and settlement characteristics of air convection embankments with and without adjacent surface water ponding in permafrost regions. Eng. Geol. 2020, 266, 105464. [Google Scholar] [CrossRef]
- Ghias, M.S.; Therrien, R.; Molson, J.W.; Lemieux, J.-M. Controls on permafrost thaw in a coupled groundwater-flow and heat-transport system: Iqaluit Airport, Nunavut, Canada. Hydrogeol. J. 2017, 25, 657–673. [Google Scholar] [CrossRef]
- Kokelj, S.V.; Zajdlik, B.; Thompson, M.S.A. The impacts of thawing permafrost on the chemistry of lakes across the subarctic boreal-tundra transition, Mackenzie Delta region, Canada. Permafr. Periglac. Process. 2009, 20, 185–199. [Google Scholar] [CrossRef]
- Frampton, A.; Destouni, G. Impact of degrading permafrost on subsurface solute transport pathways and travel times. Water Resour. Res. 2015, 51, 7680–7701. [Google Scholar] [CrossRef]
- Cochand, M.; Molson, J.; Lemieux, J.-M. Groundwater hydrogeochemistry in permafrost regions. Permafr. Periglac. Process. 2019, 30, 90–103. [Google Scholar] [CrossRef]
- Elberling, B.; Michelsen, A.; Schädel, C.; Schuur, E.A.G.; Christiansen, H.H.; Berg, L.; Tamstorf, M.P.; Sigsgaard, C. Long-term CO2 production following permafrost thaw. Nat. Clim. Chang. 2013, 3, 890–894. [Google Scholar] [CrossRef]
- Reyes, F.R.; Lougheed, V.L. Rapid nutrient release from permafrost thaw in arctic aquatic ecosystems. Arct. Antarct. Alp. Res. 2015, 47, 35–48. [Google Scholar] [CrossRef] [Green Version]
- Balcarczyk, K.L.; Jones, J.B., Jr.; Jaffé, R.; Maie, N. Stream dissolved organic matter bioavailability and composition in watersheds underlain with discontinuous permafrost. Biogeochemistry 2009, 94, 255–270. [Google Scholar] [CrossRef]
- Li, Y.; Zang, S.; Zhang, K.; Sun, D.; Sun, L. Occurrence, sources and potential risks of polycyclic aromatic hydrocarbons in a permafrost soil core, northeast China. Ecotoxicology 2021, 30, 1315–1324. [Google Scholar] [CrossRef]
- Fongt, T.T.; Lipp, E.K. Enteric viruses of humans and animals in aquatic environments: Health risks, detection, and potential water quality. Microbiol. Molecul. Biol Rev. 2005, 69, 357–371. [Google Scholar] [CrossRef] [Green Version]
- Kurylyk, B.L.; Hayashi, M.; Quinton, W.L.; McKenzie, J.M.; Voss, C.I. Influence of vertical and lateral heat transfer on permafrost thaw, peatland landscape transition, and groundwater flow. Water Resour. Res. 2016, 52, 1286–1305. [Google Scholar] [CrossRef] [Green Version]
- Schuur, E.A.G.; Vogel, J.G.; Crummer, K.G.; Lee, L.; Sickman, J.O.; Osterkamp, T.E. The effect of permafrost thaw on old carbon release and net carbon exchange from tundra. Nature 2009, 459, 556–559. [Google Scholar] [CrossRef]
- Graham, D.E.; Wallenstein, M.D.; Vishnivetskaya, T.A.; Waldrop, M.P.; Phelps, T.J.; Pfiffner, S.M.; Onstott, T.C.; Whyte, L.G.; Rivkina, E.M.; Gilichinsky, D.A. Microbes in thawing permafrost: The unknown variable in the climate change equation. Int. Soc. Microb. Ecol. J. 2012, 6, 709–712. [Google Scholar] [CrossRef]
- Smith-Downey, N.V.; Sunderland, E.M.; Jacob, D.J. Anthropogenic impacts on global storage and emissions of mercury from terrestrial soils: Insights from a new global model. J. Geophys. Res. 2010, 115, G03008. [Google Scholar] [CrossRef] [Green Version]
- Obrist, D.; Agnan, Y.; Jiskra, M.; Olson, C.L.; Colegrove, D.P.; Hueber, J.; Moore, C.W.; Sonke, J.E.; Helmig, D. Tundra uptake of atmospheric elemental mercury drives Arctic mercury pollution. Nature 2017, 547, 201–204. [Google Scholar] [CrossRef] [PubMed] [Green Version]
- Schuster, P.F.; Striegl, R.G.; Aiken, G.R.; Krabbenhoft, D.P.; Dewild, J.F.; Butler, K.; Kamark, B.; Dornblaser, M. Mercury export from the Yukon river basin and potential response to a changing climate. Environ. Sci. Technol. 2011, 45, 9262–9267. [Google Scholar] [CrossRef] [PubMed]
- Fisher, J.A.; Jacob, D.J.; Soerensen, A.L.; Amos, H.M.; Steffen, A.; Sunderland, E.M. Riverine source of Arctic Ocean mercury inferred from atmospheric observations. Nat. Geosci. 2012, 5, 499–504. [Google Scholar] [CrossRef]
- Dastoor, A.P.; Durnford, D.A. Arctic Ocean: Is it a sink or a source of atmospheric mercury? Environ. Sci. Technol. 2014, 48, 1707–1717. [Google Scholar] [CrossRef]
- Schuster, P.F.; Schaefer, K.M.; Aiken, G.R.; Antweiler, R.C.; Dewild, J.F.; Gryziec, J.D.; Gusmeroli, A.; Hugelius, G.; Jafarov, E.; Krabbenhoft, D.P.; et al. Permafrost stores a globally significant amount of mercury. Geophys. Res. Lett. 2018, 45, 1463–1471. [Google Scholar] [CrossRef]
- Olson, C.L.; Jiskra, M.; Sonke, J.E.; Obrist, D. Mercury in tundra vegetation of Alaska: Spatial and temporal dynamics and stable isotope patterns. Sci. Total Environ. 2019, 660, 1502–1512. [Google Scholar] [CrossRef]
- Turetsky, M.R.; Harden, J.W.; Friedli, H.R.; Flannigan, M.; Payne, N.; Crock, J.; Radke, L. Wildfires threaten mercury stocks in northern soils. Geophys. Res. Lett. 2006, 33, L16403. [Google Scholar] [CrossRef] [Green Version]
- Mu, C.; Schuster, P.F.; Abbott, B.J.; Kang, S.; Guo, J.; Sun, S.; Wu, Q.; Zhang, T. Permafrost degradation enhances the risk of mercury release on Qinghai-Tibetan Plateau. Sci. Total Environ. 2020, 708, 135127. [Google Scholar] [CrossRef]
- Mohammed, A.A.; Bense, V.F.; Kurylyk, B.L.; Jamieson, R.C.; Johnston, L.H.; Jackson, A.J. Modeling reactive solute transport in permafrost-affected groundwater systems. Water Resour. Res. 2021, 57, e2020WR028771. [Google Scholar] [CrossRef]
- Mohammed, A.A.; Cey, E.E.; Hayashi, M.; Callaghan, M.V.; Park, Y.-J.; Miller, K.L.; Frey, S.K. Dual-permeability modeling of preferential flow and snowmelt partitioning in frozen soils. Vadose Zone J. 2021, 20, e20101. [Google Scholar] [CrossRef]
- Yi, X.; Su, D.; Bussière, B.; Mayer, K.U. Thermal-hydrological-chemical modeling of a covered waste rock pile in a permafrost region. Minerals 2021, 11, 565. [Google Scholar] [CrossRef]
- Walvoord, M.A.; Striegl, R.G. Complex vulnerabilities of the water and aquatic carbon cycles to permafrost thaw. Front. Clim. 2021, 3, 730402. [Google Scholar] [CrossRef]
Figure 1.
Schematic diagram of groundwater types in permafrost regions (adapted and modified from [46,52]). Notes: (1) Type A, supra-permafrost water; Type B, in-permafrost water; Type C, sub-permafrost water (see text for full details of these types and sub-types). (2) Type A, supra-permafrost water, or water in the seasonally thawed layer: this is the water above the permafrost table, and the permafrost layer serves as an aquitard in the bottom. Sub-type A1: water in the seasonally thawed layer, underlain by the uppermost layer of attached or detached permafrost. For the latter case, upon the freeze up of the active layer, the lower part of the Sub-type A1 can be partially or seasonally artesian or turn to the Sub-type A2 under a warming climate, fire disturbances, or anthropic activities. Sub-type A2: water in the supra-permafrost subaerial talik. (3) Type B, in-permafrost water. It generally occurs only in warm (>−1 °C) permafrost. The groundwater is partially or entirely surrounded by permafrost and stays unfrozen throughout the year. This type of groundwater can be further divided into three sub-types by the position of the aquifer(s) in, between, or among the permafrost layer(s). Sub-type B1: endo-permafrost water: entirely surrounded by permafrost in all directions. Sub-type B2: intra-permafrost water: only surrounded by permafrost at the top and bottom. Sub-type B3: talik channel water: vertical aquifers only laterally surrounded by permafrost. (4) Type C, sub-permafrost water: groundwater under the base of the permafrost layer. This can be further divided into two sub-types by its relation to the base of permafrost. Sub-type C1: the aquifer is directly beneath the base of permafrost. Sub-type C2: the aquifer indirectly contacts with the permafrost base.

Figure 2.
Changes in the hydraulic conductivity of saturated soils with soil temperatures and liquid water content of very warm permafrost soils. Notes: Curves 1, 2, and 8 are modified from [65,66]; Curves 3, 4, 5, and 6, from [63]; and Curve 7, from [64]. Soil unfrozen/liquid water contents are 25–53% (volumetric) for Curve 1, 3–13% (volumetric) for Curve 2, not specified for Curves 3 and 4, 3.64–36.37% (mass-based) for Curve 5, 6.52–23.4% for Curve 6 (mass-based), 4.98–11.90% (mass-based) for Curve 7, and 22–50% (volumetric) for Curve 8.

Figure 3.
Conceptual sketch for changes in permafrost flow systems and ensued streamflow hydrographs in relatively stable and degraded permafrost regions in early winter.
Figure 3.
Conceptual sketch for changes in permafrost flow systems and ensued streamflow hydrographs in relatively stable and degraded permafrost regions in early winter.


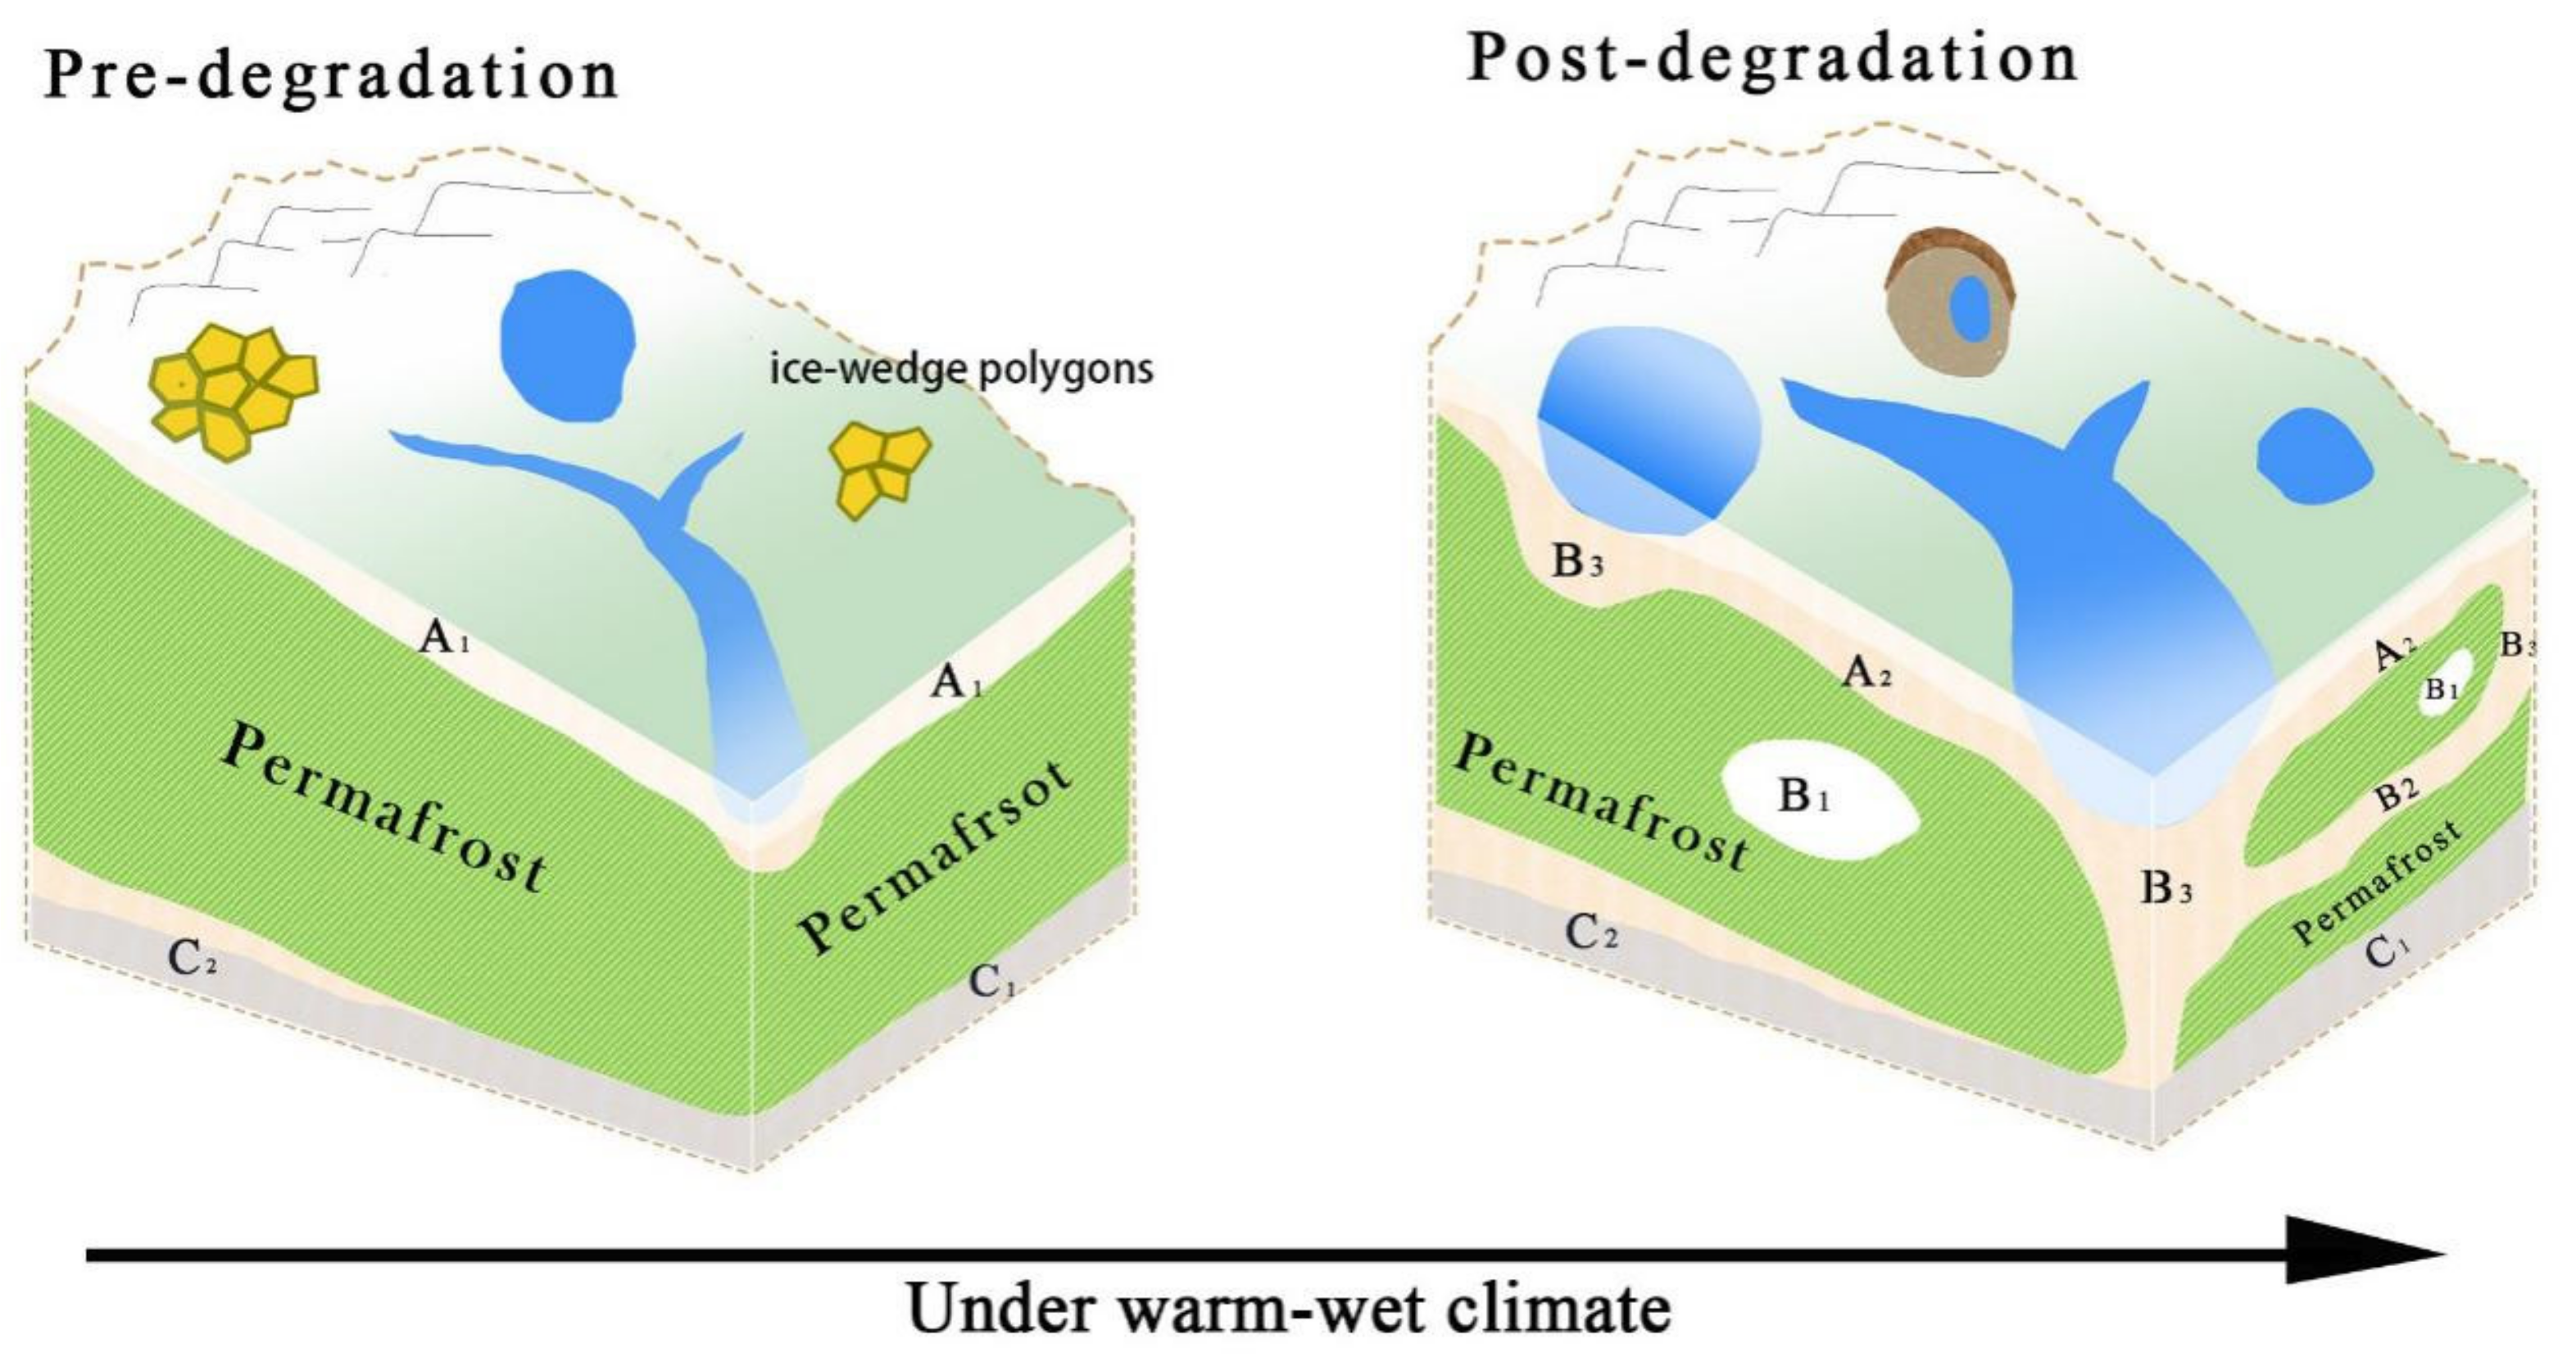
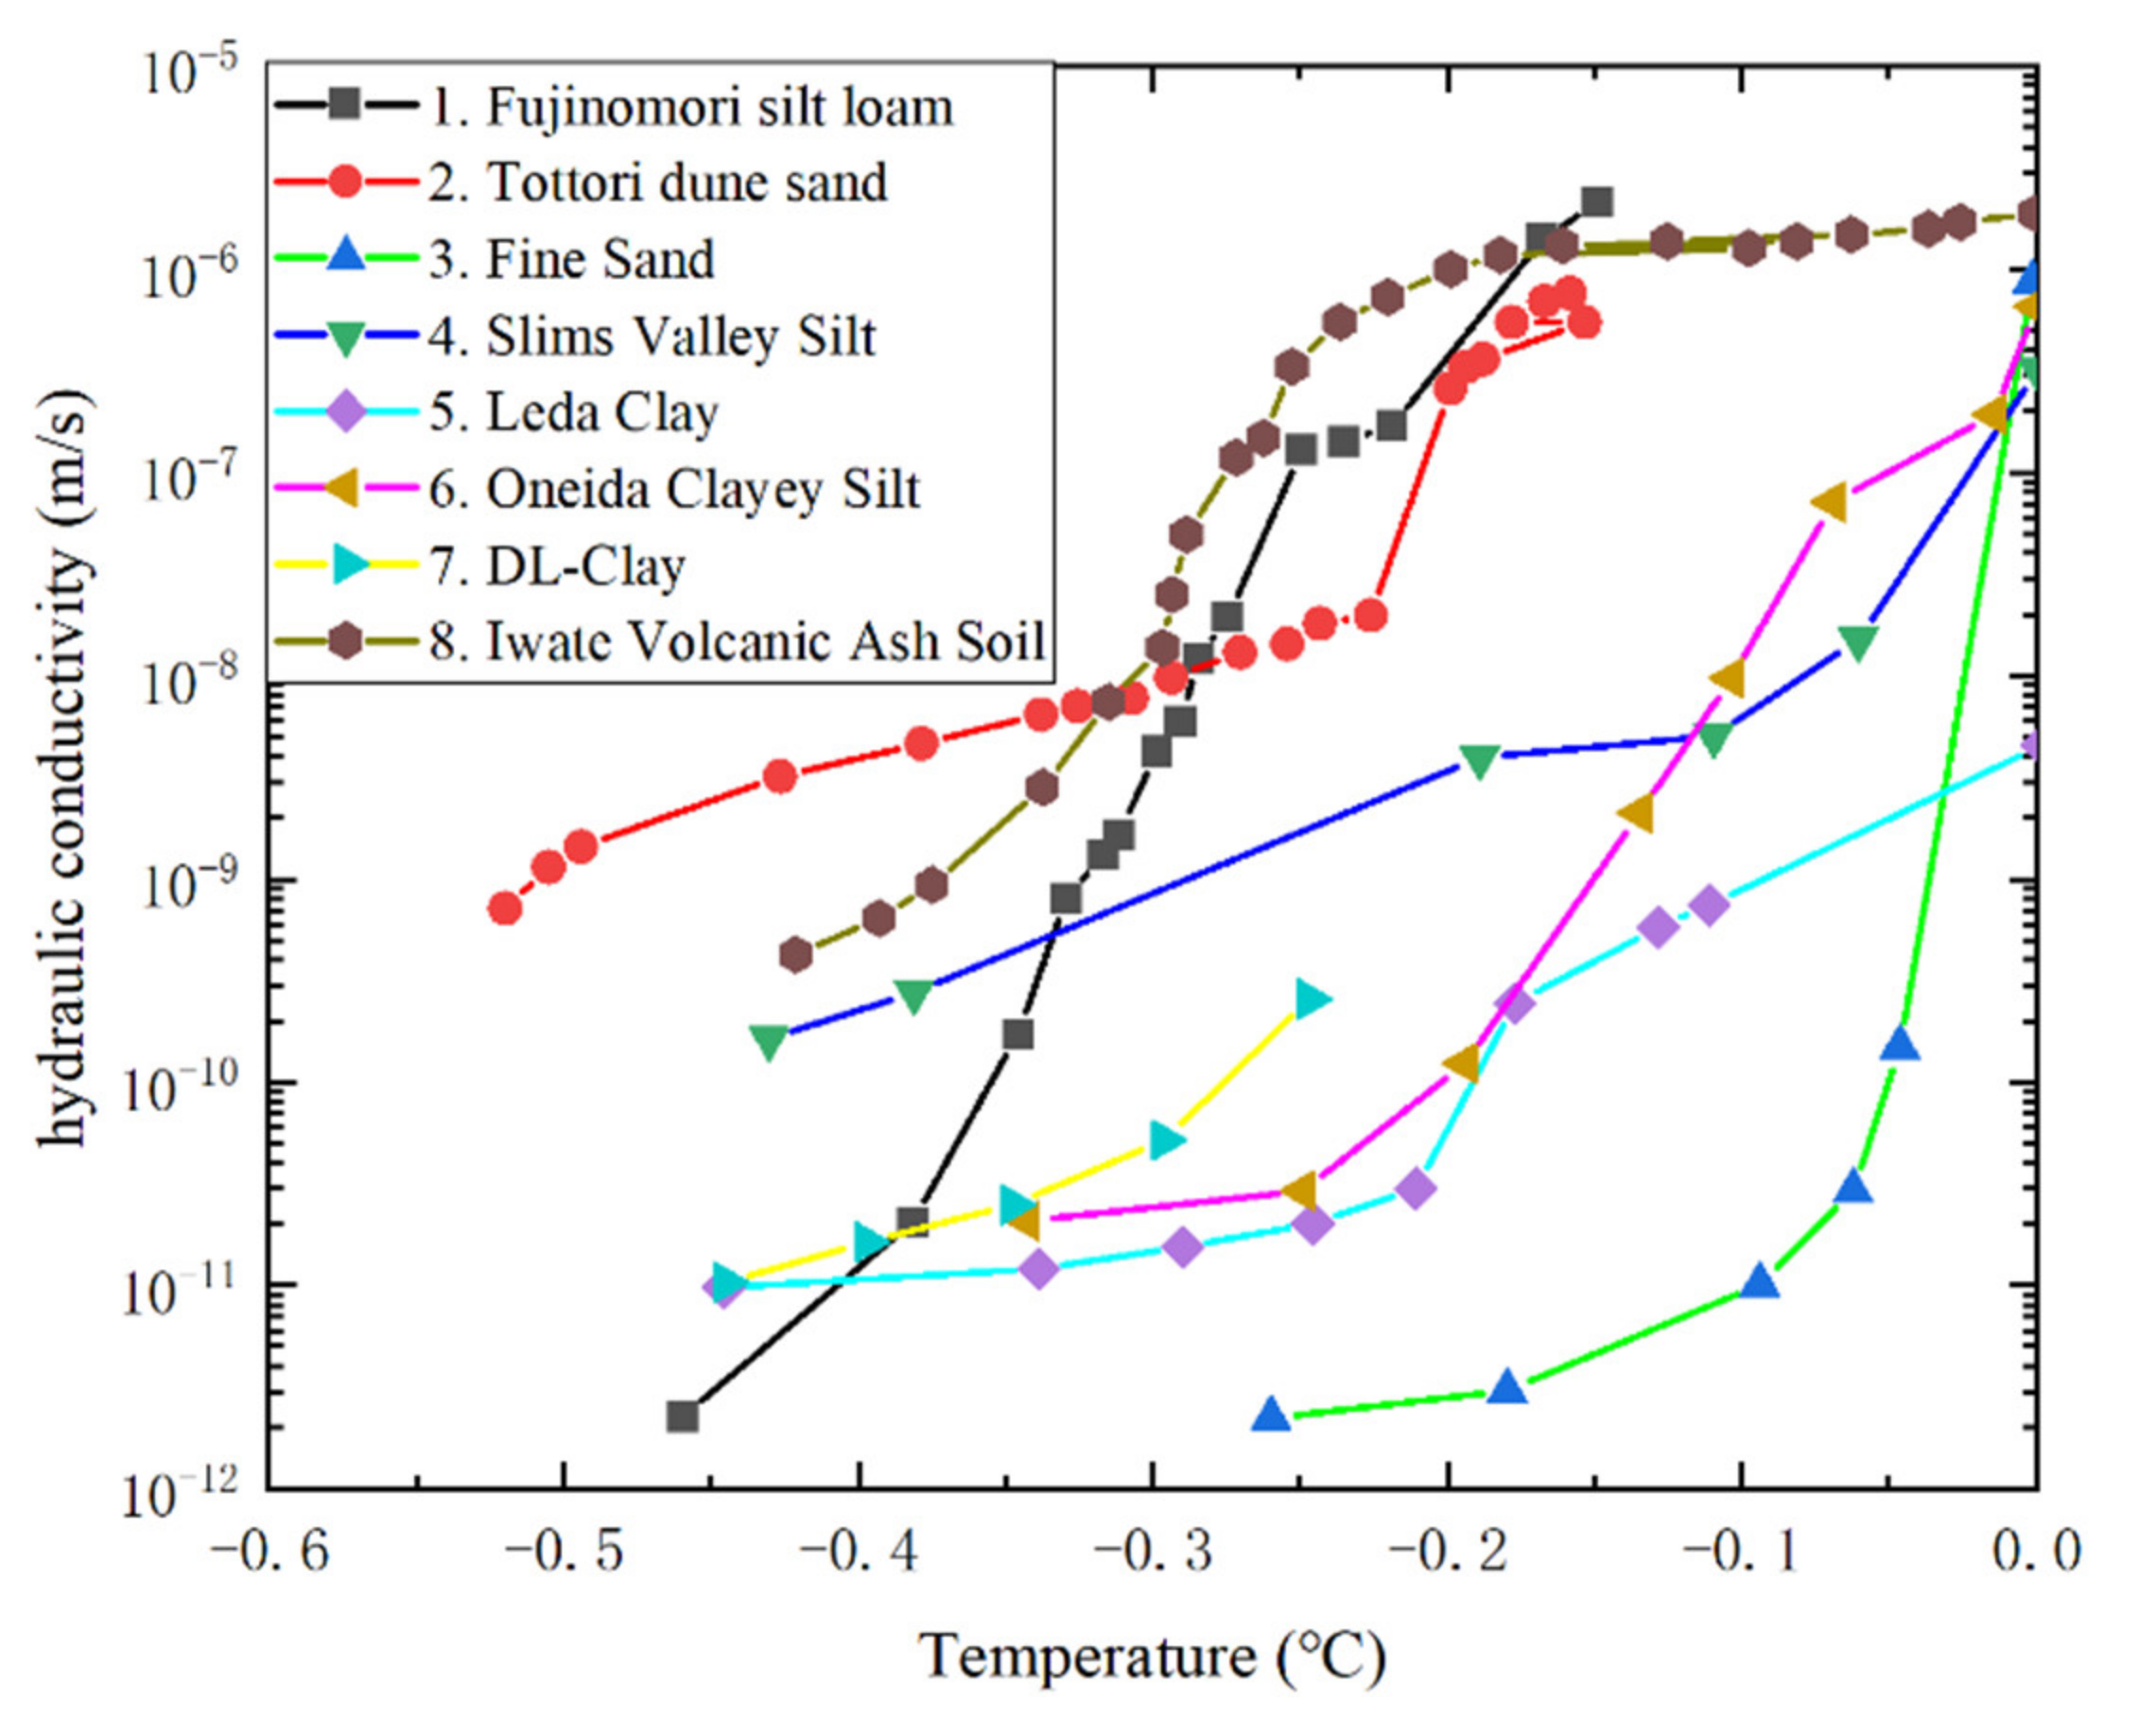
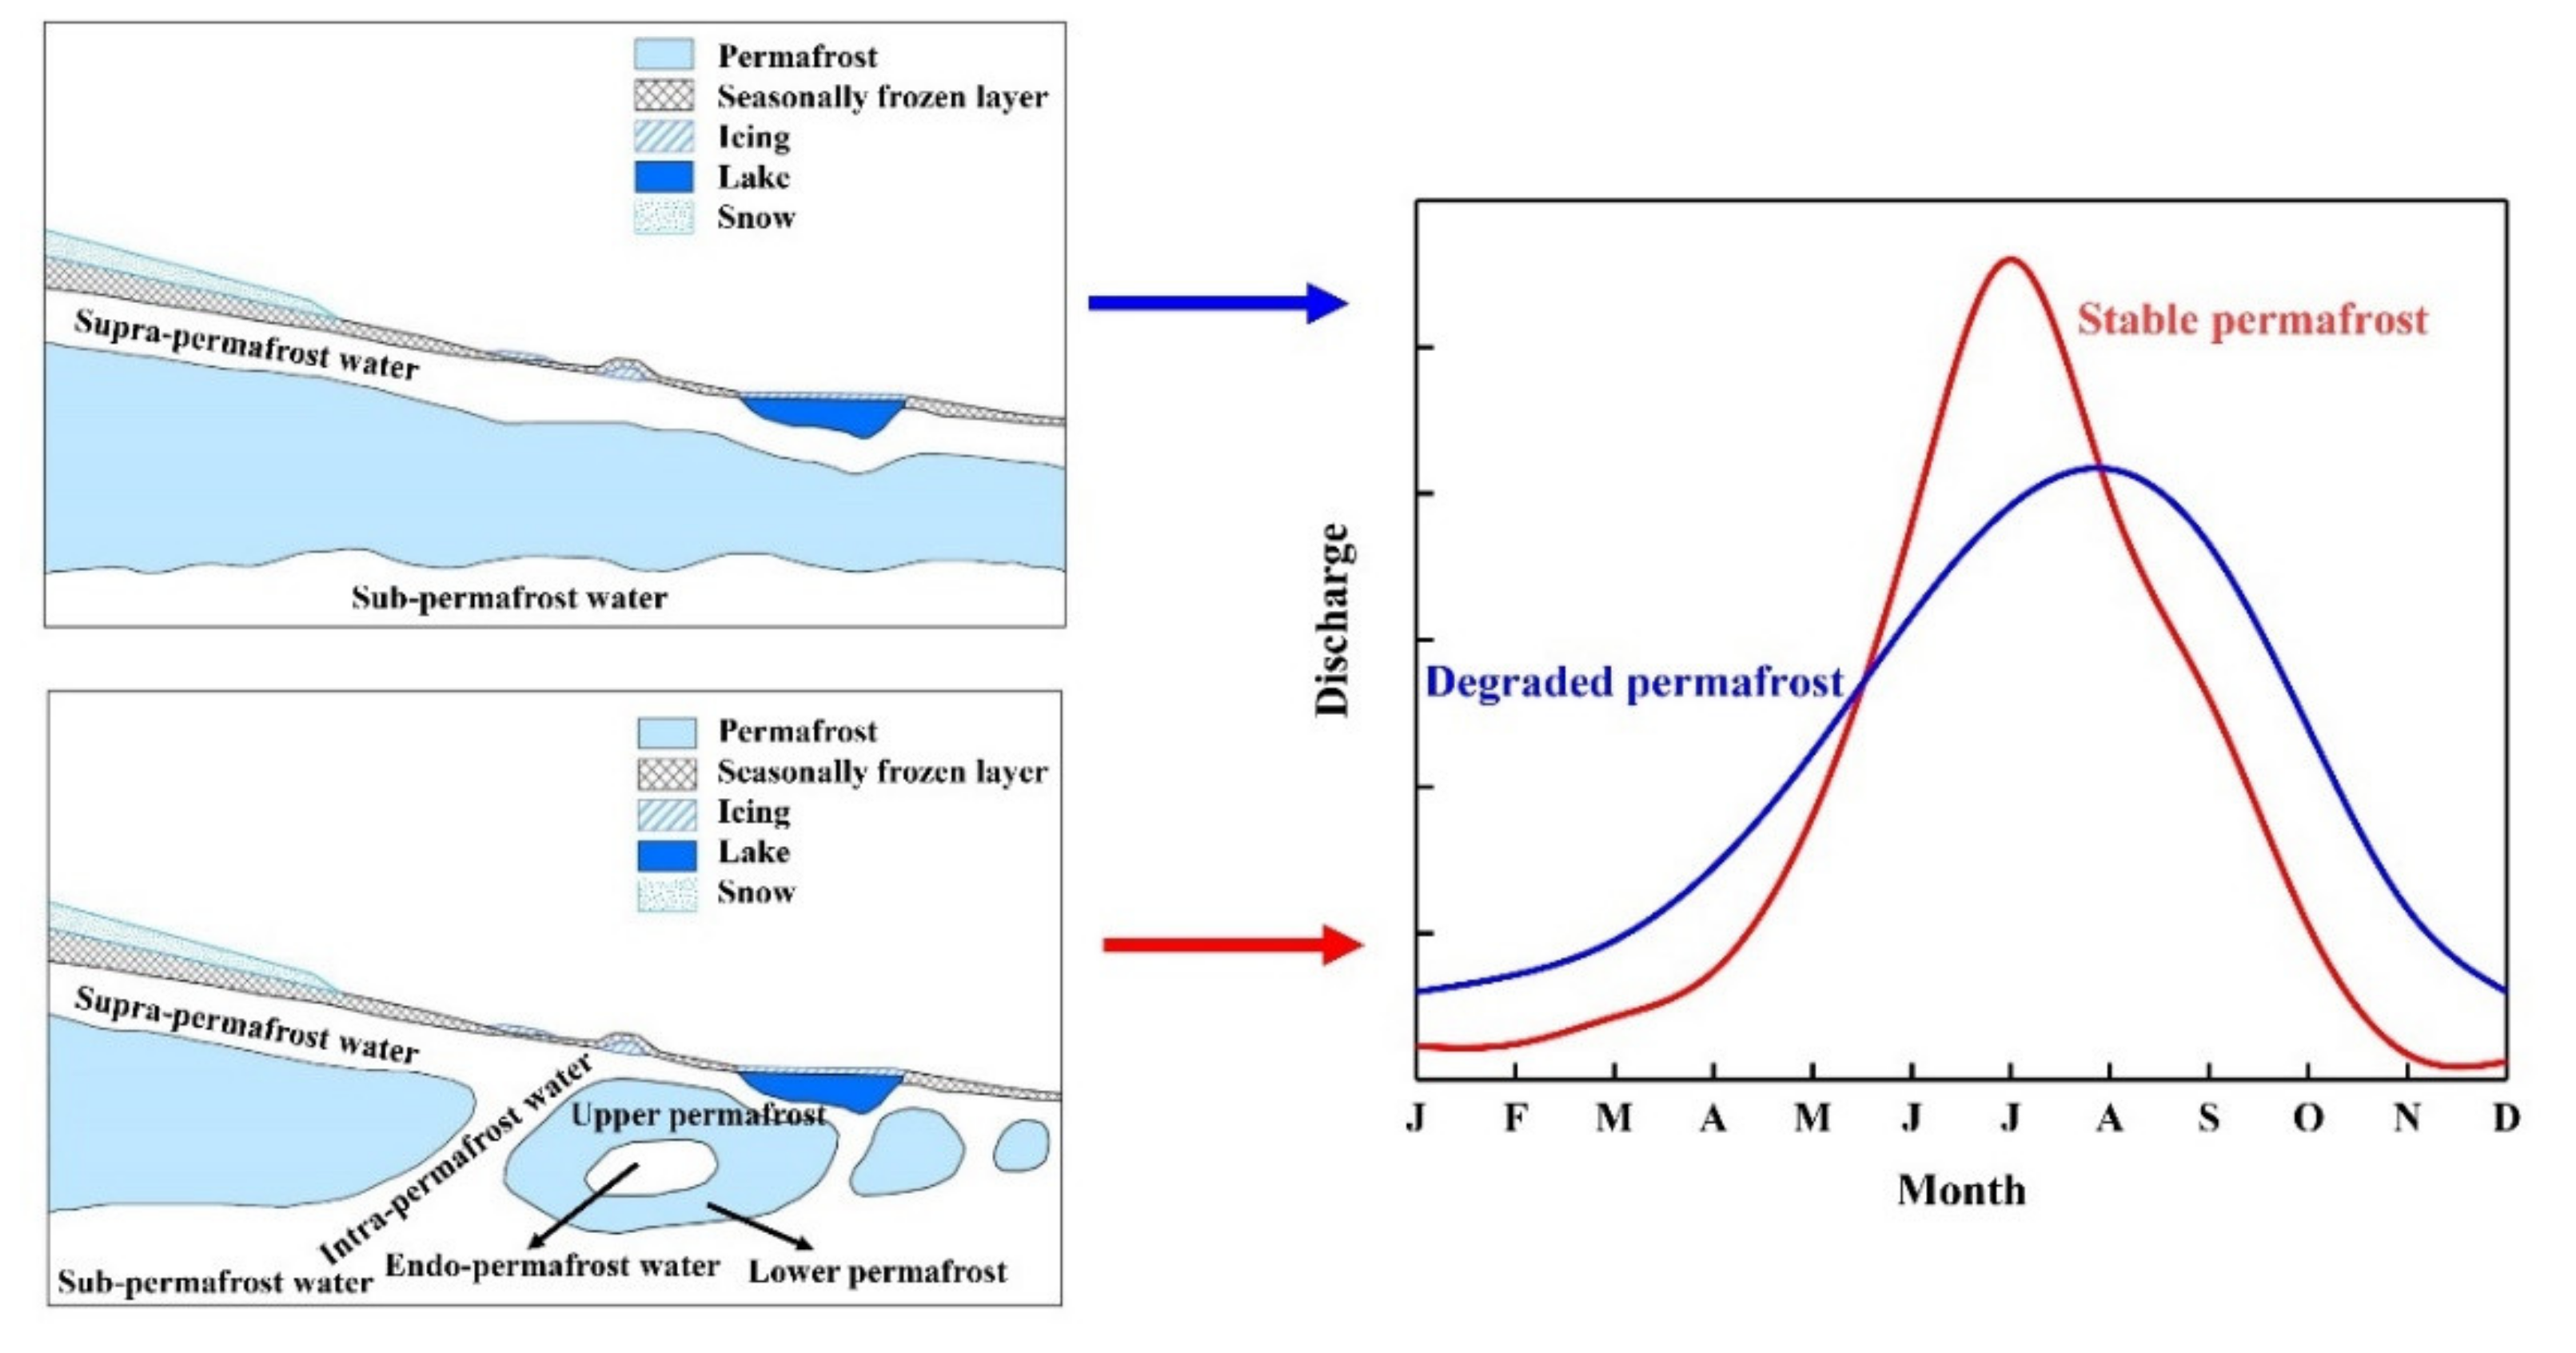
Table 1.
Types and standards of frozen-ground zone classification.
| Criteria | Type of Frozen Ground | ||||
|---|---|---|---|---|---|
| Climatic and ecological processes | Climate-driven | Climate-driven, ecosystem-modified | Climate-driven, ecosystem-protected | Ecosystem-driven or protected | Seasonal frost |
| Areal continuity | Continuous | Discontinuous | Sporadic | Isolated | |
| Permafrost extent | 90–100% | 50–90% | 10–50% | 0–10% | 0–10% |
Table 2.
Distribution variables by regions of boreholes and the ranges of changing rates of mean annual ground temperature (MAGT; °C/decade) (updated and compiled from [114,115,116]).
| Permafrost Region | Number of Boreholes | MAGT (°C) | MAGT Change (°C/decade) | Latitude (°N) | Elevation (m a.s.l.) |
|---|---|---|---|---|---|
| North America | |||||
| Alaska 1 | 185 | −12–0 | 0.07–0.80 | 56–72 | 1–1345 |
| N Canada 2 | 192 | −15–0 | 0.10–0.60 | 50–82.5 | 2–2286 |
| Europe 3 | 45 | −2.9–0.1 | 0.05–0.25 | 37–48 | 1580–3460 |
| Nordic 4 | 89 | −10–0 | 0.20–0.70 | 61–79 | 5–1894 |
| Russia 5 | 151 | −12–0 | 0.18–0.47 | 55–74 | 1–2100 |
| Asia 6 | 128 | −5.2–0.1 | 0.12–0.28 | 31–54 | 260–5100 |
| Antarctica 7 | 73 | −22.5–0 | 0.10–0.37 | 60°–78° S | 7–1800 |
Table 3.
Regional changes in groundwater storage in permafrost regions/watershed as revealed by GRACE or traditional methods (upward arrows indicate an increase trend).
Table 3.
Regional changes in groundwater storage in permafrost regions/watershed as revealed by GRACE or traditional methods (upward arrows indicate an increase trend).
| Region | Areal Extent (million km2) | Permafrost Extent (%) | Changes in Groundwater Storage (billion m3) | Evaluation Methods | Data Period | Major Causes | References |
|---|---|---|---|---|---|---|---|
| Arctic permafrost regions | |||||||
| Lena | 2.49 | 80 | 32 ± 10 | GRACE | 2002–2008 | Pf degrad., ↑ GWT in discont. pf zone | [142,145] |
| 44.69 ± 8.36 | 2002–2010 | [145] | |||||
| 26.6 ± 2.3 | 2002–2009 | ↑ Precip. | [146] | ||||
| 9.6 (0.6 mm a−1) | GRACE | 2002–2010 | ↑ ALT | [147] | |||
| Declined (−6 mm a−1) | GRACE | 2002–2015 | ↑ ET | [148] | |||
| Ob | 2.99 | 1 | 22.69 ± 8.49 | GRACE | 2002–2008 | Pf degrad. | [142,149] |
| >0 mm a−1 | 2019–2022 | ||||||
| Yenisei | 2.58 | 32 | 37.75 ± 8.83 | 2002–2008 | |||
| MacKenzie | 1.80 | 30 | −5.58 ± 7.18 | 2002–2008 | Talik formation | ||
| −6.8 ± 1.2 | 2002–2009 | Crop irrigation | [146] | ||||
| −3.26 mm a−1 | 2019–2022 | predicted | [149] | ||||
| Yukon | 0.85 | 45–46 | −5.1 ± 0.9 | 2002–2009 | Pf degrad., ponding, thermokarst | [146] | |
| Boreal permafrost regions | |||||||
| Amur | 1.6 (1.855) | −2.4 ± 2.3 | GRACE | 2002–2009 | Crop irrigation | [146] | |
| Songhua GWS | 0.54 | −1.04 ± 0.59 | GRACE | 1982–1994 | Changes in hydro-meteorol., extreme ET and precip. | [150] | |
| 3.91 ± 1.06 | 1982–1994 | [150] | |||||
| −5.51 ± 3.46 | 1982–1994 | [150] | |||||
| Elevational permafrost regions | |||||||
| SATRs | 0.302 | >85 | (9.06 ± 0.01), or (21.89 ± 0.02) × 109 m3 | Hydro-geodesy, sat/GRACE data, hydrol. models, GIA | 2003–2009 | [143,151] | |
| SAYzR | 0.1212–0.1585 | >90 | 1.86 ± 1.69 | 2003–2009 | ↑ Ice melt and precip. | [151,152,153] | |
| YzRB | 1.77–1.8085 | 7.7 ± 1.3 | 2003–2014 | Anthropogenic | [154] | ||
| YzRB | 1.831 | 1.82 mm a−1 | 2019–2022 | predicted | [149] | ||
| SAYR | 0.1209 | 34 | 1.14 ± 1.19 | 2003–2009 | ↑ Ice melt and precip. | [130,151] | |
| Cont. pf zone, QTP | 1.06 | 90–100 | 13.94 ± 0.48 | Past decades | [143,155] | ||
| Jinsha RB | 0.485 | 2.46 ± 2.24 | 2003–2009 | ↑ Precip. and meltwater | [151] | ||
| Qaidam B | 0.256 | 1.52 ± 0.95 2.24 ± 0.28 | GRACE GRACE | 2003–2012 2003–2012 | ↑ Precip. and evap. | [143,156] | |
| Interior Qiangtang | 0.70 | 1.66 ± 1.52 | Hydro-geodesy, sat. gravity and sat. altimetry data, hydrological models and model GIA | 2003–2009 | ↑ Precip. and meltwater | [151] | |
| Upper Hindu RB | 1.08 | 5.32 ± 2.17 | GRACE | [143] | |||
| Indus | 0.971 | −1.33 mm a−1 | GRACE-FO | 2019–2022 | Predicted | [149] | |
| Ganges | 1.032 | −10.59 mm a−1 | GRACE-FO | 2019–2022 | Predicted | [149] | |
| Aksu RB | 0.0514 | 2.77 ± 0.99 | GRACE | [143,157] | |||
| QTP Lakes | 0.024566 | 7.72 ± 0.63 | GRACE, Landsat MSS, ICESat, TOPEX/POSEIDON, ICESat/GLA14 | 2003–2009 | ↑ Precip. (74%), glacier-melt (13%) | [158] | |
| QTP GWS | 5.01 ± 1.59 | [158] | |||||
| Nu-Lancang RB | 0.795 | 1.77 ± 2.09 | GRACE | 2003–2014 | GW pumping and glacier melt | [154,158] | |
| QTP | 2.5 | 42.5 | 12.1 ± 0.6 5.01 ± 1.59 | GRACE | 2003–2014 2003–2009 | Glacier melt | [144,154,158,159] |
| Huang-Huai-Hai-Liao | 1477 | −10.2 ± 0.9 | GRACE | 2003–2014 | GW pumping | [154] | |
| Brahmaputra-Nu-Lancang RB | 0.712035 | −15.0 ± 1.1 | GRACE | 2003–2014 | Glacier melt | [154] | |
| Tianshan (Tien Shan) Mts. | 0.99 | 16–18 | −4.1 ± 0.3 | GRACE | 2003–2014 2003–2007 | Glacier melt | [87,121,154] |
Notes: ET stands for evapotranspiration; GW, groundwater; GWS, GW storage; QTP, Qinghai–Tibet Plateau; GRACE, Gravity Recovery and Climate Experiment, and; RB, river basin. ALT is the active layer thickness. SAYR stands for the Source Area of Yellow River; SATRs, Source Area of Three Rivers (Yangtze, Yellow, and Lancang/Mekong). SAYzR is the Source Area of Yangtze River; YzRB, Yangtze River Basin. The symbol ↑ stands for going up or increase.
Publisher’s Note: MDPI stays neutral with regard to jurisdictional claims in published maps and institutional affiliations. |
© 2022 by the authors. Licensee MDPI, Basel, Switzerland. This article is an open access article distributed under the terms and conditions of the Creative Commons Attribution (CC BY) license (https://creativecommons.org/licenses/by/4.0/).
Share and Cite
MDPI and ACS Style
Jin, H.; Huang, Y.; Bense, V.F.; Ma, Q.; Marchenko, S.S.; Shepelev, V.V.; Hu, Y.; Liang, S.; Spektor, V.V.; Jin, X.; et al. Permafrost Degradation and Its Hydrogeological Impacts. Water 2022, 14, 372. https://doi.org/10.3390/w14030372
AMA Style
Jin H, Huang Y, Bense VF, Ma Q, Marchenko SS, Shepelev VV, Hu Y, Liang S, Spektor VV, Jin X, et al. Permafrost Degradation and Its Hydrogeological Impacts. Water. 2022; 14(3):372. https://doi.org/10.3390/w14030372
Chicago/Turabian StyleJin, Huijun, Yadong Huang, Victor F. Bense, Qiang Ma, Sergey S. Marchenko, Viktor V. Shepelev, Yiru Hu, Sihai Liang, Valetin V. Spektor, Xiaoying Jin, and et al. 2022. "Permafrost Degradation and Its Hydrogeological Impacts" Water 14, no. 3: 372. https://doi.org/10.3390/w14030372
Note that from the first issue of 2016, this journal uses article numbers instead of page numbers. See further details here.