Article

Recharge and Geochemical Evolution of Groundwater in Fractured Basement Aquifers (NW India): Insights from Environmental Isotopes (δ18O, δ2H, and 3H) and Hydrogeochemical Studies

1
Department of Earth Sciences, Indian Institute of Technology Bombay, Powai 400076, India
2
Marine Geoscience Group, National Centre for Earth Science Studies, Thiruvananthapuram 695011, India
3
Hydrological Investigations Division, National Institute of Hydrology Roorkee, Roorkee 247667, India
4
Institute for Global Environmental Strategies, Kamiyamaguchi, Hayama 2108-11, Kanagawa, Japan
*
Authors to whom correspondence should be addressed.
Water 2022, 14(3), 315; https://doi.org/10.3390/w14030315
Submission received: 7 December 2021 / Revised: 15 January 2022 / Accepted: 18 January 2022 / Published: 21 January 2022

Abstract

:
Considering water as a limiting factor for socio-economic development, especially in arid/semi-arid regions, both scientific communities and policymakers are interested in groundwater recharge-related data. India is fast moving toward a crisis of groundwater due to intense abstraction and contamination. There is a lack of understanding regarding the occurrence, movement, and behaviors of groundwater in a fractured basement terrane. Therefore, integrated environmental isotopes (δ18O, δ2H, and 3H) and hydrogeochemical studies have been used to understand the recharge processes and geochemical evolution of groundwater in the fractured basement terranes of Gujarat, NW India. Our results show that the relative abundance of major cations and anions in the study basin are Ca2+ > Na+ > Mg2+ > K+ and HCO3 > Cl > SO42− > NO3, respectively. This suggests that the chemical weathering of silicate minerals influences the groundwater chemistry in the aquifer system. A change in hydrochemical facies from Ca-HCO3 to Na-Mg-Ca-Cl. HCO3 has been identified from the recharge to discharge areas. Along the groundwater flow direction, the presence of chemical constituents with different concentrations demonstrates that the various geochemical mechanisms are responsible for this geochemical evolution. Furthermore, the chemical composition of groundwater also reflects that the groundwater has interacted with distinct rock types (granites/granulites). The stable isotopes (δ18O and δ2H) of groundwater reveal that the local precipitation is the main source of recharge. However, the groundwater recharge is affected by the evaporation process due to different geological conditions irrespective of topographical differences in the study area. The tritium (3H) content of groundwater suggests that the aquifer is mainly recharged by modern rainfall events. Thus, in semi-arid regions, the geology, weathering, and geologic structures have a significant role in bringing chemical changes in groundwater and smoothening the recharge process. The findings of this study will prove vital for the decision-makers or policymakers to take appropriate measures to design water budgets as well as water management plans more sustainably.

1. Introduction

Globally, groundwater resources serve one-third of freshwater supplies, accounting for nearly 36% for domestic purposes, 42% for agricultural use, and 27% for industrial activities [1]. About 70% of the land area in India is underlain by crystalline basement rocks and approximately 30% of them are merely covered with Precambrian basement or hard rocks [2]. In the last few decades, the demand for groundwater and overexploitation of groundwater resources has significantly amplified, particularly in semi-arid and arid areas due to an increase in population, urbanization, and growth of the worldwide economy.
In semi-arid environments, understanding the groundwater evolution, flow path, and recharge processes mechanisms are very much needed for the optimal usage of groundwater resources [3,4]. Furthermore, groundwater resources in basement hard rock terranes are often restricted to the top weathered fractured zones that usually spread up to 50 m depth, and below that, groundwater movement is mainly controlled by deeply fractured zones [2,5,6,7,8]. In these terranes, the geochemical properties of groundwater are essentially a function of the mineral composition of the rock through which it flows [9,10]. In addition, the concentration of chemical species varies along its flow path [9,11,12,13,14], and several hydrogeochemical processes impact groundwater geochemistry viz. topography, precipitation intensity, water–rock interaction, mixing, dissolution, ion exchange, and oxidation–reduction process [15,16,17]. These processes are mainly depending on the physicochemical and biological properties of bedrocks with climatic conditions. Furthermore, hydrogeochemical properties are also used as a proxy for determining the recharge areas and sources [18]. Additionally, physical methods are also used to assess the recharge process. However, the interpretation remains equivocal due to variation in weathered fractured zones as well as seasonal variability of rainfall and groundwater level [19]. Hence, integrating the hydrogeochemical datasets with stable isotopes (δ18O and δ2H) and radiogenic isotopes (hydrogen-3, i.e., 3H) can aid significantly in tracing the hydrogeochemical processes and in identifying the recharge environments of groundwater systems [20].
Generally, the stable isotopic compositions are preserved in the groundwater body until it mixed with other water with altered stable isotopic signatures [21,22]. Several studies have used stable isotopes in tracing the sources of groundwater around the world viz. groundwater–surface water interaction studies [23,24], groundwater recharge assessment along different flow paths [22,25,26,27], isotope tracing of paleo groundwater [28], and evaporation effects on groundwater resources [27,29]. Among the other environmental isotopes, tritium (3H) is a unique isotope used in hydrogeological studies to understand the flow direction and groundwater age, and it has been applied in several regions (Northern China [30], South Florida [31], California Basin [32], Banana Plain [14], Punjab state [33]).
Identifying the recharge processes in semi-arid regions has gained substantial attention in recent years. However, most of the work focused mainly on sedimentary or alluvial terranes and less on crystalline fractured rock terranes with varied climatic zones [4,34,35,36,37]. Especially in NW India, no such research has been carried out, although the communities are heavily dependent on groundwater resources for domestic and agricultural activities.
Therefore, the present study is aimed at understanding the complex fractured basement aquifers using hydrogeochemical, stable isotopes (δ18O and δ2H), as well as radiogenic isotopes (3H). The specific goal is to identify the geochemical evolution and groundwater recharge processes that occurred within the fractured crystalline basement aquifers of Ambaji basin (Gujarat), NW India. The outcome of the work will lead to better groundwater management and practices for sustainable water use especially in fractured basement terrane.

2. Description of the Study Area

2.1. General Characteristics

The study area (Ambaji basin) lies in the northern end part of the Banaskantha district (North Gujarat), NW India. The area is bounded by latitude 24°10′–24°22′ N and longitude 72°30′–72°50′ E (Figure 1). The areal extent is ≈450 km2 and is divided into two Talukas (Amirgarh and Danta taluka). The area is mostly dominated by hilly terrane and a smaller portion of the low-lying flat terrane. The altitude varies from 250 to 650 m a.m.s.l. The area comes under a semi-arid climatic type and is characterized by extreme temperature in the summer months (May–July), erratic rainfall, and high evapotranspiration rates [10,38]. The average annual rainfall is ≈771 mm and is typically received through the southwest monsoon, and the temperature varies between 15 and 42 °C in this area.

2.2. Geological and Geomorphological Settings

Geologically, the Ambaji basin belongs to the South Delhi Terrane (SDT) of Aravalli-Delhi Mobile Belt (ADMB), NW India (Figure 1). The ADMB comprises several geological terranes including SDT (Figure 1 inset) [39]. Furthermore, several granitic intrusions have occurred in the ADMB i.e., the Berach, the Jasrapur, the Sendra, the Ambaji (study area), the mount Abu Granite, and the Erinpura granites. The different geological units in the study area were demarcated through extensive fieldwork and the existing geological map of the Geological Survey of India. As the study basin comes under the Meso-proterozoic age of SDT, the rocks present in this terrane were mainly of pelitic-, calcareous-, and basic granulites, where three phases of granite intruded namely G1 (gneissic), G2 (medium to coarse-grained, highly fractured), and G3 granites (fine-grained or micro-granite) [38,39]. Figure 1 shows that G2 granite is mostly dominated in this area, which is followed by basic granulite, alluviums, G1 granite, and G3 granites. Furthermore, the G2 granite is highly weathered in different regions. The area is predominantly comprised of different erosional and depositional hydrogeomorphic units viz. structural hills, denudational hills, residual hills, shallow to deep buried pediments, and valley fills. The eastern part mainly consists of hilly terranes with highly undulating surfaces, whereas the southwestern end areas are of gently undulating surfaces. The upper part of the basin mainly consists of structural hills, whereas the lower part of the basin is covered with alluviums [38].

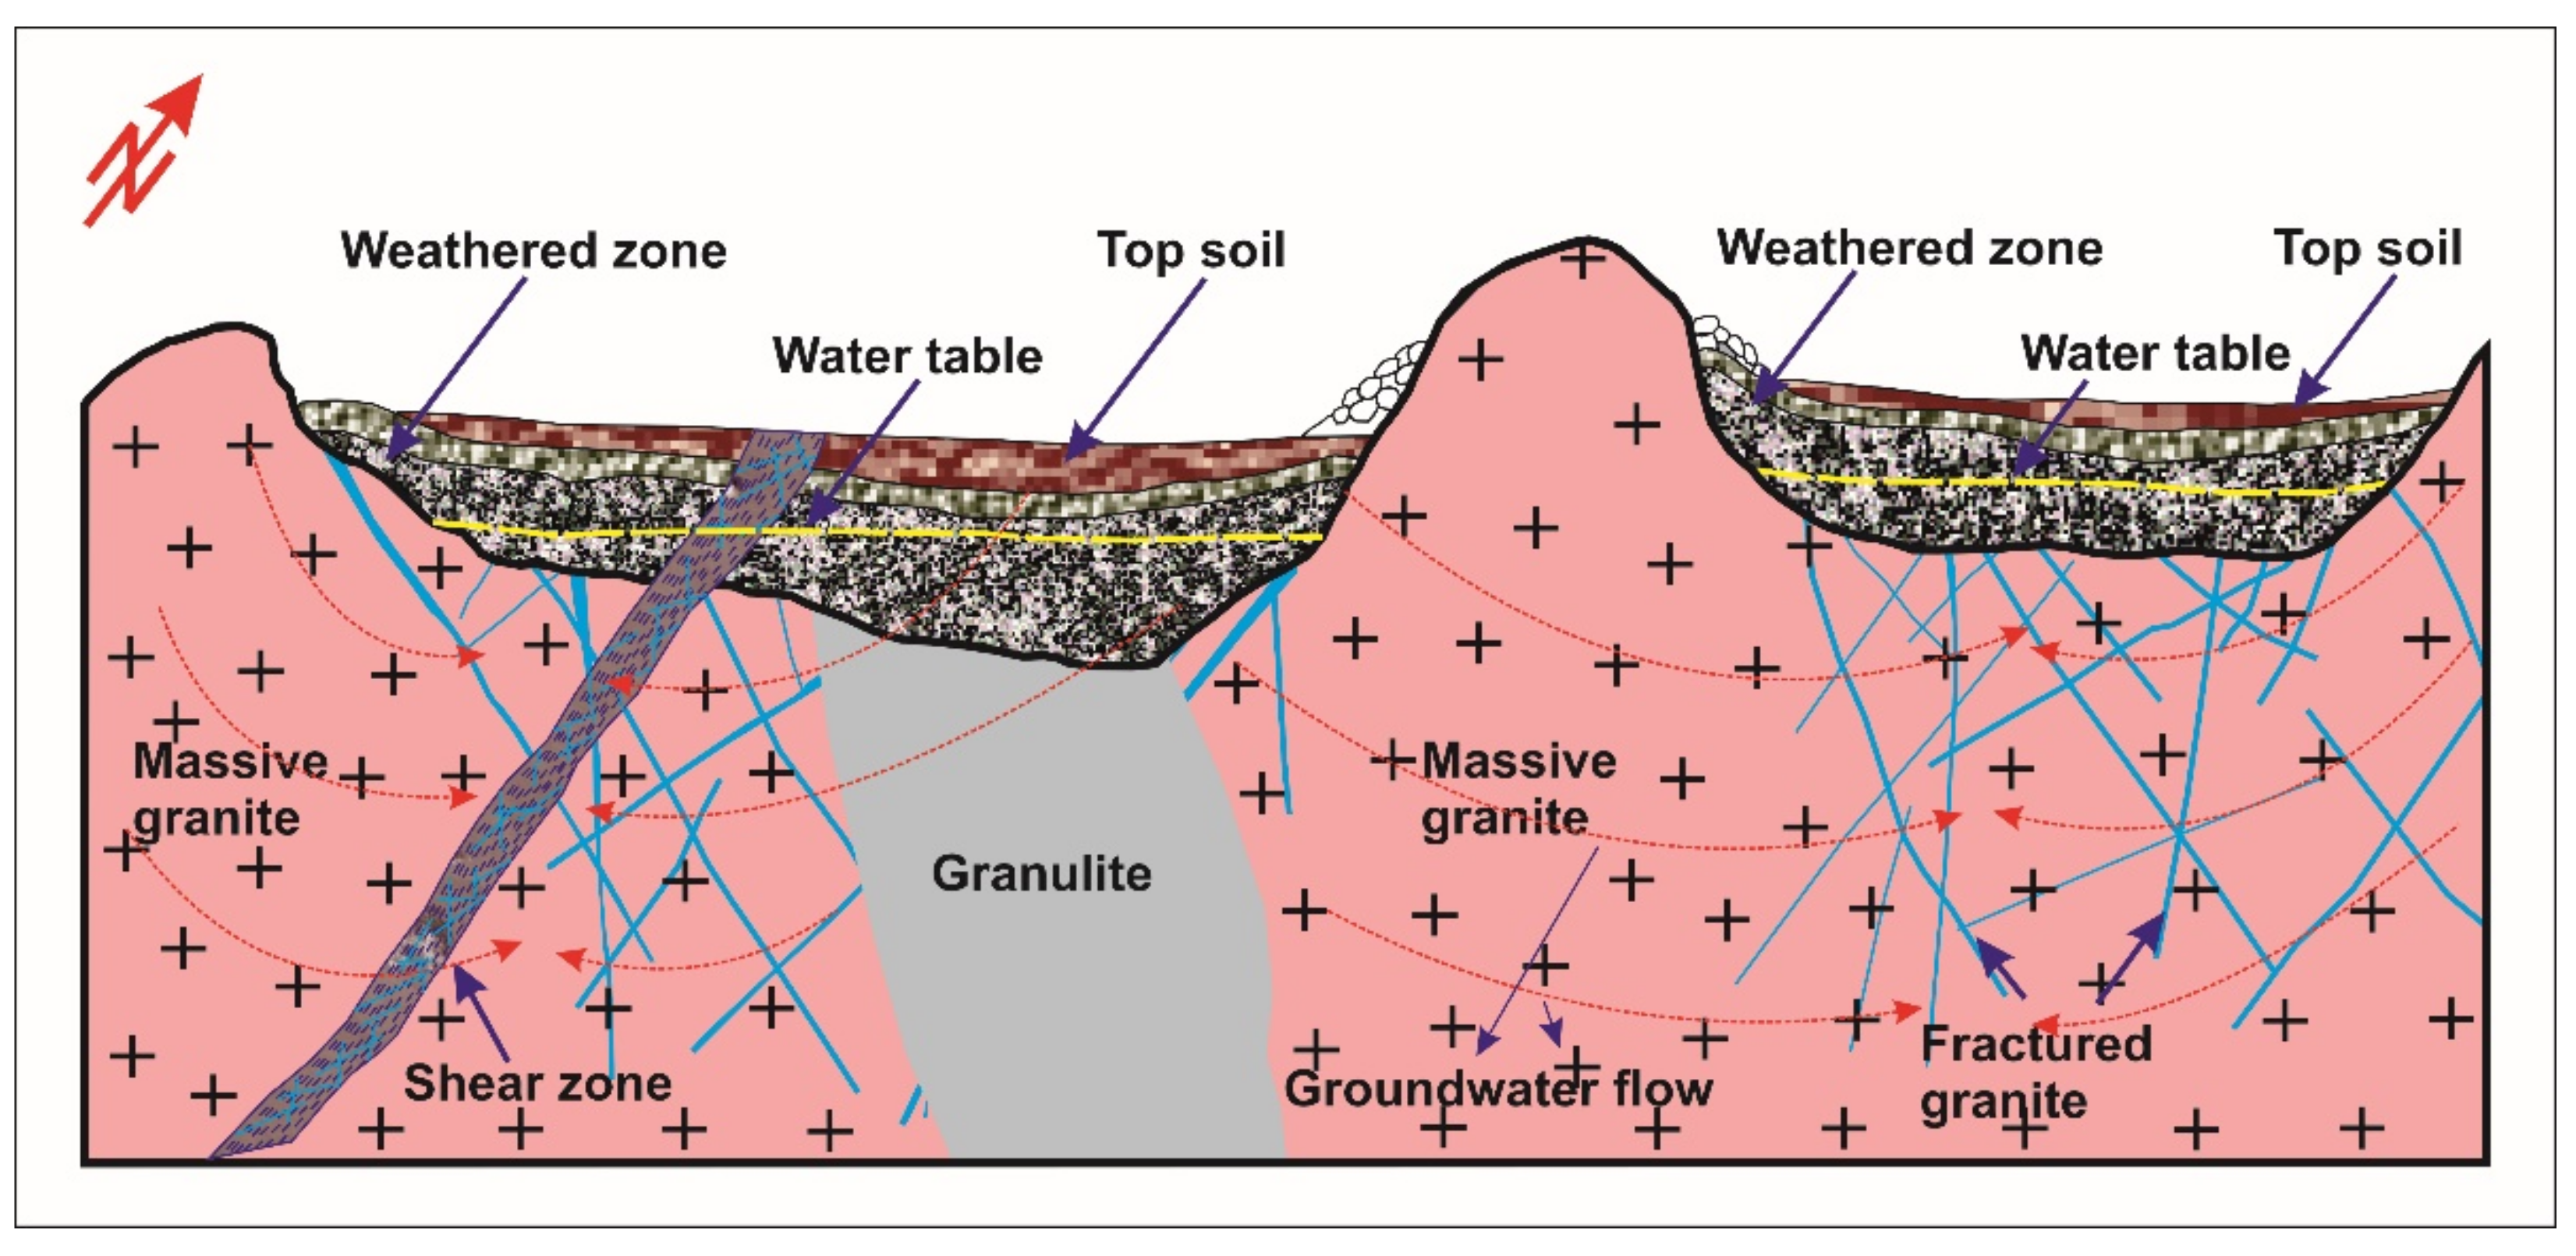
2.3. Structural and Hydrogeological Scenarios

The basin has witnessed several faults, fractures, and shear zones. The fractures mostly show three sets of orientations i.e., NE-SW, NNW-SSE, and NW-SE (Figure 1). The study area comprises several criss-crossed fractures in the northern part and northwestern part due to transtensional settings and is characterized by both extensional and compressional structures [38]. These transtensional settings lead to multiple phases of deformation, which caused several criss-crossed fractures or lineaments. The major percentage of the study basin is covered by crystalline basement rocks. Due to the absence of primary porosity, secondary porosity such as fractures, faults, and shear zones serve as the main source of groundwater resources. Furthermore, groundwater resources in the shallow part were mostly covered with weathered zones/topsoil, while the deeper part mostly consists of fault and fracture zones and shear zones followed by massive rocks. The groundwater water levels in this area range from 2.5 to 49 m below ground level (b.g.l.) in the pre-monsoon (May 2017) and 0.65–47.0 m b.g.l in the post-monsoon (December 2017). The regional groundwater flows from the northeast to southwest direction and is primarily influenced by the secondary porosities (faults/fractures/joints) and surface topography. The area has largely three types for hydrogeological formations: (1) the top weathered zones range from 1 to 30 m, (2) the fault and fractured zones comprised of granite range from 20 to 150 m b.g.l., and (3) massive granites (Figure 2). The area belongs to a semi-arid climate, and the rivers flowing through it are mostly ephemeral and the major drainage network is constituted by the Banas River flowing in the NE–SW direction and its tributaries i.e., Balaram River and Teliya Nadi.

3. Materials and Methods

3.1. Groundwater Sampling and Geochemical Analysis

A total of forty (n = 40) groundwater samples were collected for this study for stable isotopes (oxygen and hydrogen), radiogenic isotope (tritium), and major cations–anions analyses during December 2017 (post-monsoon) from different tube wells, dug wells, and bore wells with variable depths (<30 m) (Figure 1). Pre-cleaned high-density polyethylene (HDPE) bottles (500 mL) were used to collect the groundwater samples. Water was pumped out for 10–15 min before the sampling. For stable isotopes (δ18O and δ2H) analyses, the water samples were collected in 10 mL HDPE bottles, and for radiogenic isotopes (3H), water samples are collected in 1 L HDPE bottles and sealed tightly. The groundwater samples collected for major cations and anions were filtered using 0.45 µm Millipore filter paper in the field. In situ parameters such as pH, electrical conductivity (EC), temperature (°C), and total dissolved solids (TDS) were measured in the field through HANNA USA-made (Model: HI98130) portable meter. Bicarbonate (HCO3) of groundwater samples was measured in the field by the titration method. The collected samples were preserved in a cool place after sampling and then transferred to a refrigerator for preservation until the geochemical analysis. The major cations such as Ca2+, Mg2+, Na+, and K+ and anions Cl-, SO42−, and NO3 of groundwater samples were measured through a UV visible spectrophotometer at IIT Bombay and ion chromatography (Metrohm 883 Basic IC Plus) at the SEOCS, IIT Bhubaneswar with appropriate standards.

3.2. Stable Isotope Data (δ18O and δ2H) Analysis

The refrigerated water samples collected for stable isotopes (δ18O and δ2H) were analyzed at the Nuclear Hydrology Laboratory, NIH Roorkee. For measuring δ2H, a dual inlet stable isotope-ratio mass spectrometer (DISIRMS) was used, and a continuous-flow stable isotope-ratio mass spectrometer (CFSIRMS) was used to quantify the δ18O. The water samples were equilibrated with CO2 and H2 to quantity δ18O and δ2H values respectively using the standard method [40]. Then, the instrument was calibrated to determine the δ18O and δ2H composition by analyzing IAEA standards i.e., Vienna standard mean ocean water (VSMOW) [41] with precision range ±1.0‰ for δ2H and ±0.1‰ for δ18O. The results of the isotopes are expressed in terms of per mil (‰) relative to VSMOW using the ‘δ’ notation and Equation (1).
δ = R sample R standard R standard × 1000
Here, Rsample is the ratio of 18O/16O and 2H/H isotopes for the collected groundwater sample, and Rreference is the ratio of 18O/16O and 2H/H isotopes for the standard water sample. The reference standard is usually considered IAEA VSMOW, and the measurement precision is ±0.1‰ and ±1‰ for δ18O and δ2H, respectively. The isotope data reported in this paper correspond to VSMOW.

3.3. Radiogenic Tritium (3H) Analysis

A total of twenty-two identical groundwater samples were collected for tritium (3H) analysis. Usually, one liter of sample is enough for radiogenic 3H analysis. The water samples were collected in unfiltered condition, and no preservatives were added. The samples were stored in HDPE bottles with air-tight caps. The samples were analyzed at the Nuclear Hydrology Laboratory, NIH Roorkee. For tritium analysis, three steps were followed: (a) sample distillation, (b) fractionation by electrolytic enrichment (for removing 1H and 2H), and (c) measurement of tritium on Ultra Low-Level Liquid Scintillation spectrometry. The WinQ and QuickStart software on the QUANTULUS system was used to process the data. The measured tritium concentrations are stated in tritium units (TU), and the error varies between ±0.12 and ±0.24 TU.

4. Results and Discussion

4.1. Hydrogeochemical Studies

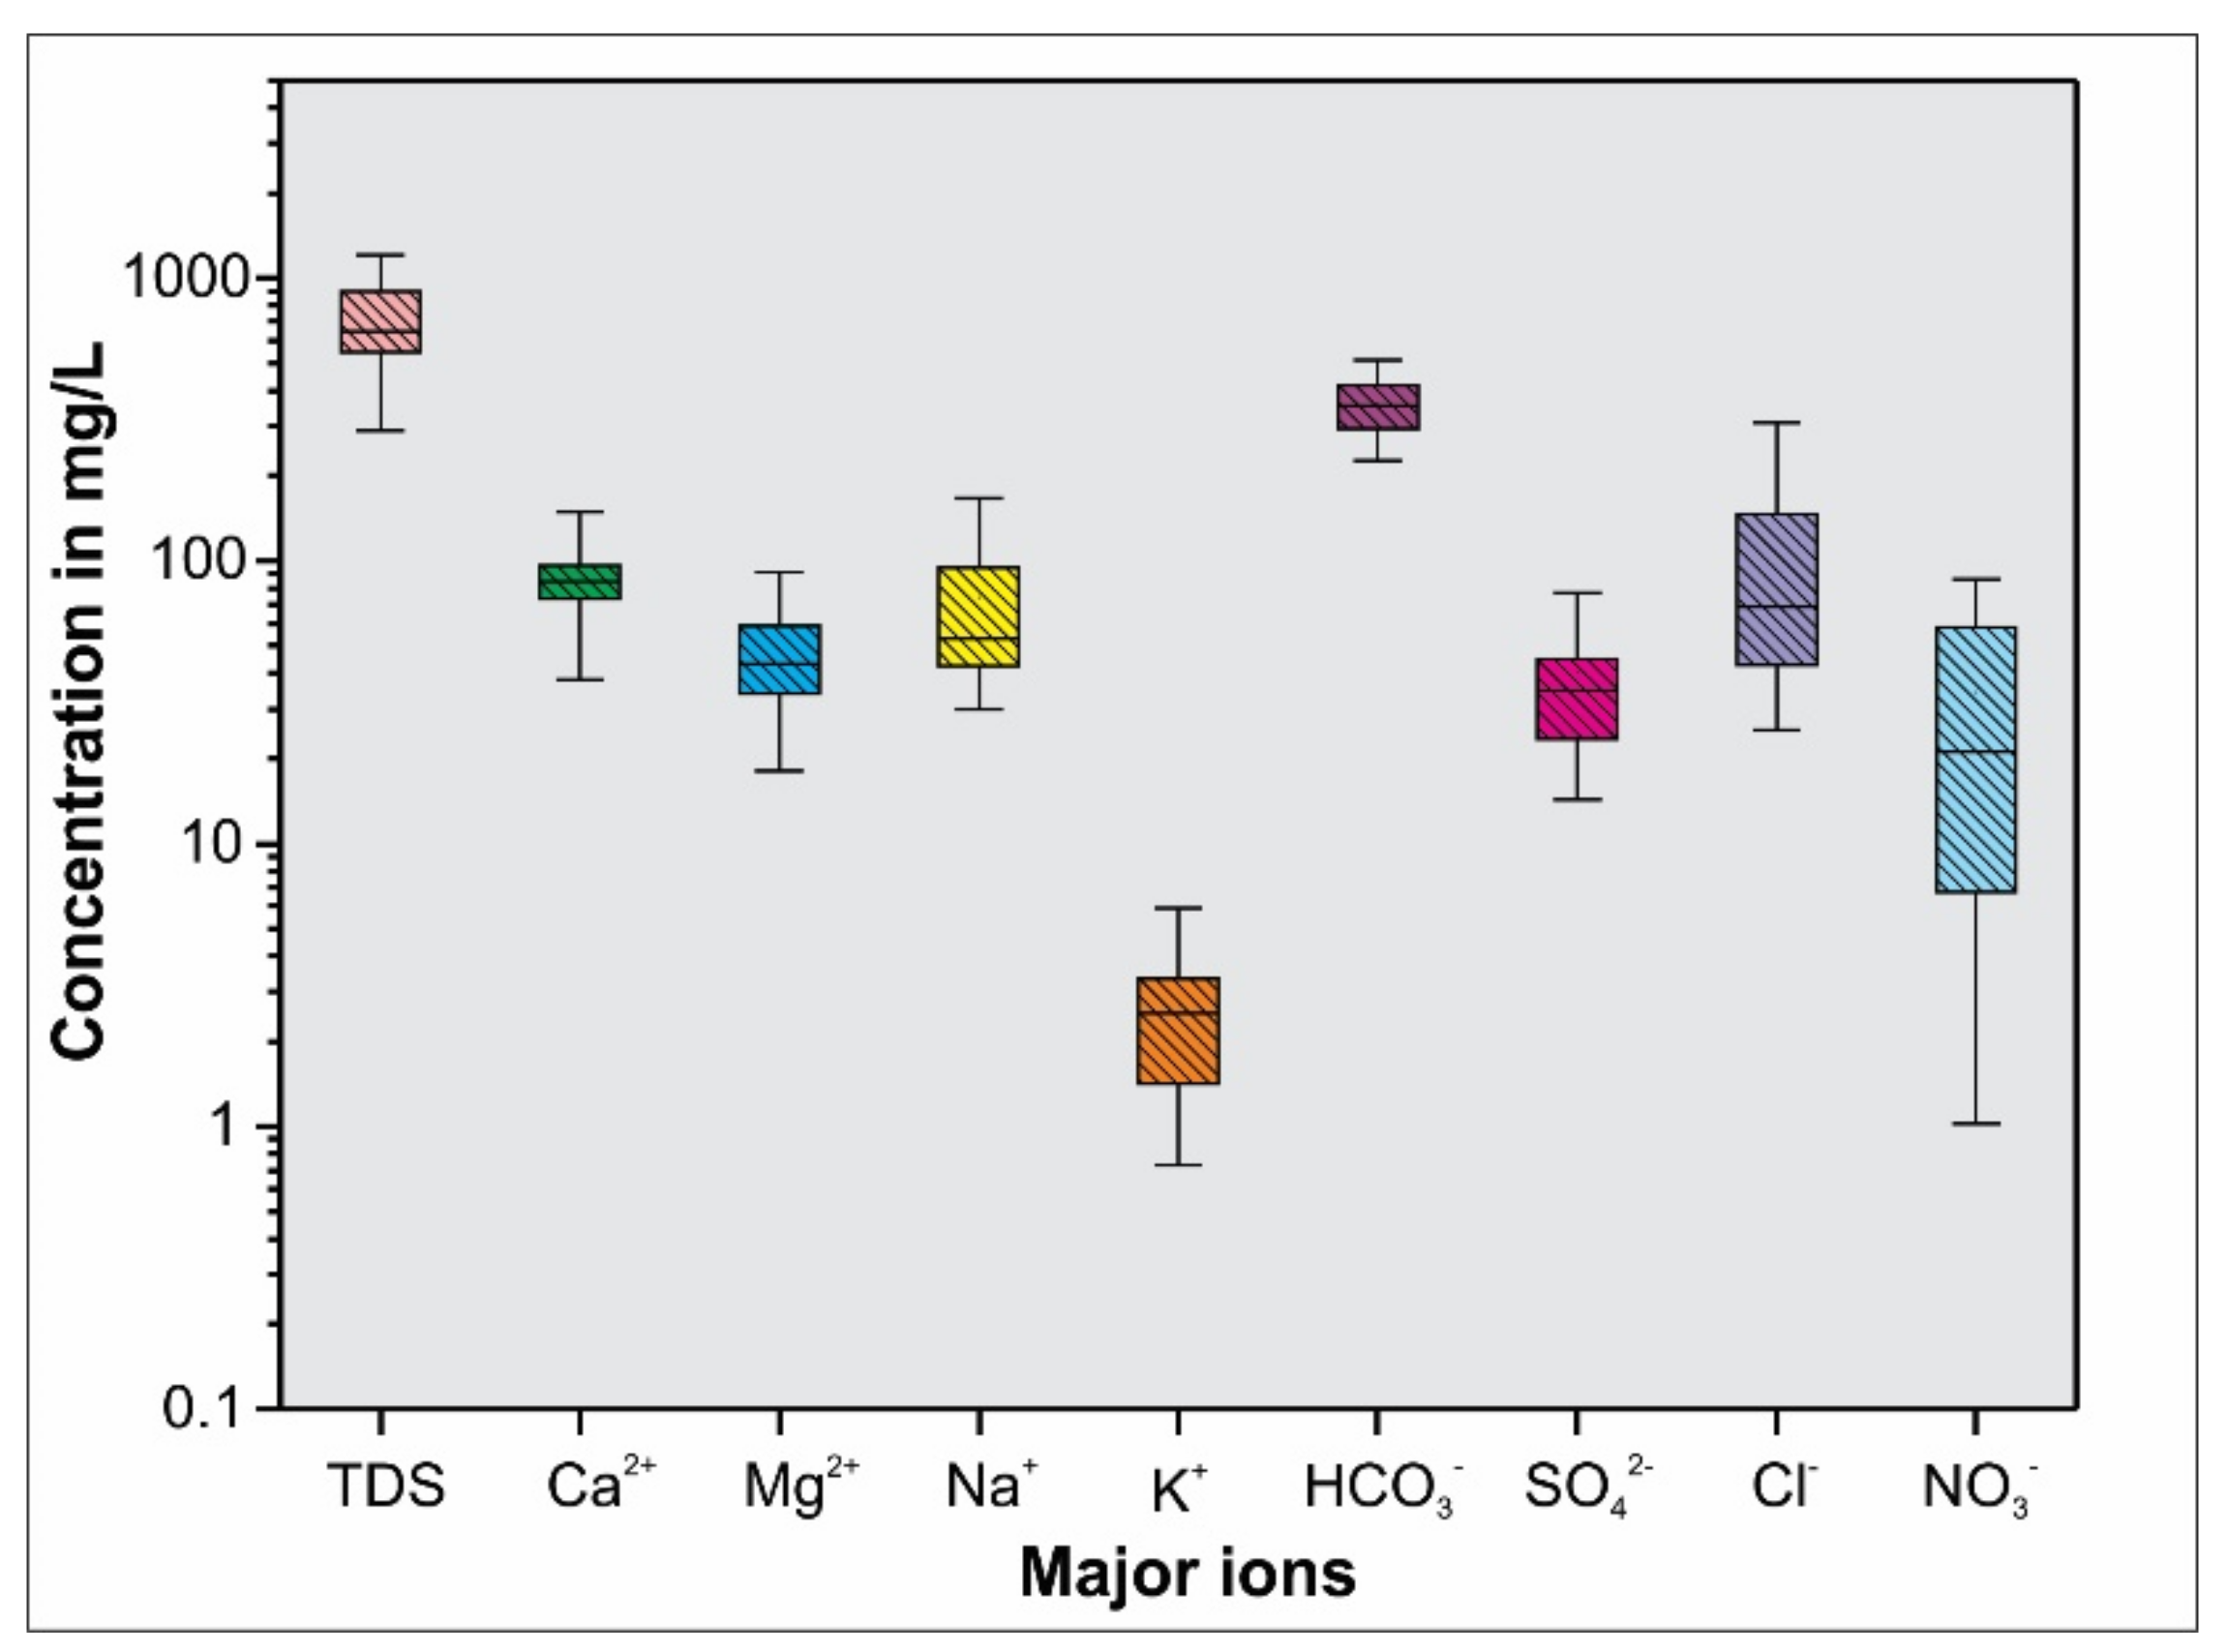
4.1.1. General Hydrogeochemistry

The physicochemical parameters and statistical data of the groundwater samples used in this study have been provided in Table 1. Detailed information about the water chemistry data is provided in Supplementary Table S1. The pH range of groundwater varies from 6.60 to 7.38 with an average value of 6.97, indicating that the groundwater is slightly acidic, which may be due to the mixture of carbonic acid in the water of the aquifer system. The electrical conductivity (EC) ranges between 360 and 2980 µS/cm, whereas the TDS varies from 216 to 1788 mg/L. The respective average value of EC and TDS is 1231.50µS/cm and 738 mg/L, which suggests that most of the groundwater samples can be used for drinking water purposes, as it follows the WHO guidelines. However, few groundwater samples (Table S1) with high NO3 (>45 mg/L, WHO) are not suitable for drinking purposes. The order of relative abundance of the major cations are Ca2+ > Na+ > Mg2+ > K+ and anions HCO3 > Cl > SO42− > NO3 (Figure 3).
Bicarbonates (HCO3) represent the alkalinity that ranges from 125 to 535 mg/L with an average of 359.25 mg/L. Such a high concentration of bicarbonates in groundwater is observed due to the chemical weathering of carbonate minerals and calcite dissolution [42,43]. Similarly, chloride (Cl) with an average concentration of 105.01 mg/L indicates that there is an interaction between freshwater from the recharge area and highly dissolved water from the discharge area [44,45,46]. Apart from the chloride (Cl) content, a high concentration of nitrate (NO3) (>45 mg/L) [47] is also observed in 30% of the groundwater samples due to agricultural activities and semi-arid climatic conditions. However, the sulfate (SO42−) concentration is between 12.29 and 195.94 mg/L with an average of 40.61 mg/L, indicating that the various sources such as pesticides used for agricultural productivity, evaporate dissolution, and domestic sewages are responsible for the high concentration of sulfate [48,49]. Calcium (Ca2+) is the most abundant ion; it ranges from 21.92 to 183.60 mg/L (average 87.04 mg/L), and it is derived from calc-silicate minerals due to chemical weathering and the dissolution of calcium carbonate minerals [50]. Sodium (Na+) is the second most abundant cation, which varies from 28.70 to 260.15 mg/L. This illustrates that the source of sodium (Na+) in groundwater is mostly plagioclase feldspar, which is the common silicate mineral of granite [9,11] as covered in most of the study regions. The magnesium concentration ranges from 11.94 to 111.28 mg/L with an average of 48.97 mg/L, which indicates that the groundwater has significantly interacted with granulites as it consists of Mg-calcite, biotite, and amphibole minerals [51]. Potassium (K+) is the lowest; it is the most abundant in the groundwater samples ranging from 0.50 to 7.27 mg/L (average 2.69 mg/L), which leached out from the clay-bearing minerals being produced by the chemical weathering of silicate minerals [52].

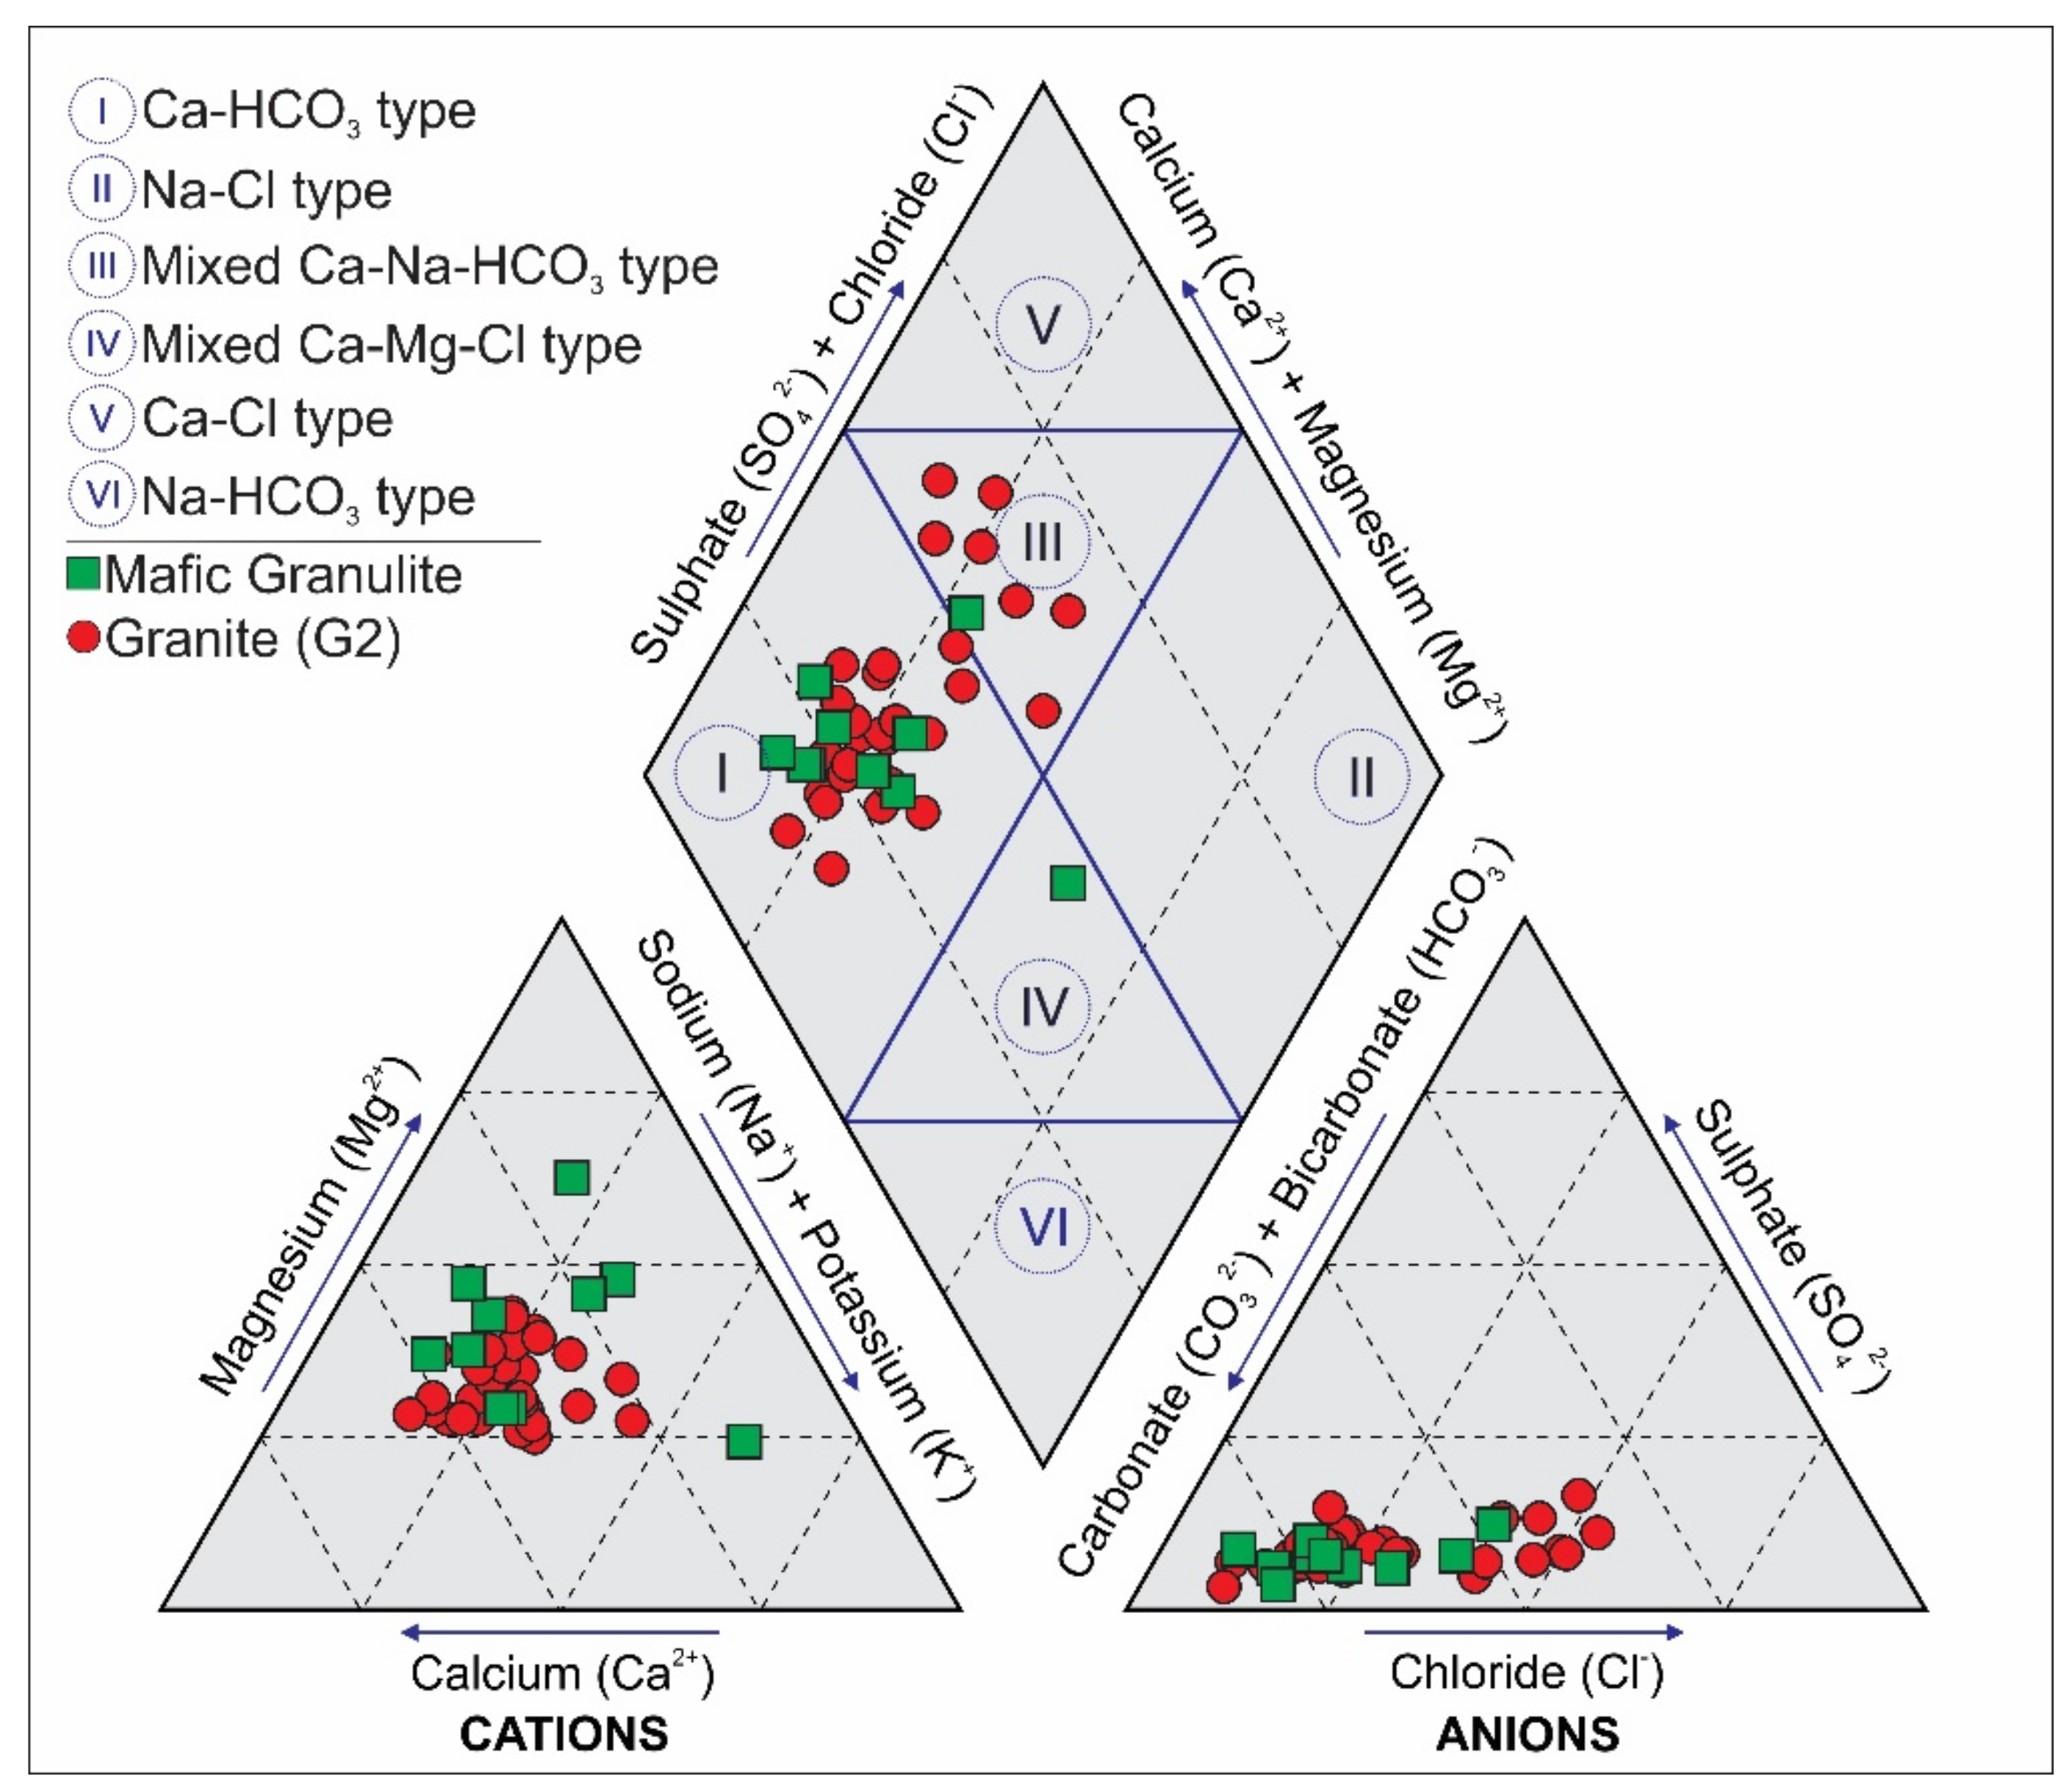
4.1.2. Hydrochemical Facies Variation

A piper trilinear plot is very useful in analyzing and understanding the geochemical evolution and chemical relations of groundwater. This plot is further used to assess the recharge flow paths by plotting the concentrations of major cations and anions [53]. The plot (Figure 4) shows that the groundwater samples are categorized by major water types such as (I) Ca-HCO3, (II) Na-Cl, (III) Mixed Ca-Na-HCO3, (IV) Mixed Ca-Mg-Cl, (V) Ca-Cl, and (VI) Na-HCO3. Most of the samples are collected from granite (G2) and Mafic granulite of the shallow aquifer (depth < 50 m) except for four (04) samples (TW-27, TW-28, TW-29, and TW-30), which are collected from alluvial/sandy zones, as shown in Figure 1. Around 77% of the total groundwater samples show Ca-HCO3 type, out of which 36% samples are derived from the recharge area, which is supposed to be recharged only by rainfall [2,11]. Furthermore, the low groundwater salinity with the Ca-HCO3 dominated type of water indicates the rapid recharge of groundwater [18]. This infers that the samples (TW-13, TW-18, TW-38, TW-41) with a TDS value <500 mg/L collected from the recharge area of granite aquifer (Figure 1) are in fresh condition, which is due to the early stage of the rainfall recharge process. However, TW-1 and TW-2 (TDS > 500 mg/L) and TW-43 (TDS > 1000 mg/L) are located in the same recharge region, suggesting that the infiltration through fractures leads to the dilution of groundwater with existing groundwater and subsequently increases the TDS value along its flow direction [54]. Furthermore, the hydrochemical facies shift from Ca-HCO3 to Ca-Na-HCO3 due to the release of sodium ions from clay minerals, which are formed due to the chemical weathering of silicate minerals. Thus, ion exchange plays a significant role in this geochemical evolution during the initial stage of groundwater flow and is expressed in Equations (2) and (3).
2 N a A l S i 3 O 8 + 2 H + + 9 H 2 O A l 2 S i 2 O 5 O H 4 + 2 N a + + 4 H 4 S i O 4
C a A l 2 S i 2 O 8 + 2 H + + H 2 O A l 2 S i 2 O 5 O H 4 + C a 2 +
The samples (TW-3 to TW-6) collected from the granulite shallow aquifer are showing TDS > 500 mg/L, which illustrates that there is a prolonged groundwater interaction with the aquifer matrix [2,11]. The incongruent dissolution of ferromagnesian minerals, hornblende, and pyroxene minerals from mafic granulite rock is attributed to the Mg(Ca)-Na-HCO3 hydrochemical facies in these samples. The presence of Mg2+ in groundwater is driven by the leaching of pyroxene from the granulite by Equation (4).
M g 0.7 C a A l 0.3 A l 0.3 S i 1.7 O 6 + 3.4 H + + 1.1 H 2 O 0.3 A l 2 S i 2 O 5 ( O H ) 4 + C a 2 + + 0.7 M g 2 + + 1.1 H 4 S i O 4
The rest of the groundwater samples have been categorized under type III water i.e., Mixed Ca-Na-HCO3, which are mostly from the granitic body. The hydrochemical facies shown by these samples is Ca-Mg-Na-HCO3. This is due to the groundwater chemistry driven by the weathering of ferromagnesian silicate minerals, as there must be an interaction with granulite rock during its flow. In addition, the samples collected from a low topography area or discharge area with a TDS value >1000 mg/L show the mixed-type of water facies viz. Ca-Na (Mg)-HCO3(Cl), Ca-Mg (Na)-HCO3, Na-Mg-Ca-Cl HCO3, etc. The presence of a high concentration of chloride (Cl) in groundwater implies the sluggish movement of groundwater with minimal flushing capacity of the aquifer [11].

4.1.3. Mechanisms Controlling the Groundwater Chemistry

Gibb’s plot of groundwater samples in the Ambaji Basin is plotted in Figure 5. The plot shows that most of the groundwater is confined in the rock dominance area. Around 95% of the groundwater samples show ratios of Na+/(Na+ + Ca2+) and Cl/(Cl + HCO3) that are less than 0.5 with a TDS value level <1000 mg/L. This suggests that the groundwater significantly interacted with fractured granite or mafic granulite during its movement. Chemical weathering is the controlling factor for releasing Ca into the groundwater, as calcium silicate and ferromagnesian minerals are the major constituents in these rock types [52,55]. Very few numbers (around 5%) of samples show the ionic ratio of Na+/(Na+ + Ca2+) and Cl/(Cl + HCO3) more than 0.5 having a TDS value >1000 mg/L, with an indication of shifting of samples from rock dominance to evaporation dominance (Figure 5). This may be due to the chemical weathering and anthropogenic activities that are attributed to evaporation [56], which leads to changes in the groundwater chemistry in Ambaji Basin. In this case, the release of Na+ ions from clay minerals or fertilizers and increase in residence time may be responsible for a higher ratio of Na+/(Na+ + Ca2+) in groundwater. No samples belong to the precipitation dominance category, illustrating a limited supply of ions from the atmosphere [57].

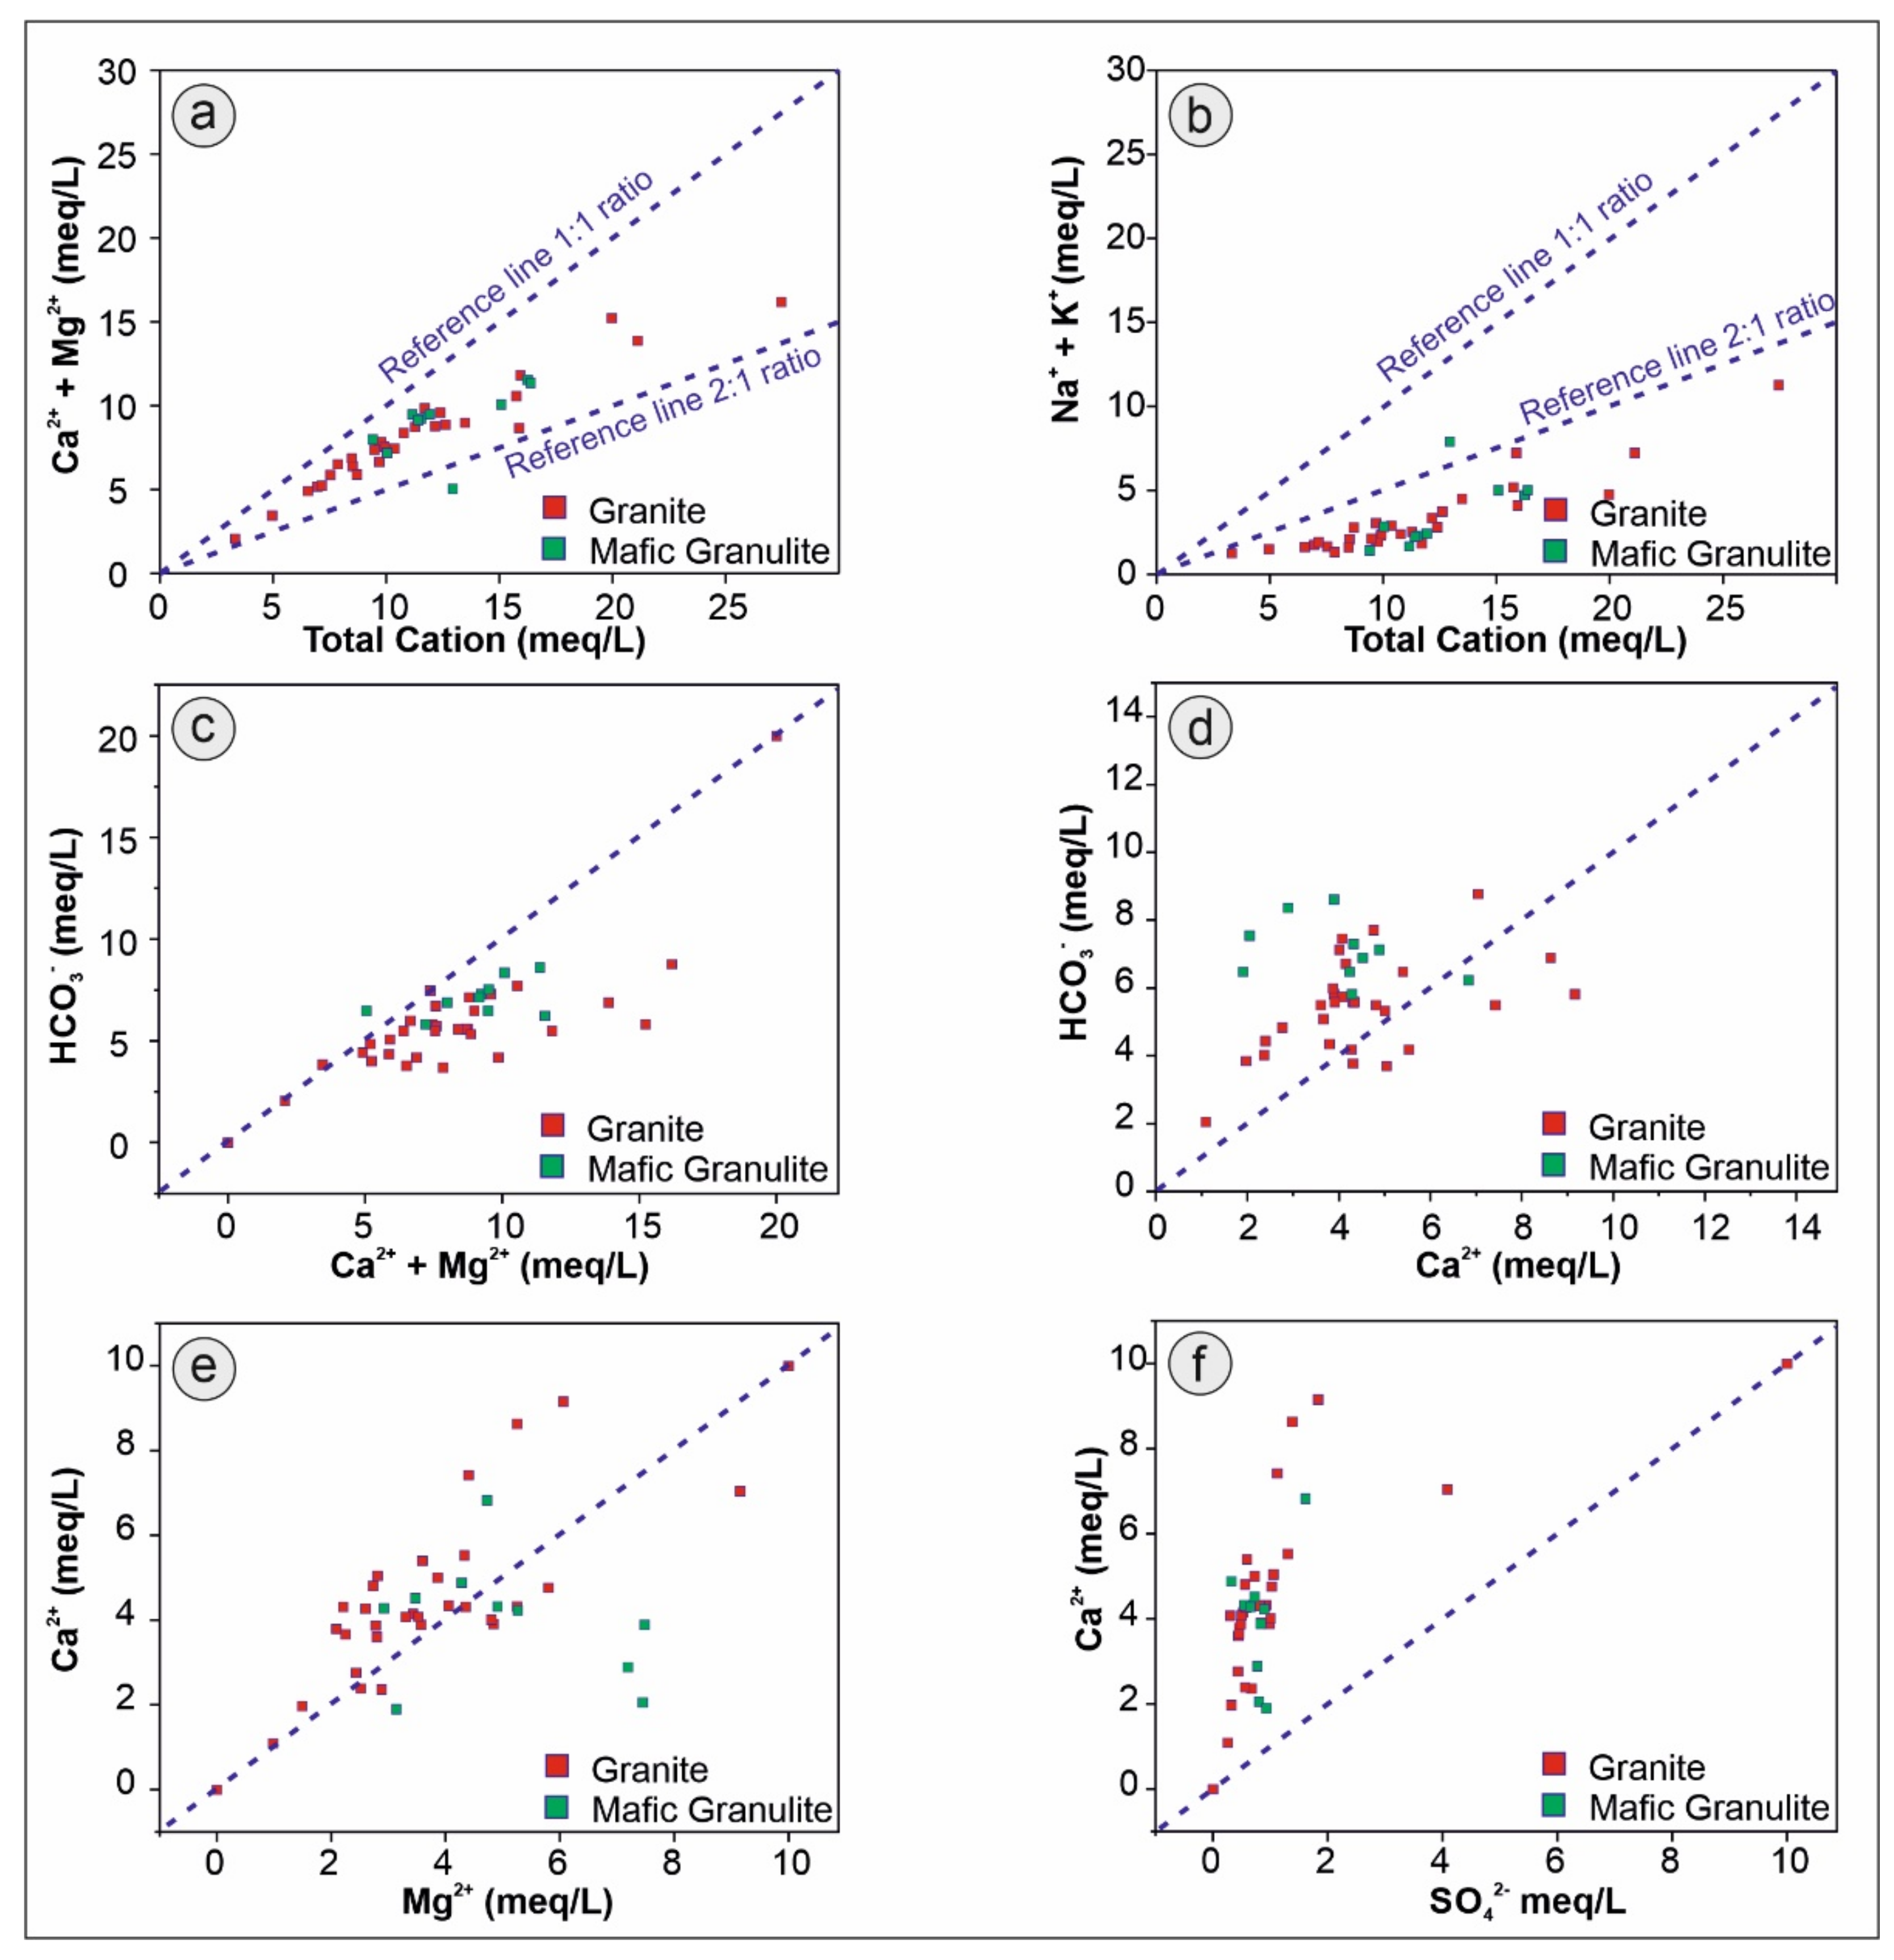
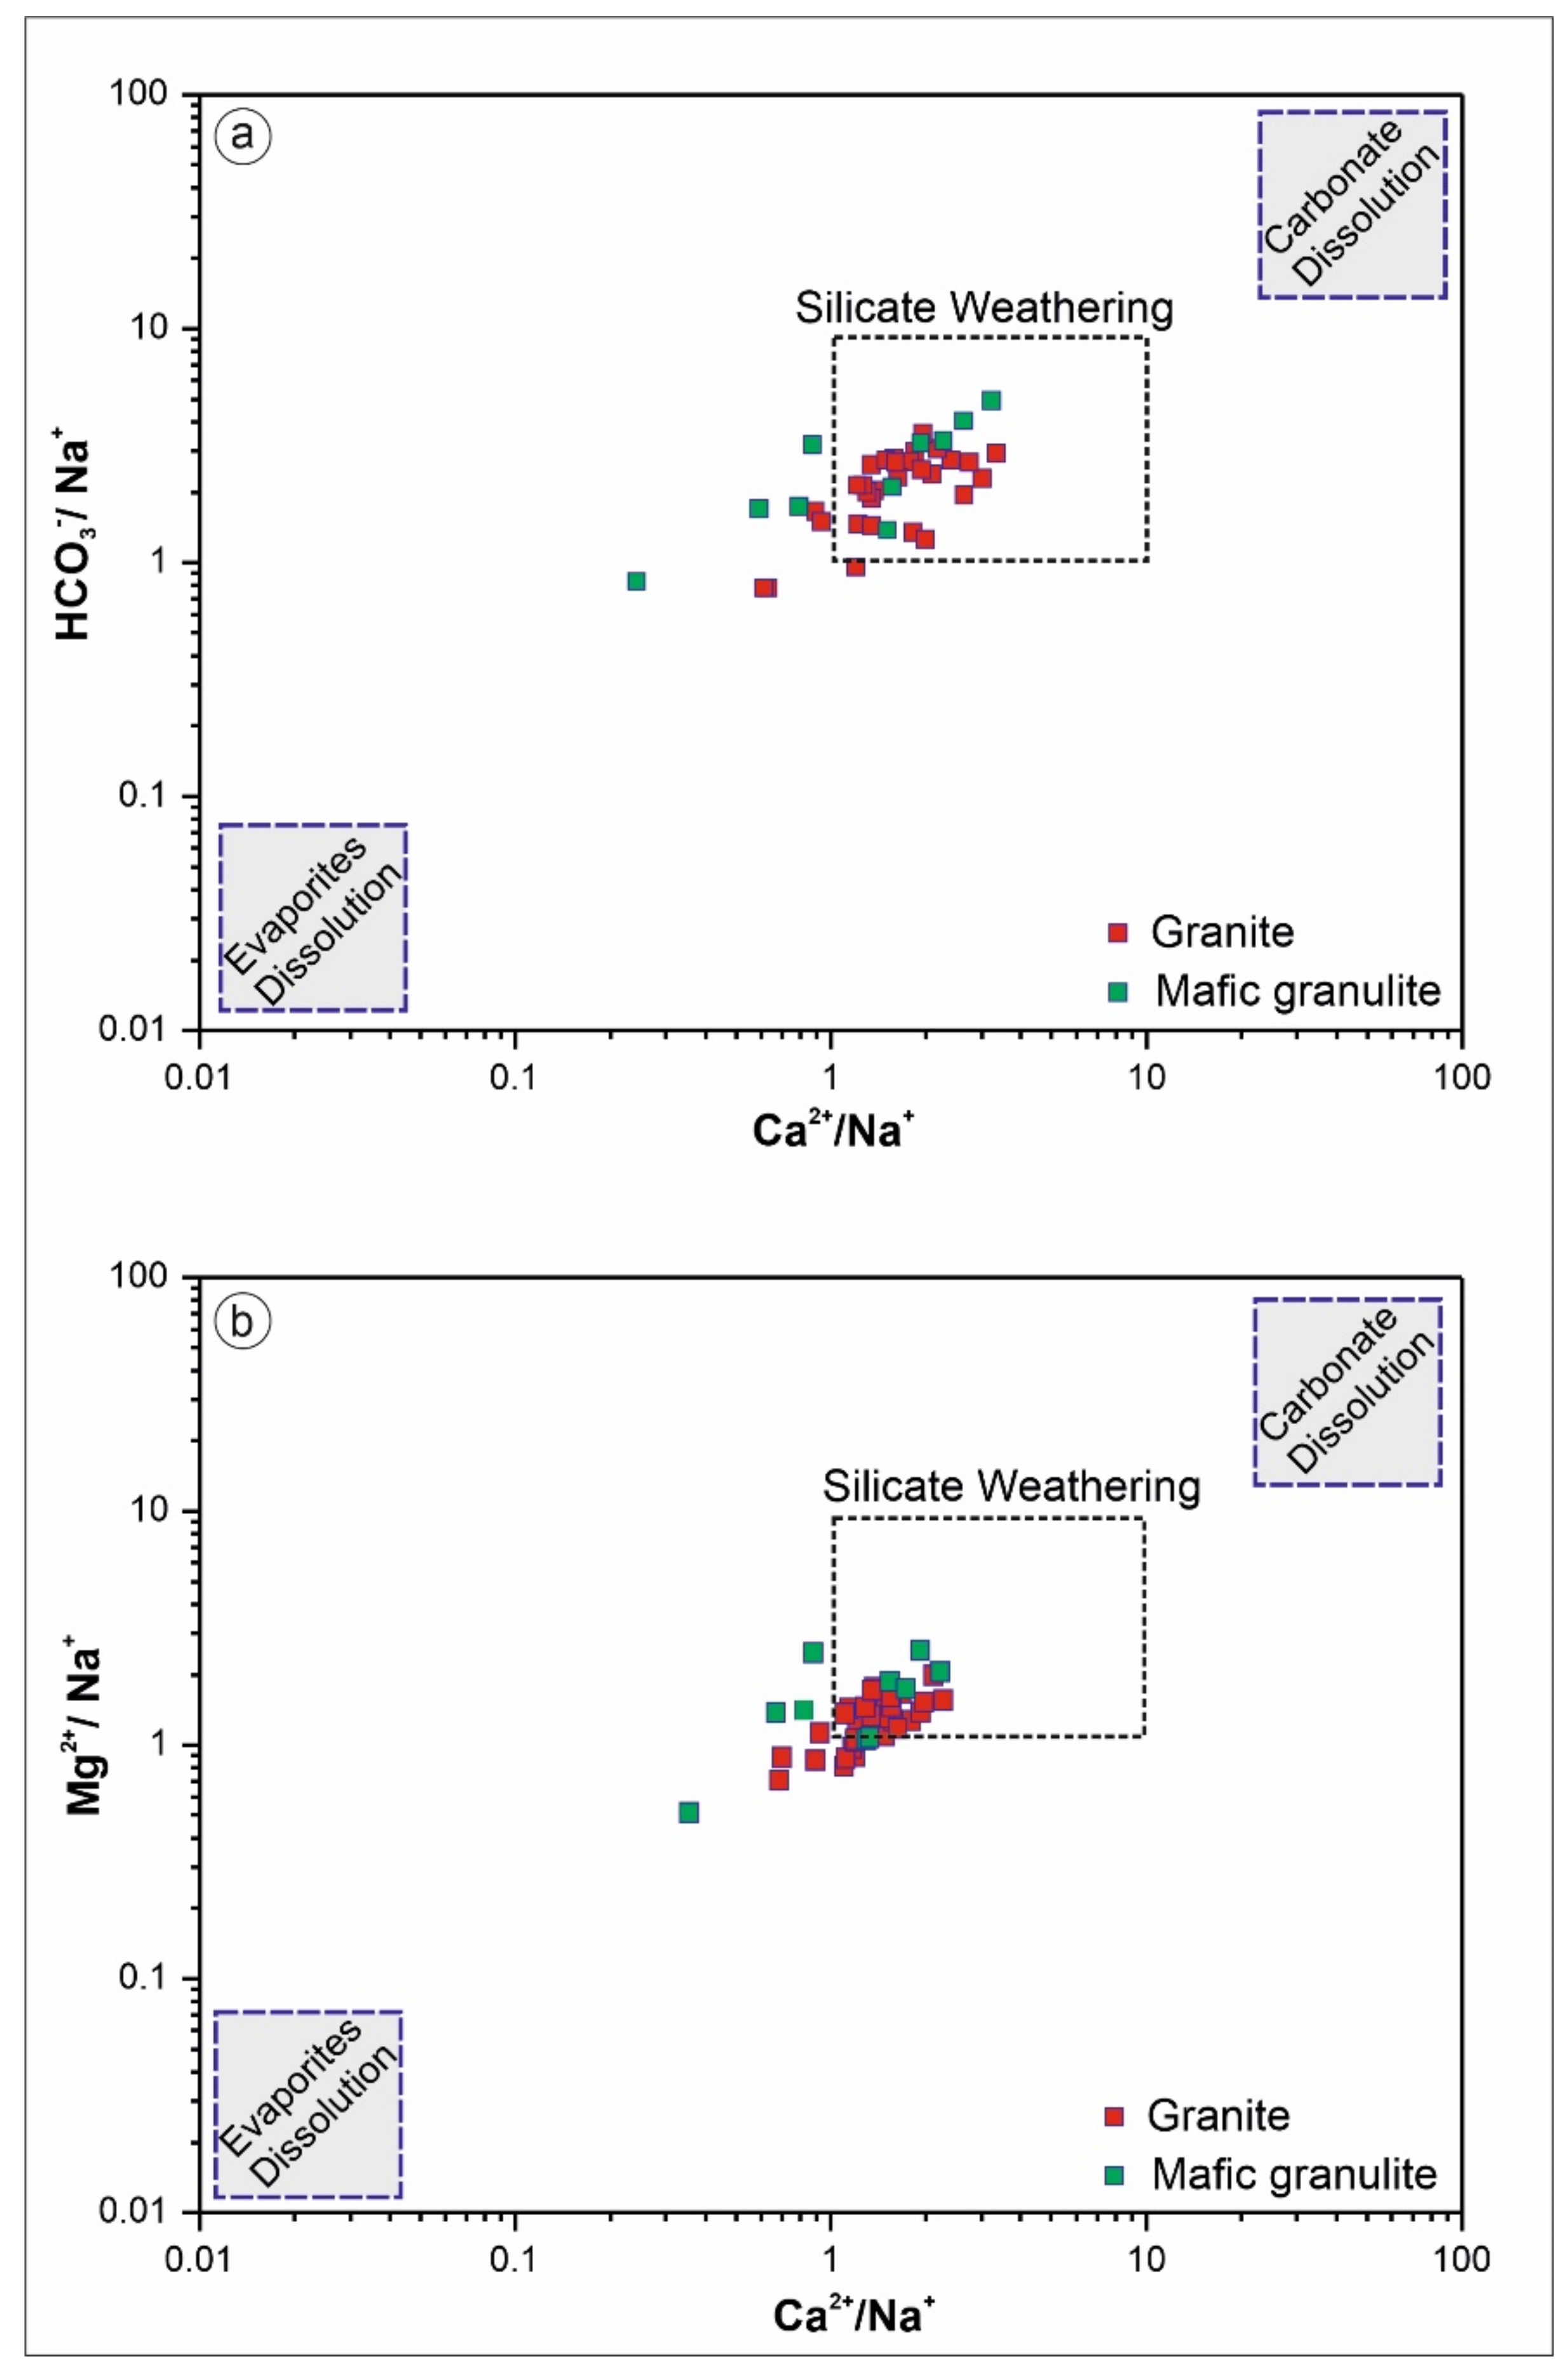
4.1.4. Ionic Ratios and Hydrogeochemical Evolution

Groundwater chemistry mainly depends on the geochemical reactions and processes that occur within the groundwater system [58]. Various binary plots (Figure 6) can explain the various controlling mechanisms for the geochemical evolution of groundwater. In Figure 6a, the samples lie in between reference lines 1:1 and 2:1 on the bivariate plot of total cations versus alkali earth metals (Ca + Mg), indicating that the contribution of Ca and Mg ions has a significant role in the derivation of groundwater chemistry. This may be due to carbonate dissolution [59] or the weathering of calc-silicate and ferromagnesian minerals/carbonate minerals (calcite and dolomite) that are likely to be present in fractured rock bodies (both in granite and granulite) [11]. However, the scatter plot (Figure 6b) between total cations versus alkali metals (Na + K) shows that nearly all samples are plotted below the reference line (2:1). This infers that the contribution of alkalis metal is relatively less than alkali earth metals, which can be explained by the enrichment of Ca2+ in groundwater due to the Ca-Na exchange process.
The ion exchange and silicate weathering are the major controlling factors for the geochemical evolution of groundwater in this aquifer system. Furthermore, the presence of fractures or faults may also be responsible for the ion exchange process [60], which can bring additional Ca2+ ions to the aquifer system. The scatter plot between Ca2+ and HCO3 as shown in Figure 6d illustrates that most of the samples are lying above the 1:1 ratio reference line, whereas very few numbers of samples fall below the reference line. This indicates that the relative enrichment of HCO3 with respect to Ca2+ is due to silicate weathering. Furthermore, an excess of Ca2+ (some samples falling below the line) infers that the cation exchange process is one of the driving mechanisms for the chemistry of groundwater. The weathering of ferromagnesian silicate minerals in the groundwater can also be elucidated through the correlation between Ca2+ + Mg2+ and HCO3, as shown in Figure 6c. In this case, the majority of the samples are plotted very close to the equilibrium line (1:1 ratio reference line) as opposite to Figure 6d. Thus, adding Mg2+ brings the major chemical variation in the groundwater system, which originates from clay minerals. During chemical weathering, the feldspar gets altered to clay minerals that mainly constitute Ca2+, Mg2+, Na+, K+, etc. as major ions. As the groundwater interacts with the aquifer matrix, an exchange of ions between Ca2+ or Mg2+ and Na+ takes place, which is also known as the reverse ion exchange process [59,61] and seemed to be one of the controlling factors.
The relationship between Ca2+ and Mg2+ can be derived from the scatter plot, as shown in Figure 6e. This graph shows that the samples collected from granite terrane fall both above the reference line, whereas the samples collected from granulite terrane lies below the reference line. This suggests that the samples above and below the reference line are Ca and Mg-rich, respectively. The presence of calc-silicate and ferromagnesian minerals in different lithology influences the groundwater system and is an attribute of the chemical variation in the groundwater. However, to identify any influence of the carbonate weathering process in the groundwater system, a scatter plot between Ca2+ and SO42− has been plotted (Figure 6f). All the samples lie above the reference line with an excess of Ca2+ relative to SO42− ions inferring the existence of carbonate weathering [42].

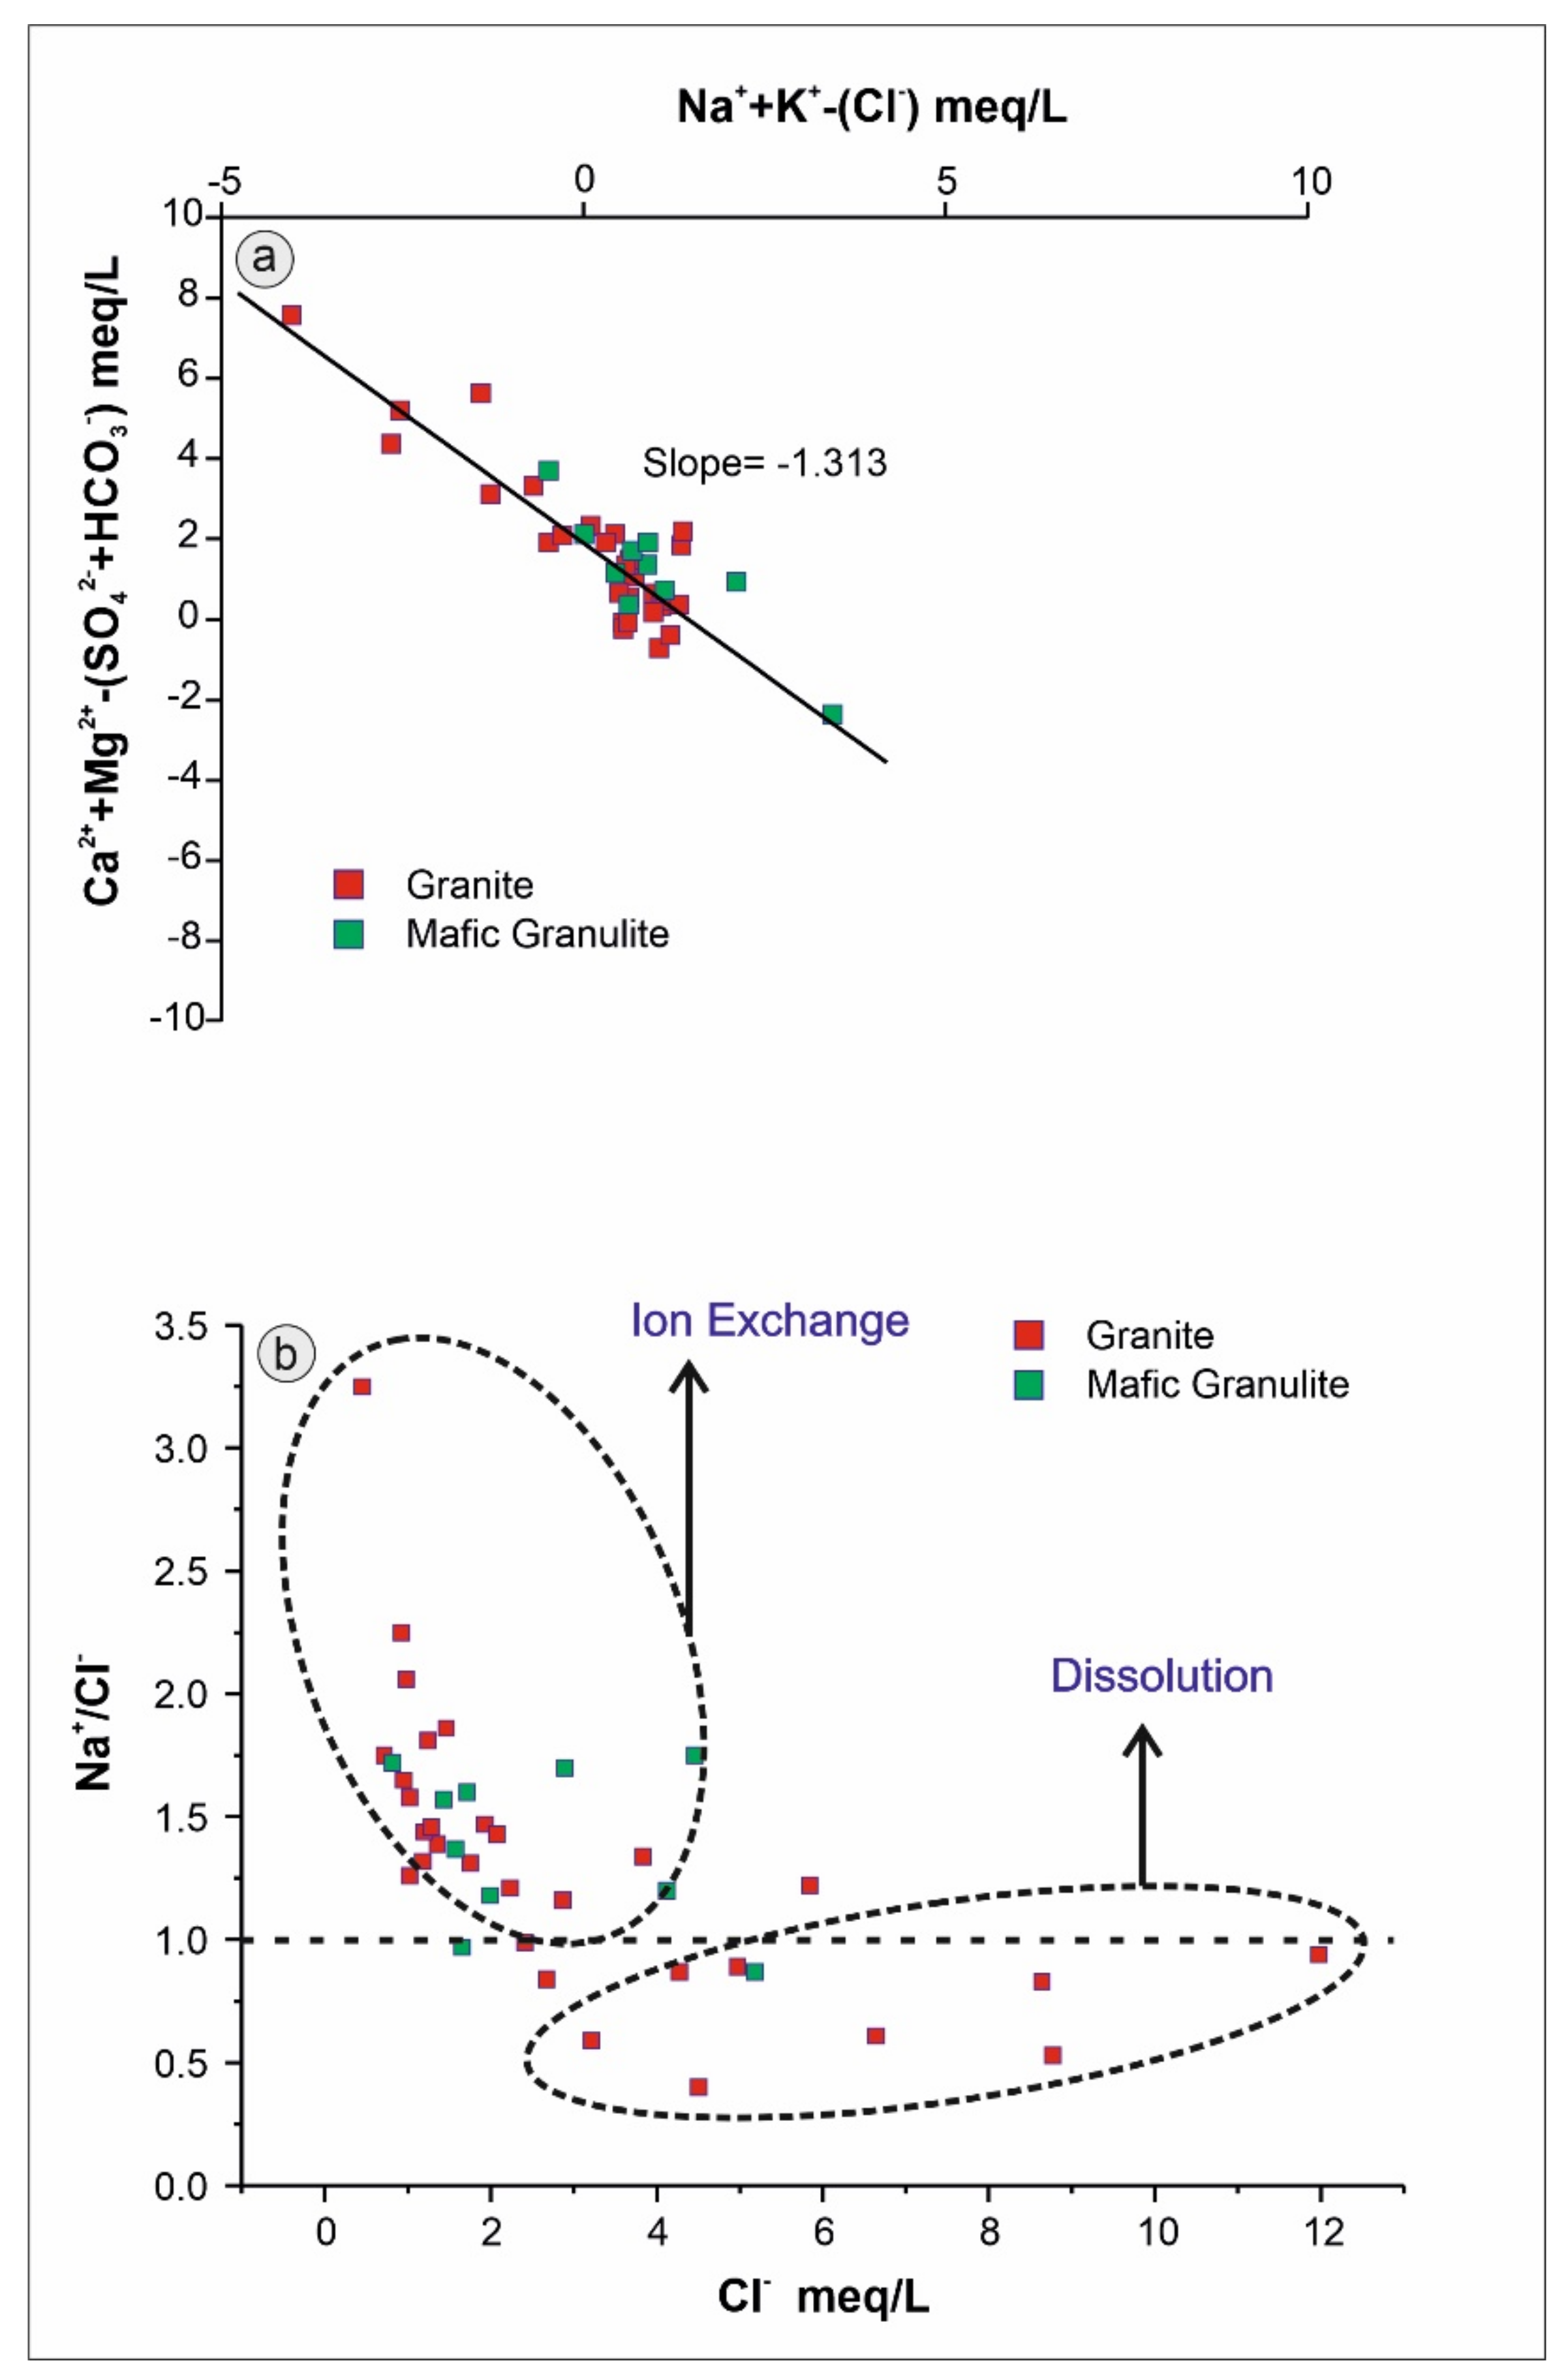
4.1.5. Major Geochemical Processes

Silicate weathering is the main controlling mechanism for the geochemical evolution of groundwater in the study basin. The study area is predominantly composed of granites and granulites, which consist of silicate minerals such as feldspars, pyroxenes, biotite, quartz, etc. The bivariate plots Ca2+/Na+ versus Mg2+/Na+ and Ca2+/Na+ versus Na+/HCO3 are used to classify three important processes that govern the geochemistry of water i.e., carbonate dissolution, evaporite dissolution, and silicate weathering [17,62]. As shown in Figure 7a, Ca/Na > 1 is an indication of Ca-rich groundwater, and HCO3/Na > 1 suggests the dissolution of silicate minerals. In this study area, granites consist of Ca feldspar, which has undergone a weathering process, and the dissolution of feldspar releases Ca2+ to the groundwater system. While the groundwater moves from higher to lower topography (from NE to SW direction) in the investigated area (Figure 1), it shows increasing TDS value with an increase in Ca2+. However, there is a sharp change in groundwater chemistry along its flow path when it interacts with mafic granulite rock, consisting of ferromagnesian minerals. In this particular region, Mg2+ slightly exceeds Ca2+ and gives rise to the Mg-Ca-Na-HCO3 type of water, as discussed in the earlier section of the paper. Thus, the weathering of Mg-rich silicate minerals releases Mg2+ into the groundwater and replaces Ca2+ on participating in the cation exchange process. The Mg/Na > 1 reveals that Mg2+ concentration is more than that of Na+ in groundwater (Figure 7b), whereas the Mg/Na < 1 shows the dominancy of Na+ ion in some groundwater samples, suspecting the normal ion exchange process.
To understand this, a plot, Na+ + K+-(Cl) versus Ca2+ + Mg2+-(SO42− + HCO3), has been plotted, in which almost all samples fall on the straight line with a slope of –1.31 (Figure 8a). This suggests that the reverse ion exchange process is one of the significant factors for the enrichment of Ca or Mg in deeply fractured aquifer relative to Na and also influences the groundwater chemistry in the semi-arid region [60,61,63], as in the case of Ambaji Basin. During this process, Na+ gets adsorbed in favorable exchange sites and replaced with Ca2+ or Mg2+. This can be explained by Equation (5).
2 N a + + C a 2 + M g 2 + C l a y N a + C l a y + C a 2 + M g 2 + .
The scattered plot between Na/Cl and Cl illustrates that the Na concentration in groundwater is due to the ion exchange and dissolution process (Figure 8b). The ratio of Na/Cl > 1 indicates the excess of Na over Cl in groundwater, as driven by the ion exchange process in a continuous groundwater flow system. However, some samples show Na/Cl < 1 with rising in salinity (Cl) concentration, suggesting the effect of dissolution processes, as observed in groundwater discharge points. The subsequent decrease in groundwater flow is attributed to a high Cl concentration, which also indicates the influence of dissolution on groundwater chemistry. Additionally, the prevailing semi-arid climatic conditions over this region enhance the evaporation effect and may cause an increase in ionic concentration in groundwater [11].

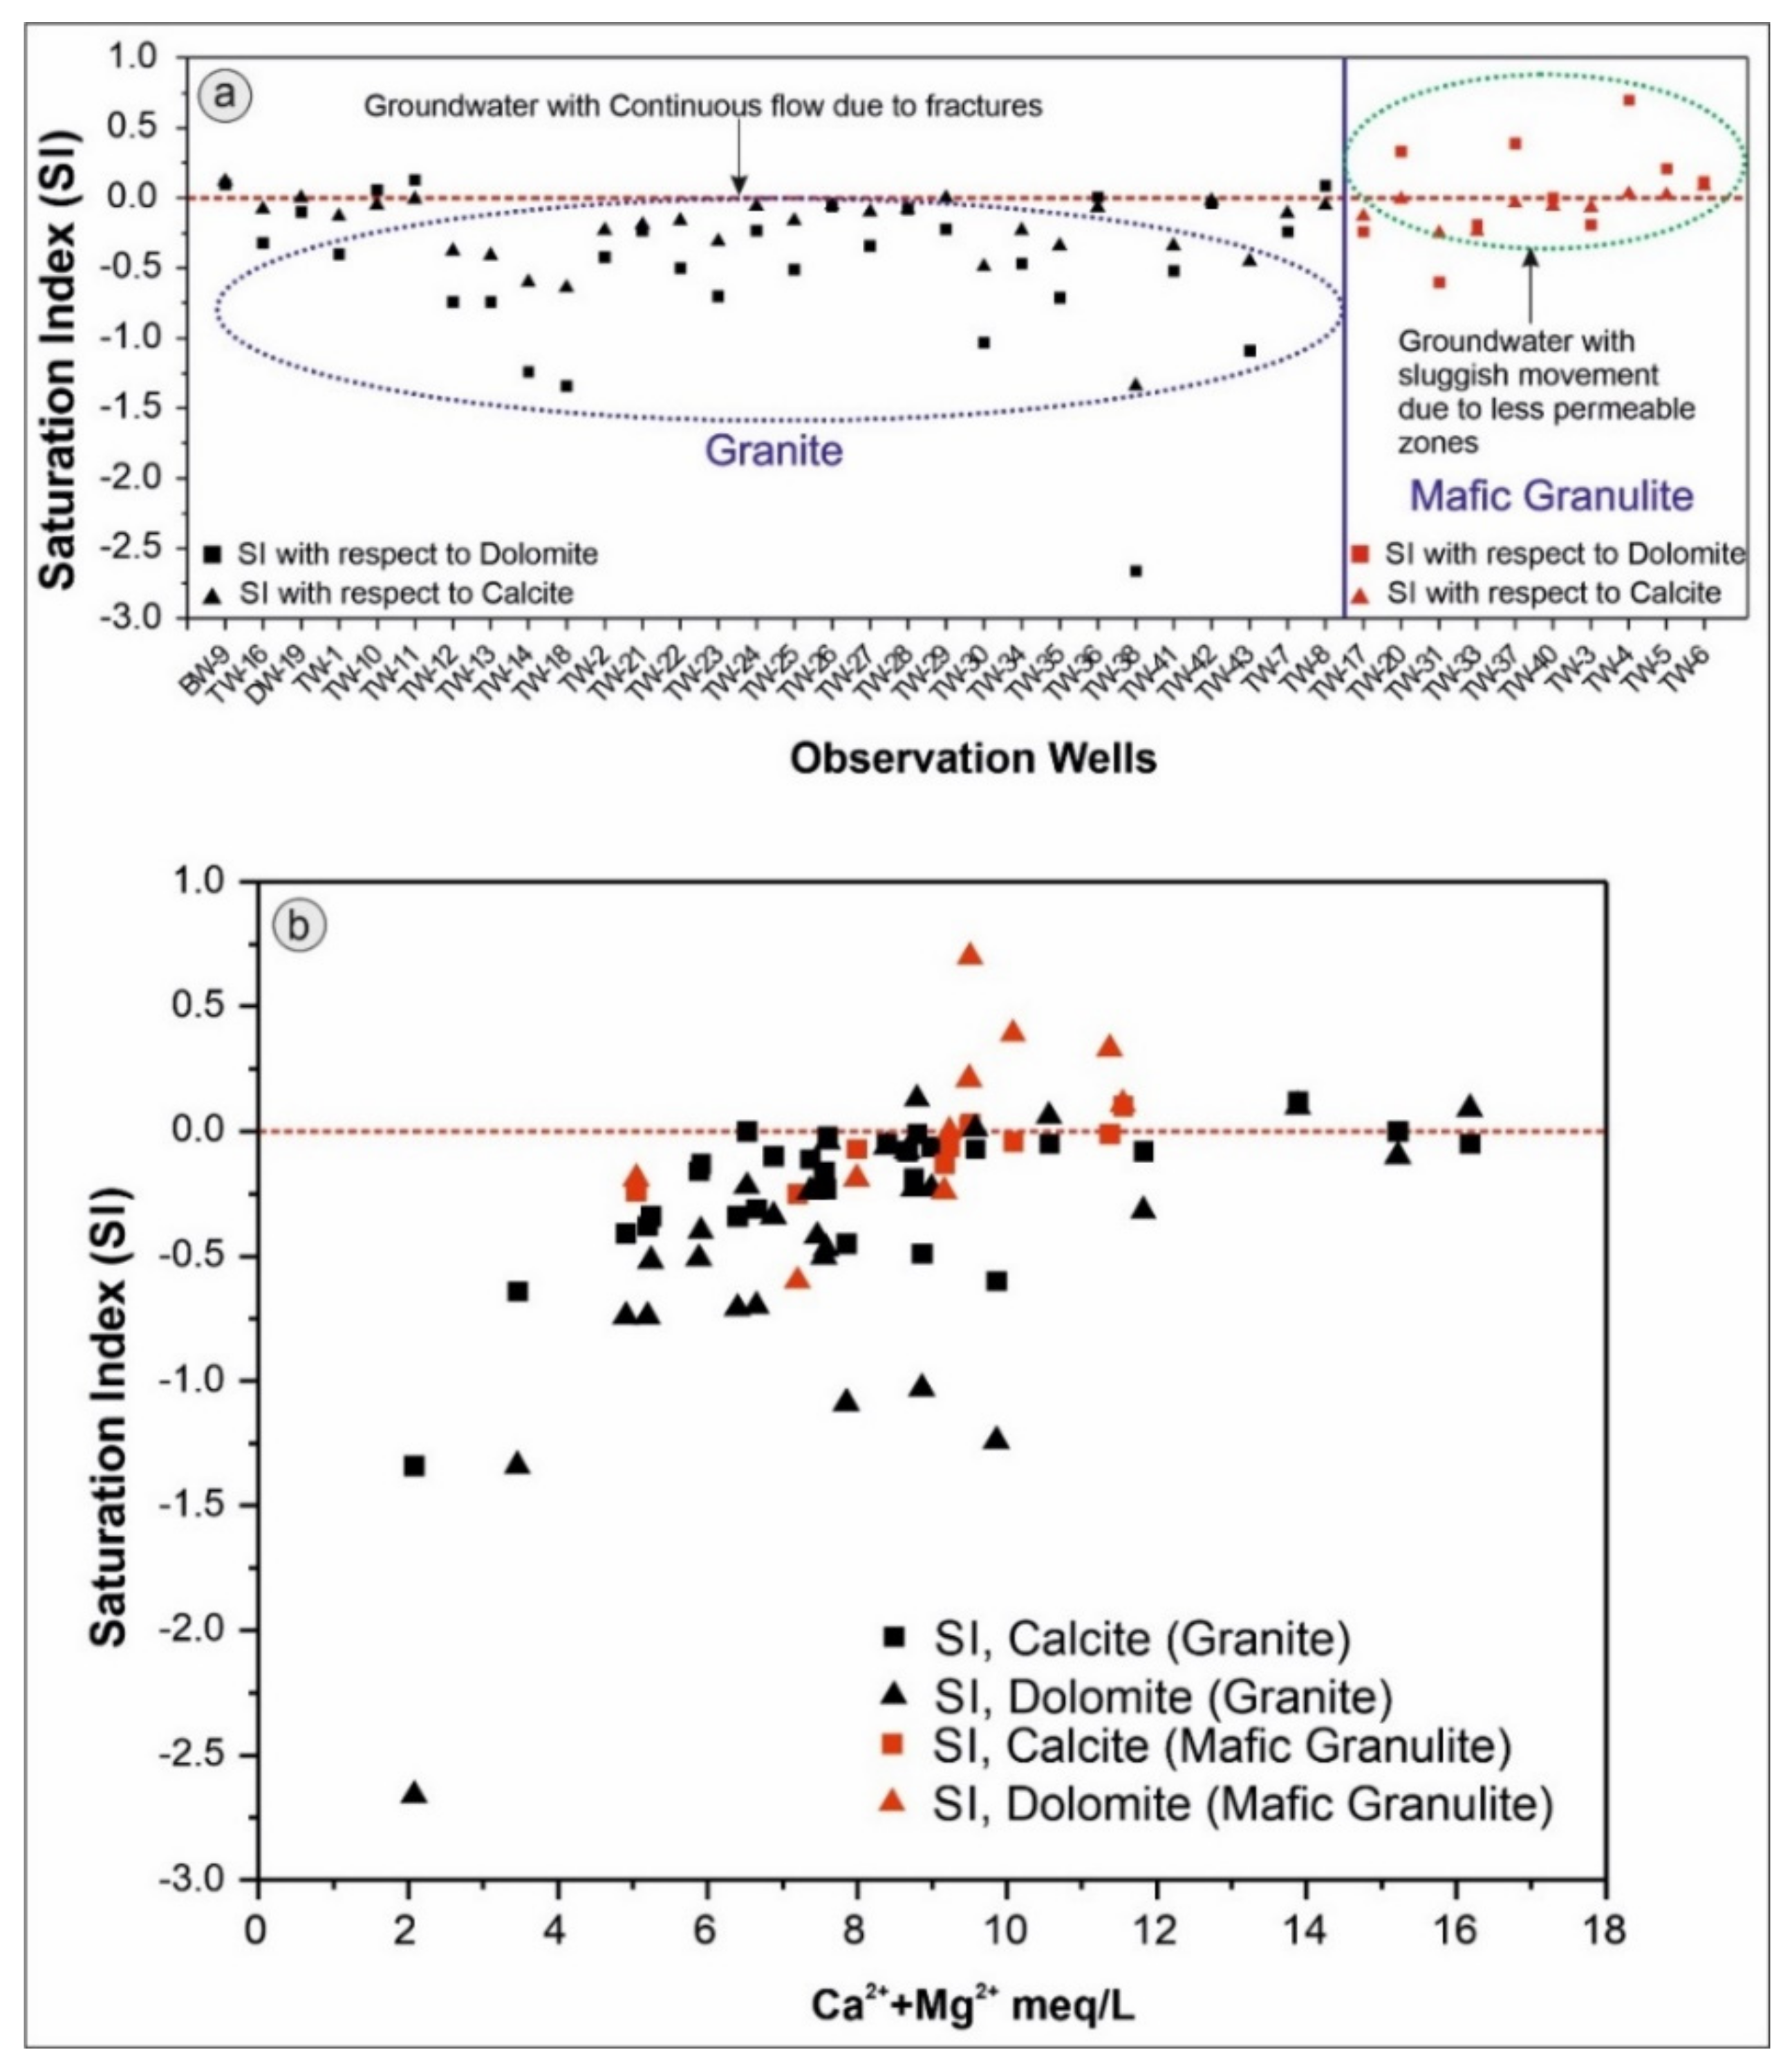
4.1.6. Saturation Index (SI) and Geochemical Modeling

For this study, the PHREEQC code [64] has been performed to compute the saturation indices (SI) of dominant carbonate mineral species such as calcite and dolomite, which are the common fracture-filling minerals. As the concentration of Ca and Mg is observed in groundwater samples, the saturation indices with respect to calcite and dolomite can be used as a proxy for identifying the geochemical processes. In Figure 9, the samples have been classified as saturated (SI = 0), undersaturated (SI < 0 or negative), and oversaturated (SI > 0, positive) [50,65]. Most of the samples collected from granitic rocks are plotted below the equilibrium line (SI = 0) (Figure 9a). This infers that groundwater is undersaturated to calcite and dolomite with an excess of Ca and Mg, which are mainly derived from the dissolution of silicate minerals. The higher dissolution rate may be due to the continuous flow of groundwater through fractured granite. However, few samples (BW-9, DW-19, TW-10, TW-11, TW-36, TW-8, TW-42) are distributed close to the saturated line (Figure 9b), acquiring the saturation or over-saturation condition with the increasing of Ca and Mg. These samples are located near the groundwater discharge locations with an average TDS value >1000 mg/L. The relatively slower movement of the groundwater and the evaporation process may be the driving factors for excess ionic concentration.
In the case of mafic granulite, the majority of the samples are near the equilibrium line (Figure 9b), indicating that groundwater is in a nearly saturated state with regard to calcite and dolomite. Groundwater is oversaturated to dolomite in mafic granulite compared to granite. Thus, the sluggish movement of groundwater may lead to an over-saturation condition of calcite and dolomite in granulite rocks, unlike granitic rocks. The concentration of alkali earth metals (Ca + Mg) increases as the groundwater is subjected to saturated or oversaturated conditions to both calcite and dolomite (Figure 9b) due to an incongruent dissolution of silicates.

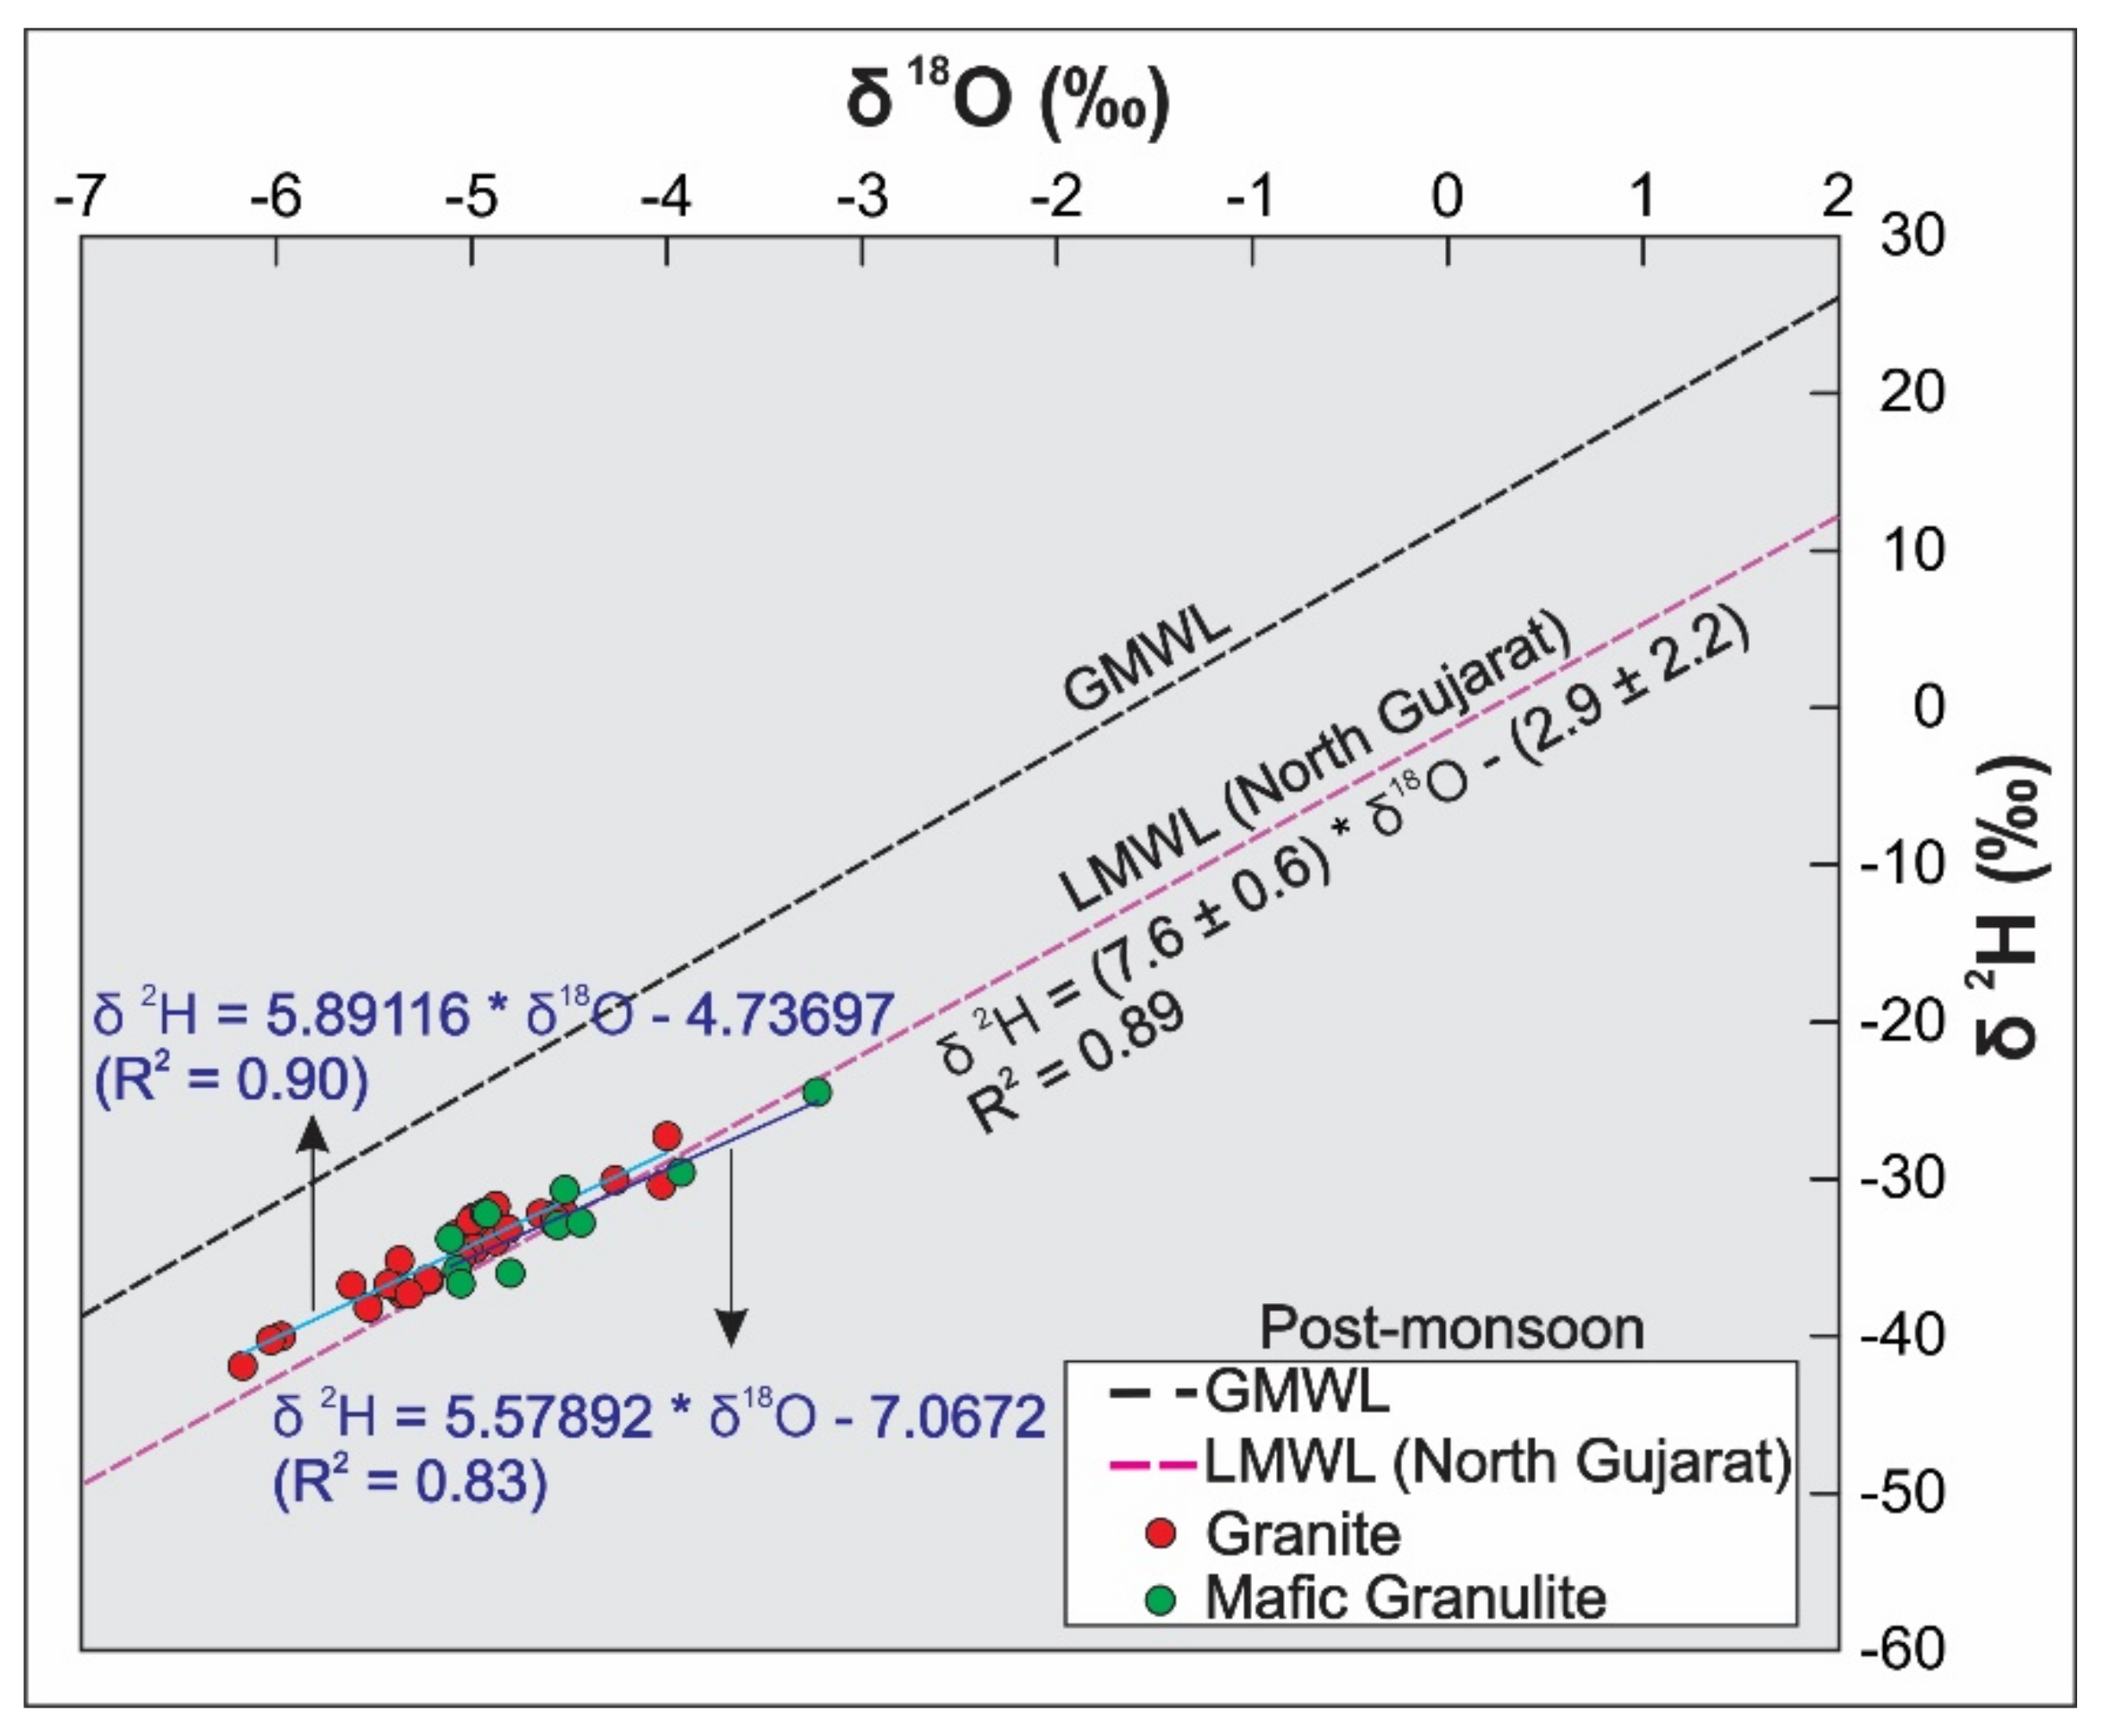
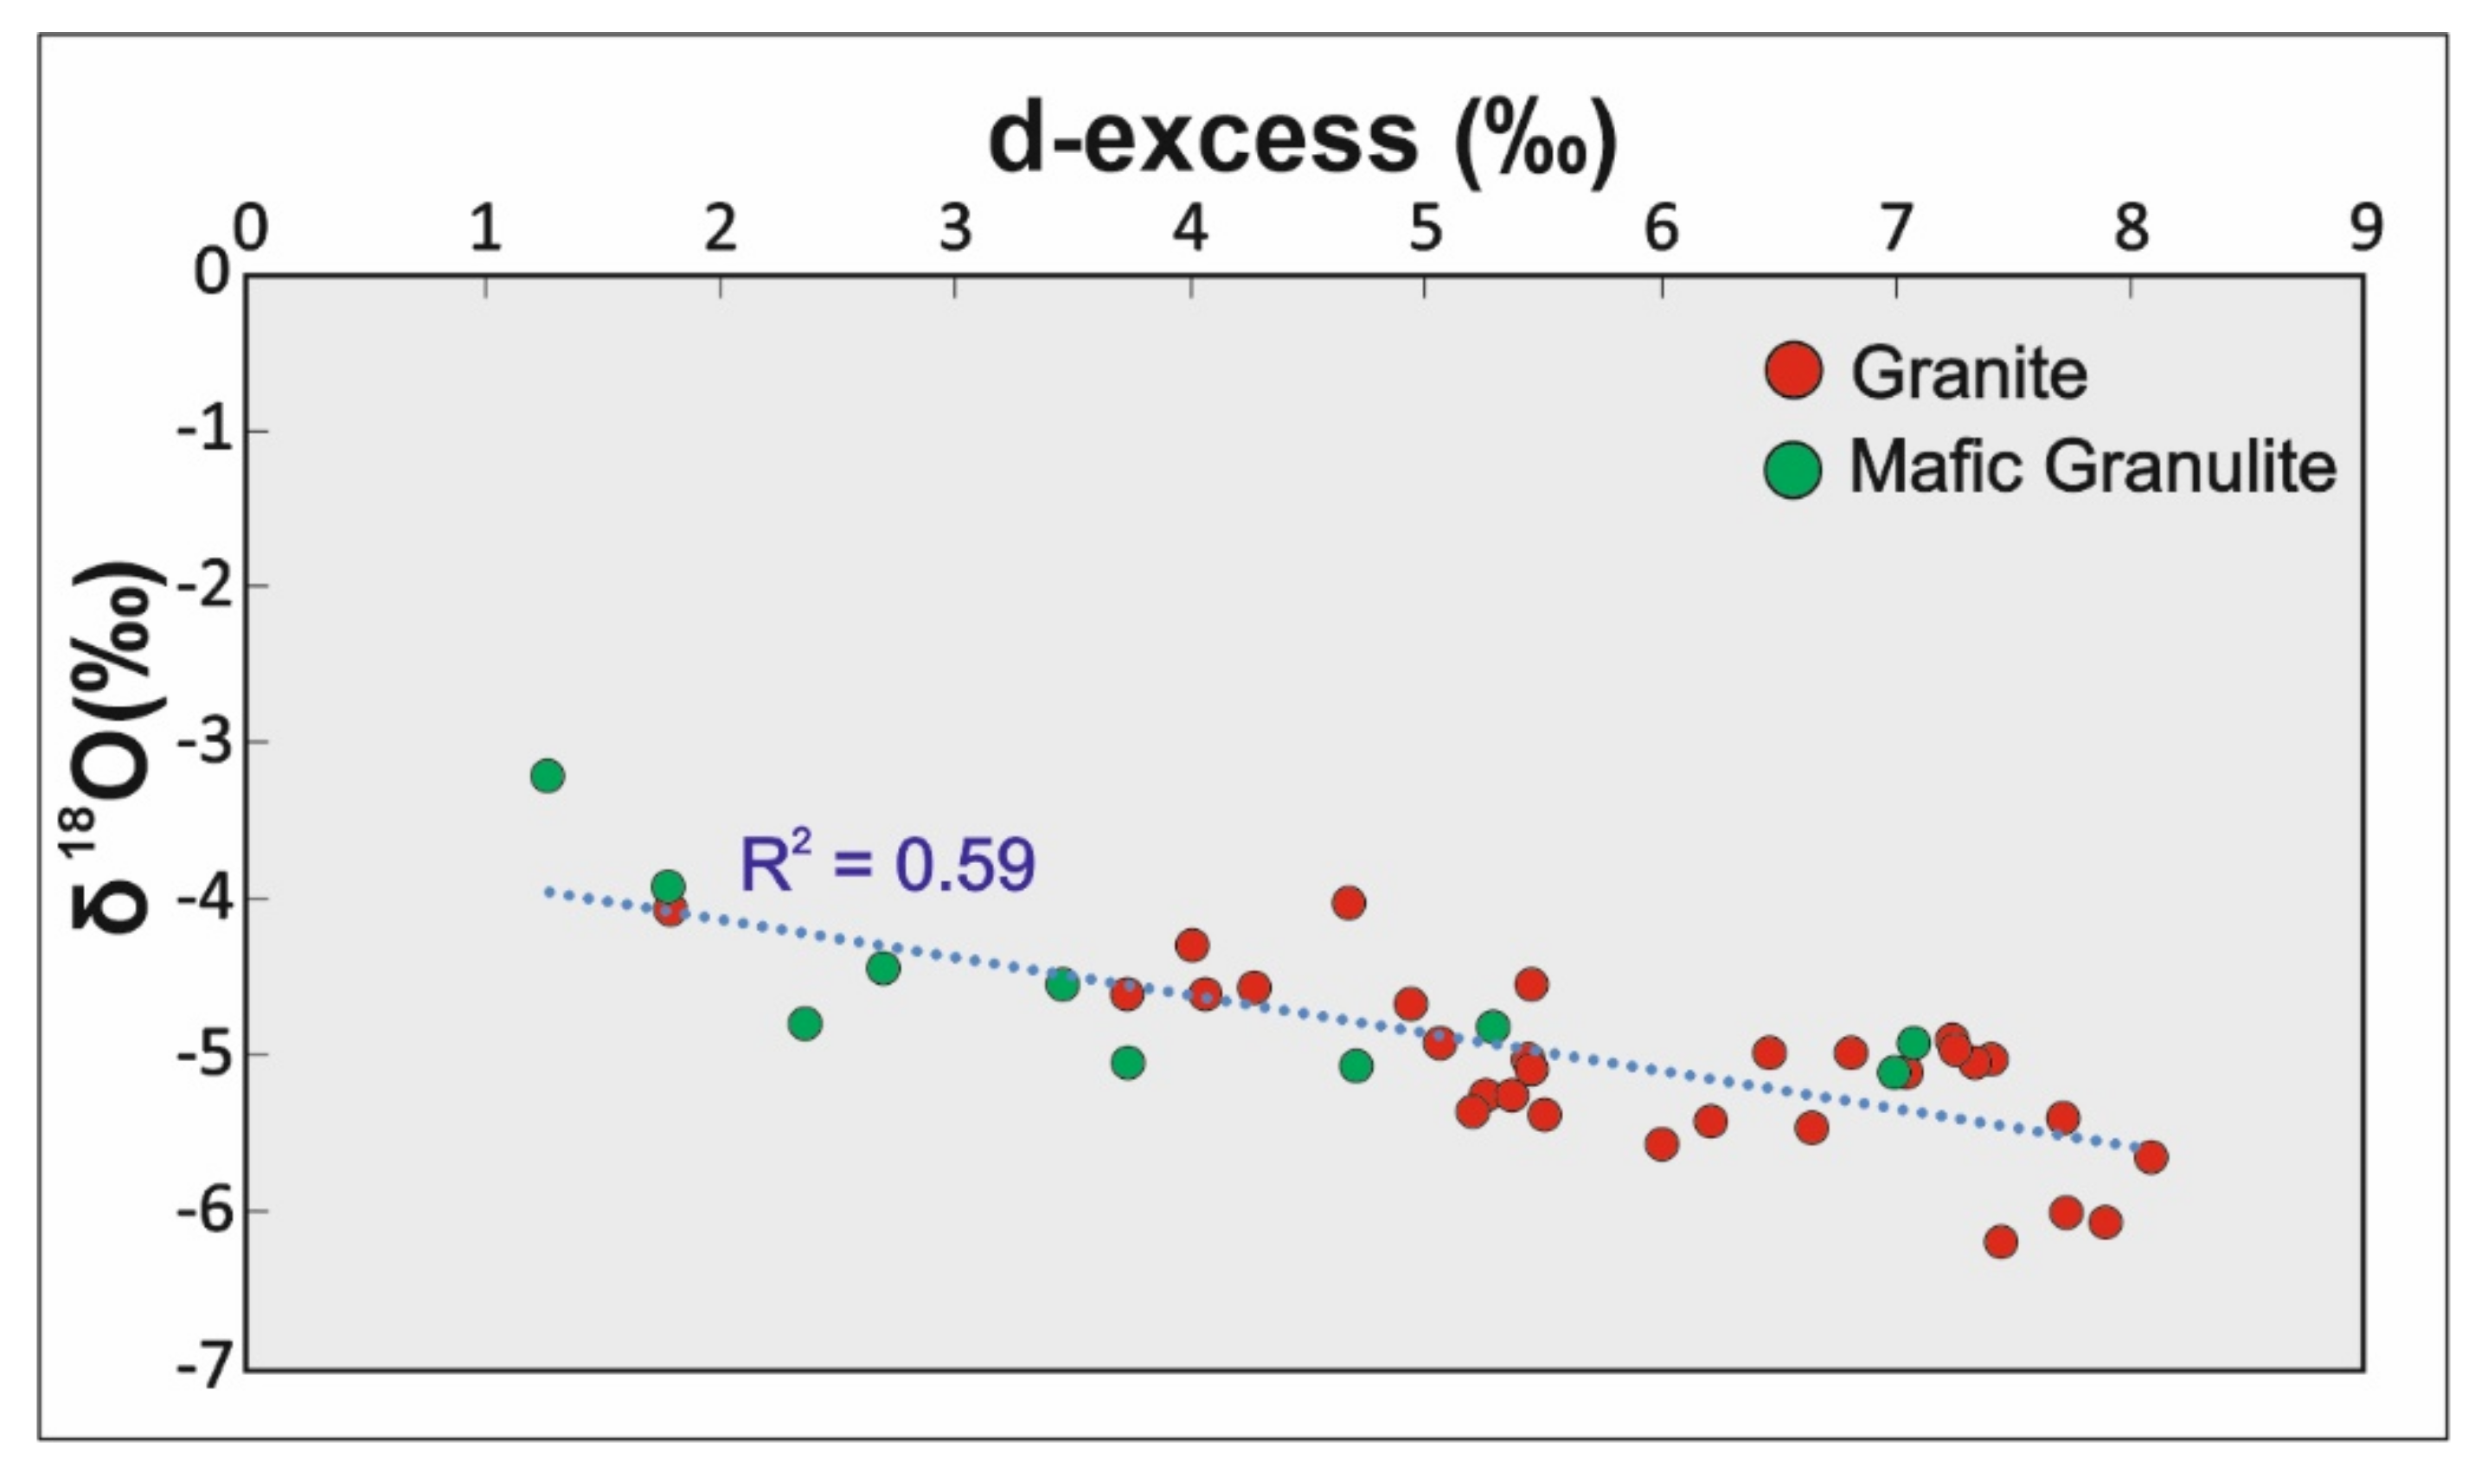
4.2. Stable Isotopic (δ18O and δ2H) Signatures and Recharge Process

The stable isotopic (δ18O and δ2H) composition of the groundwater in the study area varies from −6.17‰ to −3.23‰ in δ18O and −41.90‰ to −24.51‰ in δ2H (Table 1) with the mean value of −4.93‰ for δ18O and −34.03‰ for δ2H. The Local Meteoric Water Line (LMWL) was calculated based on the concept of Global Meteoric Water Line (GWML) using Equation (6) as shown below [66,67] to understand the relation between 2H and 18O.
δ 2 H = 8 δ 18 O + 10
Around 17% and 83% of the total groundwater samples are plotted slightly below and above the LMWL [68] (δ2H = (7.6 ± 0.6) × δ18O-(2.9 ± 2.2)) respectively, suggesting that groundwater is of meteoric origin (Figure 10).
Furthermore, there is a variation in isotopic composition in groundwater, which is collected from granite and mafic granulite, suspecting the influence of geology on the recharge process. Figure 10 illustrates that the regression line, δ2H = 5.89116 × δ18O- 4.73697, which was plotted for the shallow fractured granite aquifer, has a lower slope (approximately 5.9) and intercept (−4) than LMWL. This is due to the fractionation, which leads to a depletion of isotopic composition in groundwater with a positive and strong correlation (R2 = 0.9) between δ18O and δ2H. Moreover, the d-excess value of groundwater samples collected from fractured aquifer systems varies from 1.81 to 8.11‰ with an average value of 5.93‰, which also indicates the evaporation process. Similarly, the regression line, δ2H = 5.57 × δ18O-7.0672 fits positively (R2 = 0.83) between δ18O and δ2H of groundwater samples extracted from mafic granulite. The slope (5.57) and intercept (−7.06) of the regression line is less than that of LMWL, indicating the evaporation effect prior to recharging the groundwater in the mafic granulite aquifer. This is also supported by the d-excess value ranging from 1.30 to 7.10‰ with the mean value of 3.98‰. The slope (<7.6) and d-excess (<10‰) values of the groundwater from both granitic and mafic granulites suggest that the groundwater is influenced by the evaporation process before recharge.
In order to understand the recharge source, a flow direction map of groundwater has been prepared (Figure 11).
Sampling locations such as TW-1, TW-43, T-13, TW-42, and TW-38 show depleted isotopic compositions (average δ18O < −5.00‰) with the higher hydraulic heads and are located in the Kengora and Ghoda area. Similarly, groundwater from TW-3, TW-5, TW-4, and TW-6 in the Kanpura area shows slightly enriched isotopic values (average δ18O > −5.00‰) along the flow direction with a decrease in the hydraulic head (Figure 11), which indicates that a higher topography region is depleted with isotopic composition as compared to a low topography region, although they originate from the same source of recharge i.e., local precipitation. However, the depleted isotopic composition is also observed in TW-7, TW-10, TW-21, TW-22, TW-23, TW-25, TW-27, and TW-29 sampling locations with lower hydraulic heads, which are also falling on granitic rocks of the lower topography region. Remarkably, it reveals that groundwater in fractured granite shows the depleted isotopic composition and higher d-excess value as compared to mafic granulite (Figure 12), although they have the same source of recharge. This may be due to the kinetic evaporation of soil moisture that affects the groundwater more effectively in mafic granulite than fractured granite before it recharges. Furthermore, the sluggish movement of groundwater due to less permeability in mafic granulite is attributed to the enrichment of isotopic composition as compared to the fractured permeable aquifer.

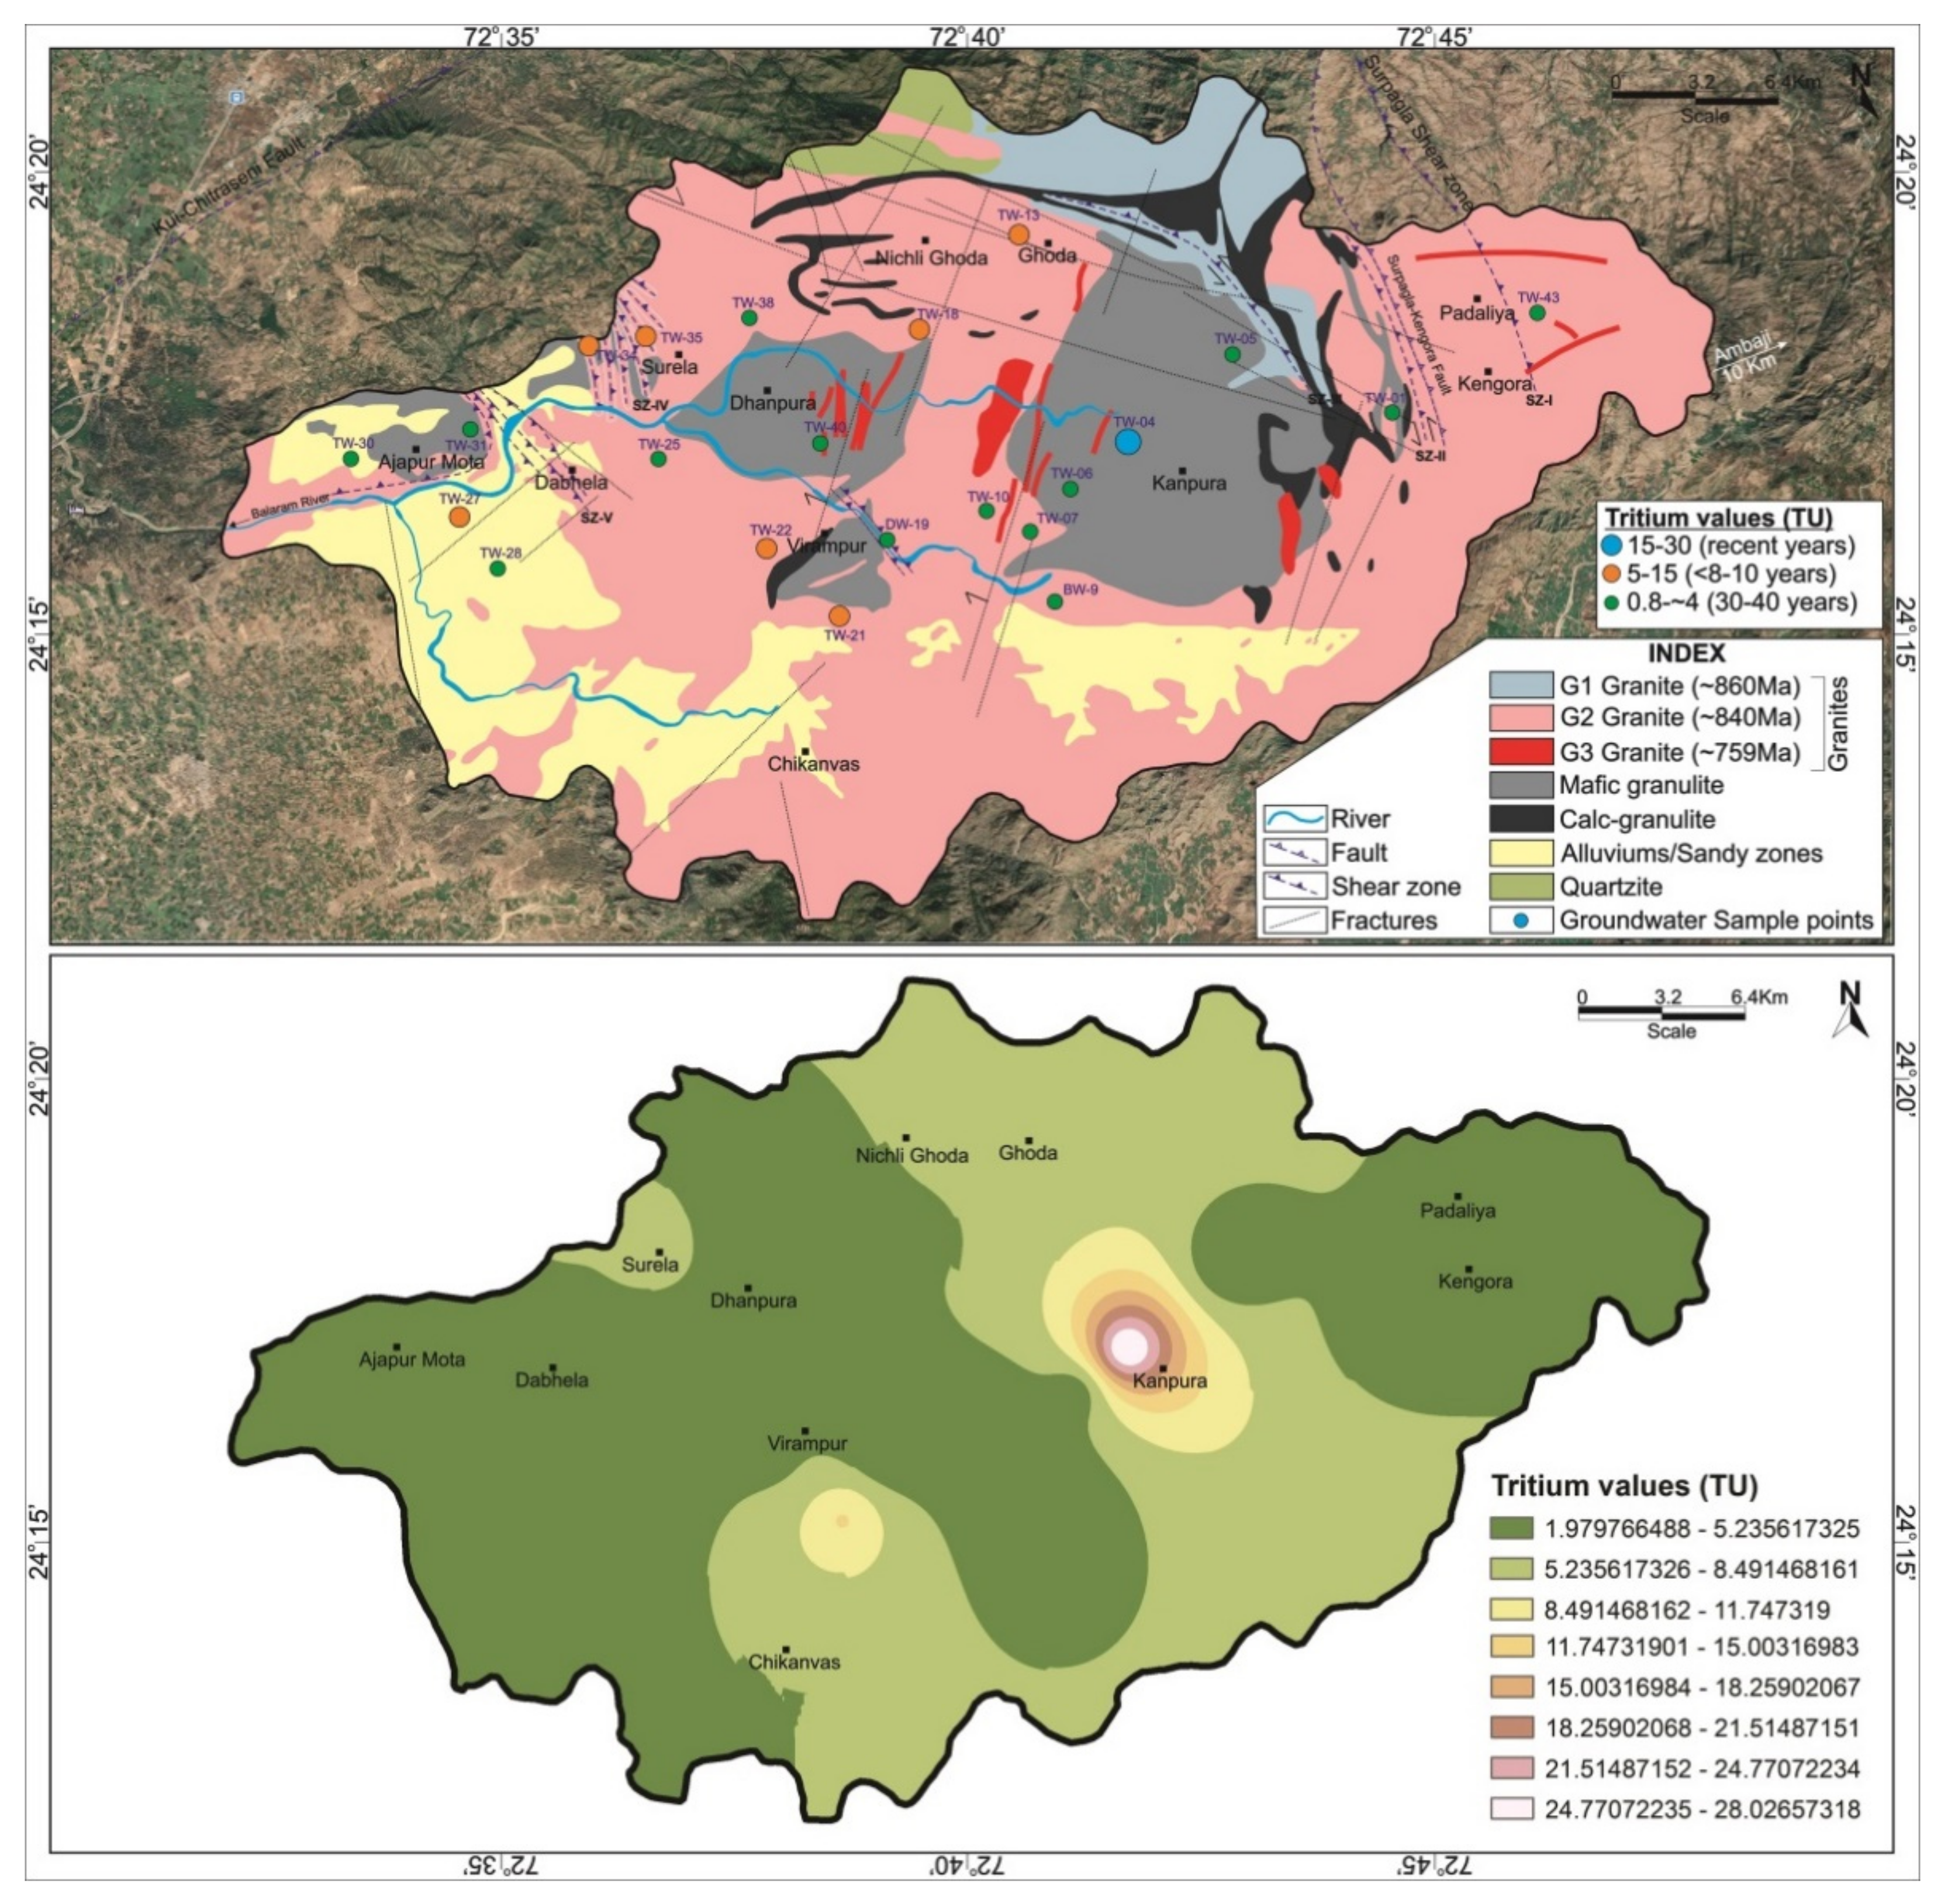
4.3. Radiogenic (3H) Isotopic Signatures

In this study, tritium (3H) dating is used to measure the age of groundwater. The half-life of 3H is 12.32 ± 0.02 years. The 3H concentration in the hydrosphere can be cosmogenic and anthropogenic, and the concentration of 3H in rain due to cosmic ray production is about 6–8 tritium units (TU) in Indian rainwaters [69]. Based on the tritium unit (TU) values, the semi-quantitative age of groundwater can be inferred [70,71]. Twenty-two (22) representative groundwater samples were collected from different aquifers during December 2017 and investigated for measuring the 3H in the study area in (Table 1). The measured range of TU varies from 1.97 ± 0.13 TU to 28.05 ± 0.70 TU with an average of 5.10 TU. Usually, the 3H content in groundwater starts decreasing from the recharge zone to discharge zones with time. The area also shows similar results, i.e., relatively high TU in the recharge areas and low TU at the discharge areas (southwest part) (Figure 13). The results show that the measured tritium values (TU) in groundwater can be categorized broadly into (1) a mixture of sub-modern and modern water (0.8–4.0 TU, 30–40 years), (2) modern water (5–15 TU, <5–10 years), and (3) recent recharge (>15 TU). The 3H values show that most of the samples show a mixture between sub-modern and modern recharge followed by modern and recent recharge. Figure 13 shows the semi-quantitative groundwater ages and exemplifies that groundwater is dynamically recharged through weathered zones, secondary fractures, faults, and shear zones. The existence of recent and modern groundwater in the deeper depth specifies a link between shallow and deeper aquifers. Furthermore, it directs that the groundwater level will be shallow even if pumping is more in these areas. Among the entire area, one sample shows 28.05 TU (TW-04, Kanpura area), representing the recent age groundwater, which might be due to a river being close to the well location. In this study basin, the identified recharge locations are Kengora (TW-1), Padaliya (TW-43), Ghoda (TW-13), Nichli Ghoda (TW-18), Surela (TW-34, TW-35), Virampur (TW-21, TW-22), and Yogdadi areas (TW-27) (>5 TU). These areas are also a good pact with the presence of structural components i.e., major faults, fractures, and shear zones that control the groundwater circulations in the study basin.
More than 50% of the samples show the TU values between 0.8 and 4.0, which indicates that the groundwater is mixed type i.e., modern and sub-modern age (30–40 years). This implies that the study area is moderately rechargeable in these areas even if few fracture and lineament traces are present. The area consists of several mafic granulite patches where fractures and weathered zones are relatively less as compared to granitic rock. The mafic granulite is massive in nature, which results in the sluggish behavior of groundwater movement in the subsurface. Therefore, these moderately rechargeable areas are expected to show a depletion of groundwater levels if pumping is more.

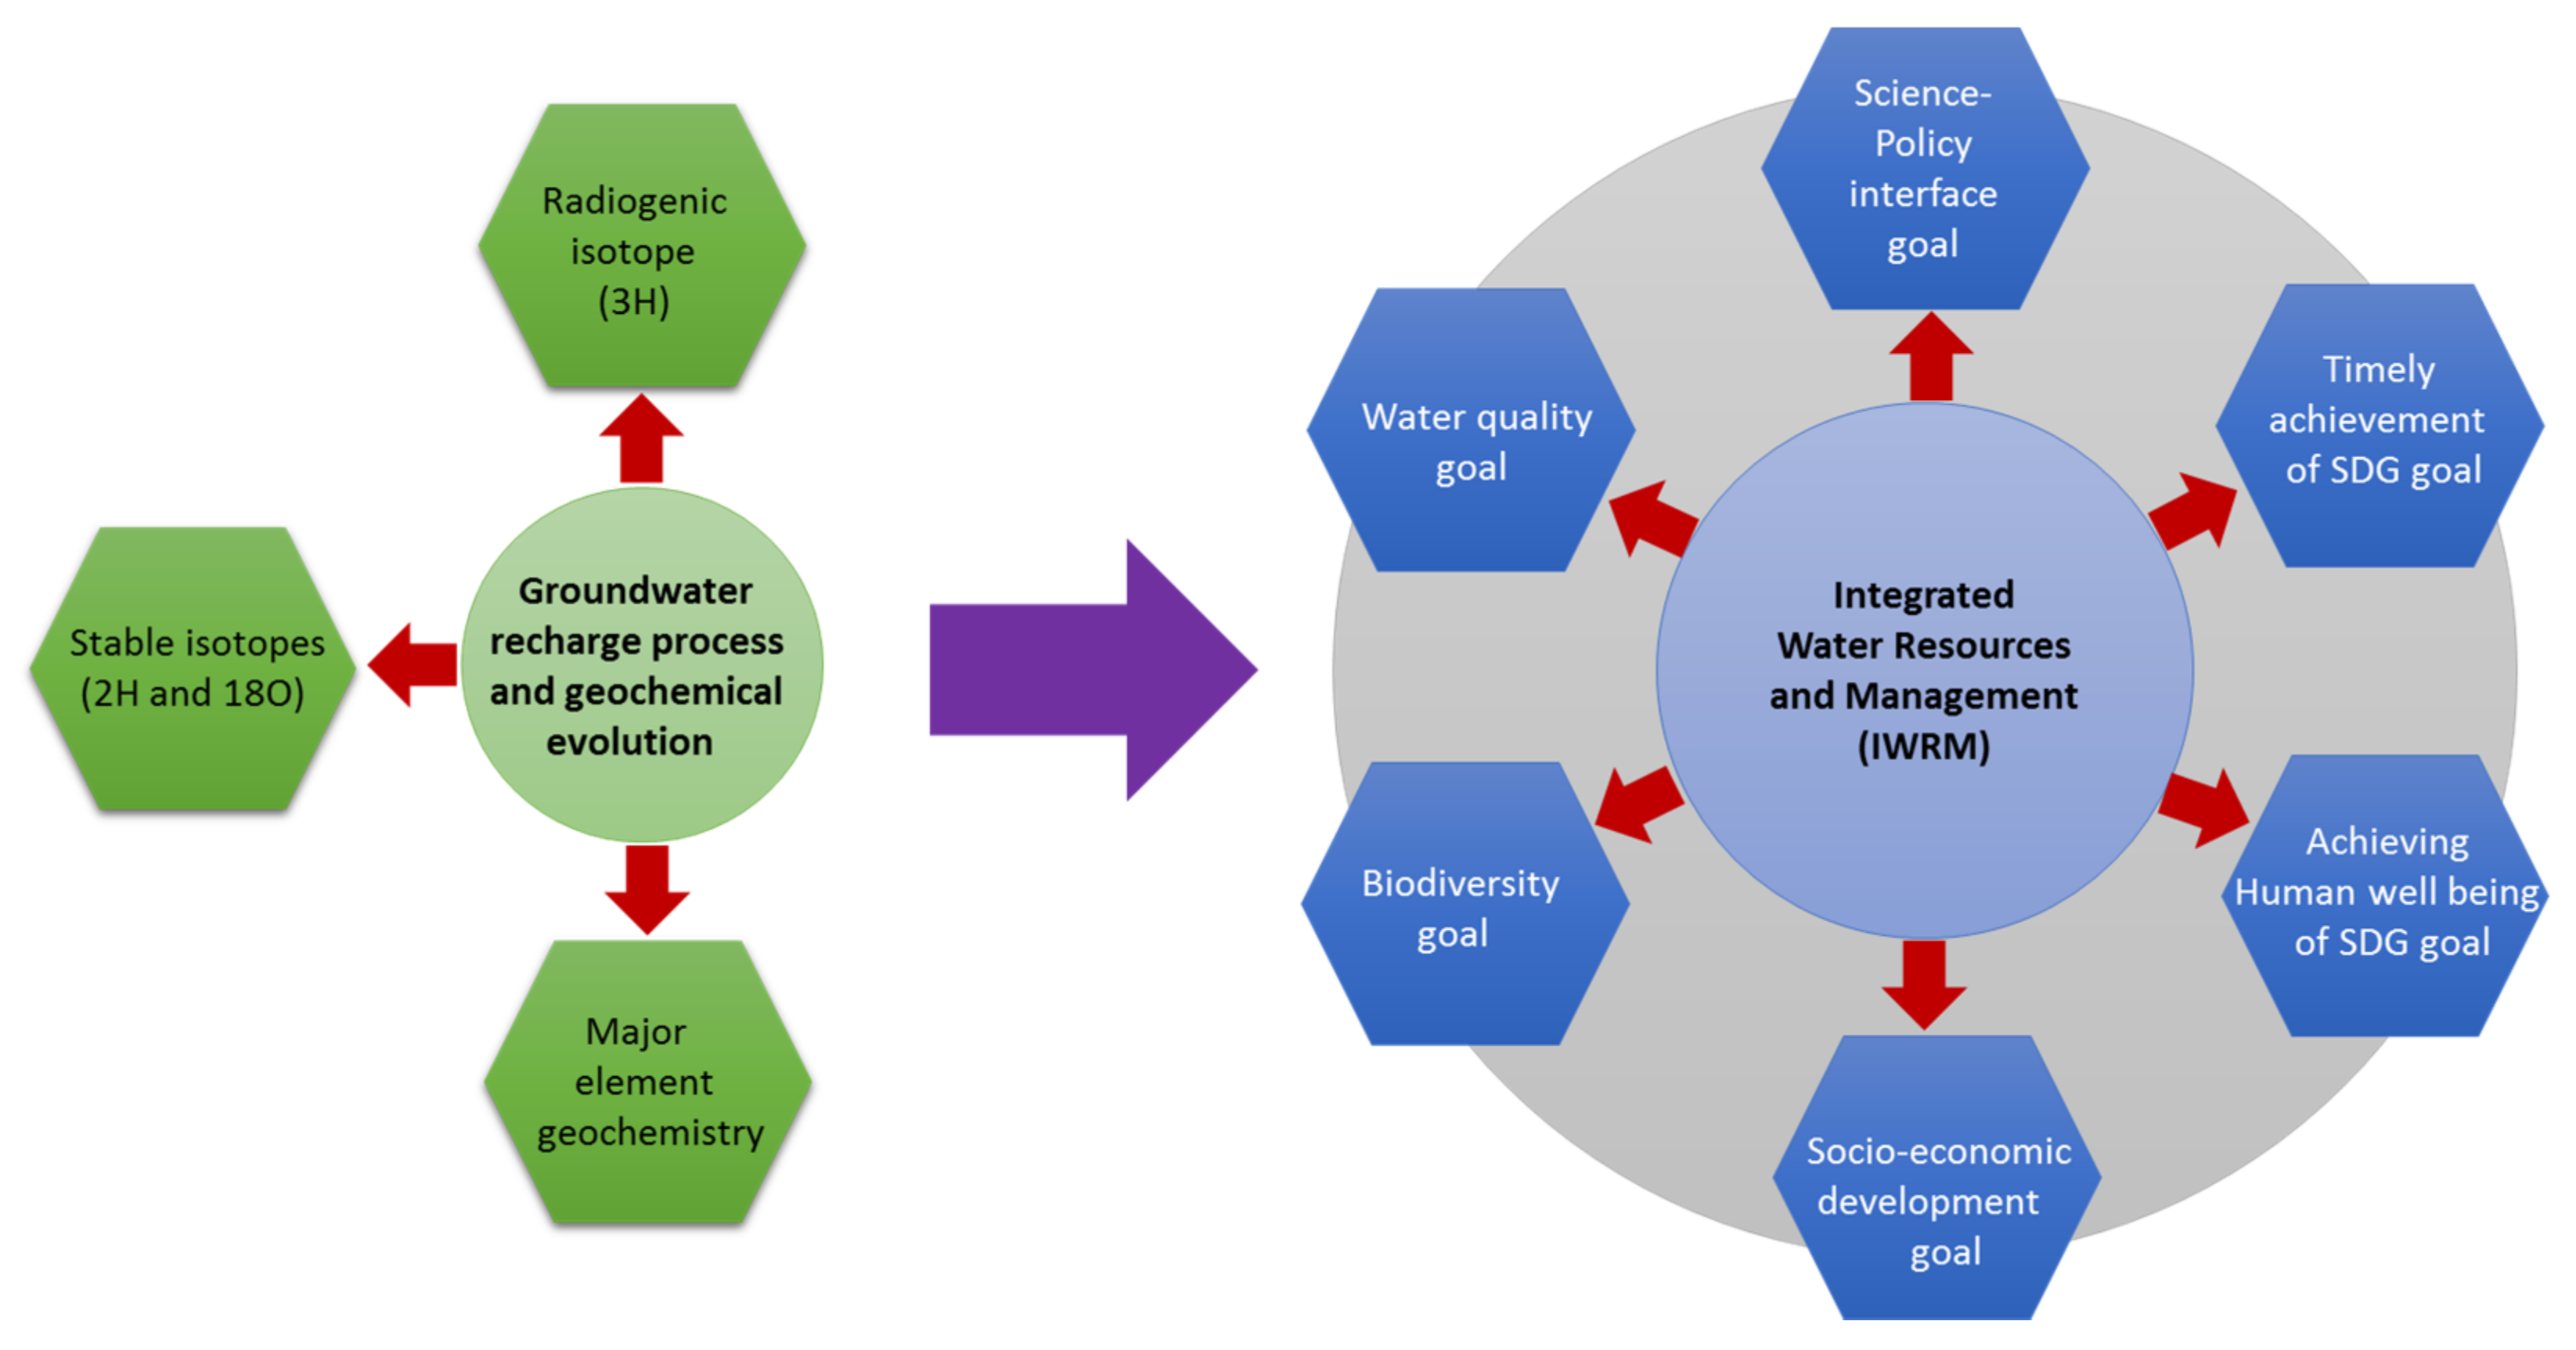
5. Scientific Outcome and Its Policy Relevance for Sustainable Water Resources Management

This study has not only given mere value for scientific investigation but also an open door for policymakers’ or decision-makers’ interventions by achieving different objectives, as shown in Figure 14. One of the dimensions is to hasten the process of SDGs targets in a timely manner. Although there are 16 sustainable development goals (SDGs), all the goals are interlinked, and accessing water management is vital for achieving all the goals. For the second dimension, robust science is necessary for designing for better policy in arid/semi-arid regions; that is why this kind of scientific evidence will open pathways for better science–policy interlinkages. For the third dimension, water always proved to be a limiting factor for socio-economic growth in a holistic manner, especially in water-scarce or water-shortage regions such as arid/semi-arid areas. This study will be proved crucial for laying a good foundation for management policies. Furthermore, this study also helps to achieve a better bio-diversity management plan or global Aichi target.

6. Conclusions

Based on hydrogeochemical parameters and isotopic composition, the study was carried out to understand the various geochemical processes that were subjected to hydrogeochemical evolution in a structurally controlled area. The environmental isotopes (δ18O, δ2H, and 3H) of groundwater samples were analyzed to identify the source of groundwater and the hydrological process for groundwater recharge. In groundwater, Ca2+ is the dominated cation followed by Na+, Mg2+, and K+, whereas from the anionic category, HCO3 is dominant with a gradual decrease in the concentration of Cl, SO42−, and NO3. The interaction of groundwater with the aquifer matrix is a common phenomenon for the different ionic distribution in the different aquifer systems. To understand the hydrogeochemical pattern from recharge to discharge areas, hydrochemical facies was plotted. All samples are majorly represented by two types of hydrochemical facies, i.e., Ca-HCO3 and Mixed Ca-Na-HCO3, which are collected from fractured granite and mafic granulite. The chemical behavior of groundwater is different, as it moves from one point to another. Initially, the groundwater shows Ca-HCO3 facies in both granites and granulites as it gets recharged by rainfall. As soon as it moves further, mixed Ca-Na-HCO3 type hydrochemical facies are observed. In fractured granite and mafic granulite, groundwater is represented by Ca-Na-HCO3 and Mg (Ca)-Na-HCO3, respectively, which is due to the chemical weathering of silicate minerals. It is also supported by Gibb’s rock–water interaction plot. Along with chemical weathering, ion exchange is also responsible for controlling the groundwater chemistry, in which the Na releases with the replacement of Ca during the early stage of groundwater movement. Gradually, the Ca and Mg replace Na by a reversible ion exchange process.
The stable isotopic (δ18O and δ2H) composition of groundwater reveals that rainfall is the primary source of the groundwater recharge and shows more depletion value in the recharge area as compared to discharge. Furthermore, the enriched isotopic composition δ18O > 5‰and low d-excess value (<10‰) indicate that the groundwater is subjected to evaporation before it recharges. The radiogenic isotope (3H) concentration shows that the study basin is predominantly modern groundwater (<8–10 years) and mixed-type sub-modern to modern groundwater age (30–40 years). Furthermore, the modern recharge is linked to the presence of different structural components i.e., secondary faults, fractures, and shear zones that circulate the precipitation into the subsurface groundwater system. As a way forward, the study recommends hydrological simulation-related studies or detailed policy-relevant studies to achieve water security in the present study area or areas with similar climatic and geographical characteristics.

Supplementary Materials

The following supporting information can be downloaded at: https://www.mdpi.com/article/10.3390/w14030315/s1, Table S1. Physicochemical and isotopic results of groundwater samples collected during post-monsoon season from Ambaji Basin (NW India) (December 2017)

Author Contributions

Writing—original draft, R.M.P.; reviewing and editing, R.M.P., A.K.B., S.K., P.K. and T.K.B.; methodology, R.M.P. and A.K.B.; supervision, T.K.B., S.K. and P.K.; data collection and conceptualization, R.M.P. All authors have read and agreed to the published version of the manuscript.

Funding

This work was supported by the Ministry of Earth Sciences (MoES), Govt. of India [MoES/P.O (Geosci)/50/2015].

Institutional Review Board Statement

Not applicable.

Informed Consent Statement

Not applicable.

Data Availability Statement

The data presented in this study are available on request from the corresponding author.

Acknowledgments

Rudra Mohan Pradhan thanks the IRCC IIT Bombay and Ministry of Earth Sciences (MoES), Govt. of India for the financial support to carry out this work as part of the Ph.D. Thesis. TK Biswal is thankful to the MoES, Govt. of India for the sponsored Aquifer mapping project (Project no. MoES/P.O (Geosci)/50/2015). We are thankful to the Department of Earth Sciences, IIT Bombay and Hydrological Investigation Division, NIH Roorkee for providing the necessary laboratory facilities to carry out the analyses.

Conflicts of Interest

The authors declare no conflict of interest.

References

  1. Taylor, R.G.; Todd, M.C.; Kongola, L.; Maurice, L.; Nahozya, E.; Sanga, H.; MacDonald, A.M. Evidence of the dependence of groundwater resources on extreme rainfall in East Africa. Nat. Clim. Chang. 2013, 3, 374–378. [Google Scholar] [CrossRef] [Green Version]
  2. Singhal, B.; Gupta, R. Applied Hydrogeology of Fractured Rocks, 2nd ed.; Springer: Berlin/Heidelberg, Germany, 2010. [Google Scholar]
  3. Sun, Z.; Ma, R.; Wang, Y.; Ma, T.; Liu, Y. Using isotopic, hydrogeochemical-tracer and temperature data to characterize recharge and flow paths in a complex karst groundwater flow system in northern China. Hydrogeol. J. 2016, 24, 1393–1412. [Google Scholar] [CrossRef]
  4. Sreedevi, P.D.; Sreekanth, P.D.; Reddy, D.V. Recharge environment and hydrogeochemical processes of groundwater in a crystalline aquifer in South India. Int. J. Environ. Sci. Technol. 2021, 1–18. [Google Scholar] [CrossRef]
  5. Wright, E.P. The hydrogeology of crystalline basement aquifers in Africa. Geol. Soc. Lond. Spec. Publ. 1992, 66, 1–27. [Google Scholar] [CrossRef]
  6. Banks, D.; Odling, N.E.; Skarphagen, H.; Rohr-Torp, E. Permeability and stress in crystalline rocks. Terra Nova 1996, 8, 223–235. [Google Scholar] [CrossRef]
  7. Dewandel, B.; Lachassagne, P.; Wyns, R.; Maréchal, J.C.; Krishnamurthy, N.S. A generalized 3-D geological and hydrogeological conceptual model of granite aquifers controlled by single or multiphase weathering. J. Hydrol. 2006, 330, 260–284. [Google Scholar] [CrossRef]
  8. Guihéneuf, N.; Boisson, A.; Bour, O.; Dewandel, B.; Perrin, J.; Dausse, A.; Viossanges, M.; Chandra, S.; Ahmed, S.; Maréchal, J.C. Groundwater flows in weathered crystalline rocks: Impact of piezometric variations and depth dependent fracture connectivity. J. Hydrol. 2014, 511, 320–334. [Google Scholar] [CrossRef]
  9. Elango, L.; Kannan, R.; Kumar, M.S. Major ion chemistry and identification of hydrogeochemical processes of ground water in a part of Kancheepuram district, Tamil Nadu, India. Environ. Geosci. 2003, 10, 157–166. [Google Scholar]
  10. Pradhan, R.M.; Biswal, T.K. Fluoride in groundwater: A case study in Precambrian terranes of Ambaji region, North Gujarat, India. Proc. Int. Assoc. Hydrol. Sci. 2018, 379, 351–356. [Google Scholar] [CrossRef] [Green Version]
  11. Freeze, R.A.; Cherry, J.A. Groundwater (No. 629.1 F7); Prentice-Hall: Englewood Cliffs, NJ, USA, 1979. [Google Scholar]
  12. Domenico, P.A.; Schwartz, F.W. Physical and Chemical Hydrogeology; Wiley: New York, NY, USA, 1998. [Google Scholar]
  13. Kortatsi, B.K. Hydrochemical framework of groundwater in the Ankobra Basin, Ghana. Aquat. Geochem. 2007, 13, 41–74. [Google Scholar] [CrossRef]
  14. Ako, A.A.; Shimada, J.; Hosono, T.; Ichiyanagi, K.; Nkeng, G.E.; Eyong, G.E.T.; Roger, N.N. Hydrogeochemical and isotopic characteristics of groundwater in Mbanga, Njombe and Penja (Banana Plain)–Cameroon. J. Afr. Earth Sci. 2012, 75, 25–36. [Google Scholar] [CrossRef]
  15. Rosen, M.R.; Jones, S. Controls on the groundwater composition of the Wanaka and Wakatipu basins, Central Otago, New Zealand. Hydrogeol. J. 1998, 6, 264–281. [Google Scholar]
  16. Tirumalesh, K.; Shivanna, K.; Sriraman, A.K.; Tyagi, A.K. Assessment of quality and geochemical processes occurring in groundwaters near central air conditioning plant site in Trombay, Maharashtra, India. Environ. Monit. Assess. 2010, 163, 171–184. [Google Scholar] [CrossRef] [PubMed]
  17. Roy, A.; Keesari, T.; Mohokar, H.; Pant, D.; Sinha, U.K.; Mendhekar, G.N. Geochemical evolution of groundwater in hard-rock aquifers of South India using statistical and modelling techniques. Hydrol. Sci. J. 2020, 65, 951–968. [Google Scholar] [CrossRef]
  18. He, J.; Ma, J.; Zhang, P.; Tian, L.; Zhu, G.; Edmunds, W.M. Groundwater recharge environments and hydrogeochemical evolution in the Jiuquan Basin, Northwest China. J. Appl. Geochem. 2012, 27, 866–878. [Google Scholar] [CrossRef]
  19. Maréchal, J.C.; Selles, A.; Dewandel, B.; Boisson, A.; Perrin, J.; Ahmed, S. An observatory of groundwater in crystalline rock aquifers exposed to a changing environment: Hyderabad, India. Vadose Zone J. 2018, 17, 1–14. [Google Scholar] [CrossRef] [Green Version]
  20. Sami, K. Recharge mechanisms and geochemical processes in a semi-arid sedimentary basin, Eastern Cape, South Africa. J. Hydrol. 1992, 139, 27–48. [Google Scholar] [CrossRef]
  21. Gat, J. Oxygen and hydrogen isotopes in the hydrologic cycle. Annu. Rev. Earth Planet. Sci. 1996, 24, 225–262. [Google Scholar] [CrossRef] [Green Version]
  22. Jeelani, G.; Lone, S.A.; Nisa, A.U.; Deshpande, R.D.; Padhya, V. Use of stable water isotopes to identify and estimate the sources of groundwater recharge in an alluvial aquifer of Upper Jhelum Basin (UJB), western Himalayas. Hydrol. Sci. J. 2021, 66, 2330–2339. [Google Scholar] [CrossRef]
  23. Kalbus, E.; Reinstorf, F.; Schirmer, M. Measuring methods for groundwater–surface water interactions: A review. Hydrol. Earth Syst. Sci. 2006, 10, 873–887. [Google Scholar] [CrossRef] [Green Version]
  24. Mahlangu, S.; Lorentz, S.; Diamond, R.; Dippenaar, M. Surface water-groundwater interaction using tritium and stable water isotopes: A case study of Middelburg, South Africa. J. African Earth Sci. 2020, 171, 103886. [Google Scholar] [CrossRef]
  25. De Vries, J.J.; Simmers, I. Groundwater recharge: An overview of processes and challenges. Hydrogeol. J. 2002, 10, 5–17. [Google Scholar] [CrossRef]
  26. Sukhija, B.S.; Reddy, D.V.; Nagabhushanam, P.; Bhattacharya, S.K.; Jani, R.A.; Kumar, D. Characterisation of recharge processes and groundwater flow mechanisms in weathered-fractured granites of Hyderabad (India) using isotopes. Hydrogeol. J. 2006, 14, 663–674. [Google Scholar] [CrossRef]
  27. Oiro, S.; Comte, J.C.; Soulsby, C.; Walraevens, K. Using stable water isotopes to identify spatio-temporal controls on groundwater recharge in two contrasting East African aquifer systems. Hydrol. Sci. J. 2018, 63, 862–877. [Google Scholar] [CrossRef]
  28. Sukhija, B.S.; Reddy, D.V.; Nagabhushanam, P. Isotopic fingerprints of paleoclimates during the last 30,000 years in deep confined groundwaters of Southern India. Quat. Res. 1998, 50, 252–260. [Google Scholar] [CrossRef]
  29. Negrel, P.; Pauwels, H.; Dewandel, B.; Gandolfi, J.M.; Mascré, C.; Ahmed, S. Understanding groundwater systems and their functioning through the study of stable water isotopes in a hard-rock aquifer (Maheshwaram watershed, India). J. Hydrol. 2011, 397, 55–70. [Google Scholar] [CrossRef] [Green Version]
  30. Chen, J.Y.; Tang, C.Y.; Shen, Y.J.; Sakura, Y.; Kondoh, A.; Shimada, J. Use of water balance calculation and tritium to examine the dropdown of groundwater table in the piedmont of the North China Plain (NCP). J. Environ. Geol. 2003, 44, 564–571. [Google Scholar] [CrossRef]
  31. Price, R.M.; Top, Z.; Happell, J.D.; Swart, P.K. Use of tritium and helium to define groundwater flow conditions in Everglades National Park. Water Resour. Res. 2003, 39, 1267. [Google Scholar] [CrossRef]
  32. Moran, J.E.; Hudson, G.B. Using Groundwater Age and Other Isotopic Signatures to Delineate Groundwater Flow and Stratification (No. UCRL-PROC-215146); Lawrence Livermore National Lab. (LLNL): Livermore, CA, USA, 2005. [Google Scholar]
  33. Krishan, G.; Kumar, B.; Sudarsan, N.; Rao, M.S.; Ghosh, N.C.; Taloor, A.K.; Bhattacharya, P.; Singh, S.; Kumar, C.P.; Sharma, A.; et al. Isotopes (δ18O, δD and 3H) variations in groundwater with emphasis on salinization in the State of Punjab, India. Sci. Total Environ. 2021, 789, 148051. [Google Scholar] [CrossRef]
  34. Kohfahl, C.; Sprenger, C.; Herrera, J.B.; Meyer, H.; Chacon, F.F.; Pekdeger, A. Recharge sources and hydrogeochemical evolution of groundwater in semiarid and karstic environments: A field study in the Granada Basin (Southern Spain). J. Appl. Geochem. 2008, 23, 846–862. [Google Scholar] [CrossRef] [Green Version]
  35. Joshi, S.K.; Rai, S.P.; Sinha, R.; Gupta, S.; Densmore, A.L.; Rawat, Y.S.; Shekhar, S. Tracing groundwater recharge sources in the northwestern Indian alluvial aquifer using water isotopes (δ18O, δ2H and 3H). J. Hydrol. 2018, 559, 835–847. [Google Scholar] [CrossRef]
  36. Khayat, S.; Marei, A.; Hippler, D.; Barghouthi, Z.; Dietzel, M. Using environmental isotopes to investigate the groundwater recharge mechanisms and dynamics in the North-eastern Basin, Palestine. Hydrol. Sci. J. 2020, 65, 583–596. [Google Scholar] [CrossRef]
  37. Kumar, S.; Joshi, S.K.; Pant, N.; Singh, S.; Chakravorty, B.; Saini, R.K.; Kumar, V.; Singh, A.; Ghosh, N.C.; Mukherjee, A.; et al. Hydrogeochemical evolution and groundwater recharge processes in arsenic enriched area in central Gangetic plain, India. J. Appl. Geochem. 2021, 131, 105044. [Google Scholar] [CrossRef]
  38. Pradhan, R.M.; Guru, B.; Pradhan, B.; Biswal, T.K. Integrated multi-criteria analysis for groundwater potential mapping in Precambrian hard rock terranes (North Gujarat), India. Hydrol. Sci. J. 2021, 66, 961–978. [Google Scholar] [CrossRef]
  39. Singh, Y.K.; De Waele, B.; Karmakar, S.; Sarkar, S.; Biswal, T.K. Tectonic setting of the Balaram-Kui-Surpagla-Kengora granulites of the South Delhi Terrane of the Aravalli Mobile Belt, NW India and its implication on correlation with the East African Orogen in the Gondwana assembly. Precambrian Res. 2010, 183, 669–688. [Google Scholar] [CrossRef]
  40. Epstein, S.; Mayeda, T. Variation of O18 content of waters from natural sources. Geochim. Cosmochim. Acta 1953, 4, 213–224. [Google Scholar] [CrossRef]
  41. Behera, A.K.; Chakrapani, G.J.; Kumar, S.; Rai, N. Identification of seawater intrusion signatures through geochemical evolution of groundwater: A case study based on coastal region of the Mahanadi delta, Bay of Bengal, India. Nat. Hazards 2009, 97, 1209–1230. [Google Scholar] [CrossRef]
  42. Ahmed, A.; Clark, I. Groundwater flow and geochemical evolution in the Central Flinders Ranges, South Australia. Sci. Total Environ. 2016, 572, 837–851. [Google Scholar] [CrossRef]
  43. Pant, N.; Rai, S.P.; Singh, R.; Kumar, S.; Saini, R.K.; Purushothaman, P.; Nijesh, P.; Rawat, Y.S.; Sharma, M.; Pratap, K. Impact of geology and anthropogenic activities over the water quality with emphasis on fluoride in water scarce Lalitpur district of Bundelkhand region, India. Chemosphere 2021, 279, 130496. [Google Scholar] [CrossRef]
  44. Marei, A.; Khayat, S.; Weise, S.; Ghannam, S.; Sbaih, M.; Geyer, S. Estimating groundwater recharge using the chloride mass-balance method in the West Bank, Palestine. Hydrol. Sci. J. 2010, 55, 780–791. [Google Scholar] [CrossRef]
  45. Naranjo, G.; Cruz-Fuentes, T.; Cabrera, M.D.C.; Custodio, E. Estimating natural recharge by means of chloride mass balance in a volcanic aquifer: Northeastern Gran Canaria (Canary Islands, Spain). Water 2015, 7, 2555–2574. [Google Scholar] [CrossRef] [Green Version]
  46. Karlović, I.; Marković, T.; Vujnović, T. Groundwater Recharge Assessment Using Multi Component Analysis: Case Study at the NW Edge of the Varaždin Alluvial Aquifer, Croatia. Water 2022, 14, 42. [Google Scholar] [CrossRef]
  47. BIS. Bureau of Indian Standards Specification for Drinking Water; IS: 10500:91. Revised 2003; Bureau of Indian Standards: New Delhi, India, 2003. [Google Scholar]
  48. Jakóbczyk-Karpierz, S.; Sitek, S.; Jakobsen, R.; Kowalczyk, A. Geochemical and isotopic study to determine sources and processes affecting nitrate and sulphate in groundwater influenced by intensive human activity-carbonate aquifer Gliwice (southern Poland). J. Appl. Geochem. 2017, 76, 168–181. [Google Scholar] [CrossRef]
  49. Gómez-Alday, J.J.; Hussein, S.; Arman, H.; Alshamsi, D.; Murad, A.; Elhaj, K.; Aldahan, A. A multi-isotopic evaluation of groundwater in a rapidly developing area and implications for water management in hyper-arid regions. Sci. Total Environ. 2022, 805, 150245. [Google Scholar] [CrossRef]
  50. Appelo, C.A.J.; Postma, D. Geochemistry, Groundwater and Pollution, 2nd ed.; Appelo, C.A.J., Postma, D., Eds.; CRC Press: Boca Raton, FL, USA, 2005. [Google Scholar]
  51. Lasaga, A.C. Chemical kinetics of water-rock interactions. J. Geophys. Res. Solid Earth 1984, 89, 4009–4025. [Google Scholar] [CrossRef]
  52. Lee, B.D.; Oh, Y.H.; Cho, B.W.; Yun, U.; Choo, C.O. Hydrochemical properties of groundwater used for Korea bottled waters in relation to geology. Water 2019, 11, 1043. [Google Scholar] [CrossRef] [Green Version]
  53. Piper, A.M. A graphic procedure in the geochemical interpretation of water-analyses. Eos Trans. Am. Geophys. Union 1944, 25, 914–928. [Google Scholar] [CrossRef]
  54. Gascoyne, M. Hydrogeochemistry, groundwater ages and sources of salts in a granitic batholith on the Canadian Shield, southeastern Manitoba. J. Appl. Geochem. 2004, 19, 519–560. [Google Scholar] [CrossRef]
  55. Srinivasamoorthy, K.; Gopinath, M.; Chidambaram, S.; Vasanthavigar, M.; Sarma, V.S. Hydrochemical characterization and quality appraisal of groundwater from Pungar sub basin, Tamilnadu, India. J. King Saud Univ. Sci. 2014, 26, 37–52. [Google Scholar] [CrossRef] [Green Version]
  56. Rao, N.S.; Rao, V.G.; Gupta, C.P. Groundwater pollution due to discharge of industrial effluents in Venkatapuram area, Visakhapatnam, Andhra Pradesh, India. Environ. Geol. 1998, 33, 289–294. [Google Scholar]
  57. Luo, W.; Gao, X.; Zhang, X. Geochemical processes controlling the groundwater chemistry and fluoride contamination in the Yuncheng Basin, China—An area with complex hydrogeochemical conditions. PLoS ONE 2018, 13, e0199082. [Google Scholar] [CrossRef] [PubMed]
  58. Cederstrom, D.J. Genesis of ground waters in the Coastal Plain of Virginia. Econ. Geol. 1946, 41, 218–245. [Google Scholar] [CrossRef]
  59. Rajmohan, N.; Elango, L. Identification and evolution of hydrogeochemical processes in the groundwater environment in an area of the Palar and Cheyyar River Basins, Southern India. Environ. Geol. 2004, 46, 47–61. [Google Scholar] [CrossRef]
  60. Abdalla, F.A.; Scheytt, T. Hydrochemistry of surface water and groundwater from a fractured carbonate aquifer in the Helwan area, Egypt. J. Earth Syst. Sci. 2012, 121, 109–124. [Google Scholar] [CrossRef]
  61. Sunkari, E.D.; Abu, M.; Zango, M.S. Geochemical evolution and tracing of groundwater salinization using different ionic ratios, multivariate statistical and geochemical modeling approaches in a typical semi-arid basin. J. Contam. Hydrol. 2021, 236, 103742. [Google Scholar] [CrossRef] [PubMed]
  62. Mukherjee, A.; Fryar, A.E.; Rowe, H.D. Regional-scale stable isotopic signatures of recharge and deep groundwater in the arsenic affected areas of West Bengal, India. J. Hydrol. 2007, 334, 151–161. [Google Scholar] [CrossRef]
  63. Nandakumaran, P.; Balakrishnan, K. Groundwater quality variations in Precambrian hard rock aquifers: A case study from Kerala, India. Appl. Water Sci. 2020, 10, 1–13. [Google Scholar] [CrossRef] [Green Version]
  64. Parkhurst, D.L.; Appelo, C.A.J. User’s Guide to PHREEQC (Version 2)—A Computer Program for Speciation, Batch-Reaction, One-Dimensional Transport, and Inverse Geochemical Calculations; Water Resources Investigations Report 99-4259; United States Geological Survey: Washington, DC, USA, 1999. [Google Scholar]
  65. Drever, J.I. The Geochemistry of Natural Waters: Surface and Groundwater Environments, 3rd ed.; Prentice Hall: New York, NY, USA, 1997. [Google Scholar]
  66. Craig, H. Isotopic variation in meteoric waters. Science 1961, 133, 1702–1703. [Google Scholar] [CrossRef]
  67. Kumar, P.; Kumar, A.; Singh, C.K.; Saraswat, C.; Avtar, R.; Ramanathan, A.L.; Herath, S. Hydrogeochemical evolution and appraisal of groundwater quality in Panna District, Central India. Expo. Health 2016, 8, 19–30. [Google Scholar] [CrossRef]
  68. Gupta, S.K.; Deshpande, R.D. Groundwater isotopic investigations in India: What has been learned? Curr. Sci. 2005, 89, 825–835. [Google Scholar]
  69. Rao, S.M. Practical Isotope Hydrology; New India Publishing: New Delhi, India, 2006. [Google Scholar]
  70. Schlosser, P.; Stute, M.; Sonntag, C.; Münnich, K.O. Tritiogenic 3He in shallow groundwater. Earth Planet. Sci. Lett. 1989, 94, 245–256. [Google Scholar] [CrossRef]
  71. Clarke, I.D.; Fritz, P. Environmental Isotopes in Hydrogeology; Lewis Publishers: New York, NY, USA, 1997. [Google Scholar]
Figure 1. Geological map of the study area (Ambaji Basin, NW India) and groundwater sampling locations (Pre-monsoon, December 2017). Figure 1 inset showing the major geological terranes of Aravalli Delhi Mobile Belt (ADMB), NW India after GSI, [38].
Water 14 00315 g001
Figure 2. A schematic diagram shows different hydrogeological zones (top-soil, weathered zones, fractured zones, and massive zones) and groundwater circulations in the subsurface.
Water 14 00315 g002
Figure 3. Major ion concentration variation in the study area.
Water 14 00315 g003
Figure 4. Piper trilinear diagram showing major groundwater types and geochemical evolution.
Water 14 00315 g004
Figure 5. Gibbs plot showing geochemical evolution and rock–water interaction mechanisms.
Water 14 00315 g005
Figure 6. Bivariate plots of (a) Ca2+ + Mg2+ vs. Total cation, (b) Na+ + K+ vs. Total cation, (c) HCO3 vs. Ca2+ + Mg2+, (d) HCO3 vs. Ca2+, (e) Ca2+ vs. Mg2+, (f) Ca2+ vs. SO42−.
Water 14 00315 g006
Figure 7. Ionic ratio plot (a) HCO3/Na+ vs. Ca2+/Na+, (b) Mg2+/Na+ vs. Ca2+/Na+ showing the silicate weathering as controlling mechanisms.
Water 14 00315 g007
Figure 8. Plot (a) Ca2+Mg2+-(SO42- + HCO3 vs. Na+−+ K+-(Cl), (b) Na+/Cl vs. Cl showing the reversible ion exchange and evaporation process as the major contributors of Na ions in groundwater at different stages of groundwater evolution.
Water 14 00315 g008
Figure 9. Plot (a) spatial variation of saturation index (SI) with respect to calcite and dolomite, (b) saturation index (SI) vs. Ca2+ + Mg2+ showing the contribution of silicate minerals in fractured granite and mafic granulite through geochemical modeling.
Water 14 00315 g009
Figure 10. A plot of δ2H (‰) versus δ18O (‰) for groundwater resources in Ambaji Basin, North Gujarat (NW India). The Local Meteoric Water Line (LMWL) of North Gujarat and the Global Meteoric Water Line (GMWL) are also shown.
Water 14 00315 g010
Figure 11. Groundwater flow direction map of the study area.
Water 14 00315 g011
Figure 12. Plot of d-excess vs. δ18O (‰) of groundwater samples.
Water 14 00315 g012
Figure 13. Distribution and variation of environmental tritium (3H) content in Ambaji Basin (NW India).
Water 14 00315 g013
Figure 14. Interactive link between groundwater recharge process and geochemical evolution with IWRM and SDG.
Water 14 00315 g014
Table 1. Physicochemical and isotopic results of groundwater samples collected during the post-monsoon season from Ambaji Basin (NW India) (December 2017).
ParameterMinimumMaximumAverage
Units
pH 6.67.386.97
EC(µS)36029801231.5
TDS(mg/L)2161788738.9
Ca2+(mg/L)21.92183.687.04
Mg2+(mg/L)11.94111.2848.97
Na+(mg/L)28.7260.1574.19
K+(mg/L)0.57.272.69
SO42−(mg/L)12.29195.9440.61
Cl(mg/L)16.08425.7105.01
NO3(mg/L)0.61182.4834.34
HCO3(mg/L)125535359.25
δ2H(‰)−41.9−24.51−34.03
δ18O(‰)−6.17−3.23−4.93
d-excess(‰)1.38.115.44
3H(TU)1.9728.055.1
Publisher’s Note: MDPI stays neutral with regard to jurisdictional claims in published maps and institutional affiliations.

