Article

Method Development for Low-Concentration PAHs Analysis in Seawater to Evaluate the Impact of Ship Scrubber Washwater Effluents

1
Department of Marine Environmental Engineering, National Kaohsiung University of Science and Technology, Kaohsiung 81157, Taiwan
2
Department of Safety, Health and Environmental Engineering, National United University, Miaoli 36063, Taiwan
3
Fisheries and Marine Research Station (FaMaRS), College of Fisheries and Allied Sciences, Northern Negros State College of Science and Technology, Sagay City 6122, Philippines
*
Authors to whom correspondence should be addressed.
Water 2022, 14(3), 287; https://doi.org/10.3390/w14030287
Submission received: 11 December 2021 / Revised: 31 December 2021 / Accepted: 17 January 2022 / Published: 19 January 2022
(This article belongs to the Special Issue The Relationship between Ships and Marine Environment)

Abstract

:
A naval ship’s exhaust gas scrubber may discharge polycyclic aromatic hydrocarbons (PAHs) into seawater. Due to the high lipophilicity and low water solubility of PAHs, their concentrations in seawater are extremely low, making them difficult to detect or accurately determine. To accurately assess the impact of scrubber washwater effluent on the PAHs concentration of seawater, appropriate analysis methods must be established. In this study, a large-volume pre-concentration water sampler was used onboard to concentrate PAHs in surface seawater (100 L) from four sites offshore of southern Taiwan. The quantitative and qualitative analysis of dissolved PAHs in seawater and quality control samples were implemented using a GC/MS system with the aid of internal and surrogate standards. Results showed that the field and equipment blank samples of quality control samples were lower than twice the detection limit. The detection limit of individual PAHs is between 0.001 (naphthalene, NA) and 0.014 ng/L (dibenzo[a,h]anthracene, DBA), which meets the requirements for evaluating PAHs in seawater (that is, less than the maximum permissible concentrations (MPCs)). The concentration of total PAHs (TPAHs) in the four seawater samples ranged from 2.297 to 4.001 ng/L and had an average concentration of 3.056 ± 0.727 ng/L. The concentrations of 16 PAHs were determined in each seawater sample, indicating that the analytical method in this study is suitable for the determination of low-concentration PAHs in seawater. Phenanthrene (PHE) is the most dominant compound in seawater samples accounting for 59.6 ± 12.6% of TPAHs, followed by fluorine (FL) accounting for 8.5 ± 3.7%. The contribution of high-ring PAHs to TPAHs is not high (0.5–9.2%), but the observed concentrations can cause a higher risk to aquatic organisms than low-ring PAHs. The diagnostic ratio showed that the sources of PAHs in the seawater collected offshore of southern Taiwan may include mixed sources such as petrogenic, petroleum combustion, and biomass combustion. The results can be used for regular monitoring, which contributes to pollution prevention and management of the marine environment.

1. Introduction

Polycyclic aromatic hydrocarbons (PAHs) are a kind of persistent organic pollutants which are ubiquitous in the marine environment. They are toxic, mutagenic, carcinogenic, and bioaccumulative [1,2]. Therefore, the US Environmental Protection Agency (US EPA) has identified 16 PAHs as priority environmental pollutants. The PAHs in the marine environment are mainly imported by human activities and can be divided into petrogenic and pyrogenic sources [3,4,5]. PAHs of petrogenic sources are mainly low-ring PAHs (LPAHs), which are mainly derived from petroleum, including the input of crude oil and its refined products. On the other hand, PAHs of pyrogenic sources are mainly medium-ring (MPAHs) and high-ring (HPAHs) PAHs. They are mainly produced by incomplete combustion of organic substances [3,5] and enter the marine environment through atmospheric transport and deposition [4,6]. The high lipophilicity and low water solubility of PAHs make them easy to adsorb on organic matter and/or accumulate in the biota after entering the water environment [7]. Although most PAHs may be deposited on the seafloor and stored in sediments, some still exist in the seawater column. In addition, the deposited PAHs may be reintroduced into the water body due to the biological disturbance process or the submarine ocean currents and be reused by the organisms [8]. PAHs in a seawater column can be directly accumulated in marine organisms through the gills or skin and cause potential hazards. PAHs dissolved in seawater are more bioavailable than PAHs in the form of a composite, adsorptant, or particles [9]. Therefore, understanding the concentration of dissolved PAHs in seawater and their potential ecological risks are crucial for marine ecosystems research due to their potential harm even at lower concentrations [7,10].
To reduce air pollution caused by ships burning high-sulfur fuel oil and for improvement of air quality, a new regulation on the upper limit of sulfur content in marine fuel oils in January 2020 was implemented by the International Maritime Organization (IMO). This rule states that ships should use fuel oil with sulfur contents of less than 0.5% by weight, seek for alternative fuels, or install an exhaust gas cleaning system (EGCS) called scrubbers. According to the forecast of the International Energy Agency [11], to comply with this new regulation, about 37% of ships will use low-sulfur fuels, about 40% will use alternative fuels, and about 22% will choose to install scrubbers and continue to use high-sulfur fuels by 2024 [11]. However, the sulfur, particulate matter, and other contaminants (including carcinogens such as PAHs and heavy metals) removed by scrubbers from the ship’s exhaust gases are eventually discharged to the sea in the form of scrubbing water [12,13,14]. This may cause non-biodegradable contaminants (such as PAHs) in the washwater which can accumulate in the marine environment and food web, causing biological hazards [13,14,15]. Moreover, Thor et al. [14] have shown that washwater from the marine scrubber system is highly toxic to zooplanktonic organisms.
At present, it is inappropriate for IMO to use the fluorescence signal characteristics of a single compound phenanthrene as an indicator of all PAHs [12]. Therefore, the Group of Experts on the Scientific Aspects of Marine Environmental Protection (GESAMP) provided IMO with a report on EGCS; the “Report of the GESAMP task team on exhaust gas cleaning systems”. The report suggests that a maximum permissible concentration (MPC) [10] should be used as the scientific basis for assessing the hazards of PAHs to the environment, ecology, and environmental quality. However, the MPC of the dissolved phase in seawater is very low, especially for PAHs with higher ring numbers, such as dibenzo[a,h]anthracene (DBA), whose MPC value is 0.014 ng/L. Due to the limitation of the instruments, the detection limits using general traditional liquid-liquid extraction or relatively low concentration factor may be higher than the MPC value. Therefore, it should be a feasible way to collect large-volume water samples, increase the concentration factor, and prepare samples with higher PAH concentrations for quantitative and qualitative analysis [16,17,18].
In this study, a pre-concentration water sampler was used to collect surface seawaters (100 L) from four different sites offshore southern Taiwan, and quantitatively and qualitatively analysis of the dissolved-phase PAHs in the seawater samples was carried out. In addition, relevant quality control was implemented to confirm that it has not been contaminated during the sampling process, and the accuracy as well as recovery rate of the analytical method were determined. The concentration, composition, and source of PAHs in seawater offshore of southern Taiwan were also discussed. The results of this research can be used for routine monitoring and evaluation of PAHs in seawater, and contribute to the management and prevention of PAHs pollution in the marine environment.

2. Materials and Methods

2.1. Chemicals and Materials

Standards of 16 PAHs (including acenaphthene (ACE), acenaphthylene (ACY), anthracene (AN), benzo[a]anthracene (BaA), benzo[a]pyrene (BaP), benzo[b]fluoranthene (BbF), benzo[g,h,i]perylene (BP), benzo[k]fluoranthene (BkF), chrysene (CH), DBA, fluoranthene (FLU), fluorine (FL), indeno[1,2,3-cd]pyrene (IP), naphthalene (NA), phenanthrene (PHE), and pyrene (PY)) in a 1000 mg/L mixture solution were obtained from AccuStandard Chem. Co. (New Haven, CT, USA). Internal standard (IS) solutions (naphthalene-d8, acenaphthene-d10, phenanthrene-d10, chrysene-d12, and perylene-d12) at 2000 mg/L and surrogate standard (SS) solutions (2-fluorobiphenyl and 4-terphenyl-d14) at 1000 mg/L were purchased from AccuStandard Chem. Co. (New Haven, CT, USA). PAH working standard, IS mixture solutions and SS mixture solutions are appropriately diluted with HPLC grade n-hexane and prepared daily before analysis. The IS and SS were used for sample quantification and procedural recovery analysis. In this study, all solvents and reagents used were chromatographic (HPLC) grade. The glasswares used were rinsed with n-hexane (HPLC grade, Duksan Co., Gyeonggi Province, South Korea) before drying in an oven. Glass fiber filter (GFF: Whatman GF/D, 142 mm id, 3 μm pore size, Cytiva, Buckinghamshire, United Kingdom and Advantec GC-50, 142 mm id, 0.5 μm pore size, Advantec Co., Tokyo, Japan) and polyurethane foam (PUF: Tisch TE1010, 63.5 mm id, 75 mm height, density 0.022 g/cm3, Tisch Environmental Inc., OH, USA) were Soxhlet pre-extracted with acetone: n-hexane (1:1) for 24 h before sample collection to ensure that there were no organic contaminant. All other materials used were pre-washed with ultrapure water (>18.2 MΩ·cm) (Purity-SP; Lotun Technic CO., LTD., Taipei, Taiwan) and acetone (HPLC grade, Duksan Co., Gyeonggi Province, South Korea).

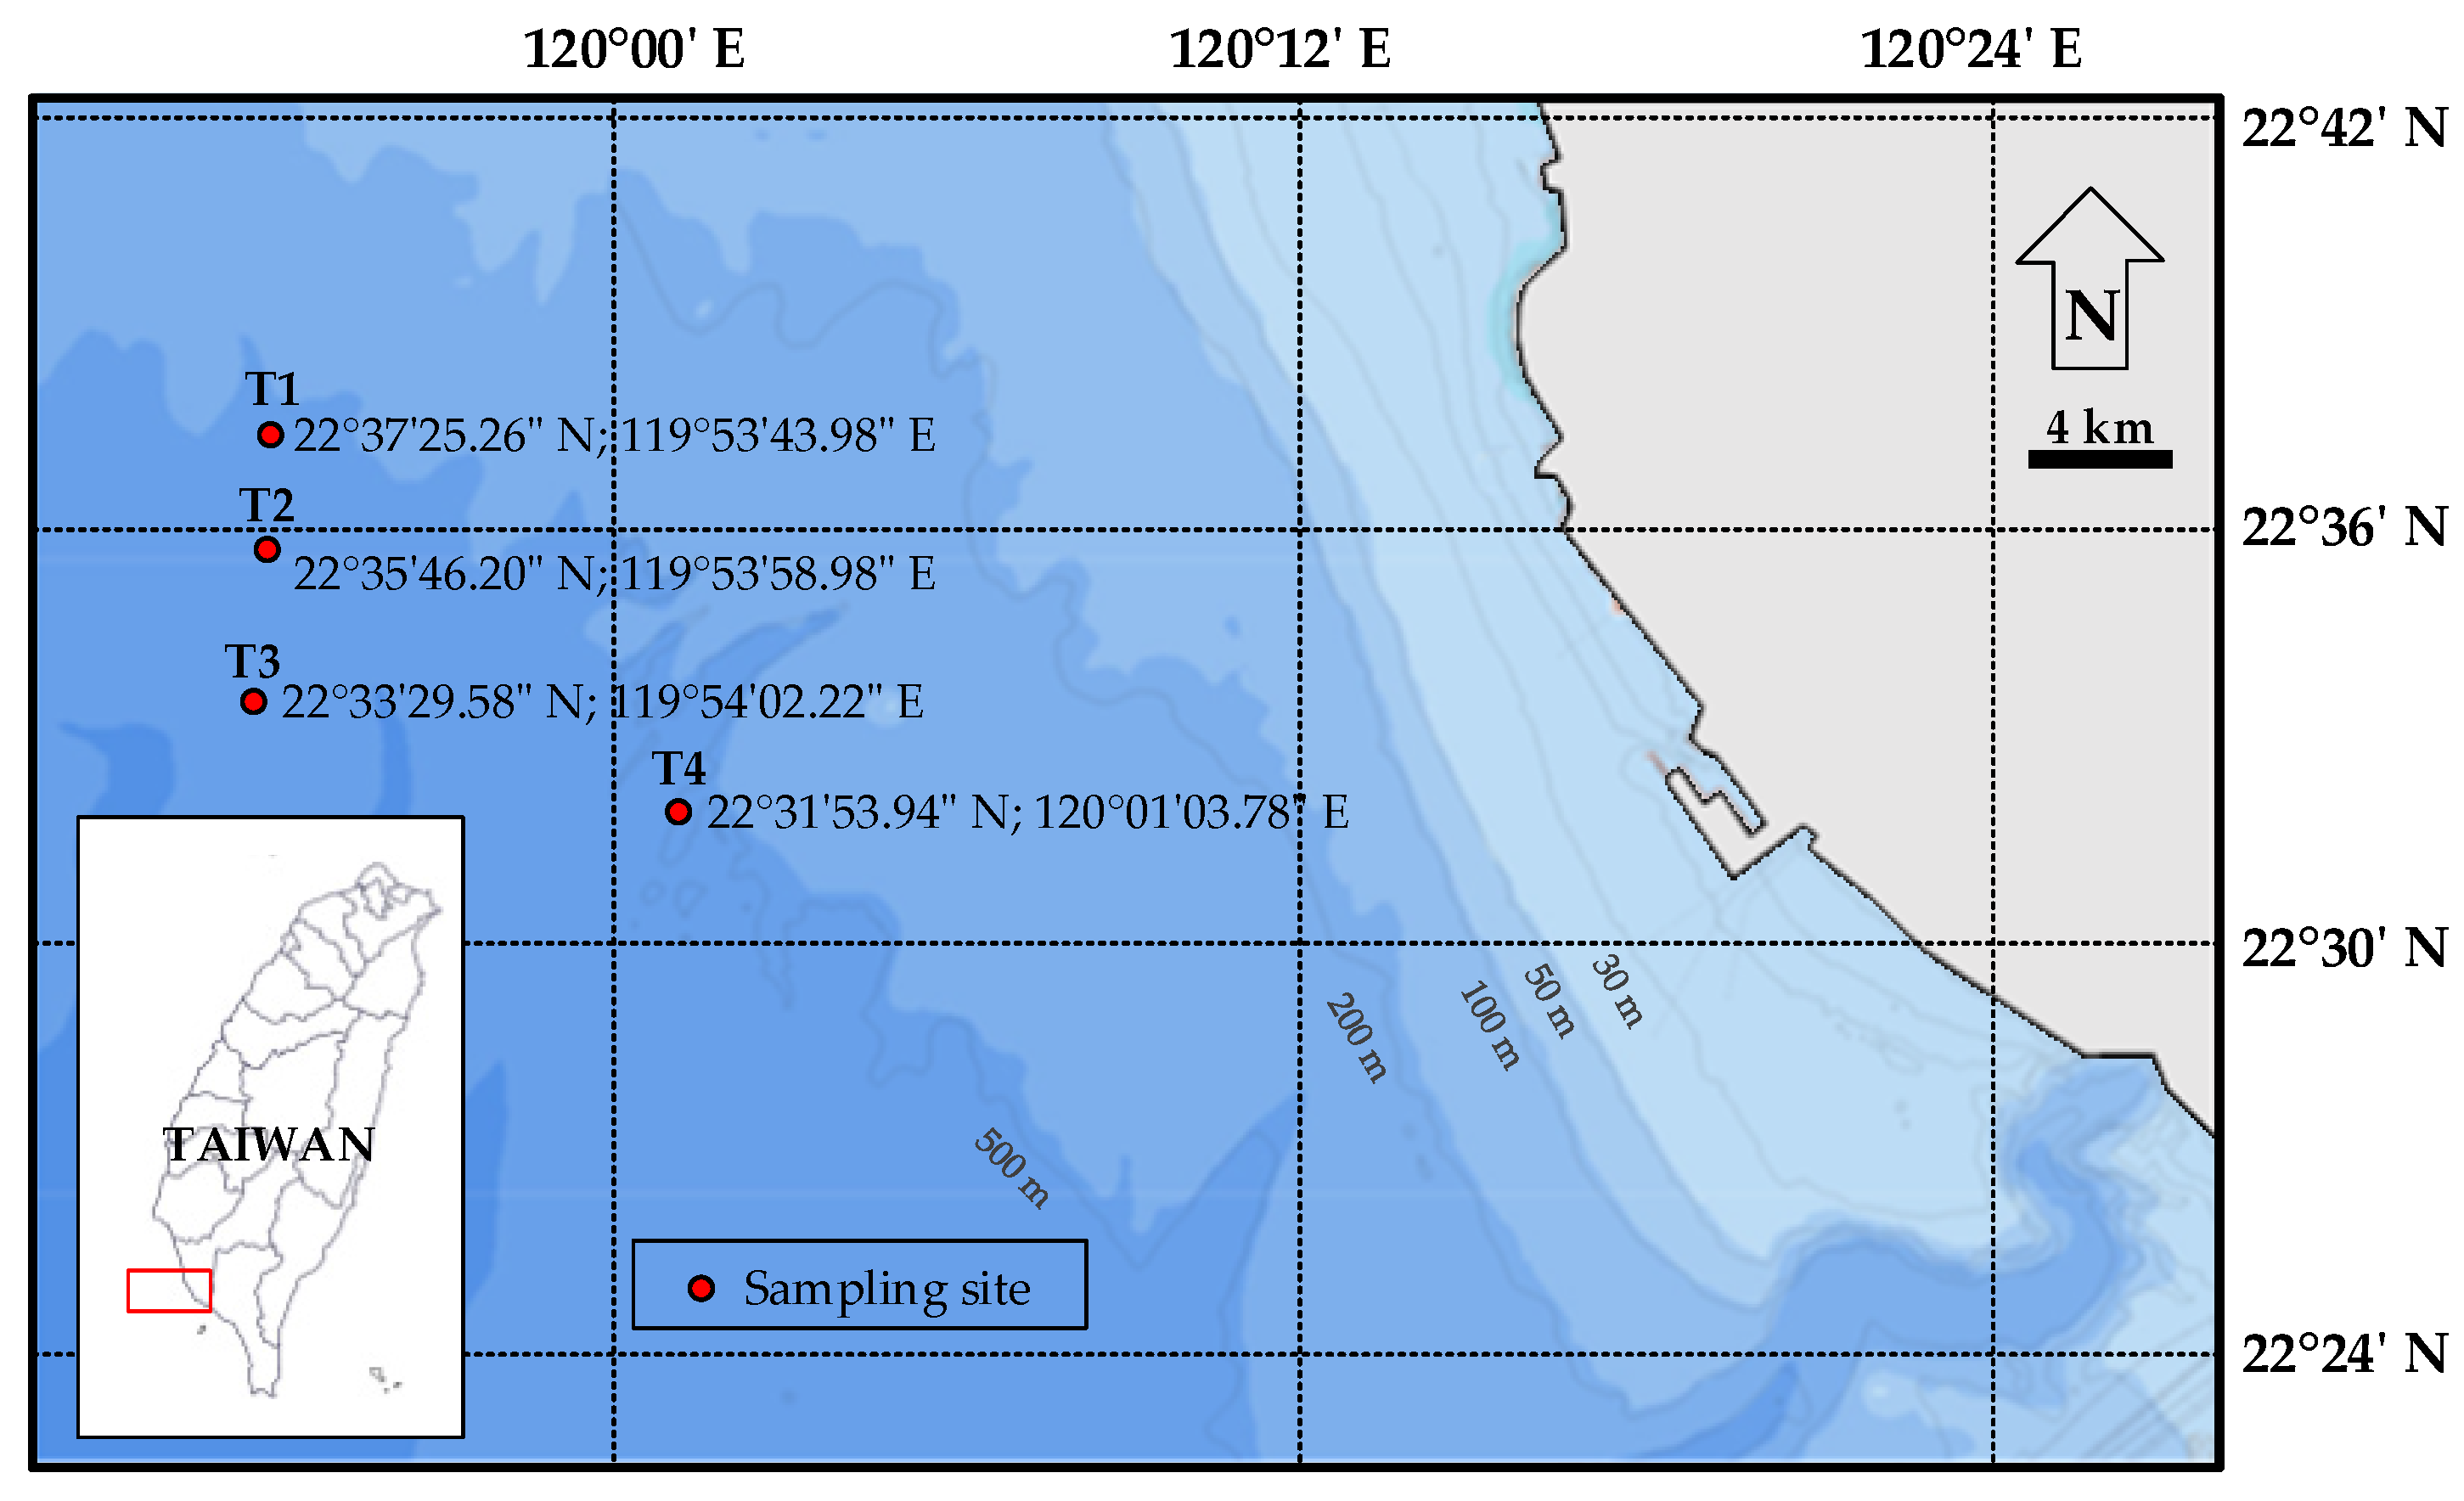
2.2. Sample Collection

In order to accurately measure the low concentrations of PAHs in seawater, large-volume water samples were collected and pre-concentrated on site. Field sampling was carried out from R/V (New Ocean Researcher 3, NOR3-0018) from 9 to 10 August 2020. The surface water from four sampling sites (T1–T4) within 12 nautical miles offshore southern Taiwan were collected (Figure 1). Surface seawater temperature and salinity were measured at all sites, using a SCTD Sea–Bird SBE 21 SeaCAT Thermosalinograph.
About 115 L of seawater was collected by a stainless steel pump and stored in a polished stainless steel airtight container. The 100 L of seawater samples collected in each site were concentrated onboard using a pre-concentration water sampler (Machine Shop, Model G23-027III, Fortelice International Co., Ltd., New Taipei, Taiwan). The pre-concentration water sampler system consists of stainless steel, glass fiber filter case, foam holder, water pump, pressure control switch, liquid level sensor, buffer tank, flow meter and computer controller [19]. The seawater sample passes through the coarse GFF (3 μm pore size), the fine GFF (0.5 μm pore size), and the two PUFs connected in series at a flow rate of about 1 L/min and then discharged. The particles in the seawater are removed by GFF, and the PAHs in the dissolved phase are adsorbed and captured by PUF. All PUF samples were wrapped in aluminum foil paper, placed in a sealed glass jar, and temporarily stored in the refrigerator until they were brought back to the laboratory for further processing. At the sampling site, equipment blank samples, field blank samples, and duplicate samples were prepared respectively. Equipment blank: After each seawater sample was concentrated, 5 L of deionized water was filtered as the equipment blank sample to confirm whether the sampling equipment is contaminated. Field blank: A set of PUF were placed into the sampler without sampling treatments. The PUF were taken out after 100 minutes and placed back into a sealed glass bottle as field blank sample. Duplicate samples: Duplicate (2 × 115 L) samples were collected at T1, T2, and T4 sites for repeated analysis to confirm the precision of the sampling and analytical methods.

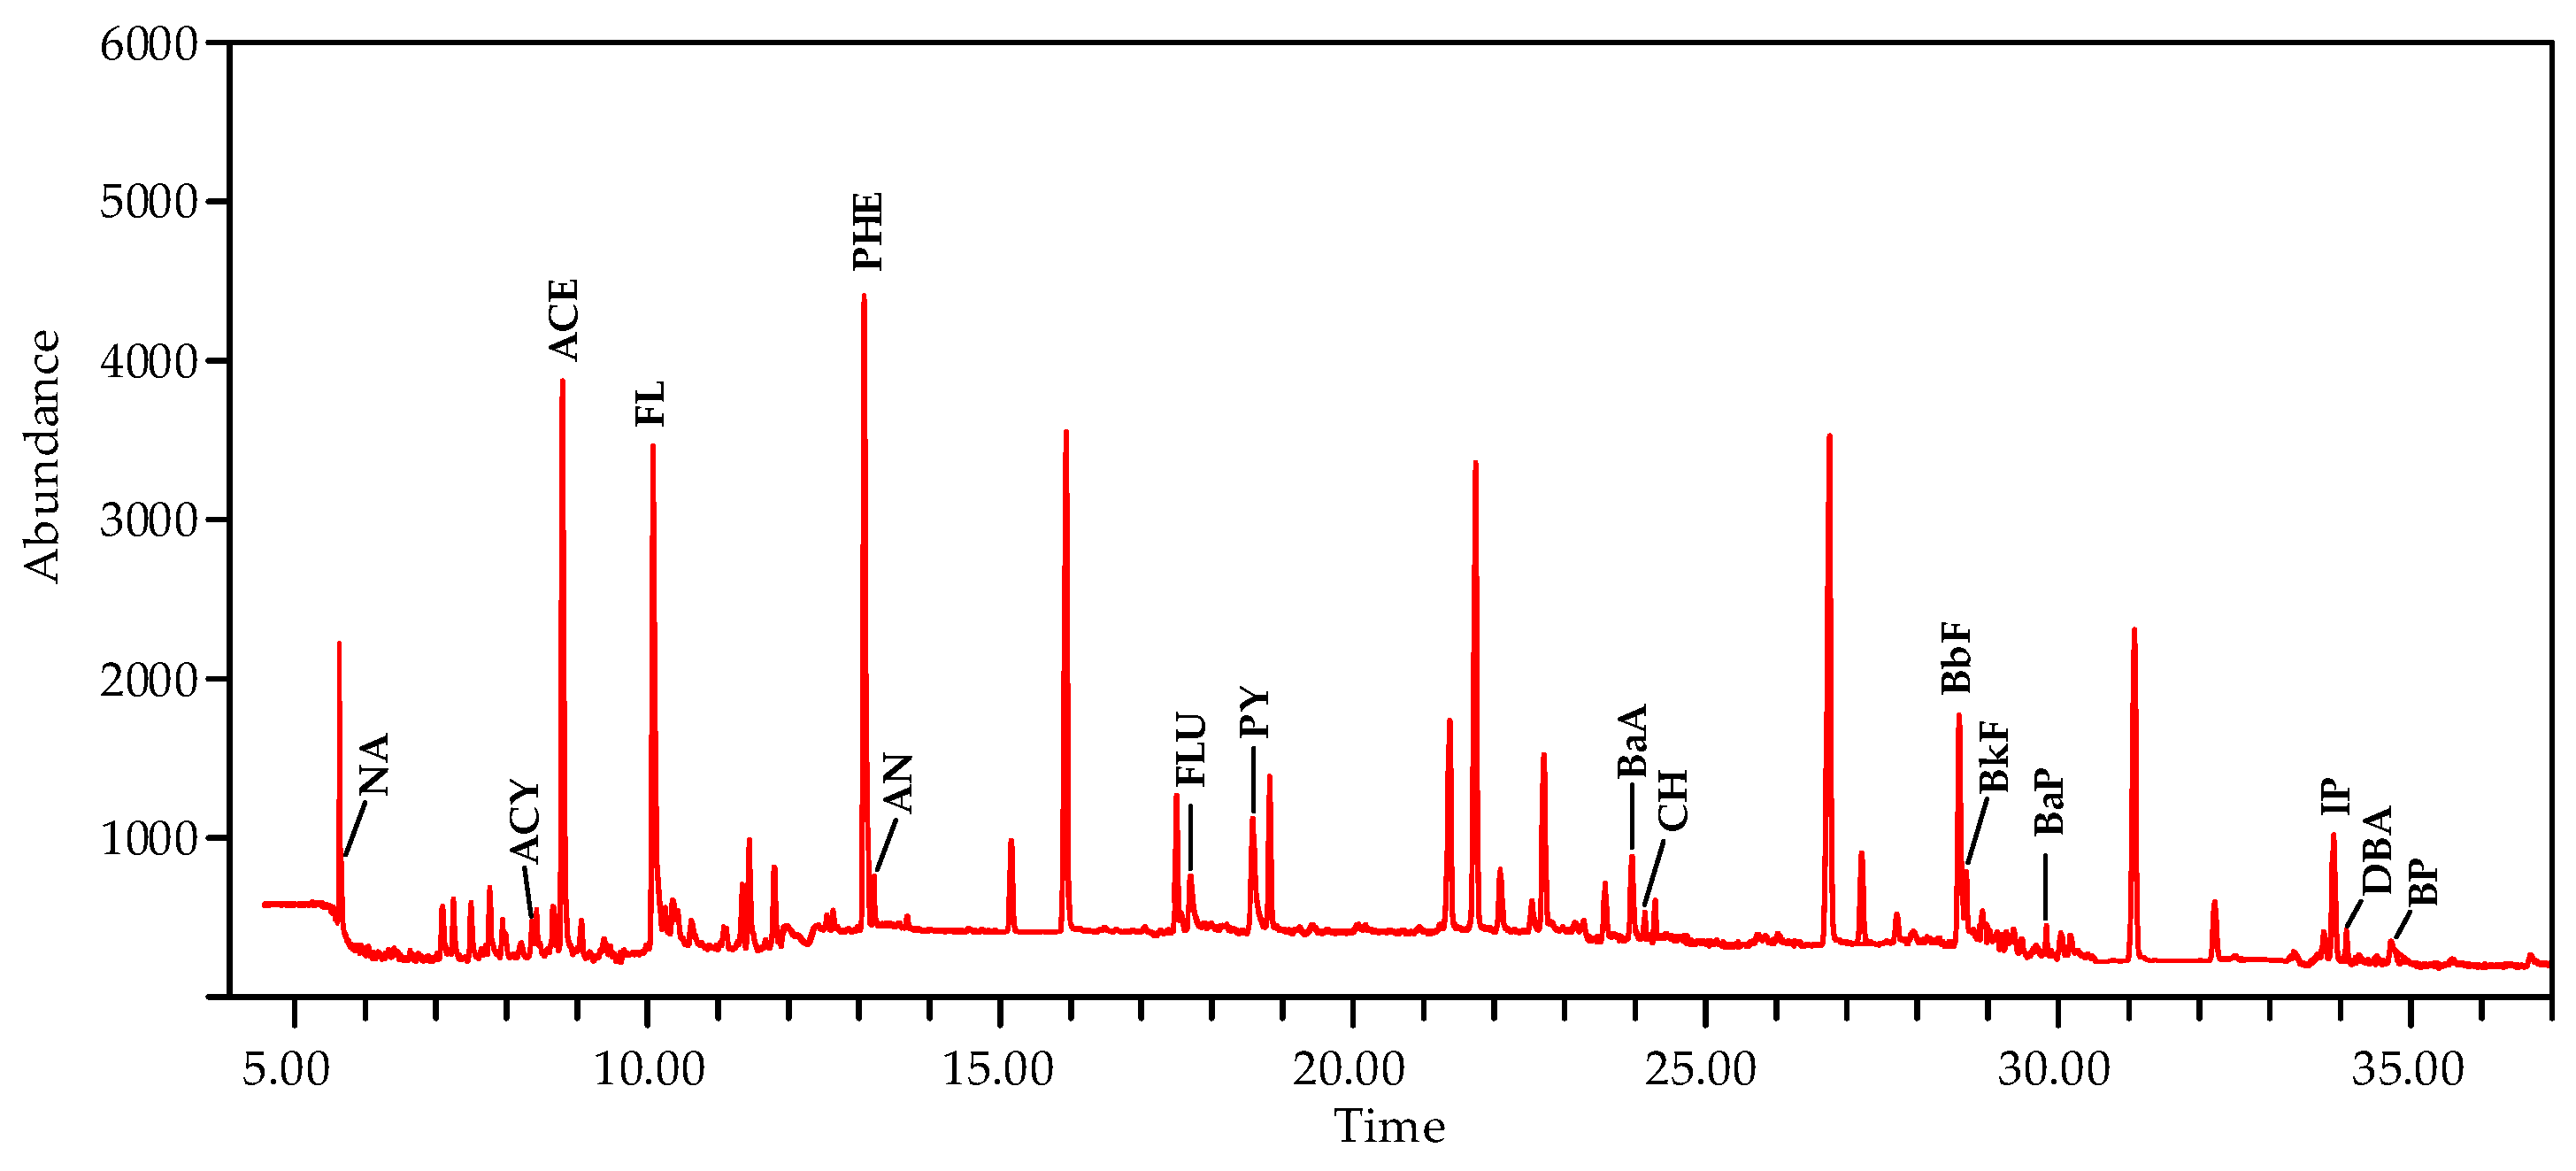
2.3. Sample Pretreatment and Analysis

All PUF samples (including 4 seawater samples, 3 replicate samples, 3 field, and 5 equipment blanks) were freeze-dried and extracted by Soxhlet extraction method for PAHs. PUF were placed into the Soxhlet extraction device and extracted with 250 mL acetone: n-hexane (1:1) for 24 h. A 100 ng SS were added before extraction. After the extraction was completed, samples were let to stand at room temperature. Extracts were concentrated to near dryness with a vacuum rotary evaporator, and anhydrous sodium sulfate was added to remove water. A glass dropper was used to transfer the extracts to a sample bottles and blown with nitrogen to concentrate to 0.2 mL. A 100 ng IS was added, and 16 PAHs were qualitatively and quantitatively analyzed by GC/MS.
A GC/MS system (Agilent 7890B GC/5977A MS; Agilent Technologies, Santa Clara, CA, USA) was used to analyze the PAH compounds. The GC/MS system and operating conditions for PAHs analysis are listed in Table 1, and the selected ion mass program used for quantification is detailed in Table 2. Figure 2 shows the selected quantification ion chromatogram of the T4 seawater sample in this study, indicating that 16 PAHs can be clearly separated. The identity of PAHs in the samples were confirmed by the retention time and the relative intensities of confirmation ions of the PAHs standards. The internal standard calibration method was used to quantify the 16 PAHs. In the laboratory, this study carried out calibration standards, laboratory blanks, control standards, repeated analyses and quantification of detection limits to ensure the accuracy and precision of the PAHs analysis process.

2.4. Analytical Characteristics

The response factors based on the five-point (10, 50, 100, 200, and 500 μg/L) calibration curve for individual PAHs showed an acceptable coefficient of variation (CV) of 4.4 to 16.3%. The results of the laboratory blank samples were always below the detection limit. The individual PAHs recovery in check standards ranged from 94 ± 4.5% to 117 ± 6.1% (n = 3) and the relative percent differences of repeated analysis ranged from 2.8 ± 7.7% to 9.8 ± 5.0% (n = 5) for all of the target analyses (Table 3). The recoveries of SS were 63.1 ± 16.1% for 2-fluorobiphenyl and 78 ± 19.6% for 4-terphenyl-d14 with seawater samples (n = 16). The method detection limit (MDL) was estimated based on the triple standard deviation of the repeated (n = 7) analysis of 16 PAHs (10 μg/L) and the amount of sample extracted. The detection limits were 0.001 (NA)–0.014 (DBA) ng/L for individual PAHs. All PAHs blew the 2x MDL detected in any of the field blank sample and equipment blank samples. The relative percent differences of sample duplicates ranged from 4.0% to 25.7% for 16 PAHs and 2 SS (Table 3).

3. Results and Discussion

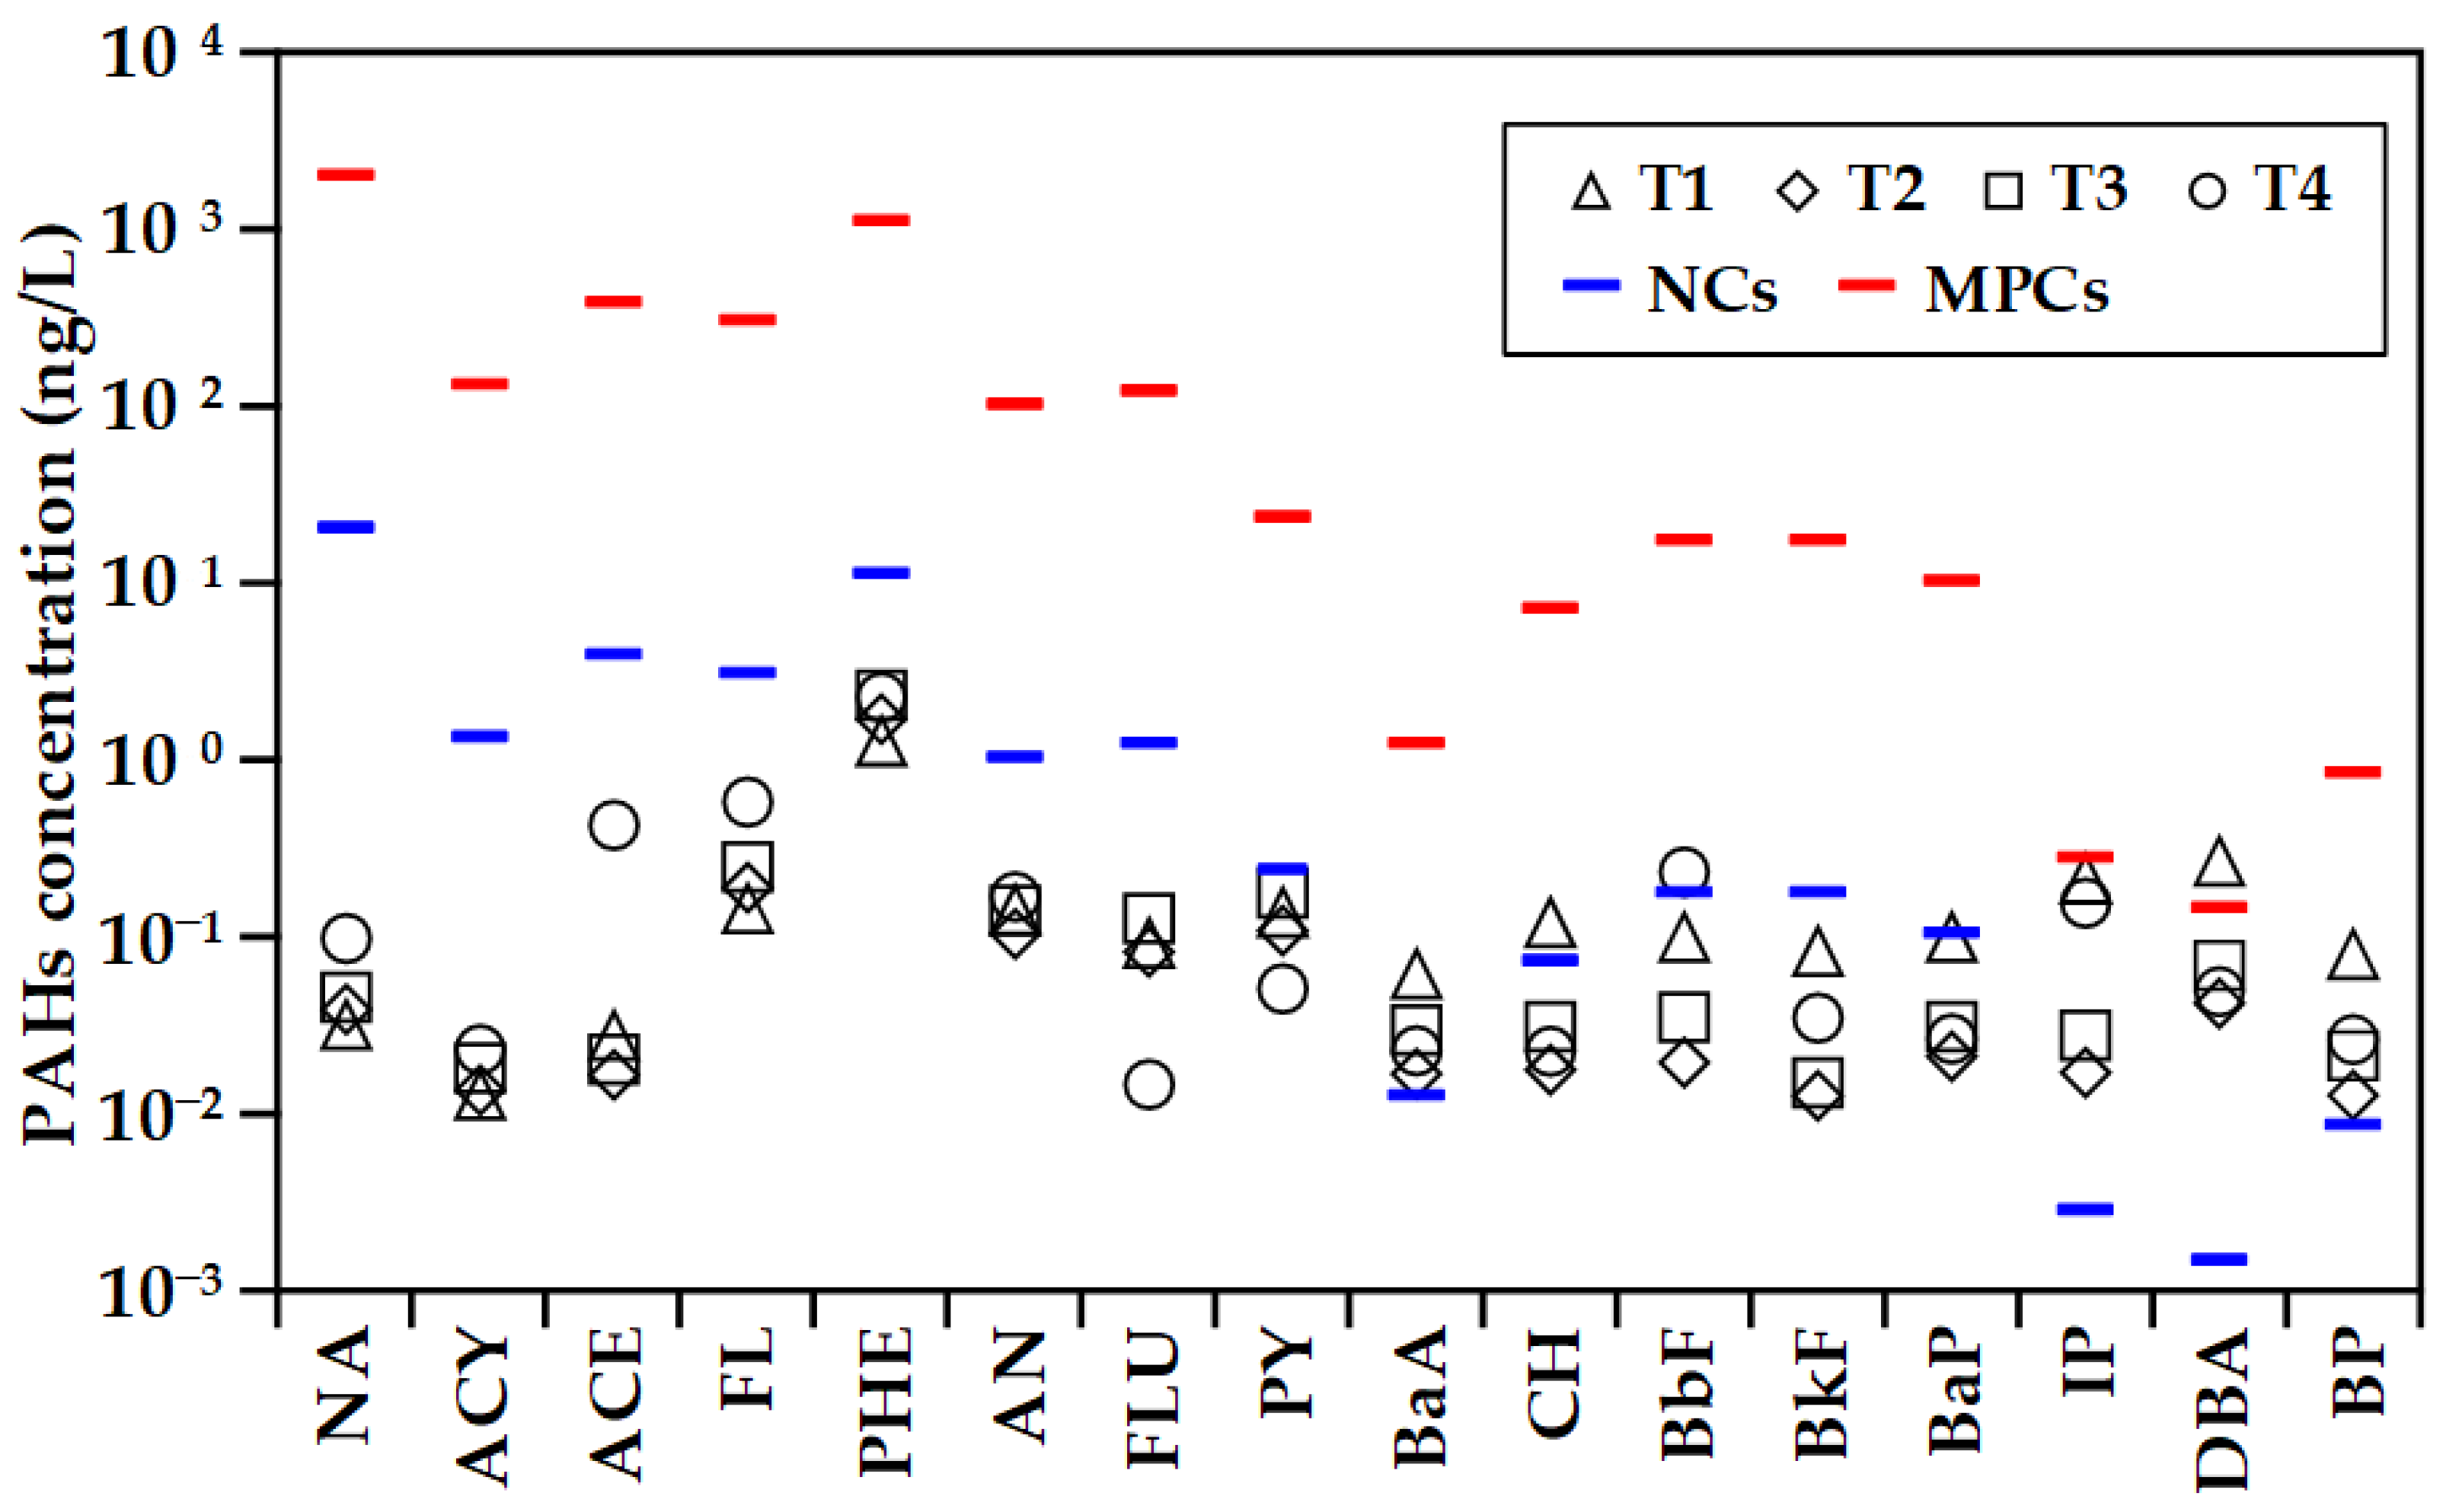
3.1. PAHs Concentrations in the Surface Seawater

The water depth of the four seawater sampling points in this study were between 587 and 852 m, and the surface seawater temperature and salinity ranged between 30.4 and 30.6 ℃ and between 33.9 and 34.0 psu, respectively (Table 4). There were no significant differences in temperature and salinity between the four areas, indicating that the hydrological conditions are similar. The concentration of total PAHs (TPAHs) in the dissolved phase of seawater at the four sampling points ranged from 2.297 to 4.001 ng/L, with an average concentration of 3.056 ± 0.727 ng/L. The concentrations of 16 individual PAHs in each seawater sample were determined, indicating the suitability of the method used in the measurement of low PAHs concentrations in seawater. The composition and source of PAHs in seawater and their biological and physicochemical effects in the environment can be further explored.
Verbruggen [10] derived 16 PAH maximum allowable concentrations (MPCs) for the ecosystem. This MPCs value were derived using ecotoxicology and environmental chemistry data, and represents the potential risk of the substance to the ecosystem. It is recognized as a scientific reference for evaluating PAH’s harm to the ecology and environmental quality [20]. In addition, generally negligible concentrations (NCs) can be defined as one percent of MPCs (MPC/100) [21]. Therefore, the NCs value of 16 PAHs are calculated based on MPCs. The comparison of dissolved phase PAHs with NCs and MPCs at four sites is shown in Figure 3. The concentrations of NA, ACY, ACE, FL, PHE, AN, FLU, PY, BkF, and BaP in the dissolved phases of seawater at each site were lower than NCs, which means that the risk of adverse effects on aquatic organisms is negligible. The concentrations of CH and BbF in one water sample were higher than NCs value but lower than MPCs value, while BaA, IP and BP in four water samples were higher than NCs value but also lower than MPCs value. These results indicate that the risk of adverse effects on aquatic organisms is acceptable. The DBA concentration of three water samples were between the NCs value and the MPCs value, and one water sample was higher than the MPCs value, which represents the risk of possible negative effects on aquatic organisms [21,22]. It is worth noting that although five-ring (DBA) and six-ring (IP and BP) PAHs contribute little to TPAHs (0.5–9.2%), the observed concentration was higher than that of NCs in a higher proportion than low-ring PAHs (Figure 3). High-ring PAHs are generally more hydrophobic, with a higher Kow value (log Kow = 6.13–6.91) and lower water solubility (<1 μg/L), so the dissolved phase concentration in water is extremely low. Some studies may fail to measure the concentration of some high-ring PAH due to the small sampling volume and low concentration factor, and ignore their influence [23,24,25]. However, the results of this study indicate that the potential pollution source and ecological impact of the dissolved phase high-ring PAHs in seawater require further attention. High-ring PAHs are generally more toxic and may be mainly caused by traffic emissions and burning of fossil fuels [26].
Comparing the concentrations of dissolved PAHs in surface seawater reported in different regions of the world (Table 5), the concentration of dissolved PAHs in the offshore southern Taiwan (3.06 ± 0.73 ng/L) is slightly higher than that of the Southern Ocean (2.3 ± 0.52 ng/L), Indian Ocean (2.7 ± 1.0 ng/L) [17], Atlantic Ocean (1.4 ng/L), and North Pacific Ocean (1.3 ng/L) [18]. It is slightly lower than the adjacent seas such as the South China Sea (4.7 ng/L) [23] and the south eastern Japan Sea (6.0 ± 1.8 ng/L) [27]. However, it is lower than the Gulf of Mexico (35.5 ± 9.0 ng/L) [28], the Xiamen coast, China (62 ng/L) [29], the Hainan Island coast, China (104 ± 38 ng/L) [30], and the Taiwan Strait (62 ± 8.3 ng/L) [31]. The distribution of PAHs concentrations in seawater in different regions of the world shows that nearshore seas with anthropogenic influence are higher than the adjacent sea and oceanic areas. The concentrations of dissolved PAHs in seawater are gradually diluted and diffused into the offshore and far seas with the input of land and coastal anthropogenic activities [32,33,34].

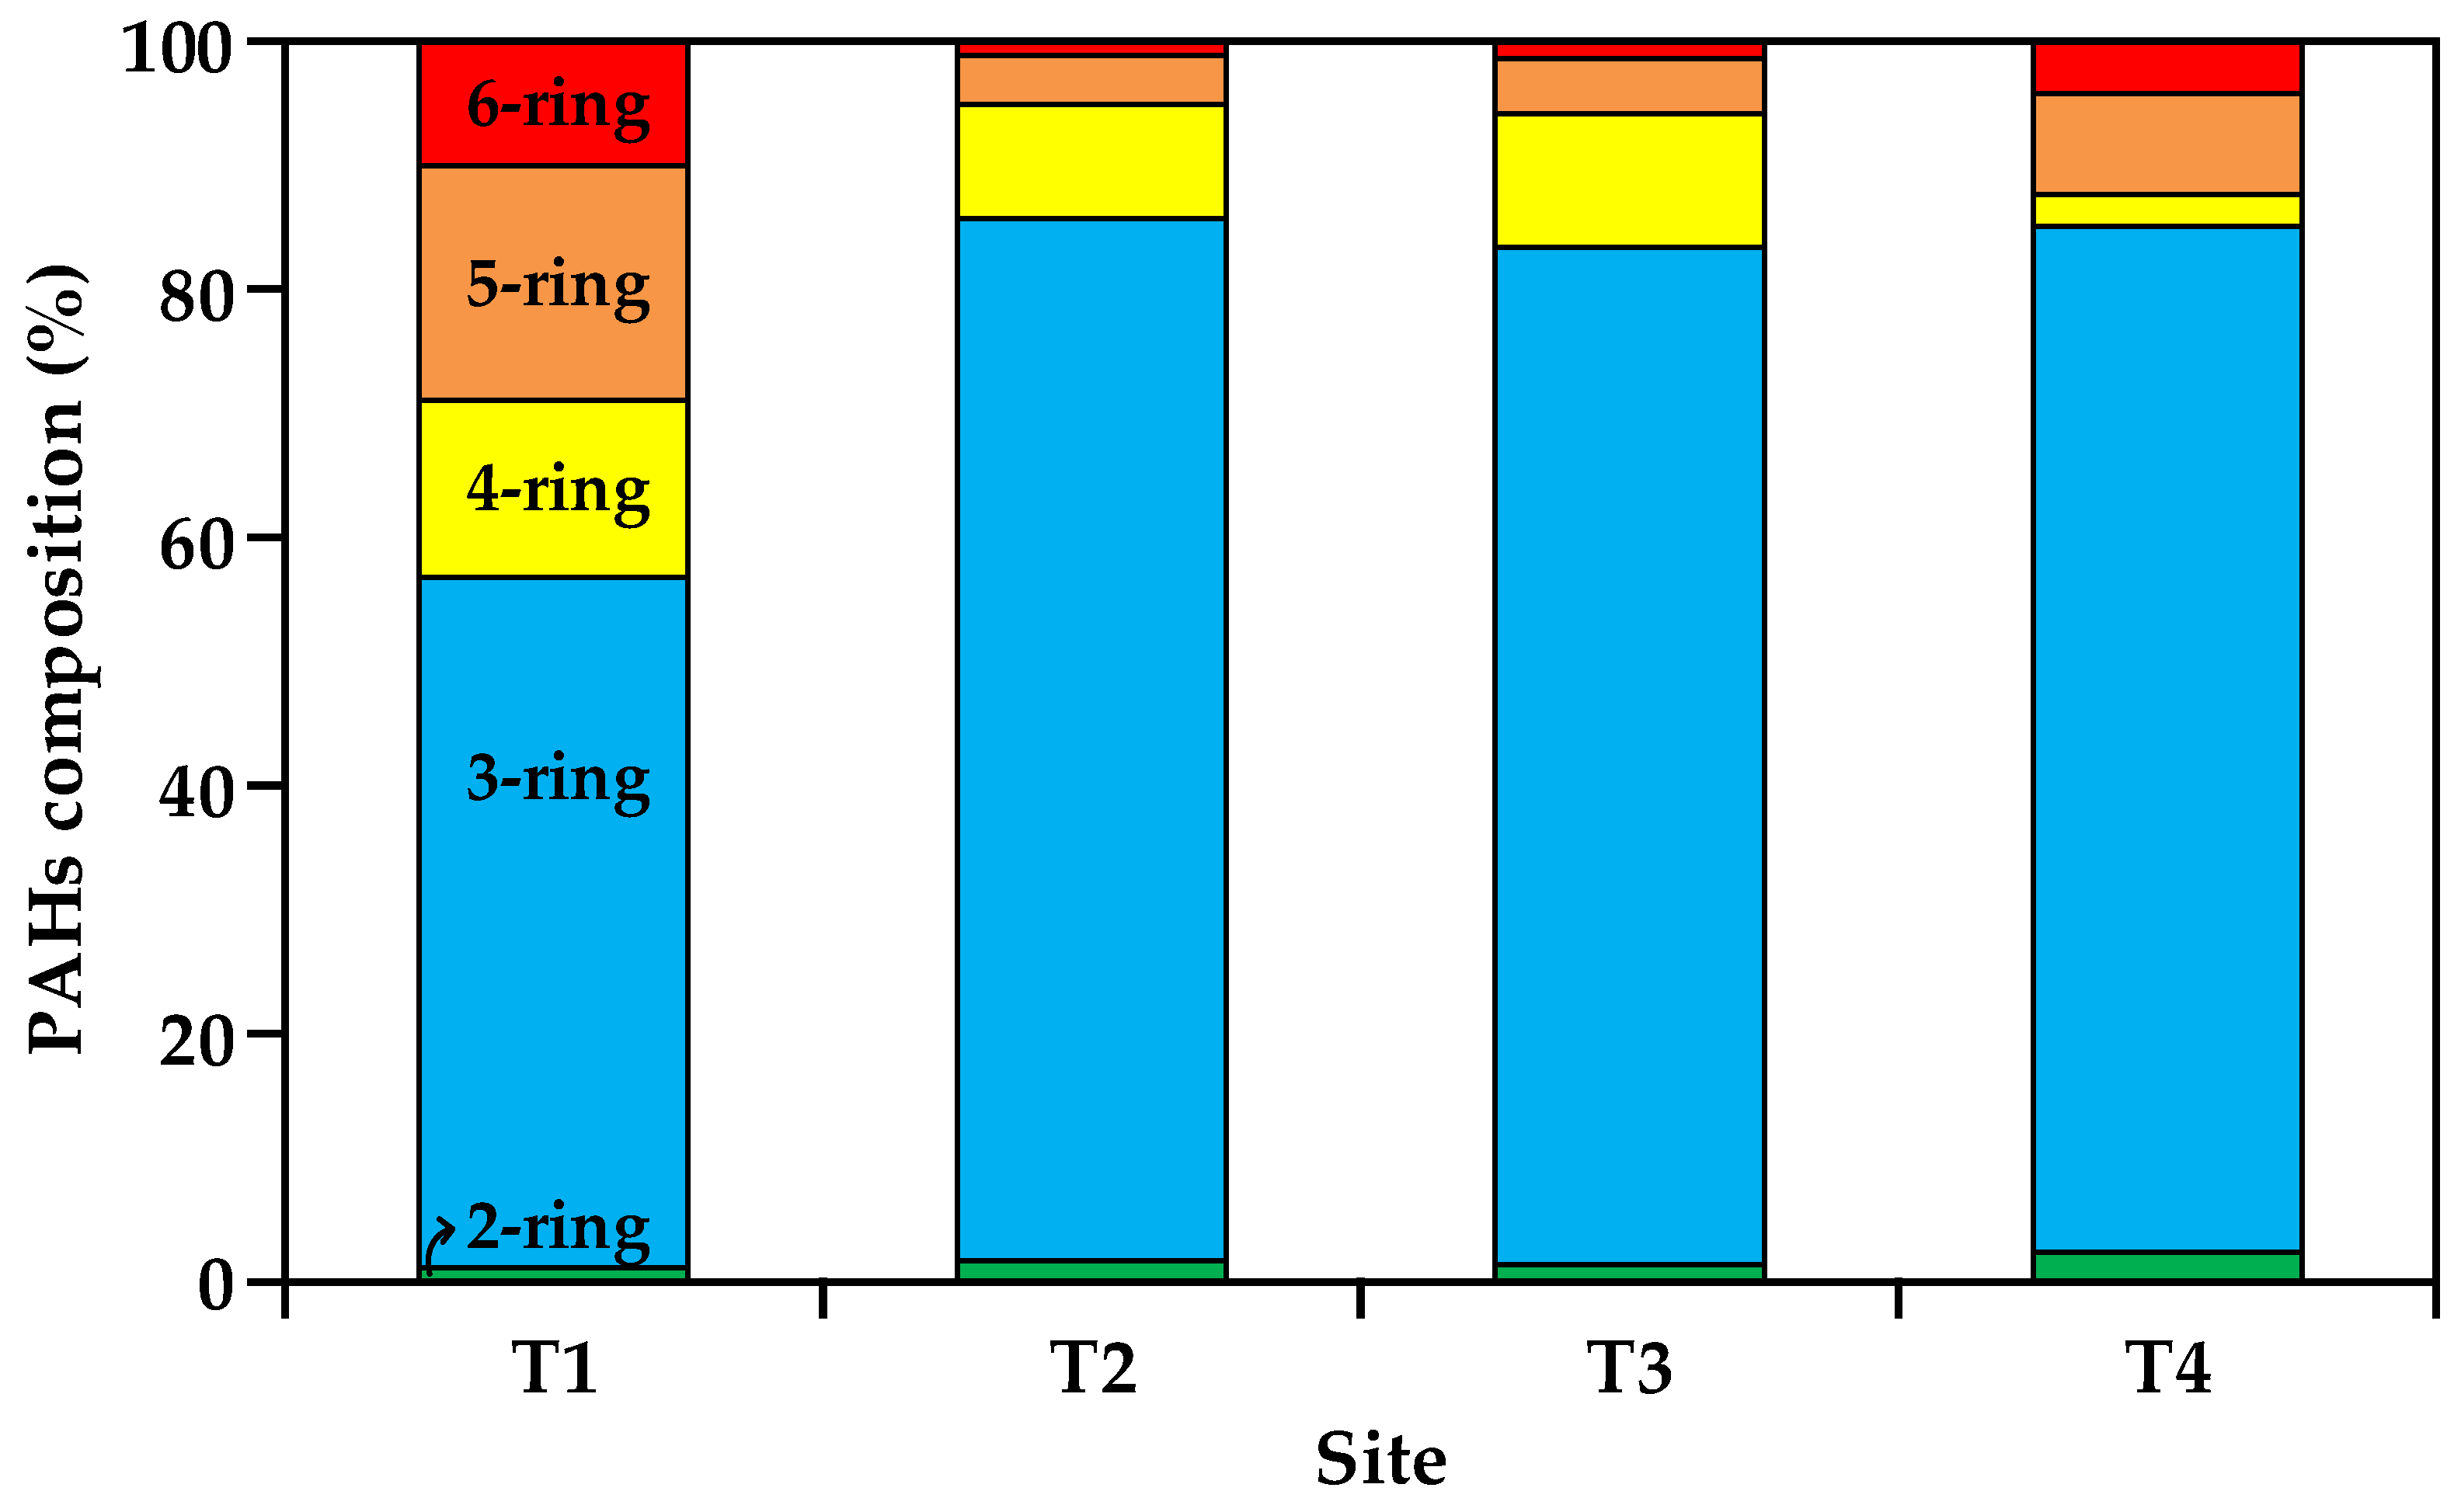
3.2. Composition Patterns of PAHs

In this study, PHE was the most dominant PAHs in the surface water collected offshore of southern Taiwan, accounting for about 59.6 ± 12.6% of TPAHs, followed by FL, accounting for about 8.5 ± 3.7% of TPAHs, and the remaining 14 types of PAHs accounting for about 0.5–4.3% of TPAHs. These results are consistent with that in the coastal areas of Taiwan [24,37], southeastern Japan Sea [27], Bransfield Strait, Antarctica [38], Arctic fjords [7], Pacific Ocean, the Indian Ocean, and the Southern Ocean [17]. Szatyłowicz and Skoczko [5] pointed out that the PHE of soot from burning coal and wood accounts for 55–67% of the total low-ring PAHs. In addition, unburned coal also contains high PHE, accounting for 44–69% of the TPAHs [39]. Coal is the most commonly used energy source in industries such as steel plants, power plants, etc. The PAHs generated during the coal combustion process can be transported through atmospheric, wet and dry deposition, and surface runoff into the coast and ocean. Thor et al. [14] showed that PHE (5690 ng/L) is the most dominant component in the washwater of marine open-loop scrubbers, which accounts for about 35.5% of TPAHs, followed by NA (4790 ng/L), which accounts for about 29.9%. The concentration of PHE and NA in washwater is about 5000 and 1000 times that of background seawater. Moreover, it is known that a predominance of low-ring PAHs was observed in urban wastewater where PHE, NA, FLU, and PY are usually the most abundant compounds [40]. Based on the above, it seems not surprising that PHE is the most important PAH compound in seawater. According to the structure of PAHs, 16 PAHs can be divided into two-, three-, four-, five-, and six-ring PAHs. The composition percentage of two- to six-ring PAHs in the dissolved phase of seawater offshore southern Taiwan is shown in Figure 4. The dissolved phase of PAHs is dominated by three-ring PAHs, which account for about 55.7–84.0% of TPAHs, with an average of 76.1 ± 13.6% (Figure 4). The average composition percentages of two-, four-, five-, and six-ring PAHs were 1.6 ± 0.5%, 9.2 ± 4.9%, 8.8 ± 7.0%, and 4.3 ± 4.1%, respectively. The lowest percentage of two-ring PAH in seawater may be due to its high volatility and bioavailability. The medium- and high-ring PAHs (four- to six-ring) may be easily combined with particles and deposited on the seafloor due to their relatively high hydrophobicity and low water solubility [7]. The advantages of three-ring PAH reflect the presence of combustion products from low-temperature pyrolysis processes and/or petroleum sources [41,42]. PAHs in most seawaters are also mainly composed of three-ring PAH, such as southeastern Japan Sea [27], Northern South China Sea [23], and East China Sea [36]. Petroleum sources and coal/wood burning sources of PAHs may be the main contributors to 3-ring PAH [17].

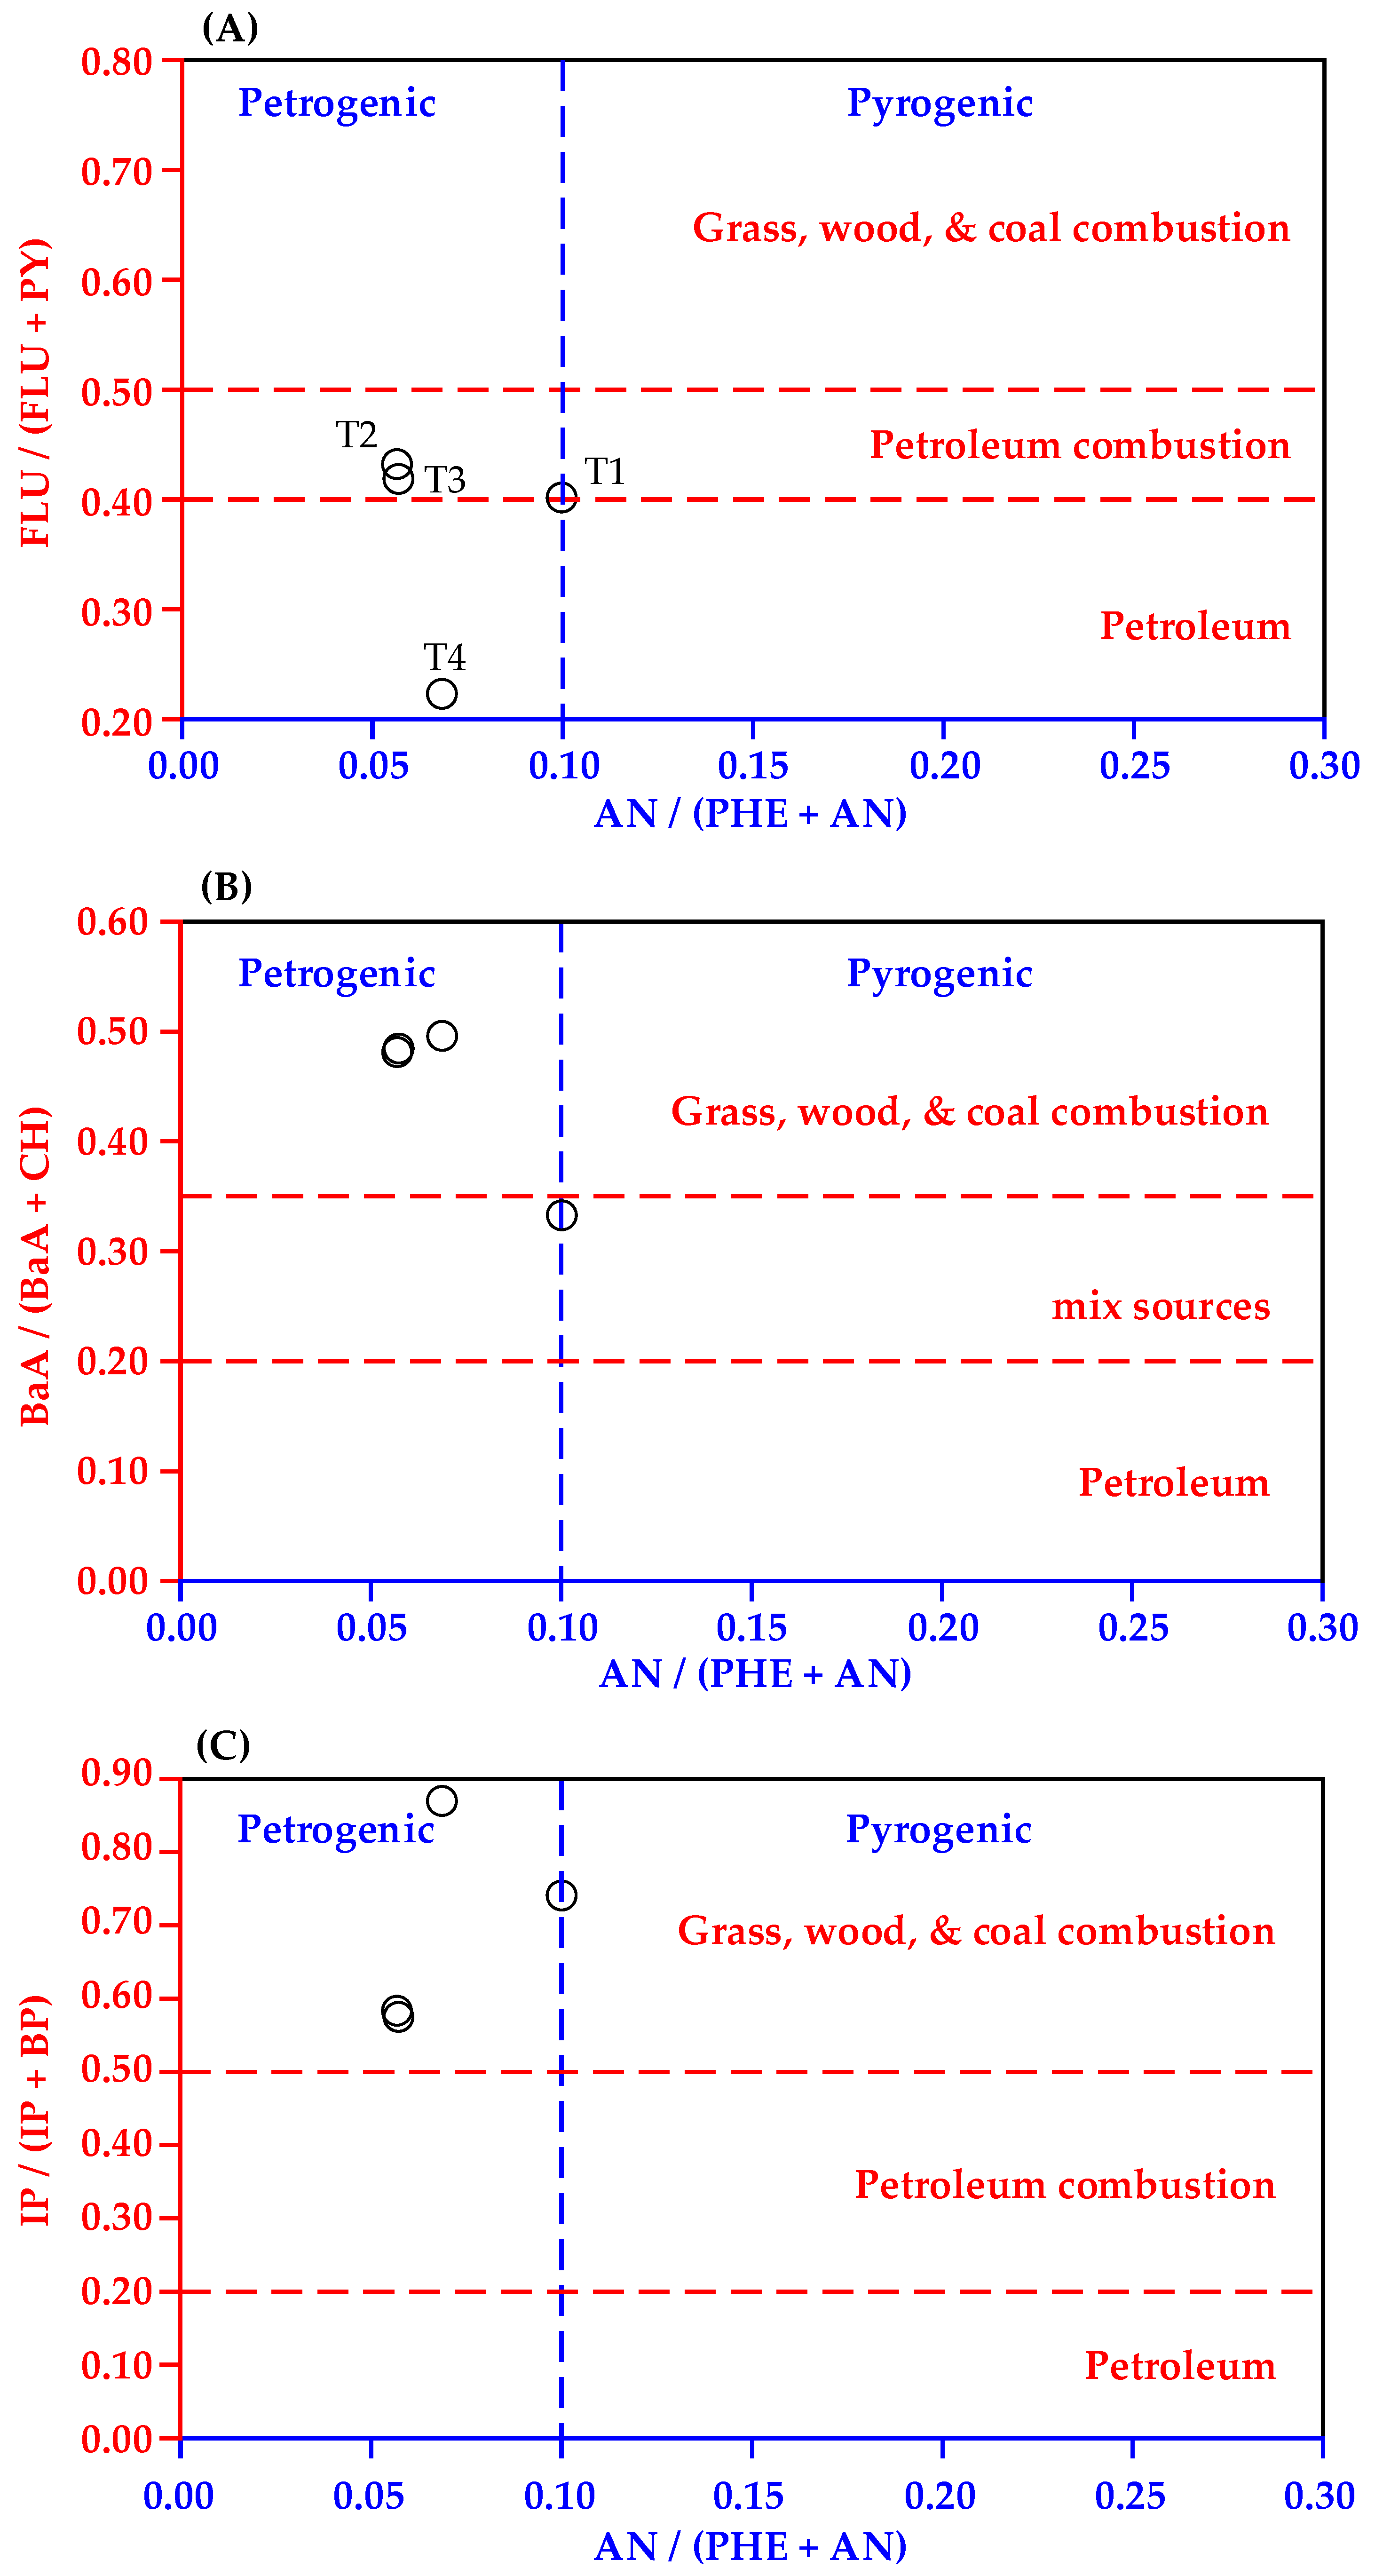
3.3. Identification of PAHs Sources

This study used the diagnostic ratio to assess the potential source of PAHs. The AN/(AN + PHE), FLU/(FLU + PY), BaA/(BaA + CH), and IP/(IP + BP) were used to evaluate the potential sources of PAHs in seawater based on their calculated ratio [26]. When AN/(AN + PHE) < 0.1, it is regarded as the petrogenic source, while >0.1 represents the pyrogenic source +[43]. FLU/(FLU + PY) < 0.4 means petroleum source, FLU/(FLU + PY) between 0.4 and 0.5 means petroleum combustion (including traffic emissions and burning crude oil), FLU/(FLU + PY) > 0.5 means grass, wood, and coal combustion. The ratio of BaA/(BaA + CH) < 0.2 is the source of petroleum, between 0.2 and 0.35 is the mixed source of petroleum and combustion, and >0.35 is the source of combustion. When the pollution source is combustion plants and coal, its IP/(IP + BP) is greater than 0.5. If it is the combustion products of gasoline, diesel, kerosene, etc., the ratio of IP/(IP + BP) is between 0.2 and 0.5, and IP/(IP + BP) < 0.2, the pollution source may be petroleum.
The AN/(AN + PHE) ratios of four seawater samples (T1–T4) in the offshore waters of southern Taiwan ranged from 0.06 to 0.10, indicating that PAH may come from petroleum sources (Figure 5). The FLU/(FLU + PY) ratios of the four seawater samples were 0.40, 0.43, 0.42, and 0.22, respectively. Except for the oil source at the T4 station, the other three stations belonged to the oil burning sources (Figure 5A). The BaA/(BaA + CH) ratios of the four (T1–T4) seawater samples were 0.34, 0.49, 0.49, and 0.50, respectively. Except for the T1 station which is a mixture of oil and combustion sources, the other three stations belong to combustion sources (Figure 5B). The ratio of IP/(IP + BP) ranged between 0.57 and 0.86, indicating that PAHs may come from the combustion source of liquid fuels (Figure 5C). In summary, the PAHs source of the four seawater samples include petroleum, combustion petroleum, and combustion biomass sources. This may be due to the mixing of PAHs generated by human activities on land and nearshores, including ship traffic, untreated and/or treated wastewater, river input, and atmospheric deposition, distributed through ocean currents and the atmosphere, resulting in a mixture of PAHs sources. It would be interesting to know the contribution of each possible source, but it is not easy to obtain. However, based on the PAHs concentration in ship scrubber washwater reported by Thor et al. [14], the ratios of AN/(AN + PHE), FLU/(FLU + PY), BaA/(BaA + CH) and IP/(IP + BP) are calculated to be 0.02, 0.50, 0.45, and 0.26. Among them, the ratio of IP/(IP + BP) shows that the washed PAHs is mainly from combustion petroleum, which corresponds to the actual situation, that is, ships combustion heavy oil. This result indicates that IP/(IP + BP) may be a suitable indicator for the contribution of seawater PAHs from washwater. In addition, the diagnostic ratio of the washwater also needs to be established in the future, which is of great help in evaluating the impact of the discharges on the PAHs concentration of seawater.

4. Conclusions

This study developed an on-site large-volume pre-concentration method for the determination of low-concentration PAH in seawater. The detection limits were 0.001 (NA)–0.014 (DBA) ng/L for individual PAHs. The field blank, equipment blank, and laboratory blank samples were all below the two times value of the detection limit, indicating that the sampling and analysis process were not significantly contaminated. The concentrations of 16 PAHs were measured in surface seawaters collected from the offshore, which means that the method in this study is suitable for the measurement of low-concentration PAHs in seawater. Although the large-volume pre-concentration method takes time (about 1.7 h per sample) to concentrate the water sample, it can detect low-concentration PAHs in seawater, especially PAHs with high ring numbers that are often ignored. The concentration of dissolved phase TPAHs in surface seawater samples collected offshore of southern Taiwan ranged from 2.297 to 4.001 ng/L, with an average of 3.056 ± 0.727 ng/L. The concentration of TPAHs in the offshore waters of southern Taiwan is higher than that of adjacent seas and oceanic areas, but lower than that of coastal waters. Among the 16 PAHs, PHE is the most important compound (59.6 ± 12.6% of TPAHs), followed by FL (8.5 ± 3.7% of TPAHs). Although the concentration of high-ring PAHs in seawater is relatively lower than that of low-ring PAHs, the observed concentration of high-ring PAHs poses a higher risk to aquatic organisms than low-ring PAHs. Diagnostic ratio shows that the sources of PAHs in offshore seawater is a mixture of multiple sources. The IP/(IP + BP) may be a suitable indicator for the contribution of seawater PAHs from ship scrubber washwater. In addition, the diagnostic ratio of the washwater also needs to be established in the future. The results of this study can be used to establish a baseline of the PAHs concentration in seawater, including ports and coastal waters. The method is conducive to assess the impacts of washwater discharged from scrubbers on the marine ecological and environmental health.

Author Contributions

Conceptualization, C.-F.C. and C.-D.D.; methodology, Y.C.L.; validation, Y.C.L. and C.-F.C.; formal analysis, Y.-R.J., C.-F.C. and F.P.J.B.A.; investigation, J.-W.C. and Y.C.L.; resources, C.-W.C. and C.-D.D.; data curation, C.-F.C.; writing—original draft preparation, C.-F.C.; writing—review and editing, Y.-R.J. and F.P.J.B.A.; visualization, C.-F.C. and Y.C.L.; supervision, C.-D.D.; project administration, C.-W.C.; funding acquisition, C.-D.D. All authors have read and agreed to the published version of the manuscript.

Funding

This research was funded by Taiwan International Ports Corporation (TIPC), grant number A0W200041.

Institutional Review Board Statement

Not applicable.

Informed Consent Statement

Not applicable.

Data Availability Statement

Not applicable.

Conflicts of Interest

The authors declare no conflict of interest.

References

  1. Honda, M.; Suzuki, N. Toxicities of Polycyclic Aromatic Hydrocarbons for Aquatic Animals. Int. J. Environ. Res. Public Health 2020, 17, 1363. [Google Scholar] [CrossRef] [Green Version]
  2. Sakellari, A.; Karavoltsos, S.; Moutafis, I.; Koukoulakis, K.; Dassenakis, M.; Bakeas, E. Occurrence and distribution of polycyclic aromatic hydrocarbons in the marine surface microlayer of an industrialized coastal area in the eastern Mediterranean. Water 2021, 13, 3174. [Google Scholar] [CrossRef]
  3. Szatyłowicz, E.; Skoczko, I. Evaluation of the PAH content in soot from solid fuels combustion in low power boilers. Energies 2019, 12, 4254. [Google Scholar] [CrossRef] [Green Version]
  4. Chen, C.F.; Ju, Y.R.; Su, Y.C.; Lim, Y.C.; Kao, C.M.; Dong, C.D.; Chen, C.W. Distribution, sources, and behavior of PAHs in estuarine water systems exemplified by Salt River, Taiwan. Mar. Pollut. Bull. 2020, 154, 111029. [Google Scholar] [CrossRef]
  5. Szatyłowicz, E.; Walendziuk, W. Analysis of polycyclic aromatic hydrocarbon content in ash from solid fuel combustion in low-power boilers. Energies 2021, 14, 6801. [Google Scholar] [CrossRef]
  6. Olayinka, O.O.; Adewusi, A.A.; Olujimi, O.O.; Aladesida, A.A. Polycyclic aromatic hydrocarbons in sediment and health risk of fish, crab and shrimp around Atlas Cove, Nigeria. J. Health Pollut. 2019, 9, 191204. [Google Scholar] [CrossRef]
  7. Pouch, A.; Zaborska, A.; Mazurkiewicz, M.; Winogradow, A.; Pazdro, K. PCBs, HCB and PAHs in the seawater of Arctic fjords—Distribution, sources and risk assessment. Mar. Pollut. Bull. 2021, 164, 111980. [Google Scholar] [CrossRef]
  8. Zaborska, A.; Carroll, C.; Pazdro, K.; Pempkowiak, J. Spatio-temporal patterns of PAHs, PCBs and HCB in sediments of the western Barents Sea. Oceanologia 2011, 53, 1005–1026. [Google Scholar] [CrossRef] [Green Version]
  9. Berrojalbiz, N.; Lacorte, S.; Calbet, A.; Saiz, E.; Barata, C.; Dachs, J. Accumulation and cycling of polycyclic aromatic hydrocarbons in zooplankton. Environ. Sci. Technol. 2009, 43, 2295–2301. [Google Scholar] [CrossRef]
  10. Verbruggen, E.M.J. Environmental Risk Limits for Polycyclic Aromatic Hydrocarbons (PAHs). For Direct Aquatic, Benthic, and Terrestrial Toxicity; RIVM Report 607711007/2012; National Institute for Public Health and the Environment: Bilthoven, The Netherlands, 2012.
  11. IEA. Oil 2019 by the International Energy Agency; IEA: Paris, France, 2019. [Google Scholar]
  12. Endres, S.; Maes, F.; Hopkins, F.; Houghton, K.; Mårtensson, E.M.; Oeffner, J.; Quack, B.; Singh, P.; Turner, D. A new perspective at the ship-air-sea-interface: The environmental impacts of exhaust gas scrubber discharge. Front. Mar. Sci. 2018, 5, 139. [Google Scholar] [CrossRef] [Green Version]
  13. Comer, B.; Georgeff, E.; Osipova, L. Air emissions and water pollution discharges from ships with scrubbers. In International Council on Clean Transportation (ICCT), ICCT Consulting Report; ICCT: Washington, DC, USA, 2020. [Google Scholar]
  14. Thor, P.; Granberg, M.E.; Winnes, H.; Magnusson, K. Severe toxic effects on pelagic copepods from maritime exhaust gas scrubber effluents. Environ. Sci. Technol. 2021, 55, 5826–5835. [Google Scholar] [CrossRef]
  15. Lunde Hermansson, A.; Hassellöv, I.; Moldanová, J.; Ytreberg, E. Comparing emissions of polyaromatic hydrocarbons and metals from marine fuels and scrubbers. Transp. Res. Transp. Environ. 2021, 97, 102912. [Google Scholar] [CrossRef]
  16. Ren, H.F.; Kawagoe, T.; Jia, H.J.; Endo, H.; Kitazawa, A.; Goto, S.; Hayashi, T. Continuous surface seawater surveillance on poly aromatic hydrocarbons (PAHs) and mutagenicity of East and South China Seas. Estuar. Coast. Shelf Sci. 2010, 86, 395–400. [Google Scholar] [CrossRef]
  17. Zhang, X.; Zhang, Z.F.; Zhang, X.; Yang, P.F.; Li, Y.F.; Cai, M.; Kallenborn, R. Dissolved polycyclic aromatic hydrocarbons from the Northwestern Pacific to the Southern Ocean: Surface seawater distribution, source apportionment, and air-seawater exchange. Water Res. 2021, 207, 117780. [Google Scholar] [CrossRef] [PubMed]
  18. Chen, A.; Wu, X.; Simonich, S.L.M.; Kang, H.; Xie, Z. Volatilization of polycyclic aromatic hydrocarbons (PAHs) over the North Pacific and adjacent Arctic Ocean: The impact of offshore oil drilling. Environ. Pollut. 2021, 268, 115963. [Google Scholar] [CrossRef] [PubMed]
  19. Nguyen, D.D.; Tsai, C.L.; Hsu, Y.C.; Chen, Y.W.; Weng, Y.M.; Chang, M.B. PCDD/Fs and dl-PCBs concentrations in water samples of Taiwan. Chemosphere 2017, 173, 603–611. [Google Scholar] [CrossRef] [PubMed]
  20. Linders, J.; Adams, E.; Behrends, B.; Dock, A.; Hanayama, S.; Luit, R.; Rouleau, C.; Tronczynski, J. Exhaust Gas Cleaning Systems—A Roadmap to Risk Assessment. Report of the GESAMP Task Team on Exhaust Gas Cleaning Systems (PPR 7/INF.23); International Maritime Organization: London, UK, 2019. Available online: http://docs.imo.org/ (accessed on 8 December 2021).
  21. Kalf, D.F.; Crommentuijn, T.; van de Plassche, E.J. Environmental quality objectives for 10 polycyclic aromatic hydrocarbons (PAHs). Ecotoxicol. Environ. Saf. 1997, 36, 89–97. [Google Scholar] [CrossRef] [PubMed]
  22. Cao, Z.; Liu, J.; Luan, Y.; Li, Y.; Ma, M.; Xu, J.; Han, S. Distribution and ecosystem risk assessment of polycyclic aromatic hydrocarbons in the Luan River, China. Ecotoxicology 2010, 19, 827–837. [Google Scholar] [CrossRef] [PubMed]
  23. Cai, M.G.; Duan, M.S.; Guo, J.Q.; Liu, M.Y.; Qi, A.X.; Lin, Y.; Liang, J.H. PAHs in the Northern South China Sea: Horizontal transport and downward export on the continental shelf. Mar. Chem. 2018, 202, 121–129. [Google Scholar] [CrossRef]
  24. Huang, Y.J.; Lin, B.S.; Lee, C.L.; Brimblecombe, P. Enrichment behavior of contemporary PAHs and legacy PCBs at the sea-surface microlayer in harbor water. Chemosphere 2020, 245, 125647. [Google Scholar] [CrossRef] [PubMed]
  25. Teuchies, J.; Cox, T.J.S.; Van Itterbeeck, K.; Meysman, F.J.R.; Blust, R. The impact of scrubber discharge on the water quality in estuaries and ports. Environ. Sci. Eur. 2020, 32, 103. [Google Scholar] [CrossRef]
  26. Yunker, M.B.; Backus, S.M.; Graf Pannatier, E.; Jeffries, D.S.; Macdonald, R.W. Sources and significance of alkane and PAH hydrocarbons in Canadian arctic rivers. Estuar. Coast. Shelf Sci. 2002, 55, 1–31. [Google Scholar] [CrossRef]
  27. Hayakawa, K.; Makino, F.; Yasuma, M.; Yoshida, S.; Chondo, Y.; Toriba, A.; Kameda, T.; Tang, N.; Kunugi, M.; Nakase, H.; et al. Polycyclic aromatic hydrocarbons in surface water of the southeastern Japan Sea. Chem. Pharm. Bull. 2016, 64, 625–631. [Google Scholar] [CrossRef] [PubMed] [Green Version]
  28. Adhikari, P.L.; Maiti, K.; Overton, E.B. Vertical fluxes of polycyclic aromatic hydrocarbons in the northern Gulf of Mexico. Mar. Chem. 2015, 168, 60–68. [Google Scholar] [CrossRef]
  29. Tang, G.W.; Liu, M.Y.; Zhou, Q.; He, H.X.; Chen, K.; Zhang, H.B.; Hu, J.H.; Huang, Q.H.; Luo, Y.M.; Ke, H.W.; et al. Microplastics and polycyclic aromatic hydrocarbons (PAHs) in Xiamen coastal areas: Implications for anthropogenic impacts. Sci. Total Environ. 2018, 634, 811–820. [Google Scholar] [CrossRef]
  30. Ya, M.; Wu, Y.; Li, Y.; Wang, X. Transport of terrigenous polycyclic aromatic hydrocarbons affected by the coastal upwelling in the northwestern coast of South China Sea. Environ. Pollut. 2017, 229, 60–68. [Google Scholar] [CrossRef]
  31. Ya, M.; Xu, L.; Wu, Y.; Li, Y.; Zhao, S.; Wang, X. Fossil fuel-derived polycyclic aromatic hydrocarbons in the Taiwan Strait, China, and fluxes across the air-water interface. Environ. Sci. Technol. 2018, 52, 7307–7316. [Google Scholar] [CrossRef]
  32. Witt, G. Occurrence and transport of polycyclic aromatic hydrocarbons in the water bodies of the Baltic Sea. Mar. Chem. 2002, 79, 49–66. [Google Scholar] [CrossRef]
  33. Yuan, K.; Wang, X.W.; Lin, L.; Zou, S.C.; Li, Y.; Yang, Q.S.; Luan, T.G. Characterizing the parent and alkyl polycyclic aromatic hydrocarbons in the Pearl River Estuary, Daya Bay and northern South China Sea: Influence of riverine input. Environ. Pollut. 2015, 199, 66–72. [Google Scholar] [CrossRef]
  34. Gao, Y.; Zheng, H.; Xia, Y.; Chen, M.; Meng, X.Z.; Cai, M. Spatial distributions and seasonal changes of current-use pesticides from the North Pacific to the Arctic Oceans. J. Geophys. Res. Atmos. 2019, 124, 9716–9729. [Google Scholar] [CrossRef] [Green Version]
  35. Wu, Z.; Lin, T.; Li, Z.; Jiang, Y.; Li, Y.; Yao, X.; Gao, H.; Guo, Z. Air-sea exchange and gas-particle partitioning of polycyclic aromatic hydrocarbons over the northwestern Pacific Ocean: Role of East Asian continental outflow. Environ. Pollut. 2017, 230, 444–452. [Google Scholar] [CrossRef]
  36. Wang, Q.; Peng, F.; Chen, Y.; Jin, L.; Lin, J.; Zhao, X.; Yin, J.; Li, J.Y. Heavy metals and PAHs in an open fishing area of the East China Sea: Multimedia distribution, source diagnosis, and dietary risk assessment. Environ. Sci. Pollut. Res. Int. 2019, 26, 21140–21150. [Google Scholar] [CrossRef]
  37. Cheng, J.O.; Ko, F.C.; Lee, C.L.; Fang, M.D. Air-water exchange fluxes of polycyclic aromatic hydrocarbons in the tropical coast, Taiwan. Chemosphere 2013, 90, 2614–2622. [Google Scholar] [CrossRef]
  38. Cao, S.K.; Na, G.S.; Li, R.J.; Ge, L.K.; Gao, H.; Jin, S.C.; Hou, C.; Gao, Y.Z.; Zhang, Z.F. Fate and deposition of polycyclic aromatic hydrocarbons in the Bransfield Strait, Antarctica. Mar. Pollut. Bull. 2018, 137, 533–541. [Google Scholar] [CrossRef] [PubMed]
  39. Ribeiro, J.; Silva, T.; Filho, J.G.M.; Flores, D. Polycyclic aromatic hydrocarbons (PAHs) in burning and non-burning coal waste piles. J. Hazard. Mater. 2012, 199–200, 105–110. [Google Scholar] [CrossRef] [PubMed]
  40. González-Pérez, D.M.; Garralón, G.; Plaza, F.; Pérez, J.I.; Moreno, B.; Gómez, M.A. Removal of low concentrations of phenanthrene, fluoranthene and pyrene from urban wastewater by membrane bioreactors technology. J. Environ. Sci. Health Part A Toxic Hazard. Subst. Environ. Eng. 2012, 47, 2190–2197. [Google Scholar] [CrossRef] [PubMed]
  41. Garcia-Falcon, M.S.; Soto-Gonzalez, B.; Simal-Gandara, J. Evolution of the concentrations of polycyclic aromatic hydrocarbons in burnt woodland soils. Environ. Sci. Technol. 2006, 40, 759–763. [Google Scholar] [CrossRef]
  42. Chen, C.W.; Chen, C.F.; Dong, C.D.; Tu, Y.T. Composition and source apportionment of PAHs in sediments at river mouths and channel in Kaohsiung Harbor, Taiwan. J. Environ. Monit. 2012, 14, 105–115. [Google Scholar] [CrossRef]
  43. Budzinski, H.; Jones, I.; Bellocq, J.; Pierard, C.; Garrigues, P. Evaluation of sediment contamination by polycyclic aromatic hydrocarbons in the Gironde Estuary. Mar. Chem. 1997, 58, 85–97. [Google Scholar] [CrossRef]
Figure 1. Map of the study area and sampling sites.
Water 14 00287 g001
Figure 2. GC/MS selected quantification ion chromatograms of 16 PAHs in the T4 seawater sample. The definitions of compound abbreviations see Table 2.
Water 14 00287 g002
Figure 3. Comparison of PAHs measured in seawater with NCs (negligible concentrations) and MPCs (maximum permissible concentrations).
Water 14 00287 g003
Figure 4. Distribution of composition percentage of two- to six-ring PAHs.
Water 14 00287 g004
Figure 5. Diagnostic ratios of PAHs and possible sources in surface seawater collected offshore of southern Taiwan. AN/(PHE + AN) vs (A) FLU/(FLU + PY), (B) BaA/(BaA + CH), and (C) IP/(IP + BP).
Water 14 00287 g005
Table 1. The GC/MS system and operating conditions for PAHs analysis.
Instrument ParameterCondition Setting
AutosamplerAgilent 7693A
Injection volume1 µL
Gas chromatography (GC)Agilent 7890B
Carrier gas Helium (≥99.999%)
Injection modeSplitless
ColumnHP-5MS (30 m, 0.25 mm, 0.25 μm)
Column flow rate1 mL/min
Temperature of inlet300 °C
Oven temperature program40 °C (hold for 1 min), 120 °C (35 °C/min), 160 °C (10 °C/min), 300 °C (5 °C/min, hold for 10 min)
Mass selective detector (MSD)Agilent 5977A
Temperature of ion source230 °C
Temperature of quadrupole150 °C
Temperature of transfer line280 °C
Electronic energy70 eV
Ionization modeElectron ionization (EI)
Type of mass scanSelective ion monitoring (SIM) (see Table 2)
Table 2. Selected ion monitoring of individual PAH in the GC/MS system.
CompoundsRingRetention Time
(min)
Quantitative Ion
(m/z)
Time Window
(min)
Selected Ions
(m/z)
Naphthalene-ds (IS1)25.6531364.00–8.00127, 128, 129, 136, 172
Naphthalene (NA)25.676128
2-Fluorobiphenyl (SS1)27.372172
Acenaphthylene (ACY)38.3631528.00–11.00151, 152, 153, 154, 164, 165, 166, 167
Acenaphthene-d10 (IS2)38.713164
Acenaphthene (ACE)38.782154
Fluorene (FL)310.077166
Phenanthrene-d10 (IS3)312.98618811.00–19.00101, 176, 178, 179, 188, 200, 202, 203
Phenanthrene (PHE)313.062178
Anthracene (AN)313.221178
Fluoranthene (FLU)417.702202
Pyrene (PY)418.582202
4-Terphenyl-d14 (SS2)419.73324419.00–27.00226, 228, 229, 240, 244
Benzo[a]anthracene (BaA)423.978228
Chrysene-d12 (IS4)424.043240
Chrysene (CH)424.155228
Benzo[b]fluoranthene (BbF)528.61225227.00–45.29125, 138, 139, 252, 253, 264, 276, 277
Benzo[k]fluoranthene (BkF)528.723252
Benzo[a]pyrene (BaP)529.833252
Perylene-d12 (IS5)530.072264
Indeno[1,2,3-c,d]pyrene (IP)633.919276
Dibenz[a,h]anthracene (DBA)534.094278
Benzo[g,h,i]perylene (BP)634.719276
Table 3. Quality assurance and quality control for PAHs analysis in this study.
PAHs aResponse Factor (RF)
(n = 5)
Check Standard
(n = 3)
R b (%)
Repeat
Analysis
(n = 5)
RPD b (%)
Duplicate
Sample
(n = 3)
RPD b (%)
Detection
Limits
(ng/L)
Field Blank
(n = 3)
(ng/L)
Equipment Blank
(n = 5)
(ng/L)
Average ± SD aCV b (%)
NA1.01 ± 0.1615.794 ± 4.55.3 ± 5.115.5 ± 3.00.0010.001 ± 0.0010.001 ± 0.000
ACY0.75 ± 0.0810.2101 ± 2.93.7 ± 3.217.0 ± 5.20.0010.001 ± 0.0010.001 ± 0.000
ACE0.46 ± 0.0512.0106 ± 1.37.2 ± 5.115.8 ± 4.20.0060.003 ± 0.0010.004 ± 0.002
FL0.58 ± 0.0711.5100 ± 7.94.1 ± 8.411.4 ± 3.20.0020.003 ± 0.0010.002 ± 0.001
PHE0.74 ± 0.0811.0110 ± 3.32.8 ± 5.813.5 ± 3.40.0040.002 ± 0.0010.003 ± 0.001
AN0.87 ± 0.1213.3106 ± 4.14.1 ± 4.27.5 ± 3.80.0090.002 ± 0.0020.002 ± 0.003
FLU0.97 ± 0.1414.4101 ± 12.05.4 ± 8.212.7 ± 5.40.0070.002 ± 0.0020.003 ± 0.002
PY1.01 ± 0.1716.3107 ± 10.06.1 ± 7.114.1 ± 10.60.0120.002 ± 0.0010.005 ± 0.004
BaA0.69 ± 0.068.5108 ± 5.69.8 ± 5.09.8 ± 4.50.0130.004 ± 0.0020.007 ± 0.004
CH0.90 ± 0.089.0102 ± 8.32.1 ± 7.514.5 ± 4.60.0130.002 ± 0.0010.009 ± 0.004
BbF0.69 ± 0.079.9110 ± 5.86.2 ± 9.012.5 ± 4.40.0110.003 ± 0.0010.013 ± 0.004
BkF1.01 ± 0.108.9106 ± 5.84.4 ± 6.012.9 ± 3.70.0110.002 ± 0.0010.004 ± 0.004
BaP0.77 ± 0.034.4117 ± 6.12.8 ± 7.716.4 ± 7.80.0150.004 ± 0.0020.008 ± 0.005
IP0.77 ± 0.0810.7103 ± 1.43.2 ± 3.414.8 ± 6.70.0110.004 ± 0.0010.010 ± 0.004
DBA0.83 ± 0.1213.9102 ± 0.86.1 ± 6.115.8 ± 5.90.0140.004 ± 0.0020.008 ± 0.005
BP0.95 ± 0.1111.6109 ± 5.37.5 ± 4.614.5 ± 5.00.0090.002 ± 0.0010.004 ± 0.003
SS11.22 ± 0.081.6103 ± 5.46.1 ± 3.18.3 ± 0.5---
SS21.40 ± 0.069.2103 ± 2.43.7 ± 6.59.1 ± 2.5---
a See Table 2 for the definitions of compound abbreviations; b SD: standard deviation; CV: coefficient of variation; R: recoveries of check standard; RPD: relative percent differences.
Table 4. Concentrations of dissolved polycyclic aromatic hydrocarbons in seawater collected offshore of southern Taiwan.
ItemMDL aMPCs bT1T2T3T4
Water depth (m)683626852587
Water temp (°C)30.430.530.630.5
Salinity (psu)34.034.034.033.9
PAHs (ng/L)
Naphthalene (NA)0.00120000.0300.0370.0430.092
Acenaphthylene (ACY)0.0011300.0120.0130.0170.022
Acenaphthene (ACE)0.0063800.0260.0160.0190.406
Fluorene (FL)0.0023000.1370.1790.2350.552
Phenanthrene (PHE)0.00411001.2151.6242.2082.169
Anthracene (AN)0.0091000.1350.0980.1340.160
Fluoranthene (FLU)0.0071200.0870.0780.1200.014
Pyrene (PY)0.012230.1300.1020.1670.048
Benzo[a]anthracene (BaA)0.0131.20.0580.0160.0280.021
Chrysene (CH)0.01370.1140.0170.0290.021
Benzo[b]fluoranthene (BbF)0.011170.0940.0180.0330.221
Benzo[k]fluoranthene (BkF)0.011170.0780.0120.0140.033
Benzo[a]pyrene (BaP)0.015100.0940.0200.0290.025
Indeno[1,2,3-c,d]pyrene (IP)0.0110.270.2020.0160.0260.148
Dibenz[a,h]anthracene (DBA)0.0140.140.2530.0400.0650.046
Benzo[g,h,i]perylene (BP)0.0090.820.0750.0120.0200.025
Total PAHs (sum of 16 PAHs)2.7402.2973.1874.001
a MDL: method detection limit; b MPCs: maximum allowable concentrations.
Table 5. Comparing the concentrations of dissolved PAHs in surface seawater reported in different regions of the world.
LocationsNo. of PAHsSample Volume (L)Total PAHs (ng/L)Reference
Pacific Ocean212004.0 ± 1.4[17]
Southern Ocean212002.3 ± 0.52
Indian Ocean212002.7 ± 1.0
East Asia1545–1813.0–3.7 (3.3)[18]
North Pacific15120–1661.0–1.6 (1.3)
Arctic Ocean1549–1420.82–2.1 (1.4)
Northwestern Pacific Ocean1560–1005.5–15.6 (9.4)[35]
East China Sea163380–4000[36]
Northern South China Sea1540.98–13 (4.7)[23]
South eastern Japan Sea1333.7–10 (6.0 ± 1.8)[27]
East and South China Seas15765–108030.4–120.3 (66 ± 32)[16]
Taiwan Strait15853–79 (62 ± 8.3)[31]
Gulf of Mexico432024.2–58 (35.5 ± 9.0)[28]
Xiamen coast, China13418–250 (62)[29]
Hainan Island coast, China1512–1828–207 (104 ± 38)[30]
Kaohsiung Harbor and adjacent areas, Taiwan1511.25–9.39 (3.85 ± 2.43)[24]
Kenting coast, Taiwan22400.9–8.0 (2.17 ± 1.19)[37]
Offshore southern Taiwan161002.30–4.00 (3.06 ± 0.73)This study
Publisher’s Note: MDPI stays neutral with regard to jurisdictional claims in published maps and institutional affiliations.

