
Simulation of Denitrification Process of Calcium Nitrate Combined with Low Oxygen Aeration Based on Double Logarithm Mode
by
 ,
,
Fan Wang
1,†, 
Fang Yang
1,2,†,
Hongjie Gao
1,
Yangwei Bai
1,*,
Haiqing Liao
2,* and
Haisheng Li
3 1
Basin Research Center for Water Pollution Control, Chinese Research Academy of Environmental Sciences, Beijing 100012, China
2
State Key Laboratory of Environmental Criteria and Risk Assessment, Chinese Research Academy of Environmental Sciences, Beijing 100012, China
3
Institute of Water Environment Sciences, Chinese Research Academy of Environmental Sciences, Beijing 100012, China
*
Authors to whom correspondence should be addressed.
†
These authors contributed equally to this work.
Water 2022, 14(2), 269; https://doi.org/10.3390/w14020269
Submission received: 18 September 2021
/
Revised: 14 January 2022
/
Accepted: 14 January 2022
/
Published: 17 January 2022
(This article belongs to the Special Issue Water and Soil Pollution Restoration)
Abstract
:In situ remediation of sediment pollution is an important measure for the treatment of urban black-odorous water. In this study, the process of calcium nitrate dosing and low oxygen aeration was used to repair the sediment of black-odorous water body in a glass container. The variation trend and removal efficiency of ammonia nitrogen and nitrate nitrogen in sediment and overlying water were investigated during the process. By establishing the double logarithm model of calcium nitrate sediment repair process, the change law of ammonia nitrogen and nitrate nitrogen content in sediment under different calcium nitrate dosing conditions was studied, and the denitrification process of different calcium nitrate dosing and low oxygen aeration was simulated. The results showed that by establishing the double logarithm model of calcium nitrate sediment remediation process, when the dosage of calcium nitrate was 6%, the inhibition rate of calcium nitrate on nitrate nitrogen release was the largest. The stable inhibitory concentration of nitrate nitrogen was 11.65 mg/g, and the stable inhibited concentration of ammonia nitrogen was 382.95 mg/kg. The stable inhibitory concentration of nitrate nitrogen and ammonia nitrogen in overlying water was 8.34 mg/L and 16.47 mg/L. Moreover, excessive calcium nitrate (8%) may increase the risk of microbial ecological environment in sediment and weaken the inhibitory effect. The optimum parameters were the calcium nitrate dosage of 6%, the reaction time of 21 days, and the aeration rate of 30 mL/min. Under these conditions, the removal effect of ammonia nitrogen in sediment and overlying water was further improved, and the concentration of nitrate nitrogen was effectively controlled. The stable inhibitory content of nitrate nitrogen in sediment was 5.55 mg/g, and the stable inhibitory content of ammonia nitrogen was 982.79 mg/kg. The stable inhibitory concentration of nitrate nitrogen and ammonia nitrogen in overlying water was 6.55 mg/L and 118.20 mg/L. Based on a simulation, this study provides important technical support for the formulation of a refined endogenous pollution control scheme by controlling the process of calcium nitrate remediation and low oxygen aeration.
1. Introduction
Urban black-odorous water bodies are usually formed by long-term pollution such as domestic sewage and industrial wastewater, resulting in serious pollution of urban rivers [1]. There are many reasons for the occurrence of black-odorous water, and the overload pollution sources are the main reasons. When the concentration of oxygen consuming pollutants in the river exceeds a certain range, the oxygen consumption rate of the water body is greater than its reoxygenation rate, resulting in anoxia of the water body. River microorganisms decompose organic matter or metabolize to produce odorous substances such as H2S, ammonia (NH4+), sulfide and various alcohols in anoxic environment. Metal ions such as Fe2+, Mn2+ in water react with S2- in anoxic environment to form ferrous metal sulfides such as FeS and MnS, which seriously affect the environmental quality around the water body [2,3,4]. Black-odorous water not only destroys the river ecosystem, but also affect the drinking water quality, even pollutes the atmospheric environment, seriously damaging the urban living environment and urban image. According to statistical analysis, as of December 2019, 2899 black and smelly water bodies have been identified in 295 prefecture level and above cities in China, including 2548 rivers, 235 ponds, and 116 lakes, accounting for 4.0%, 87.9% and 8.1%, respectively [5]. In terms of geographical distribution, black and smelly water bodies are mainly distributed in Guangdong, Anhui, Hunan, Shandong, Jiangsu, Hubei, Henan and Sichuan. Among the 36 key cities (municipalities directly under the central government, provincial capitals and cities specifically designated in the state plan), more than 1/2 of the black and smelly water bodies are distributed in Guangzhou, Shenzhen, Changchun, Shanghai and Beijing [6]. The pollution sources of a black-odorous water body are mainly divided into exogenous pollution and endogenous pollution. Exogenous pollution mainly refers to the external pollutants entering the river through surface runoff and sewage outlet discharge such as polluted water or garbage. Endogenous pollution mainly refers to the pollution of river sediments. Black-odorous water sediments are often black a with disgusting smell, containing high concentrations of nutrients (nitrogen and phosphorus), heavy metals (mercury, arsenic, cadmium, etc.) and organic pollutants (polycyclic aromatic hydrocarbons, polychlorinated biphenyls, etc.) [7,8,9]. It is the “source” and “sink” of pollutants. Pollutants in water can settle into sediments, and pollutants in sediments can also be released into water. Therefore, the treatment of black-odorous water body should not only control external pollution, but also do a good job in sediment treatment and control internal pollution.
At present, there are two main methods to eliminate sediment black odor: dredging and in situ remediation. Usually, the dredging works are complicated, which is not conducive to the rapid treatment and secondary utilization of sediment. Among them, the in-situ treatment technology of sediment with calcium nitrate as a repair agent has attracted extensive attention [1,10,11,12]. Its repair mechanism is that under anoxic conditions, calcium nitrate provides an electron acceptor for sediment microorganisms, promotes the rapid reproduction of denitrification bacteria, inhibits the growth of SRB (sulfate reducing bacteria) and reduces the generation and release of AVS (acid volatile sulfide). This technology is low-cost, fast, and effective. Tang et al. [13] used calcium nitrate and aerobic denitrifying bacteria to control nitrogen in sediment. After 115 days of remediation, TN (total nitrogen) content decreased by 16.5%, and transferable nitrogen content increased from 0.097 mg/g to 0.109 mg/g. However, it was difficult to control the redox potential in the reaction system after adding nitrate. As a result, nitrate nitrogen was easy to be directly reduced to ammonia nitrogen, resulting in secondary pollution. Moreover, when the dosage of calcium nitrate is too high, it will lead to a sharp increase in nitrate content in sediment and cause great harm to benthos and aquatic animals and plants [14]. Research [15,16] shows that low oxygen aeration technology can effectively improve DO (dissolved oxygen) and ORP (oxidation-reduction potential) conditions of a water body, thus promoting microbial denitrification and preventing the DNRA (dissimilatory nitrate reduction to ammonium) process of nitrate, which is very important for restoring the self- purification function of a sediment-water system. However, previous studies fail to find the evaluation methods for the calcium nitrate dosage and aeration process, and an indoor small-scale test is mostly used for concentration simulation, which often leads to the increase of initial cost. In the phenomenon description with time as a variable, the double logarithm method can often simplify the nonlinear problem into a linear problem. This method provides an important physical generalization means for practical engineering, as well as an important reference for the accurate control of engineering measures. Therefore, the double logarithm model of calcium nitrate sediment remediation process was established to study the change rate of ammonia nitrogen and nitrate nitrogen content in sediment under different calcium nitrate dosage conditions during the reaction within 30 days, and simulate the denitrification process of different calcium nitrate dosage and low oxygen aeration, so as to provide a new idea for optimizing the remediation scheme of black-odorous water sediment.
2. Materials and Methods
2.1. Materials
Sediment samples were collected using a mud grab bucket from the surface (with a depth of 0 to 20 cm) of a black-odorous river in Shunyi District, Beijing. The background indicators of the overlying water and sediment were measured after collecting the samples before the experiment. The pH was measured by glass electrode method. The ORP was measured by electrometric method. The DO was measured by iodometry. The NH3-N was measured by sodium reagent spectrophotometry according to HJ/T 535-2009. The COD was measured by dichromate method according to HJ 828-2017. The moisture content was measured by the direct drying method. All the results are shown in Table 1.
The solutions used in the experiment are as follows. 0.15 mol/L mixed solution of K2S2O8 and NaOH: dissolve 40.5 g K2S2O8 and 40 g NaOH in water and fix the volume to 1 L. 1 mol/L KCl solution: dissolve 74.5 g KCl in water and fix the volume to 1 L. (1 + 9) hydrochloric acid: add 10 mL hydrochloric acid to 90 mL water. Nessler’s reagent: dissolve 7 g potassium iodide and 10 g mercury iodide in 50 mL water and 16 g sodium hydroxide in 40 mL water, slowly inject the former solution into the sodium hydroxide solution under stirring, fix the volume with water to 100 mL, store it in a polyethylene bottle and keep it tightly sealed. Potassium sodium tartrate solution: dissolve 50 g of potassium sodium tartrate in 100 mL water, heat and boil to remove ammonia, cool and constant volume to 100 mL. Ammonia nitrogen standard solution: 10 mg/L. Nitrate nitrogen standard solution, 10 mg/L. All the reagents which were all bought from Sinopharm Chemical Reagent Co., Ltd., Shanghai, China were analytical purity.
2.2. Methods
2.2.1. Determination of the Optimum Dosage of Calcium Nitrate
The bottom sediment and the overburden water samples were pretreated at room temperature. One kg of bottom sediment samples were added into the container, and a corresponding calcium nitrate dosage was added according to the mass ratio of 2%, 4%, 6% and 8%, and the particles were stirred evenly until the sediment was mixed evenly and all of them were dissolved into the sediment. In addition, the experiment set a control group which did not add calcium nitrate. In order to prevent excessive calcium nitrate release into the water, the original sample of untreated sediment with a thickness of 2 cm was covered on the treated sediment, and then 1 L of overburden water sample was slowly injected into the glass container. The glass container was stored at room temperature and kept in dark space to avoid the phytoplankton growth with may affect the result. In addition, the river water lost due to evaporation was replenished regularly during the test, and the container was covered with gauze to prevent impurities from falling into the container without hindering air-water gas exchange. The water and sediment samples were collected at the first, second, third, fifth, seventh, 10th, 14th, 21st and 30th days. The changes of ammonia nitrogen and nitrate nitrogen were observed, and the optimal dosage of calcium nitrate was determined.
2.2.2. Determination of the Optimum Aeration Rate
The sediment was moved to the glass container with the addition of the optimal calcium nitrate dose determined in the above test, and the overcoating water was slowly added. The aeration equipment was connected, and the aerator was turned on. The aeration rate was adjusted to 10, 20, 30 and 40 mL/min, respectively, through the rotor flowmeter. A group without aeration was set as the control group. In order to investigate the effect of aeration rate after adding calcium nitrate on the concentration of ammonia nitrogen and nitrate nitrogen in sediment and overburden water, sediment samples and water samples were collected at the first, third, fifth, seventh, 14th, 21st and 30th days of the experiment. In each of the above days, three sediment samples and 3 water samples were collected. The sediment samples were all collected from the surface of the sediments. The contents of ammonia nitrogen and nitrate nitrogen in sediment samples as well as the concentrations of ammonia nitrogen and nitrate nitrogen in water samples were indicated according to the methods mentioned in chapter 2.2.3. The variation trend and removal efficiency of ammonia nitrogen and nitrate nitrogen in sediment and overlying water were investigated.
2.2.3. Determination of Ammonia Nitrogen and Nitrate Nitrogen
The sediment samples were extracted with 1 mol/L KCl solution (water/soil ratio 10:1), oscillated at room temperature for 1 h (200 r/min), and then centrifuged at 5000 r/min for 10 min. The supernatant was poured into a 50 mL square flask and mixed well. An appropriate amount of water sample was filtered through a 0.45 μm membrane. The content of nitrate nitrogen in the filtrate was determined by ultraviolet spectrophotometry according to HJ/T 346-2007 [17], and the content of ammonia nitrogen was determined by sodium reagent spectrophotometry according to HJ/T 535-2009 [18].
3. Results
3.1. Variation of Ammonia Nitrogen and Nitrate Nitrogen Contents with Calcium Nitrate Addition
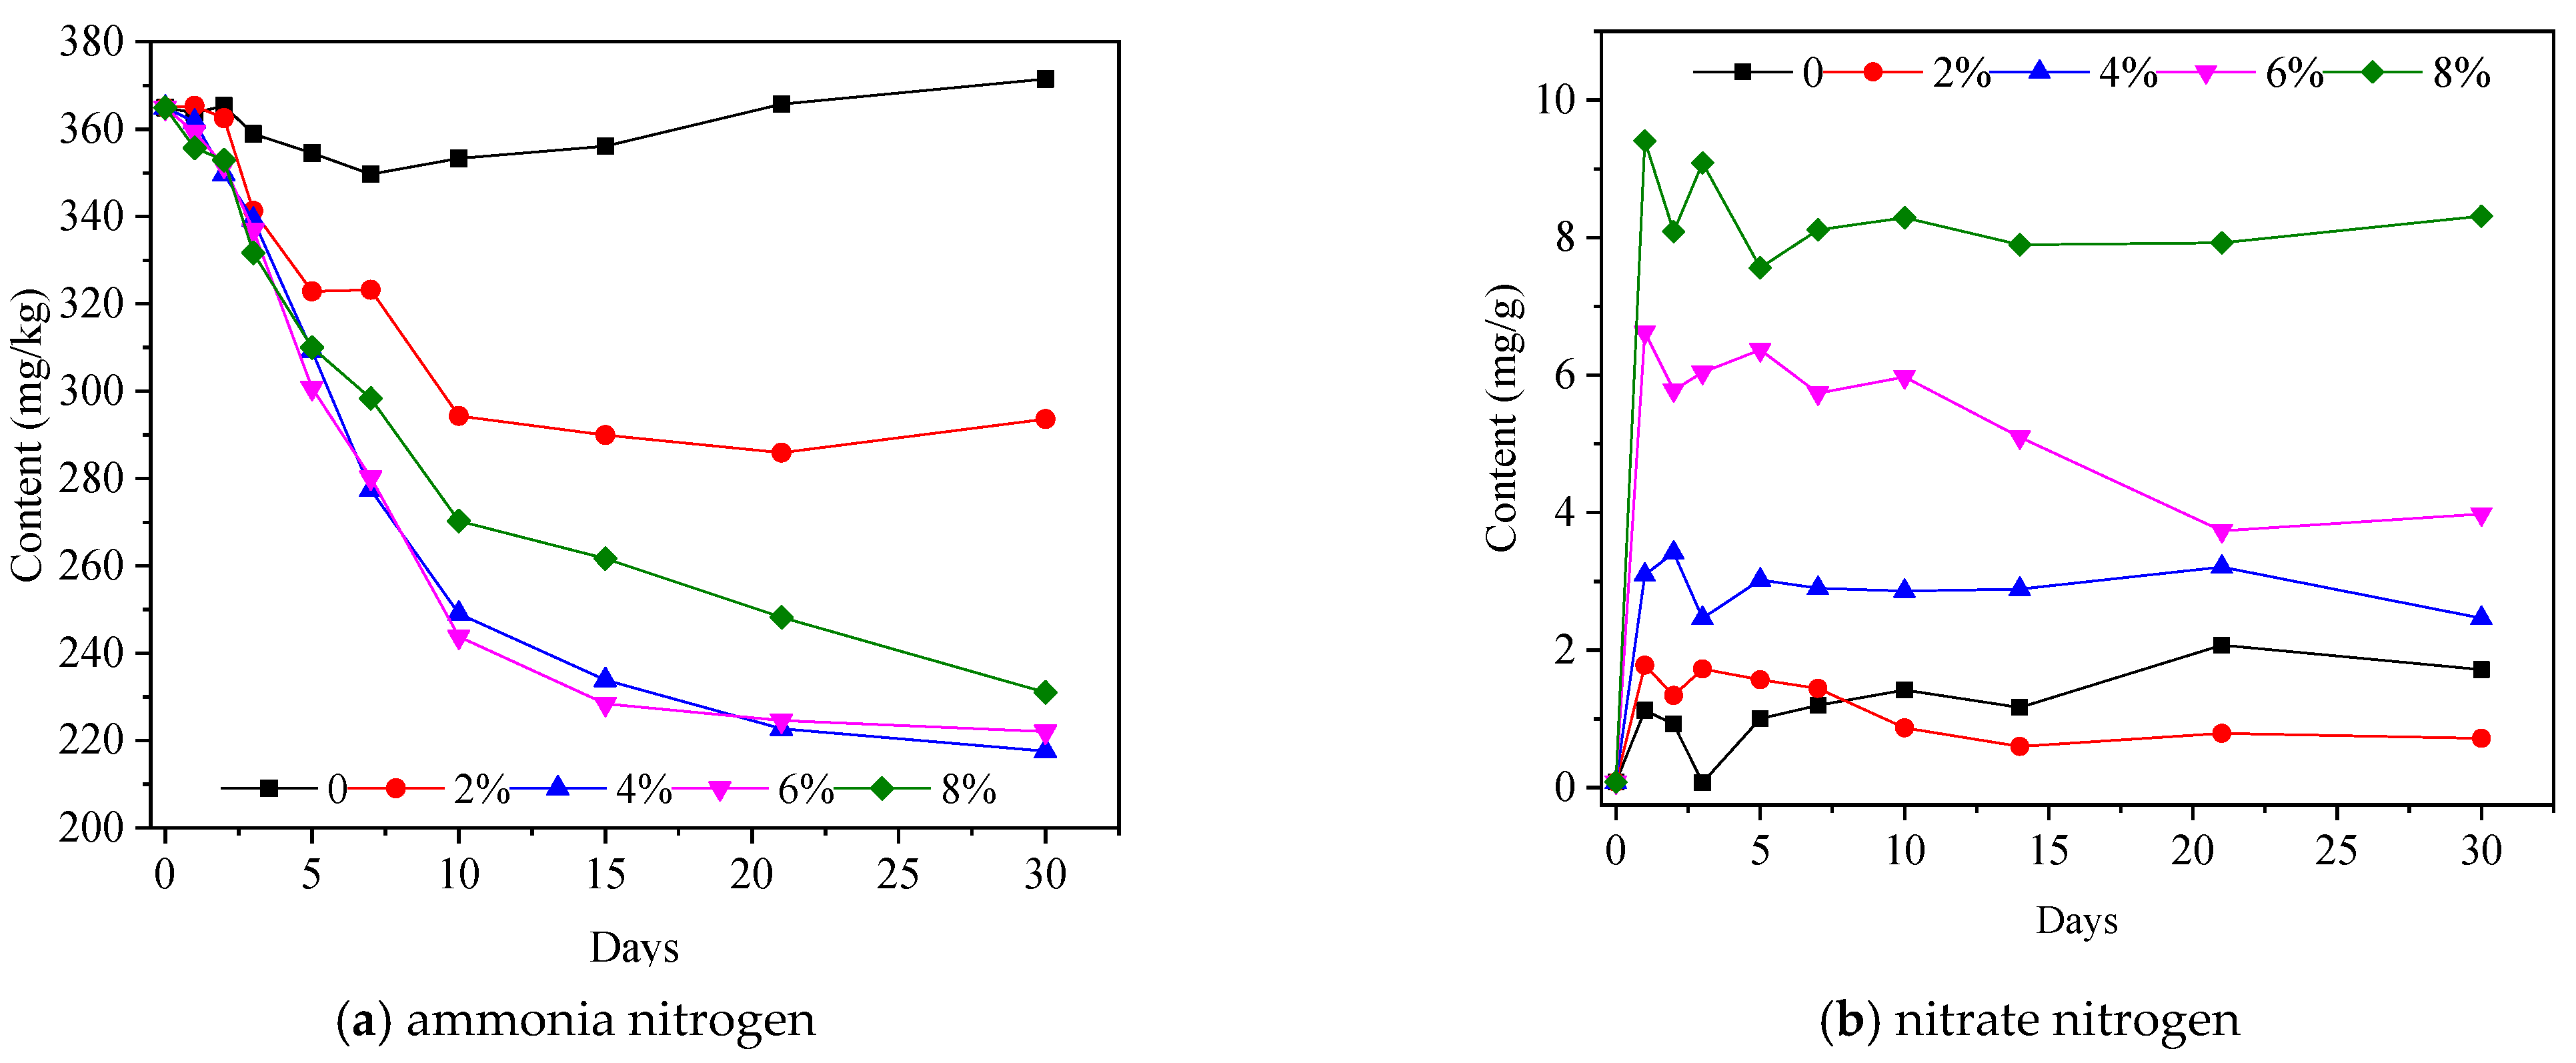
The dosage of calcium nitrate was 0–8% of the bottom sediment mass with an interval of 2%. The experimental days were one day, three days, five days, seven days, 10 days, 14 days, 21 days and 30 days. The relationship between the ammonia nitrogen/nitrate nitrogen content in sediment and test days under different calcium nitrate dosages is shown in Figure 1.
It can be seen from Figure 1a that under different calcium nitrate dosage conditions, the ammonia nitrogen concentration showed a decreasing trend with the increase of test days, and the greater the dosage, the more obvious the decreasing trend was. The effect of calcium nitrate dosage on the concentration of ammonia nitrogen in sediment is also different under the condition of the same test days. When the test days were longer than 10 d, the decrease trend of ammonia nitrogen concentration was more obvious with the increase of calcium nitrate dosage, but when the test days were less than seven d, the trend was not obvious. When the experimental days were 30 days and the dosage of calcium nitrate was 4%, the removal rate of ammonia nitrogen was 40.4%, and the best treatment effect was obtained. Figure 1b showed that the concentration of nitrate nitrogen in the sediment first increased significantly, and the increase was directly related to the addition amount of calcium nitrate. After a few days of reaction, the concentration of nitrate nitrogen in each group decreased, but the decrease was not obvious.
3.2. Variation of Ammonia Nitrogen and Nitrate Nitrogen Concentration with Calcium Nitrate Addition
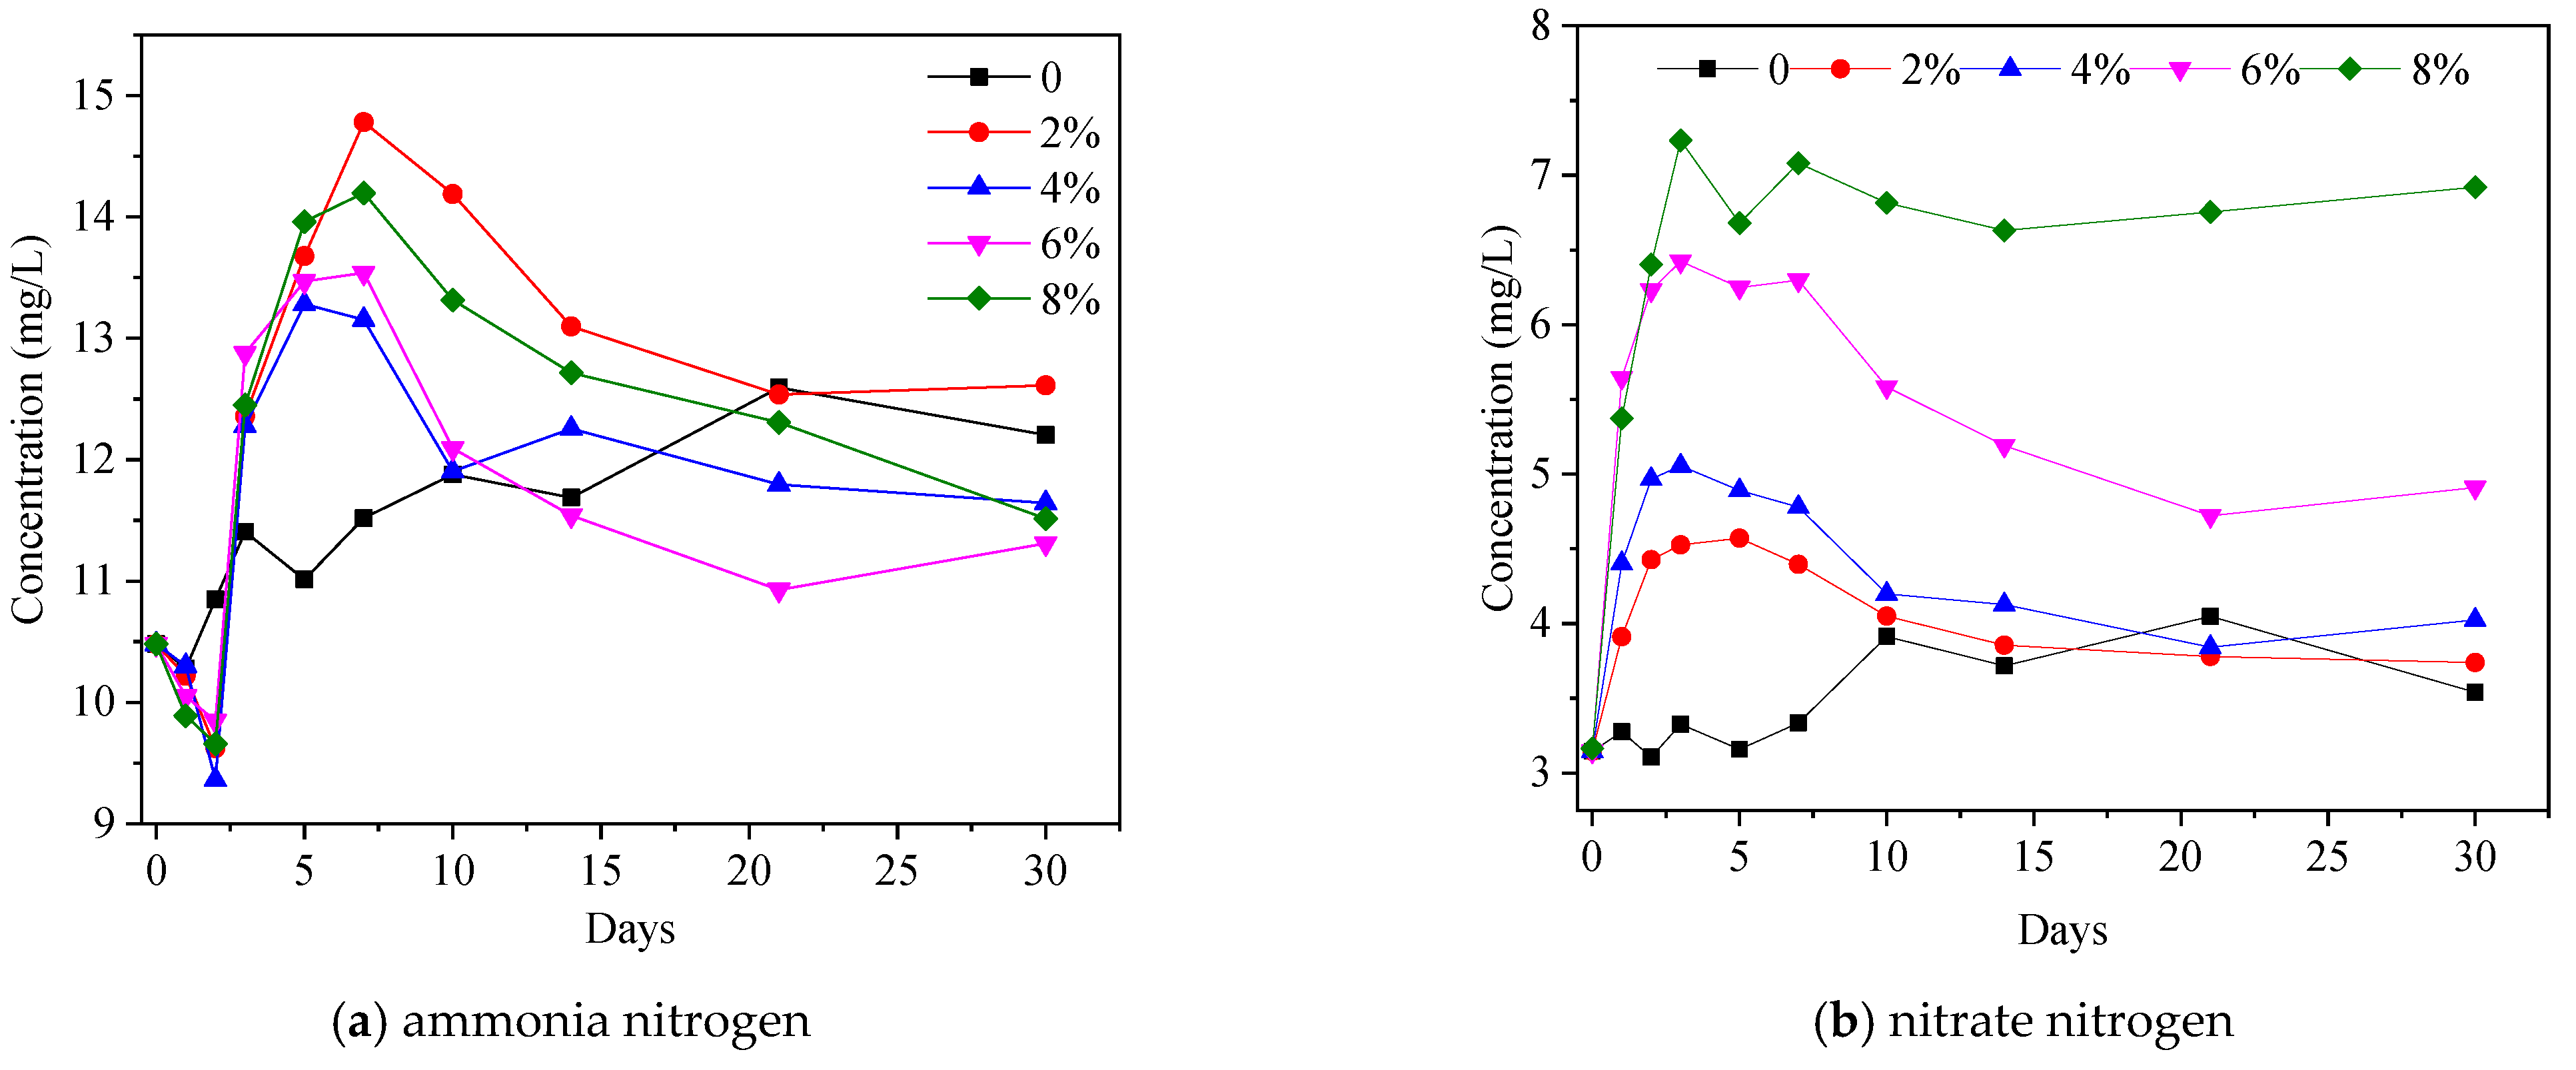
The concentration of ammonia nitrogen/nitrate nitrogen in overlying water was also determined besides that in sediment. The results are shown in Figure 2.
As can be seen from Figure 2a, under the conditions of calcium nitrate dosage, the concentration of ammonia nitrogen firstly increased and then decreased with the increase of the test days. The concentration of ammonia nitrogen reached the maximum on day seven and then began to decline. It shows that the ammonia nitrogen in the bottom sediment is first released into the water, and then some of the ammonia nitrogen in the water degrades. The concentration of ammonia nitrogen eventually stabilized at about 11 to 12 mg/L.
As can be seen from Figure 2b, when calcium nitrate was added, the concentration of nitrate nitrogen in the overlying water also had an obvious rising process, similar to that in the sediment. After that, with the increase of test days, the concentration of nitrate nitrogen decreased to different degrees. When calcium nitrate dosage was 2%, 4% and 6%, the concentration of nitrate nitrogen decreased noticeably. When the test days were 21 days, the concentration of nitrate nitrogen in each aeration group was basically stable. However, the final stable concentration of nitrate nitrogen was still higher than that before adding calcium nitrate, which indicates that nitrate nitrogen in overlying water cannot be removed only by the addition of calcium nitrate.
3.3. Variation of Ammonia Nitrogen and Nitrate Nitrogen Contents with Aeration
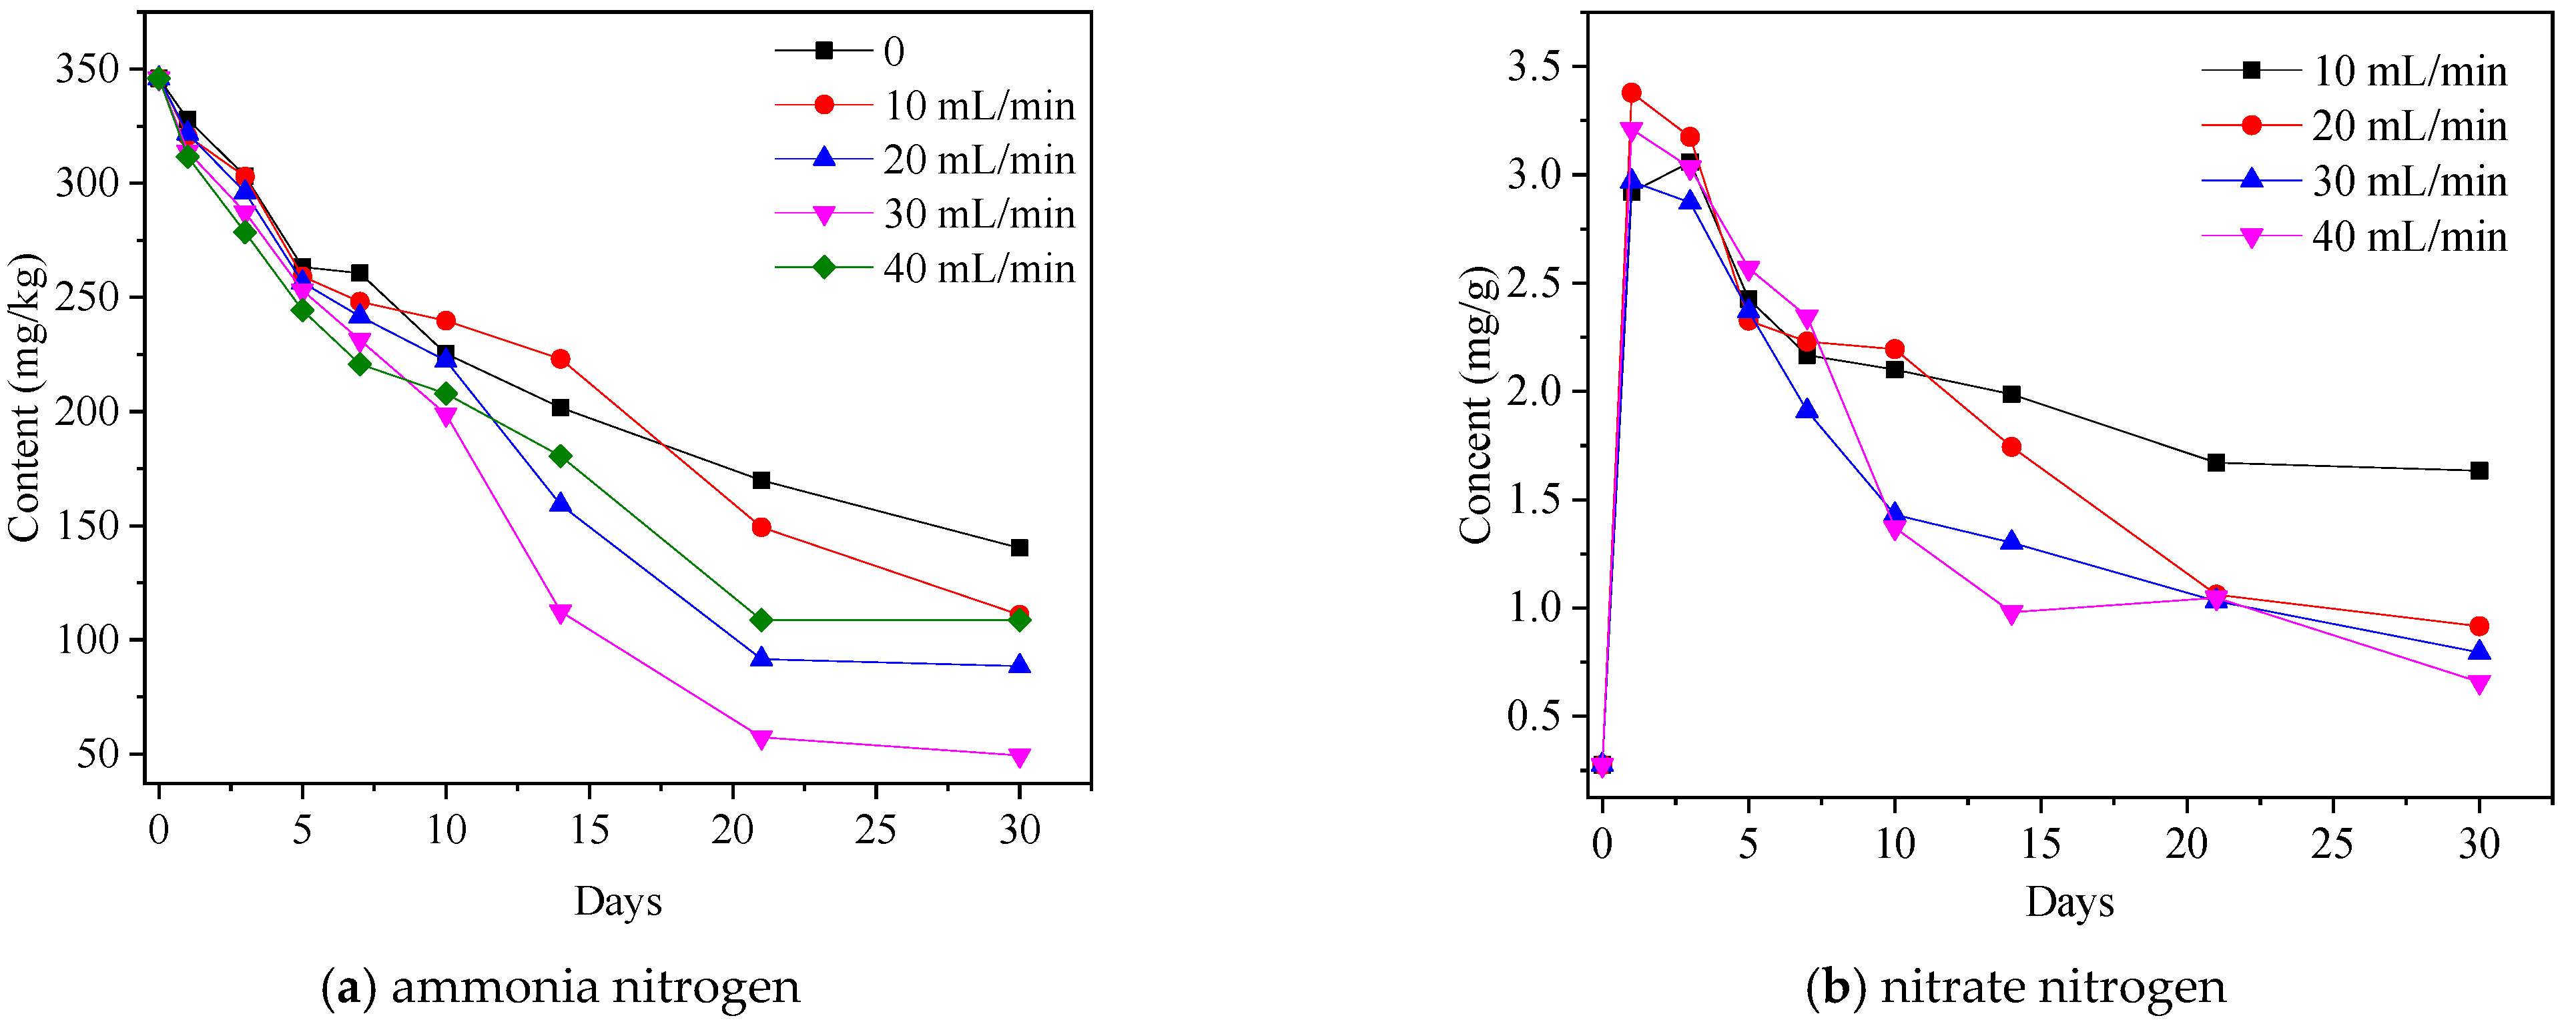
As can be seen from Figure 3a, under the condition of the same aeration rate, with the increase of test days, the ammonia nitrogen concentration showed a trend of gradual decline. When the aeration rate was 30 mL/min, the ammonia nitrogen concentration decreased most obviously. In the same test days, with the increase of aeration rate, the concentration of ammonia nitrogen showed a decreasing trend, especially at 21 days and 30 days. However, there was little difference in the decreasing process between the two when the aeration rate was 30 mL/min and 40 mL/min. It shows that the degradation of ammonia nitrogen has reached a stable level when the aeration rate was 21 days. The optimal aeration rate and experimental days for ammonia nitrogen degradation were an aeration time of 30 days and aeration rate of 40 mL/min. The effect of test days on ammonia nitrogen under different aeration rates was further discussed using regression analysis.
The same as the results without aeration, the concentration of nitrate nitrogen in each aeration group was significantly increased after the addition of calcium nitrate, as can be seen from Figure 3b. However, with the extension of test days, compared with the non-aerated group, the concentration of nitrate nitrogen in the aerated group decreased significantly. This indicates that aeration can indeed promote nitrite denitrification. The degradation of nitrate nitrogen in sediment has little difference at the aeration rates of 20 mL/min, 30 mL/min and 40 mL/min. Therefore, 30 mL/min was the best aeration rate considering the oxidation of ammonia nitrogen and the degradation of nitrate nitrogen.
3.4. Variation of Ammonia Nitrogen and Nitrate Nitrogen Concentration with Aeration
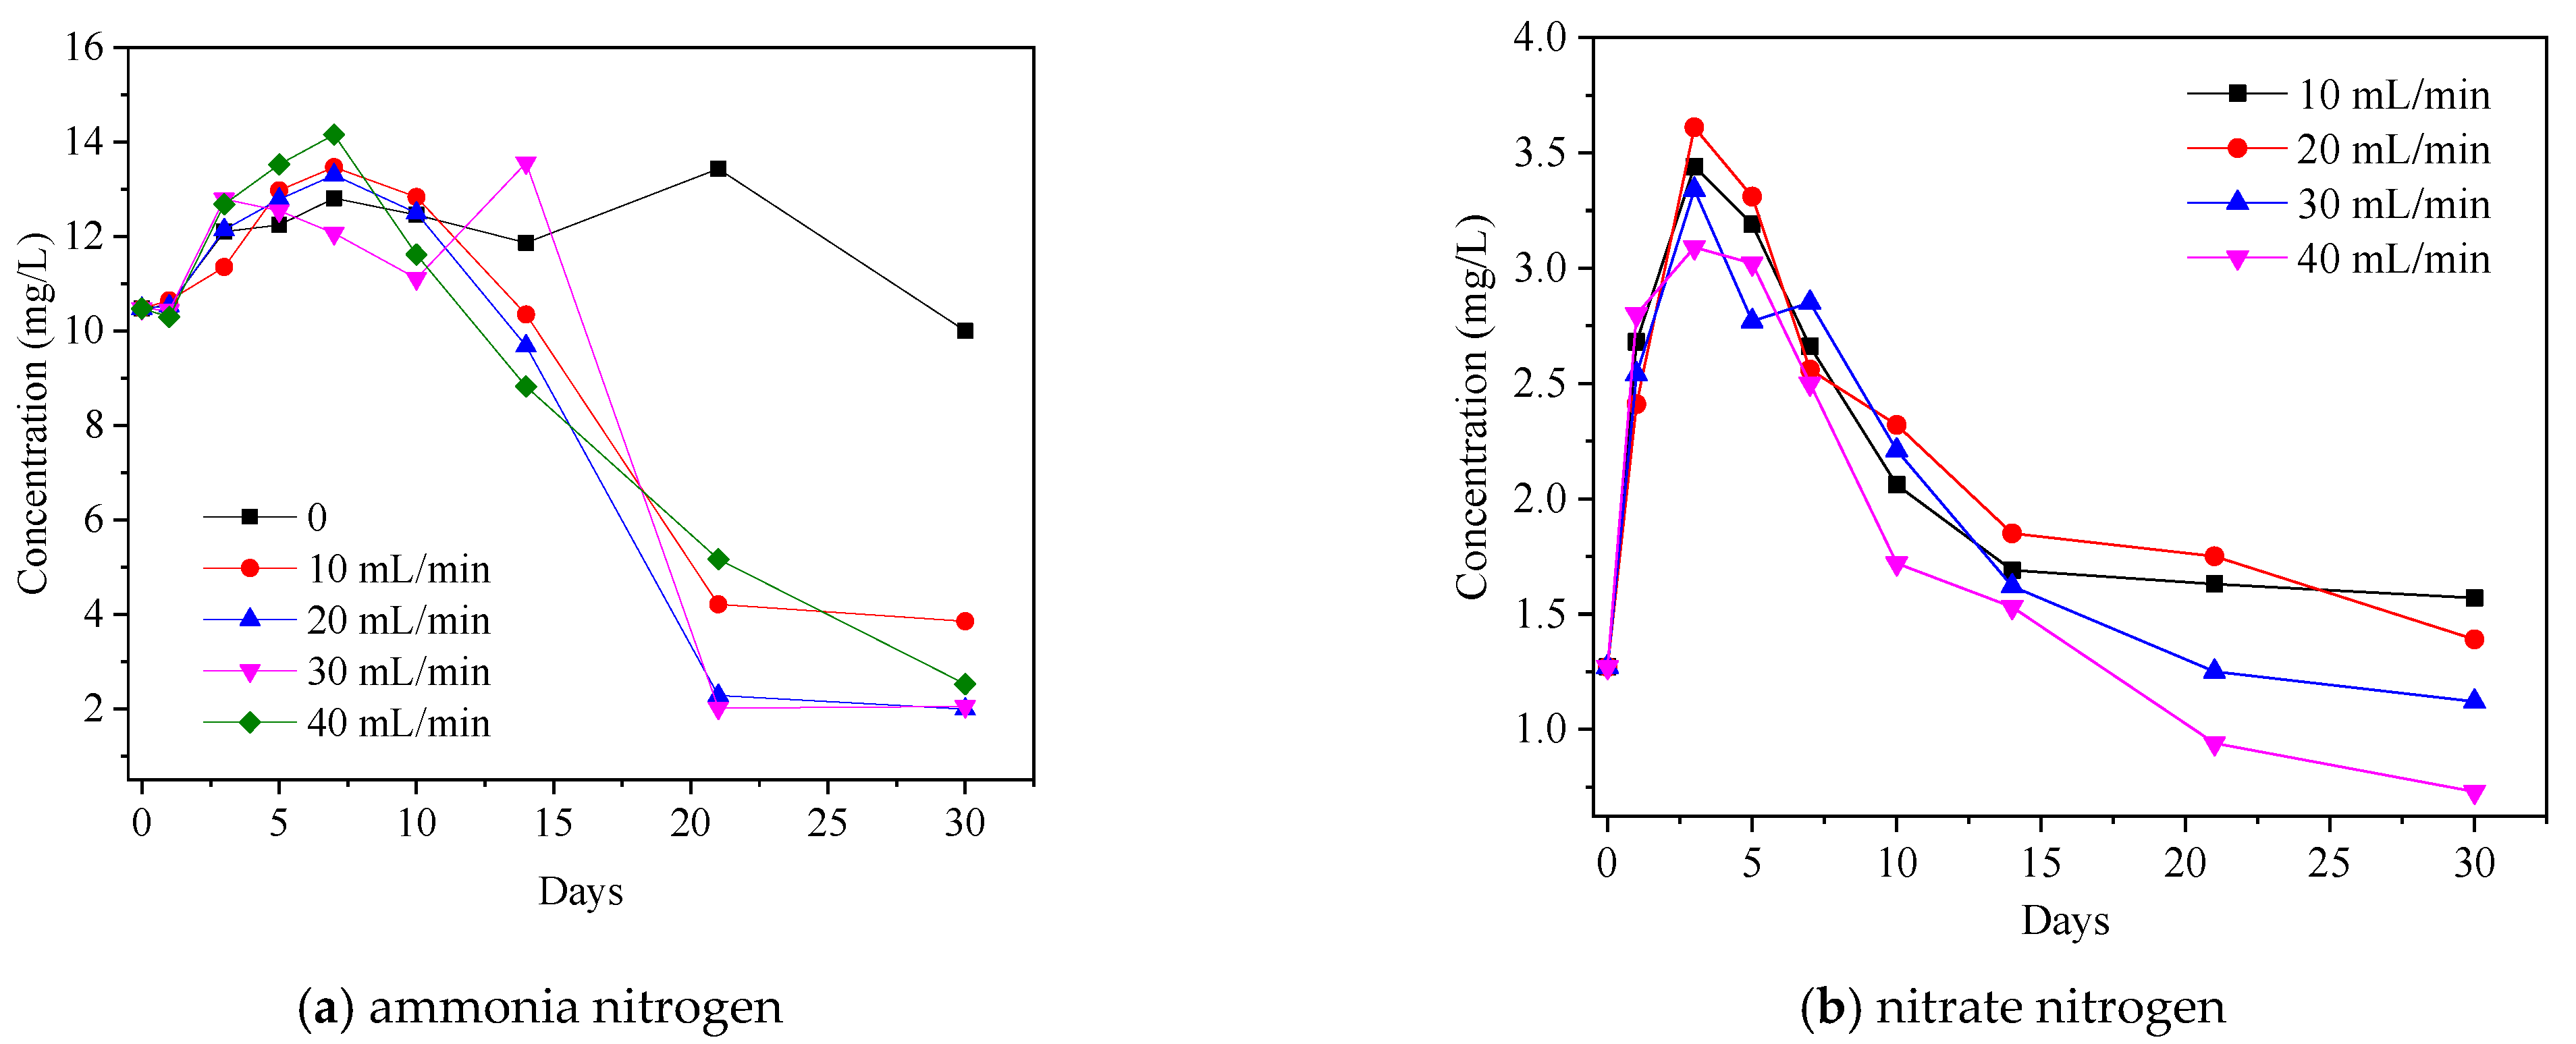
As can be seen from Figure 4a, the variation trend of ammonia nitrogen concentration in overlying water in groups with different aeration rates is basically the same, showing a trend of first increase and then decrease with the increase of test days. The concentration of ammonia nitrogen in each group reached the maximum value on the 7th day of the experiment. There is no significant difference between the concentration of ammonia nitrogen in the overlying water of each aeration rate group at 21 days and that at 30 days, indicating that the change of the concentration of ammonia nitrogen in the overlying water has reached a basically stable level at 21 days. Compared with the test days, the change of ammonia nitrogen concentration in overlying water is small under different aeration rates. The lowest concentration of ammonia nitrogen in overlying water was 1.966 mg/L when the aeration rate was 20 mL/min and the test days were 30 days.
As can be seen from Figure 4b, the concentration of nitrate nitrogen in each aeration rate group firstly increased and then decreased with the extension of the test days, and the decrease range of nitrate nitrogen concentration became more obvious with the increase of aeration rate. When the aeration rates were 30 mL/min and 40 mL/min, the concentration of nitrate nitrogen in the overlying water was lower than the initial state after 21 days, indicating that the addition of calcium nitrate would not release excess nitrate into the water under the conditions of such a dosage and aeration rate.
In summary, the main chemical reactions during the removal of ammonia nitrogen and nitrate nitrogen were illustrated as follows:
2NH4+ + 3O2→2NO2− + 4H+ + 2H2O
2NO2− + O2→2NO3−
C6H12O6 + 12NO3−→12NO2− + 6CO2 + 6H2O
C6H12O6 + 8NO2−→4N2 +2CO2 +6 H2O + 4CO32−
6NO3− + 2CH3OH→6NO2− + 2CO2 + 4H2O
6NO2− + 3CH3OH→3N2 + 3H2O + 6OH− + 3CO2
The ammonia nitrogen was firstly oxidized to nitrous nitrogen and nitrate nitrogen in the presence of oxygen. Adding nitrate and in aerobic state can promote the degradation of organic matter and produce heterotrophic nitrification denitrification, that is, the transformation of ammonia nitrogen, nitrate nitrogen and organic matter. Finally, it escapes into the air in the form of N2.
4. Discussion
4.1. Analysis on Inhibition Degree of Ammonia Nitrogen and Nitrate Nitrogen in Sediment with Different Dosage of Calcium Nitrate
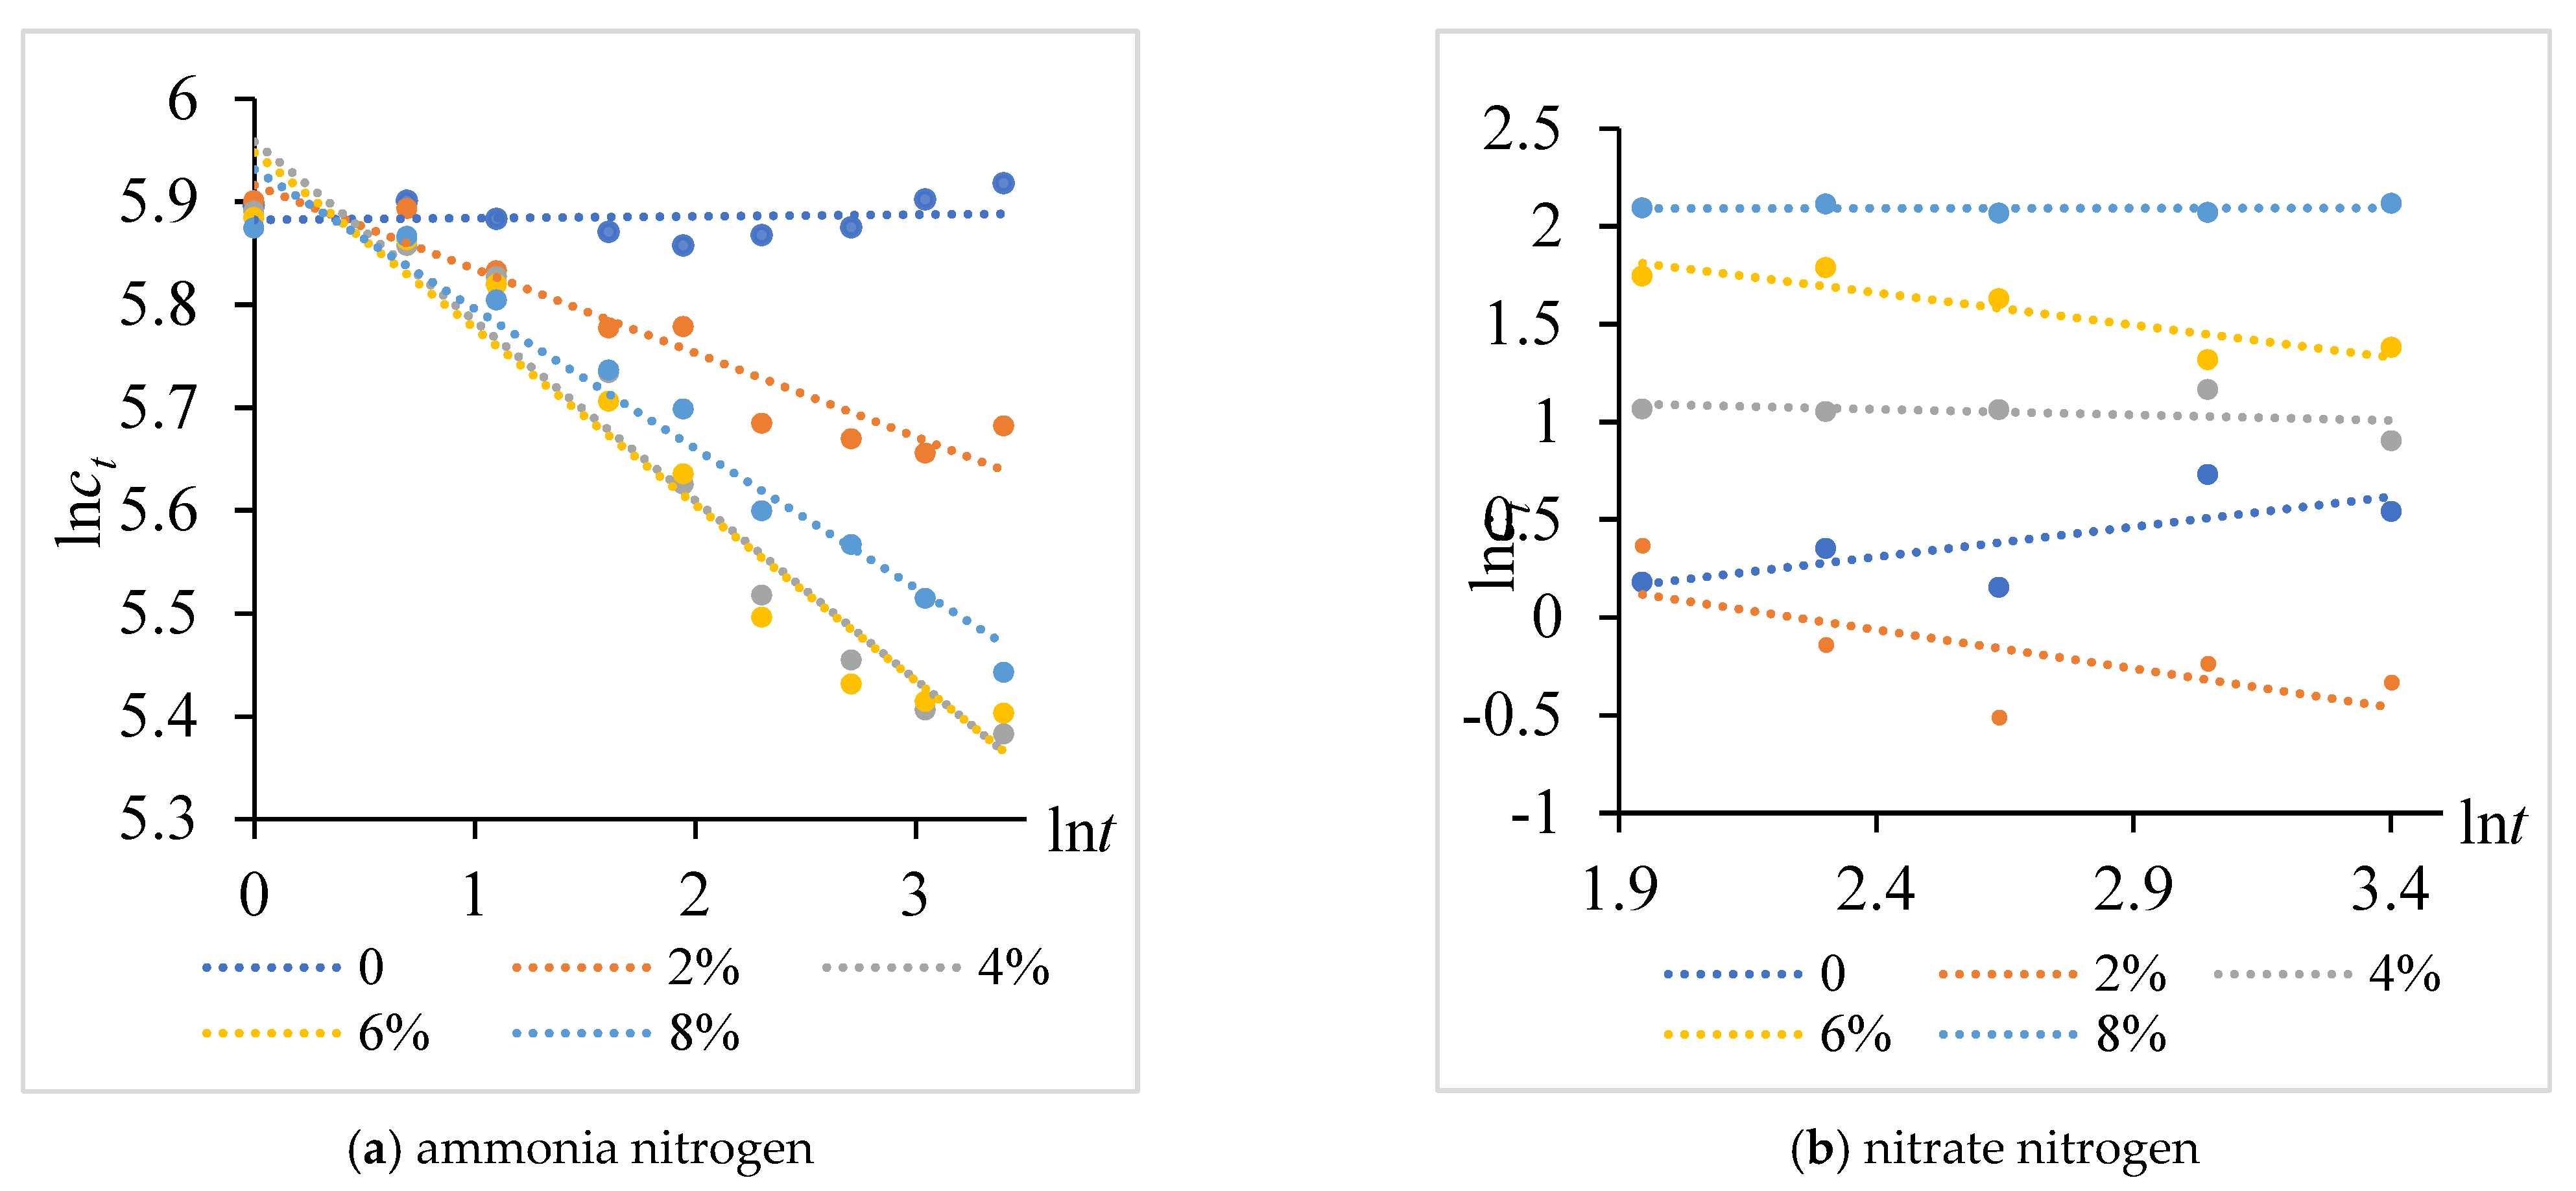
In order to further study the inhibition degree of calcium nitrate on ammonia nitrogen and nitrate nitrogen in sediment, logarithm of test days and concentration were taken, and linear regression was carried out.
The regression equation is lnct = alnt + b or ct = ebta, which can be simplified as ct = kta. Where, t is the test days, ct is the content of ammonia nitrogen or nitrate nitrogen in sediment on day t, and a and k are constants, where a reflects the change rate of ammonia nitrogen or nitrate nitrogen content in sediment and k reflects the stable content of nitrate nitrogen or ammonia nitrogen in sediment.
It can be seen from Figure 5 and Table 2 that when the dosage of calcium nitrate was 0, the value of a in the linear fitting expression was positive, that was, the content of ammonia nitrogen and nitrate nitrogen in the sediment showed an increasing trend, which may be because nitrogen in the atmosphere was fixed under the action of microorganisms and entered the soil in the form of ammonia nitrogen and nitrate nitrogen [19,20]. When calcium nitrate was added into sediment, the value of a in the fitting expression became negative, indicating that the nitrogen fixation begins to be inhibited. When the dosage of calcium nitrate was 4% and 6%, the absolute value of a was the largest in the double logarithm linear fitting expression between ammonia nitrogen concentration and test days; When the dosage of calcium nitrate was 2% and 6%, the absolute value of a was the largest in the double logarithm linear fitting expression between nitrate nitrogen concentration and test days. Therefore, combining the two fitting results, when the dosage of calcium nitrate was 6%, the inhibition effect of nitrogen fixation was the best. When the dosage of calcium nitrate was 8%, the absolute value of a in the double logarithm linear fitting expression of ammonia nitrogen, nitrate nitrogen concentration and test days decreased, which may be because too much calcium nitrate has ecological environmental risk to microorganisms in sediment and affects the inhibition of microorganisms on nitrogen fixation [21]. The calculation showed that when the dosage of calcium nitrate was 6%, the inhibitory stable content of nitrate nitrogen was 11.65 mg/g and the inhibitory stable content of ammonia nitrogen was 382.95 mg/kg.
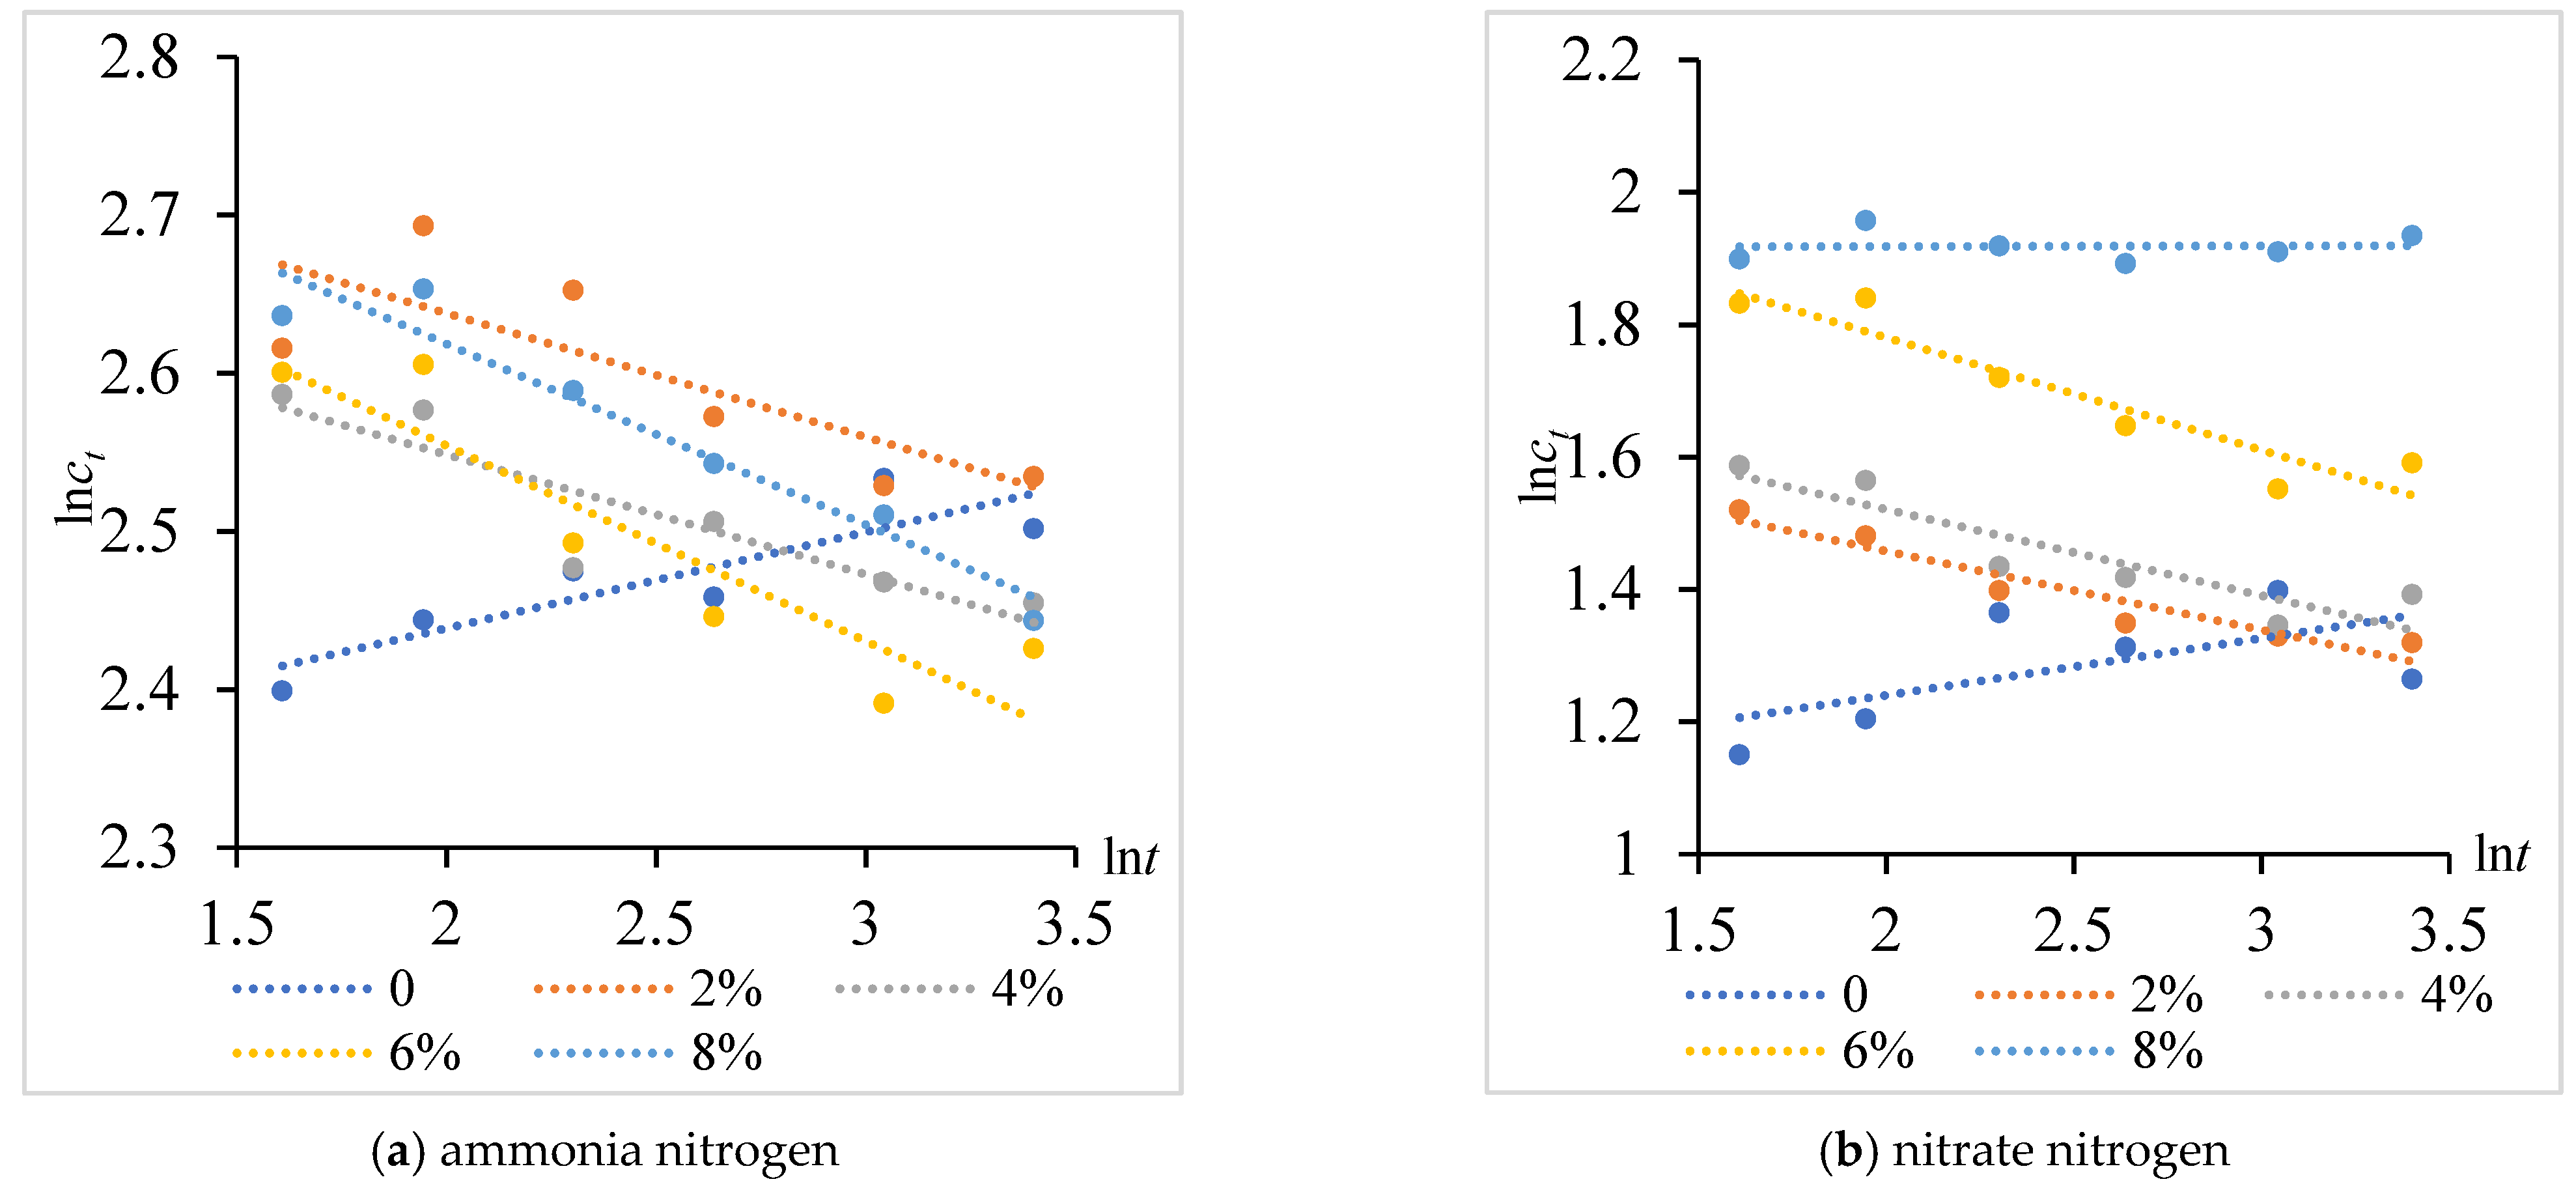
4.2. Analysis on Inhibition Degree of Ammonia Nitrogen and Nitrate Nitrogen in Overlying Water with Different Dosage of Calcium Nitrate
Similarly, logarithm and linear regression were used to further study the inhibition degree of calcium nitrate on ammonia nitrogen and nitrate nitrogen in overlying water. The regression equation is still lnct = alnt + b, or ct = ebta, which can be simplied as ct = kta. Where t is still the test days, ct is the concentration of ammonia nitrogen or nitrate nitrogen in overlying water on day t, and a and k are constants, where a reflects the change rate of ammonia nitrogen or nitrate nitrogen concentration in overlying water, and k reflects the stable concentration of nitrate nitrogen or ammonia nitrogen in overlying water. The simulation results are shown in Figure 6.
It can be seen from Table 3 that when the dosage of calcium nitrate was 0, a in the linear fitting expression was positive, that was, the concentration of ammonia nitrogen and nitrate nitrogen in the overlying water showed an increasing trend, which was mainly caused by the release of ammonia nitrogen and nitrate nitrogen in the sediment to the overlying water. When calcium nitrate was added into the bottom mud, a in the fitting expression became negative, indicating that the release effect was inhibited. By comparing the value of a under different dosages of calcium nitrate, it can be seen that when the dosage was 6% and 8%, the inhibitory effect of calcium nitrate on ammonia nitrogen release was the strongest. When the dosage was 6%, the inhibitory effect of calcium nitrate on nitrate nitrogen release was the strongest, but when the dosage was 8%, the inhibitory effect of calcium nitrate on nitrate nitrogen release was significantly weakened. This may be caused by the excessive addition of calcium nitrate, which does some harm to microorganisms [22]. The calculation showed that when the dosage of calcium nitrate was 6%, the inhibitory stable concentration of nitrate nitrogen was 8.34 mg/L and the inhibitory stable concentration of ammonia nitrogen was 16.47 mg/L.
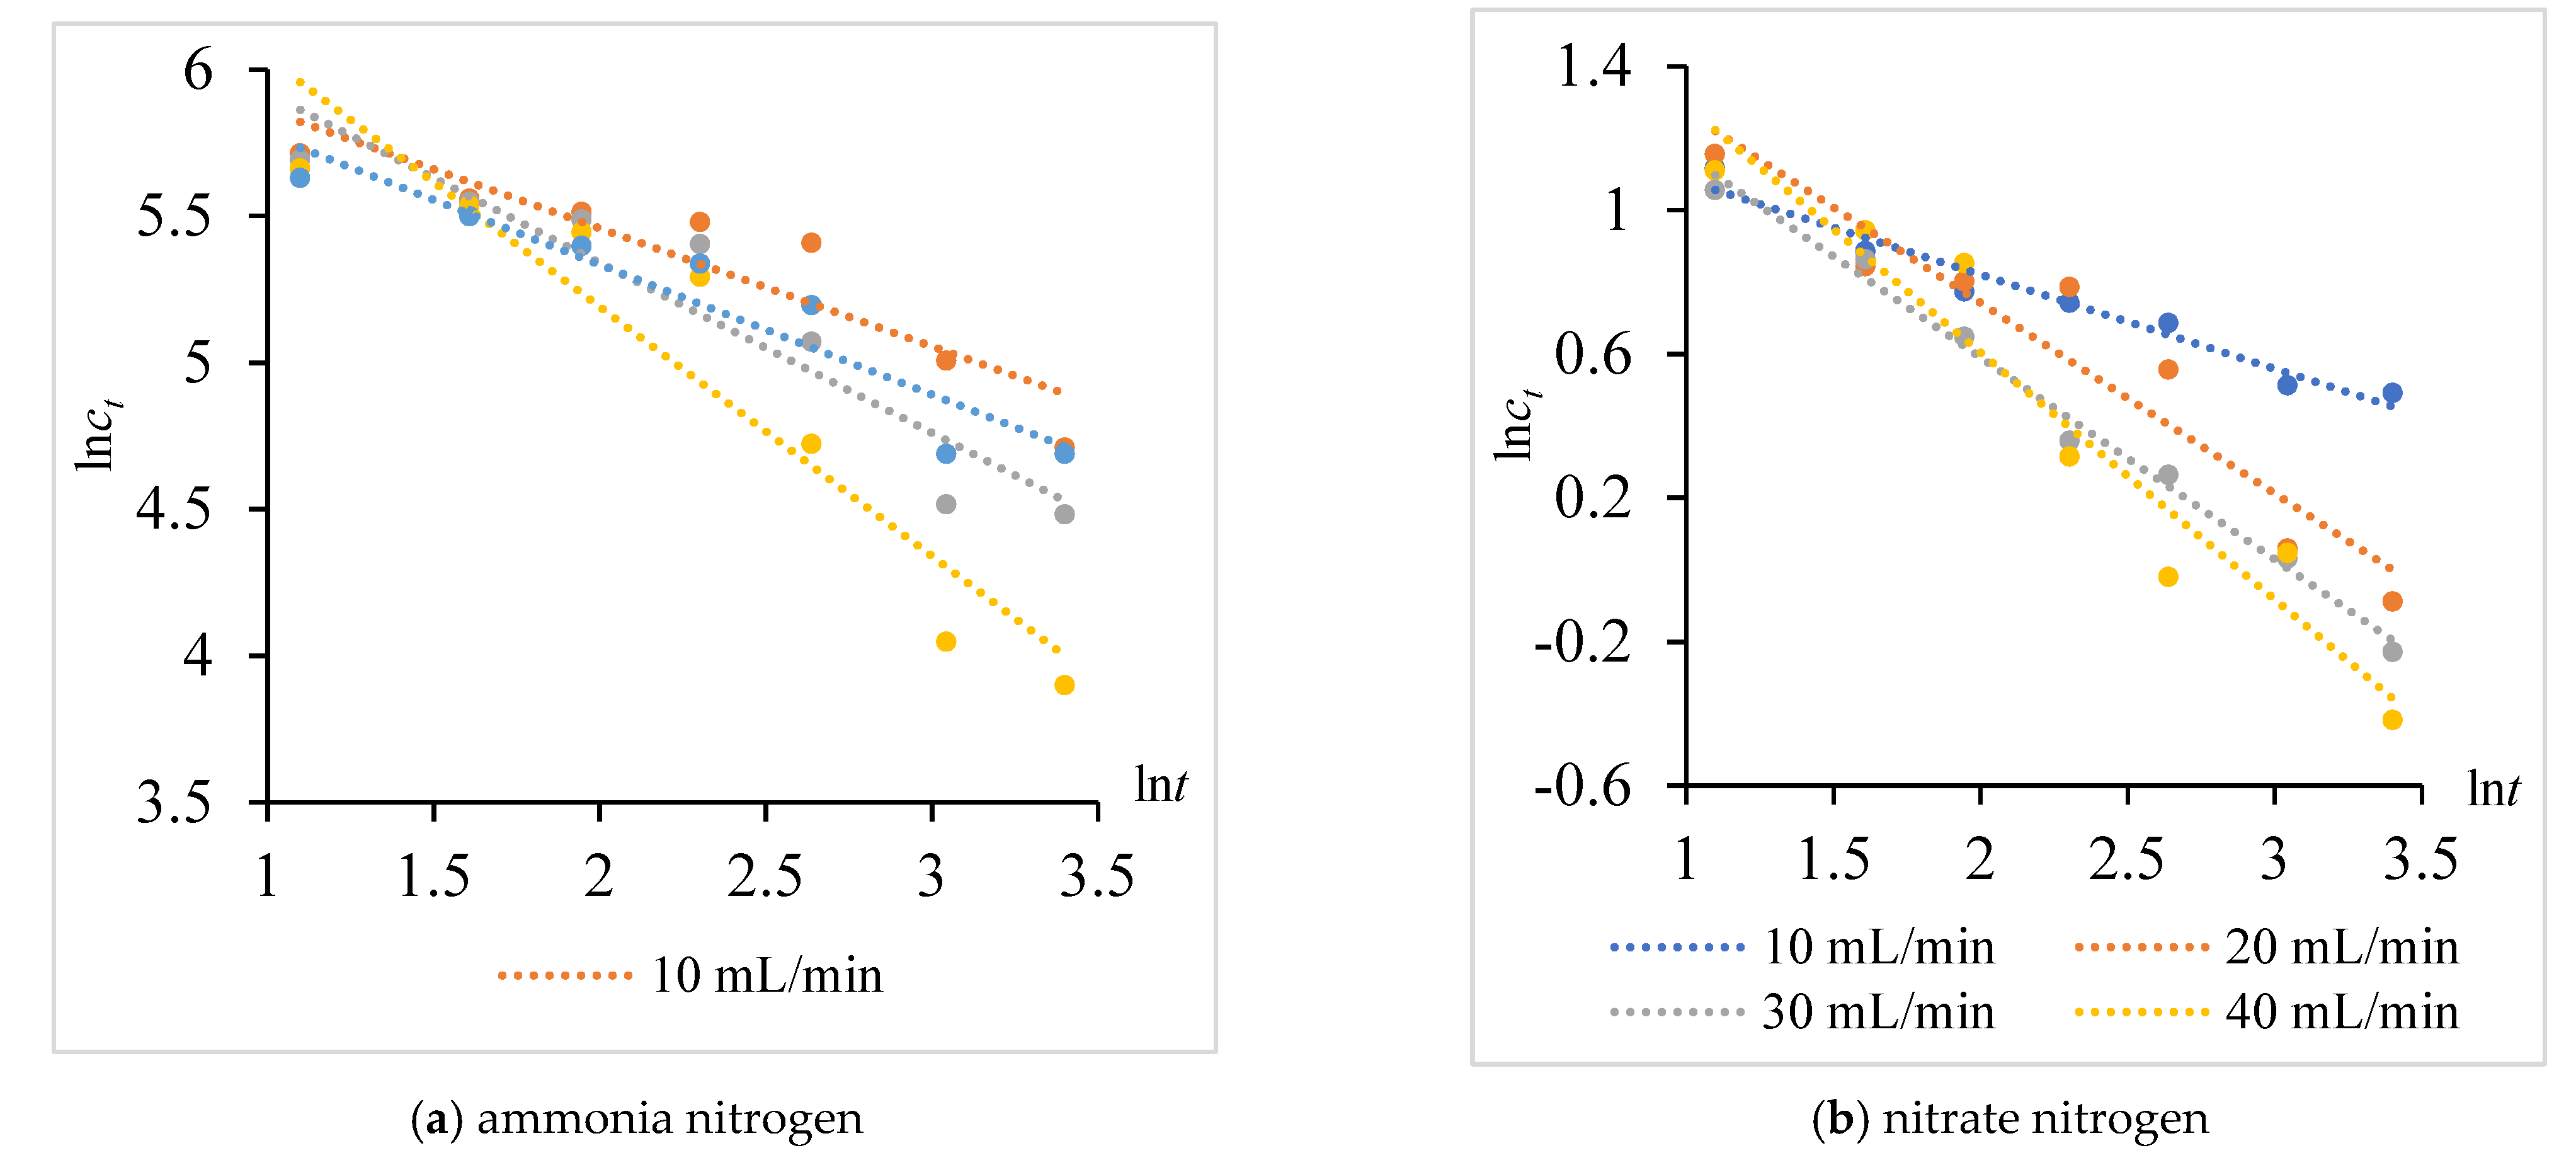
4.3. Analysis on Inhibition Degree of Ammonia Nitrogen and Nitrate Nitrogen in Sediment with Different Aeration Rates
The linear regression method in 4.1 was used to study the inhibition of low oxygen aeration on ammonia nitrogen and nitrate nitrogen in sediment. The form of regression equation and the meaning of each parameter were consistent with 4.1. Results are shown in Figure 7.
It can be seen from the double logarithm linear expression under different aeration rates in Table 4 that with the continuous increase of aeration concentration, the inhibition of ammonia nitrogen and nitrate nitrogen in sediment continued to increase, and the inhibition of ammonia nitrogen reached the strongest when the aeration rate was 30 mL/min. When the aeration rate was 40 mL/min, the inhibition effect on nitrate nitrogen reached its strongest, but the inhibition effect on ammonia nitrogen was greatly weakened, which may be due to the disturbance of sediment caused by too high an aeration rate, which cannot play a good inhibitory effect on microorganisms [23]. According to the calculation, when the aeration rate was 30 mL/min, the inhibitory stable content of nitrate nitrogen was 5.55 mg/g and the inhibitory stable content of ammonia nitrogen was 982.79 mg/kg.
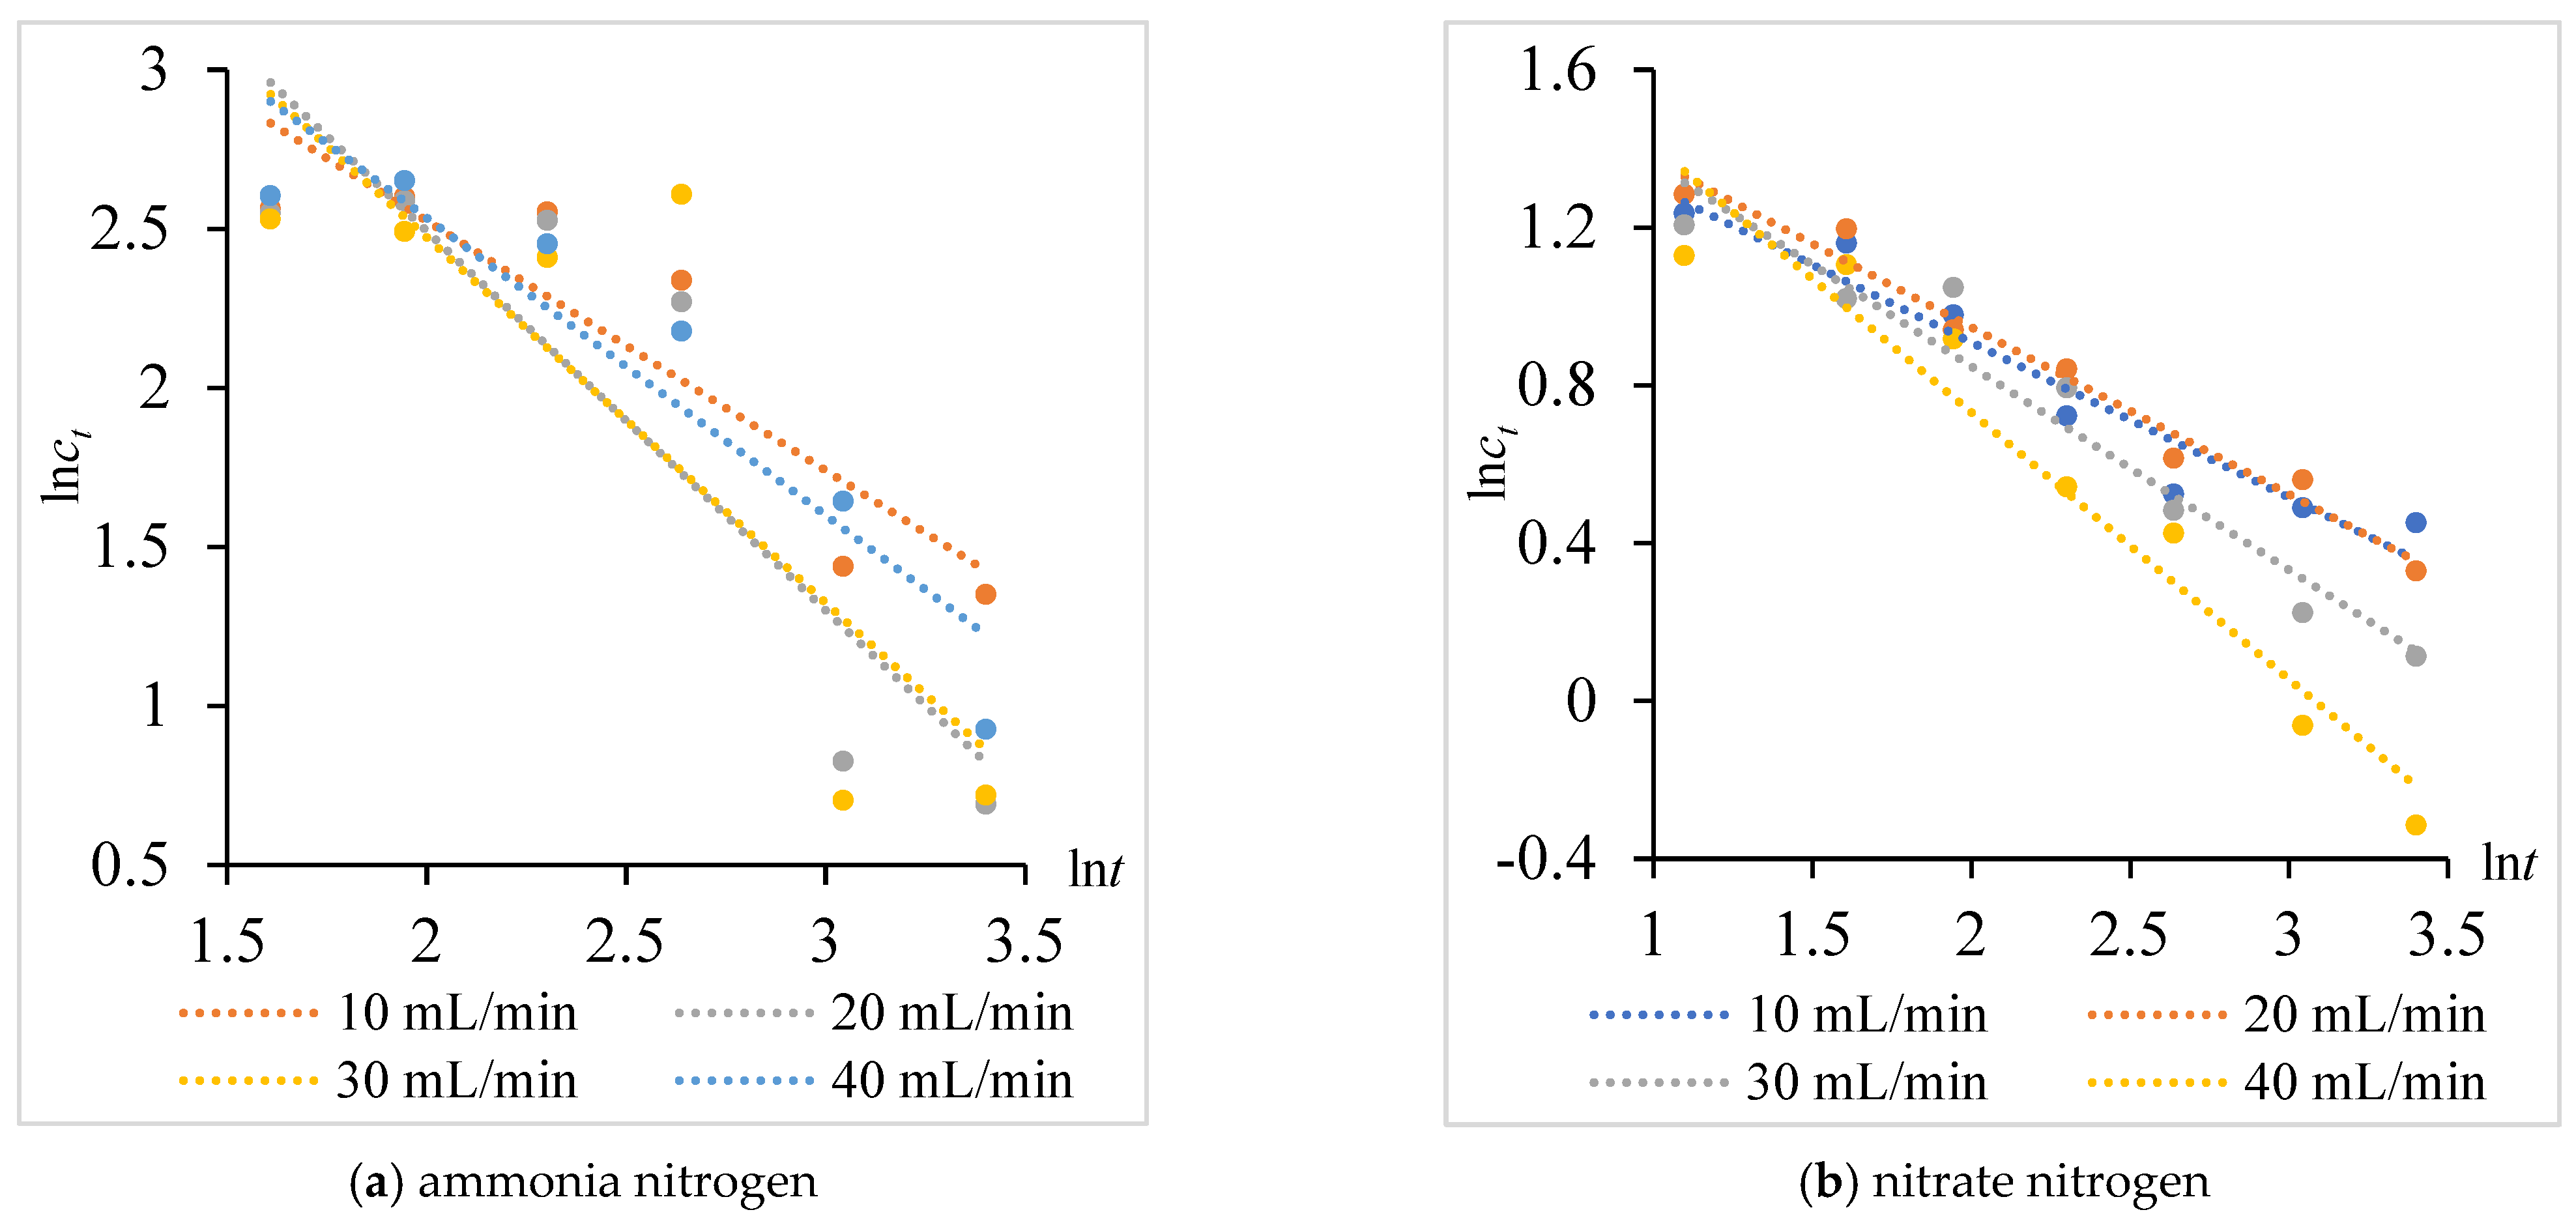
4.4. Analysis on Inhibition Degree of Ammonia Nitrogen and Nitrate Nitrogen in Overlying Water with Different Aeration Rates
The linear regression method in 4.2 was used to study the inhibition of low oxygen aeration on ammonia nitrogen and nitrate nitrogen in overlying water. The form of regression equation and the meaning of each parameter were consistent with 4.2. Results are shown in Figure 8. The double logarithm linear expressions are shown in Table 5.
By comparing the values of a at different aeration rates, it can be seen that when the aeration rates were 20 mL/min and 30 mL/min, the inhibition effect of aeration on ammonia nitrogen release is the strongest. When the aeration rate was 40 mL/min, the inhibition effect of aeration on nitrate nitrogen release was the strongest. Since ammonia nitrogen in overlying water was the main substance causing water body odor, the inhibition effect on ammonia nitrogen release was given priority, so the optimal aeration rate was 30 mL/min. According to the calculation, when the aeration rate was 30 mL/min, the stable inhibitory concentration of nitrate nitrogen was 6.55 mg/L and the stable inhibitory concentration of ammonia nitrogen was 118.20 mg/L.
5. Conclusions
In this study, the organic pollutants in sediment were degraded by adding calcium nitrate and low oxygen aeration to achieve the purpose of nitrogen removal. The main conclusions are as follows:
Adding calcium nitrate can effectively remove ammonia nitrogen in the sediment. The optimal dosage of calcium nitrate is 6%, and the test duration is 21 days. However, the removal effect of ammonia nitrogen in the overlying water was not obvious, and the large amount of nitrate nitrogen produced by adding calcium nitrate could not be removed.
The ammonia nitrogen and nitrate nitrogen can be effectively removed from the bottom mud and overlying water by adding calcium nitrate and low oxygen aeration, and the nitrate nitrogen generated by the introduction of calcium nitrate can be effectively eliminated. The optimal aeration rate is 30 mL/min.
Under the optimal experimental conditions, the stable inhibitory content of nitrate nitrogen in sediment was 5.55 mg/g, and the stable inhibitory content of ammonia nitrogen was 982.79 mg/kg. The stable inhibitory concentration of nitrate nitrogen and ammonia nitrogen in overlying water was 6.55 mg/L and 118.20 mg/L.
Author Contributions
Conceptualization, F.W. and F.Y.; methodology, F.W.; software, F.Y.; validation, H.G., H.L. (Haiqing Liao) and H.L. (Haisheng Li); formal analysis, Y.B.; investigation, Y.B.; resources, F.Y.; data curation, F.W.; writing—original draft preparation, F.W.; writing—review and editing, F.Y.; visualization, Y.B.; supervision, H.L. (Haisheng Li); project administration, H.G.; funding acquisition, F.Y. All authors have read and agreed to the published version of the manuscript.
Funding
This research was funded by the National Natural Science Foundation of China (41907338, 2019YFC0409205) and Postdoctoral Science Foundation of China (2019M660753).
Institutional Review Board Statement
Not applicable.
Informed Consent Statement
Not applicable.
Data Availability Statement
The data presented in this study are available on request from the corresponding authors.
Acknowledgments
Special thanks to anonymous reviewers for their detailed editing of the manuscript which greatly improved the readability of this work.
Conflicts of Interest
The authors declare no conflict of interest.
References
- Cao, J.; Sun, Q.; Zhao, D.; Xu, M.; Shen, Q.; Wang, D.; Wang, Y.; Ding, S. A critical review of the appearance of black-odorous waterbodies in China and treatment methods. J. Hazard. Mater. 2020, 385, 121511. [Google Scholar] [CrossRef] [PubMed]
- Wang, G.; Li, X.; Fang, Y.; Huang, R. Analysis on the formation condition of the algae-induced odorous black water agglomerate. Saudi J. Biol. Sci. 2014, 21, 597–604. [Google Scholar] [CrossRef] [PubMed] [Green Version]
- Liang, Z.; Siegert, M.; Fang, W.; Sun, Y.; Jiang, F.; Lu, H.; Chen, G.H.; Wang, S. Blackening and Odorization of Urban Rivers: A bio-geochemical process. FEMS Microbiol. Ecol. 2017, 94, fix180. [Google Scholar] [CrossRef] [PubMed] [Green Version]
- Liu, G.; Zhong, J.; He, J.; Zhang, L.; Fan, C. Effects of black spots of dead-cyanobacterial mats on Fe-S-P cycling in sediments of Zhushan Bay, Lake Taihu. Environ. Sci. 2009, 30, 2520–2526. [Google Scholar]
- Ministry of Ecology and Environment of the People’s Republic of China. Available online: http://www.mee.gov.cn/xxgk2018/xxgk/xxgk15/202001/t20200117_760049.html. (accessed on 21 December 2021).
- Bin, L.; Bai, Y.; Liu, D.; Wanf, F.; Yuan, P.; Liu, R. Nationwide distribution, problems, countermeasure proposals of black and odorous water bodies in built-up area of cities at prefecture level or above in China. Chin. J. Environ. Eng. 2019, 13, 511–518. [Google Scholar]
- Zhang, D.; Yang, H.; Lan, S.; Wang, C.; Li, X.; Xing, Y.; Yue, H.; Li, Q.; Wang, L.; Xie, Y. Evolution of urban black and odorous water: The characteristics of microbial community and driving-factors. J. Environ. Sci. 2022, 112, 94–105. [Google Scholar] [CrossRef] [PubMed]
- Liang, Z.; Fang, W.; Luo, Y.; Lu, Q.; Juneau, P.; He, Z.; Wang, S. Mechanistic insights into organic carbon-driven water blackening and odorization of urban rivers. J. Hazard. Mater. 2021, 405, 124663. [Google Scholar] [CrossRef] [PubMed]
- Liu, Y.; Niu, M.S.; Yi, X.; Li, G.; Zhou, H.; Gao, W. Boron vacancies of mesoporous MnO2 with strong acid sites, free Mn3+ species and macropore decoration for efficiently decontaminating organic and heavy metal pollutants in black-odorous waterbodies. Appl. Surf. Sci. 2021, 561, 150081. [Google Scholar] [CrossRef]
- Yin, H.; Wang, J.; Zhang, R.; Tang, W. Performance of physical and chemical methods in the co-reduction of internal phosphorus and nitrogen loading from the sediment of a black odorous river. Sci. Total Environ. 2019, 663, 68–77. [Google Scholar] [CrossRef]
- Yin, H.; Yang, P.; Kong, M. Effects of nitrate dosing on the migration of reduced sulfur in black odorous river sediment and the influencing factors. Chem. Eng. J. 2019, 371, 516–523. [Google Scholar] [CrossRef]
- Yin, Q.; Wang, Z.; Wu, G. Impacts of environmental factors on microbial diversity, distribution patterns and syntrophic correlation in anaerobic processes. Arch. Microbiol. 2019, 201, 603–614. [Google Scholar] [CrossRef] [PubMed]
- Tang, Y.; Li, M.; Zou, Y.; Lv, M.; Sun, J. Mechanism of aerobic denitrifiers and calcium nitrate on urban river sediment remediation. Int. Biodeterior. Biodegrad. 2018, 126, 119–130. [Google Scholar] [CrossRef]
- Sueitt, A.P.E.; Yamada-Ferraz, T.M.; Oliveira, A.F.; Botta, C.M.R.; Fadini, P.S.; Nascimento, M.R.L.; Faria, B.M.; Mozeto, A.A. Ecotoxicological risks of calcium nitrate exposure to freshwater tropical organisms: Laboratory and field experiments. Ecotoxicol. Environ. Saf. 2015, 117, 155–163. [Google Scholar] [CrossRef] [PubMed]
- Yu, P.; Wang, J.; Chen, J.; Guo, J.; Yang, H.; Chen, Q. Successful control of phosphorus release from sediments using oxygen nano-bubble-modified minerals. Sci. Total Environ. 2019, 663, 654–661. [Google Scholar] [CrossRef] [PubMed]
- Chen, J.; Lu, S.; Zhao, Y.; Wang, W.; Huang, M. Effects of overlying water aeration on phosphorus fractions and alkaline phosphatase activity in surface sediment. J. Environ. Sci. 2011, 23, 206–211. [Google Scholar] [CrossRef]
- Ministry of Ecology and Environment of the People’s Republic of China. Water Quality—Determination of Ammonia Nitrogen-Nessler’s Reagent Spectrophotometry. Available online: http://www.mee.gov.cn/ywgz/fgbz/bz/bzwb/jcffbz/201001/t20100112_184155.shtml. (accessed on 21 December 2021). (In Chinese)
- Ministry of Ecology and Environment of the People’s Republic of China. Water quality--Determination of Nitrate-Nitrogen--Ultraviolet Spectrophotometry. Available online: http://www.mee.gov.cn/ywgz/fgbz/bz/bzwb/jcffbz/200703/t20070316_101688.shtml. (accessed on 21 December 2021). (In Chinese)
- Li, S.; Twilley, R.; Hou, A.; Hou, A. Heterotrophic nitrogen fixation in response to nitrate loading and sediment organic matter in an emerging coastal deltaic floodplain within the Mississippi River Delta plain. Limnol. Oceanogr. 2021, 66, 1962–1978. [Google Scholar] [CrossRef]
- Tian, L.; Yan, Z.; Wang, C.; Xu, S.; Jiang, H. Habitat heterogeneity induces regional differences in sediment nitrogen fixation in eutrophic freshwater lake. Sci. Total Environ. 2021, 772, 145594. [Google Scholar] [CrossRef] [PubMed]
- Yamada, T.M.; Sueitt, A.P.E.; Beraldo, D.A.S.; Botta, C.M.R.; Fadini, P.S.; Nascimento, M.R.L.; Faria, B.M.; Mozeto, A.A. Calcium nitrate addition to control the internal load of phosphorus from sediments of a tropical eutrophic reservoir: Microcosm experiments. Water Res. 2012, 46, 6463–6475. [Google Scholar] [CrossRef] [PubMed]
- He, Z.; Huang, R.; Liang, Y.; Yu, G.; Chong, Y.; Wang, L. Index for nitrate dosage calculation on sediment odor control using nitrate-dependent ferrous and sulfide oxidation interactions. J. Environ. Manag. 2018, 226, 289–297. [Google Scholar] [CrossRef] [PubMed]
- Bittman, S.; van Vliet, L.J.; Kowalenko, C.G.; McGinn, S.; Hunt, D.E.; Bounaix, F. Surface-Banding Liquid Manure over Aeration Slots: A New Low-Disturbance Method for Reducing Ammonia Emissions and Improving Yield of Perennial Grasses. Agron. J. 2005, 97, 1304–1313. [Google Scholar] [CrossRef] [Green Version]
Figure 1.
Variation of ammonia nitrogen/nitrate nitrogen content in sediments.

Figure 2.
Variation of ammonia nitrogen/nitrate nitrogen concentrations in overlying water.

Figure 3.
Variation of ammonia nitrogen/nitrate nitrogen content in sediments under aeration.

Figure 4.
Variation of ammonia nitrogen/nitrate nitrogen concentrations in overlying water under aeration.
Figure 4.
Variation of ammonia nitrogen/nitrate nitrogen concentrations in overlying water under aeration.

Figure 5.
Double logarithm regression relationship between ammonia nitrogen/nitrate nitrogen content in sediment and test days.
Figure 5.
Double logarithm regression relationship between ammonia nitrogen/nitrate nitrogen content in sediment and test days.

Figure 6.
Double logarithm regression relationship between ammonia nitrogen/nitrate nitrogen concentration in overlying water and test days.
Figure 6.
Double logarithm regression relationship between ammonia nitrogen/nitrate nitrogen concentration in overlying water and test days.

Figure 7.
Double logarithm regression relationship between ammonia nitrogen/nitrate nitrogen content in sediment and test days under aeration.
Figure 7.
Double logarithm regression relationship between ammonia nitrogen/nitrate nitrogen content in sediment and test days under aeration.

Figure 8.
Double logarithm regression relationship between ammonia nitrogen/nitrate nitrogen concentration in overlying water and test days under aeration.
Figure 8.
Double logarithm regression relationship between ammonia nitrogen/nitrate nitrogen concentration in overlying water and test days under aeration.


Table 1.
Physical and chemical properties of experimental sediment.
| Sample | Indicator | Unit | Background Value |
|---|---|---|---|
| Overlying water | pH | - | 7.34 ± 0.39 |
| ORP | mV | −58.6 ± 1.24 | |
| DO | mg/L | 0.48 ± 0.12 | |
| NH3-N | mg/L | 9.10 ± 0.43 | |
| COD | mg/L | 182.81 ± 3.93 | |
| Sediment | moisture content | % | 49.04 ± 2.01 |
| pH | - | 7.06 ± 0.35 | |
| NH3-N | mg/L | 364.94 ± 4.06 |
Table 2.
Double logarithm linear expression between ammonia nitrogen/nitrate nitrogen content in sediment and test days.
Table 2.
Double logarithm linear expression between ammonia nitrogen/nitrate nitrogen content in sediment and test days.
| Dosage of Calcium Nitrate | Double Logarithm Relation (Ammonia Nitrogen) | R2 | Double Logarithm Relation (Nitrate Nitrogen) | R2 |
|---|---|---|---|---|
| 0 | lnct = 0.0017lnt + 5.8824 | 0.7593 | lnct = 0.3084lnt − 0.4313 | 0.8301 |
| 2% | lnct = −0.0815lnt + 5.9161 | 0.9126 | lnct = −0.3974lnt + 0.8904 | 0.6853 |
| 4% | lnct = −0.1743lnt + 5.5983 | 0.9536 | lnct = −0.0573lnt + 1.2019 | 0.7225 |
| 6% | lnct = −0.1712lnt + 5.9479 | 0.9431 | lnct = −0.3311lnt + 2.4552 | 0.8081 |
| 8% | lnct = −0.1357lnt + 5.9314 | 0.9670 | lnct = 0.0014lnt + 2.0889 | 0.7011 |
Table 3.
Double logarithm linear expression between ammonia nitrogen/nitrate nitrogen concentration in overlying water and test days.
Table 3.
Double logarithm linear expression between ammonia nitrogen/nitrate nitrogen concentration in overlying water and test days.
| Dosage of Calcium Nitrate | Double Logarithm Relation (Ammonia Nitrogen) | R2 | Double Logarithm Relation (Nitrate Nitrogen) | R2 |
|---|---|---|---|---|
| 0 | lnct = 0.0609lnt + 2.3169 | 0.7740 | lnct = 0.0862lnt + 1.0678 | 0.7753 |
| 2% | lnct = −0.0784lnt + 2.7947 | 0.7378 | lnct = −0.119lnt + 1.6959 | 0.9168 |
| 4% | lnct = −0.0758lnt + 2.7002 | 0.8023 | lnct = −0.1302lnt + 1.7814 | 0.8178 |
| 6% | lnct = −0.1238lnt + 2.8018 | 0.8405 | lnct = −0.1701lnt + 2.1208 | 0.8856 |
| 8% | lnct = −0.1145lnt + 2.8475 | 0.9398 | lnct = 0.0008lnt + 1.9165 | 0.7005 |
Table 4.
Double logarithm linear expression between ammonia nitrogen/nitrate nitrogen content in sediment and test days under aeration.
Table 4.
Double logarithm linear expression between ammonia nitrogen/nitrate nitrogen content in sediment and test days under aeration.
| Aeration Rate | Double Logarithm Relation (Ammonia Nitrogen) | R2 | Double Logarithm Relation (Nitrate Nitrogen) | R2 |
|---|---|---|---|---|
| 10 mL/min | lnct = −0.4026lnt + 6.2634 | 0.8473 | lnct = −0.2617lnt + 1.3442 | 0.9555 |
| 20 mL/min | lnct = −0.5792lnt + 6.4985 | 0.8915 | lnct = −0.5303lnt + 1.8030 | 0.9127 |
| 30 mL/min | lnct = −0.8499lnt + 6.8904 | 0.8930 | lnct = −0.5618lnt + 1.7145 | 0.9904 |
| 40 mL/min | lnct = −0.4426lnt + 6.219 | 0.8992 | lnct = −0.6863lnt + 1.9767 | 0.9331 |
Table 5.
Double logarithm linear expression between ammonia nitrogen/nitrate nitrogen concentration in overlying water and test days under aeration.
Table 5.
Double logarithm linear expression between ammonia nitrogen/nitrate nitrogen concentration in overlying water and test days under aeration.
| Aeration Rate | Double Logarithm Relation (Ammonia Nitrogen) | R2 | Double Logarithm Relation (Nitrate Nitrogen) | R2 |
|---|---|---|---|---|
| 10 mL/min | lnct = −0.7851lnt + 4.0957 | 0.8145 | lnct = −0.3934lnt + 1.6959 | 0.9331 |
| 20 mL/min | lnct = −1.1932lnt + 4.8799 | 0.7994 | lnct = −0.4235lnt + 1.7944 | 0.9752 |
| 30 mL/min | lnct = −1.1495lnt + 4.7724 | 0.6914 | lnct = −0.5159lnt + 1.8799 | 0.9450 |
| 40 mL/min | lnct = −0.9356lnt + 4.4059 | 0.8743 | lnct = −0.6770lnt + 2.0859 | 0.9411 |
Publisher’s Note: MDPI stays neutral with regard to jurisdictional claims in published maps and institutional affiliations. |
© 2022 by the authors. Licensee MDPI, Basel, Switzerland. This article is an open access article distributed under the terms and conditions of the Creative Commons Attribution (CC BY) license (https://creativecommons.org/licenses/by/4.0/).
Share and Cite
MDPI and ACS Style
Wang, F.; Yang, F.; Gao, H.; Bai, Y.; Liao, H.; Li, H. Simulation of Denitrification Process of Calcium Nitrate Combined with Low Oxygen Aeration Based on Double Logarithm Mode. Water 2022, 14, 269. https://doi.org/10.3390/w14020269
AMA Style
Wang F, Yang F, Gao H, Bai Y, Liao H, Li H. Simulation of Denitrification Process of Calcium Nitrate Combined with Low Oxygen Aeration Based on Double Logarithm Mode. Water. 2022; 14(2):269. https://doi.org/10.3390/w14020269
Chicago/Turabian StyleWang, Fan, Fang Yang, Hongjie Gao, Yangwei Bai, Haiqing Liao, and Haisheng Li. 2022. "Simulation of Denitrification Process of Calcium Nitrate Combined with Low Oxygen Aeration Based on Double Logarithm Mode" Water 14, no. 2: 269. https://doi.org/10.3390/w14020269
Note that from the first issue of 2016, this journal uses article numbers instead of page numbers. See further details here.