Article

Development and Application of an Urban Flood Forecasting and Warning Process to Reduce Urban Flood Damage: A Case Study of Dorim River Basin, Seoul

1
Urban Flood Research Institute, University of Seoul, Seoul 02504, Korea
2
Water Resources Environment Research Institute, K-Water Research Institute, Daejeon 34045, Korea
*
Author to whom correspondence should be addressed.
Water 2022, 14(2), 187; https://doi.org/10.3390/w14020187
Submission received: 24 November 2021 / Revised: 25 December 2021 / Accepted: 6 January 2022 / Published: 10 January 2022

Abstract

:
Early and accurate flood forecasting and warning for urban flood risk areas is an essential factor to reduce flood damage. This paper presents the urban flood forecasting and warning process to reduce damage in the main flood risk area of South Korea. This process is developed based on the rainfall-runoff model and deep learning model. A model-driven method was devised to construct the accurate physical model with combined inland-river and flood control facilities, such as pump stations and underground storages. To calibrate the rainfall-runoff model, data of gauging stations and pump stations of an urban stream in August 2020 were used, and the model result was presented as an R2 value of 0.63~0.79. Accurate flood warning criteria of the urban stream were analyzed according to the various rainfall scenarios from the model-driven method. As flood forecasting and warning in the urban stream, deep learning models, vanilla ANN, Long Short-Term Memory (LSTM), Stack-LSTM, and Bidirectional LSTM were constructed. Deep learning models using 10-min hydrological time-series data from gauging stations were trained to warn of expected flood risks based on the water level in the urban stream. A forecasting and warning method that applied the bidirectional LSTM showed an R2 value of 0.9 for the water level forecast with 30 min lead time, indicating the possibility of effective flood forecasting and warning. This case study aims to contribute to the reduction of casualties and flood damage in urban streams and accurate flood warnings in typical urban flood risk areas of South Korea. The developed urban flood forecasting and warning process can be applied effectively as a non-structural measure to mitigate urban flood damage and can be extended considering watershed characteristics.

1. Introduction

Urban flooding is one of the most damaging natural disasters to human life and property worldwide, and the frequent occurrence of flood damage in recent years has highlighted the need to prevent and reduce urban flooding [1,2,3]. The Sixth Assessment Report recently published by the IPCC revealed that an unprecedented climate change in modern human history is occurring, and the surface temperature has risen rapidly since the Fifth Assessment Report to record the highest since 1850 [4]. With temperatures now 1.2° higher than in the past due to climate change, survey results indicate that the likelihood of large-scale flooding events is up to nine times higher and rainfall up to 19% higher [5], and urban flood damages are increasing worldwide owing to the impacts of urbanization and increase in property values [6,7,8,9]. The major urban areas in South Korea are also experiencing a rapid increase in flood damage due to increased urbanization and torrential rainfall caused by climate change, resulting in casualties and property damage [10,11]. The flood damage in an urban stream is an integrated result of processes in the drainage basin with high portions of impervious areas and high values of the runoff coefficient [12]. Additionally, flash flood, river regulation (e.g., channel straightening and shortening, riverside walking trail), and flood control facilities (e.g., dikes and pump station) increase the flood risk in an urban stream [13]. To reduce flood damage effectively, structural measures, as well as non-structural measures, such as accurate and preemptive flood forecasting and warning, are necessary [14,15,16,17]. Especially, with the development and maturity of machine learning algorithms, extensive advanced deep learning technologies, such as artificial intelligence, have been successfully applied for the prediction of time series data in the hydrological area. Important research trends for establishing the optimal urban flood forecasting and warning method are the previous artificial intelligence-based time-series learning using a neural network theory that first began with McCulloch and Pitts [18], and based on this research, the backpropagation learning algorithm developed for the nonlinear signal processing by Lepedes [19,20,21], which initiated time-series future value forecasting studies. With these studies as leads, research employing artificial neural networks (ANNs) is actively carried out in the field of hydrology. The following studies demonstrate the beginning of the use of deep learning models. Karunanithi performed a river discharge forecasting study using the artificial neural network theory [22]. Rangari resolved one-hour rainfall data of Hyderabad, India into 15, 30, and 45-min data using the ANN algorithm, to use them as input for urban flood analysis [23]. Tran and Song used the recurrent neural network (RNN), recurrent neural network-back propagation through time (BPTT), and LSTM for learning the water level data from Trinity River in the United States to present the most accurate LSTM forecasting results [24]. Recently developed neural network models include the feature-enhanced regression model (FER), which is a stacked autoencoder (SAE) combined with LSTM to predict the storage basin inflow rate [25], and time-series forecasting studies using bidirectional LSTM are actively conducted [26].
As global urban flood damage due to climate change intensifies, efforts to reduce such flood damages by predicting and warning are also becoming an issue [27,28,29,30,31,32]. A considerable number of studies have already developed integrated forecasting and warning systems for urban flooding in developed nations including the United States, European countries, Japan, and so on, non-structural flood protection measures, and a flood protection concept that organically links inland and outland water in urban areas were introduced where structural flood control systems were inadequate for flood damage mitigation. The European Flood Awareness System (EFAS) provides probabilistic flood forecast data 10 days before a flood occurrence to national authorities of the European Union and the Emergency Response Coordination Center of the European Commission [33,34]. Similarly, the Thames Estuary 2100 (TE 2100 project) provides a 36-h flood risk forecasting and warning by connecting weather stations and weather satellites. It establishes flood management plans phased according to climate change for the Thames River basin and specific areas in London and provides situational codes of conduct. Such flood forecasting provides essential data for determining actions to protect citizens, properties, and various infrastructures in urban and industrial areas. [35,36]. However, in Korea, most flood forecasting and warning are based on extensive river flood forecasting systems, and it is not easy to reflect the watershed characteristics of urban hydrological systems that connect inland and rivers in urban areas, and it is difficult to predict and prevent urban stream damages due to rapid rainfall and pump stations [13].
Therefore, this study presents an optimal flood forecasting and warning method based on the runoff model and deep learning techniques to prevent casualties in an urban stream from urban flash floods and reduce urban flood damages. A highly urbanized basin and flood risky area called Dorim river basin in Seoul city was selected as a case study. First, the rainfall-runoff model of the target area was constructed considering the combined inland-river, flood control facilities, and the stream elevation scenario according to the rainfall intensity was analyzed for warning of flood damage. Based on this work, flood forecasting and warning criteria were calculated, various deep learning models were constructed, and time-series data from gauging stations were trained to forecast and warn water levels of flood-prone areas. For effective urban flood forecasting and warning, relevant analyses must consider accurate hydrological time-series data construction and temporal and spatial properties of the target urban basin (inland and outland water connection analysis, real-time water level, hydrological data such as flow rate, flood control facility operational data, basin spatial data, and urban hydrological system such as an urban network). In particular, early and accurate flood forecasting for urban flood risk areas is an essential prerequisite for reliable urban flood forecasting and warning.

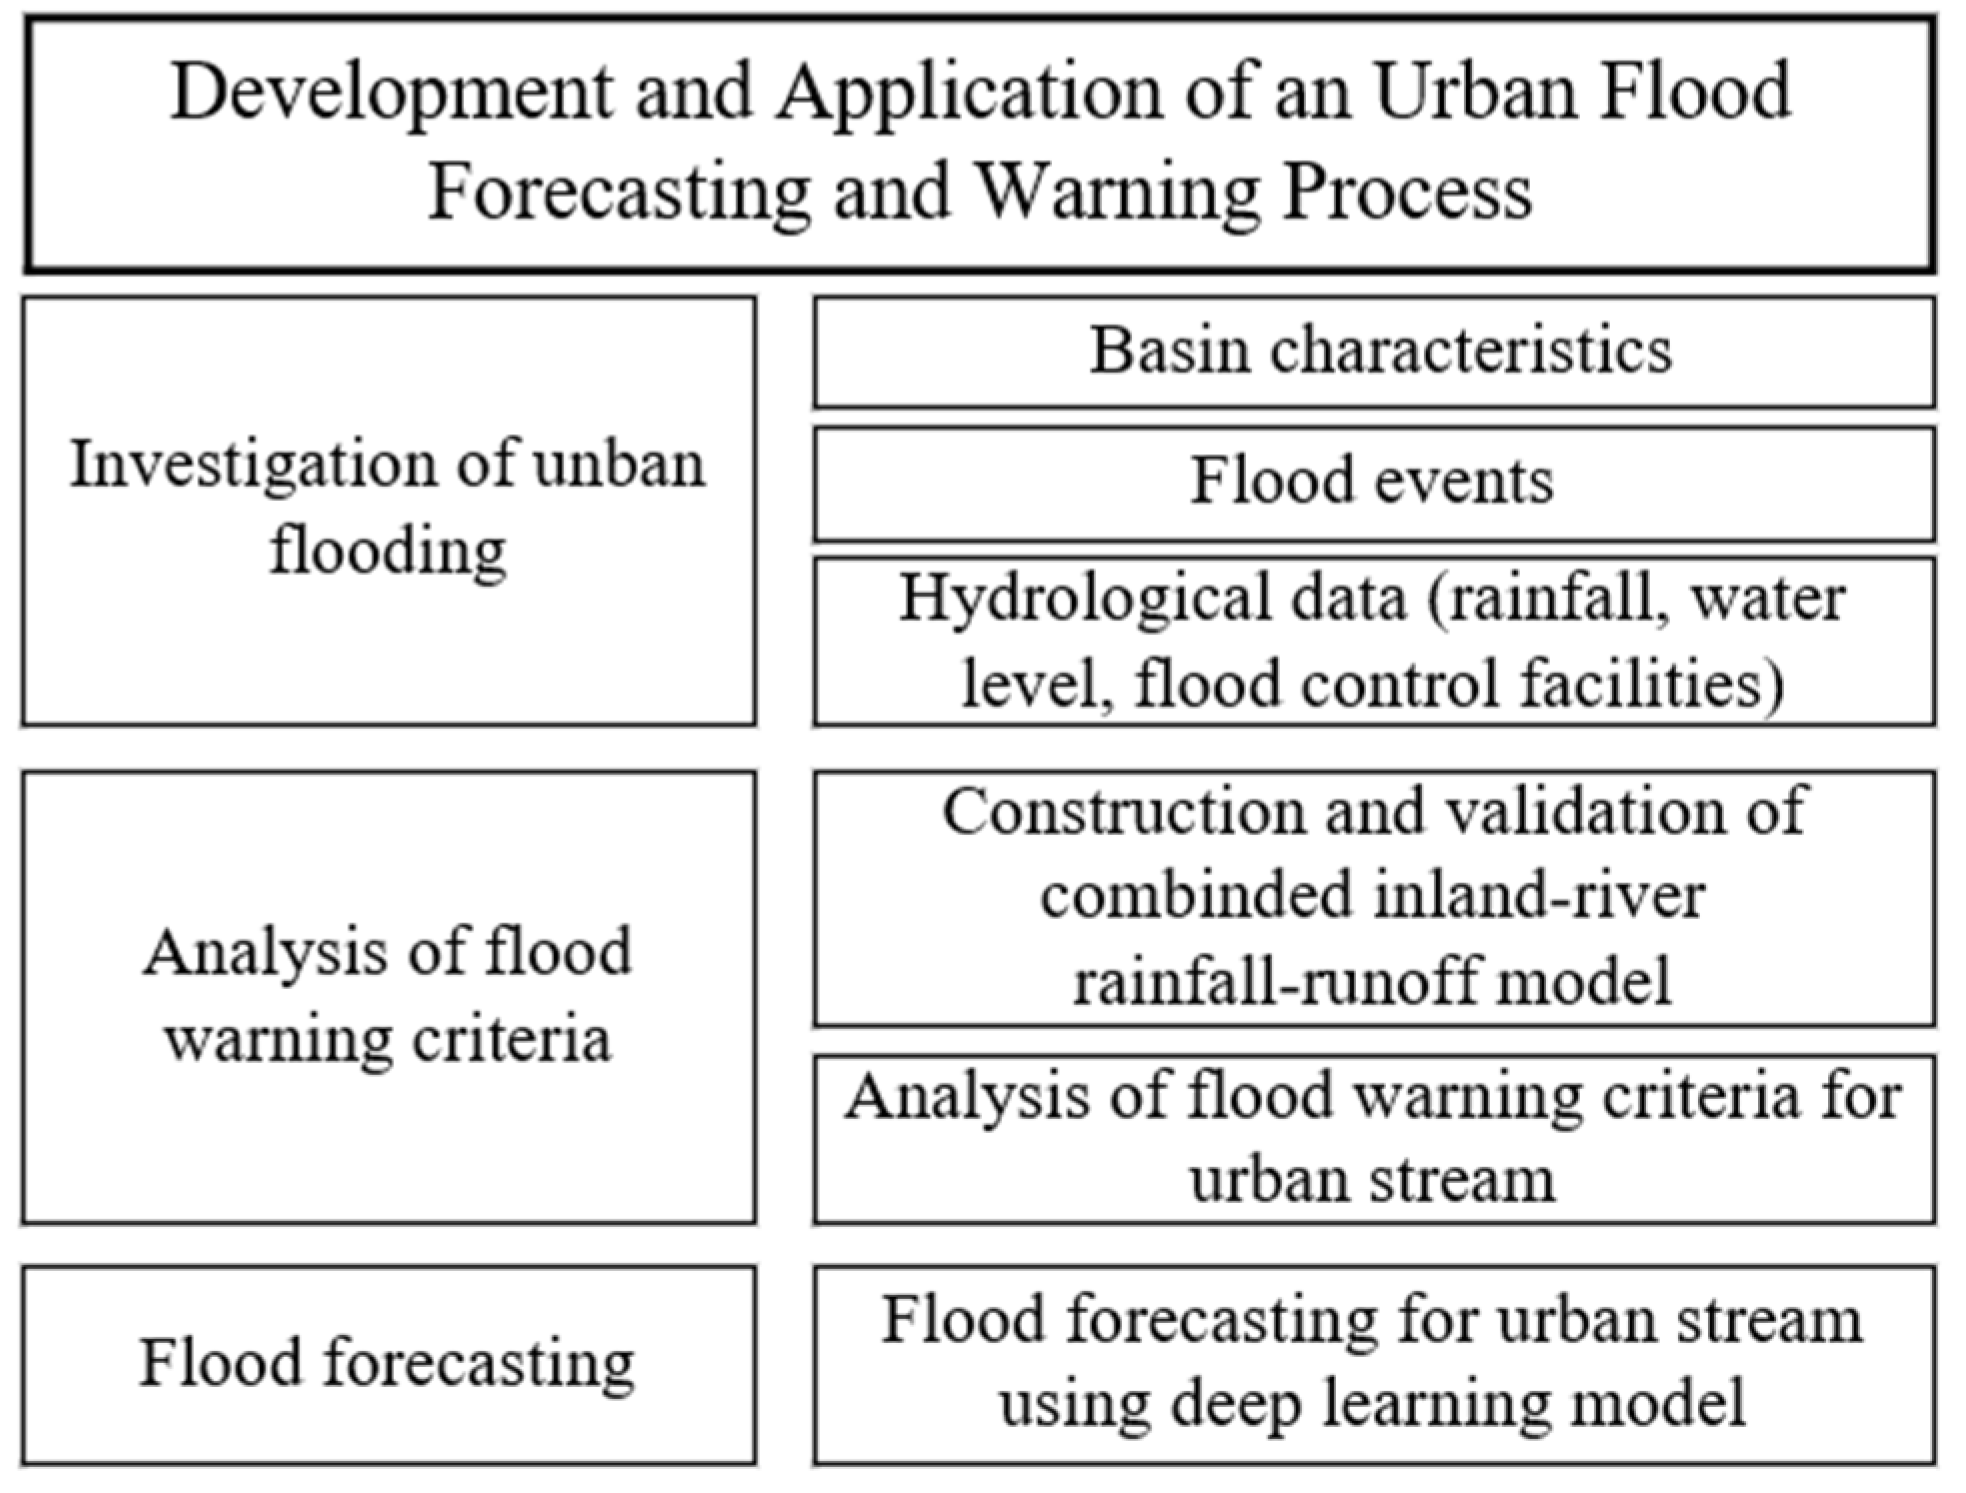
2. Materials and Methods
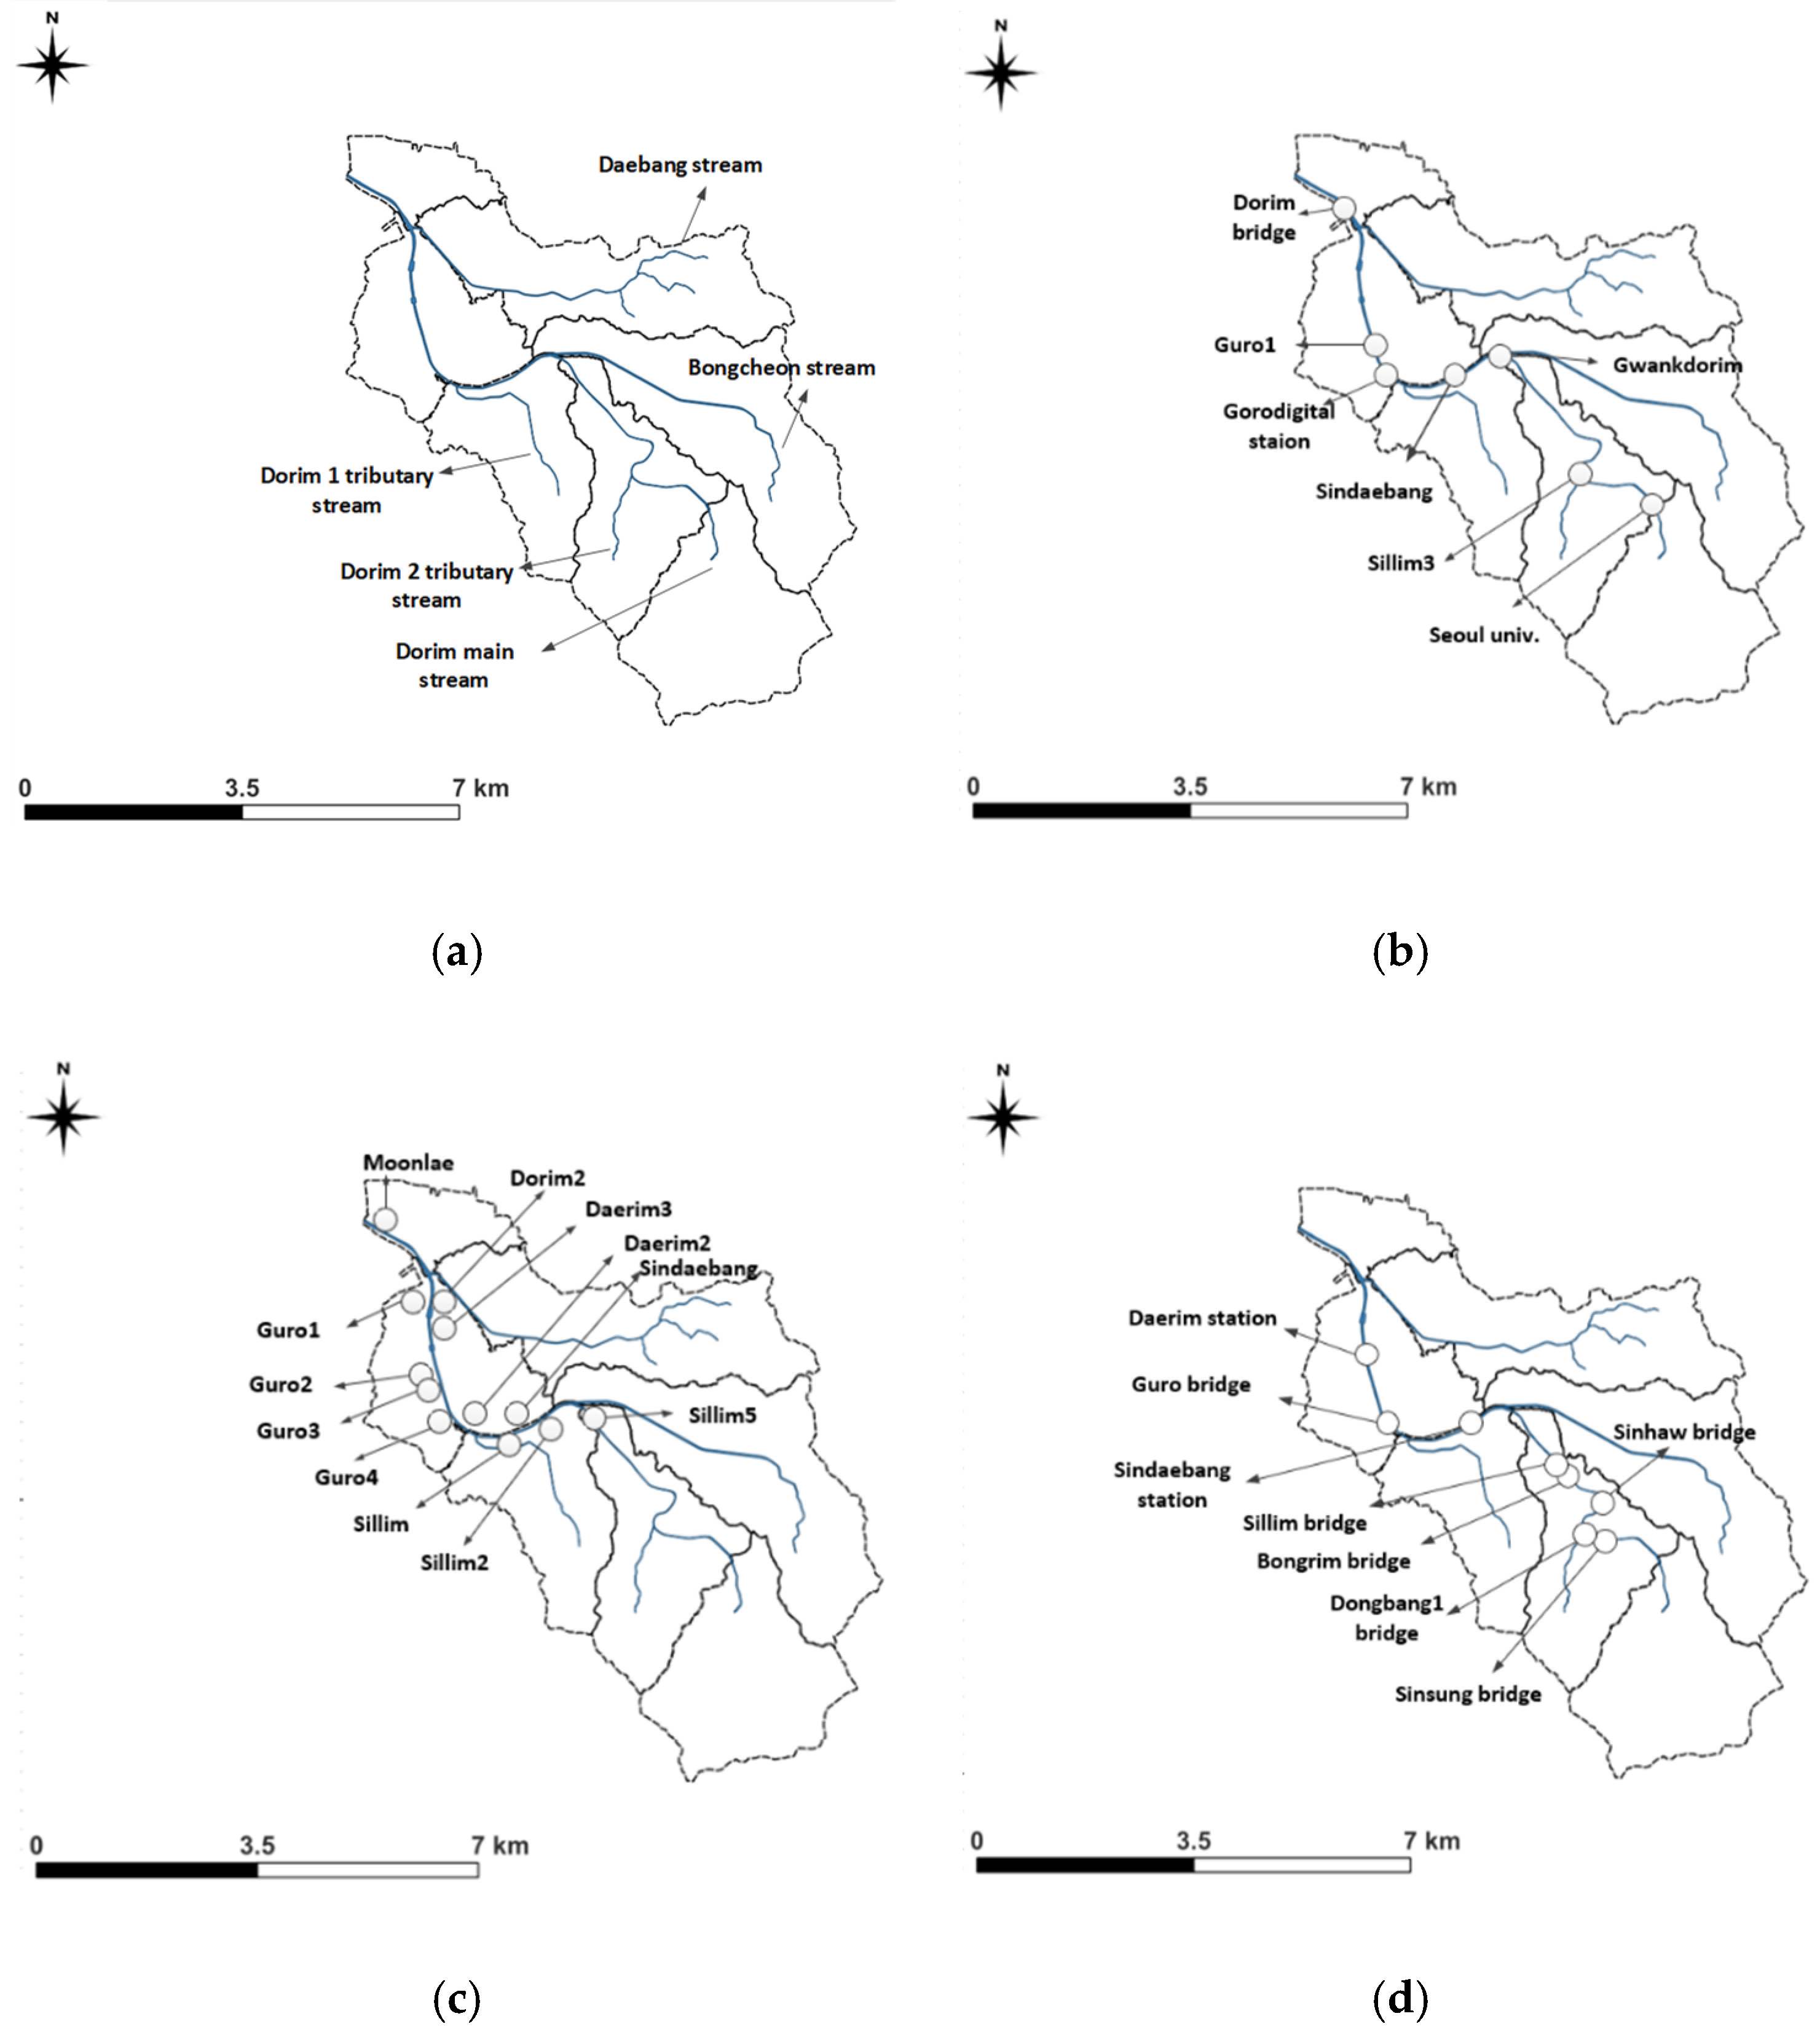
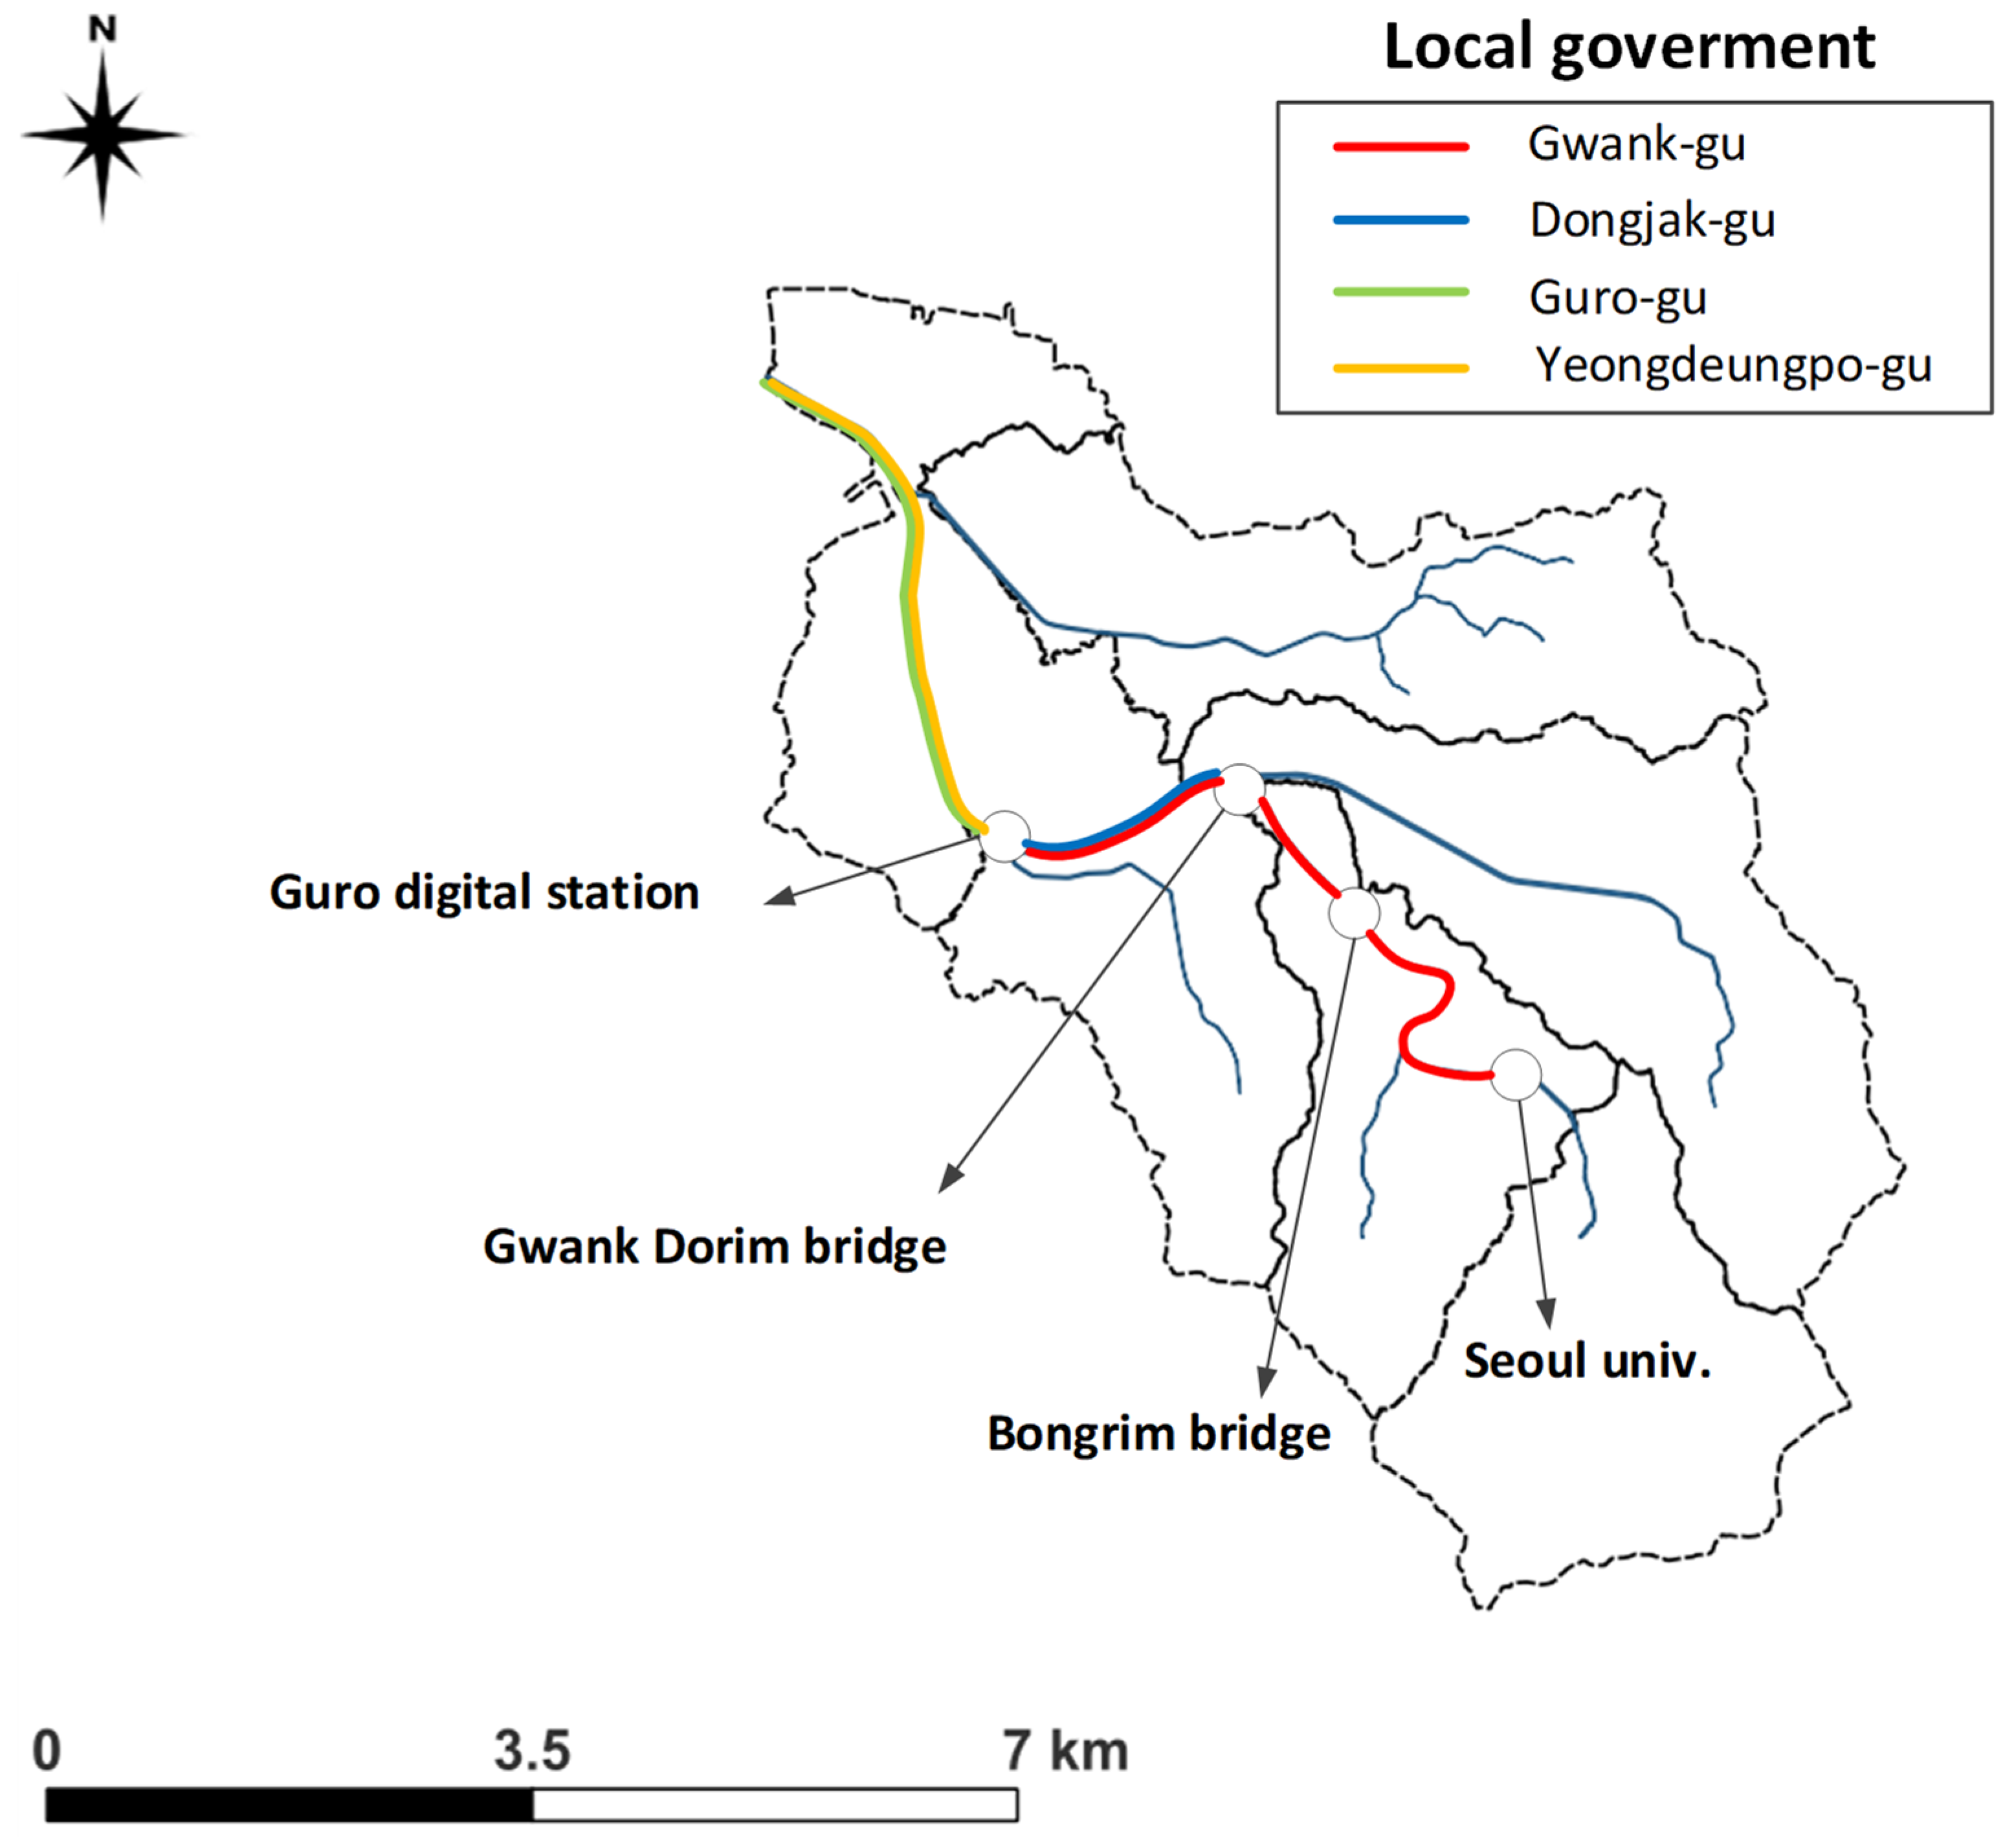
The urban flood forecasting and warning process of this study is developed for a complex urban basin in which inland and river are organically connected, especially in the urban stream in which casualties and isolation accidents occur (Figure 1). This process is divided into three phases, investigation of urban flooding, analysis of flood warning criteria, and flood forecasting. The flood damage of Dorim river basin can be effectively reduced through accurate warning criteria by a rainfall-runoff model, and flood forecasting using deep learning techniques.

2.1. Study Area

The target watersheds were the urban stream that crosses through the center of the city, the stream inflow, and the Dorim river basin where inland and outland waters are organically connected and flood damage is aggravated, which were selected among 32 flood-prone areas in Seoul, the capital of South Korea (Figure 2). The major causes of flood damage in Dorim river basin are torrential rainfall due to climate change, discharge increase due to rapid urbanization, flooding due to inner basin drainage defects, riverside casualties due to sudden torrential rainfall, and a potential damage increase from extreme weather events. In addition, the riverbank is occupied by roads at Dorim river basin, so it is impossible to expand the river width, and bridges lower than the bank height were observed to impede the streamflow. In particular, upstream of Dorim river basin is a mountainous region with steep slopes, and the flood arrival time is relatively short. Thus, recent abnormal rainfalls prompt flash floods, which rapidly elevate the Dorim river basin flood elevation and continuously generate casualties by exposing citizens that use pathways built along the entire Dorim river, bicycle roads, and the riverside for avoiding the rain to flood risks (Table 1).
There is a main stream, Dorim river and 4 tributary streams, Daebang river, Bongcheon river, and Dorim 1,2 tributary river, connected with Dorim river in the target watershed (Figure 3a). Water levels are provided from a total of three locations in Dorim river basin: Dorim Bridge, Sindaebang Station, and Sillim 3 Bridge. We collected additional data for a total of seven locations, from the Seoul National University entrance, Gwanak Dorim Bridge, Guro 1 Bridge, and Guro Digital Complex Station water level measurement data measured by each local government (Guro, Gwanak, Dongjak, and Yeongdeungpo District Offices), and performed quality control (Figure 3b). A pump station is a typical structural flood control method, and a total of 12 stations are located in Dorim river basin. Accurate data must be collected from pump stations to develop an integrated urban hydrological system that connects inland and river (Figure 3c). Overall data from the Seoul pump stations were collected by referring to their Implementation Design Report for the number of pumps, pump specifications, discharge, pump station location, pump elevation, and reservoir. Furthermore, the pump operation records were collected for every pump station to validate the accuracy of the constructed rainfall-runoff model. The bicycle roads, pathways along the stream, flood control facilities, stream cross-section, and cases of flood damages were examined comprehensively and from various perspectives for the flood-prone areas in the Dorim river basin. The results revealed that most casualties were generated due to sudden torrential rainfall, a short travel time due to the steep slopes upstream, and insufficient differences between the stream floor and riverside water levels. Additionally, the drainage pump station located in the stream was found to rapidly increase the Dorim river basin discharge by operating the pump for inner basin drainage. An examination of each subsection of flood risk areas revealed that the entire upstream section did not have sufficient difference between the stream floor and the left and right pathways, bicycle roads, and riversides. Thus, the area was prone to casualties from sudden torrential rainfall. Moreover, the river width increased downstream, for instance, from an average of 33.1 to 78.8 m, and the upstream with a relatively narrow river width and higher flow velocity had short travel times and frequent casualties (Figure 3d). Based on the analysis of the Dorim river basin properties, facility surveys, and flood-prone areas, an accurate rainfall-runoff model was constructed, which was used in the composition of the learning module (learning data, forecast point, etc.) for deep learning.

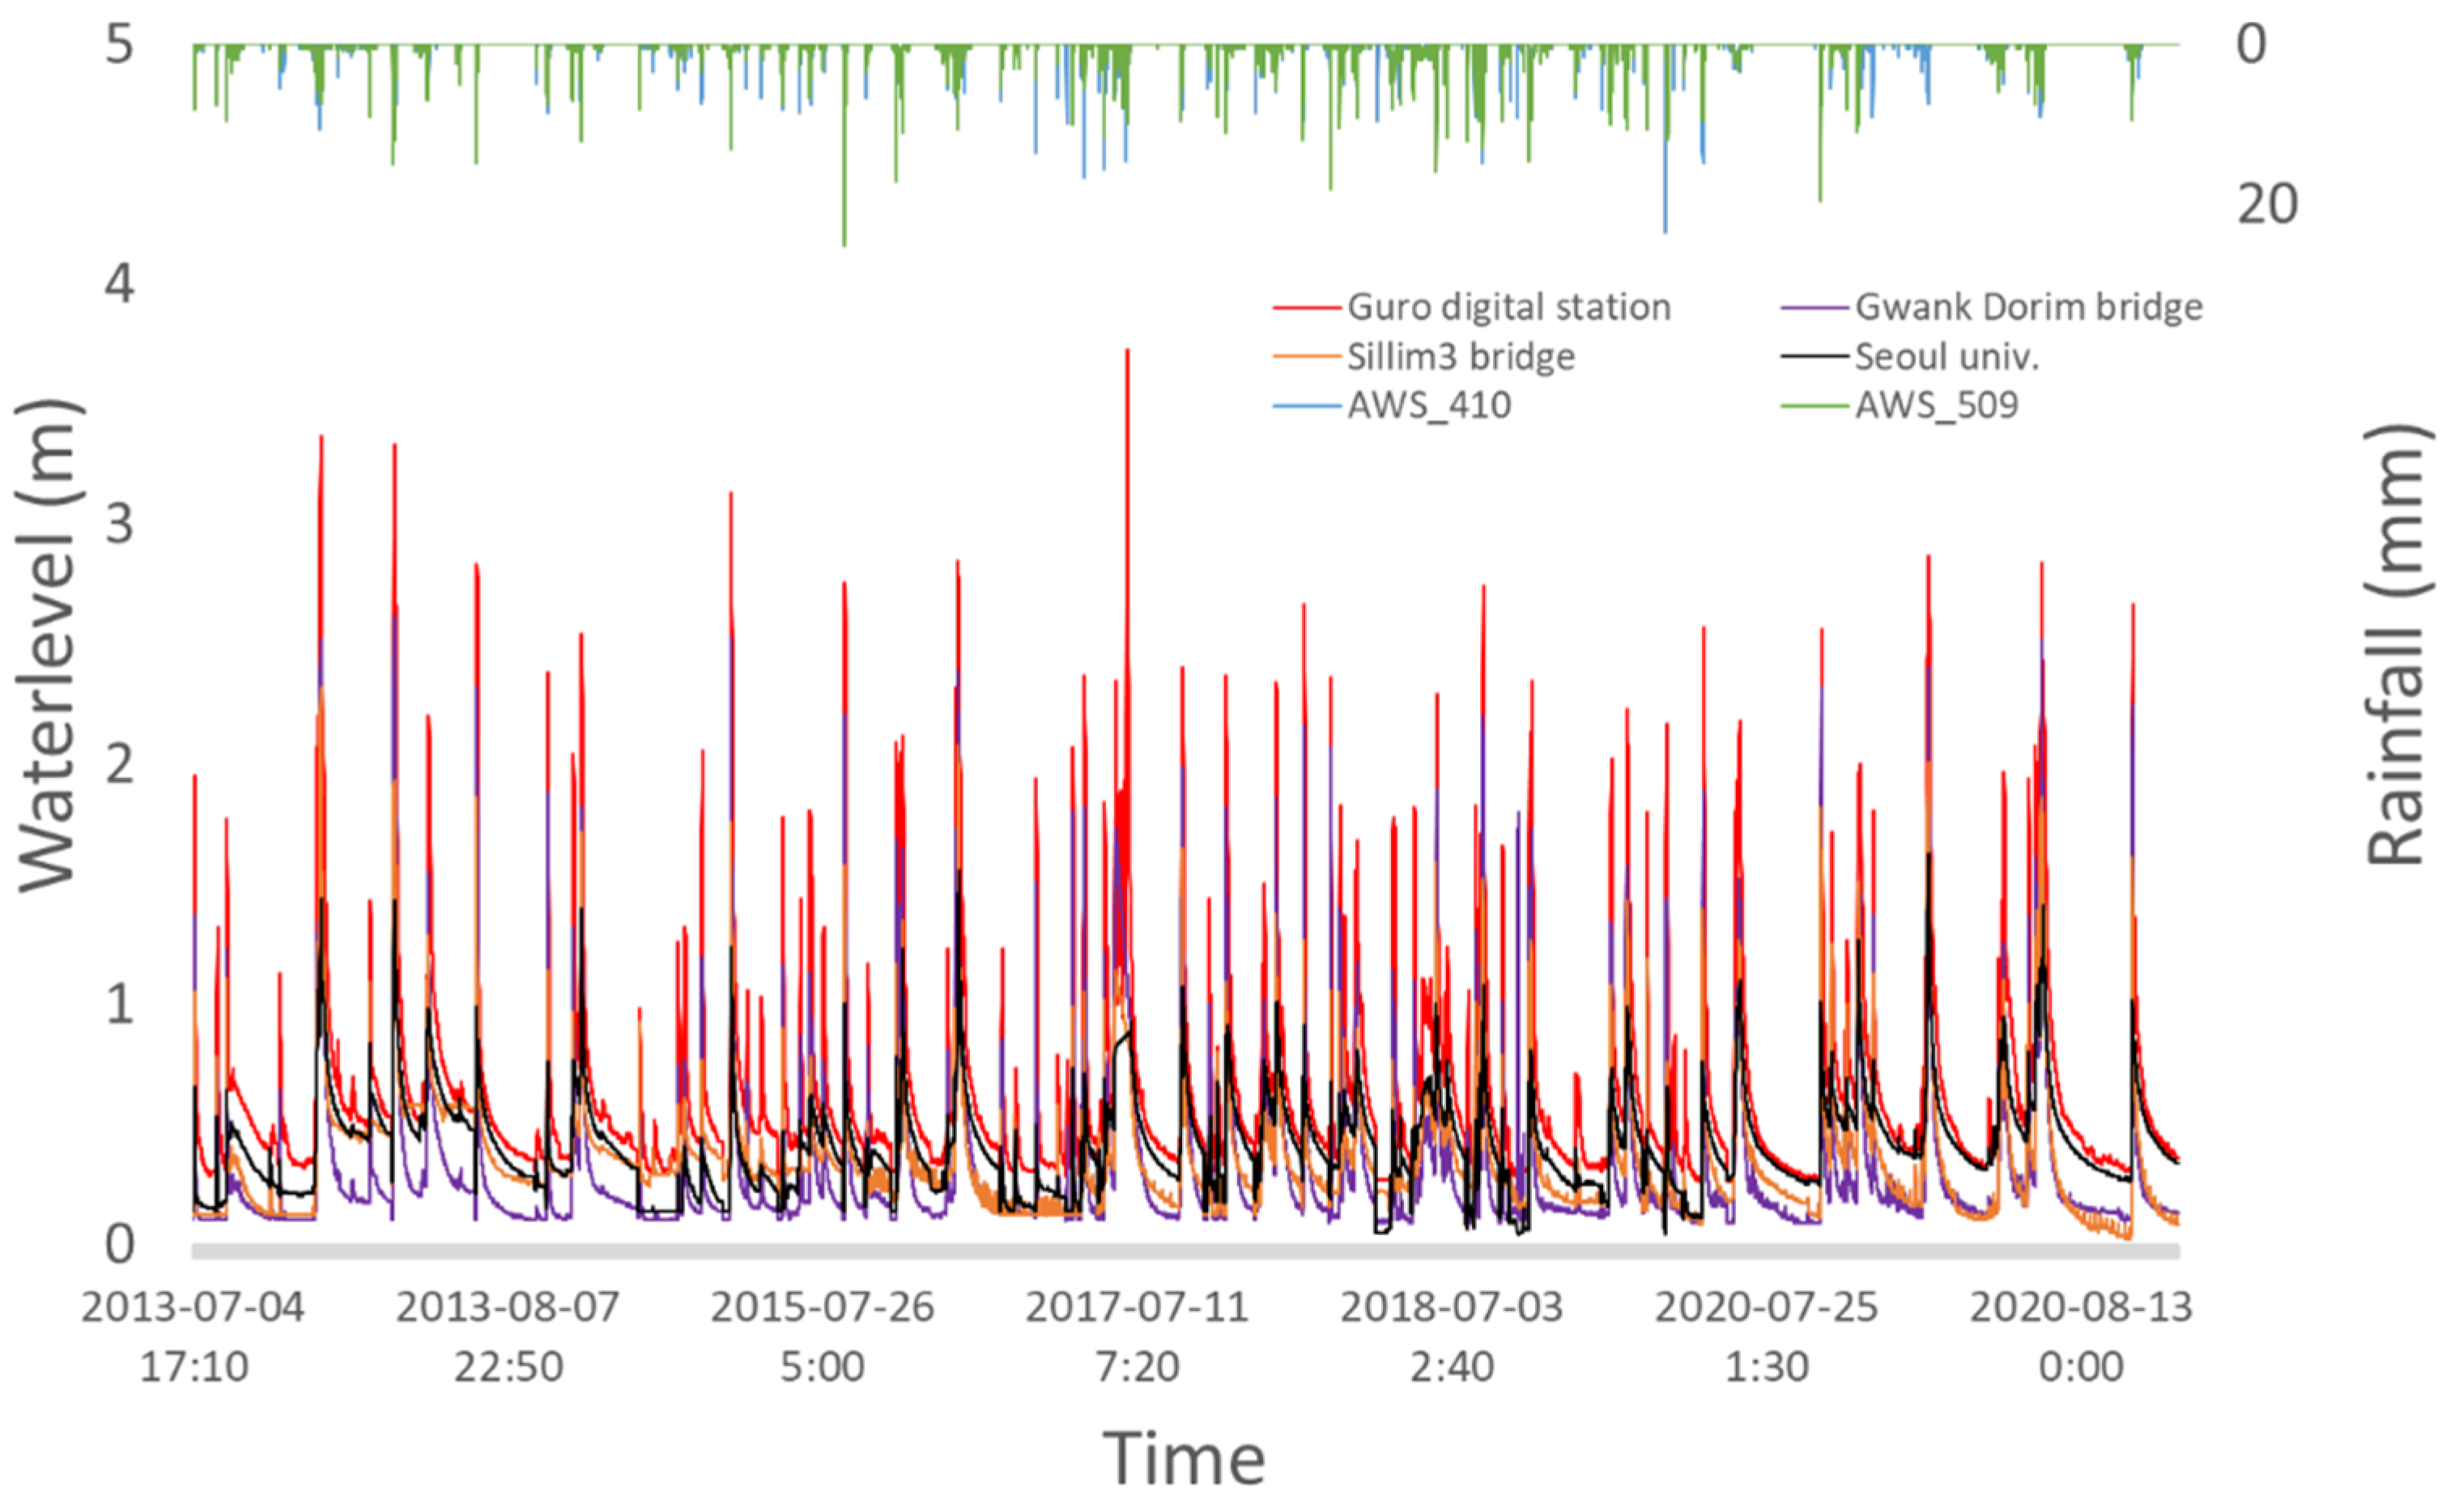
2.2. Data-Driven Method

Flood forecasting and warning in the Dorim river basin were performed with a deep learning model through training and forecasting 10-min hydrological time-series data. The deep learning module was constructed with Python 3.7, together with various libraries including Scikit-learn, Keras, Pandas, and NumPy. Vanilla ANN, LSTM, Stack-LSTM, and Bidirectional LSTM models were used to forecast the stream water level of the target basin. The structures of the above deep learning models are provided in Figure 4. In general, a vanilla ANN, which is simply called a neural network, receives more than or equal to one input data, aggregates them, performs output or activation, and shows neuron action potential. Each input into the vanilla ANN is weighed individually, and the sum of neurons is delivered through nonlinear functions known as the activation function or transfer function. These nonlinear functions generally have a Sigmoid form, but they can manifest in other forms of nonlinear or step functions. Currently, various activation functions are under development. In the RNN model, the connections between the nodes in the artificial neural network process input and output in units of sequences according to time, which represents the most basic sequence form for deep learning models. However, the hidden state must be calculated up to the order amount of t to calculate a single layer, so the operation speed is slow. Additionally, the gradient may gradually decrease to the point of no possible learning as the number of data and layer depth increase. In LSTM, the self-loop allows the gradient to be calculated continuously, which solved the gradient dissipation issue from RNN [37]. In Stack-LSTM, scales can be added, which are input value levels observed in time by adding LSTM layers. Additionally, memory units, such as individual letters, words, and sentences, can be learned in a given time, or issues arising from different time scales can be solved [38]. The general RNN can only process and use data in a single direction, but this results in data imbalance. Therefore, in order to improve this structural problem, a bidirectional LSTM or biLSTM learns not only the relationship with the previous input but also that with the incoming input in relation to the ordered input data. Bidirectional LSTM has two hidden layers, forward states and backward states, and these two hidden layers have a structure that is not connected to each other, but the input value itself is transmitted to both of these hidden layers. The output value also receives the data of the two hidden layers and calculates them all. The forward calculation is the same as a general RNN, and the input values of the backward hidden layer are put in the opposite direction, and the output layer value is calculated after all input values are applied to the two-way hidden layer.

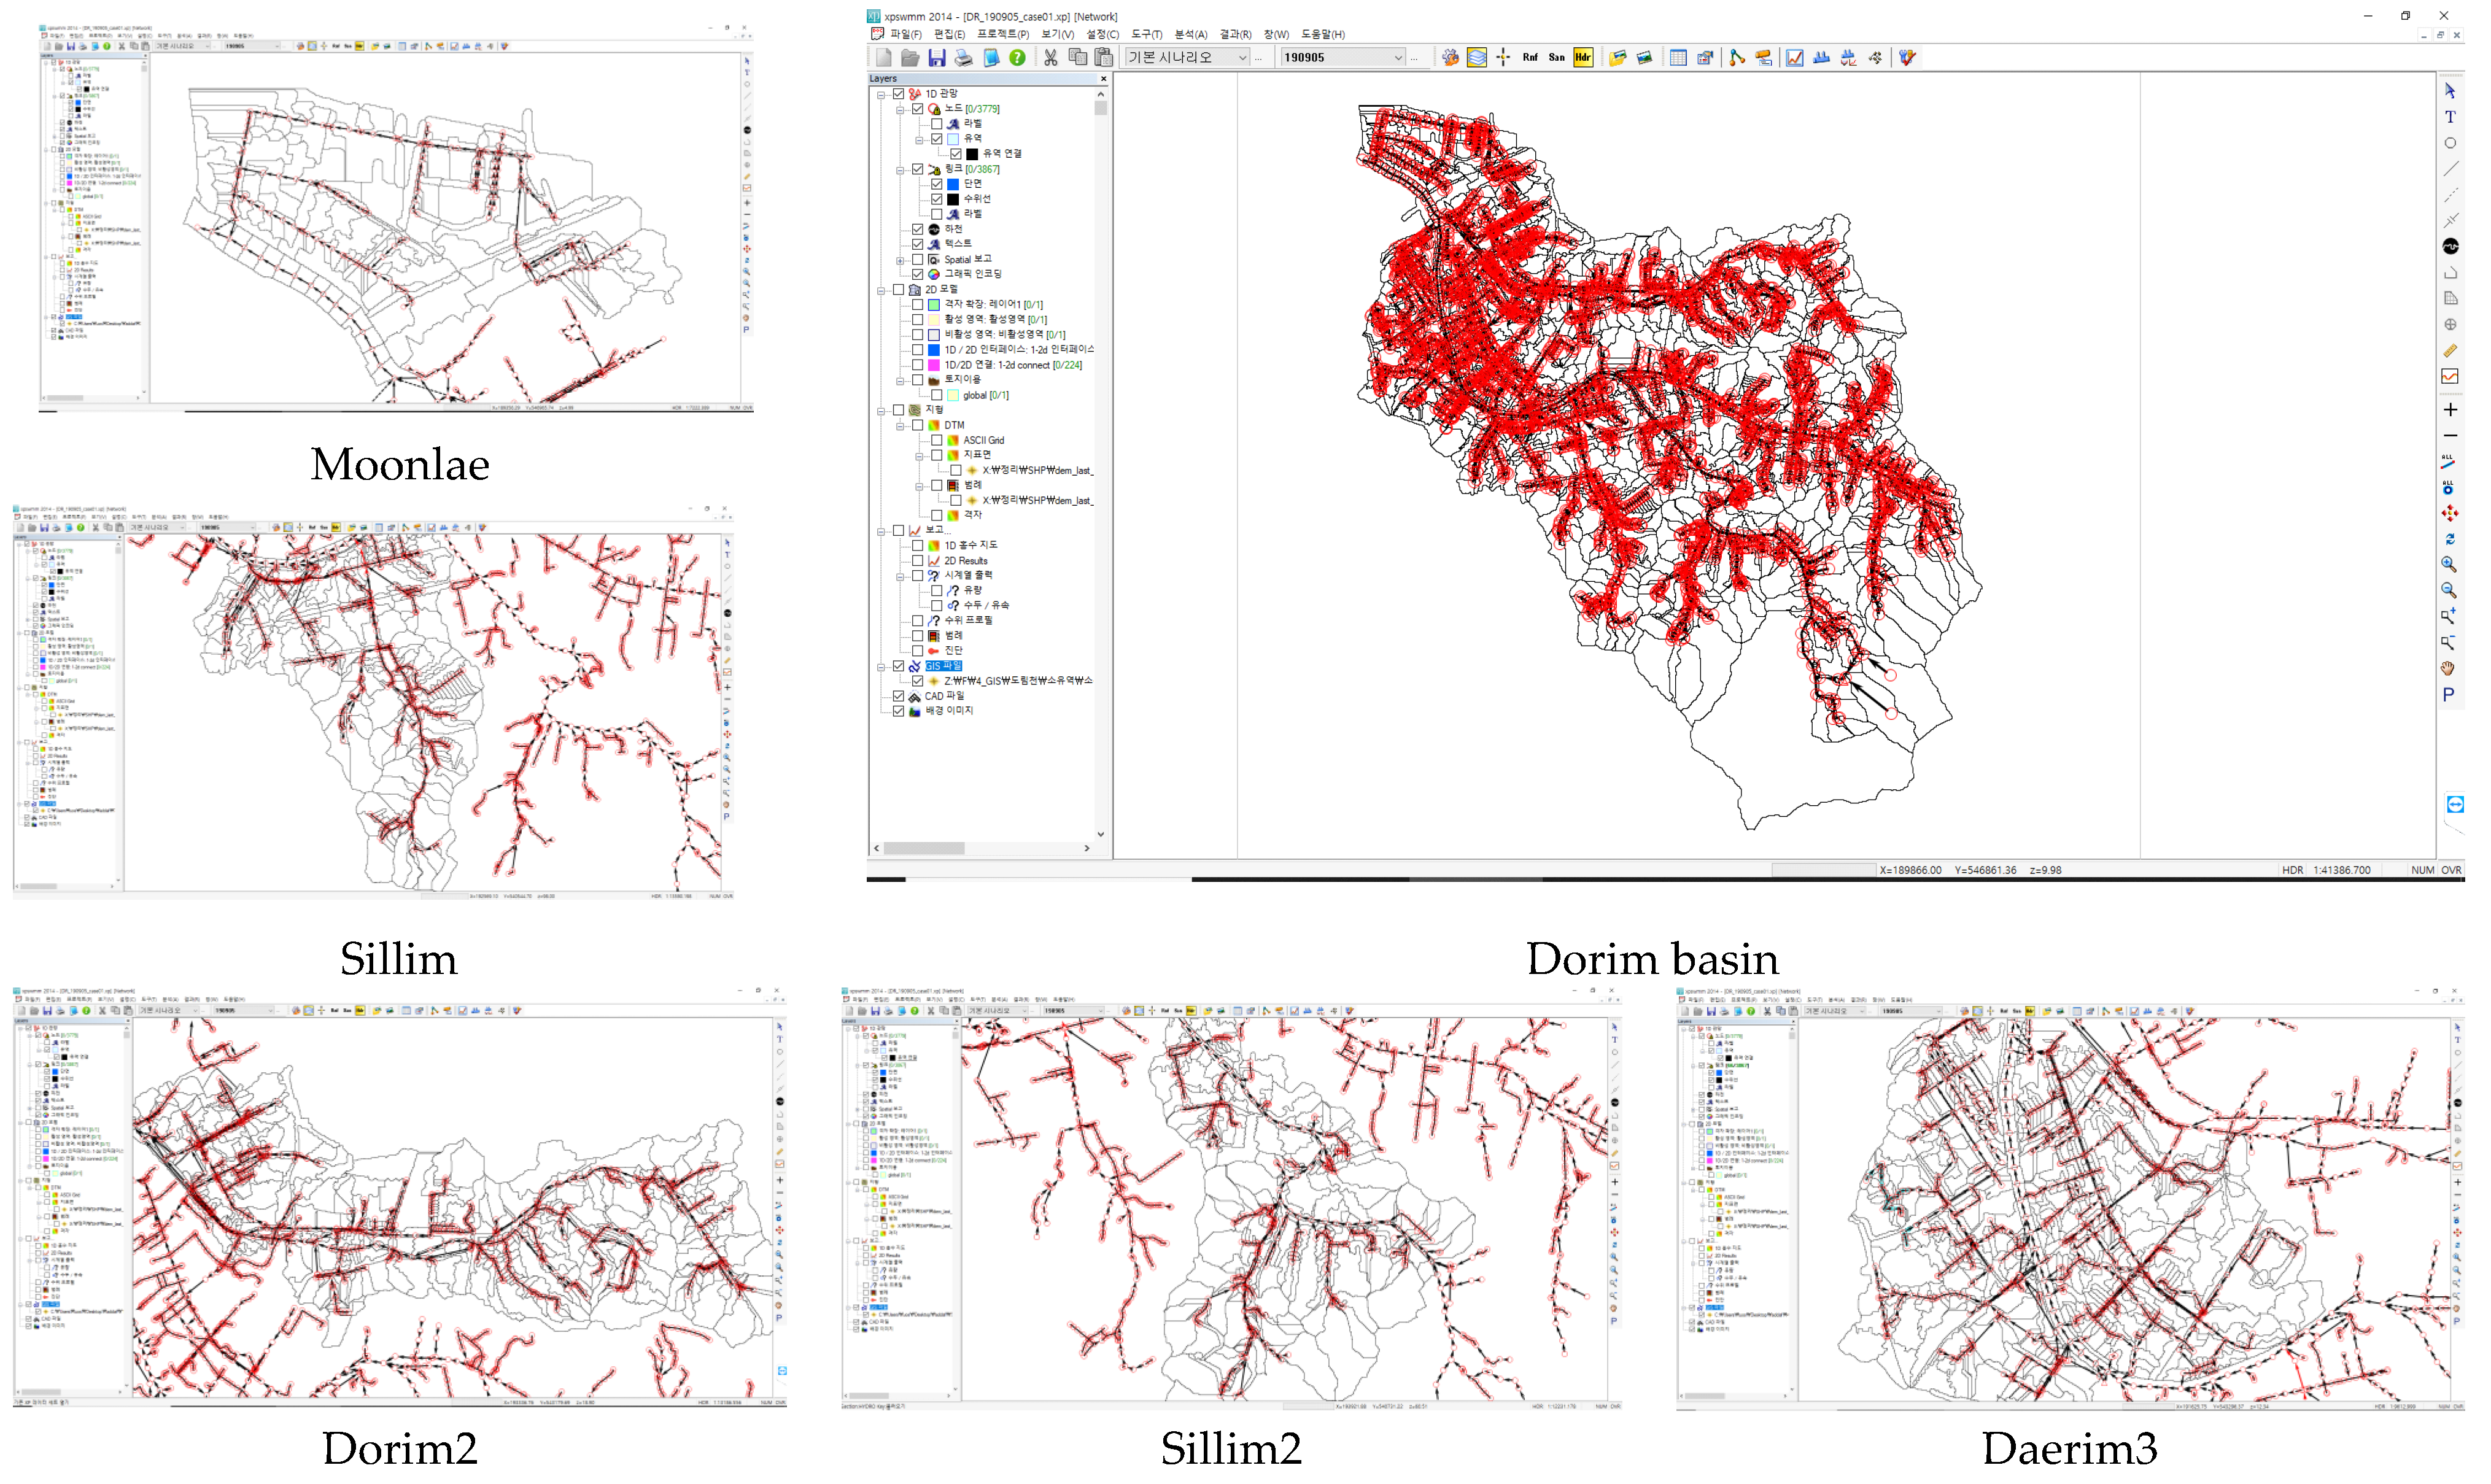
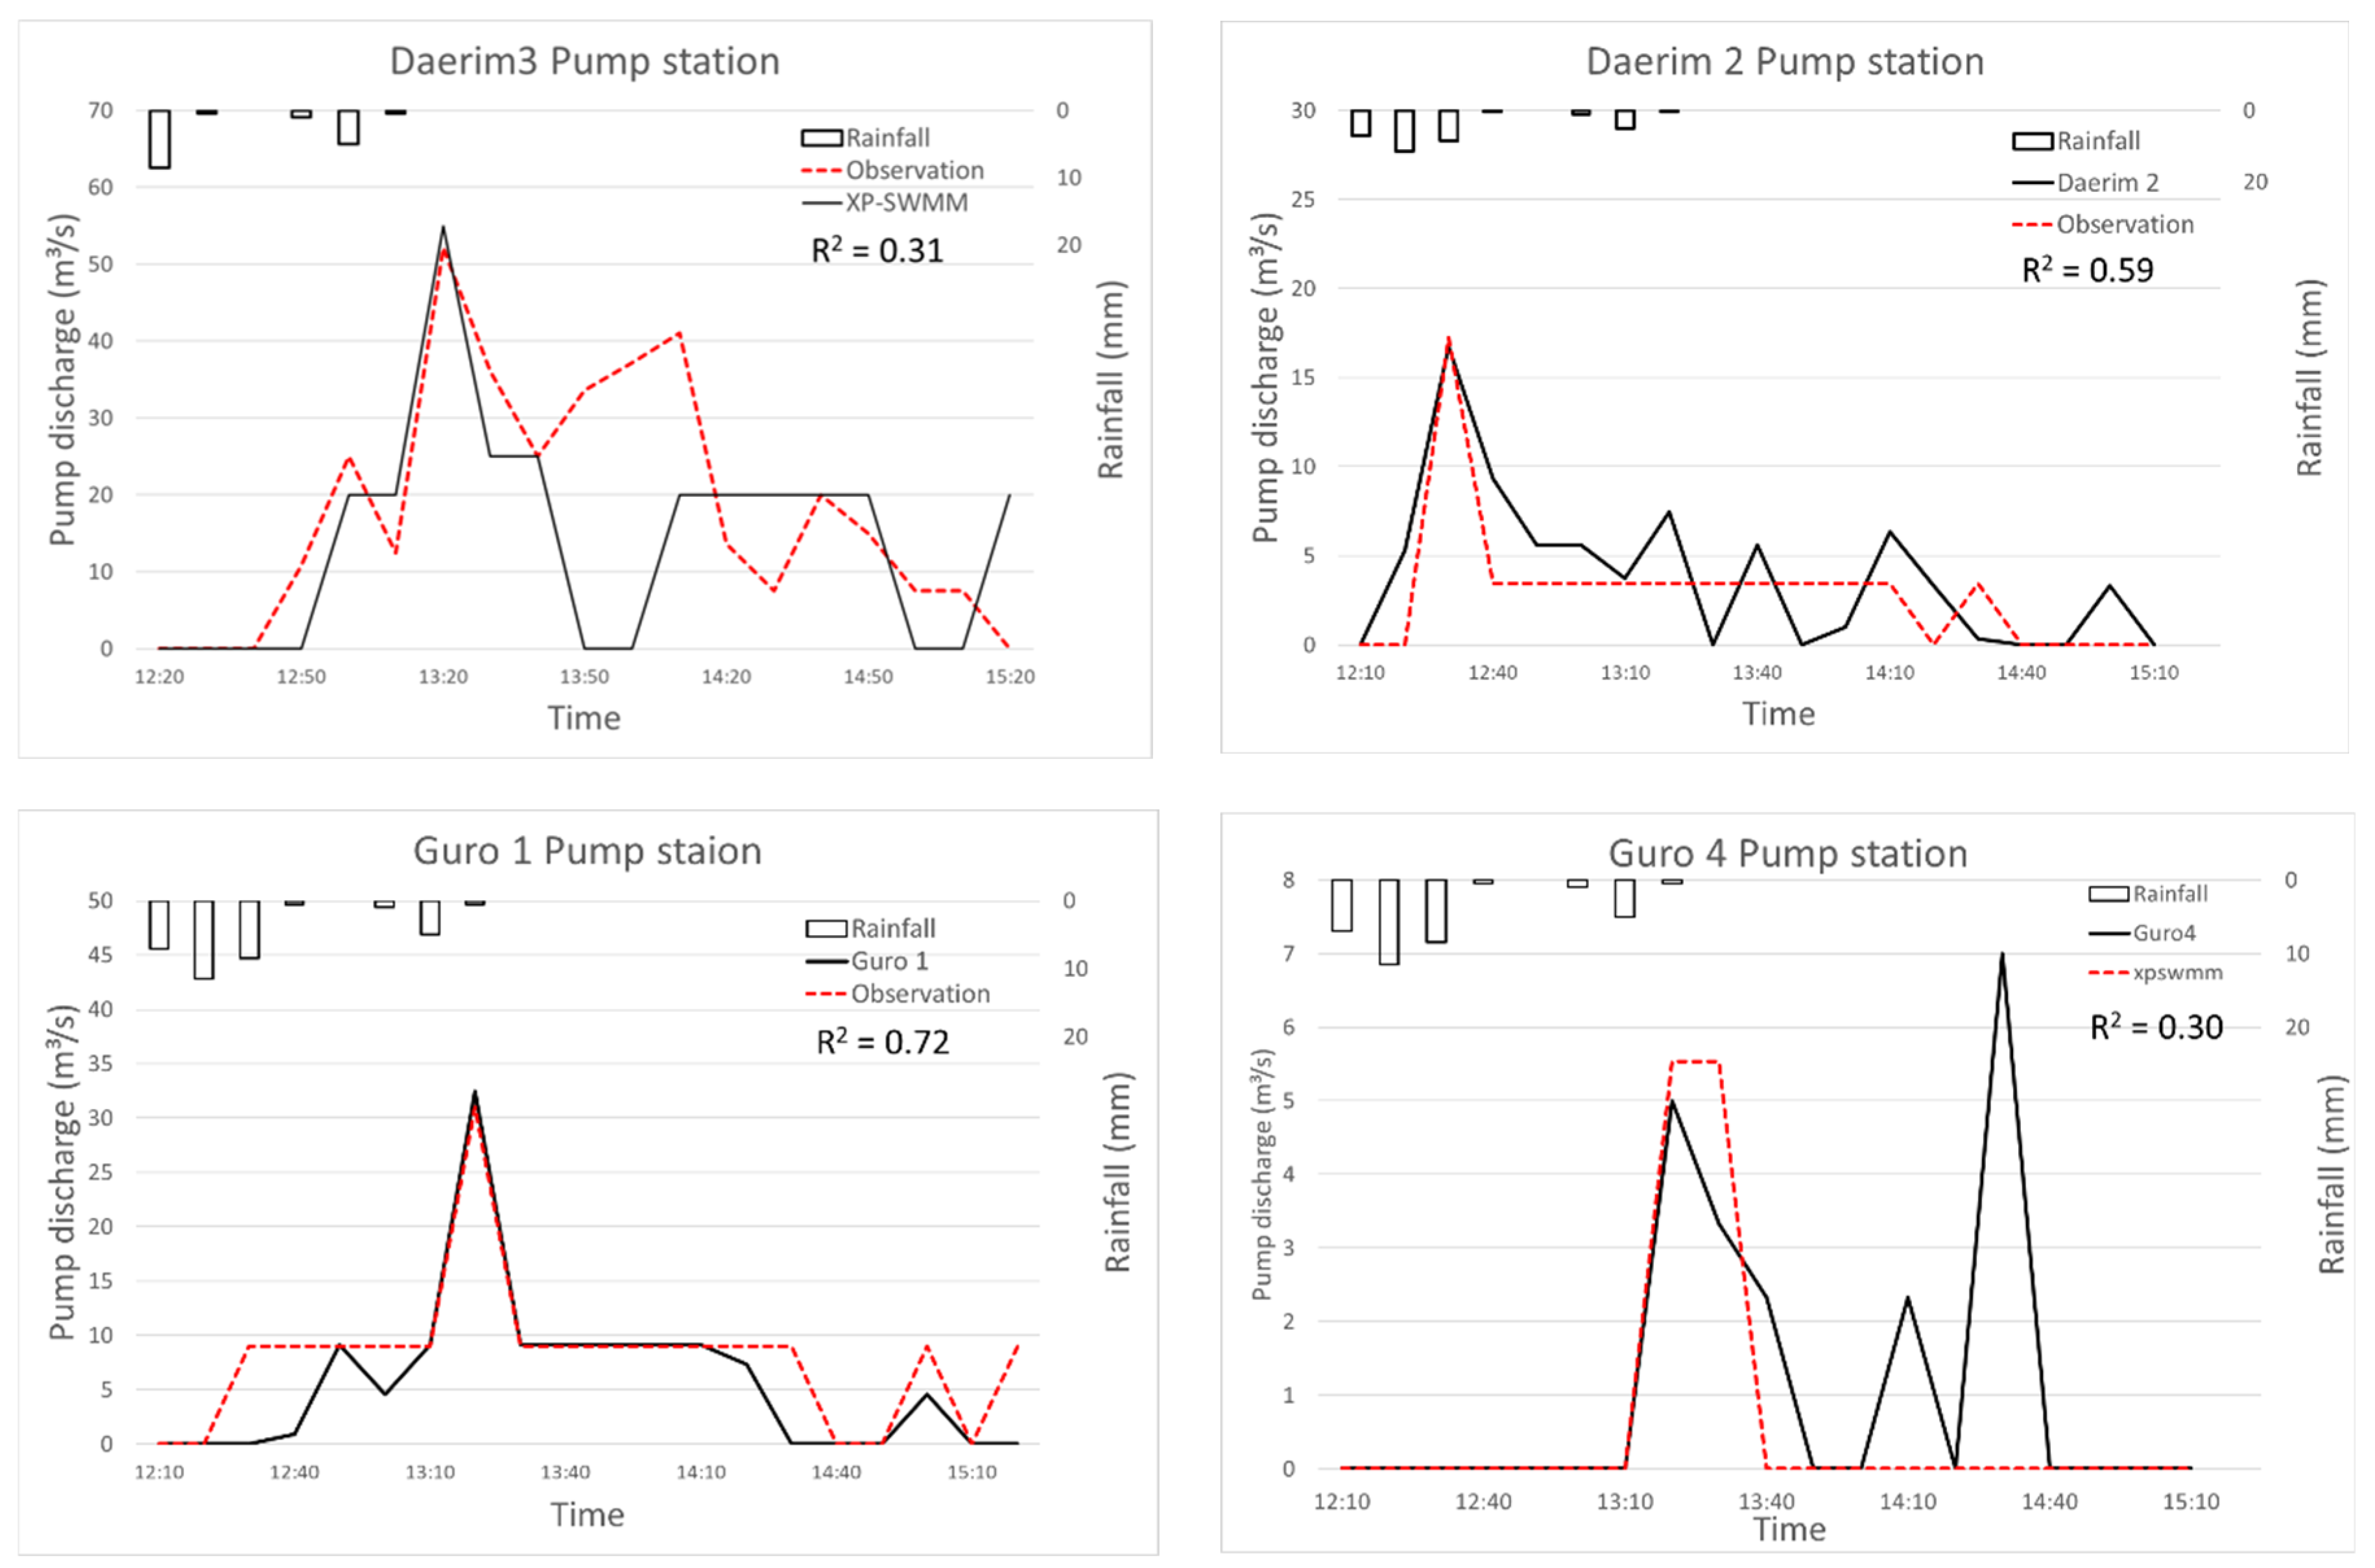
2.3. Model-Driven Method

Increasingly, the application of models in urban hydrology has undergone a shift toward integrated structures that recognize the interconnected nature of the urban landscape and both the natural and engineered water cycles [39,40]. In this paper, recent spatial data was used to construct an integrated rainfall-runoff model combined with the inland and river of the Dorim river basin, to accurately calculate the urban flood forecasting and warning criteria for the target point. A land cover map, impervious area ratio, soil map, DEM, and Implementation Design Reports of the pump station and underground depot were used to construct an integrated urban hydrological model (Figure 5). Flood control facilities, such as pump stations or underground storage, are essential for reducing inland flood damage, but the impact of flood control facilities is larger in urban areas, such as Dorim river basin, which is closely associated with outland flooding and outland casualties, and require more precise analysis. For the validation of the rainfall-runoff model for flood control facilities, a sudden torrential rainfall event that occurred on 1 August 2020, which generated casualties, was validated. The pump station Implementation Design Report and pump operation record data were referenced for the parameter data of the rainwater pump station and underground storage inserted in the model (Figure 6). On 1 August 2020, one person died in the Dorim river upstream area and 25 were isolated before being rescued. In the location and time where 25 people were isolated, more than or equal to 8 out of 12 pump stations were under operation, which were discharging a significant amount of outflow to Dorim river basin. In contrast, three underground storages located upstream were not operated according to the operational standard for preventing Dorim river from flooding. When the results from the model that executed the calibration and validation of the stream cross-section and flood control facilities were examined, the R2 values for each pump station simulation results were 0.26–0.73, and the R2 values for the water level analysis results were 0.48–0.79 (Figure 7).

3. Analysis and Application of Urban Flood Forecasting

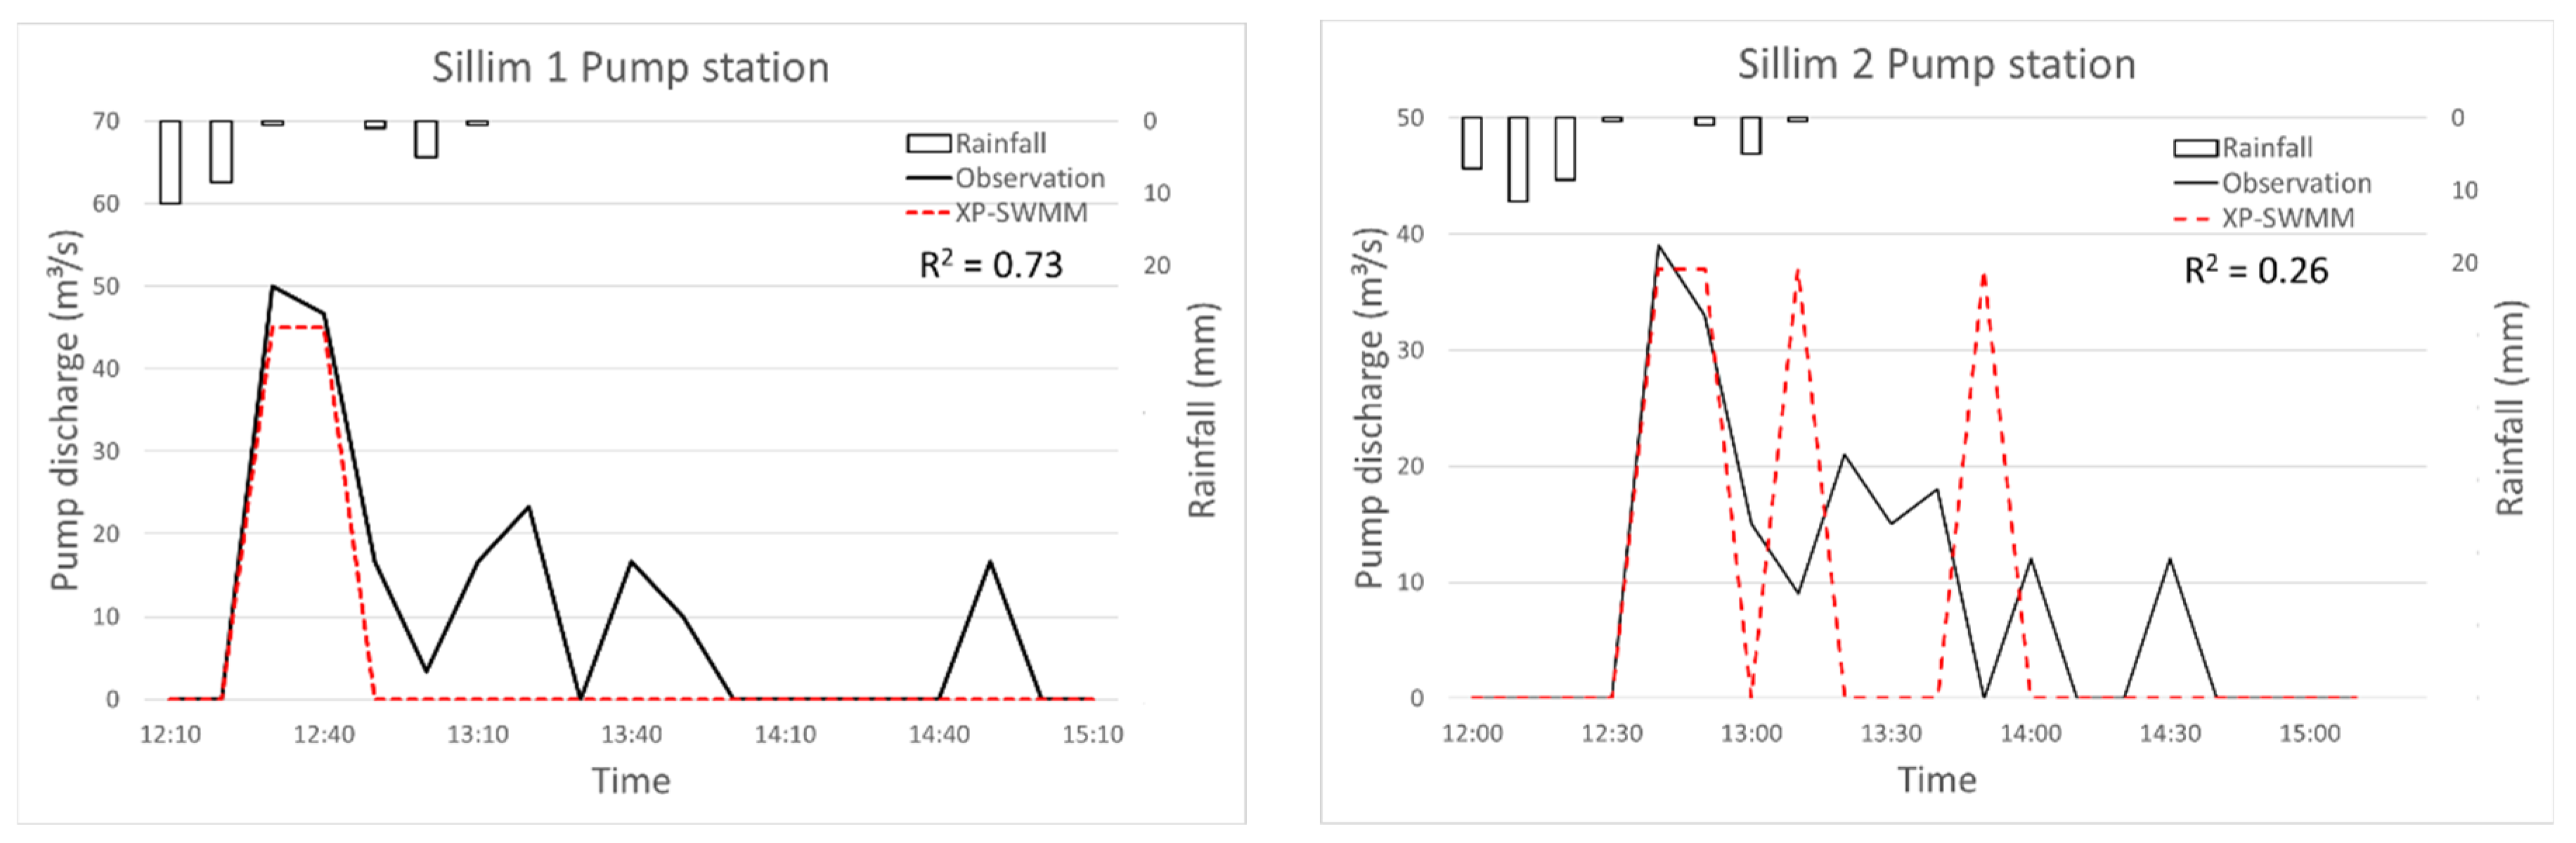
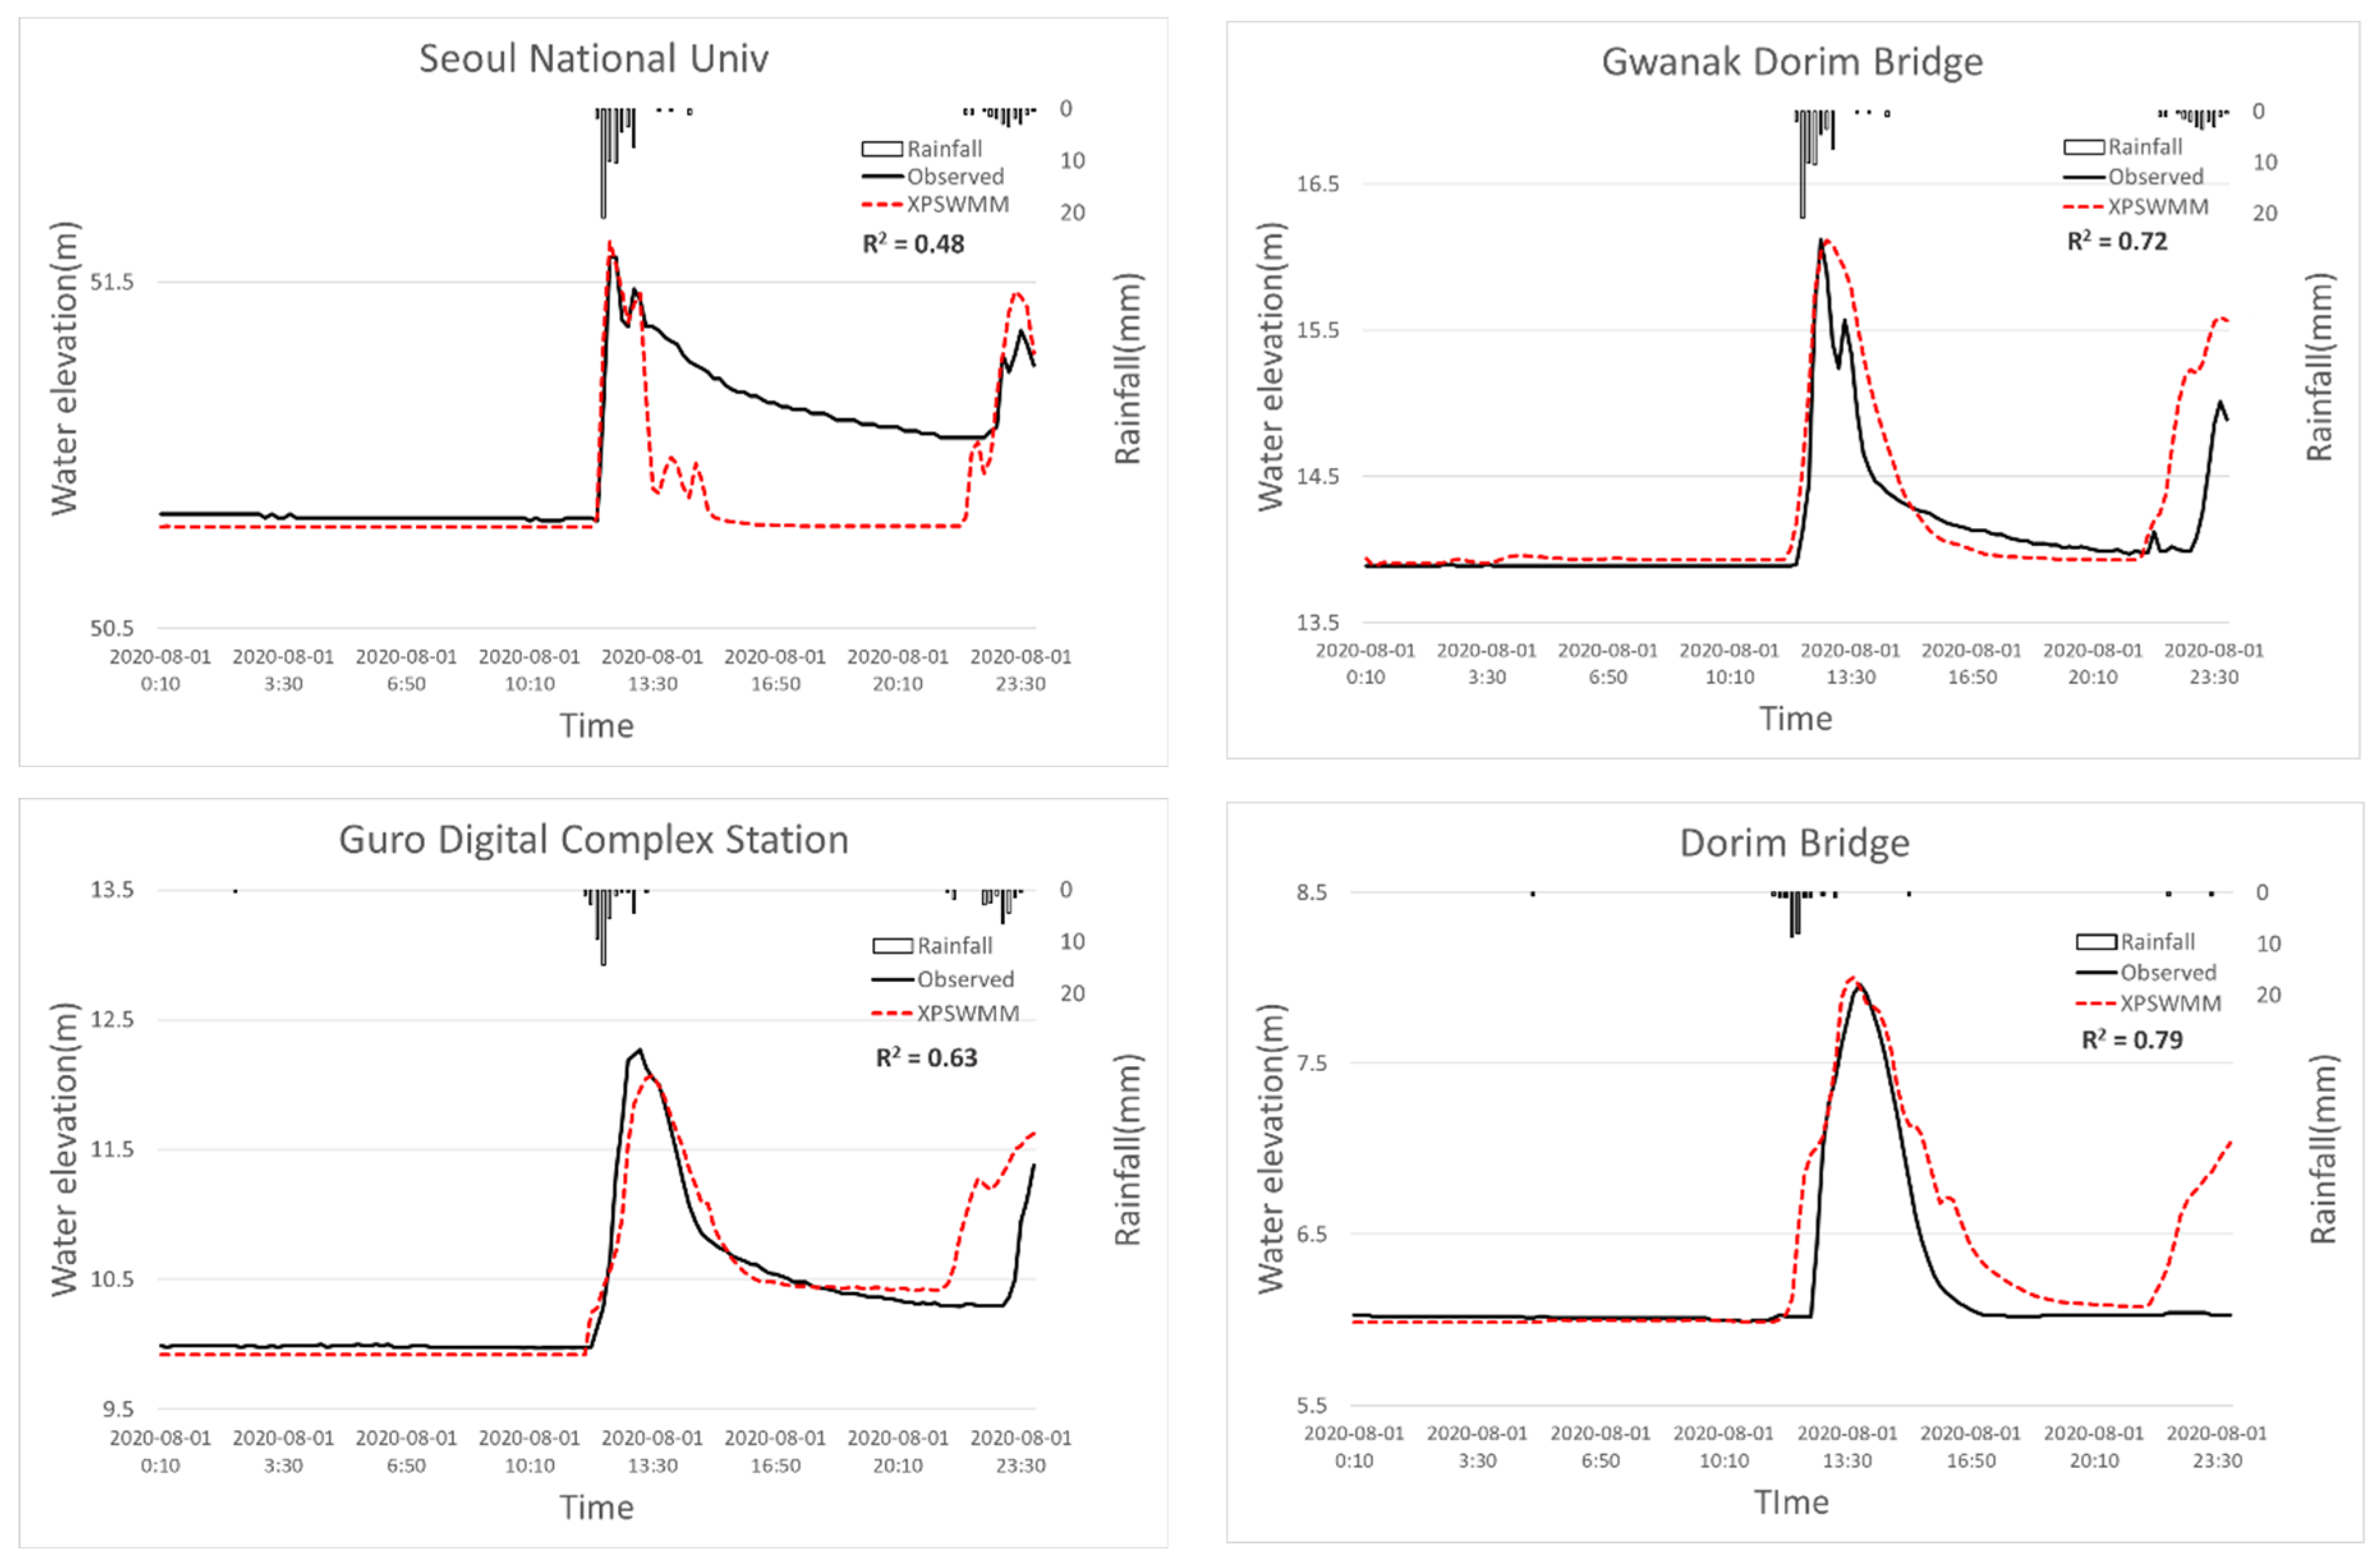
3.1. Flood Forecasting and Warning Criteria Calculation Based on the Rainfall-Runoff Model

After examining the flood damage characteristics of the basin to calculate the Dorim river basin flood forecasting and warning criteria, the criteria for the target basin were established based on the riverside water level to prevent casualties from flash floods instead of stream flooding. An actual case of flood damage in Dorim river basin was referenced for the water level analysis based on the rainfall-runoff model for establishing forecasting and warning. The third huff quartile distribution analyzed from the basin, rainfall duration of 100 min, and rainfall 20–100 mm scenarios were configured to analyze the riverside flood elevation according to the application at each analysis point. The flood elevation analysis results revealed that riverside flooding occurred when rainfall was 40–50 mm or above for one hour at the Sillim 3 Bridge point and Seoul National University entrance point at the upstream section of Dorim river basin. At the Seoul National University entrance, riverside flooding occurred within about 30–44 min, depending on the rainfall intensity. At Sillim 3 Bridge, riverside flooding occurred within about 36–50 min. At the Gwanak Dorim Bridge and Sindaebang Station points in the mid- and downstream of Dorim river, riverside flooding occurred within about 36–50 min. The height differences between the riverbed and riverside were small at the Dorim Bridge and Sindaebang Station points, so riverside flooding occurred at a relatively low rainfall of 20–30 mm or above. Depending on the rainfall intensity, riverside flooding occurred within about 36–64 min at the Dorim Bridge and about 46–66 min at the Sindaebang Station. Riverside flooding occurred when rainfall was 20–30 mm or above at the Guro Digital Complex Station and Guro 1 Bridge points in the downstream section of Dorim river basin. Depending on the rainfall intensity, riverside flooding occurred within about 52–92 min at the Guro Digital Complex Station and 54–86 min at the Guro 1 Bridge (Table 2).
Based on the results above, the forecasting and warning criteria for the Dorim river basin were established, and an urban flood conduct manual was developed to prepare a Dorim river basin flood response process. A total of four local governments perform the actual flood protection operation of Dorim river basin, but since their flood forecasting and warning criteria differ, an integrated flood protection operating standard was presented. Operating restriction facilities that regulate Dorim river basin and access must be based on a flexible operation method among autonomous districts with reference to the water levels at the selected reference points Sillim 3 Bridge and Sindaebang Station. However, regulation of the upstream section (Seoul National University entrance-before joining Bongcheoncheon) when the reference water level is reached at Sillim 3 Bridge, and the mid- and downstream section (after joining Bongcheon river-before joining Anyang river) according to the reference water level at Sindaebang station was presented (Table 3). Through the operational standard presented herein, a rainfall guidance must be broadcast to restrict citizen access to the stream once an initial rainfall is forecasted or detected. Thereafter, a phased riverside warning must be issued, and stream access blocked in the upstream section when the water level reaches 34.01 m at Sillim 3 Bridge, and when the water level reaches 13.55 m at Sindaebang Station in the downstream section (Figure 8).

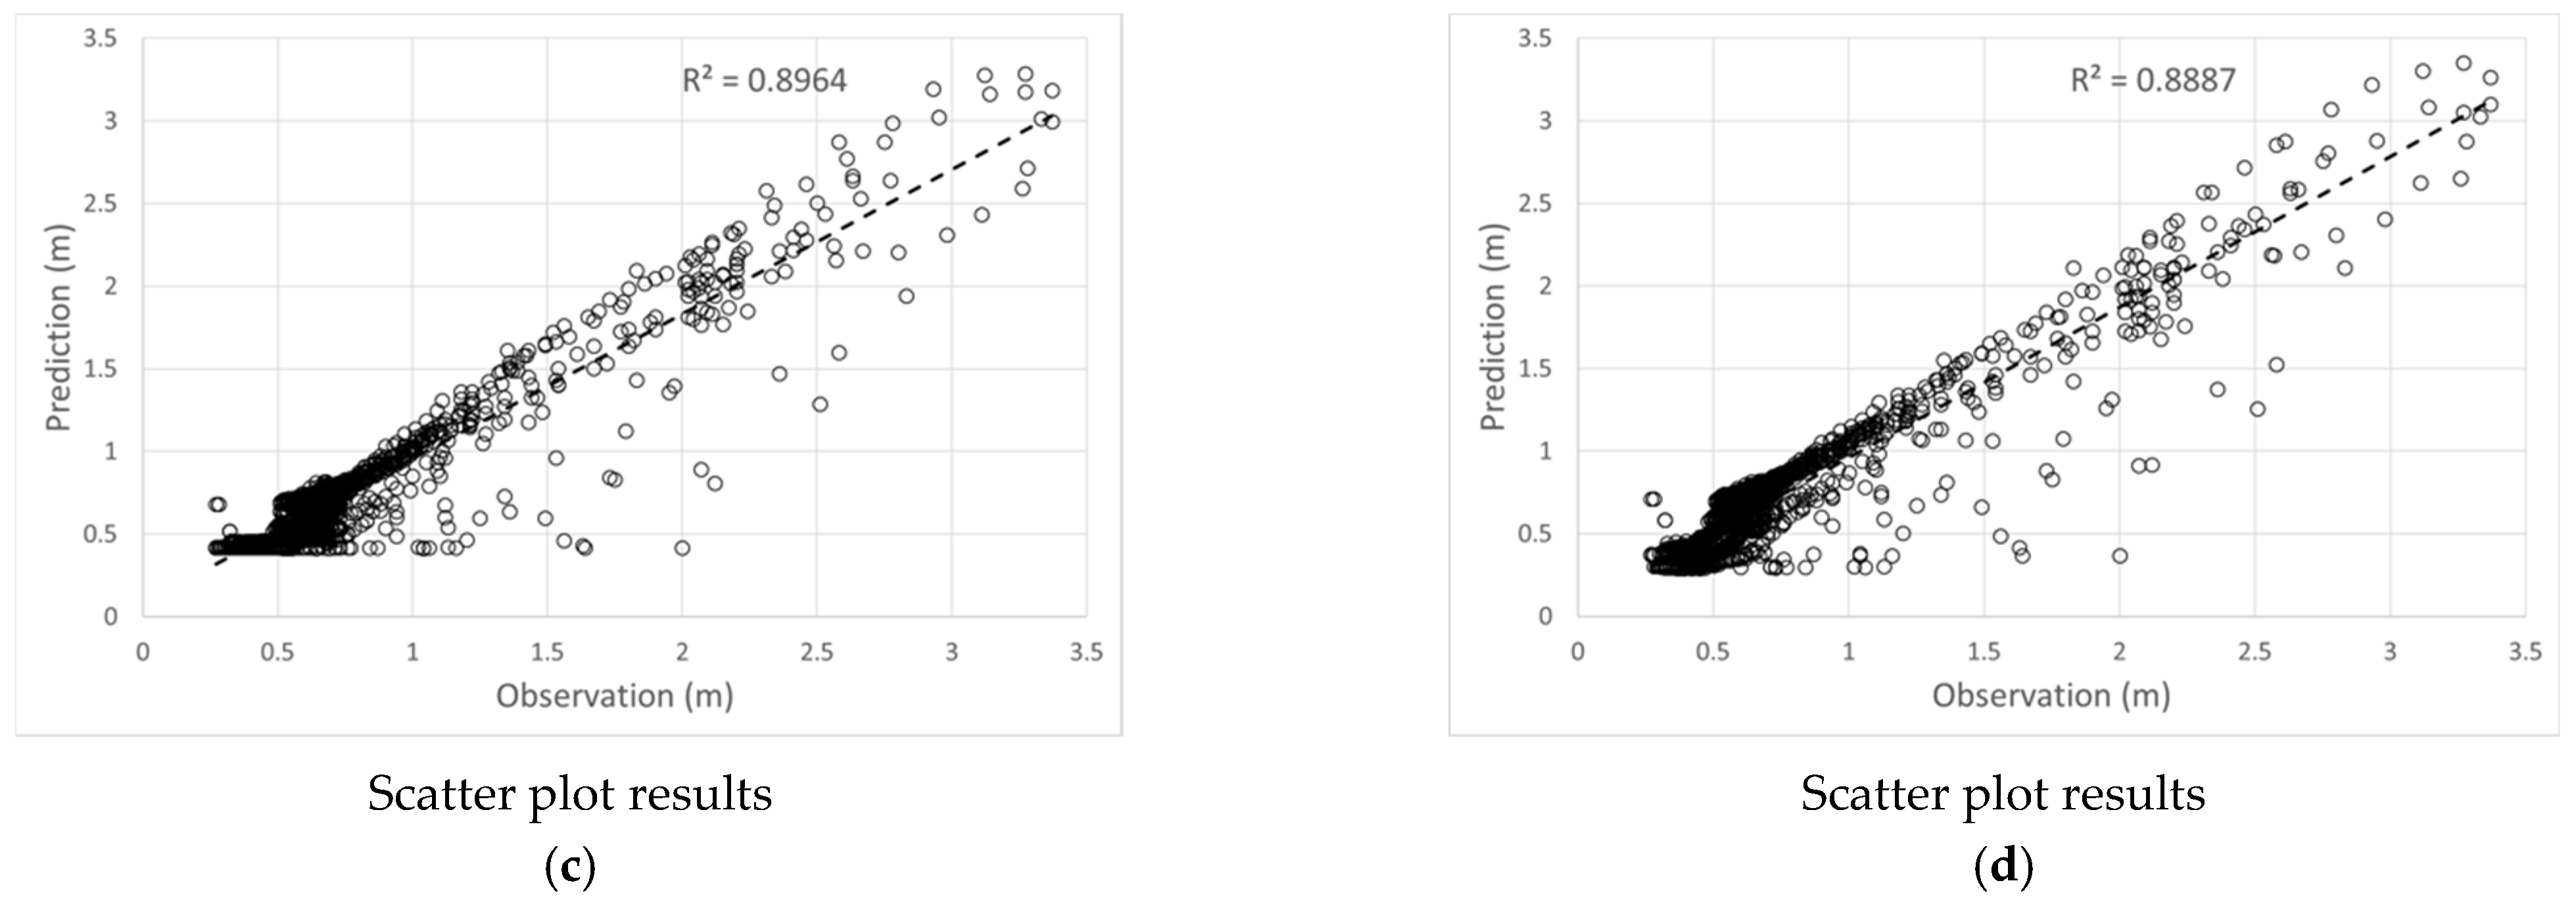
3.2. Deep Learning-Based Flood Forecasting and Warning

Based on a previous study, the deep learning model, which trained water level data from all periods in a hydrological time-series data, showed underestimated results of water level peaks [13]. It was found that training the hydrological time-series data during the inter-event time degraded the forecasting performance of high water levels. The training group was reestablished to exclude ordinary water levels and inter-event data from the time-series hydrological data constructed from the Dorim river basin to improve this shortcoming. As a method of selecting the torrential rain events in the urban basin, the urban basin inter-event time definition (IETD) was considered for separating the rainfall events and extracting the independent rainfall events. In North America, the IETD was set to six hours [41], but this study considered the time of arrival at the Dorim river basin (three-four hours) and set the IETD to five hours for selecting the independent rainfall events, and water level data for the equivalent period was constructed. Training for LSTM must be composed of time-series data. Therefore, an inter-event and initial water level of five hours were attached to the beginning and end of the constructed five-hour independent hydrological time-series data to create continuous hydrological time-series data (Figure 9).
In the deep learning model for forecasting the water level, the hydrological time-series data for training were classified into the training, validation, and test sets. After examining the flood-prone areas in the Dorim river basin, cases of flood damage, flood control facilities, water level meter location, etc., from multiple perspectives, the learning conditions were set to train the water levels at Seoul National University entrance, Sillim 3 Bridge, and Gwanak Dorim Bridge points in the hydrological time-series data to forecast the water level data at the Guro Digital Complex Station point after 30 min of lead time. The deep learning models for training the hydrological time series data in Dorim River basin include vanilla ANN, LSTM, Stack-LSTM, and bidirectional LSTM. Each model was calibrated through hyperparameter tuning to find the optimal values for numerous parameters and improve the model performance. We set the hyperparameter to be used for each model, and a random search method was used, in which the parameters for application were randomly calculated to find the optimal hyperparameters. The random search method is more effective than the grid search method that combines each parameter at a time, and its search for relatively significant parameters by setting checkpoints is known to show higher accuracy [42]. The applied hyperparameter setting conditions for each model are summarized in Table 4.
In the hyperparameters that are tuned by the random search, training nonlinear data was enabled by adding layers for the number of neurons and layers. However, when the number of layers is too large, overfitting or training problems occur. Therefore, the number of layers and neurons were set to 1–3 and 5–30, respectively, by applying empirical conditions. As the number of the neural network increases, the overfitting issue must be resolved with methods, such as the dropout. In general, the number of layers has a greater effect on the accuracy more than the number of nodes. The batch size is a parameter that determines the amount of data for each learning. When the size is too large, the issue of having to calculate the loss for all data during the weight update and memory issues are generated. When the size is too small, the learning data are finely split, which increases the learning period and generates noise. In general, the batch size is set from 32 to 512, as 2n. This study applied the batch size from 16 to 128 considering the empirical conditions of water level learning. The optimizer is a hyperparameter used for finding the minimum value of the loss function. In general, Adam is known to show high accuracy, but empirical conditions were considered, and various optimizers were applied to modify the learning rate and momentum. The learning rate is a parameter that determines the extent of movement of the weight toward the gradient direction for learning, for which, in general, a basic value of 0.01 is used. If the value is too high, the result diverges, and if the value is too low, the learning rate may become too slow to find the minimum value. For the validation split, cross-validation (CV) was applied, which is a method of learning and validating by altering the data sets between the train and validation sets, when data is limited, with the parameter that determines the quantity of data from the hydrological time-series data that will be used as validation data. Its ratios were set to 0.1, 0.2, and 0.3. In the activation function, the Exponential Linear Unit (ELU), Rectified Linear Unit (ReLU), and Scaled Exponential Linear Unit (SELU) were applied, which are often used recently, and the starting point of learning was found to apply the He_normal to the weight initialization function, which significantly affects the accuracy. As empirical conditions, the drop out was set to 0, 0.3, 0.5, and 0.8; the mean square error (MSE) to the loss function; and the lead time was set to 30 min considering the flood forecasting and warning times of Dorim river basin. With the basic deep learning model for forecasting the water levels, the 10-min hydrological time-series data established according to the training conditions were trained and the accuracy of the forecast water level results was examined (Figure 10). The vanilla ANN, LSTM, stack-LSTM, and bidirectional LSTM models were established for forecasting water levels in Dorim river basin. The water level data from three points in the upstream section were trained to forecast the water level data at mid- and downstream of Guro Digital Complex Station with a 30 min lead time from 1 August 2020 to 18 August 2020, and the water level forecast results from each deep learning model were compared and examined. The hyperparameters calculated for each model by random search did not show distinct consistency. It was considered that given the random calculation method for the hyperparameters, another optimal condition could be achieved with variously applicable parameters other than the combination of hyperparameters calculated for each model. The evaluation metric for each model showed for all LSTM, Stack-LSTM, and Bidi-rectional LSTM, but excluding the vanilla ANN, had high forecast performances at RMSE 0.15 or below (Table 5). The availabilities of the four models were presented in the urban stream level forecasting through optimal hyperparameter tuning. The deep learning models showed that the forecasting results were similar for each model, but bidirectional LSTM showed a slightly more accurate prediction performance compared to the other models in high water level prediction (Figure 10d). Finally, the loss rates for the training data and validation data of each model consistently decreased, no overfitting of the models were observed, and the water levels at the Guro Digital Com-plex with a 30 min lead time were accurately forecasted in advance. Table 6 shows that the hyperparameters finally applied through the random search method in each deep learning model. As a result, in the training of univariate hydrological data in urban areas, the setting of various lead times, the utilization of complex data, the selection of data to predict urban flooding, and the setting of hyperparameters rather than the setting of specific deep learning models should be considered.

4. Conclusions and Debate

This study developed a flood forecasting and warning process for an urban stream in South Korea by systemizing flood forecasting, warning, and quantification techniques for flooding risks. This case study aimed to contribute to the reduction of casualties and flood damage in urban streams and accurate flood warnings in complex urban areas. The results of this study are summarized as follows. The model-driven method by the integrated urban rainfall-runoff model and the data-driven method by the deep learning model were used to predict the urban flood damage. The flood warning criteria for the urban stream based on the urban rainfall-runoff model were analyzed. The rainfall-runoff model that combined the inland and river can accurately reflect the characteristics of the watershed, flood control facilities, and flood risk areas of the Dorim river basin. To calibrate the rainfall-runoff model, data of gauging stations and pump stations of an urban stream in August 2020 were used, and the model result was presented as an R2 value of 0.63~0.79. For flood forecasting and warning in the urban stream, deep learning models, vanilla ANN, Long Short-Term Memory (LSTM), Stack-LSTM, and Bidirectional LSTM were constructed. Deep learning models using 10-min hydrological time-series data from gauging stations were trained to warn of expected flood risks based on the water level in the urban stream. A forecasting and warning method that applied the bidirectional LSTM showed an R2 value of 0.9 for the water level forecast with a 30 min lead time, indicating the possibility of effective flood forecasting and warning.
The Dorim river basin is a representative flood risk area, having the most complex hydrological drainage system in South Korea. The flood forecasting and warning process applied to the target area can be sufficiently applied to the hydrological drainage systems in other complex urban watersheds. By constructing accurate forecasting and warning criteria through physical models and performing proactive flood warnings through deep learning models, flood damage reduction measures considering water-shed characteristics can be expanded. However, according to the frequently improved hydrological drainage system, it is necessary to continuously update the physical model and calibrate the model for the latest heavy rainfall events. In addition, it is necessary to evaluate the applicability of the flood warning method through cooperation with the local government in charge of the management of the flood defense system to construct a sustainable warning system. Furthermore, in this paper, the prediction results of bidirectional LSTM showed a slightly more accurate performance compared to other models in high water level prediction, but the latest deep learning models did not show a high performance in the prediction of univariate hydrological time series data compared to LSTM. In the training of univariate hydrological data in urban areas, the setting of various lead times, the utilization of complex data, the selection of data to predict urban flooding, and the setting of hyperparameters rather than setting specific deep learning models should be considered. In further research, the use of a more extended deep learning model and extension to other urban areas should be considered, and it is expected that the indicators shown by the deep learning models in this study can be utilized.

Author Contributions

Conceptualization, Y.-M.W. and J.-H.L.; methodology, Y.-M.W. and J.-H.L.; validation, Y.-I.M. and Y.-M.W.; formal analysis, Y.-M.W.; investigation, H.-T.M.; resources, J.-H.L.; data curation, Y.-I.M.; writing—original draft preparation, J.-H.L.; writing—review and editing, Y.-I.M.; supervision, Y.-I.M.; project administration, Y.-I.M.; funding acquisition, Y.-I.M. All authors have read and agreed to the published version of the manuscript.

Funding

This work was supported by the 2021 Research Fund of the University of Seoul.

Institutional Review Board Statement

Not applicable.

Informed Consent Statement

Not applicable.

Data Availability Statement

Not applicable.

Conflicts of Interest

The authors declare no conflict of interest.

References

  1. Bertilsson, L.; Wiklund, K.; Tebaldi, I.D.M.; Rezende, O.M.; Veról, A.P.; Miguez, M.G. Urban flood resilience—A multi-criteria index to integrate flood resilience into urban planning. J. Hydrol. 2019, 573, 970–982. [Google Scholar] [CrossRef]
  2. Lu, Y.; Xie, J.; Yang, C.; Qin, Y. Control of Runoff Peak Flow for Urban Flooding Mitigation. Water 2021, 13, 1796. [Google Scholar] [CrossRef]
  3. Rainey, J.L.; Brody, S.D.; Galloway, G.E.; Highfield, W.E. Assessment of the growing threat of urban flooding: A case study of a national survey. Urban Water J. 2021, 18, 375–381. [Google Scholar] [CrossRef]
  4. IPCC. Climate Change 2021: The Physical Science Basis. Contribution of Working Group I to the Sixth Assessment Report of the Intergovernmental Panel on Climate Change; Cambridge University Press: Cambridge, UK, 2021. [Google Scholar]
  5. World Weather Attribution. Rapid attribution of heavy rainfall events leading to the severe flooding in Western Europe dur-ing July 2021. Extrem. Rainfall Anal. Rep. 2021, 2021, 1–51. [Google Scholar]
  6. Machado, I.B.R.; Maroto, M.F.; Graña, A.M. Resilient Urbanism from the Perspective of Climate Change in Spain—The Case of Floods. In Civil Engineering for Disaster Risk Reduction; Springer: Berlin/Heidelberg, Germany, 2021; pp. 479–489. [Google Scholar] [CrossRef]
  7. Yan, D.; Liu, J.; Shao, W.; Mei, C. Evolution of Urban Flooding in China. Proc. IAHS 2020, 383, 193–199. [Google Scholar] [CrossRef]
  8. Dhiman, R.; VishnuRadhan, R.; Eldho, T.I.; Inamdar, A. Flood risk and adaptation in Indian coastal cities: Recent scenarios. Appl. Water Sci. 2019, 9, 5. [Google Scholar] [CrossRef] [Green Version]
  9. Jacobson, C.R. Identification and quantification of the hydrological impacts of imperviousness in urban catchments: A review. J. Environ. Manag. 2011, 92, 1438–1448. [Google Scholar] [CrossRef]
  10. Jung, M.; Kim, H.; Mallari, K.J.B.; Pak, G.; Yoon, J. Analysis of effects of climate change on runoff in an urban drainage system: A case study from Seoul, Korea. Water Sci. Technol. 2015, 71, 653–660. [Google Scholar] [CrossRef] [PubMed]
  11. Lee, Y.; Brody, S.D. Examining the impact of land use on flood losses in Seoul, Korea. Land Use Policy 2018, 70, 500–509. [Google Scholar] [CrossRef]
  12. Kundzewicz, Z.W.; Pińskwar, I.; Brakenridge, G. Changes in river flood hazard in Europe: A review. Hydrol. Res. 2017, 49, 294–302. [Google Scholar] [CrossRef]
  13. Lee, J.; Yuk, G.; Moon, H.; Moon, Y.-I. Integrated Flood Forecasting and Warning System against Flash Rainfall in the Small-Scaled Urban Stream. Atmosphere 2020, 11, 971. [Google Scholar] [CrossRef]
  14. Meyer, V.; Priest, S.; Kuhlicke, C. Economic evaluation of structural and non-structural flood risk management measures: Examples from the Mulde River. Nat. Hazards 2012, 62, 301–324. [Google Scholar] [CrossRef]
  15. Schanze, J.; Hutter, G.; Offert, A.; Penning-Rowsell, E.C.; Parker, D.; Harries, T.; Koniger, P. Systematisation, Evaluation and Context Conditions of Structural and Non-Structural Measures for Flood Risk Reduction. CRUE Funding Initiative on Flood Risk Management Research. 2008. Available online: http://www.flood-era.ioer.de/files/FLOOD-ERA_Final_report.pdf (accessed on 23 November 2021).
  16. Parker, D.J. Modelling the Damage Reducing Effects of Flood Warning; Middlesex University: London, UK, 2008; p. T10-07-12. [Google Scholar]
  17. Olfert, A.; Schanze, J. Methodology for Ex-Post Evaluation of Measures and Instruments for Flood Risk Reduction. FLOOD Site 2007, T12-07-01. Available online: http://www.floodsite.net/html/partner_area/project_docs/T12_07_04_Ex-Post_Evaluation_D12_1_ExecSum_V1_3_P04.pdf (accessed on 23 November 2021).
  18. Mcculloch, W.S.; Pitts, W. A logical calculus of the ideas immanent in nervous activity. Bull. Math. Biophys. 1943, 5, 115–133. [Google Scholar] [CrossRef]
  19. Lapedes, A.; Farber, R. In the title of Nonlinear signal processing using neural networks: Prediction and system modelling. In Proceedings of the IEEE International Conference on Neural Networks, San Diego, CA USA, 21 June 1987. [Google Scholar]
  20. Lapedes, A.S.; Farber, R.M. Neural Net Learning Algorithms and Genetic Data Analysis; Los Alamos National Laboratory: Northern, NM, USA, 1987; in prepatation. [Google Scholar]
  21. Lapedes, A.; Farber, R. How Neural Nets Work. Technical Report; World Scientific Pub Co. Pte Ltd.: Singapore, 1989. [Google Scholar] [CrossRef] [Green Version]
  22. Karunanithi, N.; Grenney, W.J.; Whitley, D.; Bovee, K. Neural Networks for River Flow Prediction. J. Comput. Civ. Eng. 1994, 8, 201–220. [Google Scholar] [CrossRef]
  23. Rangari, V.A.; Gopi, K.V.; Nanduri, U.V.; Bodile, R. ANN based Scaling of Rainfall Data for Urban Flood Simulations. In Proceedings of the 2020 IEEE Bangalore Humanitarian Technology Conference (B-HTC), Vijiyapur, India, 8–10 October 2020; pp. 1–6. [Google Scholar] [CrossRef]
  24. Tran, Q.-K.; Song, S.-K. Water Level Forecasting based on Deep Learning: A Use Case of Trinity River-Texas-The United States. J. KIISE 2017, 44, 607–612. [Google Scholar] [CrossRef]
  25. Bai, Y.; Li, Y.; Zeng, B.; Li, C.; Zhang, J. Hourly PM2.5 concentration forecast using stacked autoencoder model with emphasis on seasonality. J. Clean. Prod. 2019, 224, 739–750. [Google Scholar] [CrossRef]
  26. Althelaya, K.A.; El-Alfy, E.-S.M.; Mohammed, S. Evaluation of bidirectional LSTM for short-and long-term stock market prediction. In Proceedings of the 2018 9th International Conference on Information and Communication Systems (ICICS), Irbid, Jordan, 3–5 April 2018; pp. 151–156. [Google Scholar] [CrossRef]
  27. Ashley, R.M.; Balmforth, D.J.; Saul, A.J.; Blanskby, J.D. Flooding in the future–predicting climate change, risks and responses in urban areas. Water Sci. Technol. 2005, 52, 265–273. [Google Scholar] [CrossRef] [PubMed]
  28. Hammond, M.; Chen, A.; Djordjević, S.; Butler, D.; Mark, O. Urban flood impact assessment: A state-of-the-art review. Urban Water J. 2015, 12, 14–29. [Google Scholar] [CrossRef] [Green Version]
  29. René, J.-R.; Djordjević, S.; Butler, D.; Madsen, H.; Mark, O. Assessing the potential for real-time urban flood forecasting based on a worldwide survey on data availability. Urban Water J. 2014, 11, 573–583. [Google Scholar] [CrossRef] [Green Version]
  30. Wang, X.; Kinsland, G.; Poudel, D.; Fenech, A. Urban flood prediction under heavy precipitation. J. Hydrol. 2019, 577, 123984. [Google Scholar] [CrossRef]
  31. Pappenberger, F.; Cloke, H.; Parker, D.J.; Wetterhall, F.; Richardson, D.; Thielen, J. The monetary benefit of early flood warnings in Europe. Environ. Sci. Policy 2015, 51, 278–291. [Google Scholar] [CrossRef]
  32. Wang, H.; Chen, Y. Identifying key hydrological processes in highly urbanized watersheds for flood forecasting with a dis-tributed hydrological model. Water 2019, 11, 1641. [Google Scholar] [CrossRef] [Green Version]
  33. Thielen, J.; Bartholmes, J.; Ramos, M.-H.; de Roo, A. The European Flood Alert System—Part 1: Concept and development. Hydrol. Earth Syst. Sci. 2009, 13, 125–140. [Google Scholar] [CrossRef] [Green Version]
  34. Bartholmes, J.C.; Thielen, J.; Ramos, M.H.; Gentilini, S. The European Flood Alert System EFAS—Part 2: Statistical skill as-sessment of probabilistic and deterministic operational forecasts. Hydrol. Earth Syst. Sci. 2009, 13, 141–153. [Google Scholar] [CrossRef] [Green Version]
  35. Jongman, B.; Hochrainer-Stigler, S.; Feyen, L.; Aerts, J.C.J.H.; Mechler, R.; Botzen, W.J.W.; Bouwer, L.M.; Pflug, G.; Rojas, R.; Ward, P.J. Increasing stress on disaster-risk finance due to large floods. Nat. Clim. Change 2014, 4, 264–268. [Google Scholar] [CrossRef]
  36. Jongman, B.; Hochrainer-Stigler, S.; Feyen, L.; Aerts, J.C.J.H.; Mechler, R.; Botzen, W.J.W.; Bouwer, L.M.; Pflug, G.; Rojas, R.; Ward, P.J. Reply to ‘Statistics of flood risk’. Nat. Clim. Change 2014, 4, 844–845. [Google Scholar] [CrossRef]
  37. Hochreiter, S.; Schmidhuber, J. Long short-term memory. Neural Comput. 1997, 9, 1735–1780. [Google Scholar] [CrossRef]
  38. Graver, A.; Mohamed, A.; Hinton, G. Speech recognition with deep recurrent neural networks. In Proceedings of the 2013 IEEE International conference on acoustics, speech and signal processing, Vancouver, BC, Canada, 26–31 May 2013; pp. 6645–6649. [Google Scholar] [CrossRef] [Green Version]
  39. Perales-Momparler, S.; Hernández-Crespo, C.; Vallés-Morán, F.; Martín, M.; Andrés-Doménech, I.; Andreu Alvarez, J.; Jefferies, C. SuDS Efficiency during the Start-Up Period under Mediterranean Climatic Conditions. CLEAN–Soil Air Water 2014, 42, 178–186. [Google Scholar] [CrossRef] [Green Version]
  40. Ramos, H.M.; Pérez-Sánchez, M.; Franco, A.B.; López-Jiménez, P.A. Urban Floods Adaptation and Sustainable Drainage Measures. Fluids 2017, 2, 61. [Google Scholar] [CrossRef] [Green Version]
  41. Adams, B.J.; Papa, F. Urban Stormwater Management Planning with Analytical Probabilistic Model; John Wiley Sons: New York, NY, USA, 2000. [Google Scholar]
  42. Schrack, G.F.; Choit, M. Optimized relative step size random searches. Math. Program. 1976, 10, 230–244. [Google Scholar] [CrossRef]
Figure 1. Urban flood forecasting and warning process.
Water 14 00187 g001
Figure 2. Study area for this cast study.
Water 14 00187 g002
Figure 3. Map of the study area in Dorim basin. (a) River. (b) Waterlevel station. (c) Pump station. (d) Flood-stricken areas.
Water 14 00187 g003
Figure 4. Typical structure of deep learning models.
Water 14 00187 g004
Figure 5. Rainfall-runoff model in Dorim basin by XP-SWMM.
Water 14 00187 g005
Figure 6. Calibration results of pump station (01 August 2021).
Water 14 00187 g006aWater 14 00187 g006b
Figure 7. Calibration results of the water level in Dorim stream (1 August 2021).
Water 14 00187 g007
Figure 8. Flood defense locations according to local governments.
Water 14 00187 g008
Figure 9. Construction of hydrological time series data.
Water 14 00187 g009
Figure 10. Waterlevel prediction by deep neural networks (Gurodigital station). (a) Vanilla ANN. (b) LSTM. (c) Stack-LSTM. (d) Bidirectional LSTM.
Water 14 00187 g010aWater 14 00187 g010b
Table 1. Dorim river isolation accident status.
DayEventAccident
September 2010Marooned on river 1 Water 14 00187 i001 Water 14 00187 i002
July 2011Marooned on river 3
August 2012Marooned on river 2
August 2013Marooned on river 17
August 2014Marooned on river 221 September 201027 July 2011
August 2015Marooned on river 52 Water 14 00187 i003 Water 14 00187 i004
August 2016Marooned on river 5
August 2017Marooned on river 10
July 2018Marooned on river 12
September 2019Marooned on river 2, fatality 1
August 2020Marooned on river 25, fatality 15 September 20191 August 2020
Table 2. Waterlevel analysis due to rainfall scenario in Dorim basin (Guro digital station).
Duration (min)Waterlevel by Rainfall Intensity (EL.m)
20 mm30 mm40 mm50 mm60 mm70 mm80 mm90 mm100 mm
2010.2410.2410.2410.2510.2510.2510.2510.2510.26
2210.2410.2410.2510.2510.2510.2510.2510.2610.26
2410.2410.2510.2510.2510.2510.2510.2610.2610.26
2610.2510.2510.2510.2510.2510.2610.2610.2610.26
2810.2510.2510.2510.2510.2610.2610.2610.2610.26
3010.2510.2510.2510.2610.2610.2610.2610.2610.27
3210.2510.2510.2610.2610.2610.2610.2610.2710.27
3410.2510.2610.2610.2610.2610.2610.2710.2710.27
3610.2610.2610.2610.2610.2610.2710.2710.2710.27
3810.2610.2610.2610.2610.2710.2710.2710.3310.28
4010.2610.2610.2610.2710.2710.2710.3410.4010.33
4210.2610.2610.2710.2610.2710.3510.4010.4410.40
4410.2610.2710.2710.3210.3510.4710.4310.4610.49
4610.2710.2710.2710.3410.3910.4510.5610.6110.53
4810.2710.2710.4510.4110.5110.6210.5610.6110.69
5010.2710.2810.4310.4910.4810.9010.6310.6810.94
5210.2710.3110.4010.5510.8510.8810.7311.1111.15
5410.2710.4610.4810.5510.8511.2211.1411.3311.45
5610.2910.3910.6110.7010.7811.2411.2211.5111.57
5810.3210.4210.6710.8811.4311.3311.5011.5811.74
6010.3510.5010.6110.9711.1811.4711.6311.7511.89
6210.3710.5911.0411.3811.3911.6311.7811.8512.01
6410.4010.5610.9911.4411.5511.7311.8611.9812.10
6610.4410.5911.3911.5311.6511.8311.9612.1112.22
6810.4510.7311.3111.6411.7411.9312.0712.2112.40
7010.4610.7111.3711.7111.8812.0312.1912.3212.46
7210.5011.0111.5211.7911.9612.1012.2612.4612.58
7410.5111.2111.6211.8612.0312.1912.3512.5012.66
7610.5611.4211.7011.9212.1112.2612.4012.5812.75
7810.6511.3911.7111.9712.1212.3312.4912.6612.81
8010.6111.4511.8111.9912.2312.3712.5312.7012.87
8210.6211.5011.8312.0412.2612.4112.5912.7612.93
8410.6511.5811.8712.0712.2812.4612.6412.7912.97
8610.6711.6011.9012.1012.3012.4812.6712.8613.01
8810.6811.6011.9212.1312.2912.5312.6912.8513.03
9010.7911.6111.9512.1412.3612.5112.7112.8813.05
9211.2611.6211.9212.1712.3512.5312.7312.9213.07
9411.2811.6511.9812.1712.3712.5312.7312.9013.07
9611.3011.6911.9612.1912.3712.5412.7312.9013.06
9811.2111.7111.9612.1912.3512.5412.7112.8913.06
10011.2211.7111.9812.1912.4012.5312.7512.8913.06
(1) Riverside over flooding 10 min before, (2) Riverside over flooding 10 min before, (3) Riverside over flooding
Table 3. Blocked section of Dorim river in a warning rainfall event.
Classification (Local Government)Regulated SectionSection Length
Gwanak DistrictUpstreamSeoul National University entrance-Bonglim Bridge (left bank, right bank)3.4 km
DownstreamBonglim Bridge-Dorim Bridge (left bank, right bank)
Dorim Bridge-Guro Digital Complex Station (left bank)
3.3 km
1.5 km
Dongjak DistrictDorim Bridge-Guro Digital Complex Station (right bank)1.5 km
Guro DistrictGuro Digital Complex Station-Anyangcheon (left bank)4.3 km
Yeongdeungpo DistrictGuro Digital Complex Station-Anyangcheon (right bank)4.3 km
Table 4. Hyperparameter estimation by the random search method.
ClassificationParameters
Neurons5, 10, 15, 20, 25, 30
Layer1, 2, 3
Batches16, 32, 64, 128
Epochs200
OptimizerAdam, Nadam, Admax, RMSprop, SGD, Adadelta,
Adagrad
Learning rate0.001, 0.01, 0.05, 0.1
Validation split0.1, 0.2, 0.3
Activate functionReLU, SELU, ELU
Weight initialization functionHe_normal
Normalization functionL2 regularizers
Lossmse
Lead time30 min
Dropout0, 0.3, 0.5, 0.8
Table 5. Comparison and analysis of waterlevel prediction results due to deep learning models.
ClassificationRMSEMAEMAPE (%)R2
ANN0.6250 0.538987.06910.8912
LSTM0.13880.070010.44280.9022
Stack-LSTM0.14170.086214.58030.8964
Bidirectional LSTM0.14700.093314.87340.8887
Table 6. Adopted hyperparameters by the random search method.
ClassificationANNLSTMStack-LSTMBidirectional LSTM
Neurons50251515
Layer1131
Batches32326464
Epochs200, Early stopping application
OptimizerAdamAdagradNadamNadam
Learning rate0.10.050.10.001
Validation split0.30.30.10.1
Activate functionELUReLUReLUELU
Weight initialization functionHe_normal
Normalization functionl2 regularizers (0.001)
Lossmse
Lead time30 min
Dropout0000.5
Publisher’s Note: MDPI stays neutral with regard to jurisdictional claims in published maps and institutional affiliations.

