
Mining Scheme for Small Rivers near Water Sources—A Case Study of Liuan River in Linquan County, China

1
School of Civil Engineering, Hefei University of Technology, Hefei 230009, China
2
School of Resource and Environmental Engineering, Hefei University of Technology, Hefei 230009, China
3
School of Resource and Environmental Engineering, Anhui Technical College of Water Resources and Hydroelectric Power, Hefei 231603, China
*
Author to whom correspondence should be addressed.
Water 2022, 14(12), 1921; https://doi.org/10.3390/w14121921
Submission received: 28 April 2022
/
Revised: 6 June 2022
/
Accepted: 8 June 2022
/
Published: 15 June 2022
(This article belongs to the Special Issue River Ecological Restoration and Groundwater Artificial Recharge II)
Abstract
:During dry seasons or years, the runoff processes from small rivers influence the safety of riverside groundwater source fields. Water source exploitation has a considerable effect on river runoff. In this study, the riverside source field of the Liuan River in the Linquan County, Anhui Province, was analyzed. The effect of mining on the ecological flow of the river under river runoff conditions in different typical dry years was quantified. This was undertaken using numerical simulations of the groundwater flow to provide guidance for the establishment of mining schemes for riverside source fields. In 95% of typical dry years, the water supply of small rivers is insufficient. The improved 7Q10 method used to calculate the ecological flow in different dry years revealed that mining water had little effect on the ecological flow. However, during the pumping process, the groundwater level of the water source area decreased greatly. The establishment of riverside source fields can aid in reducing excessive development and use of deep groundwater. The planning, construction, and implementation of the “Divert water from the Yangtze River to the Huaihe River” project can effectively reduce the economic losses that have occurred due to severe drought in the local area.
1. Introduction
In many arid and semi-arid regions, the long-term exploitation of groundwater has caused a range of environmental problems [1]. Researchers worldwide have studied groundwater overexploitation and highlighted that it can lead to a considerable drop in the water level, the formation of groundwater falling funnels, ground subsidence due to ground cracks, groundwater pollution, and deterioration of the groundwater quality [2]. In 2003, the Ministry of Water Resources of the People’s Republic of China formulated the “Opinions on Strengthening the Management of Water Resources in Groundwater Overexploited Areas” with the aim of reducing groundwater exploitation [3]. Based on the reduction in groundwater exploitation, some areas that use groundwater as a source of municipal water may need to adjust their strategies for water supply [4]. Many researchers have suggested the use of riverside source fields to secure urban water supplies [5]. Riverside source fields refer to water sources in which the lateral river runoff is the main water source for pumping wells that are distributed along rivers. Compared with other groundwater and surface water sources, the exploitation of riverside source fields is more complex. It depends not only on the hydrogeological conditions near the rivers but also on the hydraulic connection with aquifers and additional hydrogeological parameters [6]. Sufficient water in the riverside source field is recharged from the river [7], resolving surface water quality problems through the water–rock reaction in the flow path, which meets the safe drinking water standard in some areas [8]. The advantage in terms of water supply from the riverside source is that it can be used for regulation and improving the storage capacity of the aquifer, as well as mutual adjustment with the river.
Many researchers have studied the joint regulation of surface water and groundwater in large river basins [9]. However, small rivers are often an important water resource in arid and semi-arid areas. Rivers with protected areas of less than 6.6 km2 in size are generally classified as small rivers. There are few studies that have been undertaken on the joint regulation and impact mechanisms of groundwater and surface water in small river basins. Small rivers in arid and semi-arid areas have low levels of flow and low water levels. There is also a strong seasonal influence and ecological effect on river flow in arid and semi-arid areas. Small rivers can play a key role in meeting the local demand for water supplies as the riverside source field. However, small rivers may suffer from periodic water shortages during the dry season, and different exploitation strategies need to be formulated for implementation during dry years [10]. During these dry years, exploitation of water sources near the river will lead to declining water levels in small rivers, as well as changes in the hydraulic gradient [11]. If the water level of the small rivers is lower than the ecological water level, it will cause irreversible ecological and environmental problems in these river basins. With improvement in groundwater management systems, groundwater management is not limited to the pumping capacity. There are also strict control standards for changes in the groundwater level and the associated ecological impact. With the proposal of the ministry of water resources of China that the protection of ecological flow of rivers and lakes should be put in the first place, the protection of ecological flow should be paid more attention in the water resource management of the Huaihe River Basin [12]. Due to the uneven distribution of rainfall in the Huaihe River Basin, the ecological flow of the river should be paid more attention in the dry season. Liuan River, as a small tributary of the Huaihe River Basin, will also have an important impact on the ecological flow due to the decline of water level in the process of taking water near the river. In arid and semi-arid areas, there are frequent exchanges between the surface water and the groundwater. The dynamic changes in groundwater levels and the river levels should also form a key focus while ensuring maintenance of the water supply [13]. Therefore, the exploitation strategy of small shallow rivers should be adjusted under climate change [14]. In calculating the water supply capacity of riverside water sources in small rivers, the influence from changes in the boundary conditions on the water supply should be a key focus [15].
The hydraulic changes and ecological impacts from abstraction of water near the river in small river basins are not currently clear. This study focuses on a typical small river in the Huaibei Plain of China and uses it as a case study to examine the characteristics of small rivers. The numerical simulation method is used to study the hydraulic changes and their ecological effects from the water intake area near the Liuan River.
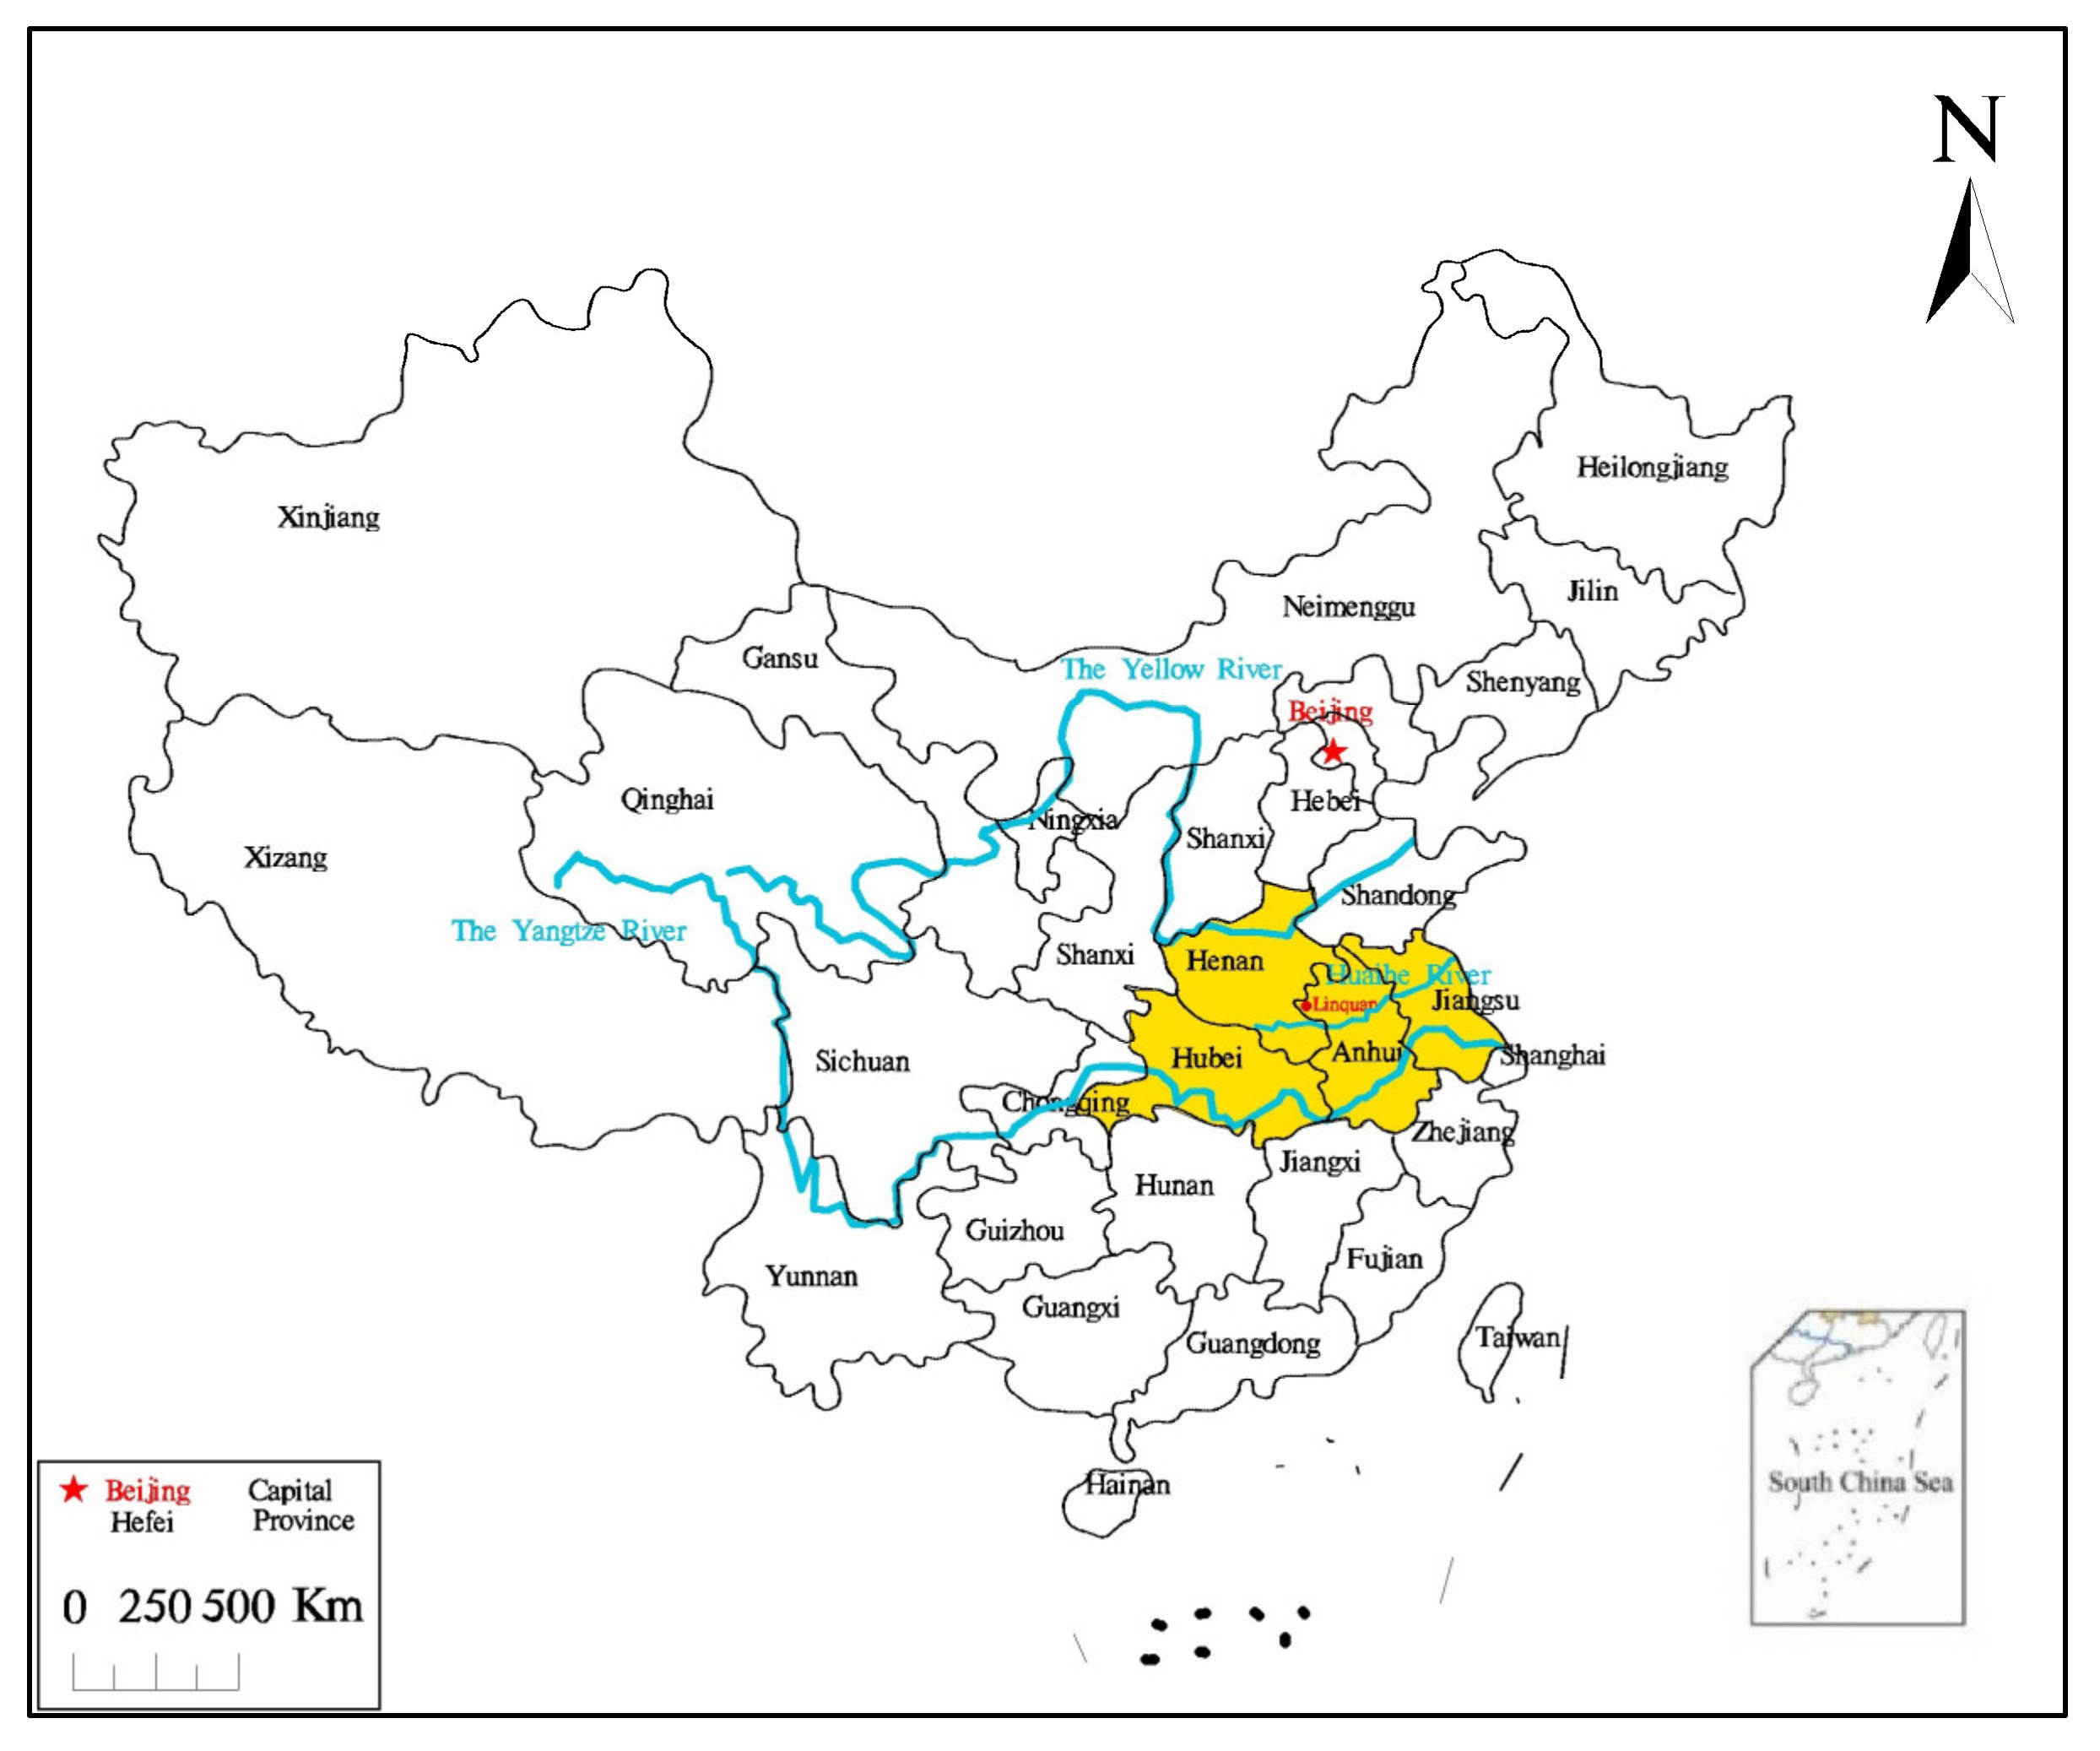
In this study, the riverside source field of the Liuan River in the Huaihe River Basin (Figure 1 and Figure 2) was used as the case study and the hydrogeological conditions were systematically analyzed. A numerical model was established to analyze the effects of the water intake in the riverside source area of the Liuan River in 95%, 75%, and 50% typical dry years. The model was used to simulate and predict the effects of the water supply on the riverside source area and the ecological flow. Based on the results of this study, this paper proposes a mining scheme that is suitable for small rivers near water sources [16]. Compared with the water supply of large rivers, when studying the water supply of small rivers, the impact of pumping on the river runoff and ecological flow, and changes in the groundwater level should be a key focus [17], as well as the planning, construction, and implementation of the “Divert water from the Yangtze River to the Huaihe River” project. The “Divert water from the Yangtze River to the Huaihe River” project is a large-scale trans-basin water diversion project, which mainly focuses on urban and rural water supplies. The project also encompasses the development of navigation in the Yangtze River and the Huaihe River, combined with the replenishment of irrigation water and the improvement of the water ecological environment of the Chaohu Lake and the Huaihe River. The study aims to provide suggestions for solving the problem of water supplies in arid and semi-arid areas, and to prevent economic losses caused by the imbalance between the supply and demand of water resources.
2. Study Area
2.1. Geographical Location
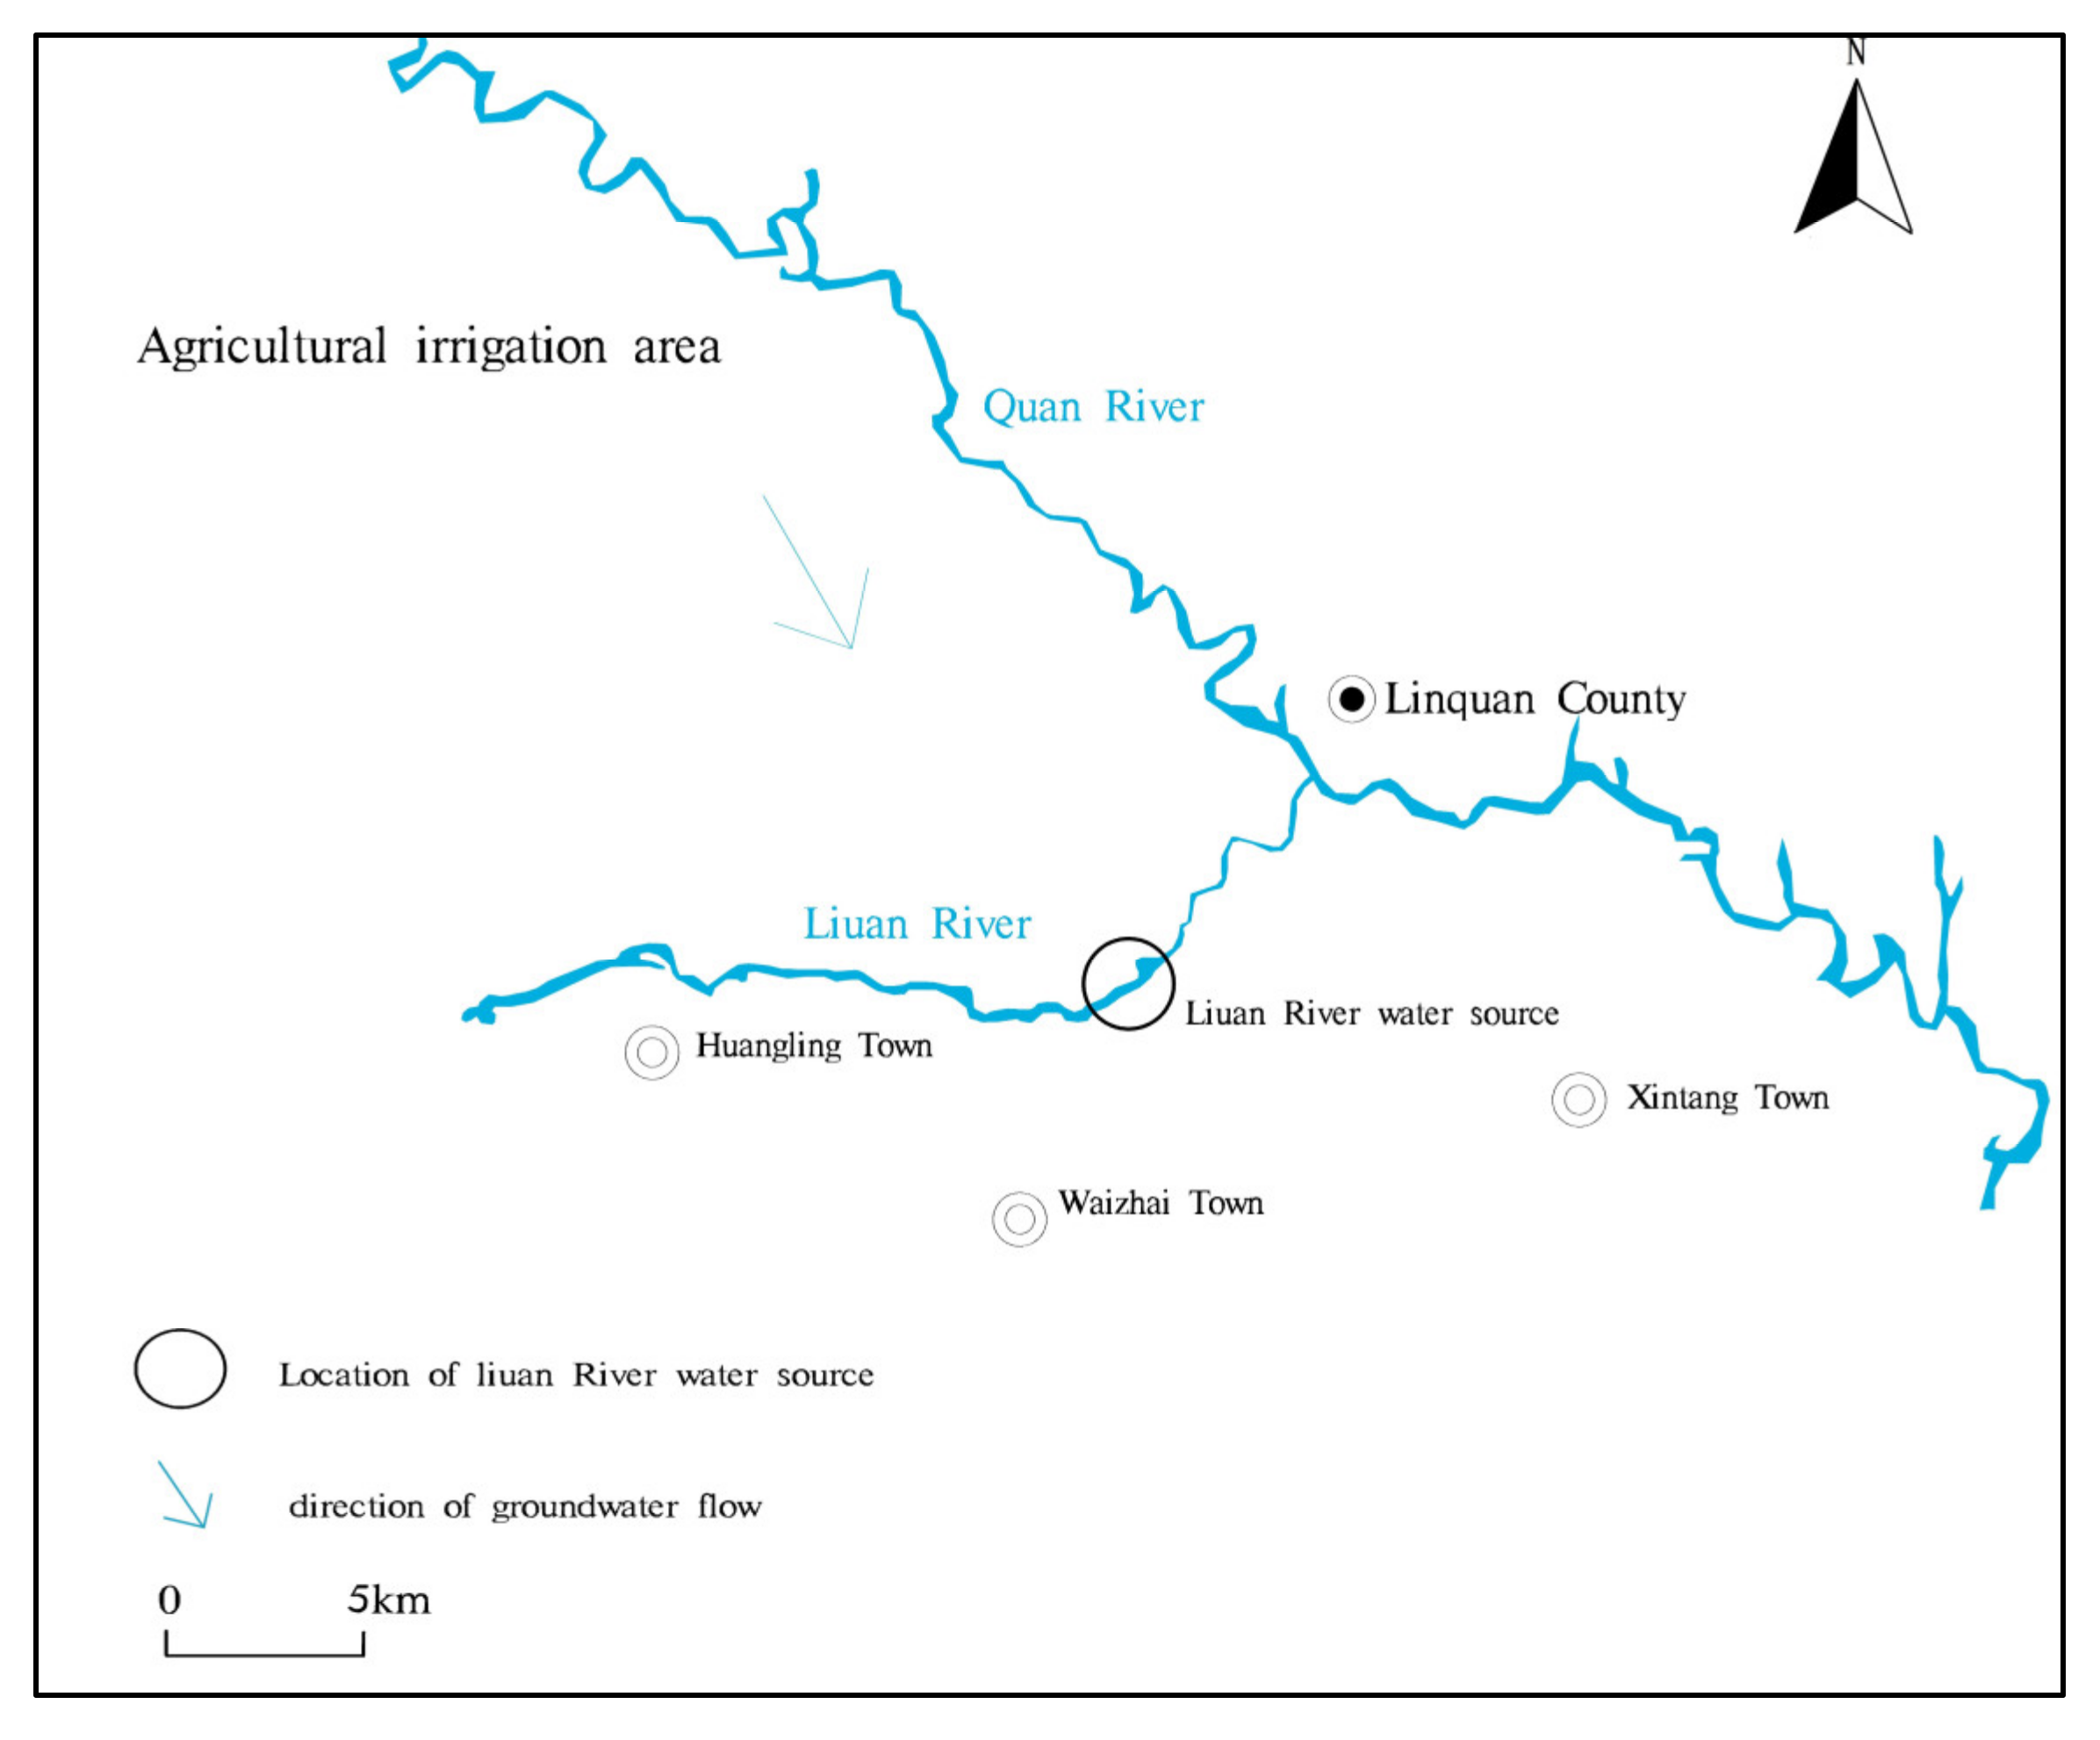
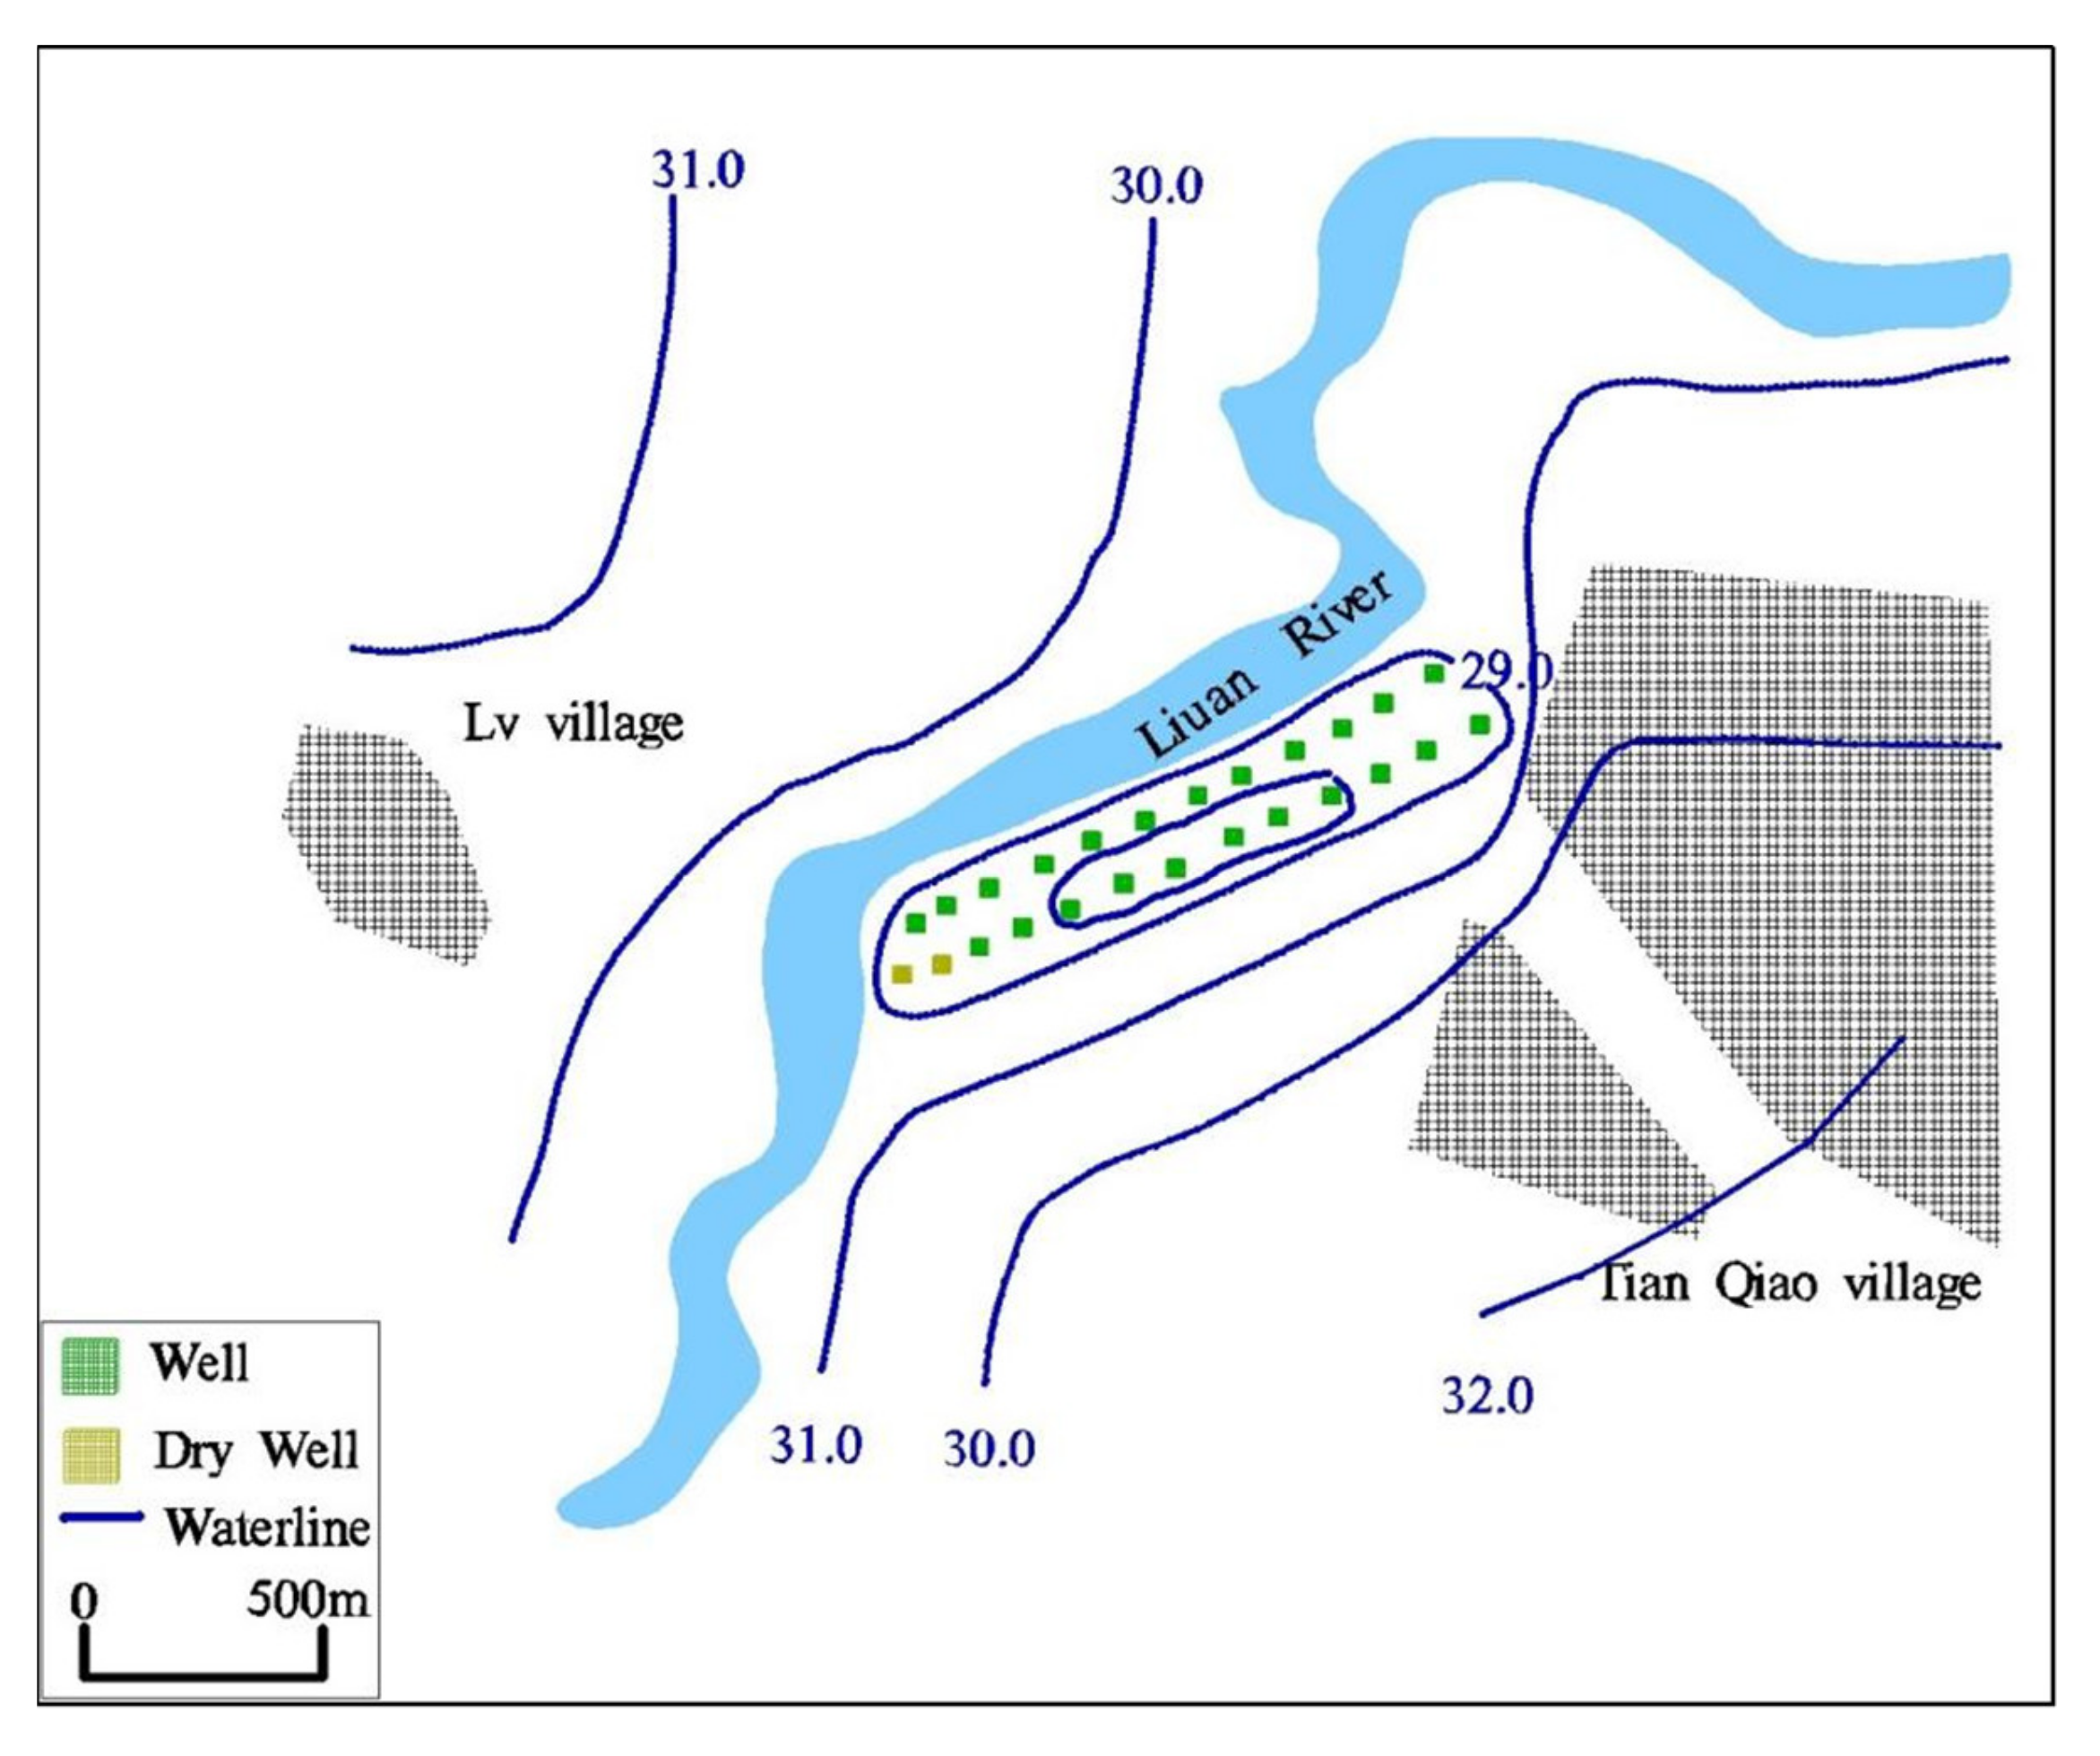
The research area is in Linquan County, Fuyang City, Anhui Province. The terrain is relatively low in the northeast and high in the southwest, with an elevation ranging from 34 to 40 m asl. The research area is approximately 4 km2 (Figure 3 and Figure 4) with an accumulation plain formed by the flooding of the Yellow and the Huaihe rivers.
2.2. Meteorological and Hydrological Conditions
Linquan County is adjacent to the Quanhe River in the north and Honghe River in the south. Linquan County is in the transition zone between the warm temperate and subtropical zones and forms part of the semi-humid continental climate zone of the warm temperate zone. The average annual precipitation in the county is 906.2 mm.
According to the Liuan River System governance planning report in Linquan County, the Liuan River is one of the main tributaries of the Quanhe River. It covers an area of 406.40 km2 and has a total length of 41.60 km. The Liuan River length of the study area is approximately 3500 m, the width of the riverbed is approximately 100 m, and the length of the riverbed can reach 150 m locally. The average annual water level of the Liuan River is 34 m asl, the average annual runoff is 14.3 m3/s, and the minimum daily flow is 2.5 m3/s. The maximum annual river flow generally occurs in August with the minimum flow occurring in January.
2.3. Hydrogeological Conditions
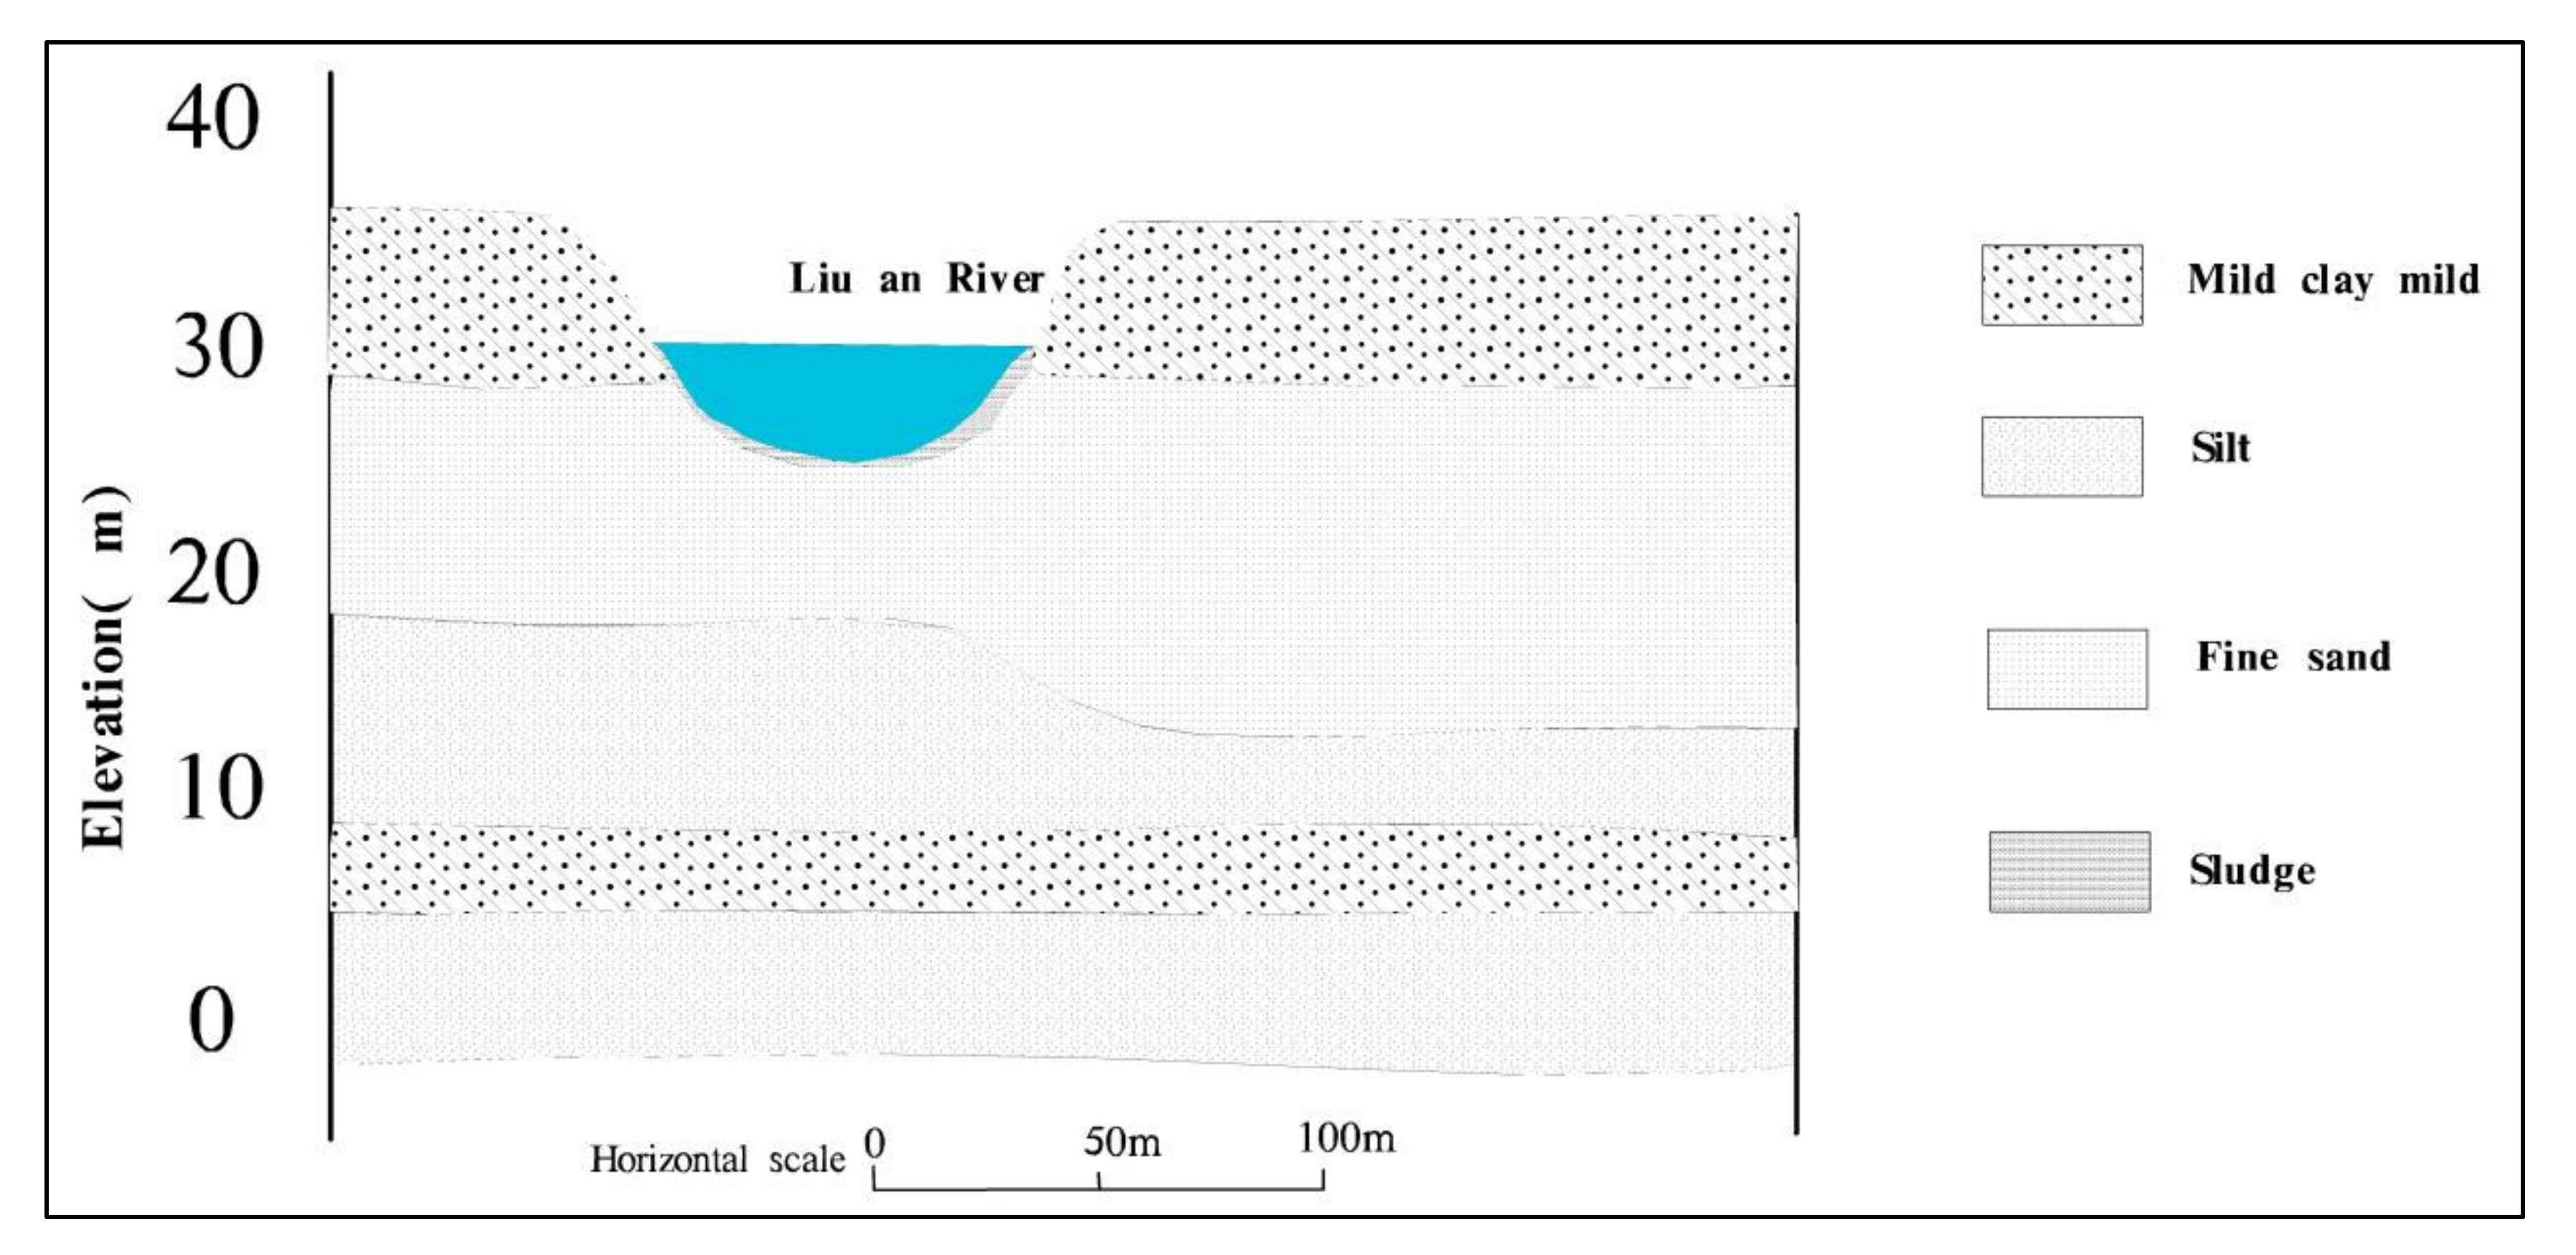
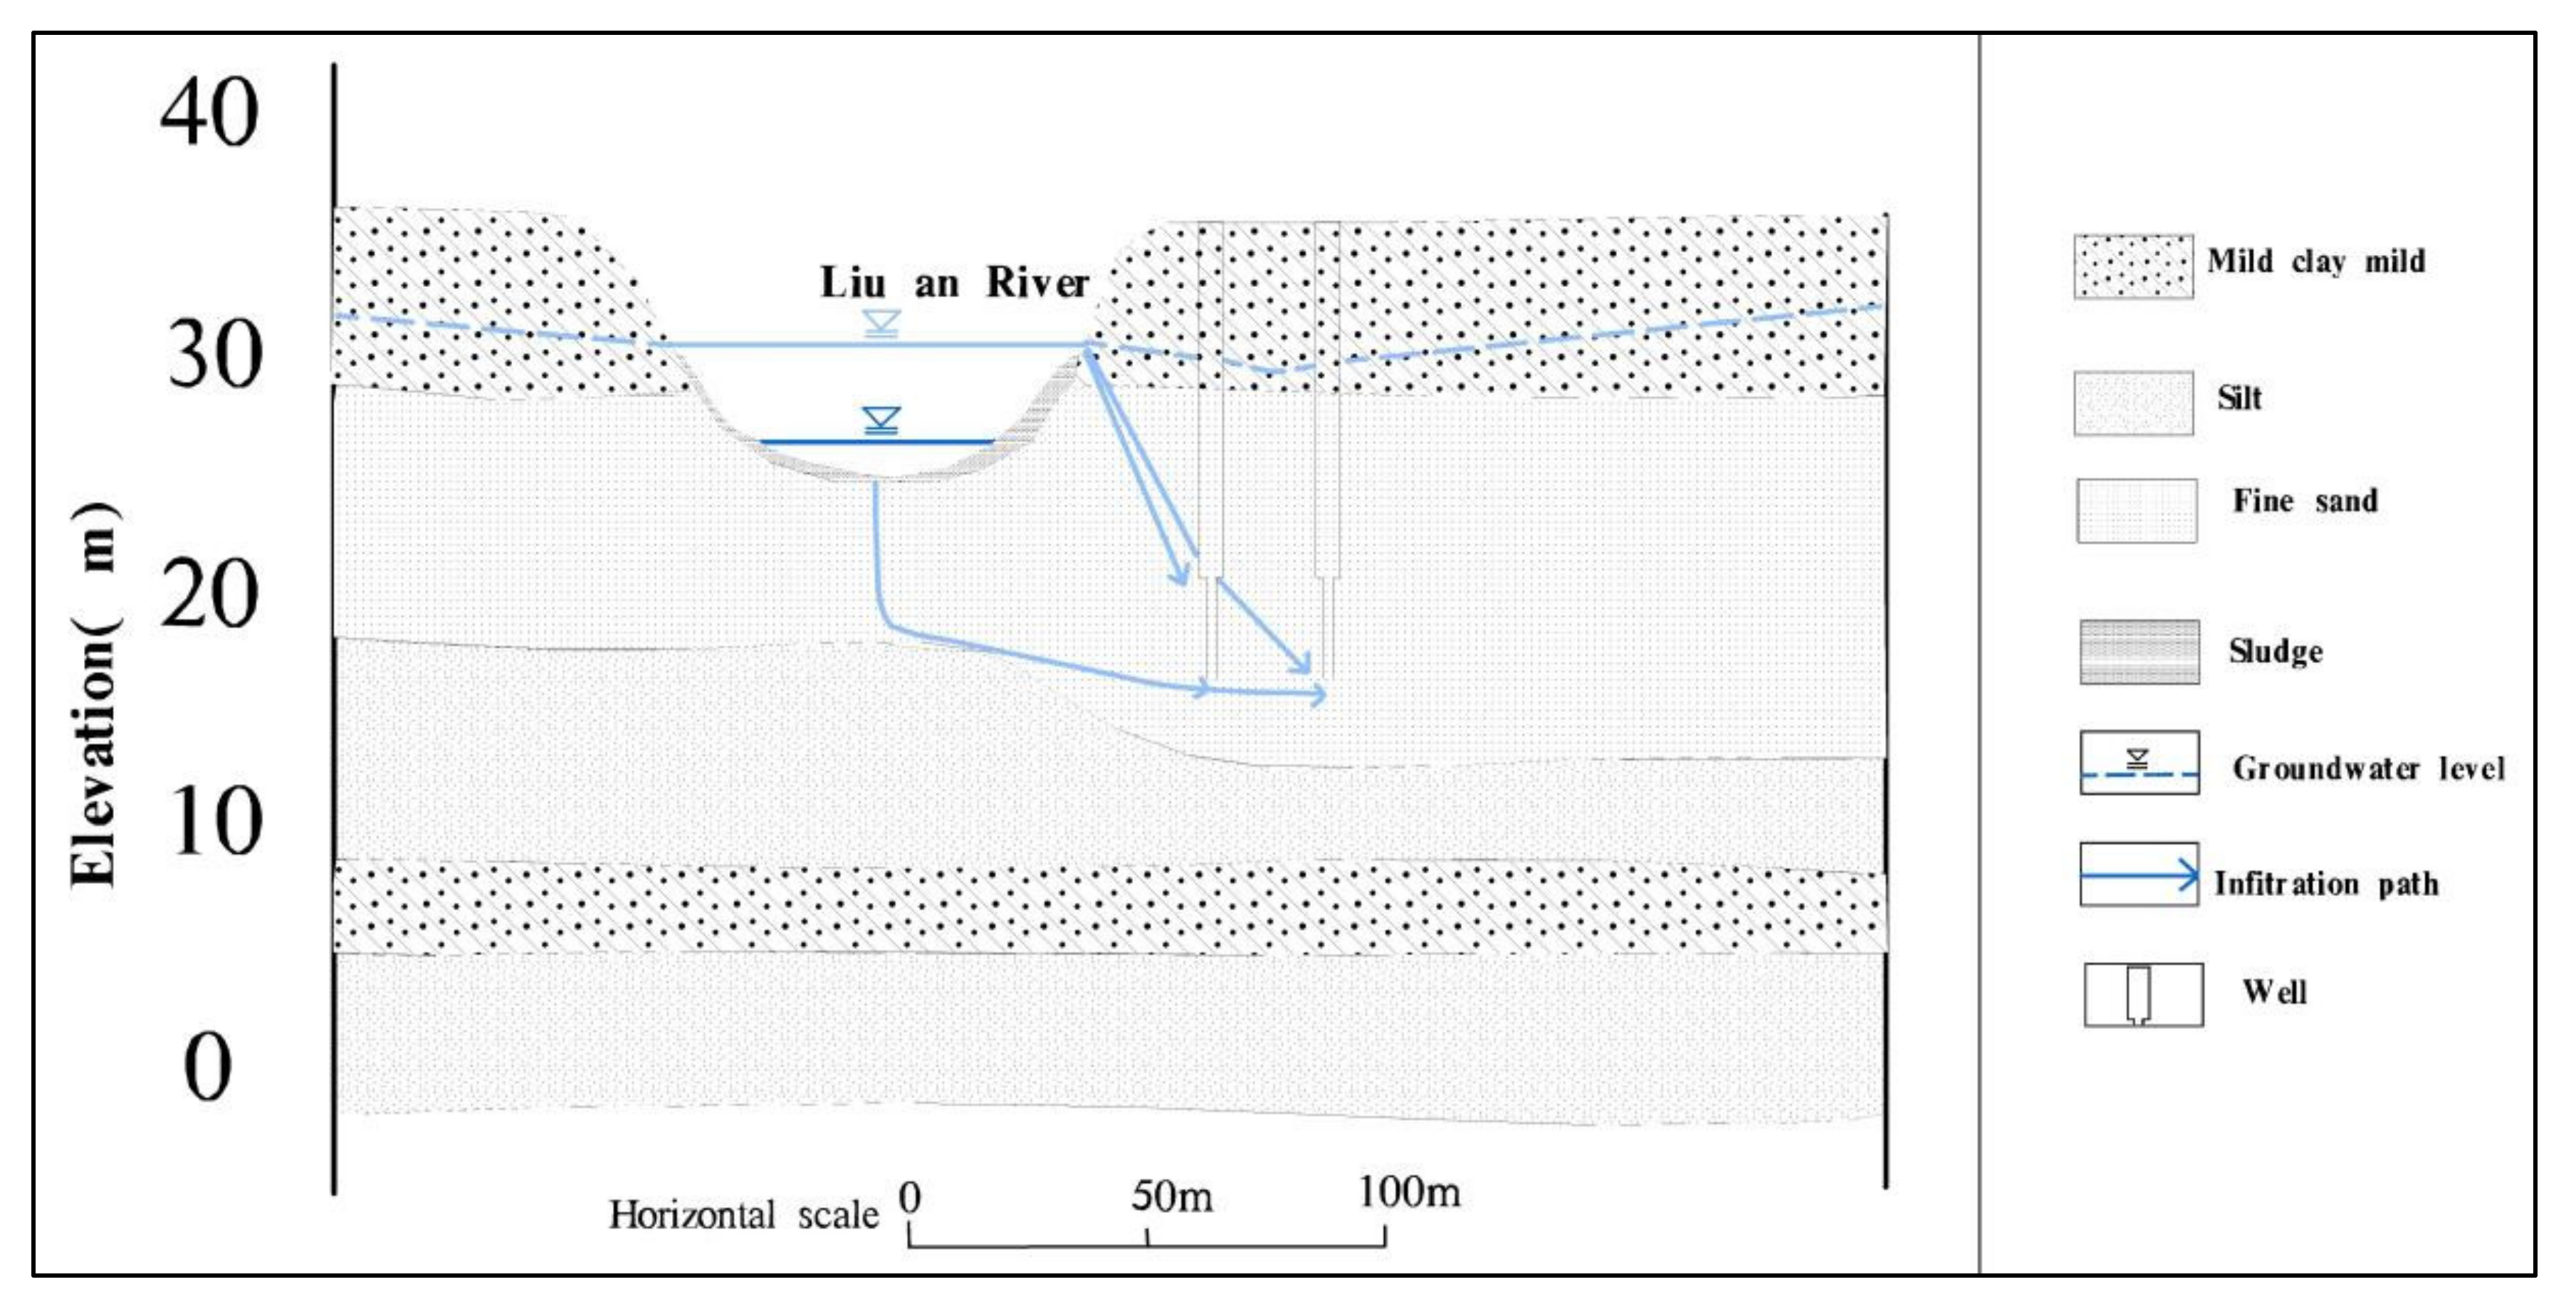
Based on the relative age of the formations, the genetic groundwater type, the hydraulic characteristics, and the burial conditions, the study area can be classified into the Quaternary Holocene microconfined fissure and the pore phreatic aquifer group (Figure 5). The water-bearing sections were divided into the Middle Holocene () fissure and the pore phreatic water-bearing section. The groundwater runoff in the study area is controlled by the regional topography, from northwest to southeast, which is basically consistent with the river flow direction.
The upper section of the formation is a sand-bearing sub-clay layer with a bluish yellow color and a thickness of 7–10 m, which is the exploitable layer with fissures in the strata. The water level is at approximately 2–4 m, which is relatively deep in the bank of the modern valley, and relatively shallow in the inter-river area at a depth of approximately 1–2 m.
This layer is extensively exposed along the river, with being a recharge channel for the aquifer section.
The aquifer comprises two to three layers of silt and fine sand aquifers. In some areas, four to five or more layers have been recorded. The burial depth of the top and bottom layers ranges from 7 to 10 m and from 20 to 25 m, respectively. The thickness of a single layer is 1–5 m and the average accumulated thickness is 5–15 m. The northern and eastern areas of the county mainly have fine sand aquifers with relatively few layers, but the thickness of a single layer is approximately 5–10 m, and can reach more than 15 m. Aquifers alternate with sandy loam soil and clay (claypan), and generally have low water pressure or no water, except for in the sandy loam soil layer, in the vertical section part of the opposing waterproof layer. However, because of variable development in the ancient riverbed, the lateral variation of the claypan is so high that the aquifer creates a water-bearing system with hydraulic connections at different depths. Based on pumping data obtained from several wells, the water inflow can reach 40 m3/h when the depth has been reduced by 3–6 m.
The study area is mainly a broad and flat accumulation plain, and its main movement mode is vertical, continuously alternating the circulation of seepage and evaporation, leading to low mineralization of the groundwater [18]. The hydrochemistry of the water in the study area is relatively simple. The anionic content (mainly HCO3) is stable, whereas the cation (main cations are Ca and Na) content differs.
Groundwater is mainly abstracted for artificial mining. There is a weak permeable layer on the surface and the consumption of water through phreatic evaporation is low. The bed of the Liuan River is within the phreatic aquifer, which is a typical groundwater source adjacent to the river.
3. Methods
3.1. Model Setup and Validation
The strata found in the study area dates from the Quaternary and Tertiary periods. The hydrogeological conditions of the Cenozoic strata in the study area are consistent with the regional hydrogeological conditions. In this study, the porewater aquifer group was analyzed. From top to bottom, this group can be divided into one weakly permeable layer group and two aquifer groups.
The groundwater in the study area is in an unstable state, the aquifer is heterogeneous and anisotropic, and the water flow obeys Darcy’s law. The flow direction of groundwater is basically parallel to the flow direction of the river, and the boundary on both sides of the river is generalized as the general head boundary. The water level of Liuan River is stable, so it is generalized into the boundary of fixed water level. A diving model to determine the leakage recharge was established according to the hydrogeological conceptual model [19]
where kx is the horizontal permeability coefficient (m/d); ky is the vertical permeability coefficient (m/d); h and h1 respresent the shallow groundwater level and the confined aquifer level (m), respectively; m is the thickness of the weakly permeable layer (m); W is the unit volume flow, which is used to represent the amount of water flowing into the source or out of the sink (m3); S is the gravity feed water; H0 is the initial groundwater level (m); H1 is the groundwater level at the boundary of the simulated period (m); T is the time (d); D is the simulated range; and Γ1 is the Dirichlet function.
The research area is relatively small, so the water level in the groundwater observation hole on 1 July 2020 is set as the initial groundwater level. In the model, the Liuan River is defined as the river boundary. According to the topography, the groundwater depth, and the rainfall characteristics of Linquan County, the rainfall infiltration coefficient in this simulation is calculated using the following formula:
where is the rainfall infiltration amount (m3/a), is the rainfall (mm), and is the rainfall infiltration recharge coefficient. In the study area, the value is 0.22, with being the study area (km2). The rainfall infiltration data are collected monthly. See Table 1 for rainfall.
The groundwater depth in the study area is approximately 3.5 m, and the evaporation is high. This can be calculated as follows:
where is the evaporation intensity of the shallow groundwater (mm/d); is the river surface evaporation intensity (mm/d); is the shallow groundwater level buried deep (m); is the shallow groundwater evaporation limit according to depth (m).
The evaporation in the study area is affected considerably according to the season, so the evaporation is assessed quarterly. See Table 2 for the evaporation.
Visual MODFLOW software was used to divide the study area in Linquan County into 10,000 cells (100 rows × 100 columns). Each cell was 480 m long and 270 m wide and covered an area of 0.13 km2 based on observations of the groundwater level in Linquan County. The water level of the Zhangying monitoring well at the Linquan County National Monitoring Station recorded from 1 July 2019 to 30 June 2020 was used for model verification. The initial operation date of the model is 1 July 2019, and the operation ended on 30 June 2020.
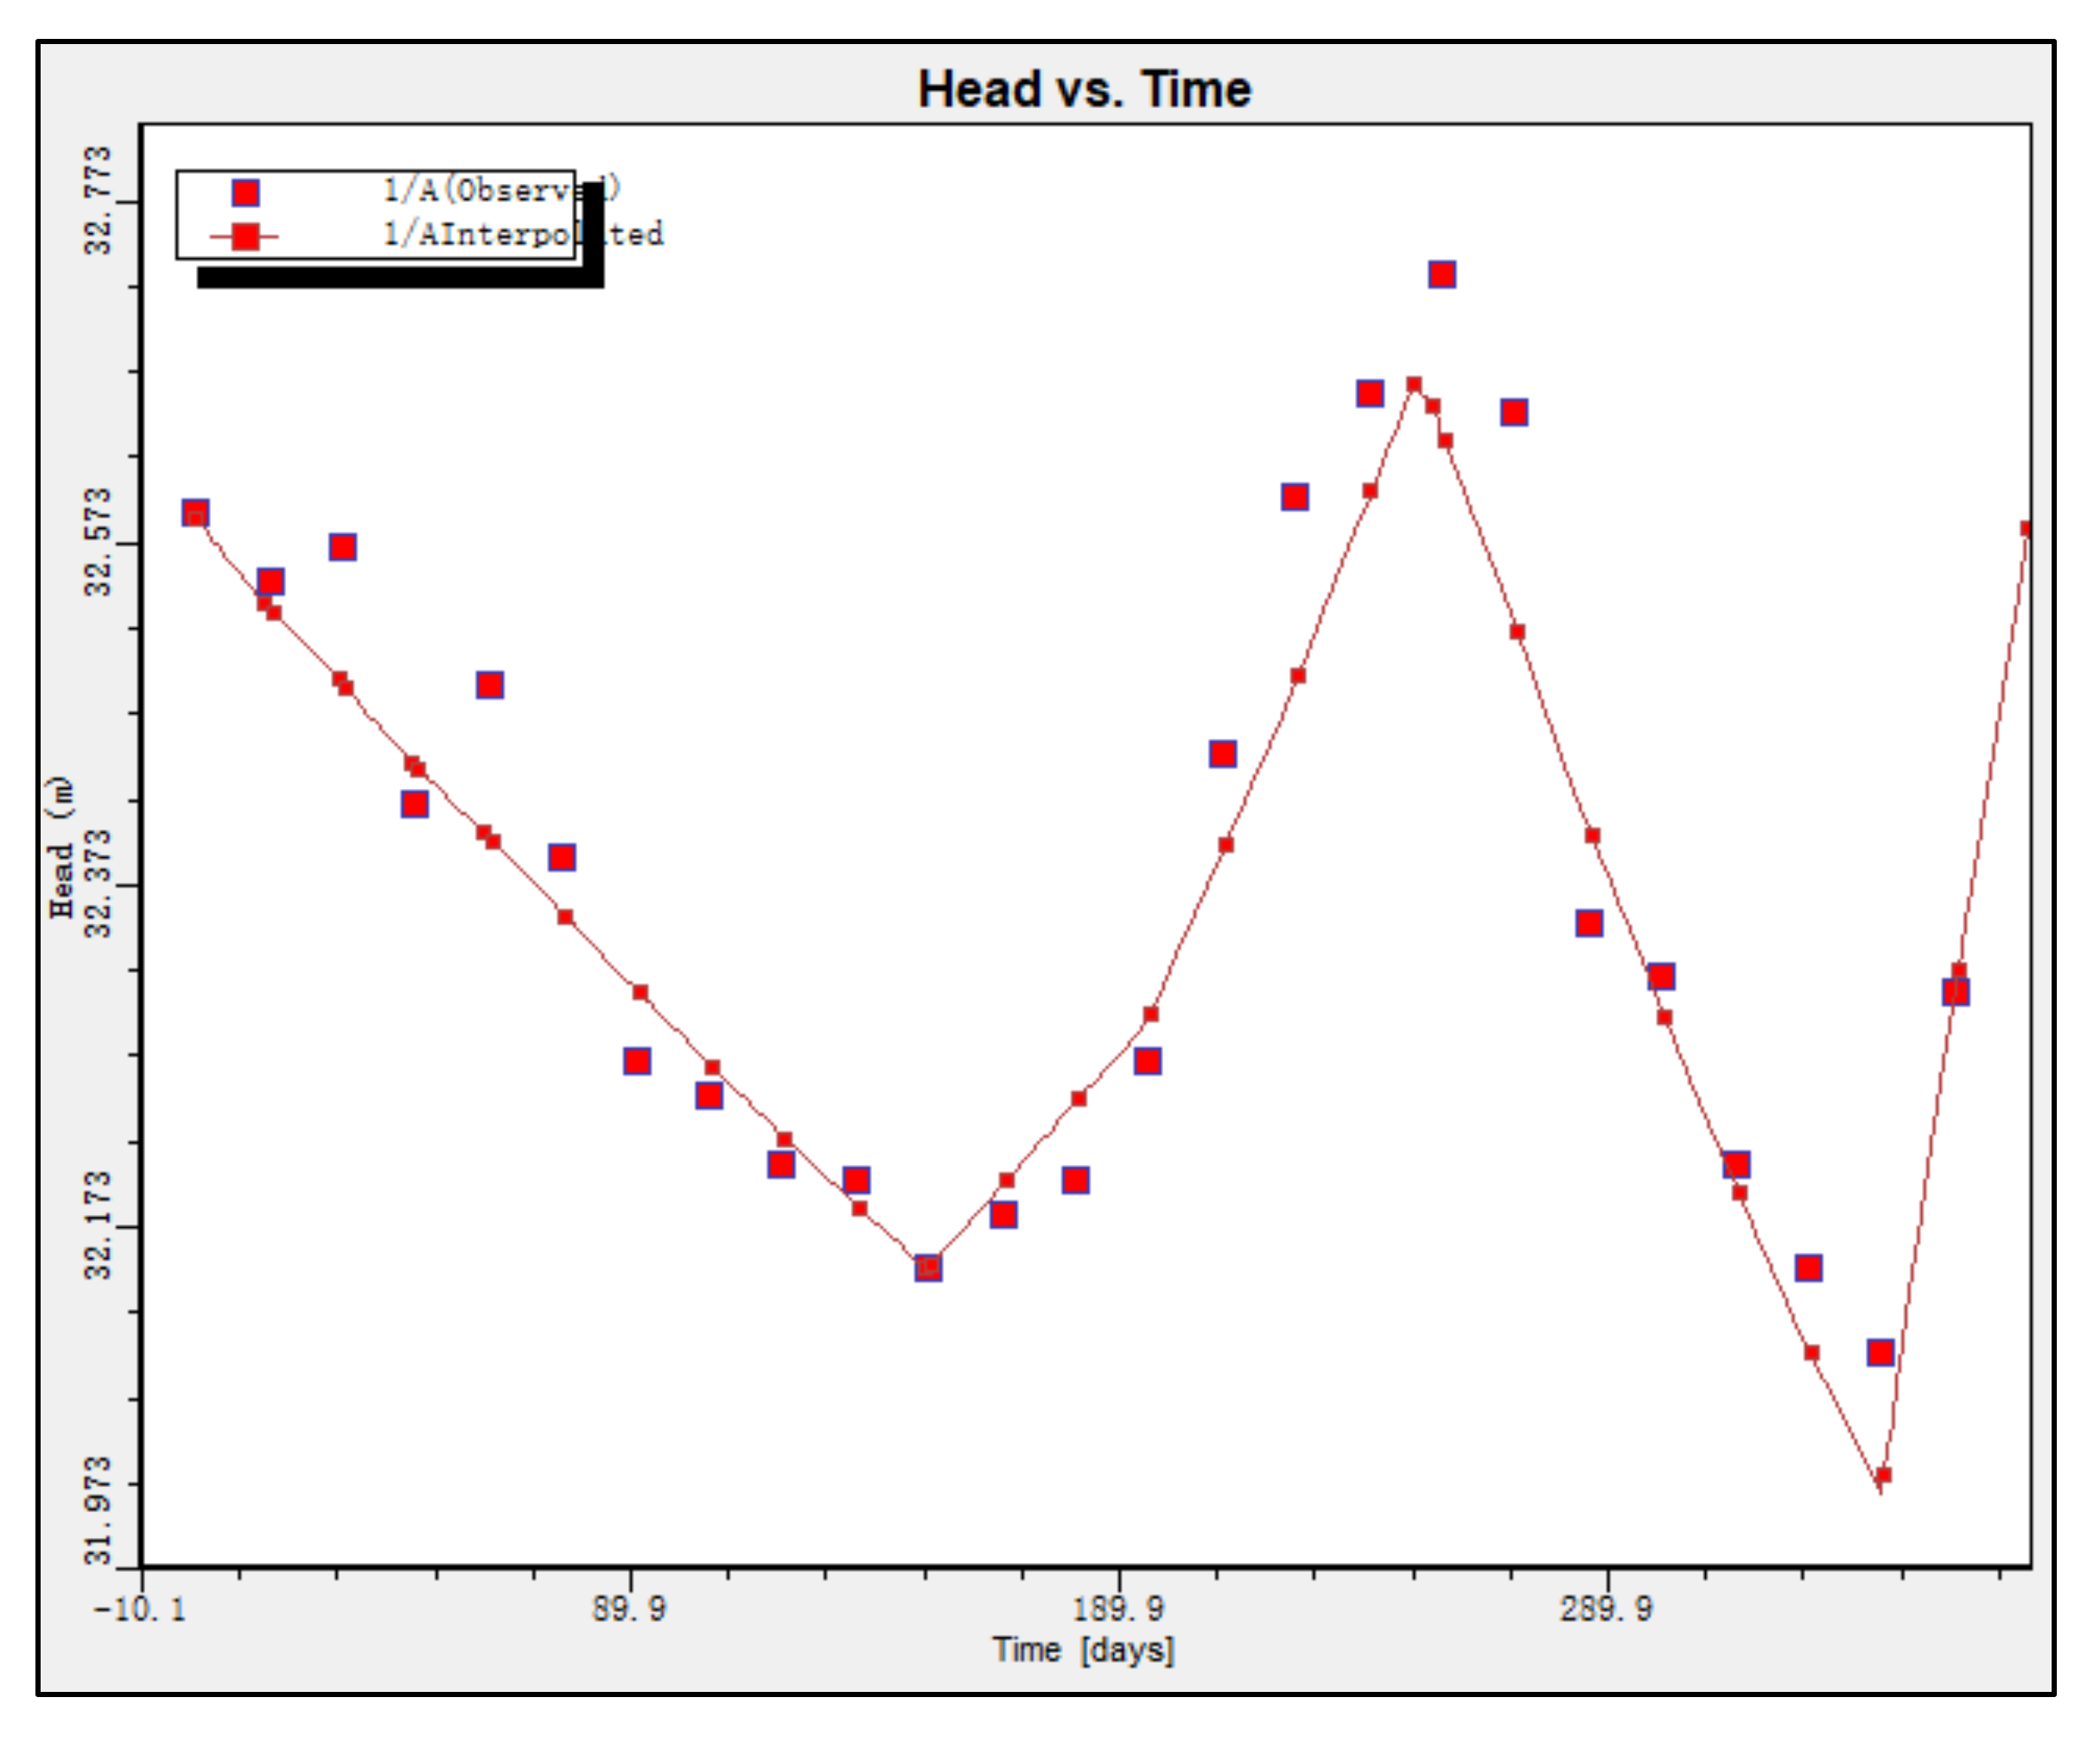
Based on research data in the study area, the trial estimation correction method was used to adjust the existing parameters, which is one of the indirect methods used to reverse the parameters [20]. The water level error was more than 70% within a range of 0.5 m (Figure 6). The simulated water level matched the water level at the monitoring point. This indicates that the mathematical model established is correct, can accurately represent the hydrogeological conditions of the study area, and can be used to simulate the effect of pumping on the river flow.
3.2. Parameter Sensitivity Analysis
Parameter sensitivity analysis is used to increase or decrease the variable x according to a specific proportion observing the degree of change of function f(x). The calculation formula is as follows:
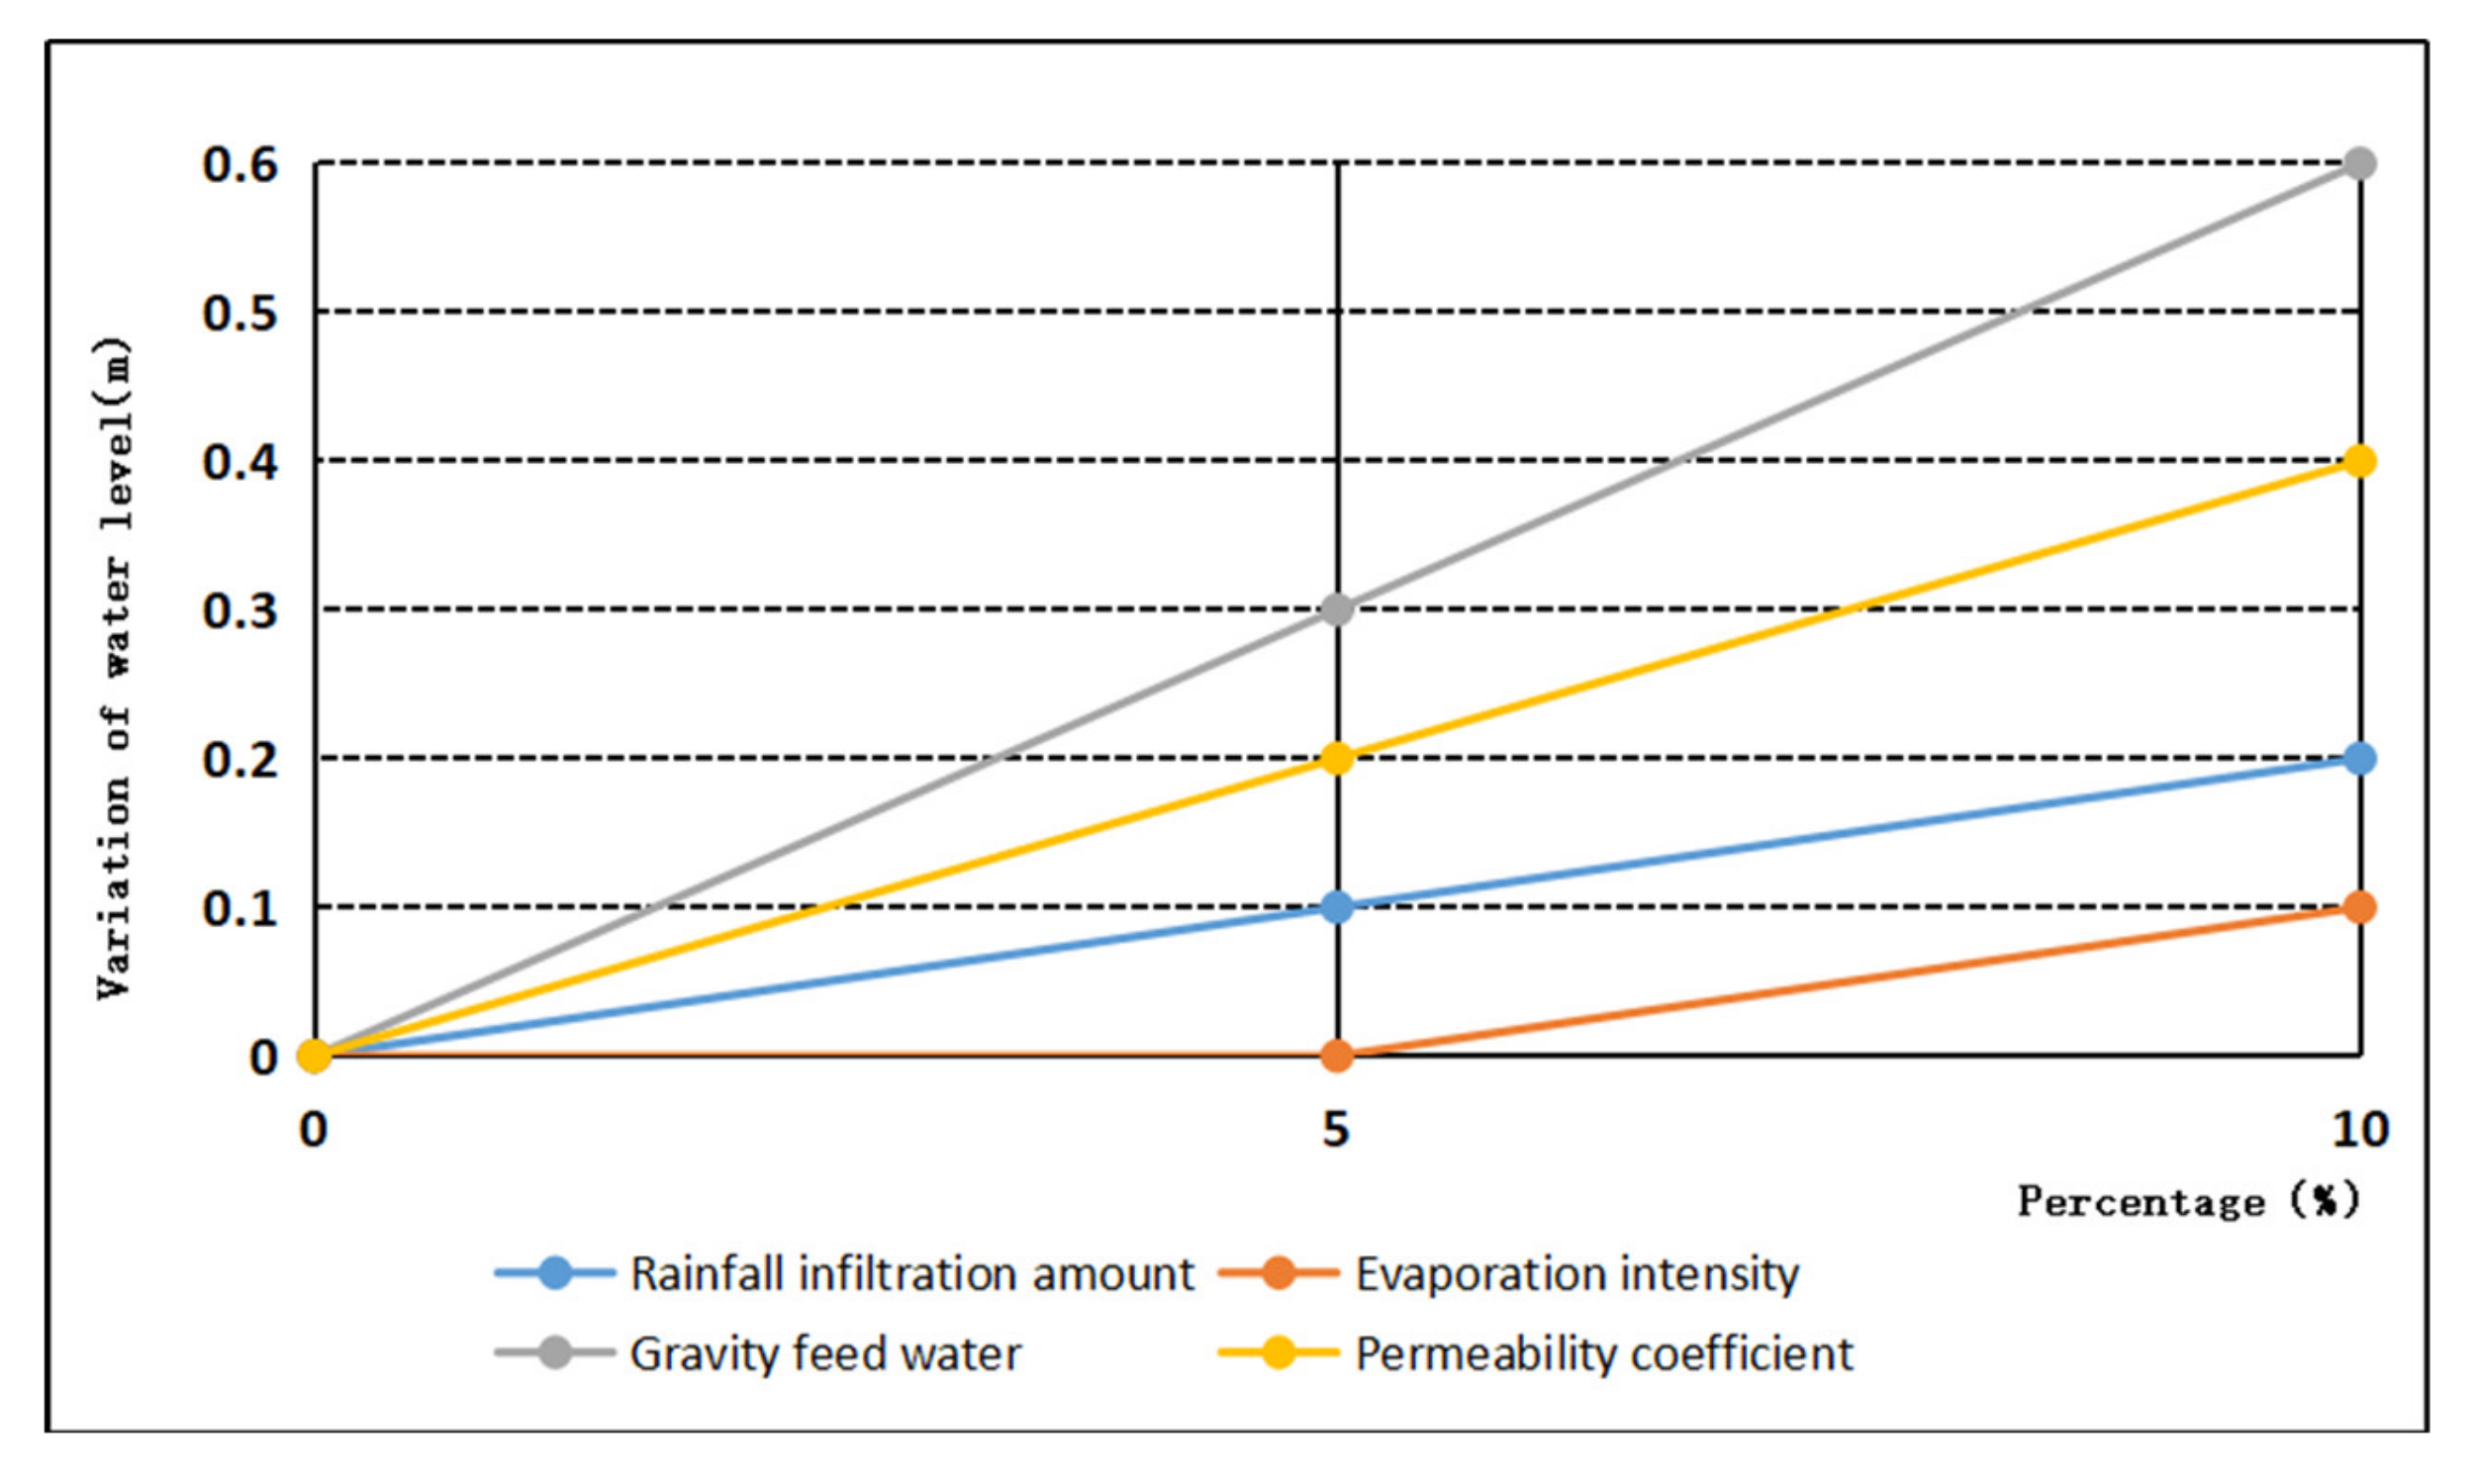
where x is the design variable, is the sensitivity of function to variable x. The larger the value, the more sensitive the variable x is. Sensitivity analysis was carried out on the four parameters of the permeability coefficient, gravity feed water, rainfall infiltration amount, and the evaporation intensity in the numerical model. The parameters selected are increased by 5% and 10%, and the range of variation in the water level after operation of the observation model is shown in Figure 7.
The gravity feed water and permeability coefficient of the aquifer have a pronounced impact on the groundwater level, while the effects of evaporation and rainfall infiltration are relatively small (Figure 7). This is consistent with the groundwater in the study area mainly being recharged by the lateral runoff of the river.
After establishing and verifying a numerical model for Linquan County, the hydrogeological parameters were obtained. The model was then refined to establish a numerical model for the riverside source field of the Liuan River.
Results show that the current water supply demand near the riverside source field of the Liuan River is approximately 25,000 m3/d. Based on the calculation of the exploitable groundwater reserves in Linquan County and the results of the model operation [21], the riverside source field of the Liuan River met the local water demand for Linquan County under normal conditions.
3.3. Adjustment Method and Control Conditions
The balance of water resource supply and demand must be adjusted every ten days during typical irrigation years. Based on the current situation and the water inflow and water consumption projected for 2020, water regulation calculations were synchronously carried out for the Xiaqiao to Chengxi sluices. The water level of the Liuan River was analyzed by calculating the water level of the Chengxi sluices [22].
Based on the water balance principle, the following calculation was used:
where Vi < VDead, Vi = VDead, and Vi and Vi−1 represent the water volume stored in the regulation reservoir at the end of the ith and i−1th months, respectively; WInterval is the interval inflow in the current month (without evaporation loss); WIrrigation is the irrigation water capacity in the current month; WDrainage is the discharge volume; V0 is the reservoir capacity corresponding to the initial water level; and VDead is the dead storage.
Vi = Vi−1 + WInterval − WIrrigation − WDrainage
The Liuan River is the main tributary of the Quanhe River. A rubber dam was built upstream of the Liuan River Bridge to increase the storage level of the main river channel of the Liuan River and to hold the surface water in the Liuan River from the Huangling to the Chengxi sluices. Here, the normal storage level was 34.50 m, and the elevation of the riverbed was 28.50 m.
When the water storage capacity at the west gate is less than the corresponding dead storage capacity of 3.5 million m3, there is no water in the river channel.
3.4. Analysis of the Incoming Flow
The incoming flow is computed as the sum of water flow from the upper section and the interval inflow. In the upper section, the water flow is from the agricultural irrigation water in the upper section of the Huangling sluice. Given that there is little water during drought years and the irrigation is exhausted, the amount of water coming from the upper section is zero in the absence of measured data from the hydrology station.
The interval inflow can be calculated by subtracting the water storage and water consumption from the precipitation yield
where P is the monthly precipitation, α is the monthly runoff coefficient, and F is the interval water production area. The monthly runoff coefficients of the intervals are shown in Table 3.
QInterval = P × α × F
3.5. Calculation Method of Minimum Ecological Water Demand
At present, the most sensitive problem in arid and semi-arid areas is the ecological water use of rivers. In addition, the contradiction between industrial and agricultural production water and ecological environment water is the largest. Due to the lag of ecological environment problems, it is necessary to pay attention to the impact of pumping on ecological environment water use in the process of taking water near the river.
The minimum ecological flow is the flow that maintains the basic morphology of the river bed, prevents the flow interruption, maintains the self-purification ability of the water body and avoids irreversible damage to the water organisms in the river [23]. The calculation of ecological water demand of Liuan River mainly considers evaporation and leakage in the river channel [24]. At present, there are several methods to calculate the minimum ecological flow: Tennant method, aquatic biological base flow method, RVA method, wetted perimeter method, 7Q10 method. At present, there are some disputes about these calculation methods. The Tennant method and the 7Q10 method are widely used in the Huaihe River Basin. Therefore, the 7Q10 method is used to calculate the ecological flow in the calculation process of this section [25].
In this paper, the statistical data of Yangqiao hydrological station in Liuan River were selected to collect the flow data of Liuanhe River from 1970 to 2021, 90% typical dry years were selected, and the ecological flow was calculated by using the 7Q10 method [26]. This method is based on hydrological parameters. The average water volume in the driest month for seven consecutive days with a 90% guarantee rate is used as the minimum ecological flow of the river, and then the minimum ecological water demand in a single day is calculated.See Table 4 for the minimum ecological water demand of Liuan River.
4. Results
The current situation for the urban and rural water supply in Linquan County depends on the groundwater at medium and low depths. A large area of overexploitation has formed in the confined aquifer at a depth of 50 m. In 2015, the area of restricted groundwater exploitation centered on the county was 415.6 km2. Based on current data, the shallow groundwater exploitation volume in Fuyang City is 571 million m3/a, which accounts for 34.2% of the shallow groundwater resources. The average shallow groundwater exploitation volume in Fuyang City is 990 million m3/a, and the recoverable modulus is 102,000 m3/(km2 × a).
The groundwater exploitation volume in Linquan County is approximately 78,000 m3/d. Because of the condition of the water resources in the region and the influence of policies, the exploitation of pore-confined water is currently restricted and further development and use should not be considered. Based on the water supply plans of Linquan County, the water shortage will be 127,400 m3/a in 2025. Based on the urban water supply plans of the county, the current water supply scale is 100,000 m3/a and water shortages will reach 25,000 m3/d in 2025 before the completion of the “Divert water from the Yangtze River to the Huaihe River” project. The construction of the riverside source field of the Liuan River will solve problems with respect to land subsidence in the Fuyang area as well as insufficient water supplies in the city.
Therefore, future water supply demand from the city can be met by the construction of the riverside source fields along the Liuan River.
4.1. Water Supply and Water Balance in Different Years
- (1)
- Water supply analysis in 95% typical dry years
Based on the flood regulation calculation, the water quantity in the Liuan River is insufficient for 4 months in 95% typical dry years given that the river becomes dry. The Liuan River riverside source field was simulated numerically.
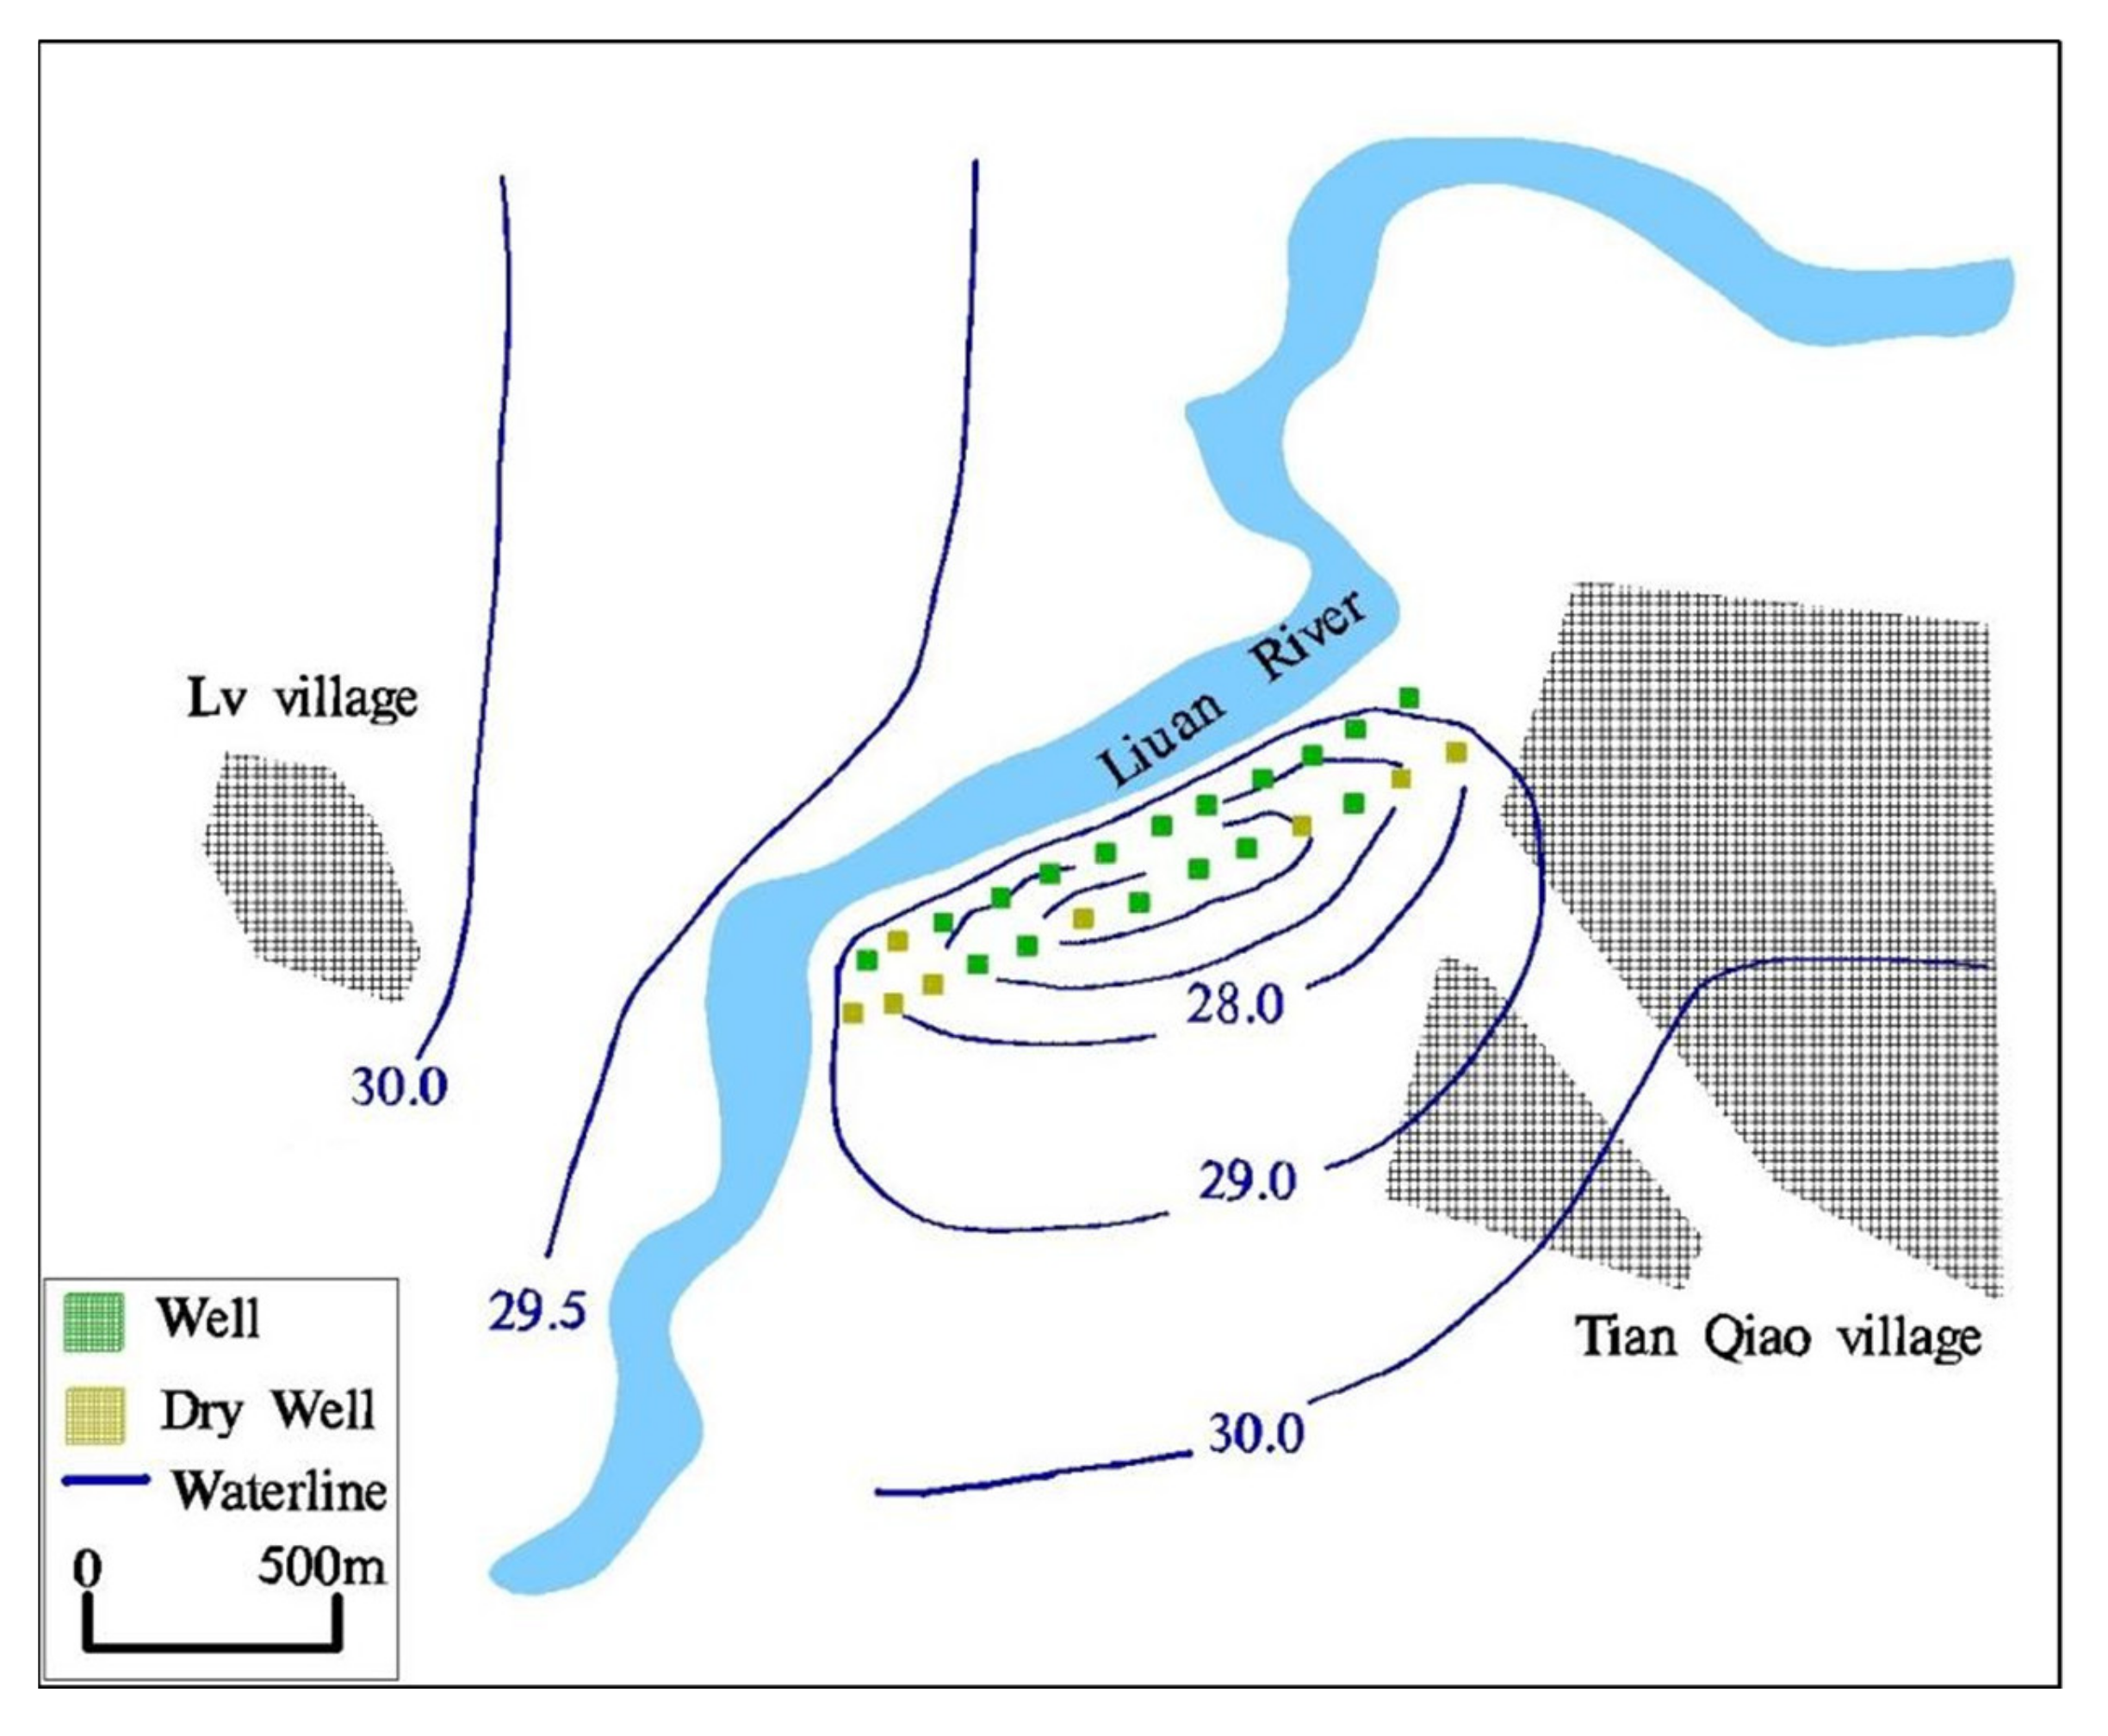
Based on the local hydrogeological conditions and the degree of water richness in the aquifer, the water yield per well was set in the model to be 1000 m3/d. The results of the model operation show that the wells begin to dry up on the tenth day of model operation and that the water level stabilizes after 32 days in 95% typical dry years. Eight wells were dry and the remaining wells can maintain a stable water supply of approximately 16,000 m3/d. The change in the groundwater level is shown in Figure 8 and Figure 9.
To determine the flow direction of the groundwater under the pumping conditions of a 95% typical dry year, the particle-tracking module of the Visual MODFLOW software was used to set the particles in the Liuan River. The model run was performed to observe the particle movement. The movement track section is illustrated in Figure 10.
Results indicate that the groundwater level was stable for 32 days. The profile shows that the river continuously supplies water to the pumping wells, whereas the water supply from the side (other than the riverside source field) was insufficient. This led to the pumping wells drying up because of the river’s lateral runoff supply to ensure the normal water supply of some of the pumping wells.
To determine changes in the groundwater quantity during the model operation, the ZBud module of the Visual MODFLOW software was used. The water balance data [27] are shown in Table 5.
The data in Table 5 show that the pumping well can supply 16,000 m3 of water when the water level stabilizes on day 32 of the model operation. Based on the analysis of the amount of water (Table 5), the water supplied by the pumping well primarily originates from the infiltration of the river, which is a typical riverside source field. The river water directly infiltrates into the pumping well. Most of the water flows underground and then through the underground pumping wells. This process is predominantly related to the hydrogeological conditions of the study area. The Liuan River is between the sub-clay layer and the aquifer on the surface. Therefore, the river water mainly replenishes the groundwater through infiltration to ensure a normal water supply in the wells. Water exchange occurs between the groundwater and the river water on the first day under drought conditions. During the pumping process, the groundwater storage gradually decreases. After the water volume stabilizes, the water supply is maintained by the infiltration of the river.
- (2)
- Water supply analysis of 75% typical dry years
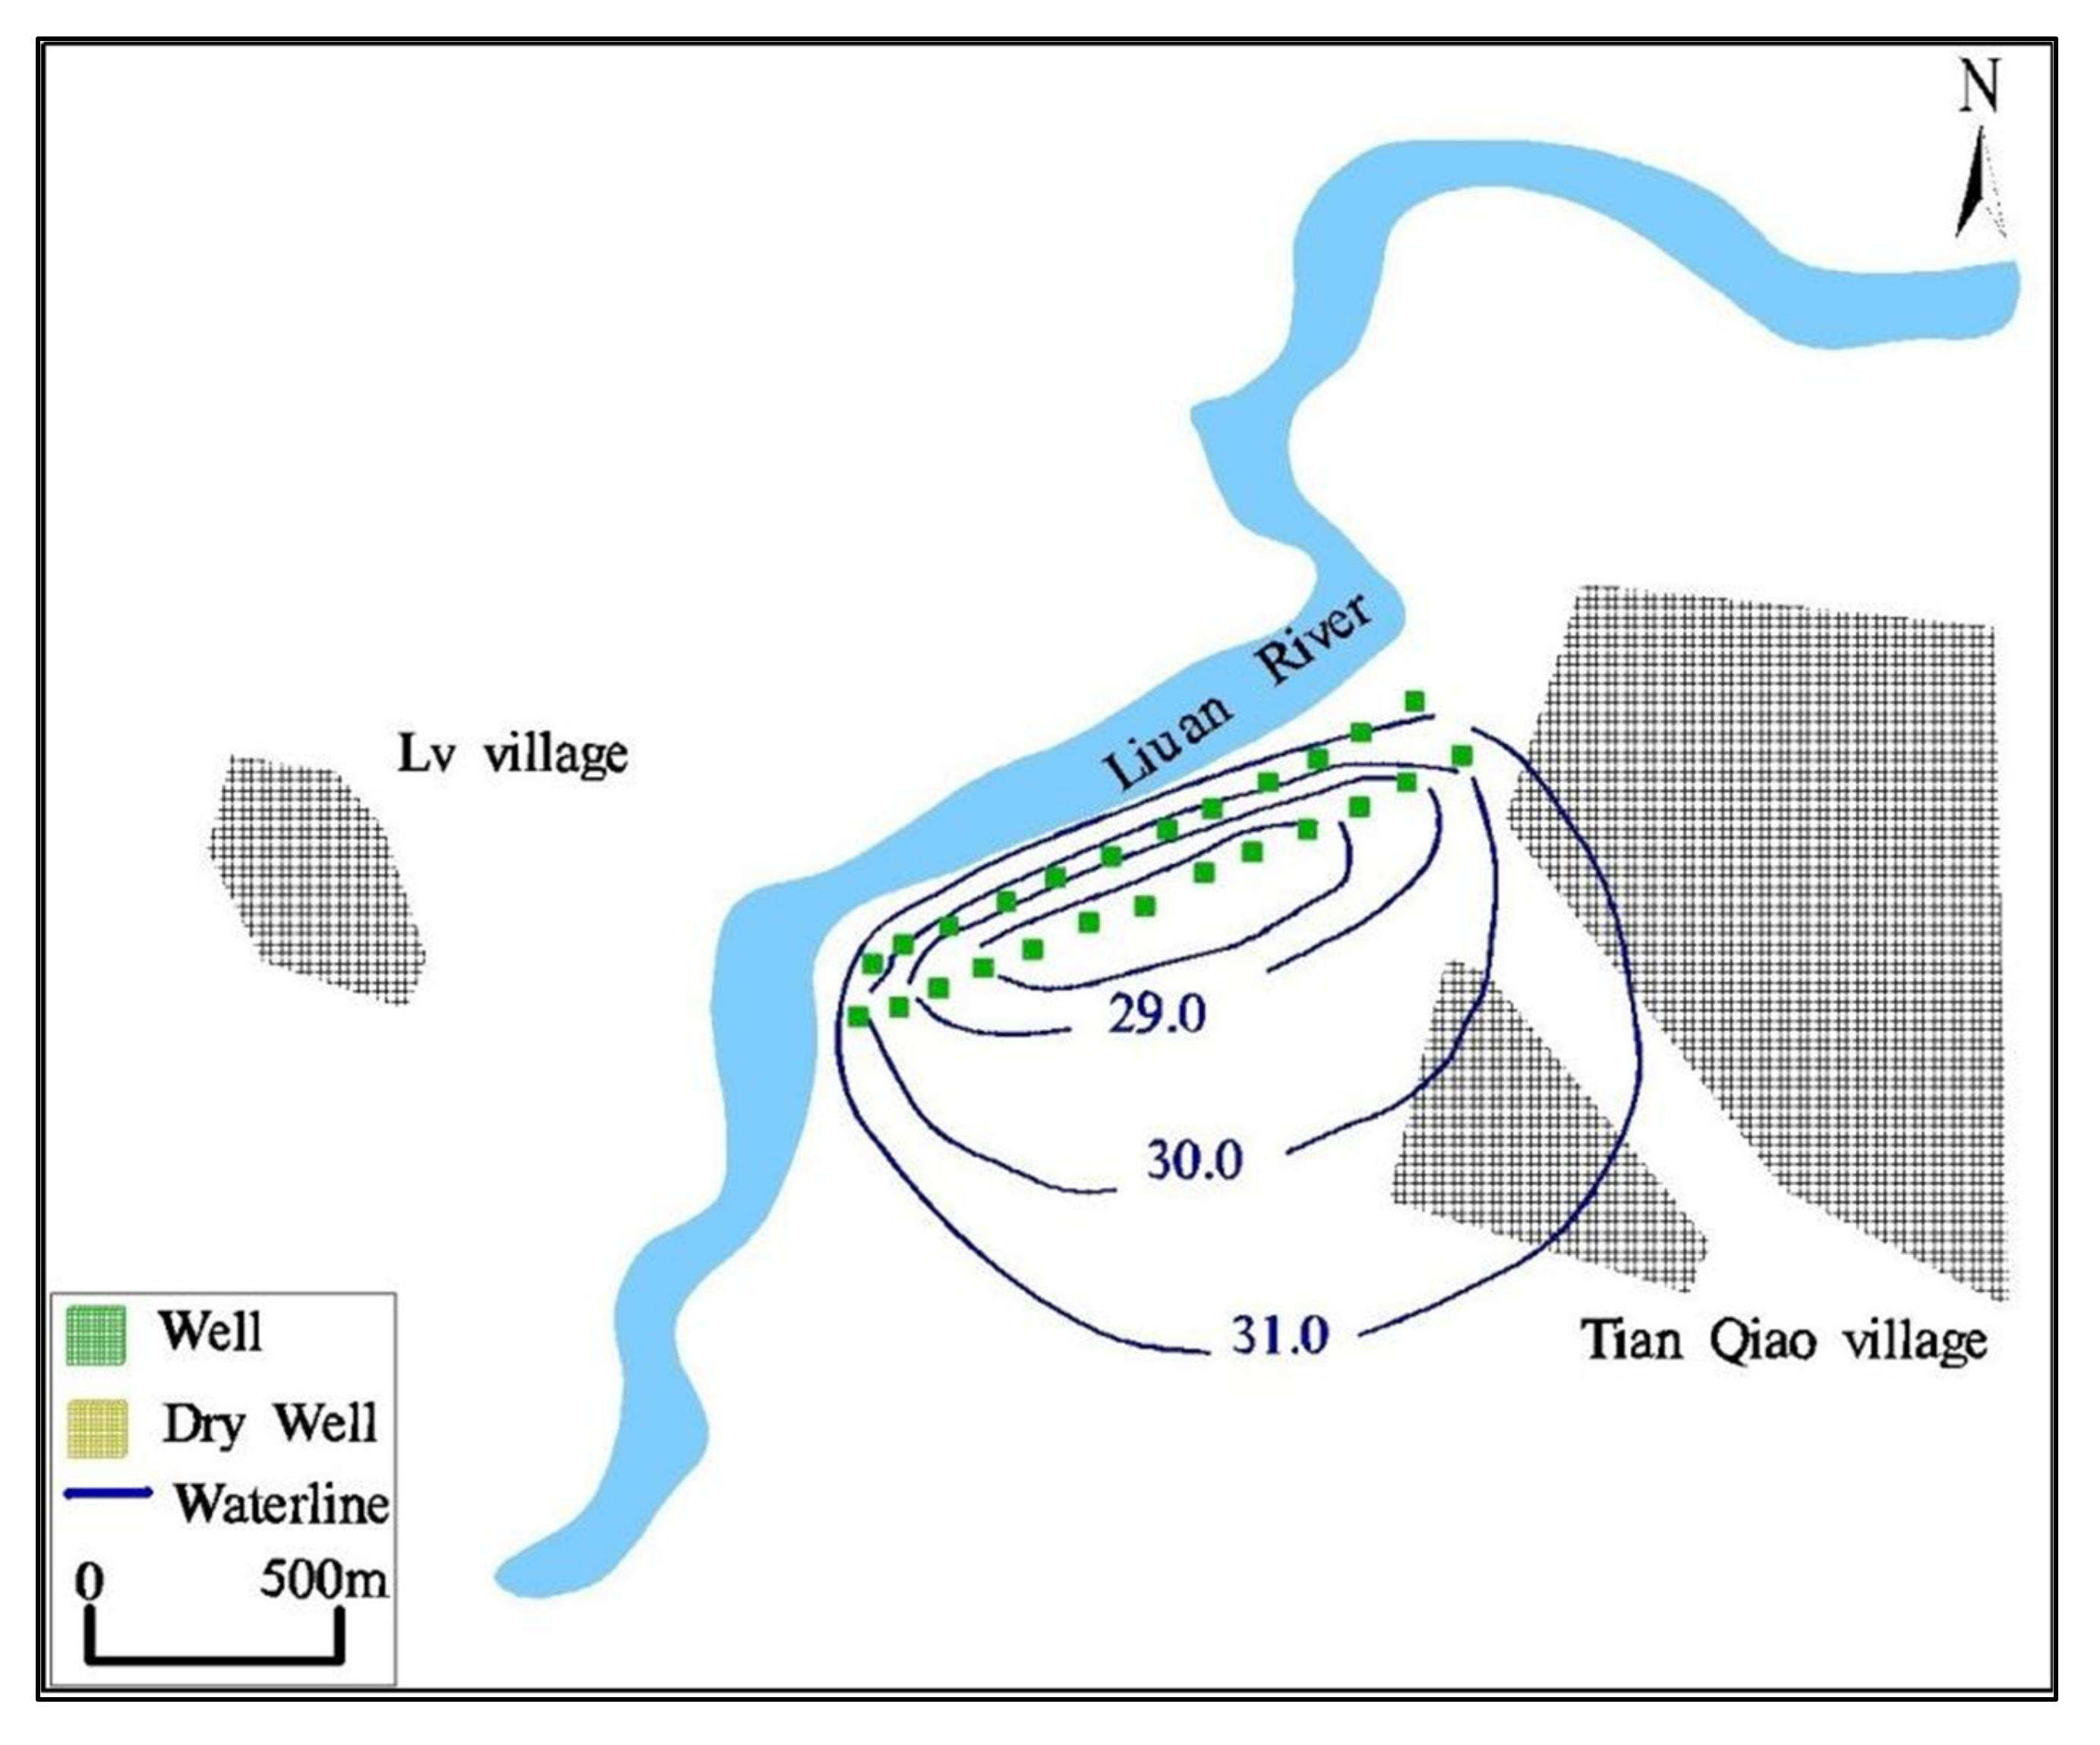
Based on the flood regulation calculation, the Liuanhe River can guarantee sufficient water throughout the year, with a 75% guarantee rate. A simulation was carried out for the riverside source field of the Liuanhe River for years with a 75% guarantee rate. The results are shown in Figure 11.
Based on the precipitation analysis for years with a 75% guarantee rate, the month with the least rainfall was selected for the model prediction. After 60 days, the water level stabilized and the pumping well did not dry up; therefore, it met the water demand.
The model was analyzed using the ZBud module. The results were compared with the river leakage in years with a 95% guarantee rate, as shown in Table 6.
The water balance data for 75% typical dry years show that the water supplied to the pumping wells originates from river infiltration.
Based on comparison with typical dry years, 75% typical dry years met the local water supply requirements. In 95% typical dry years, the water level stabilizes within 32 days and 65% of the water supply scale could be met. In extremely dry years, reduction in the irrigation water based on the actual situation can ensure a basic water supply for residents.
4.2. Groundwater Level Change
According to the results from different typical dry year models, the central water level of the pumping wells decreases by the same amplitude, except the water level changes considerably during the early days of exploitation. After 10 days, the water level decreases slowly, and after 40 days, the water level remains unchanged, as shown in Table 7. Therefore, the stability of the regional groundwater level can be ensured by using the capacity of aquifer regulation and replenishing the shortage with abundance.
4.3. Effects of Ecological Water Demand
Given that the tributary being studied is part of the Huaihe River system, people pay attention to the ecological problems and the effect of ecological flow has become an important part of water resource management in the region. The time series runoff data of the river is limited.
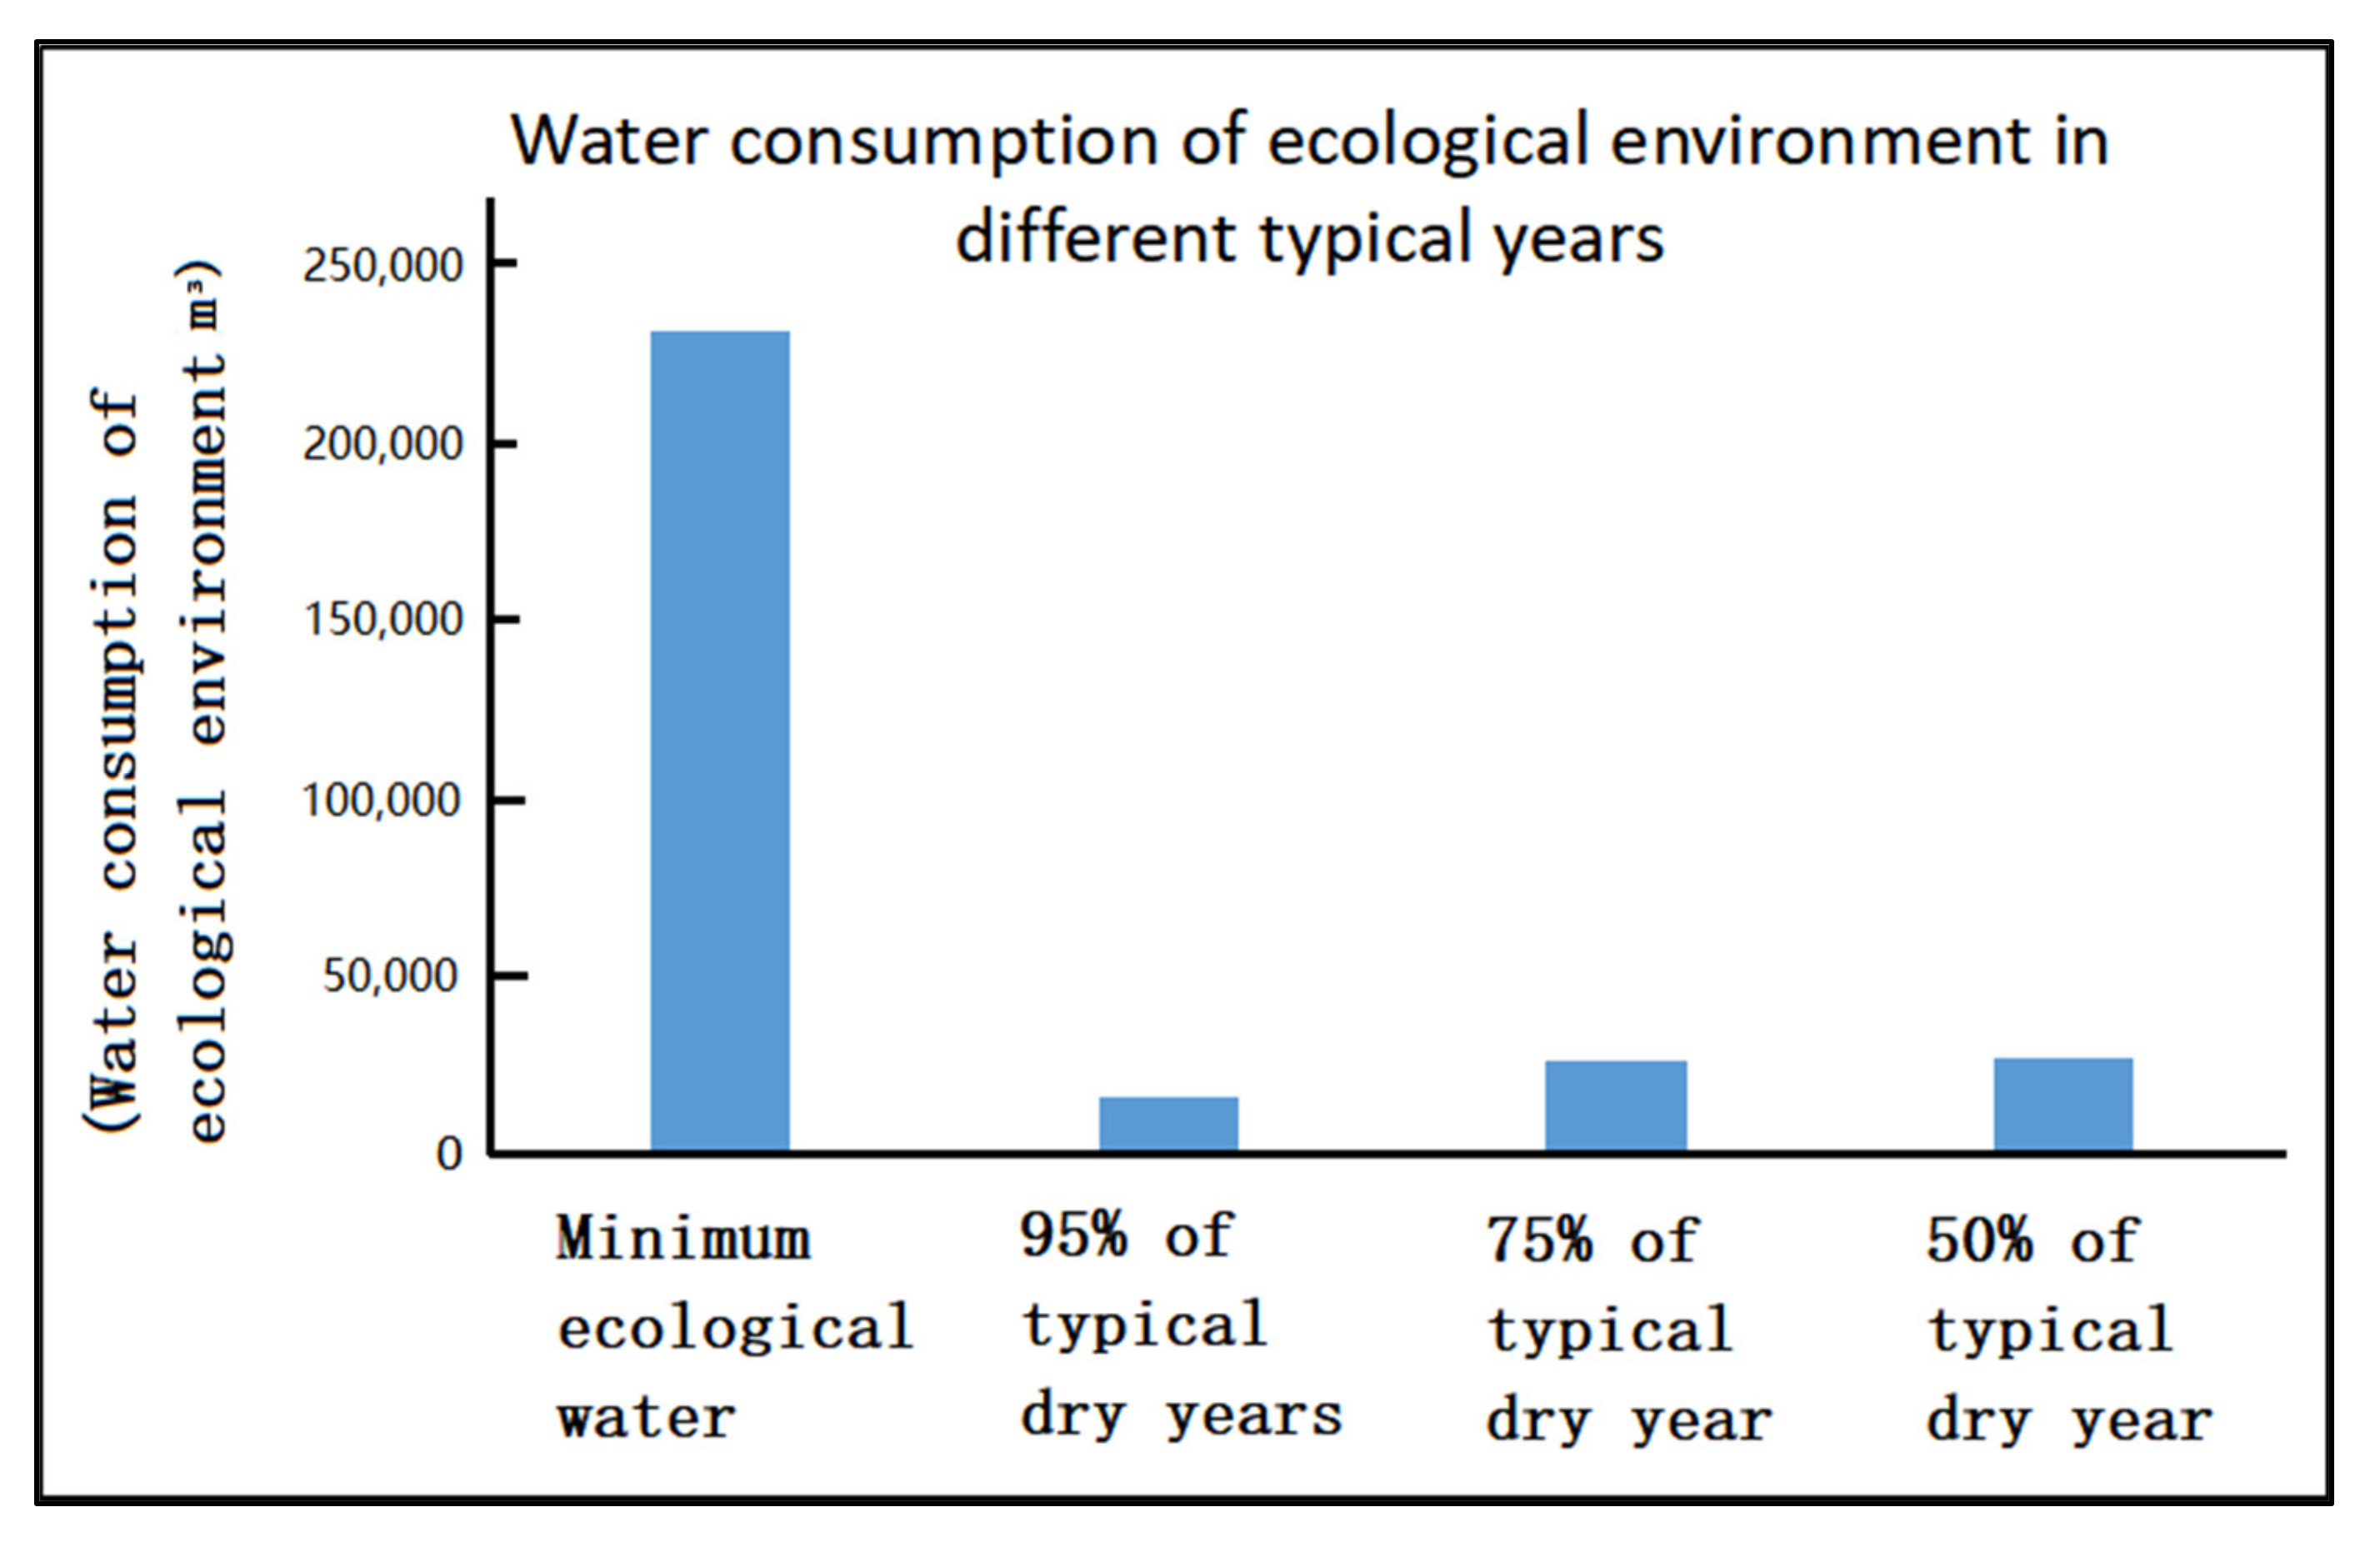
Therefore, the ecological flow is calculated by calculating a different guaranteed arid reliability year exchange capacity for the groundwater accounts for the proportion of ecological flow, mining the impact on the ecological flow analysis alongside the river source. The effects of the water intake on the ecological flow were analyzed by calculating the proportion of the groundwater exchange capacity to the ecological flow in years with different drought guarantee rates. The proportion of the daily maximum water exchange to the minimum ecological water consumption in years with different guaranteed rates was small. The 95%, 75%, and 50% typical dry years accounted for 6.73%, 11.20%, and 11.45% of the minimum ecological water consumption, respectively, as shown in Figure 12.
4.4. Summary of Results
In this study, the water supply of the water source area near the Liuan River in different typical dry years was analyzed under different drought conditions. A numerical model was used to simulate and predict the groundwater under various drought conditions. In 95% typical dry years, the water supply can reach 16,000 m3/d. In 75% and 50% typical dry years, the water supply can reach 25,000 m3/d. The results simulated indicate that local water supply plans can be met, except for in particularly dry years. The groundwater level changes and the effect on the ecological flow in the riverside source field in extreme drought years were simulated. Based on the results, the following conclusions can be drawn:
- (1)
- Based on the hydrogeological conditions in the study area, the water source mainly comes from underground river infiltration, which can attain more than 80% of the water supply, and the other water sources originate from lateral infiltration of the river. The water seeps into the aquifer and then into the pumping wells.
- (2)
- The water supply from small rivers is insufficient during 95% typical dry years. In other years, it meets the mining plans. Therefore, the water supply guarantee must be considered when small rivers are used to establish riverside source fields, especially in dry years.
- (3)
- Because of the lack of long-term hydrological data for small rivers, the improved 7Q10 method was used to calculate the ecological flow during different dry years. The findings of the study reveal that mining water has little effect on the ecological flow.
5. Discussion
5.1. Baseline Analysis
Based on analysis of the conditions in Linquan county, deep groundwater overexploitation significantly affects the local ecological environment. Therefore, based on the establishment of riverside source fields, sustainable development of industrial policies in the Linquan county can be implemented and excessive development and use of deep level groundwater can be effectively reduced.
5.2. Small River Riverside Water Sources
Based on research and analysis of the riverside source fields of the Liuan River, this paper puts forward the following suggestions, namely to establish a riverside source area for the Liuan River, replace the task of water supply with small rural drinking water plants in the region, and gradually close the rural self-provided water source wells. Unified water supply and distribution can effectively guarantee the safety of drinking water for rural residents and the scale of irrigation, which is not only conducive to the management of water conservancy departments, but also can increase economic benefits. Compared with large rivers, it is more important to pay attention to the influence of pumping on river runoff and whether the change in the groundwater level is within the red line of water resource management in the process of mining the riverside water sources of small rivers.
6. Conclusions
Liuan River, as a tributary of the Huaihe River, has obvious hydrological and ecological significance. Under the condition of the basic completion of the water diversion project from the Yangtze River to the Huaihe River, the supply of water resources in Linquan county cannot reach the balance between supply and demand, which is a blank point under the condition of inter-basin water transfer. Its research is representative and typical, and it is reasonable to take Liuan River Basin as a research representative.
Small rivers used to establish riverside source fields can not only alleviate the problem of regional water resource shortages, but also optimize the regional water supply through the allocation of multiple water sources. Through the study on the exploitation scheme of the riverside source field of the Liuan River, it can be found that the water source mainly comes from river infiltration underground, which can attain more than 80% of the water supply. In 95% typical dry years, the Liuan River cannot meet the water supply task. Therefore, it is necessary to adjust the water supply strategy in the regional water supply to ensure the assurance rate of water supply under special drought conditions.
The impact on the ecological flow is small in the process of pumping water from the riverside source field of the Liuan River. However, unlike large rivers, water abstraction from small rivers requires a strong focus on the impact of pumping on the river water level. If the river water level is lower than the ecological water level, it will have an irreversible impact on the small river basin. Therefore, in the process of mining small rivers, we need to ensure that they can not only meet the needs of production and domestic water, but also protect the ecological environment.
With the promulgation and implementation of groundwater management regulations, the sustainable use of water resources in small river basins is vital to maintaining normal supplies of regional water resources, and the use and protection of water resources in small river basins require more strategic development strategies.
Author Contributions
Writing—original draft preparation, Z.H., B.K. and L.Q.; writing—review and editing, Z.H., B.K.; supervision, Y.T. All authors have read and agreed to the published version of the manuscript.
Funding
This research is financially supported by the National Natural Science Foundation of China (Grant No. 42107162), the Natural Science Foundation of Anhui Province (Grant No. 1908085QD168), The Fundamental Research Funds for the Central Universities of China (Grant Number: PA2021 KCPY0055)and Key R&D Plan of Anhui Province (No. 202104g01020010).
Data Availability Statement
The data presented in this study are available on request from the corresponding author.
Conflicts of Interest
The authors declare no conflict of interest. The funders had no role in the design of the study; in the collection, analyses, or interpretation of data; in the writing of the manuscript, or in the decision to publish the results.
References
- Sathya, N.; Muralidhara, P. Groundwater development in fragile water resource ecosystems in arid or semi-arid areas in northwest Indian Himalayas: Implication for sustainable development. J. Geosci. Res. Northeast. Asia 1998, 1, 50–51. [Google Scholar] [CrossRef]
- Han, Z. Groundwater for urban water supplies in northern China—An overview. Hydrogeol. J. 1998, 6, 416–420. [Google Scholar]
- Ministry of Water Resources of the People’s Republic of China. Opinions on Strengthening the Management of Water Resources in Groundwater Overexploited Areas; Ministry of Water Resources of the People’s Republic of China: Beijing, China, 2003.
- Uddameri, V.; Kakarlapudi, C.; Hernandez, E.A. A GIS enabled nested simulation-optimization model for routing groundwater to overcome spatio-temporal water supply and demand disconnects in South Texas. Environ. Earth Sci. 2014, 71, 2573–2587. [Google Scholar] [CrossRef]
- Yi, S.; Chi, B.; Wu, F.; Zhou, Y. Research on Numerical Simulation and Evaluation of Riverside Source Field—A Case Study of Liguanpu Riverside Source Field in Shenyang City. J. Nat. Resour. 2006, 21, 154–160. (In Chinese) [Google Scholar]
- Haque, M.A.M.; Jahan, C.S.; Mazumder, Q.H.; Nawaz, S.M.S.; Mirdha, G.C.; Mamud, P.; Adham, M.I. Hydrogeological condition and assessment of groundwater resource using visual modflow modeling, Rajshahi city aquifer, Bangladesh. J. Geol. Soc. India 2012, 79, 77–84. [Google Scholar] [CrossRef]
- Hancock, P.J. Human Impacts on the Stream-Groundwater Exchange Zone. Environ. Manag. 2002, 29, 763–781. [Google Scholar] [CrossRef] [PubMed]
- Zhu, Y.; Zhai, Y.; Du, Q.; Teng, Y.; Wang, J.; Yang, G.; Jinsheng, W. The impact of well drawdowns on the mixing process of river water and groundwater and water quality in a riverside well field, Northeast China. Hydrol. Process. 2018, 33, 945–961. [Google Scholar] [CrossRef]
- Wu, X.; Zheng, Y.; Wu, B.; Tian, Y.; Han, F.; Zheng, C. Optimizing conjunctive use of surface water and groundwater for irrigation to address human-nature water conflicts: A surrogate modeling approach. Agric. Water Manag. 2016, 163, 380–392. [Google Scholar] [CrossRef]
- Molina-Navarro, E.; Hallack-Alegría, M.; Martínez-Pérez, S.; Ramírez-Hernández, J.; Mungaray-Moctezuma, A.; Sastre-Merlín, A. Hydrological modeling and climate change impacts in an agricultural semiarid region. Case study: Guadalupe River basin, Mexico. Agric. Water Manag. 2016, 175, 29–42. [Google Scholar] [CrossRef]
- Lorenzo-Lacruz, J.; Vicente-Serrano, S.M.; López-Moreno, J.I.; Beguería, S. The impact of droughts and water management on various hydrological systems in the headwaters of the Tagus River (central Spain). J. Hydrol. 2010, 386, 13–26. [Google Scholar] [CrossRef] [Green Version]
- Ministry of Water Resources of the People’s Republic of China. The Letter of the Ministry of Water Resources on the Issuance of the First Batch of Key River and Lake Ecological Flow Guarantee Targets. China Water Resour. 2020, 15, 5–7. [Google Scholar]
- Lewandowski, J.; Lischeid, G.; Nuetzmann, G. Drivers of water level fluctuations and hydrological exchange between groundwater and surface water at the lowland River Spree (Germany): Field study and statistical analyses. Hydrol. Process 2010, 23, 2117–2128. [Google Scholar] [CrossRef]
- Alifujiang, Y.; Abuduwaili, J.; Ge, Y. Trend Analysis of Annual and Seasonal River Runoff by Using Innovative Trend Analysis with Significant Test. Water 2021, 13, 95. [Google Scholar] [CrossRef]
- Saenger, N.; Kitanidis, P.K.; Street, R.L. A numerical study of surface-subsurface exchange processes at a riffle-pool pair in the Lahn River, Germany. Water Resour. Res. 2005, 41. [Google Scholar] [CrossRef] [Green Version]
- Brunner, P.; Therrien, R.; Renard, P.; Simmons, C.T.; Franssen, H.J. Advances in understanding river-groundwater interactions. Rev. Geophys. 2017, 55, 818–854. [Google Scholar] [CrossRef]
- Liu, C.; Zhao, C.; Xia, J.; Sun, C.; Wang, R.; Liu, T. An instream ecological flow method for data-scarce regulated rivers. J. Hydrol. 2011, 398, 17–25. [Google Scholar] [CrossRef]
- Zhu, G.; Su, Y.; Feng, Q. The hydrochemical characteristics and evolution of groundwater and surface water in the Heihe River Basin, northwest China. Hydrogeol. J. 2008, 16, 167–182. [Google Scholar] [CrossRef]
- Zume, J.; Tarhule, A. Simulating the impacts of groundwater pumping on stream–Aquifer dynamics in semiarid northwestern Oklahoma, USA. Hydrogeol. J. 2008, 16, 797–810. [Google Scholar] [CrossRef]
- Karan, S.; Engesgaard, P.; Looms, M.C.; Laier, T.; Kazmierczak, J. Groundwater flow and mixing in a wetland—Stream system: Field study and numerical modeling. J. Hydrol. 2013, 488, 73–83. [Google Scholar] [CrossRef]
- Chung, I.M.; Lee, J.W.; Kim, N.W. Estimating Exploitable Groundwater Amount in Musimcheon Watershed by Using an Integrated Surface Water-Groundwater Model. Econom. Environ. Geology 2011, 44, 433–442. [Google Scholar] [CrossRef] [Green Version]
- Gao, Q.; Du, H.; Zu, R. The balance between supply and demand of water resources and the water-saving potential for agriculture in the hexi corridor. Chin. Geogr. Sci. 2002, 12, 23–29. [Google Scholar] [CrossRef]
- Yan, D.; Wang, G.; Wang, H.; Qin, T. Assessing ecological land use and water demand of river systems: A case study in Luanhe River, North China. Hydrol. Earth Syst. 2012, 16, 2469–2483. [Google Scholar] [CrossRef] [Green Version]
- Wan, F.; Zhang, F.; Zheng, X.; Xiao, L. Study on Ecological Water Demand and Ecological Water Supplement in Wuliangsuhai Lake. Water 2022, 14, 1262. [Google Scholar] [CrossRef]
- Gu, H. Analysis on key and difficult points of determination and guarantee of river lake ecological flow in Huaihe River Basin. China Water Resour. 2020, 15, 47–49. [Google Scholar]
- Li, H.; Qu, X.; Tao, J.; Hu, C.; Zuo, Q. The optimal allocation of water resources oriented to prioritizing ecological needs using multiple schemes in the Shaying River Basin (Henan Section), China. Water Supply 2022, 22, 1593–1610. [Google Scholar] [CrossRef]
- Istanbulluoglu, E.; Wang, T.; Wright, O.M.; Lenters, J.D. Interpretation of hydrologic trends from a water balance perspective: The role of groundwater storage in the Budyko hypothesis. Water Resour. Res. 2012, 48, 273–279. [Google Scholar] [CrossRef] [Green Version]
Figure 1.
Location map showing the Huaihe River Basin.

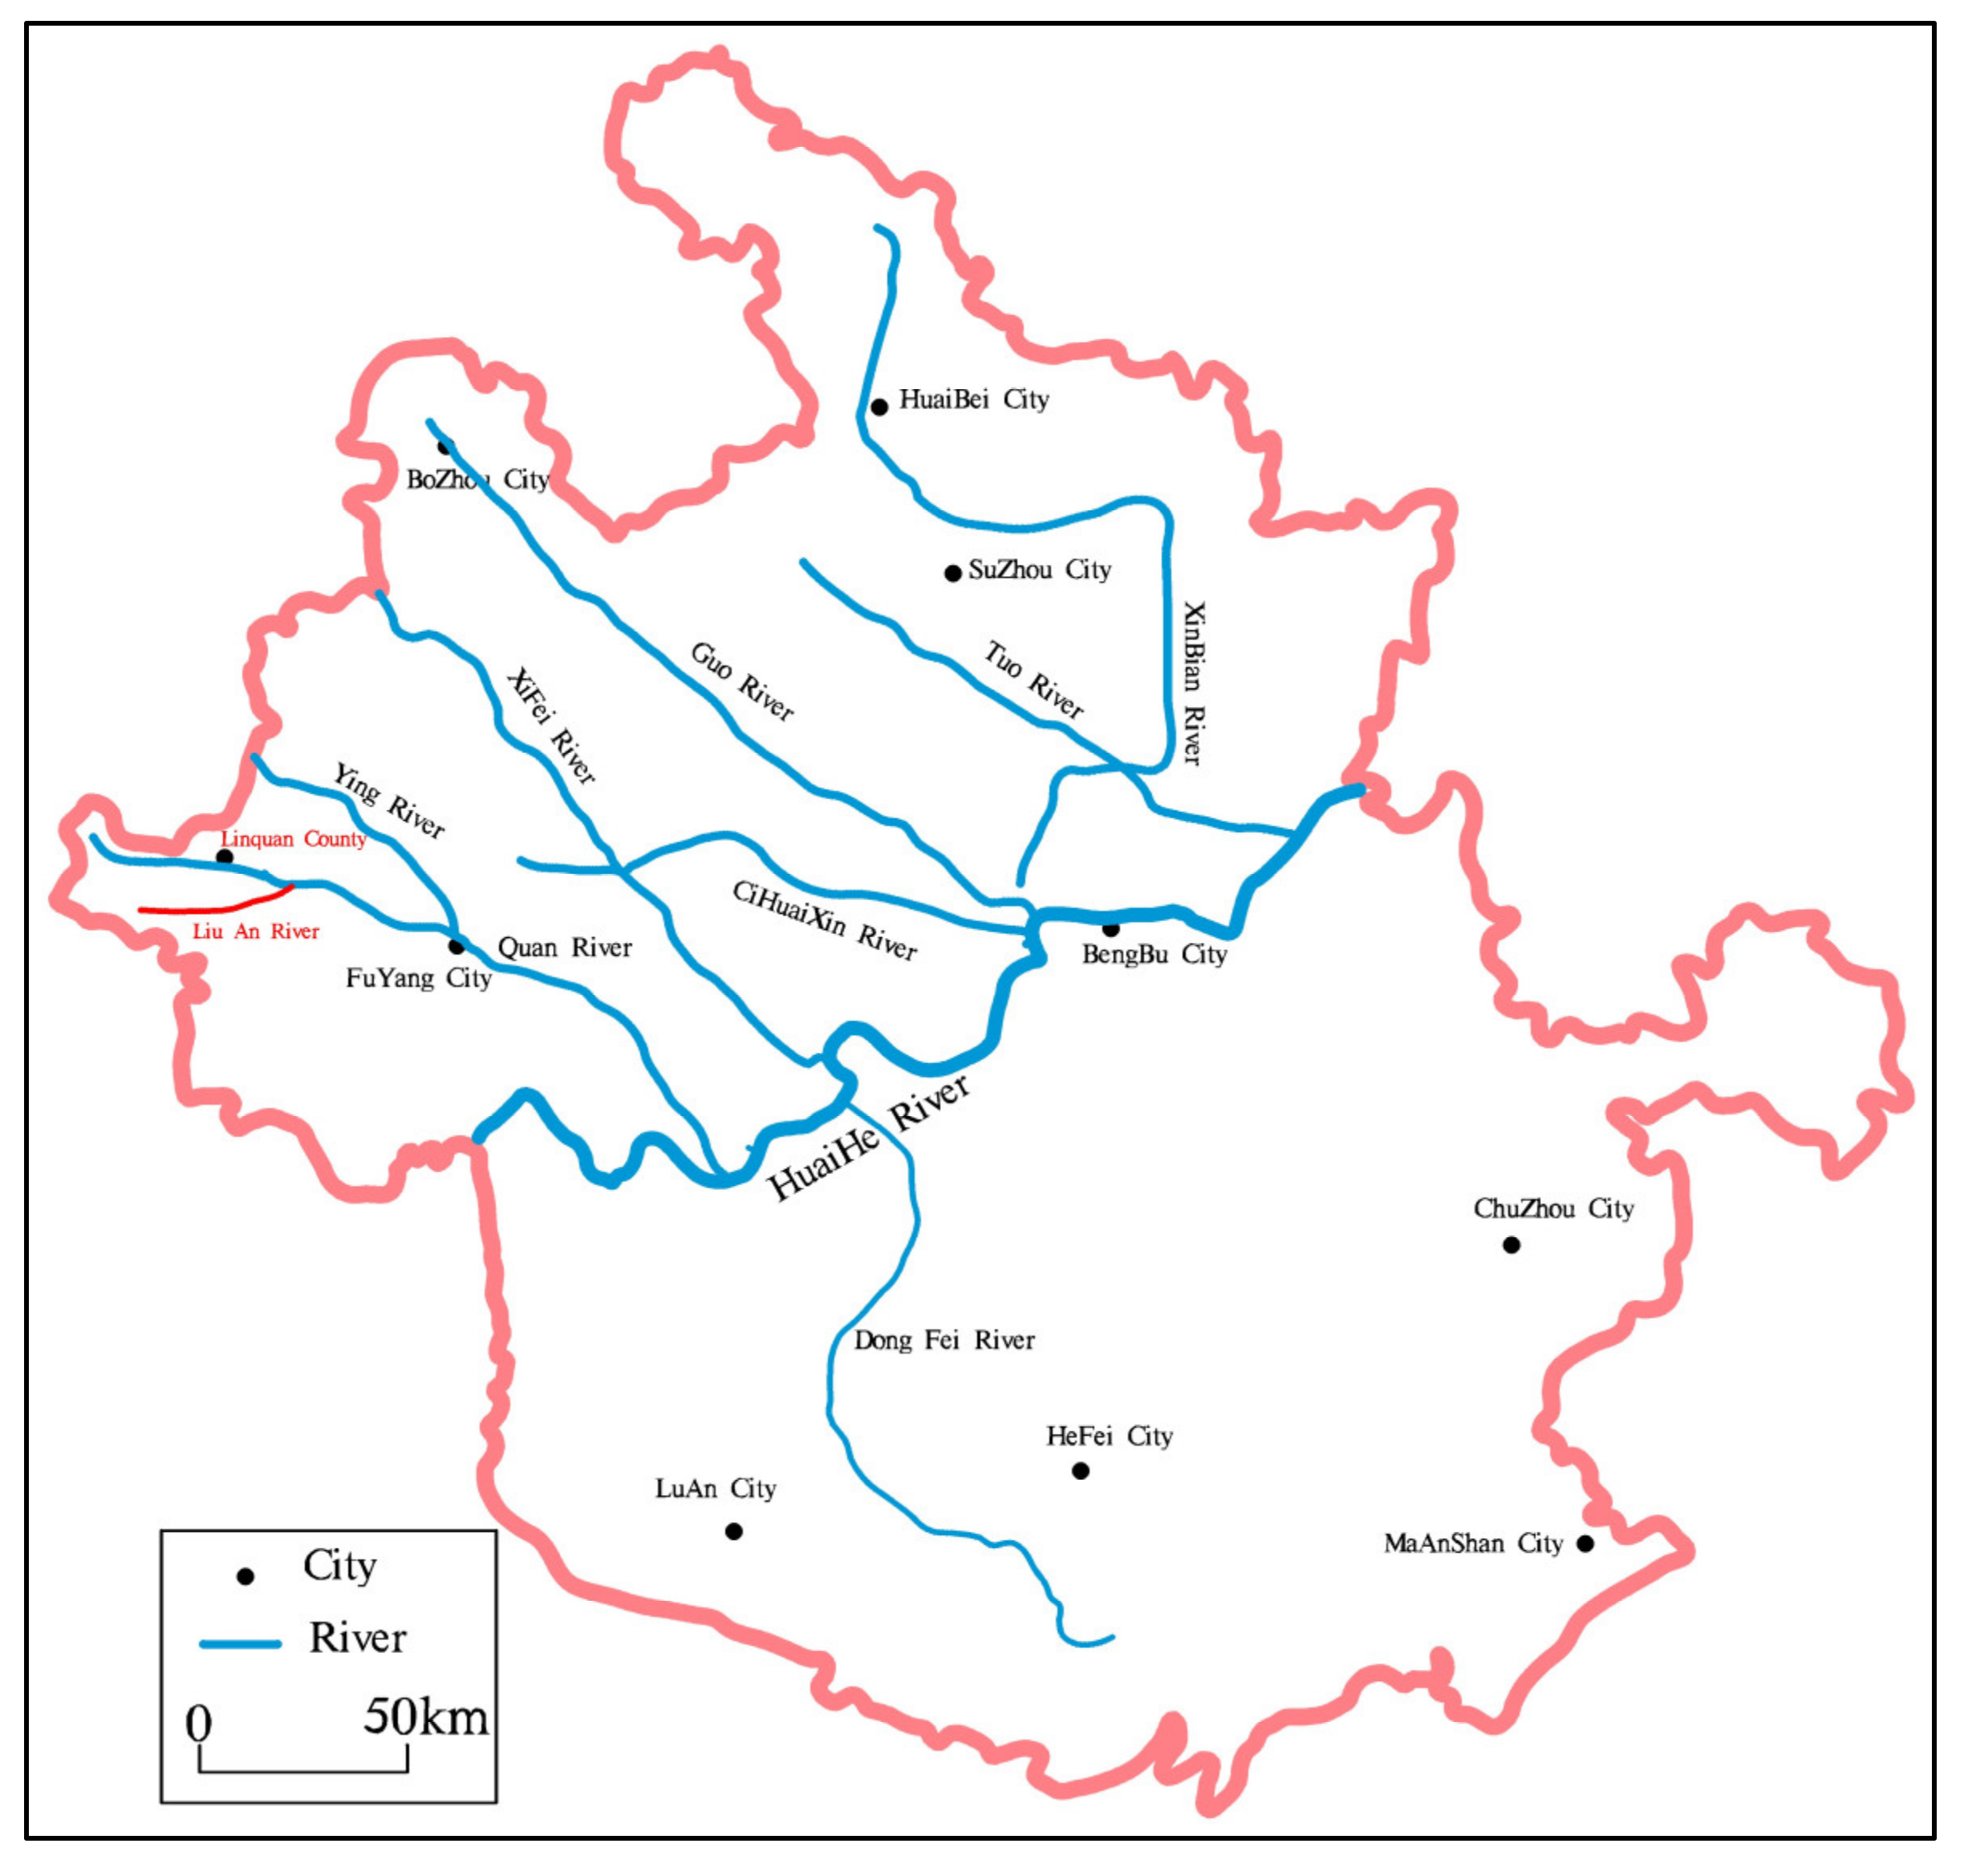
Figure 2.
Map of the Huaihe River drainage system.

Figure 3.
Location map of the main Liuan River.

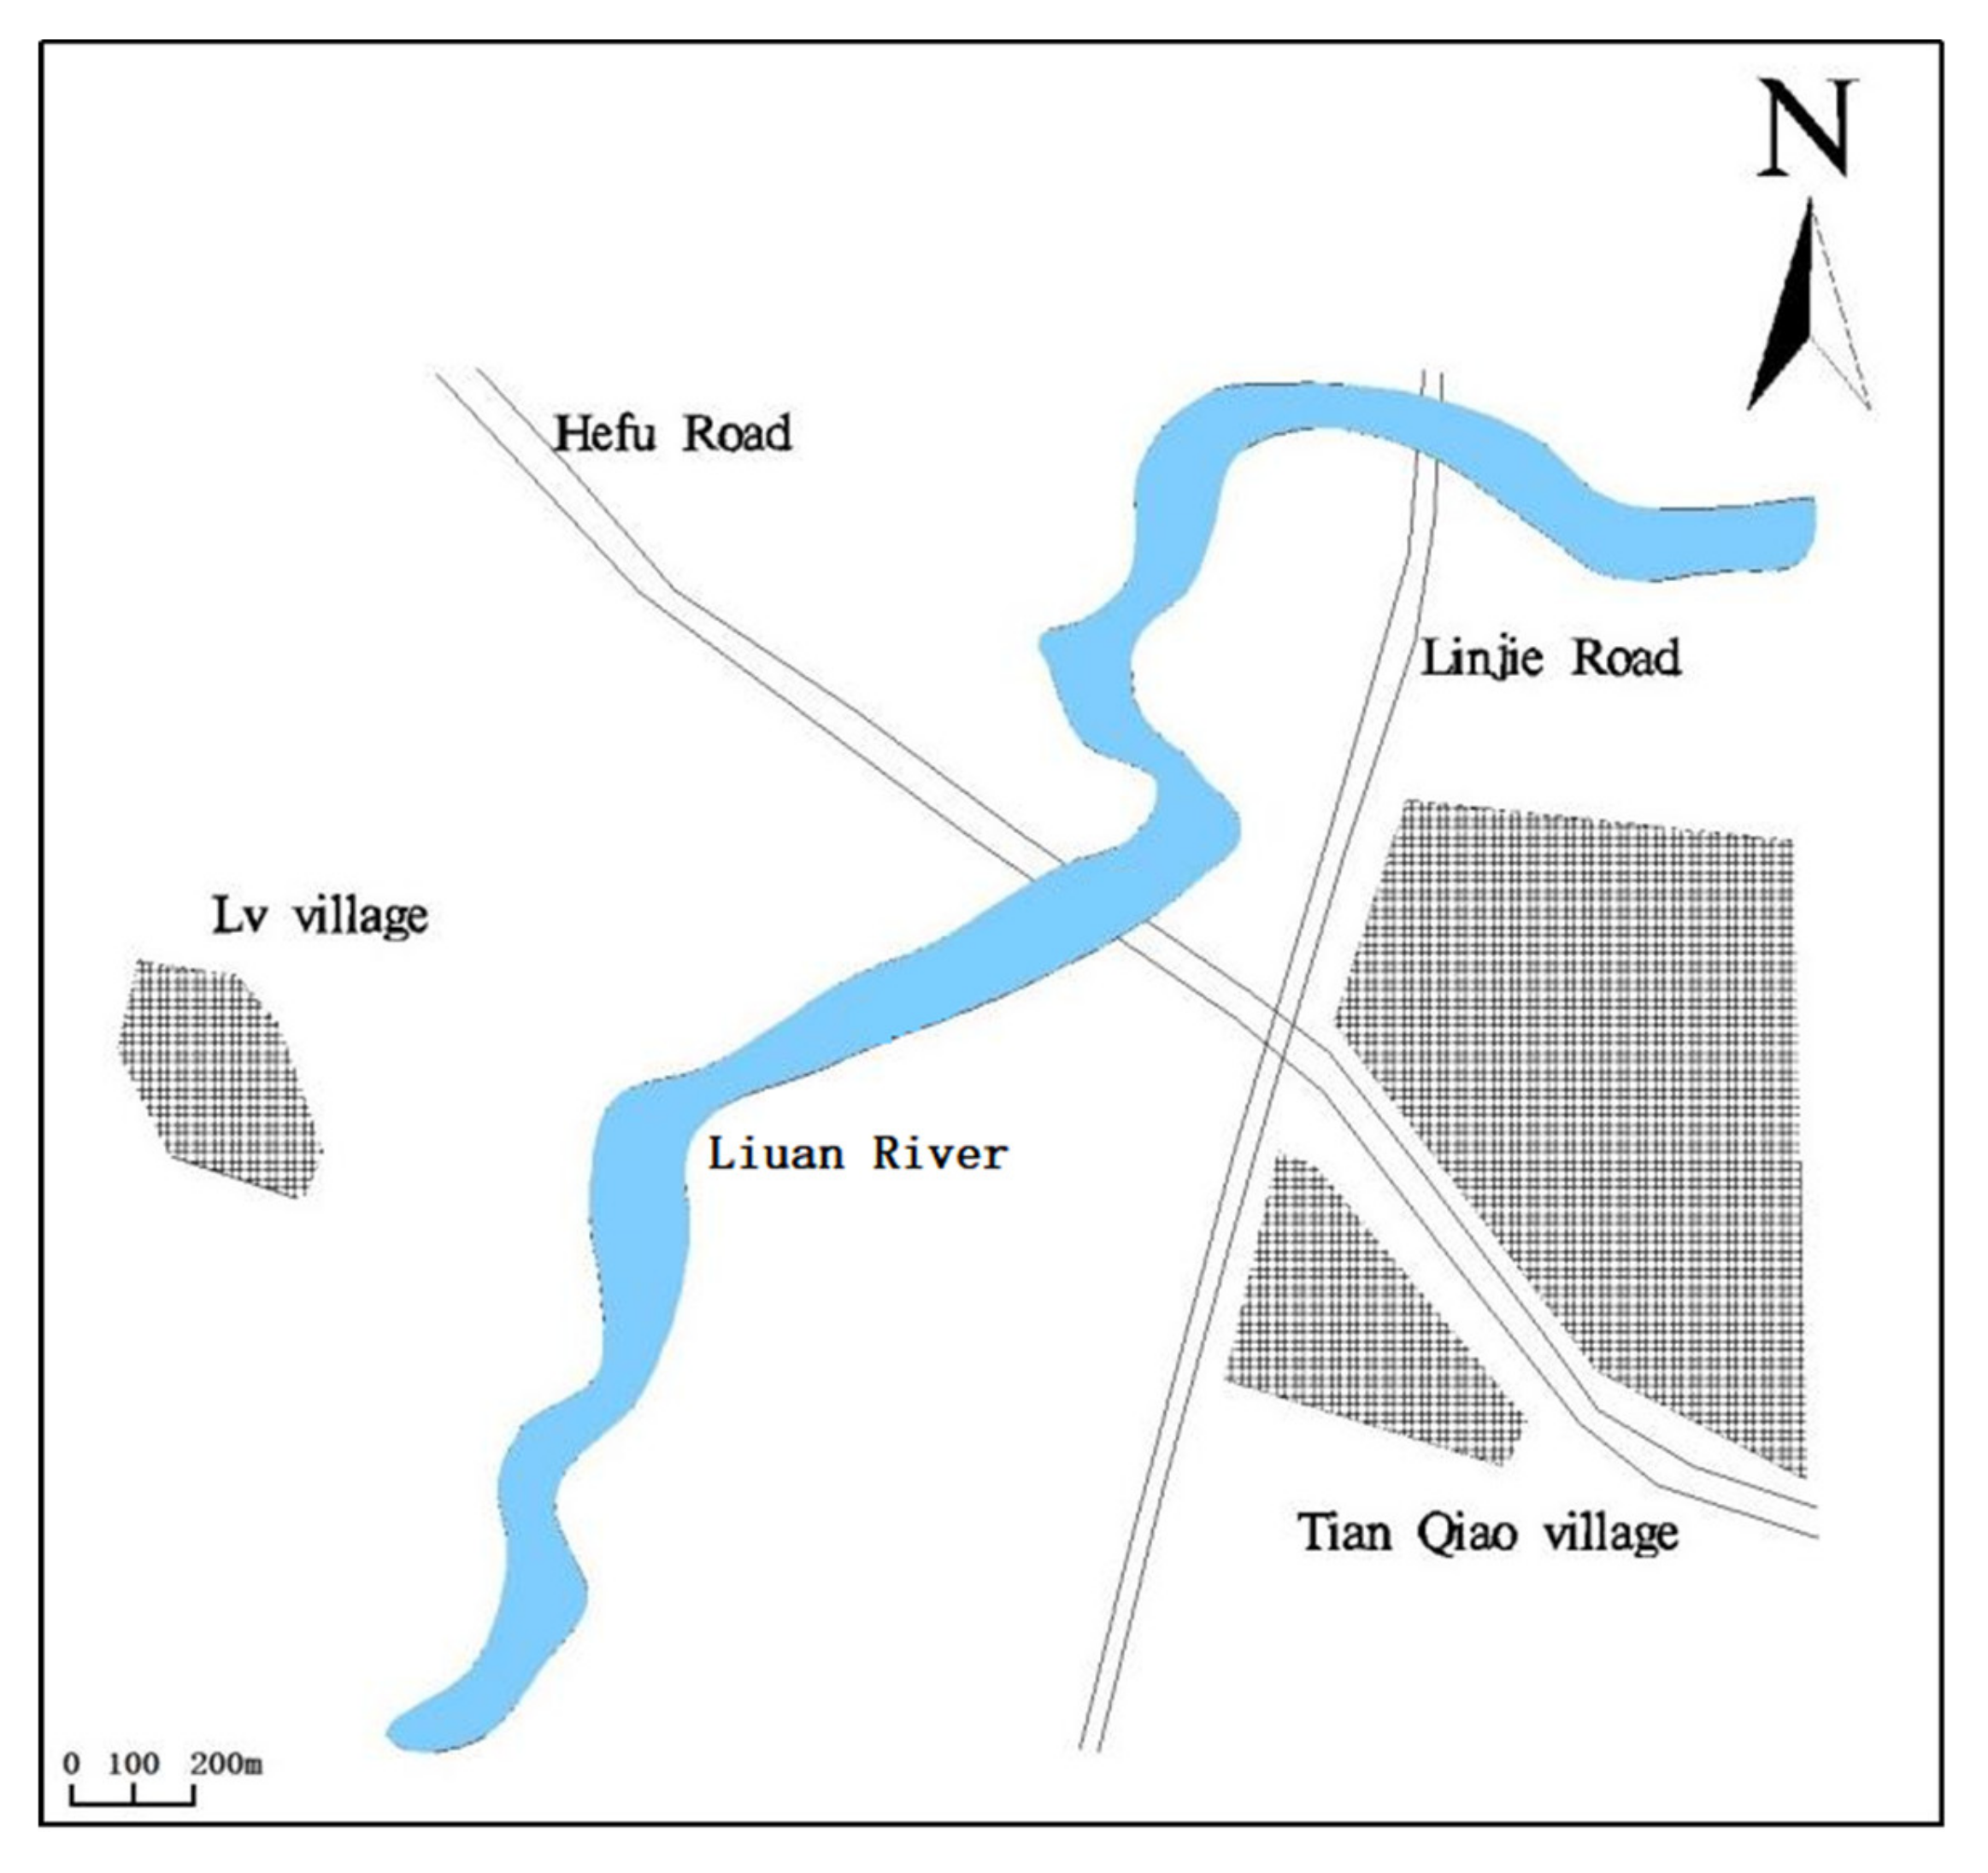
Figure 4.
Location map of the main Liuan River water source.

Figure 5.
Hydrogeological section of the Liuan River water source.

Figure 6.
Diagram showing the water level fit for the Zhangying 50671120 monitoring well in Linquan County.
Figure 6.
Diagram showing the water level fit for the Zhangying 50671120 monitoring well in Linquan County.

Figure 7.
Results of the parameter sensitivity analysis.

Figure 8.
Water level flow field 10 days after pumping.

Figure 9.
Water level flow field 32 days after pumping.

Figure 10.
Flow direction of the groundwater under pumping conditions in a 95% typical dry year.

Figure 11.
Water level flow field 60 days after pumping.

Figure 12.
Maximum eco-environmental water consumption in different typical years.


Table 1.
Monthly rainfall in the study area.
| Month | 7 | 8 | 9 | 10 | 11 | 12 | 1 | 2 | 3 | 4 | 5 | 6 |
|---|---|---|---|---|---|---|---|---|---|---|---|---|
| Rainfall (mm) | 229.8 | 134.3 | 68.9 | 40.5 | 42.2 | 17.1 | 22.6 | 28.5 | 56.5 | 64.1 | 71.9 | 135.8 |
Table 2.
Monthly evaporation in the study area.
| Month | 7–9 | 10–12 | 1–3 | 4–6 |
|---|---|---|---|---|
| Evaporation capacity (mm) | 187 | 97 | 87 | 220 |
Table 3.
Values of the monthly runoff coefficients in the study area.
| Monthly Total Precipitation (mm) | P ≥ 100 | 100 > P ≥ 50 | 50 > P ≥ 30 | 30 > P ≥ 20 | P < 20 |
|---|---|---|---|---|---|
| Monthly runoff coefficient | 0.26 | 0.22 | 0.12 | 0.07 | 0 |
Table 4.
The minimum ecological water demand of Liuan River.
| Q1/(m3/s) | Q2 (m3) |
|---|---|
| 2.66 | 229,824 |
Q1: Ecological flow; Q2: Minimum Ecological Environment Water Demand.
Table 5.
Water balance data from a 95% typical dry year.
| Date | Pump Output (m3) | River in Flow (m3) | Groundwater Exchange Rate (m3) | |||
|---|---|---|---|---|---|---|
| The River Drains into the Pumping Wells (m3) | The River Seeps into the Groundwater (m3) | Total | Proportion of Pumping Water (m3) | |||
| 1 | 25,000 | 1049.1 | 2560 | 3609.1 | 14% | 41,641.42 |
| 12 | 19,000 | 3025.8 | 13,746 | 16,771.8 | 88% | 489.91 |
| 22 | 17,000 | 3030.3 | 12,987.6 | 12,150.9 | 94% | 722.68 |
| 32 | 16,000 | 3066.5 | 12,924.2 | 15,990.7 | 99% | 719.8 |
| 42 | 16,000 | 3086.9 | 12,901.14 | 15,988.04 | 99% | 747.86 |
| 52 | 16,000 | 3099.5 | 12,891.14 | 15,990.64 | 99% | 769.86 |
| 62 | 16,000 | 3107.9 | 12,885.1 | 15,993 | 99% | 784.9 |
| 72 | 16,000 | 3113.8 | 12,881.46 | 15,995.26 | 99% | 795.54 |
Table 6.
Water balance data from a 75% typical dry year.
| Date | Pump Output (m3) | River in Flow (m3) | Groundwater Exchange Rate (m3) | |||
|---|---|---|---|---|---|---|
| The River Drains into the Pumping Wells (m3) | The River Seeps into the Groundwater (m3) | Total | Proportion of Pumping Water (m3) | |||
| 1 | 25,000 | 2143 | 2281 | 4424 | 17% | 47,607 |
| 12 | 25,000 | 3289.7 | 16,645.7 | 19,935.4 | 80% | 1533.3 |
| 22 | 25,000 | 3461.6 | 17,495.8 | 20,957.4 | 83% | 2042.2 |
| 32 | 25,000 | 3539.6 | 18,441.5 | 21,981.1 | 87% | 2297.5 |
| 42 | 25,000 | 3573.8 | 19,417.2 | 22,991 | 91% | 2416.8 |
| 52 | 25,000 | 3589.4 | 19,406.3 | 22,995.7 | 91% | 2473.7 |
| 62 | 25,000 | 3596.9 | 20,401.6 | 23,998.5 | 95% | 2500.4 |
| 72 | 25,000 | 3600.4 | 20,398.5 | 23,998.9 | 95% | 2512.5 |
Table 7.
Groundwater levels for different typical dry years.
| Date | |||||||||
|---|---|---|---|---|---|---|---|---|---|
| 1 | 12 | 22 | 32 | 42 | 52 | 62 | 72 | ||
| 95% typical dry year | groundwater level (m) | 31 | 27.8 | 27.5 | 27.3 | 27.2 | 27.2 | 27.2 | 27.2 |
| 75% typical dry year | 31 | 28 | 27.8 | 27.5 | 27.4 | 27.4 | 27.4 | 27.4 | |
| 50% typical dry year | 34 | 30.3 | 29.9 | 29.7 | 29.6 | 29.6 | 29.6 | 29.6 | |
Publisher’s Note: MDPI stays neutral with regard to jurisdictional claims in published maps and institutional affiliations. |
© 2022 by the authors. Licensee MDPI, Basel, Switzerland. This article is an open access article distributed under the terms and conditions of the Creative Commons Attribution (CC BY) license (https://creativecommons.org/licenses/by/4.0/).
Share and Cite
MDPI and ACS Style
He, Z.; Kang, B.; Tao, Y.; Qin, L. Mining Scheme for Small Rivers near Water Sources—A Case Study of Liuan River in Linquan County, China. Water 2022, 14, 1921. https://doi.org/10.3390/w14121921
AMA Style
He Z, Kang B, Tao Y, Qin L. Mining Scheme for Small Rivers near Water Sources—A Case Study of Liuan River in Linquan County, China. Water. 2022; 14(12):1921. https://doi.org/10.3390/w14121921
Chicago/Turabian StyleHe, Zhenyu, Bo Kang, Yuezan Tao, and Li Qin. 2022. "Mining Scheme for Small Rivers near Water Sources—A Case Study of Liuan River in Linquan County, China" Water 14, no. 12: 1921. https://doi.org/10.3390/w14121921
Note that from the first issue of 2016, this journal uses article numbers instead of page numbers. See further details here.