Article

Trend and Sensitivity Analysis of Reference Evapotranspiration in the Senegal River Basin Using NASA Meteorological Data

1
Laboratoire Leïdi “Dynamique des Territoires et Développement”, Université Gaston Berger (UGB), Saint-Louis BP 234, Senegal
2
UFR S2ATA Sciences Agronomiques, de l’Aquaculture et des Technologies Alimentaires, Université Gaston Berger, Saint-Louis BP 234, Senegal
3
Laboratoire LSAO “Laboratoire des Sciences de l’Atmosphère et de l’Océan”, Université Gaston Berger (UGB), Saint-Louis BP 234, Senegal
4
HydroSciences Montpellier, University of Montpellier, IRD, CNRS, CC 057, 163 rue Auguste Broussonnet, 34090 Montpellier, France
5
Department of Plant and Environmental Sciences, New Mexico State University, Agricultural Science Center at Farmington, P.O. Box 1018, Farmington, NM 87499, USA
6
UMR G-EAU, AgroParisTech, Cirad, University of Montpellier, IRD, INRAE, Montpellier SupAgro, 34196 Montpellier, France
*
Author to whom correspondence should be addressed.
Water 2020, 12(7), 1957; https://doi.org/10.3390/w12071957
Submission received: 16 May 2020 / Revised: 29 June 2020 / Accepted: 29 June 2020 / Published: 10 July 2020
(This article belongs to the Special Issue Evapotranspiration Measurements and Modeling)

Abstract

:
Understanding evapotranspiration and its long-term trends is essential for water cycle studies, modeling and for water uses. Spatial and temporal analysis of evapotranspiration is therefore important for the management of water resources, particularly in the context of climate change. The objective of this study is to analyze the trend of reference evapotranspiration (ET0) as well as its sensitivity to climatic variables in the Senegal River basin. Mann-Kendall’s test and Sen’s slope were used to detect trends and amplitude changes in ET0 and climatic variables that most influence ET0. Results show a significant increase in annual ET0 for 32% of the watershed area over the 1984–2017 period. A significant decrease in annual ET0 is observed for less than 1% of the basin area, mainly in the Sahelian zone. On a seasonal scale, ET0 increases significantly for 32% of the basin area during the dry season and decreases significantly for 4% of the basin during the rainy season. Annual maximum, minimum temperatures and relative humidity increase significantly for 68%, 81% and 37% of the basin, respectively. However, a significant decrease in wind speed is noted in the Sahelian part of the basin. The wind speed decrease and relative humidity increase lead to the decrease in ET0 and highlight a “paradox of evaporation” in the Sahelian part of the Senegal River basin. Sensitivity analysis reveals that, in the Senegal River basin, ET0 is more sensitive to relative humidity, maximum temperature and solar radiation.

1. Introduction

One of the current challenges in hydrological studies is the assessment of the impact of climate change on water resources [1]. Indeed, streamflow projections allow water resource managers as well as decision-makers to compare estimated future water availability with water demands and thus develop strategies to better manage water, particularity in the context of climate change. Forecasting future streamflow is highly dependent on evapotranspiration, which is influenced by several climatic variables [2]. In addition, evapotranspiration plays a crucial role in determining crop water requirements [3], essential when planning and programming irrigation. Evapotranspiration is a key variable that establishes a relationship between the energy and the water balances on the earth’s surface [4]. Thus, it is one of the parameters which control the transfer of water and energy between the earth and the atmosphere and is considered as an indicator of climate change [5].
Evapotranspiration is influenced by several factors: temperature, wind speed, relative humidity, solar radiation, plant cover, land use, etc. [6,7,8]. Variation in any of these factors can affect the spatiotemporal distribution of evapotranspiration [9,10,11,12]. In recent years, several authors [4,5,13,14,15,16] have shown that global warming leads to an increase in evapotranspiration. Indeed, temperature increases due to climate change and the associated higher amount of available energy leads to an increase in evapotranspiration [13]. On the other hand, a decrease in evapotranspiration has been noted in certain climatic regions of the world: in dry and humid climates of the United States [17,18], in tropical and subtropical climates in China [13,14,19], in semi-arid climate of Turkey [20,21], and in arid climate of Iran [22]. The contrast between the increase in temperature and the decrease in evapotranspiration is known as the “evaporation paradox” [13,23]. This “paradox of evaporation” could be explained by the decrease in solar radiation, following the increase in cloud cover and the concentration of aerosols and pollutants in the atmosphere [17,24,25], the increase in relative humidity [26] and the reduction in wind speed [25].
In this regard, several studies have been interested in characterizing the trend of evapotranspiration and the climatic variables which condition it [4,12,16,27,28]. The method generally used by these authors are: (i) the use of the Mann-Kendall test for detecting the trend of ET0 and climatic variables [7,13,27,29] (ii) and an analysis of the sensitivity of evapotranspiration to climatic variables [1,30,31,32,33,34,35,36,37]. Sensitivity analysis helps to understand the link between evapotranspiration and climatic variables [31], to choose the methods for evapotranspiration estimation [30], and to detect the impact of climate change on evapotranspiration [16]. For example, Darshana et al. [34] used Mann-Kendall’s test and sensitivity analysis to detect the trend of evapotranspiration and climatic variables in the Tons basin (India). Their results showed a significant decrease in annual and seasonal evapotranspiration; sensitivity analysis reveals that evapotranspiration is more sensitive to maximum temperature and solar radiation. Gong et al. [31] found that evapotranspiration is more sensitive to relative humidity, solar radiation, average air temperature, and wind speed, respectively, in the Changjiang Basin in China. Tabari et al. [36] noted that mean temperature, solar radiation, relative humidity and wind speed, respectively, are the main parameters that influence evapotranspiration in western Iran. These different studies show that the trend and sensitivity of evapotranspiration to climatic variables depend on the study regions. In Africa, Obada et al. [8] analyzed recent and future variations in evapotranspiration in Benin over the period 1981–2010 using the Lamb index [38] and the Mann-Kendall test. They noted a significant downward trend (95% of studied stations) in annual evapotranspiration during this period with high inter-annual variability. However, they did not analyze the trend of climatic variables (temperature, wind speed, relative humidity, and solar radiation) and their influence on evapotranspiration. Abiye et al. [7] used monthly data from the Climate Research Unit (CRU) (version TS 4.00) to analyze the trend of evapotranspiration over the period 1906–2015 on the scale of West Africa. Their results showed a significant upward evapotranspiration trend in the Sahelian zone and a downward trend in the Sahelian and Guinean areas. Their study showed that temperature is the key climatic parameter that explains evapotranspiration variation in West Africa. Although the study by Abiye et al. [7] is relevant in many ways, they did not include wind speed, humidity and solar radiation in the sensitivity analysis. The works of Gong et al. [31] in China, Irmak [30] in the United States, Bakhtiari and Liaghat [39] in Iran, Ambas and Baltas [40] in Greece, have shown that these climatic variables have an influence on evapotranspiration.
Thus, this work has a double objective: (i) detect the trends of annual and seasonal evapotranspiration at the scale of the Senegal River watershed and (ii) analyze the sensitivity of ET0 to climatic variables (maximum temperature, minimum temperature, wind speed, relative humidity and solar radiation). The Senegal River basin is the second largest transboundary basin in West Africa after the Niger basin. It is at the heart of the development issues and challenges of its riparian countries: Guinea, Mali, Senegal and Mauritania and is managed by the Senegal River basin Organization (in French, Organisation pour la Mise en Valeur du fleuve Sénégal, OMVS). Its surface area is estimated at more than 300,000 km² [41] and its population was 6.5 million in 2015 and will reach 9.8 million in 2025 [42]. Senegal River basin water resources are used for irrigation (2 billion m3 year−1), water supply for the capital cities of Senegal and Mauritania, hydroelectricity, water supply for livestock, industries and mining, navigation and fishery. The incomes of almost 6 million people depend on the Senegal River basin water resources [42]. Therefore, the study of the reference evapotranspiration which is one the main elements of the hydrological cycle is crucial, particularly the investigation of its long-term trends.

2. Materials and Methods
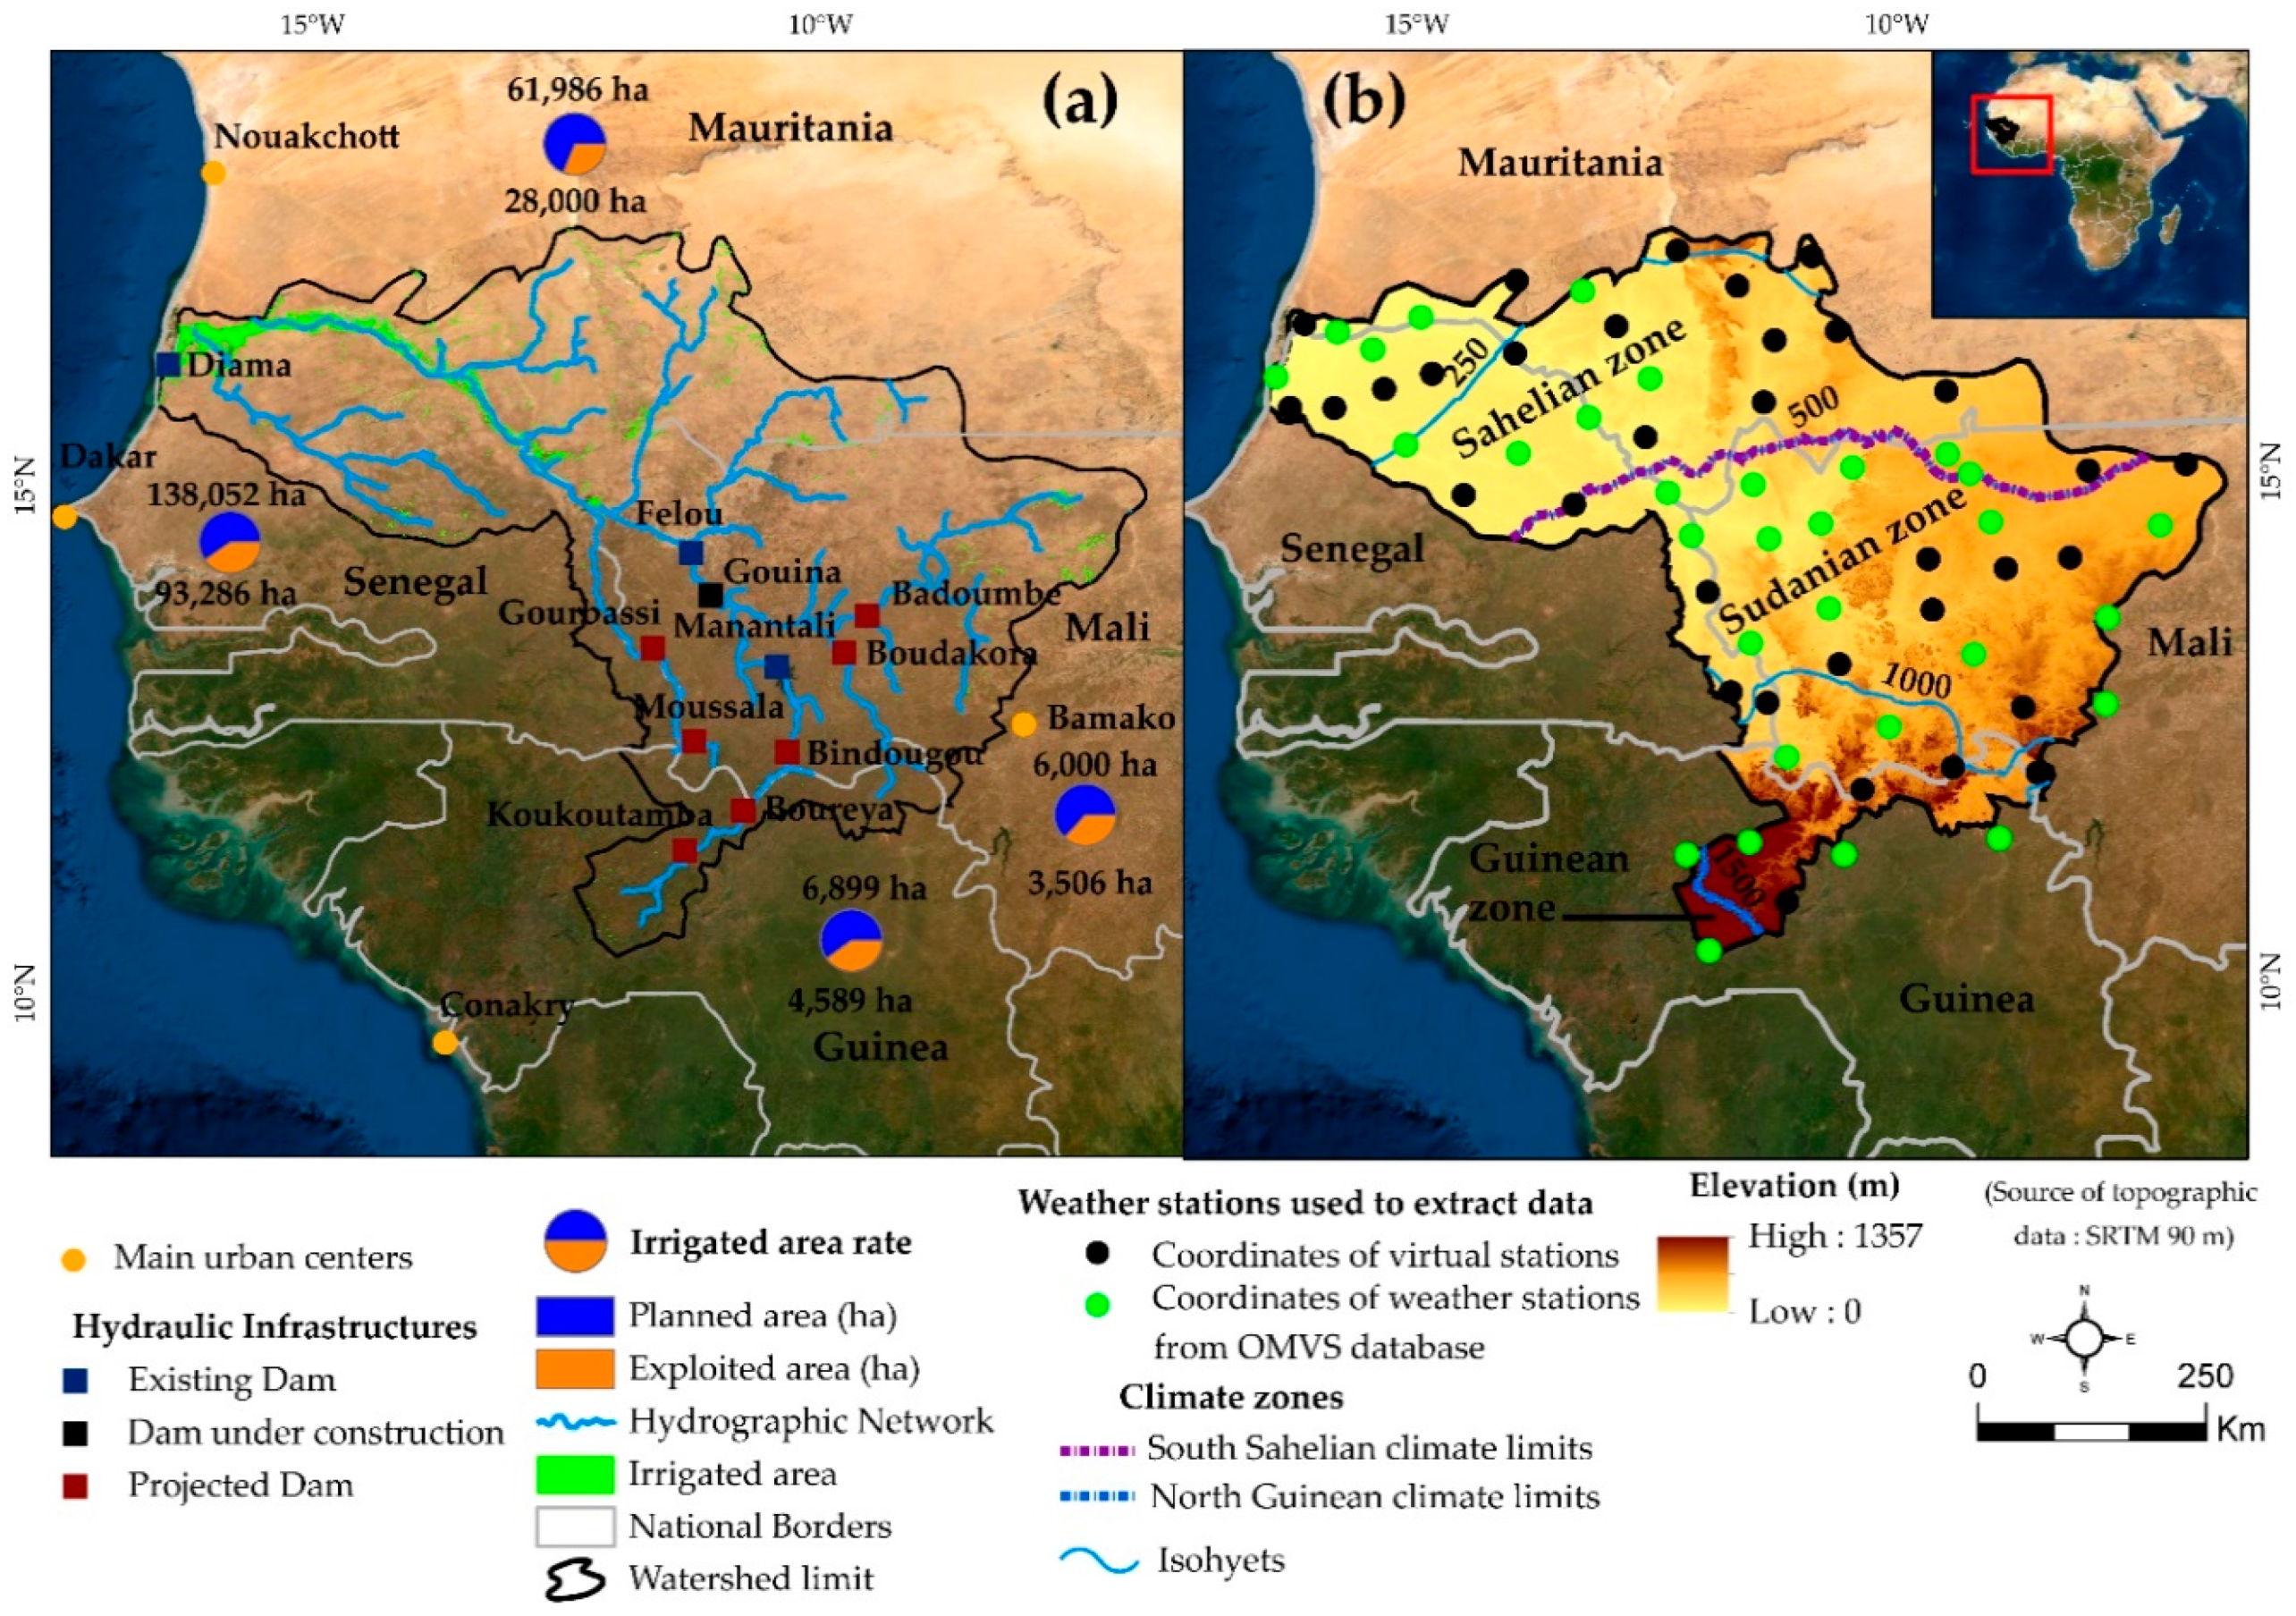
2.1. Study Area

The Senegal River basin is divided into two large geographic units: the upper basin and the lower basin. The upper basin is almost essentially centered on the mountain ranges of Fouta-Djalon in Guinea, source of the main flows in West Africa, and on the hills and plateau as the river flows north into Mali. This area is the rainiest part of the Senegal river basin and the source of the main tributaries (Bafing, Bakoye, Baoulé). In addition, the main hydraulic infrastructures (Manantali, Felou dams) were built in this area by OMVS. These infrastructures play the main role in river flow regulation, the production of hydroelectricity and the development of irrigation. In order to regulate the uncontrolled tributaries and increase the energy productivity of the basin, several other dams are planned in this area by OMVS. The lower basin, which corresponds to the Valley and the Delta, concentrates the main agricultural activities in the basin. From a climatic point of view, Dione [43] identified four main climatic zones on the basis of the latitudinal distribution of precipitation: Guinean (average annual rainfall p > 1500 mm); South Sudanian (1000 < p < 1500 mm); North Sudanian (500 < p < 1000 mm) and Sahelian (p < 500 mm). In this study, the Sudanian zone (South Sudanian and North Sudanian) has been considered as one climate zone. Thus, three climatic zones are considered: Guinean (1% of the river basin area), Sudanian (62%), and Sahelian (37%).

2.2. Data

In West Africa, climate data managed by national meteorological services are difficult for researchers to access because of their high cost of acquisition [44]. In addition, the low density of the observation network poses a problem of representativeness of these data at the scale of the watershed. However, a large-scale study of evapotranspiration requires several measurement points due to the heterogeneity of the landscapes and the variation in the energy transfer processes [45]. Therefore, in this study, data reanalysis and observation of the POWER project of NASA Langley Research Center (LaRC) funded by the NASA Earth Science/Applied Science program (https://power.larc.nasa.gov/data-access-viewer, accessed on 20 December 2018) were used as an alternative to observed data that are inaccessible and generally scattered [44,46]. These data, already used and validated in previous studies [47,48,49], have the advantage of having spatial and temporal coverage on a global scale [46,50,51,52] and provide the climatic variables necessary for the estimation of evapotranspiration [46,53]. These datasets which result from satellite and model-derived weather data contain uncertainties however, and where possible these should be evaluated and validated locally against available in situ measurements [54]. When extracting NASA data, the coordinates of 31 weather stations from the OMVS database [44] and 33 virtual stations were used (Figure 1). The climatic variables extracted on a daily scale over the period 1984-2017 are: temperature (maximum and minimum), relative humidity, wind speed and solar radiation. The average daily values of the main climatic variables are given in Figure 2. The temperature varies from 19 °C to more than 38 °C depending on the climatic zones. The maximum values are observed in the Sahelian zone and those minimum in the Guinean zone. The latter area has the highest relative humidity rates above 60%.

2.3. Methods

2.3.1. Reference Evapotranspiration Estimation

Reference evapotranspiration (ET0) is the evapotranspiration of a reference surface (grass or alfalfa), of uniform height (0.08 to 0.15 m) and suitably supplied with water [55]. It is considered as a climatic parameter and therefore can be estimated with only climatic variables [55]. Among the various existing methods for estimating ET0, Penman-Monteith is recognized as a standard method in all climatic conditions of the globe [55]. Thus, this method (Equation 1) is used in this study for the estimation of ET0 of grass on a daily scale. The annual and seasonal ET0 are obtained by summing daily ET0 values. Two seasons are considered: a dry season (November to May) and a rainy season (June to October) even though, the length of the seasons varies according to the climatic zones of the basin. The method of interpolation of the Inverse Distance Weighting (IDW) [56,57] is used to spatialize the ET0 on an annual and seasonal scale. The IDW interpolation technique is widely used to analyze the spatial distribution of evapotranspiration [10,56,57,58]. It is a simple method that provides accurate estimates of evapotranspiration values [10] compared to more resource-intensive methods like kriging [59]:
ET 0 = 0.408 Δ ( Rn G ) +   γ   900 T + 273.3 u 2   ( es ea ) Δ + γ ( 1 + 0.34 u 2 )
where ET0 is the reference evapotranspiration (mm d−1), Rn: net radiation on the crop surface (MJ·m−2 d−1), G is the density of heat flux of the soil (MJ·m−2 d−1) which is ignored on a daily scale, T is the average daily air temperature at a height of 2 m (°C), u2 is the wind speed at a height of 2 m (m s−1), es is the pressure of saturated vapor (kPa), ea is actual vapor pressure (kPa), (es ea) is the saturation deficit (kPa) Δ is the slope curve of the vapor pressure (kPa °C−1) and γ is the psychrometric constant (kPa °C).
Due to the unavailability of maximum and minimum relative humidity in the reanalysis data used, the actual vapor pressure (ea) is estimated from the average relative humidity according to the formula proposed by Allen et al. [55]:
ea = Rh 100 [ e ° ( Tmax ) + e ° ( Tmin ) 2 ]
where ea is the actual vapor pressure (kPa), Rh mean relative humidity, e°(Tmax) saturated vapor pressure at a maximum temperature, e°(Tmin) saturated vapor pressure at a minimum temperature.

2.3.2. Reference Evapotranspiration Trend

The Mann-Kendall test [60,61], is often used to detect trends in hydroclimatic data series [44,62,63]. The advantage of this test is that it does not require the data to follow any statistical distribution [56]. It is also not sensitive to extreme values [22]. The test is based on two hypotheses: null hypothesis (noted Ho) which supposes that the test is stationary, no trend and the alternative hypothesis (H1) which rejects Ho and indicates the existence of a trend. Mann-Kendall’s statistical S is given by the following formula:
S = j = 1 j = n 1 i = j + 1 i = n sign   ( x i x j )
where x i is the value of the variable at time i and x j is the value of the variable j, n is the length of the series and sign () is a function which is calculated as follows:
sign   ( x i x j ) = { 1   if   ( x i x j ) > 0 0   if   ( x i x j ) = 0 1   if   ( x i x j ) < 0
An upward or downward trend is given by the sign of the value Z (positive or negative) which is obtained from the variance of S which is obtained by this formula:
Var   ( s ) = n ( n 1 ) ( 2 n + 5 ) / 18
For n > 10, Z follows approximately a normal distribution and can be calculated as follows:
Z = { s 1 var ( s )   if   S > 0 0   if   S = 0 s + 1 var ( s )   if   S < 0
The trend obtained is measured according to its level of significance i.e., the probability associated with the rejection or not of the null hypothesis. In this study, the significance level of 0.05 is used. When |Z|> 1.96 the null hypothesis is rejected and the trend is significant at 5%. If a trend is noted in the data series, its amplitude can be determined by the slope of the trend (noted β). The method of Sen [64] is generally used to estimate the slope of the trend:
β = Median   ( x i x j i j )   i < j
where x i and x j are the data values at times i and j, respectively. A positive β value indicates an upward trend and a negative value indicates a downward trend.
The application of the Mann-Kendall test requires a verification of the autocorrelation of the data. If the data are not autocorrelated, the Mann-Kendall test can be applied directly without modification. However, the existence of an autocorrelation can increase the probability of detecting a significant trend [65]. A positive autocorrelation increases the rejection of the null hypothesis when it is true because the variance of the Mann-Kendall test increases with the magnitude of the autocorrelation of the series [5]. Therefore, the influence of autocorrelation should be removed from the series [66]. The autocorrelation function (ACF) was used to construct the autocorrelation graphs [67].
Figure 3 shows the autocorrelation tests of some stations in the basin. Significant autocorrelation (5%) was not observed for 80% of the stations. Nevertheless, some stations show significant autocorrelation but not very representative. Therefore, given the limited number of stations with significant autocorrelation, the Mann-Kendall trend test is directly applied to the raw data.

2.3.3. Sensitivity of ET0 to Climatic Variables

Sensitivity analysis is the technique generally used to determine the influence of climatic variables on evapotranspiration [1,30]. The daily average variables used in this study are: maximum temperature (Tmax), minimum temperature (Tmin), wind speed (u2), relative humidity (Rh) and solar radiation (Sr). ET0 sensitivity to climate variables was estimated by varying each variable individually by ± 5, 10, 15, 20 and 25%, leaving the other variables constant [36]. A sensitivity coefficient (8) was calculated to determine the degree of influence of each climate variable on the ET0 [11]:
S vi = ET 0 vi × vi ET 0
where S vi the sensitivity coefficient, ∂ET0 variation of the reference evapotranspiration (ET0) caused by the change of a variable vi , vi is the considered variable. A positive (negative) sensitivity coefficient indicates that the variable increases (decreases) the reference evapotranspiration. The higher the absolute value of the sensitivity coefficient, the more the variable has influence on ET0 [11].

3. Results and Discussion

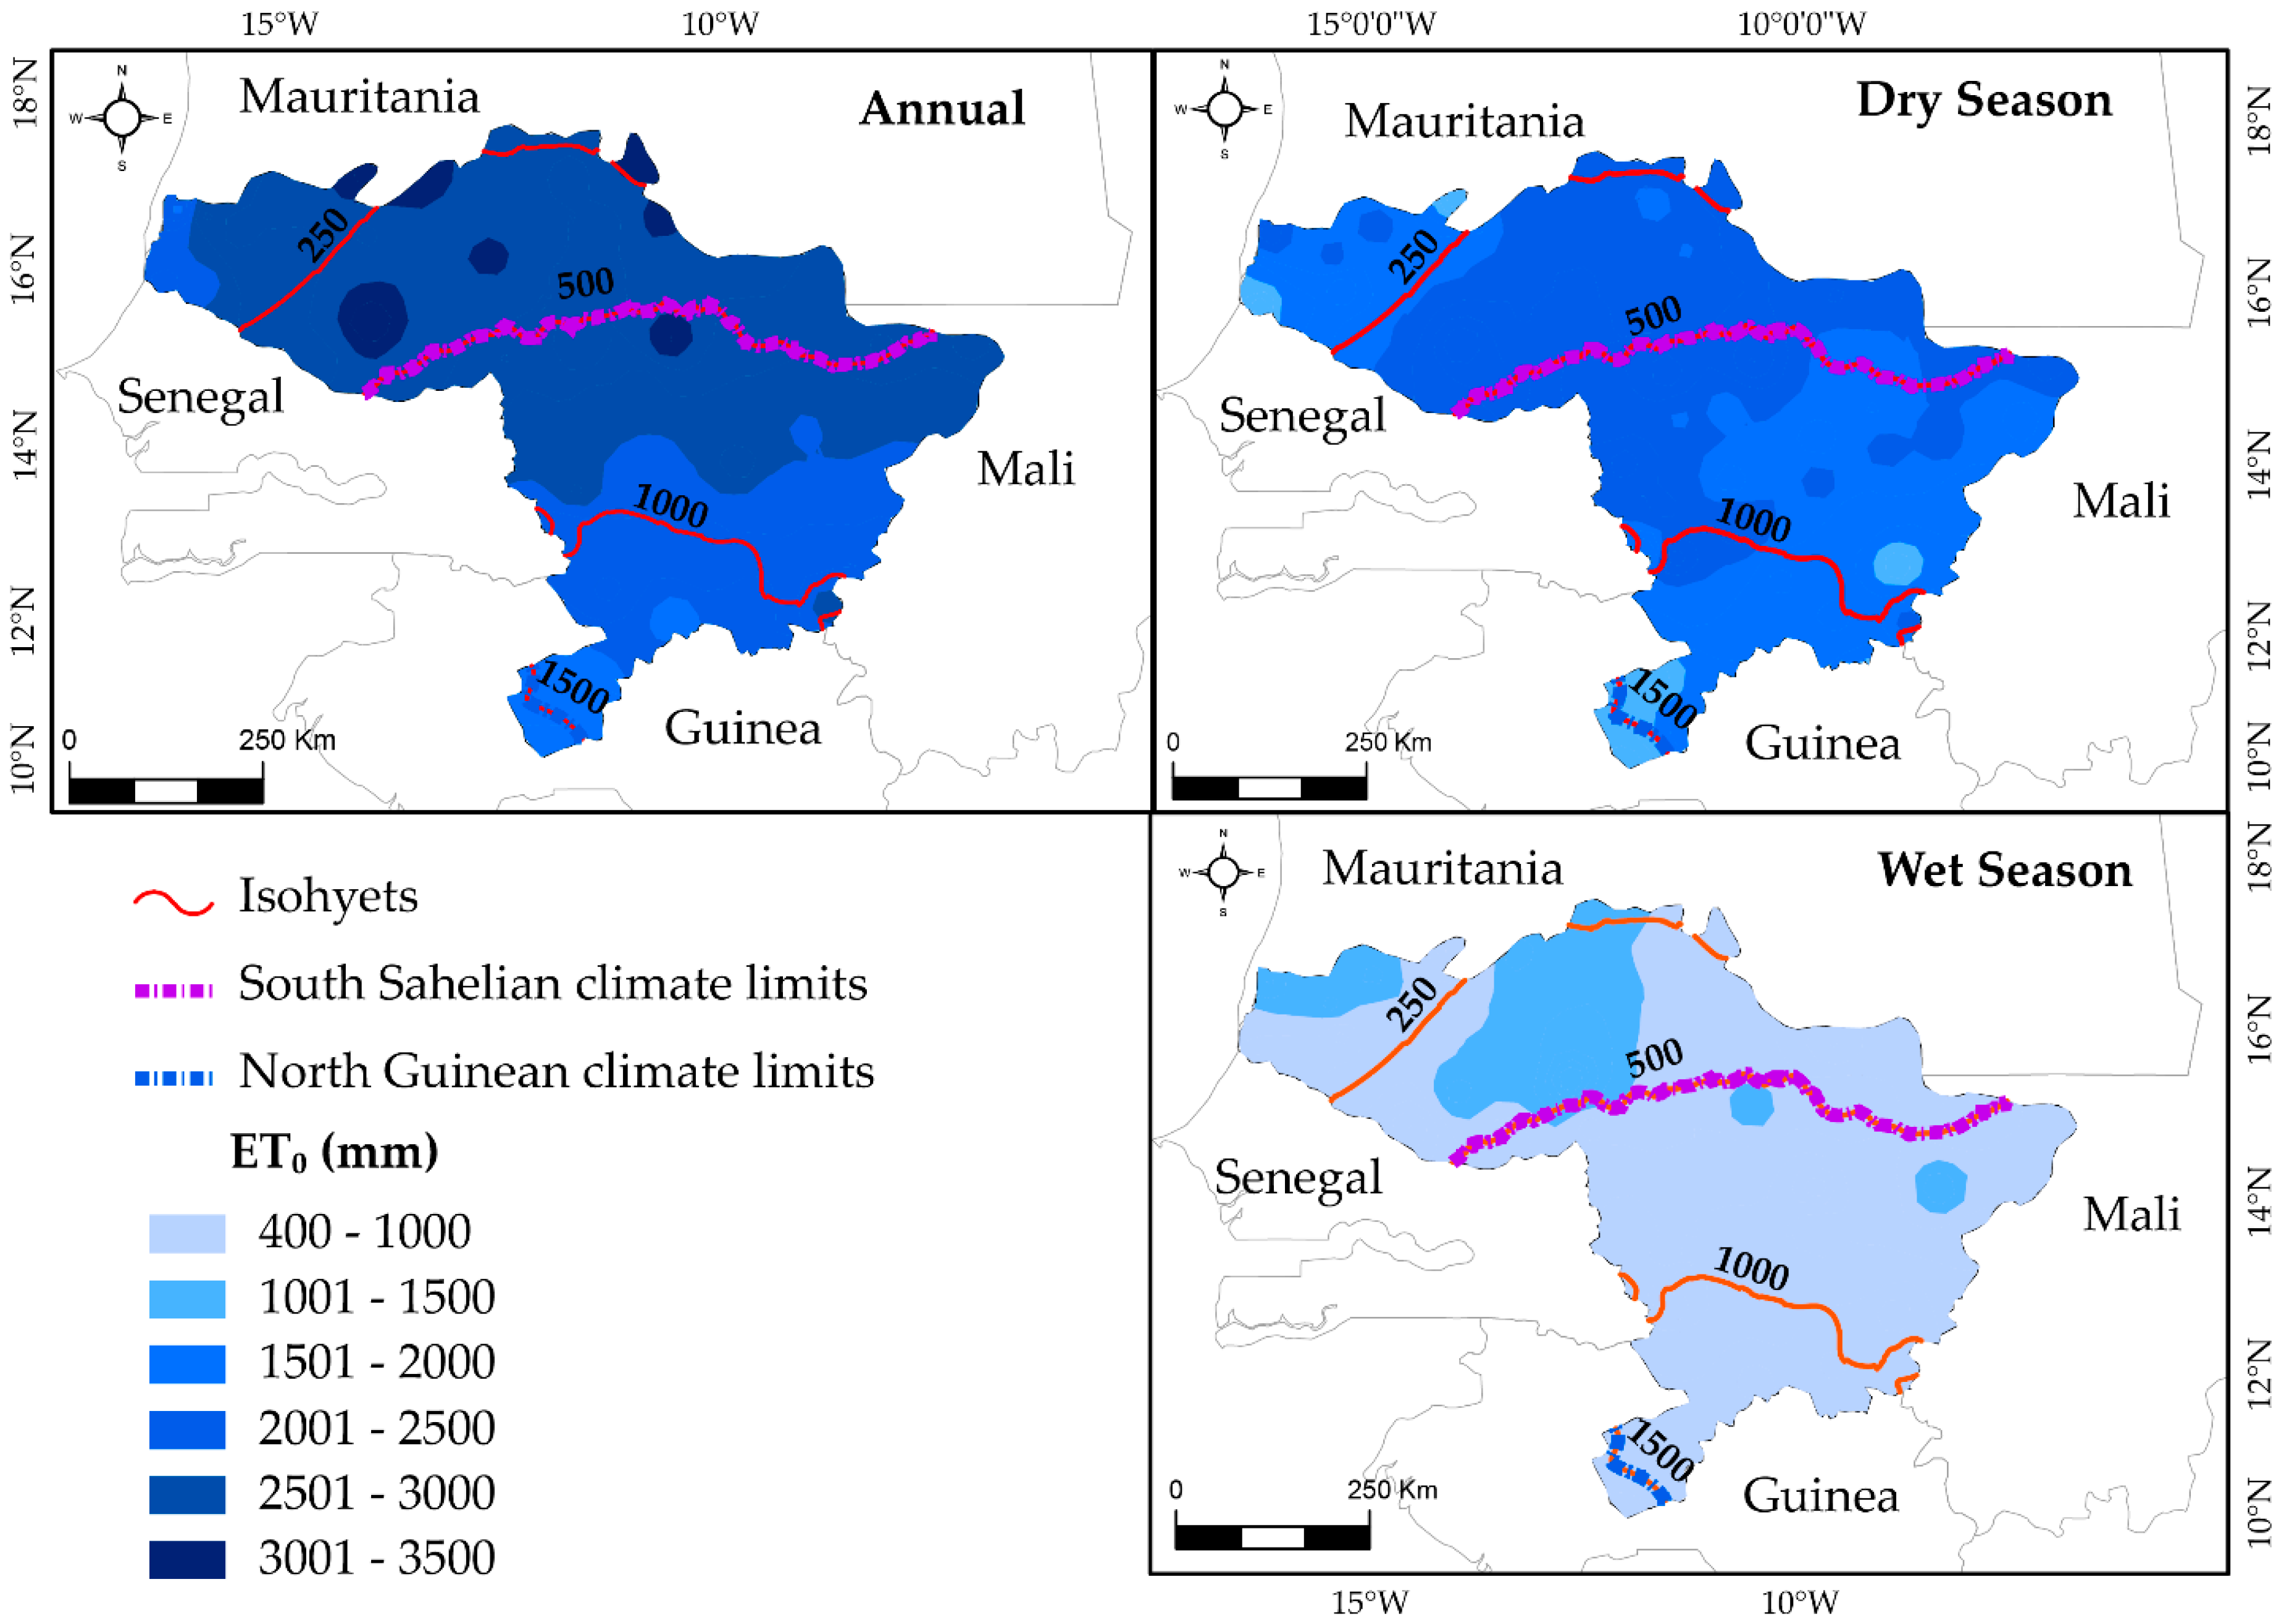
3.1. Spatial Variation of Annual and Seasonal Evapotranspiration

Figure 4 shows the spatial distribution of seasonal and annual reference evapotranspiration in the Senegal river basin averaged over 1984–2017. Reference evapotranspiration varies spatially from 1130–2170 mm during the dry season and decreases during the rainy season with values between 400 to 1500 mm. Annual ET0 varies from 1500 to more 3288 mm with an average value of 2524 mm (i.e., between 4.1 and 9.0 mm d−1, mean 6.9 mm d−1). These values, even if they seem high, are in line with those of Aubin [68] who showed that in West Africa, annual evapotranspiration varies from 3500 mm in the north of the Sahel to 1000 mm in the equatorial zone. From a spatial point of view, the distribution of annual ET0 follows the opposite direction of the latitudinal distribution of precipitation. Indeed, the Sahelian zone which receives less rain records the highest ET0 values. On the other hand, in the Guinean zone, the high value of relative humidity and the low ones of temperatures favor the drop-in evapotranspiration values.

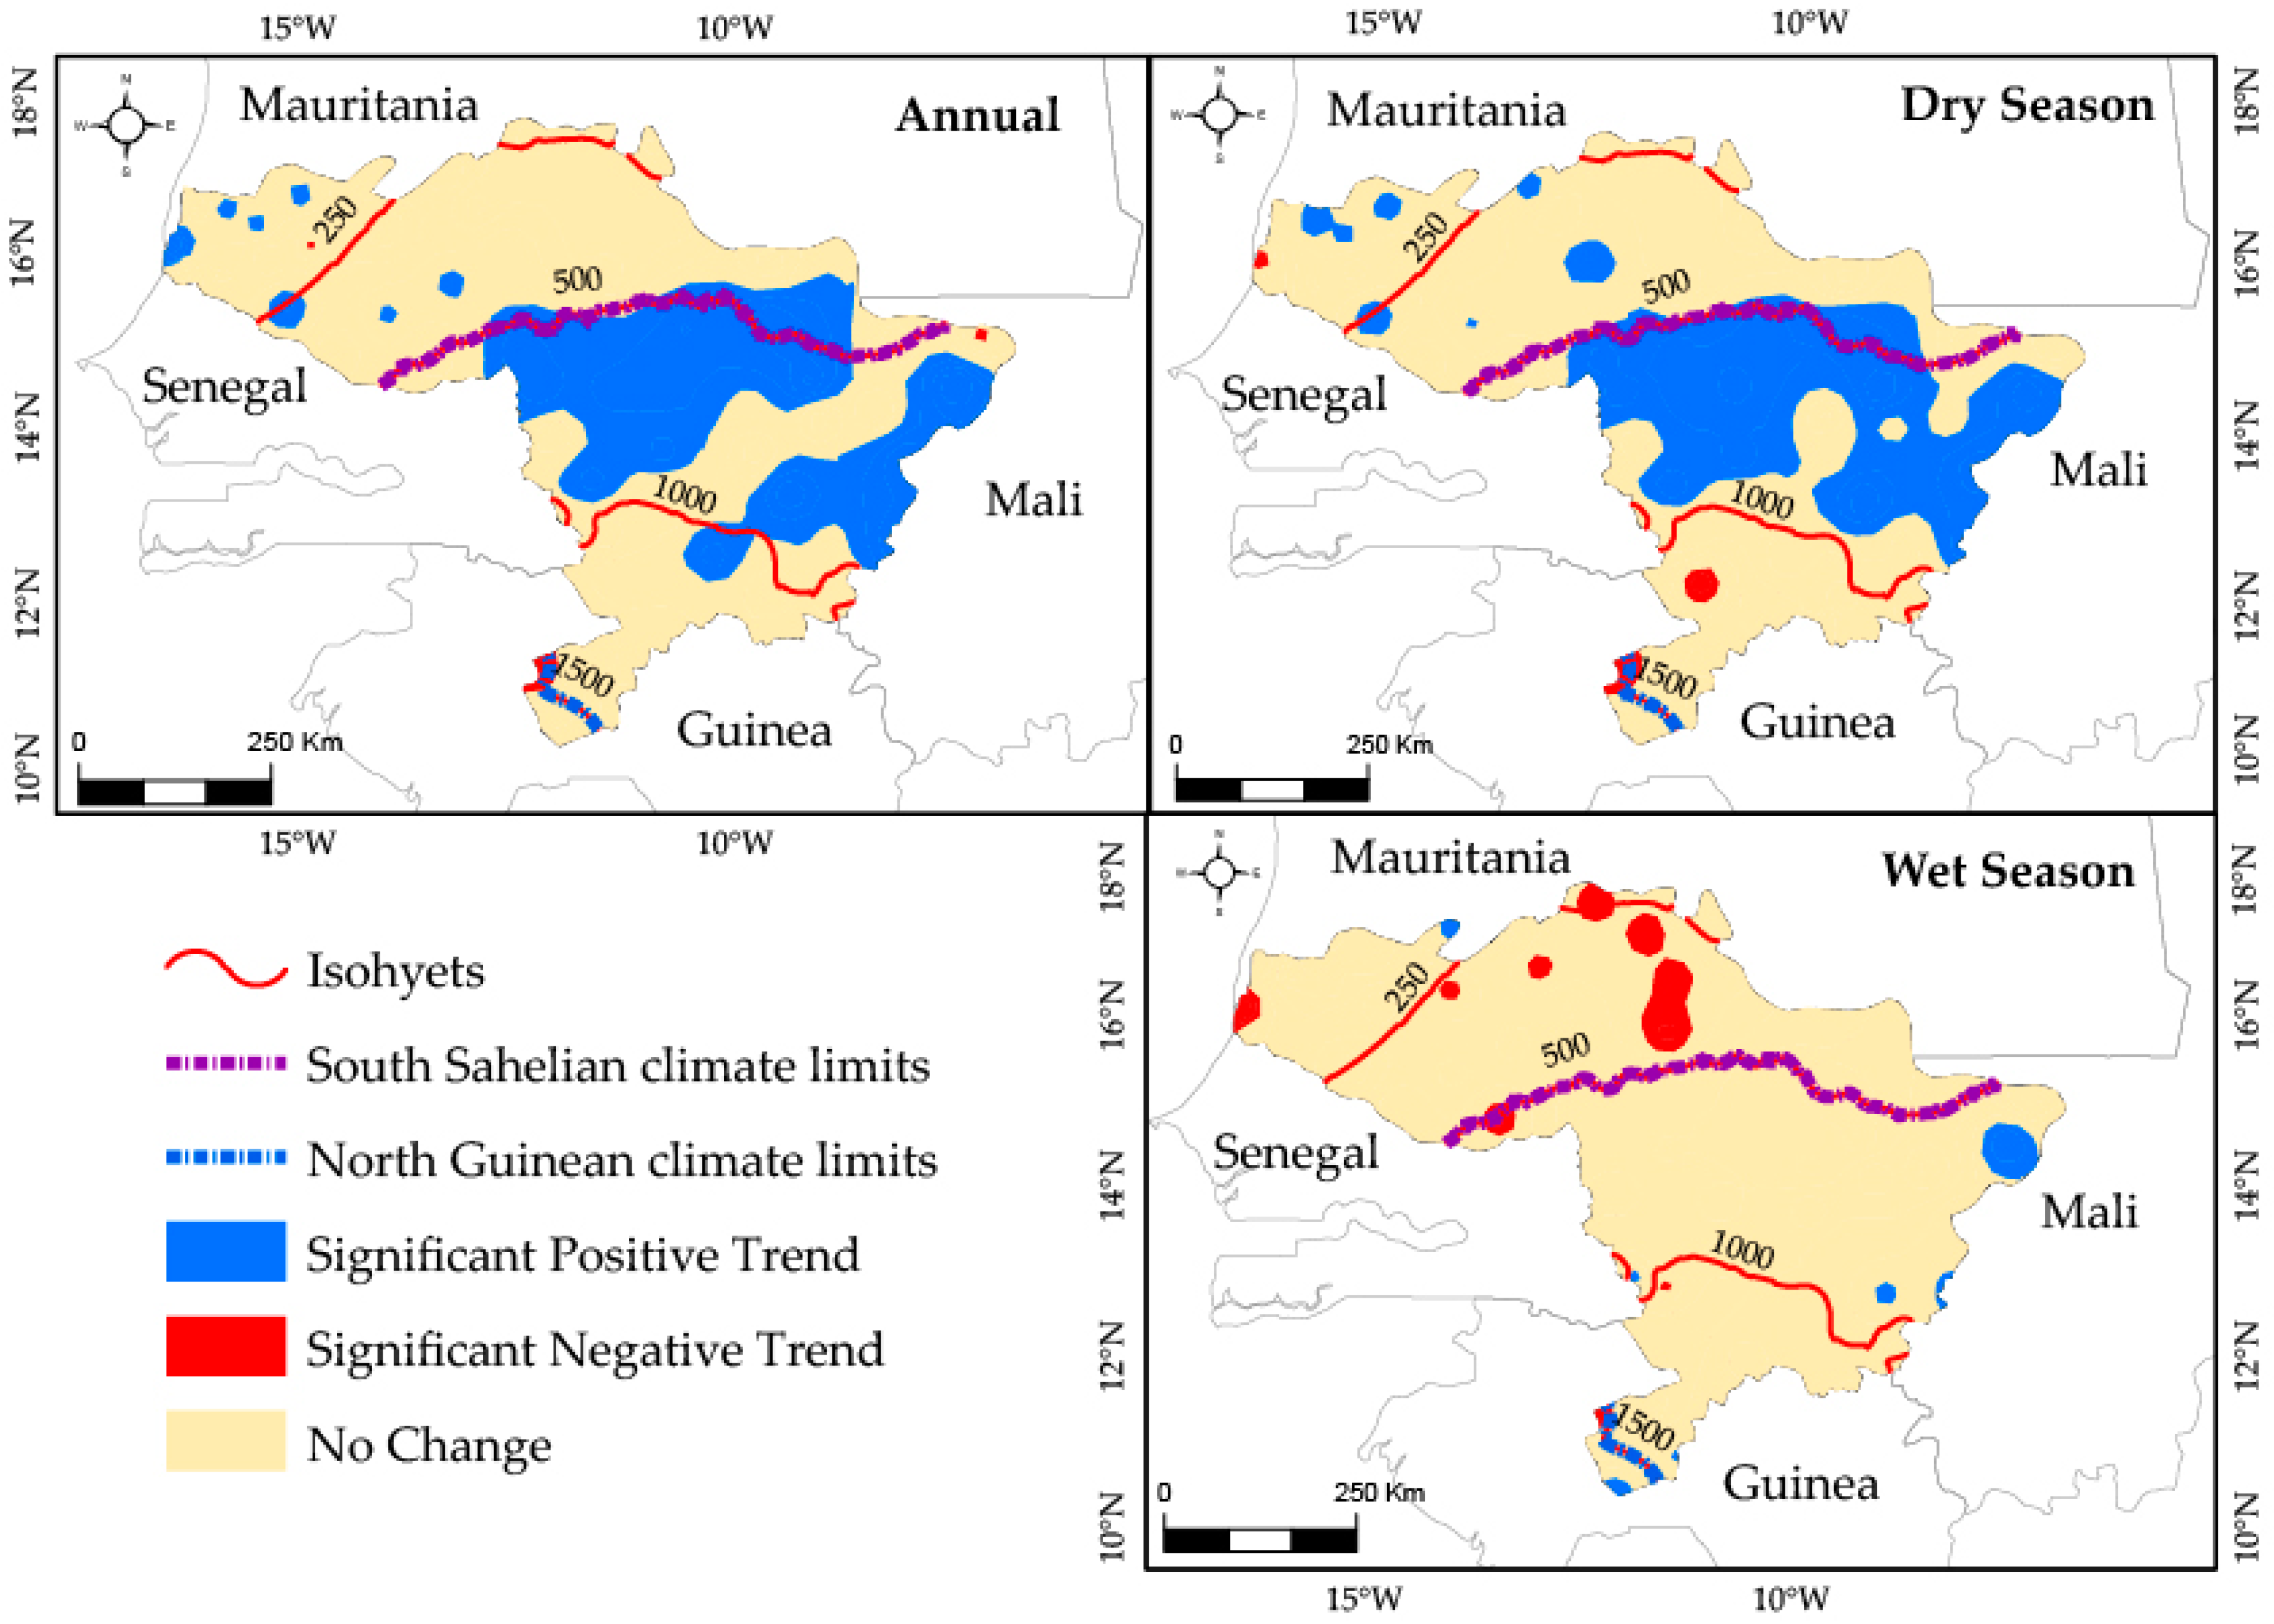
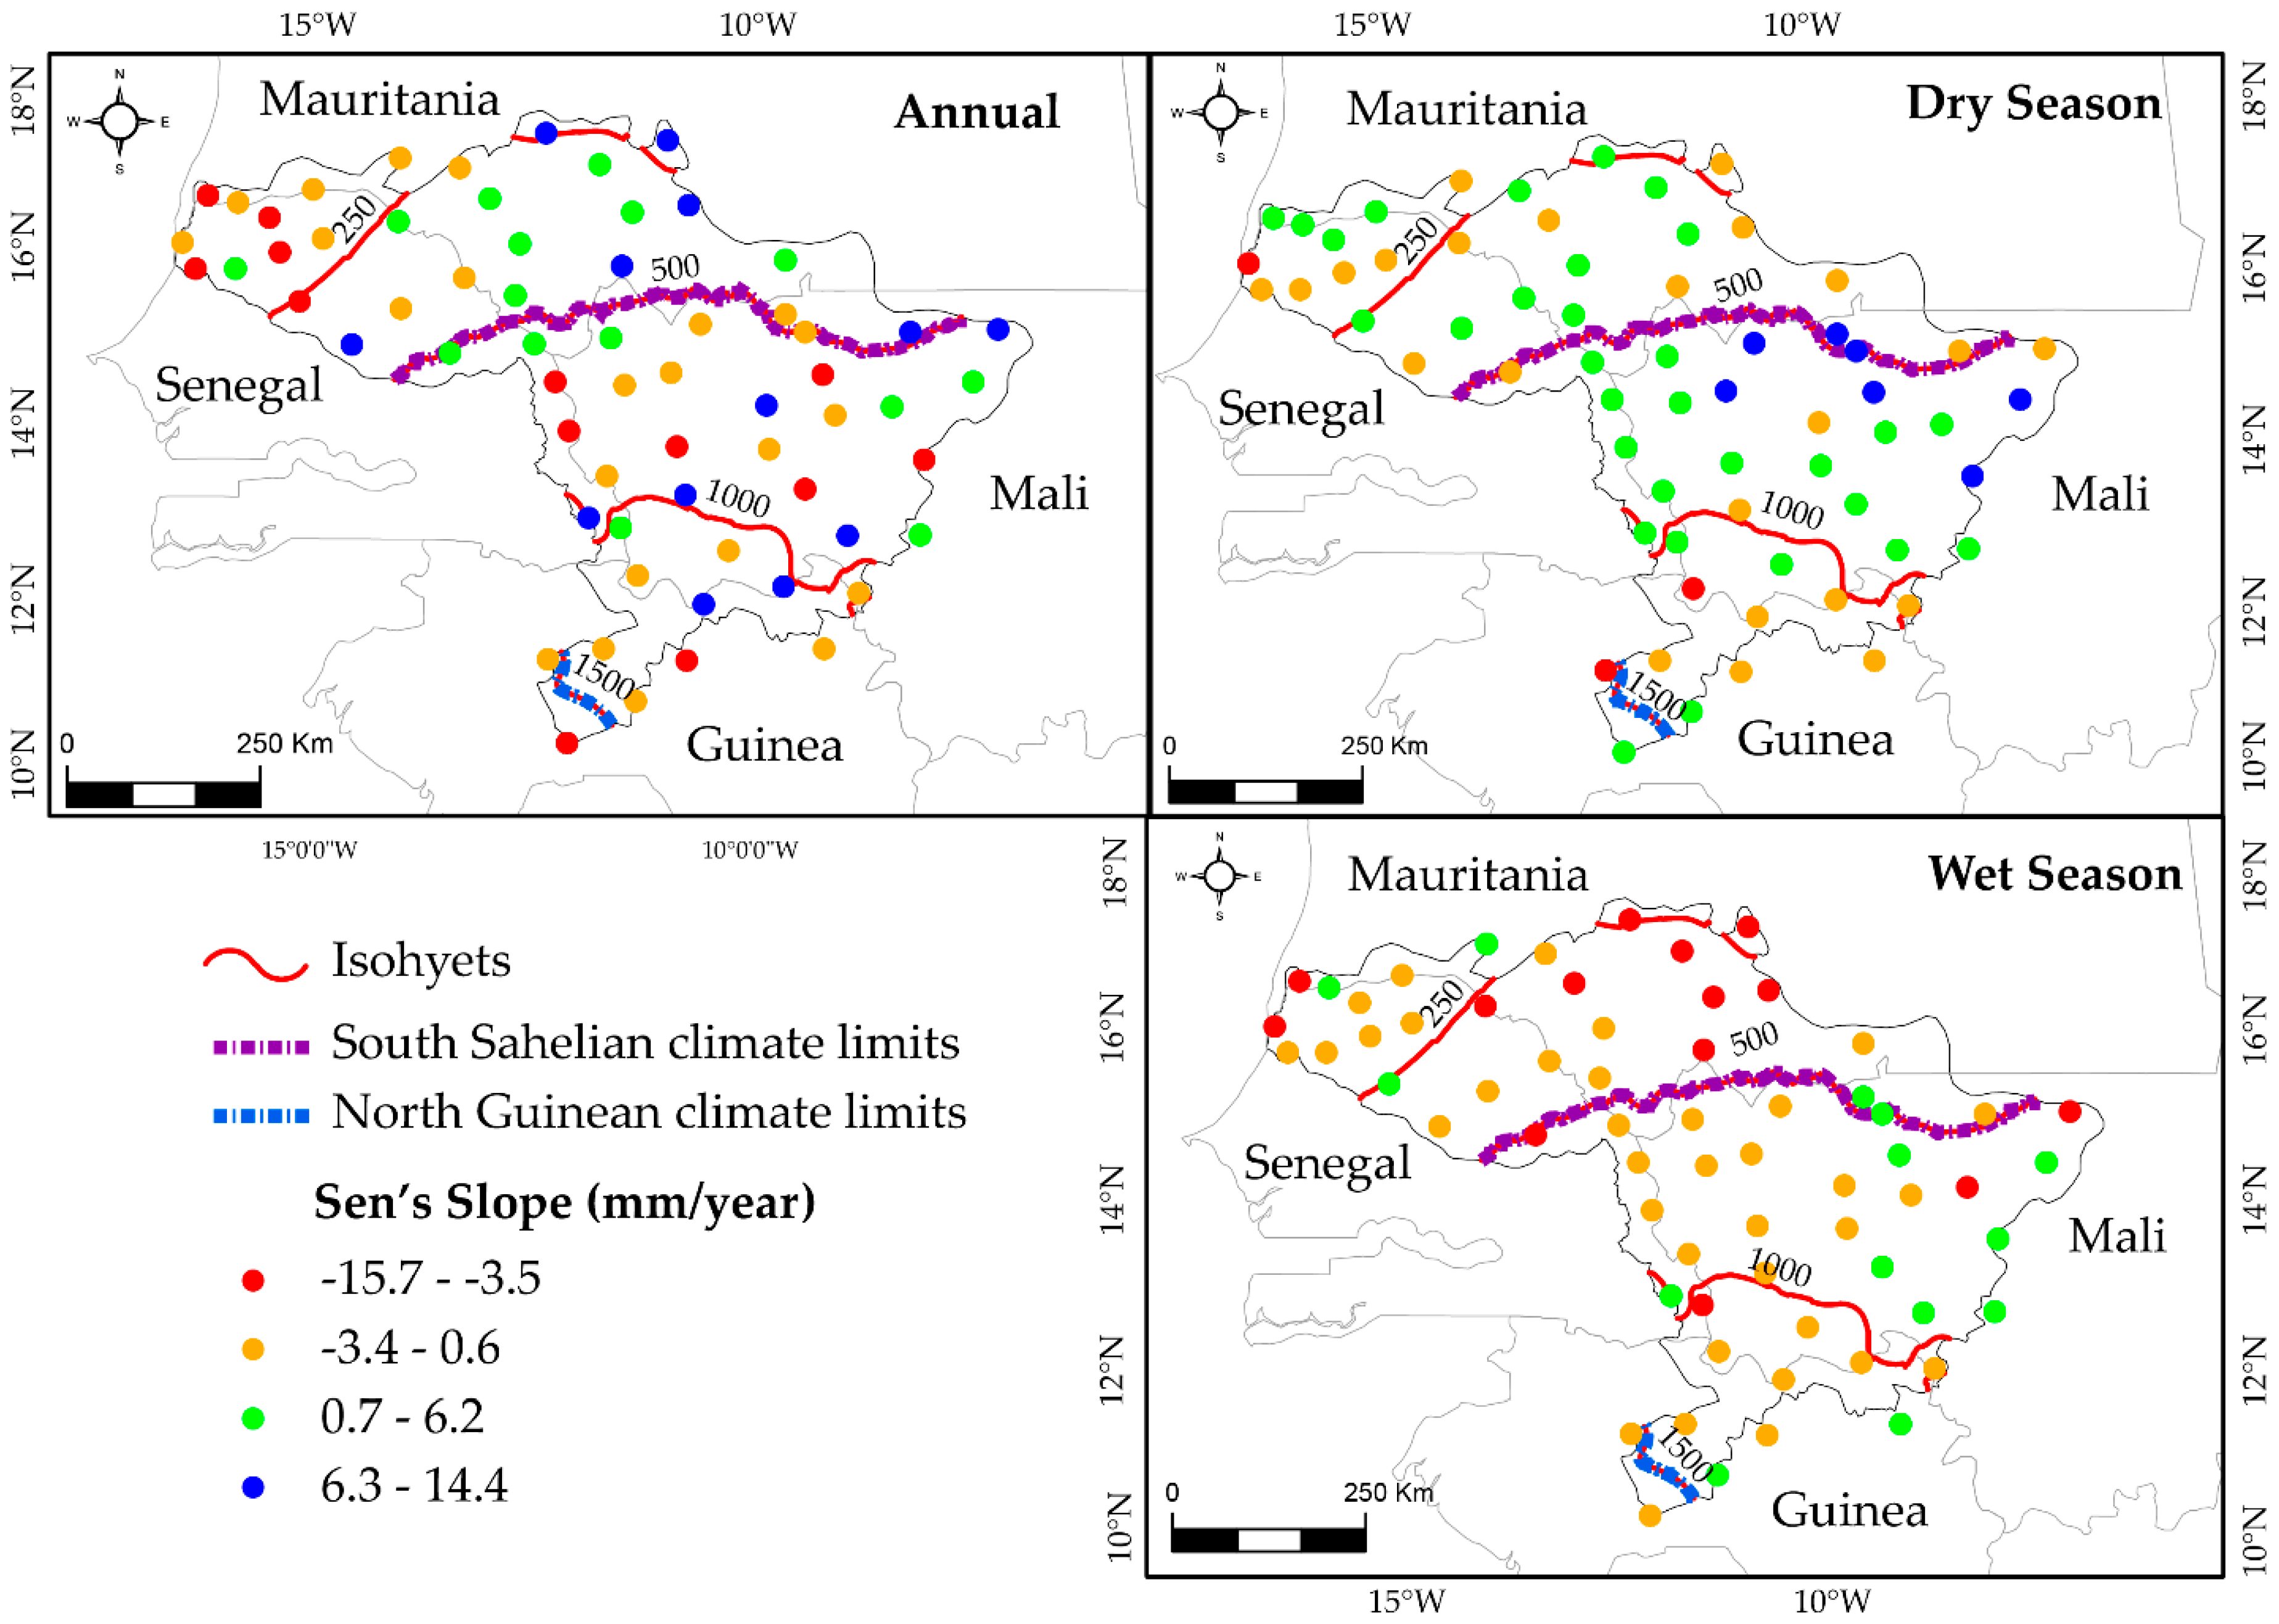
3.1.1. Trend of Annual and Seasonal Evapotranspiration

Annual and seasonal evapotranspiration trends and their amplitude are given in Figure 5 and Figure 6. Figure 5 shows that there is no spatial organization of the trend of evapotranspiration in the Senegal River basin. At the annual scale (Figure 5), 32% of the basin area shows a significant increase in ET0. On the other hand, less than 1% of watershed area exhibits a significant decrease in ET0, mainly in the Sahelian zone of basin. The amplitude of the annual ET0 variation ranges from −15.5 to 13.8 mm year−1 with an average value of 0.72 mm year−1 (Figure 6). From a spatial point of view, there has been a significant increase in evapotranspiration in the Sahelian and Sudanian zones at annual and dry season scales. However, a significant decrease in ET0 is observed locally in the Sahelian and Guinean zones. The annual ET0 increases by 1.63 and 1.53 mm year−1 in the Sahelian and Sudanian zones and decreases by 2.59 mm year−1 in the Guinean zone (Table 1). These results are in agreement with those of Abiye et al. [7] who noted an increase in ET0 of 0.02 and 0.07 mm year−1 in the Sahelian and Sudanian zones and a decrease of 0.02 mm year−1 in the Guinean zone of West Africa over 1906–2015. However, even if the trend is identical the amplitudes of variation differ significantly, revealing the intensification of ET0 changes in the past 30 years.
On a seasonal basis, 32% of the basin shows a significant positive trend in ET0 during the dry season (Figure 6). During the rainy season, a significant decrease trend is observed for 4% of the basin. 97% of this decrease of annual ET0 is localized in the Sahelian zone of basin. However, the ET0 increases significantly in the Guinean zone during the rainy season. The magnitude of the trend in seasonal evapotranspiration varies slightly from −8.36 to −9.27 mm year−1 and from −6.56 to 5.32 mm year−1 during the dry and rainy seasons, respectively. Overall, the analysis of annual and seasonal trends in ET0 shows contrasting results (decline and increase) depending on the climatic zones of the basin. These results are in line with those of Abiye et al. [7] who showed: (i) a significant positive trend in ET0 in the Sahelian and Sudanian areas and (ii) a negative trend in the Guinean area of West Africa, but this study reveals how these trends have intensified over 1987–2017. The positive trend of ET0 found in this study is in agreement with the studies of Azzizadeh and Javan [62], which showed a significant increase in annual and seasonal ET0 in the northwest of Iran in a semi-arid climate.

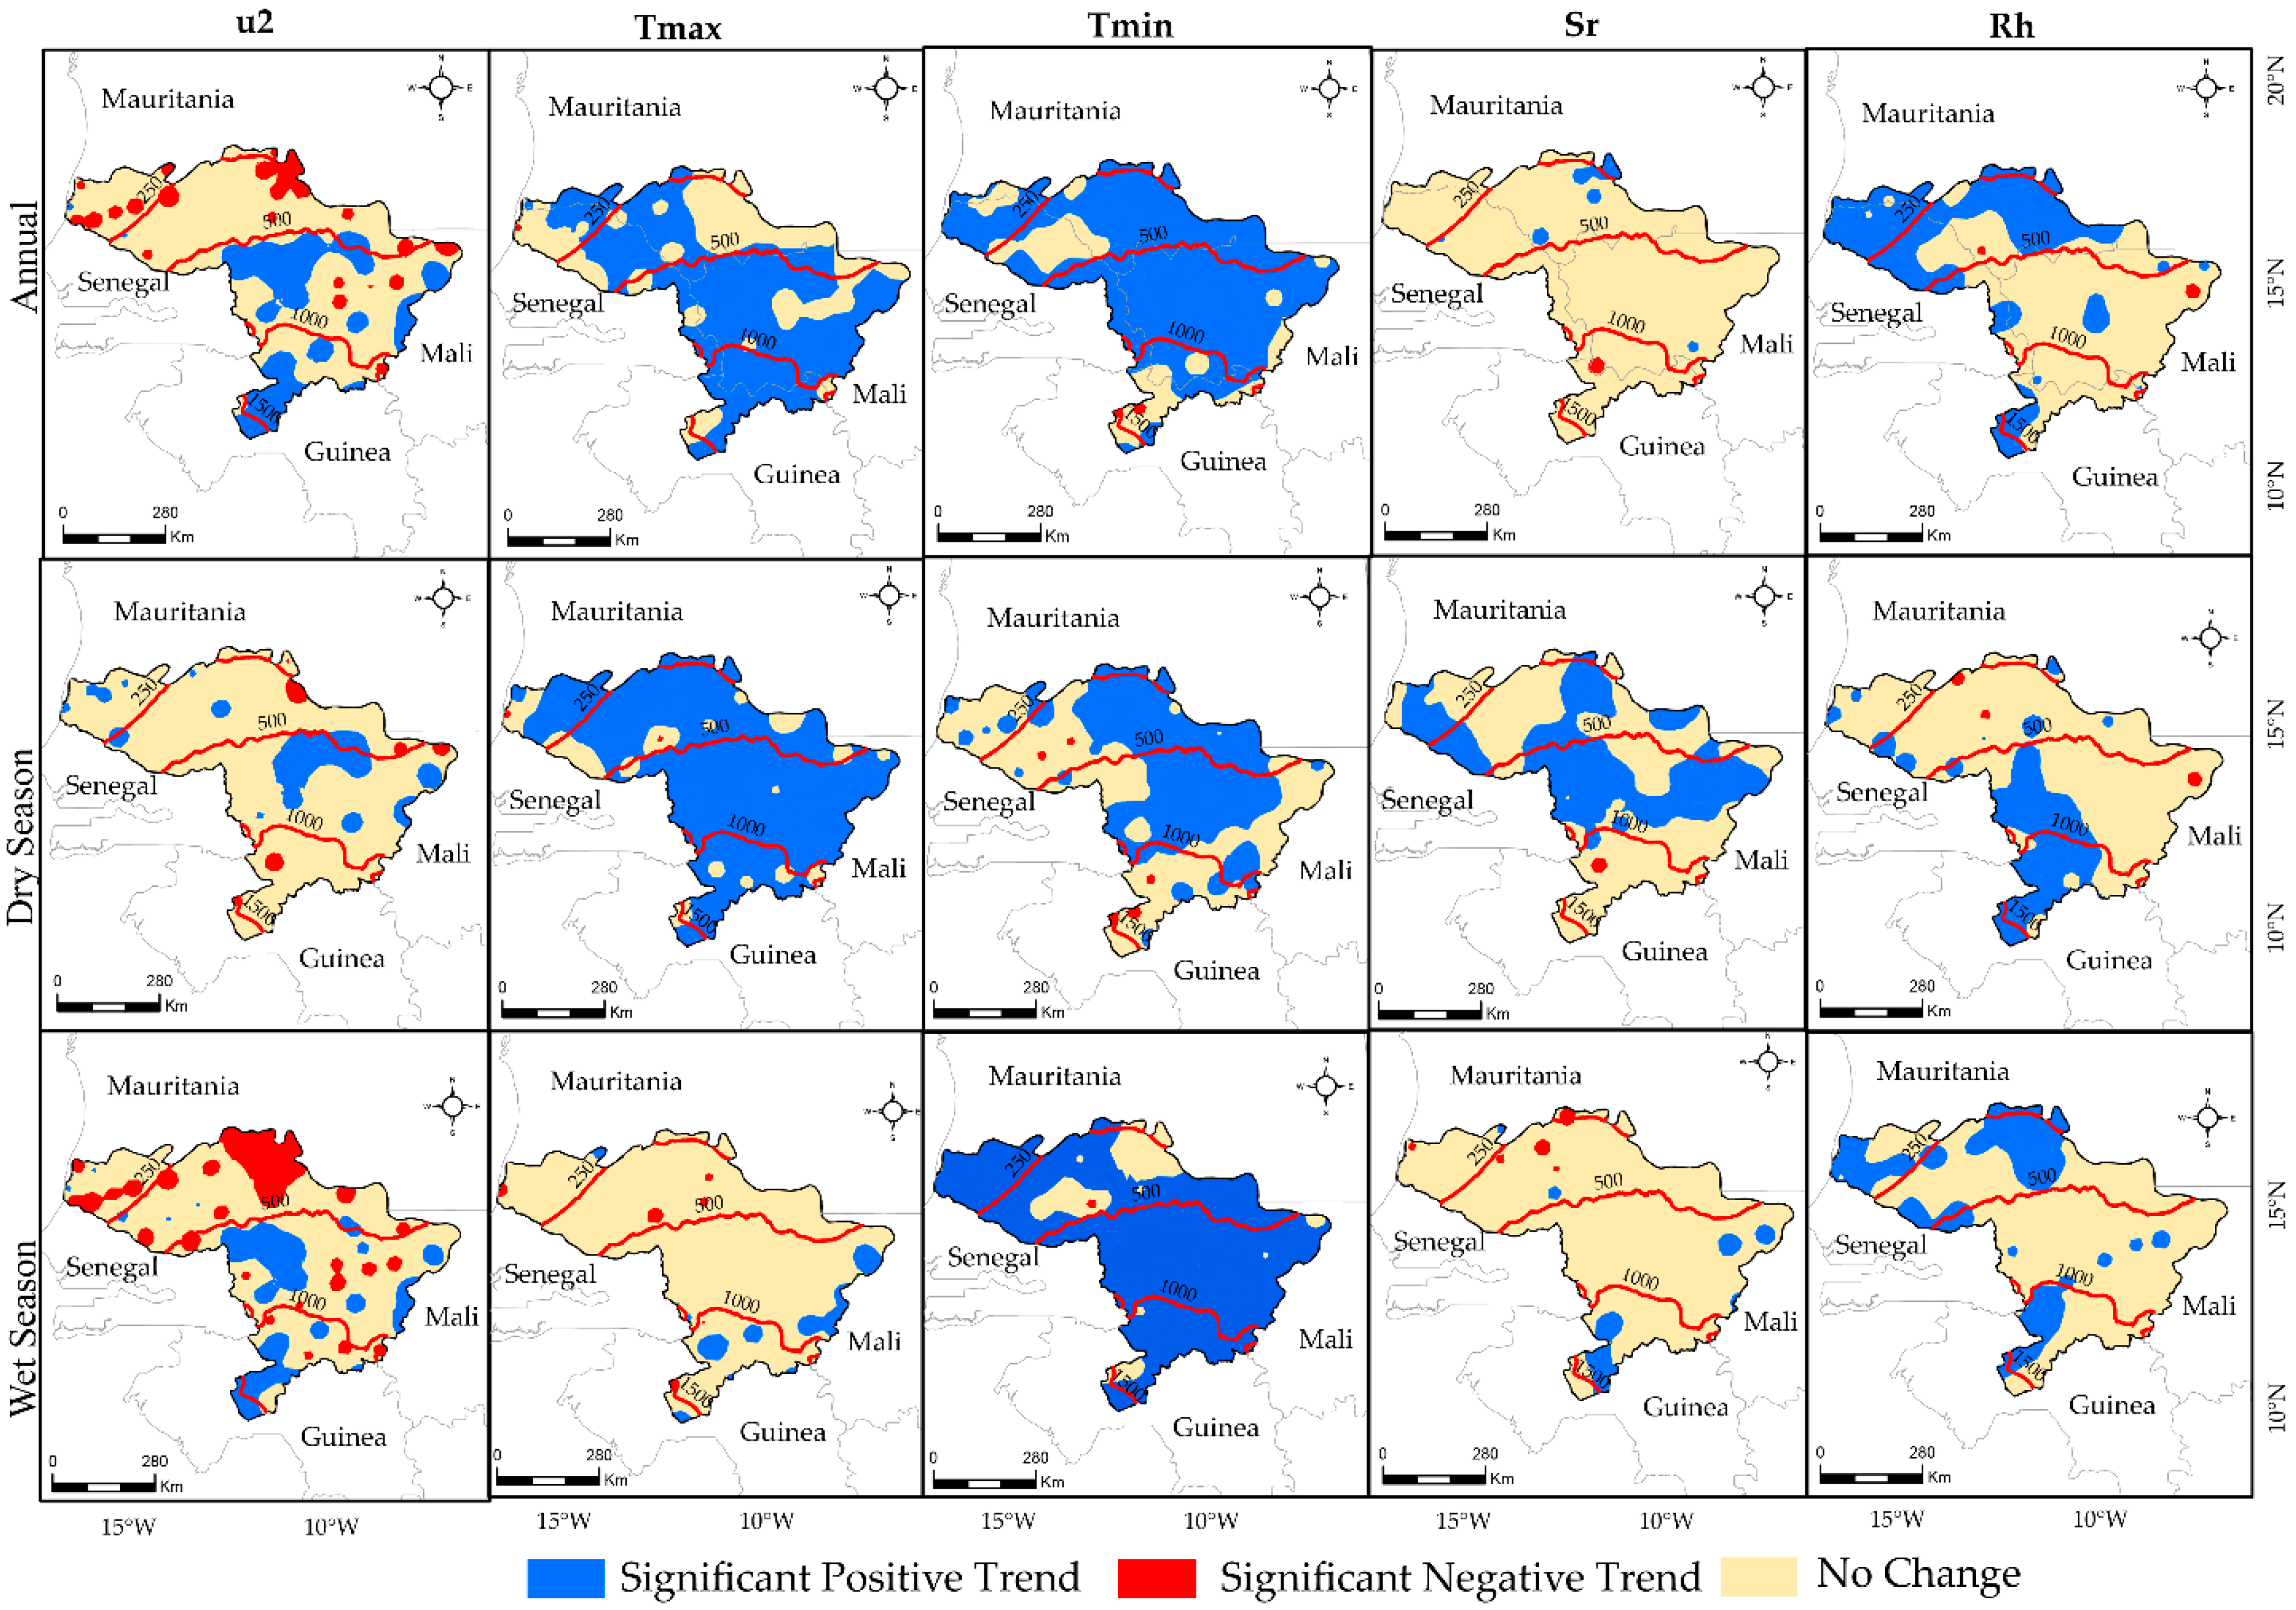
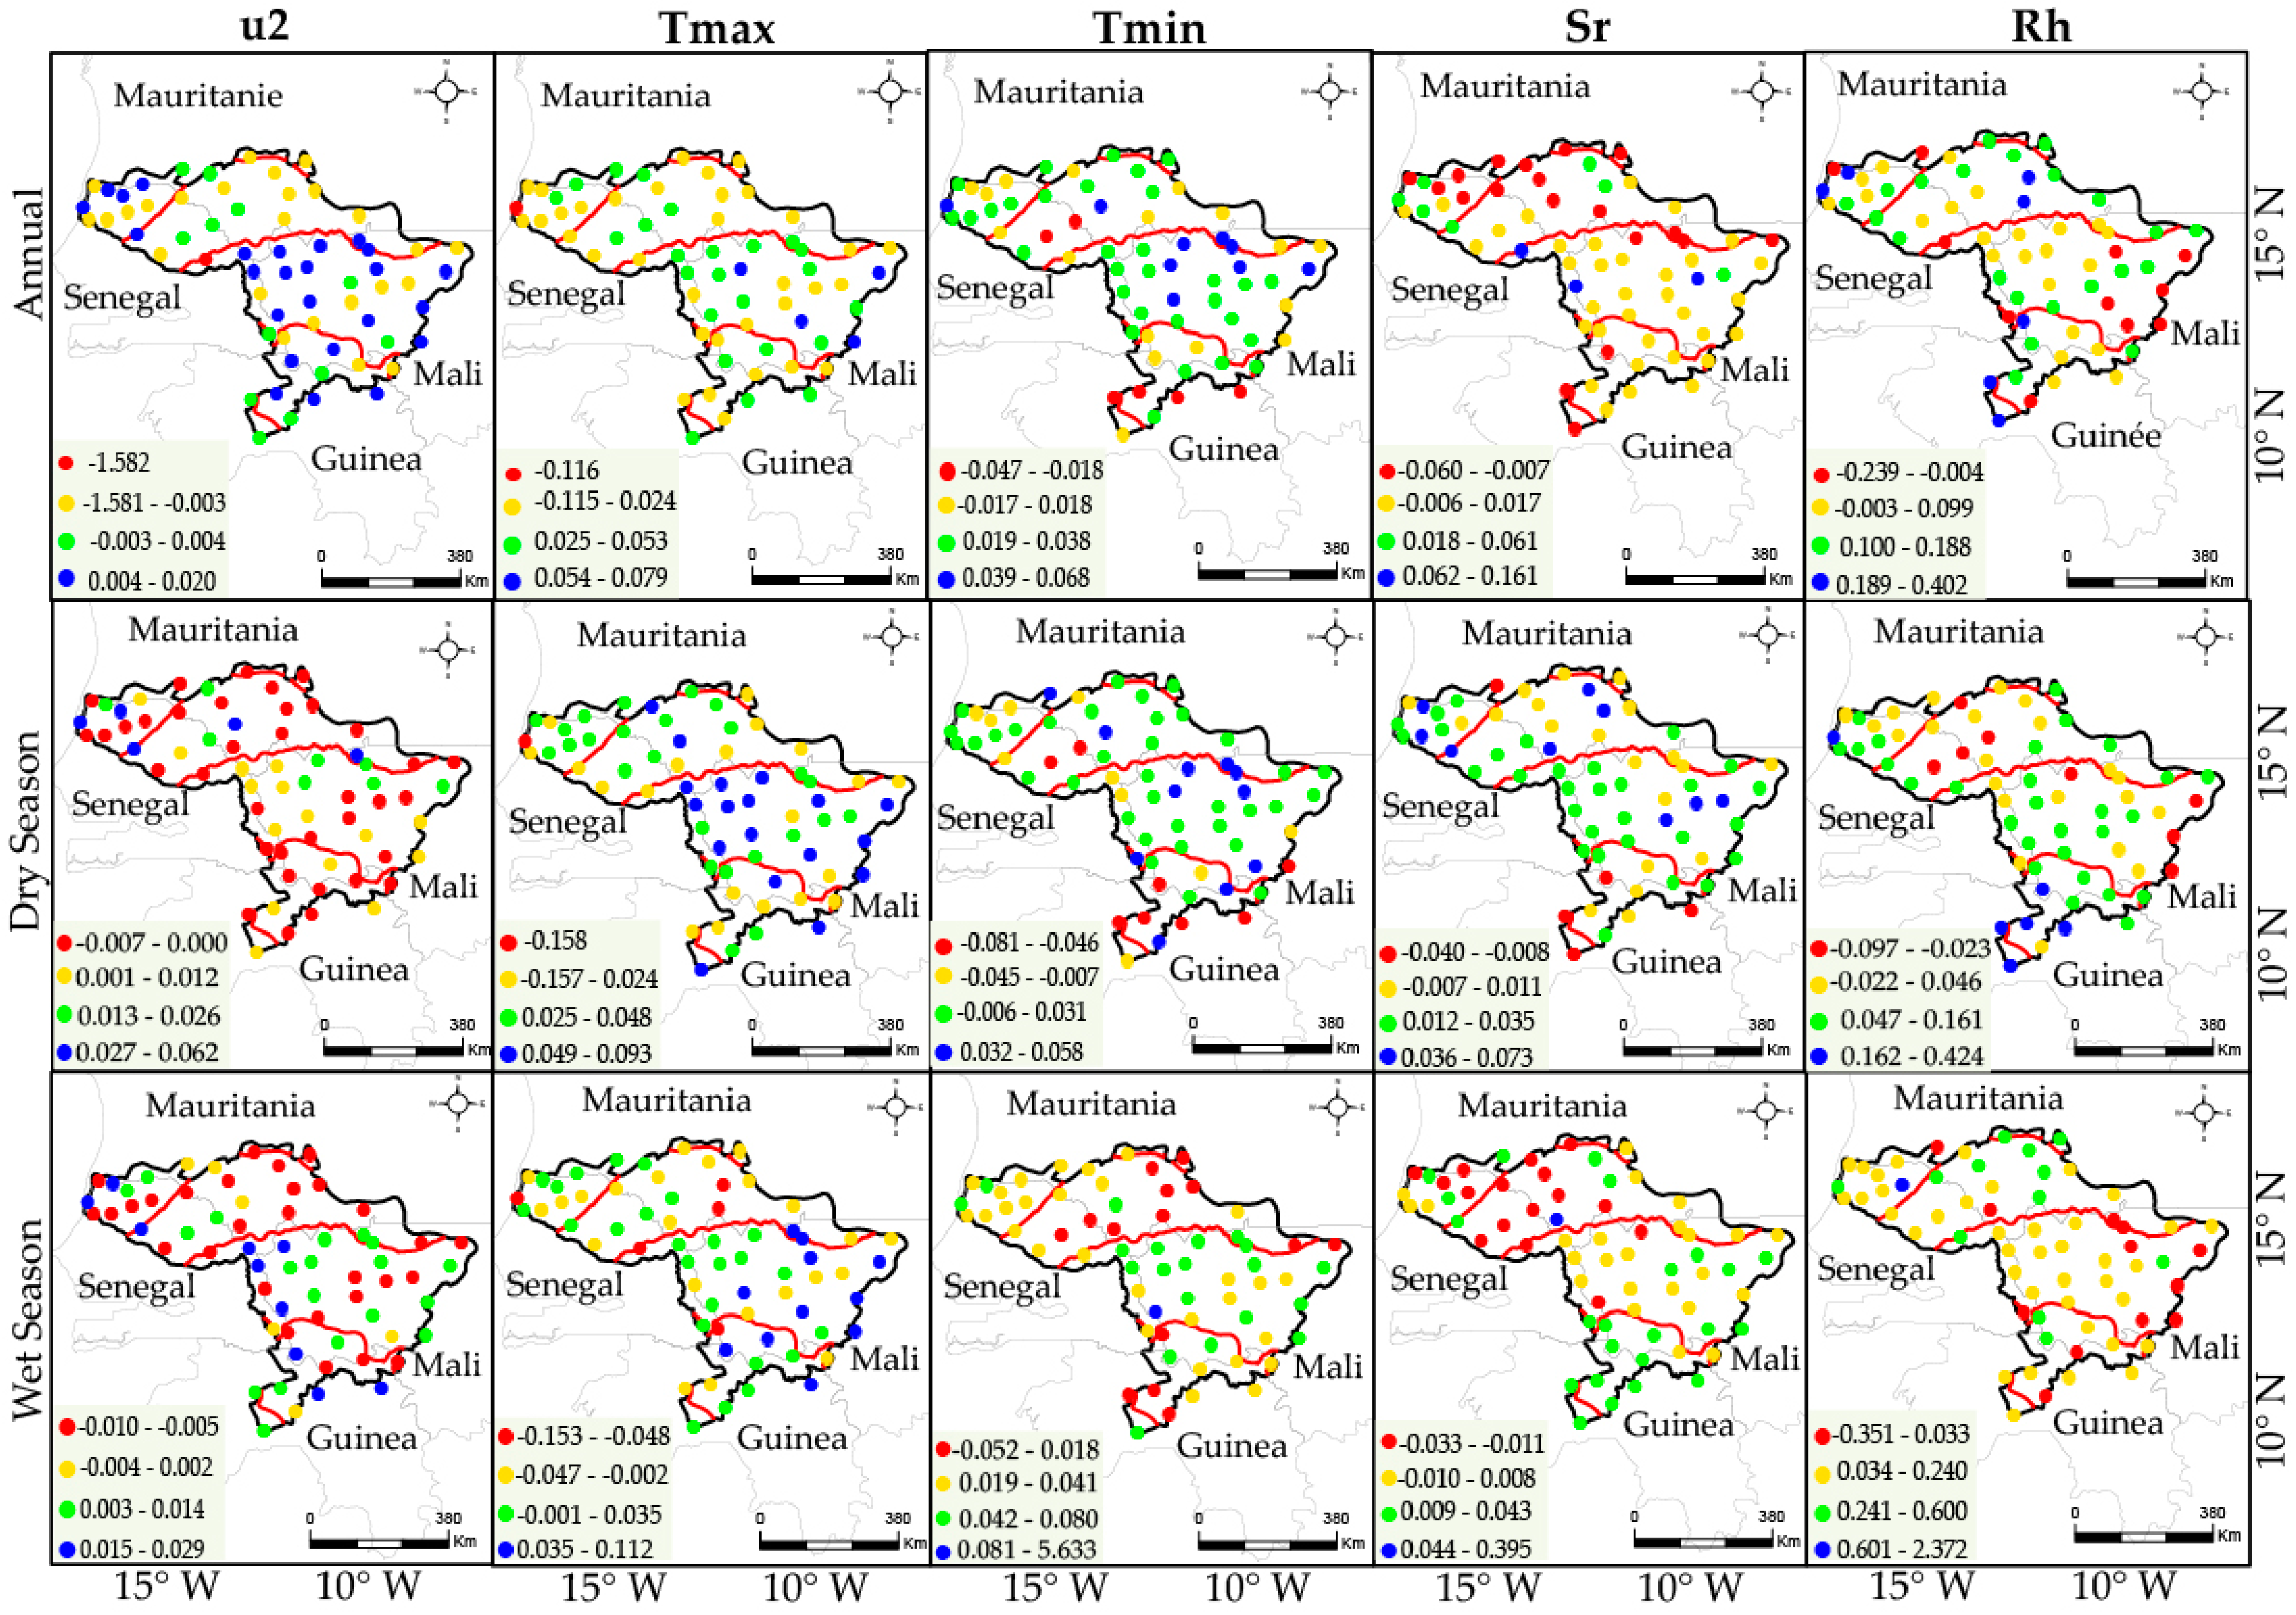
3.1.2. Trend of Annual and Seasonal Climatic Variables

Figure 7 gives the spatial distribution of the Z values of the Mann-Kendall test of the climatic variables on the annual and seasonal scales. On an annual scale, temperature (max and min), solar radiation (Sr) and relative humidity (Rh) generally show an increasing trend (Figure 7). In fact, maximum and minimum temperatures increase significantly for 68% and 81% of the basin area and relative humidity increases significantly for 37% of the area. Solar radiation stays unchanged for 97% of the basin; while, the wind speed (u2) shows a significant negative trend for 8% of the basin. From a spatial point of view, Figure 8 gives the distribution of the Sen slopes of the different climatic variables (wind speed, maximum and minimum temperature, solar radiation and relative humidity) and Table 1 gives the mean values of the Sen’s slopes of the climatic variables according to climatic zones. In the Sahelian and Sudanian zones the maximum and minimum temperature increase from 0.009 °C–0.03 °C year−1. Relative humidity and solar radiation increase from 0.05%–0.12% year−1 and from 0.01 MJ·m−2 d−1 to 0.02 MJ·m−2 d−1 year−1, respectively. On the other hand, the wind speed decreases by up to −0.05 m year−1.
During the dry season, maximum and minimum temperatures increase respectively for 88% and 52% of the basin. Relative humidity and solar radiation increase respectively for 25% and 43% of the basin. Wind speed decreases significantly for only 2% of the area. During the wet season, 16% of the basin show a significant negative trend in wind speed. Minimum temperature and relative humidity continue to increase, but a significant rising trend in maximum temperature and solar radiation is noted for 6% and 5% of the basin, respectively. From a spatial point of view, a decrease in wind speed, maximum temperature and solar radiation is noted in the Sahelian zone during the rainy season. In the Guinean zone, a decrease in radiation of 0.01 MJ·m−2 d−1 is observed during the dry season (Table 1).
Overall, wind speed is the only variable that decreases significantly on an annual scale and during the rainy period. Similar results have been obtained by Zeng et al. [69] who observed a significant decrease in wind speed during the period 1960–2018 in southwest China. In addition, Oguntunde et al. [70] also found a significant decrease in wind speed over the 1973–2008 period in Nigeria. McVicar et al. [71], based on a review of 148 studies carried out around the world, noted an average decrease in wind speed of −0.017 m year−1. The decrease in solar radiation found in this study has also been observed in Mongolia [72] and in the Yangsu and Lijiang basins in China [13,56].
Overall, the upward trend in annual evapotranspiration can be explained by the increase in temperatures (maximum and minimum). This confirms at a more detailed scale the results of Abiye et al. [7] who note that temperature is the key factor behind the variation in evapotranspiration in West Africa. Tabari et al. [37] also obtained similar results in Iran. These results confirmed a direct relationship between evapotranspiration and climate change. Indeed, rising temperatures increase evapotranspiration rates and can worsen the arid conditions of an environment and accelerate the process of desertification [73]. The increase in evapotranspiration also increases agricultural water needs, raising the cost of irrigation and potentially affecting agricultural production and yields [74].
Despite the overall upward trend, a localized decline in ET0 is observed in some zones in the Sahelian and Guinean areas. This negative trend can be explained by the increase in relative humidity and the decrease in solar radiation and wind speed. Lu et al. [29] also obtained similar results in the province of Yangsi in China. For them, the decrease in the duration of sunshine and the wind speed are the main causes of the decrease in evapotranspiration. Bian et al. [72] also noted that wind speed and radiation are the main factors behind the decline in ET0 in Mongolia. This phenomenon of declining evapotranspiration despite an increase in temperature is called the “evaporation paradox”. After the hydrological paradox highlighted in the Sahel by Descroix et al. [75,76], we are also confirming the paradox of evaporation [1,7,29,77] which is not only localized in the Sahelian zone but extends to the Guinean zone of the Senegal River basin. This paradox is more visible in the Sahelian zone where the high temperatures should be accompanied by a generalized increase in evapotranspiration. This phenomenon has recently been observed by Bian et al. [72] in arid and semi-arid areas of Mongolia.
The decrease in ET0 noted especially in some areas of the Sahelian zone highlights the notion of “paradox of evaporation” which has been debated by certain authors [1,13,29,76]. Two main phenomena explain this decline in ET0: (i) the decrease in the duration of sunshine and solar radiation (Global Dimming) which promotes the reduction of the energy available for evapotranspiration [77] and (ii) the reduction in wind speed (Wind Stilling) which causes a decrease in evapotranspiration [24]. Increased cloud cover, concentration of aerosols and pollutants are the primary factors in the global dimming of the atmosphere [77]. Surface roughness and increased plant cover may also be reasonable explanations for the decrease in wind speed [11]. In addition, anthropogenic activities may play a role in ET0 [78]. Indeed, hydraulic infrastructures, land use by agriculture and irrigation practices can contribute to the variation of evapotranspiration [4]. The increased precipitation may also be a plausible explanation for the decrease in evapotranspiration [25].

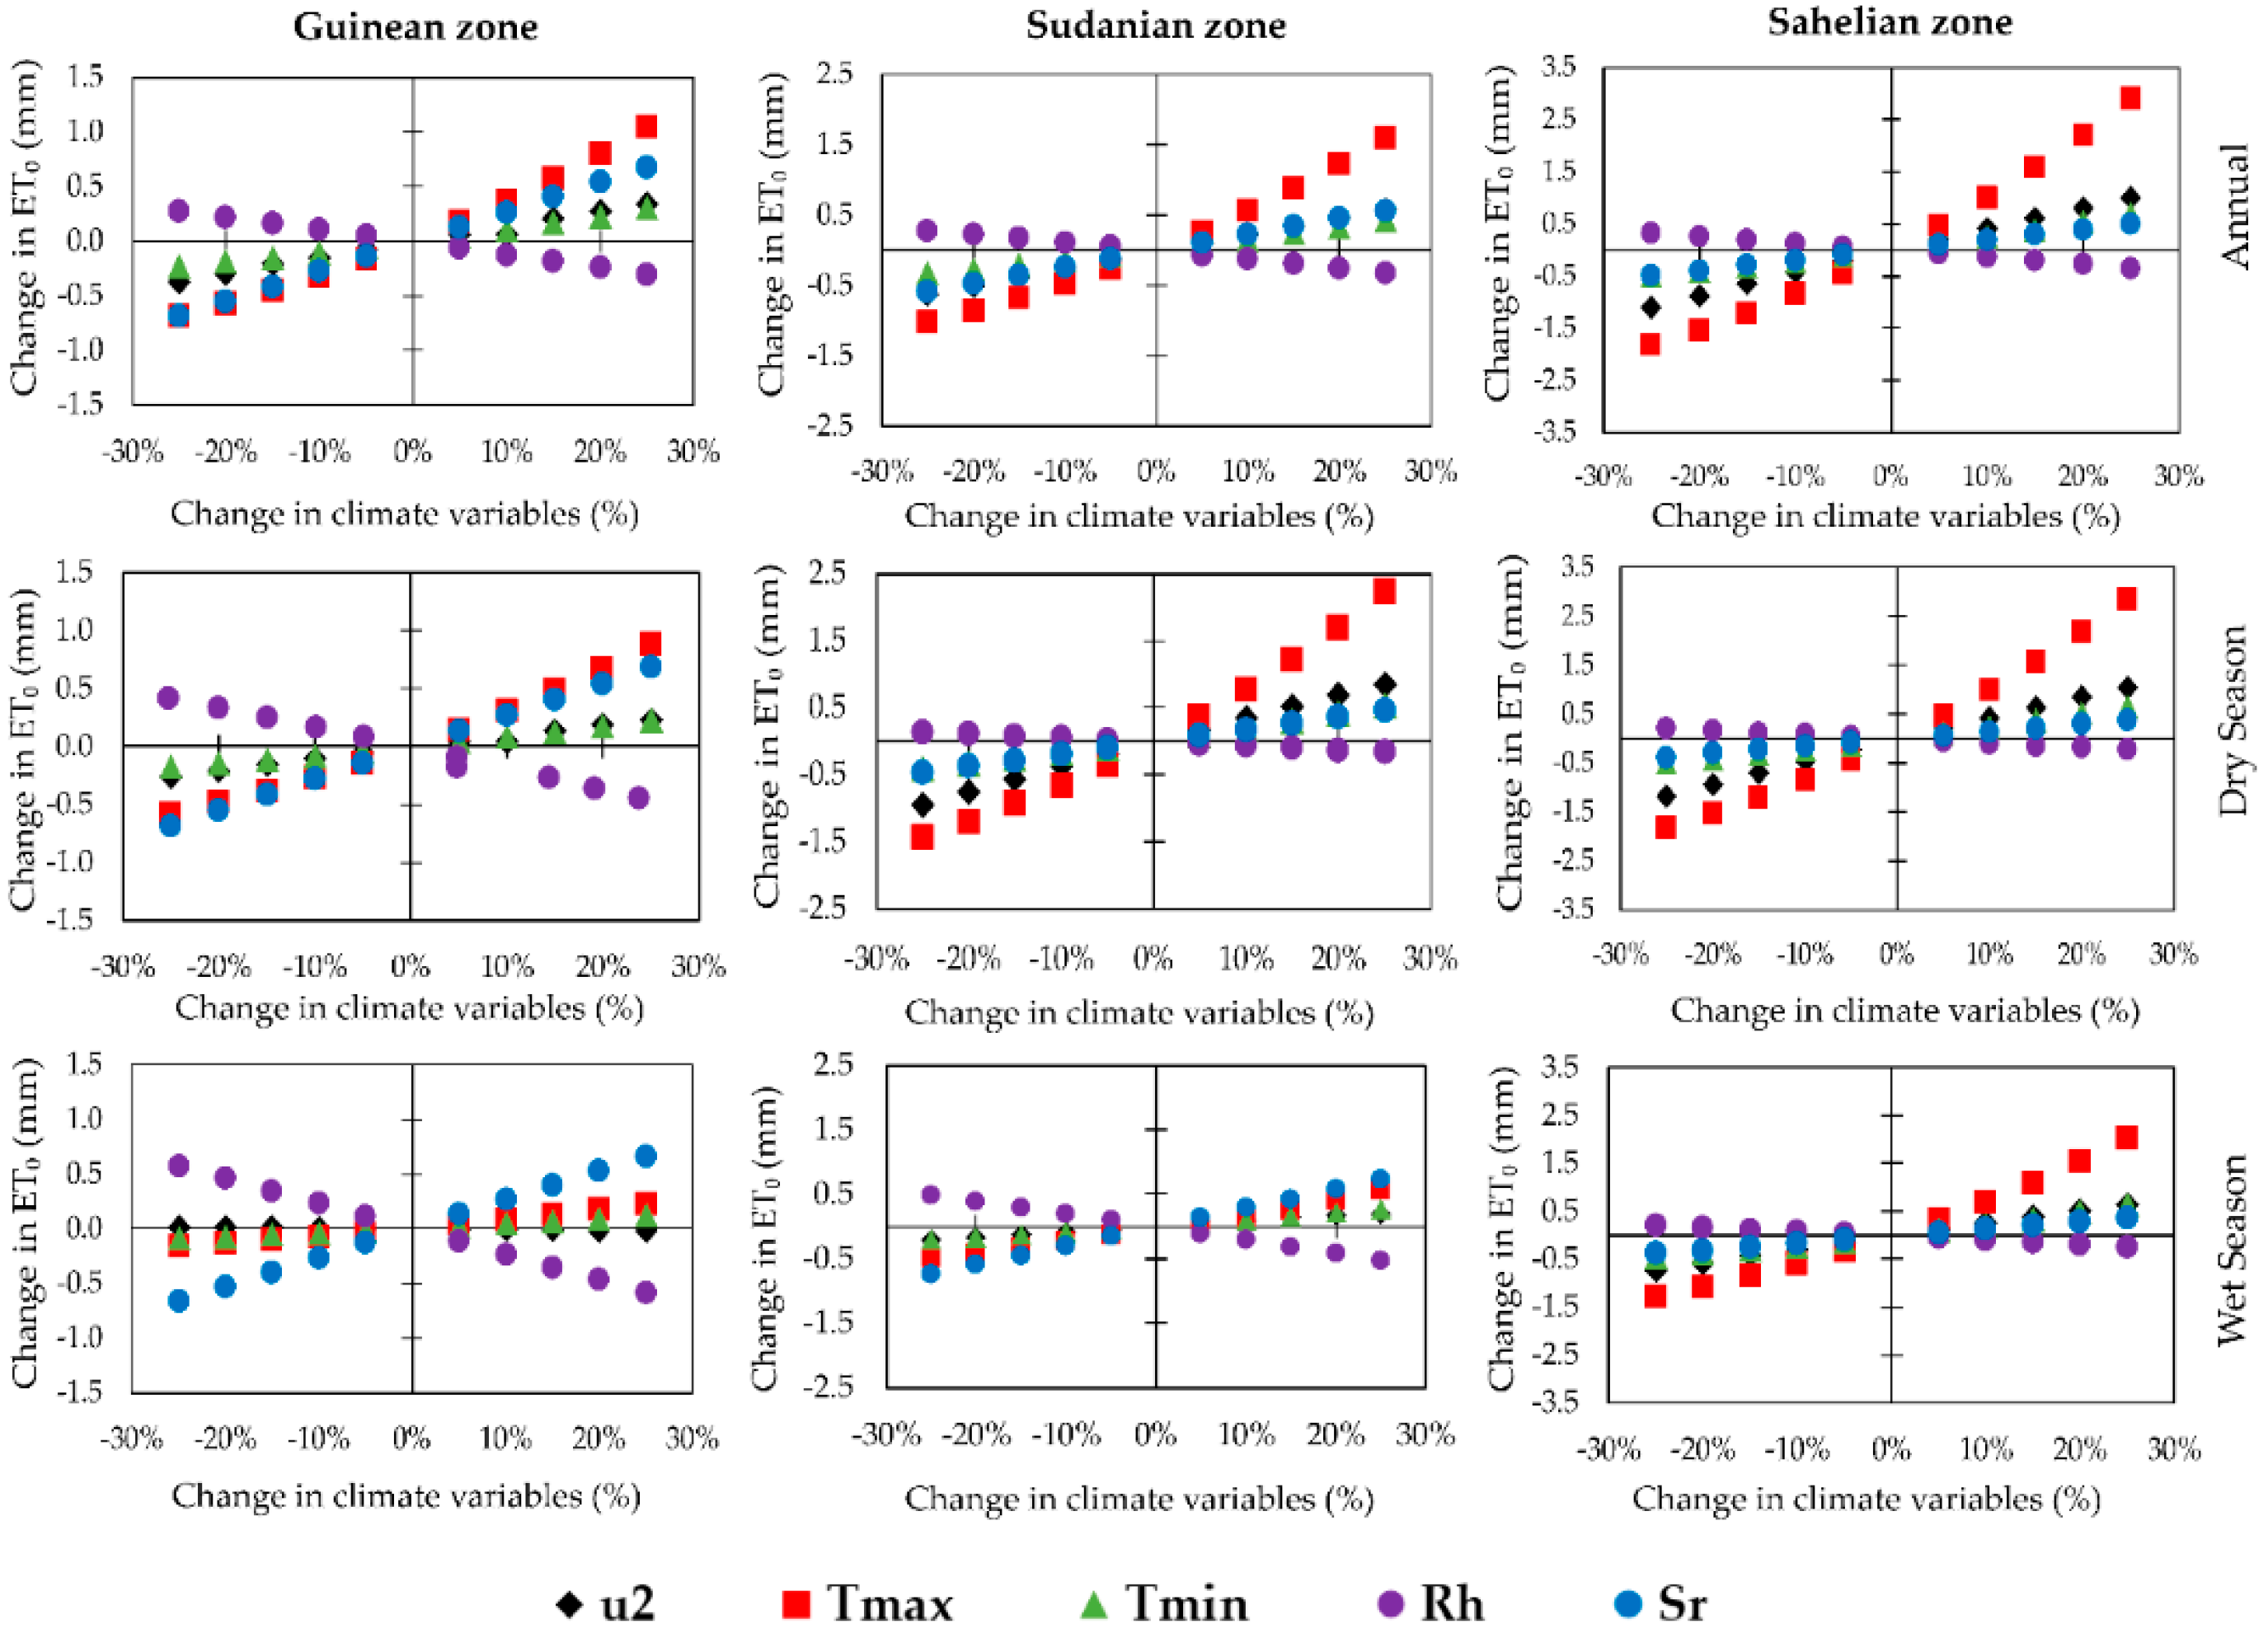
3.2. Sensitivity of Evapotranspiration to Climatic Variables

Figure 9 shows the relationship between evapotranspiration and climatic variables. The results show that temperatures (maximum and minimum), wind speed and radiation have a positive influence on evapotranspiration. The increase in these variables leads to an increase in evapotranspiration. On the other hand, an increase in relative humidity leads to a decrease in ET0. In addition, the influence of climatic variables on ET0 varies depending on the climatic zones of the basin. In fact, in the Sahelian and Sudanian zones, evapotranspiration is more sensitive to maximum temperature, wind speed and solar radiation, respectively. In contrast, in the Guinean zone, maximum temperature, relative humidity and solar radiation have more influence on ET0. For example, on an annual scale, an increase of 5% to 25% of the maximum temperature leads to an increase in ET0 from 0.48 mm to 2.89 mm in the Sahelian zone, from 0.37 mm to 2.24 mm in the Sudanian zone and by 0.15 mm to 0.89 mm in Guinean climate. Conversely, increasing the relative humidity from 5% to 25% favors a decrease in evapotranspiration from 0.06 mm to 0.38 mm according to climatic zones. These results are in line with those of Li et al. [11] who showed that relative humidity is the only variable that has a negative influence on ET0 in the Huai basin in China.

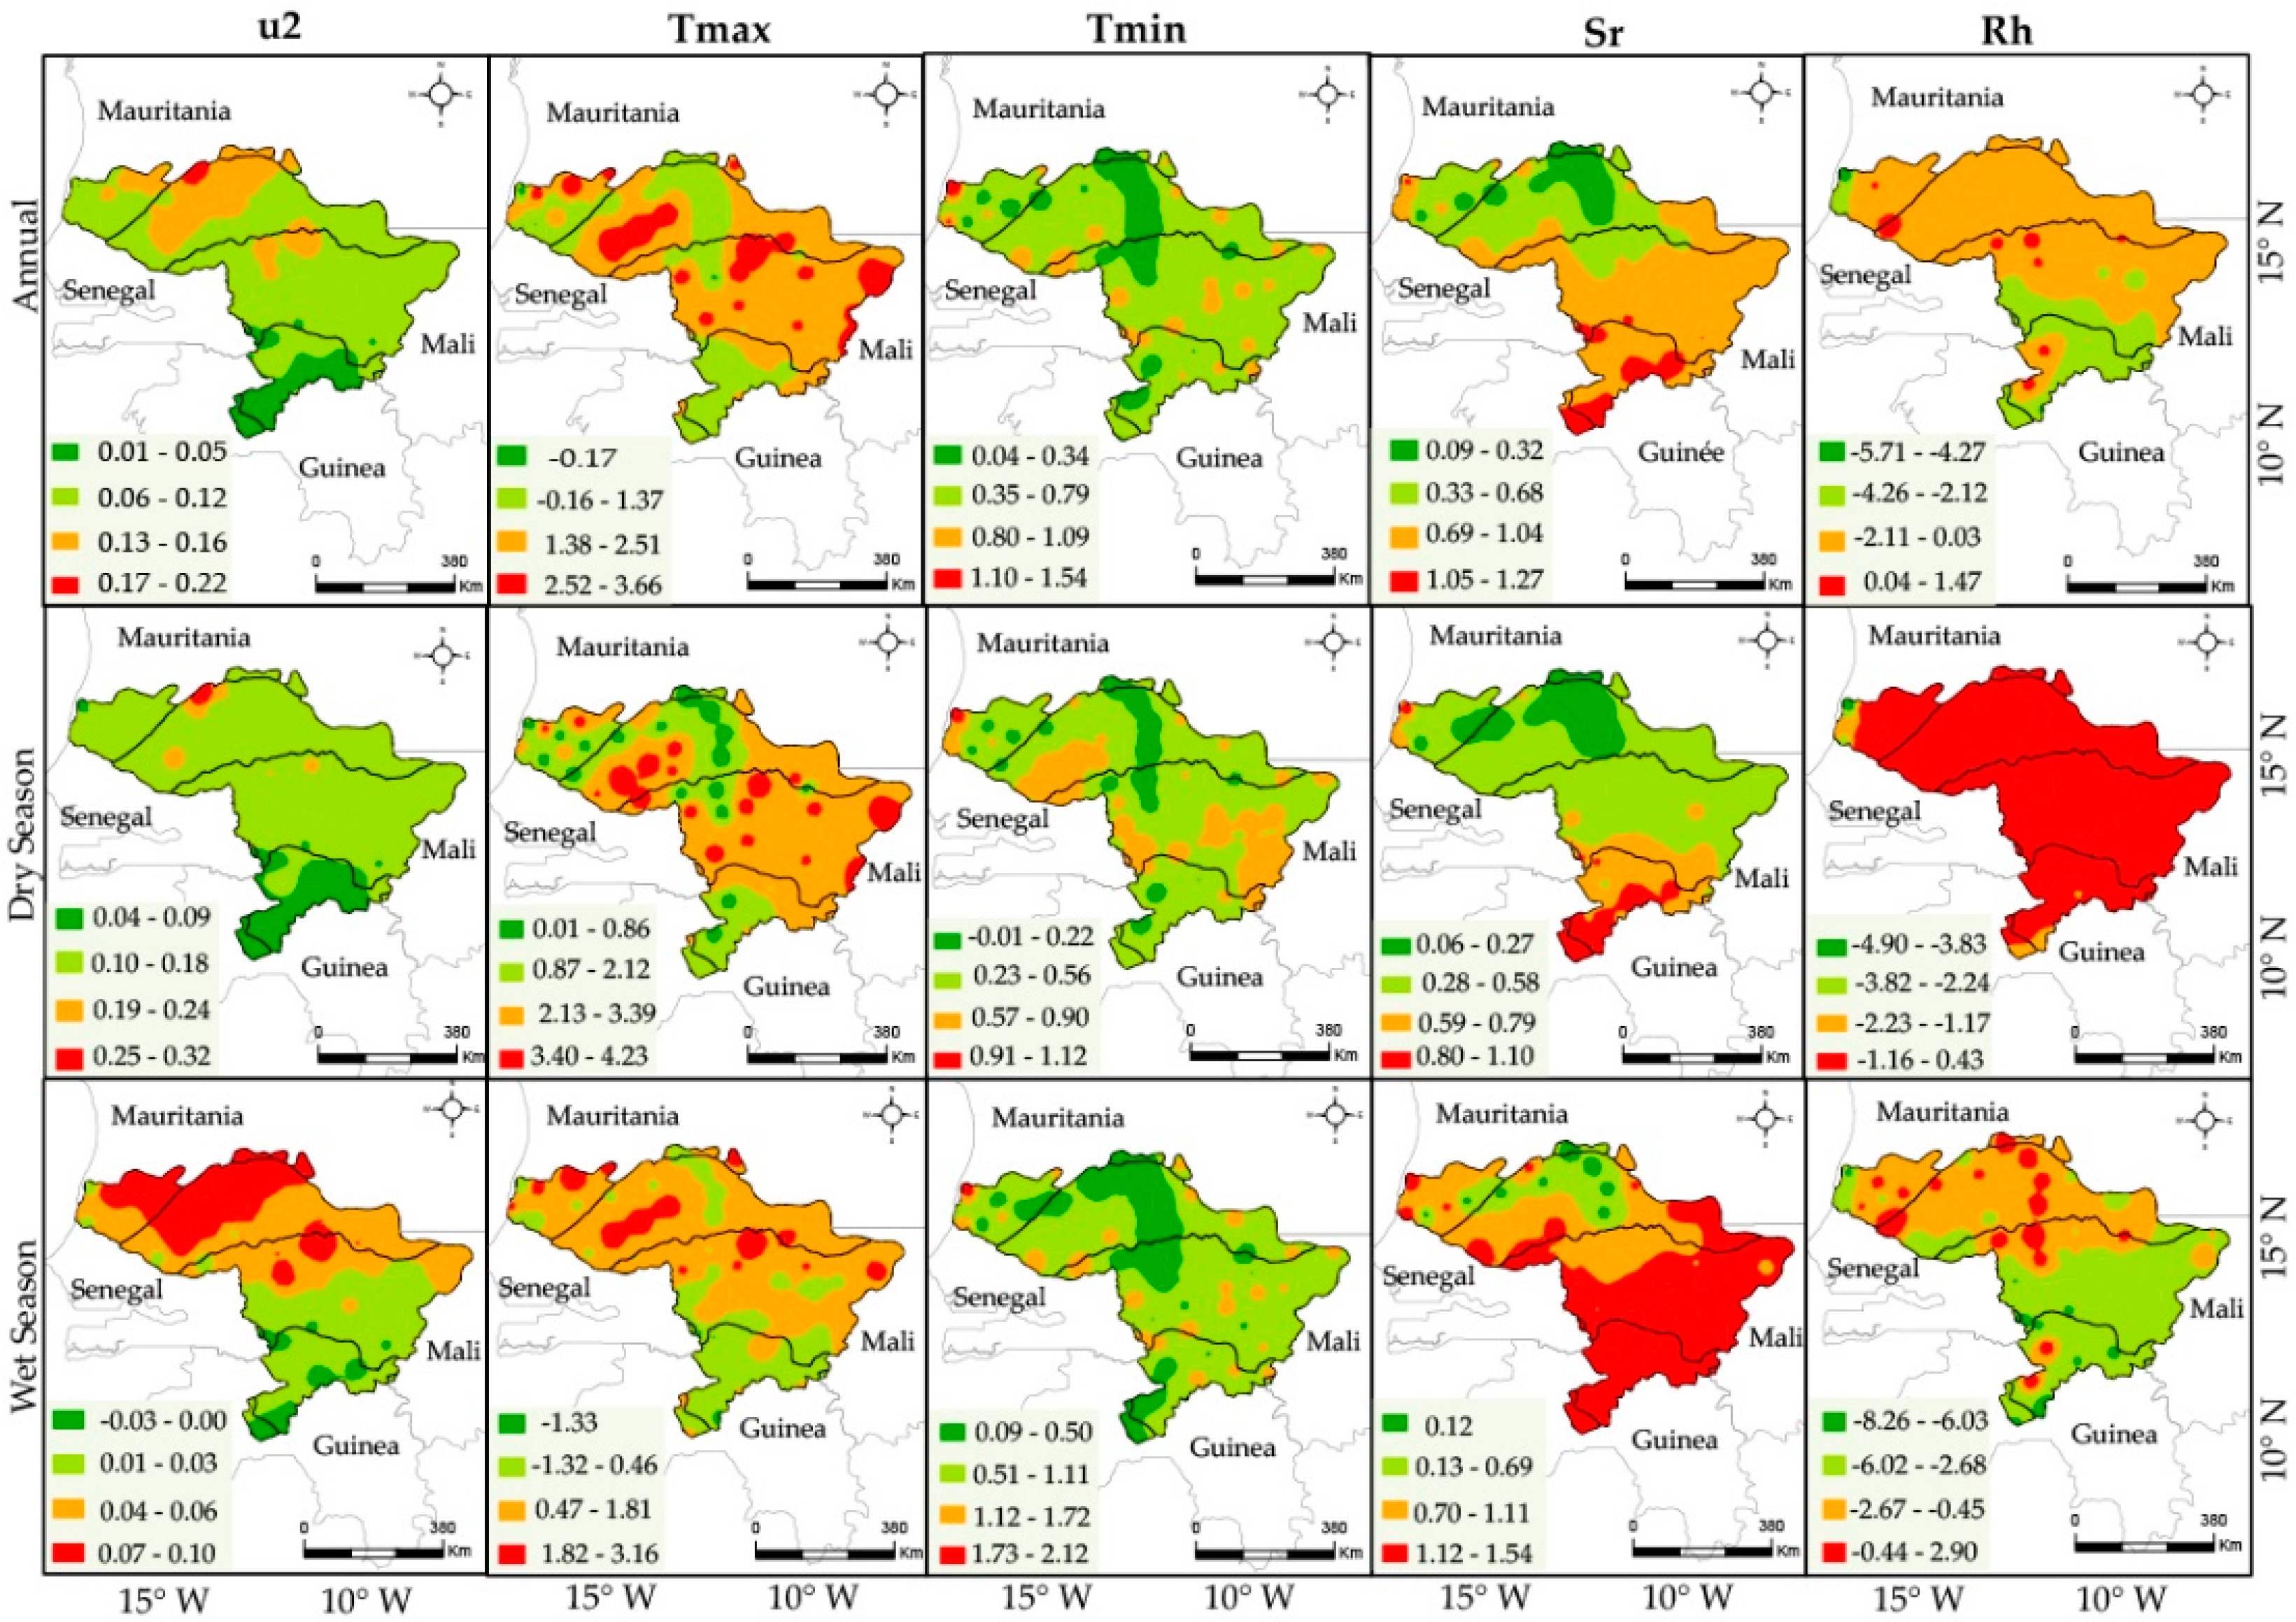
3.3. Spatial Distribution of Annual and Seasonal Sensitivity Coefficients

Figure 10 shows the spatial distribution of the mean annual and seasonal sensitivity coefficients of evapotranspiration to climatic variables. Overall, relative humidity has the highest sensitivity coefficients followed by maximum temperature, solar radiation, minimum temperature and wind speed. From a spatial point of view, the influence of maximum temperature is more significant in the Sahelian and Sudanian zone. The impact of wind speed on ET0 decreases from Sahelian to Guinean zone with the coefficients varying from −0.03 to 0.22 (Figure 10). Solar radiation and minimum temperature have sensitivity coefficients between 0.09 and 1.54 and between 0.04 and 2.12, respectively. The influence of solar radiation on ET0 is greater in the Guinean area and during the rainy season. These results are in agreement with works in the Senegal River basin [79] which showed that the methods which integrate the wind speed and the temperature are more efficient for the estimation of the ET0 in the Sahelian and Sudanian zones of the Senegal River basin. And the methods integrating solar radiation and relative humidity are more robust in the wetter Guinean domain.
Table 2 gives the average sensitivity coefficients of the different variables depending on the climatic zones. Overall, relative humidity, maximum temperature and solar radiation are the variables that have the greatest influence on evapotranspiration in the Senegal River basin.
Relative humidity has sensitivity coefficients ranging from −0.40 to −4.93, the maximum temperature from 0.63 to 1.88 and solar radiation 0.35 to 1.28 depending on the climatic zones. Thus, relative humidity is the climate variable that most influences ET0 in the Senegal river basin. This finding is not in line with those of Abiye et al. [7] which suggested that ET0 is most influenced by maximum temperature in West Africa. The wind speed has the lowest coefficients, less than 0.16.
Generally, it should be noted that the influence of climate variables on ET0 varies from one region to another [80]. Indeed, Gong et al. [31] showed that reference evapotranspiration is more sensitive to relative humidity, solar radiation, temperature and wind speed in the Yangzi Basin in China. Li et al. [11] also noted that relative humidity is the variable that has the most influence on ET0 in the Huai Basin in China. These results are confirmed in this study where ET0 is more sensitive to relative humidity, maximum temperature and solar radiation. In addition, Rohina et al. [81] found that solar radiation, maximum temperature and wind speed have more influence on ET0 in Iran. Ndiaye et al. [82] have argued that ET0 is more sensitive to changes in solar radiation, maximum temperature and wind speed in Burkina Faso. Estévez et al. [32] observed that evapotranspiration is more sensible to air temperature, relative humidity and solar radiation respectively, in the semi-arid climate of Andalusia (Southern Europe). Irmak et al. [30] noted that in arid and semi-arid regions, ET0 is more sensitive to wind speed and to saturation deficit. This is not fully verified in this study where the wind speed has the lowest coefficients. Furthermore, mutual effects between climate variables can influence ET0. An increase in temperature combined with a drop in relative humidity increases the saturation deficit; which results in an increase in evapotranspiration [83]. This finding is confirmed by Espadafor et al. [27] who identified that increases in air temperature and solar radiation and decreases in relative humidity lead to significant increases in ET0 (up to 3.5 mm year1) in Southern Europe.

4. Conclusions

The objective of this study was to analyze the trend of seasonal and annual reference evapotranspiration (ET0) over the period 1984–2017 and its sensitivity to climatic variables in the Senegal River basin. Results reveal an increase in the ET0 at the annual and dry season scales for 32% of the Senegal River basin. This increase in the ET0 is localized in the Sudanian zone where the main hydraulic infrastructures are located (Manantali and Felou dams). However, during the rainy season, a localized downward trend in the ET0 is noted in some areas of the Sahelian zone with a rise in temperatures which illustrates the concept of the “evaporation paradox”. The sensitivity analysis reveals that evapotranspiration is more sensitive to relative humidity, maximum temperature and solar radiation. Increase in the ET0 will increase crop water requirements, accentuate the water losses by evaporation in surface reservoirs, reduce the hydroelectricity producible and may lead to increased competition between different water uses. Therefore, the countries sharing the Senegal River basin must look at ways to reduce consumption where possible and optimize the allocation of available resources.
This research is based on 33-year reanalysis dataset. Therefore, the short time series of climate data used may be a limitation of this study. Thus, it would be important to extend the time series when data are available for future researches. It would also be interesting in further investigation, to evaluate the impact of the topography, the dynamics of land use and hydraulic infrastructures, and climate change on the trend of evapotranspiration in the Senegal river basin

Author Contributions

Conceptualization, P.M.N., A.B. and L.D.; methodology, P.M.N., A.B. and L.D.; software, P.M.N., A.B. and L.D.; validation, A.B., L.D., A.D. (Abdoulaye Deme), A.D. (Alain Dezetter), K.D.; formal analysis, P.M.N., A.B., L.D., A.D. (Abdoulaye Deme), A.D. (Alain Dezetter), K.D.; investigation, P.M.N., A.B., L.D., A.D. (Abdoulaye Deme) and A.D. (Alain Dezetter); data curation, P.M.N.; writing—original draft preparation, P.M.N., A.B. and L.D.; writing—review and editing, P.M.N., A.B., L.D., A.D. (Abdoulaye Deme), A.D. (Alain Dezetter), K.D., A.O.; visualization, P.M.N., A.B. and L.D.; supervision, A.B., L.D., A.D. (Abdoulaye Deme), A.D. (Alain Dezetter), K.D., A.O.; project administration, A.B.; funding acquisition, A.O., L.D., A.B. All authors have read and agreed to the published version of the manuscript.

Funding

This research was partially funded by the EU/ANR LEAP-AGRI WAGRINNOVA and the AICS/UE N. 03/2020/WEFE-SENEGAL projects.

Acknowledgments

Data used in this study were obtained from the NASA Langley Research Center (LaRC) POWER Project funded through the NASA Earth Science/Applied Science Program. The authors also wish to thank the three anonymous reviewers and the special academic editor for their suggestions, which helped improve the manuscript.

Conflicts of Interest

The authors declare no conflict of interest.

References

  1. Zhao, L.; Xia, J.; Sobkowiak, L.; Li, Z. Climatic Characteristics of Reference Evapotranspiration in the Hai River Basin and Their Attribution. Water 2014, 6, 1482–1499. [Google Scholar] [CrossRef] [Green Version]
  2. Bodian, A.; Dezetter, A.; Diop, L.; Deme, A.; Djaman, K.; Diop, A. Future Climate Change Impacts on Streamflows of Two Main West Africa River Basins: Senegal and Gambia. Hydrology 2018, 5, 21. [Google Scholar] [CrossRef] [Green Version]
  3. Patle, G.T.; Sengdo, D.; Tapak, M. Trends in major climatic parameters and sensitivity of evapotranspiration to climatic parameters in the eastern Himalayan region of Sikkim, India. J. Water Clim. Chang. 2019, 11, 491–502. [Google Scholar] [CrossRef]
  4. Tao, X.; Chen, H.; Xu, C.-Y.; Hou, Y.-K.; Jie, M. Analysis and prediction of reference evapotranspiration with climate change in Xiangjiang River Basin, China. Water Sci. Eng. 2015, 8, 273–281. [Google Scholar] [CrossRef] [Green Version]
  5. Shan, N.; Shi, Z.; Yang, X.; Zhang, X.; Guo, H.; Zhang, B.; Zhang, Z. Trends in potential evapotranspiration from 1960 to 2013 for a desertification-prone region of China. Int. J. Climatol. 2016, 36, 3434–3445. [Google Scholar] [CrossRef]
  6. Jahani, B.; Dinpashoh, Y.; Wild, M. Dimming in Iran since the 2000s and the underlying causes. Int. J. Climatol. 2018, 38, 1543–1559. [Google Scholar] [CrossRef]
  7. Abiye, O.E.; Matthew, O.J.; Sunmonu, L.A.; Babatunde, O.A. Potential evapotranspiration trends in West Africa from 1906 to 2015. Springer Nat. Appl. Sci. 2019, 1–14. [Google Scholar] [CrossRef] [Green Version]
  8. Obada, E.; Alamou, E.A.; Chabi, A.; Zandagba, J.; Afouda, A. Trends and Changes in Recent and Future Penman-Monteith Potential Evapotranspiration in Benin (West Africa). Hydrology 2017, 4, 38. [Google Scholar] [CrossRef] [Green Version]
  9. Jun, W.; Xinhua, W.; Meihua, G.; Xuyan, X.U. Impact of Climate Change on Reference Crop Evapotranspiration in Chuxiong City, Yunnan Province. Procedia Earth Planet. Sci. 2012, 5, 113–119. [Google Scholar] [CrossRef] [Green Version]
  10. Qi, P.; Zhang, G.; Xu, Y.J.; Wu, Y.; Gao, Z. Spatiotemporal Changes of Reference Evapotranspiration in the Highest-Latitude Region of China. Water 2017, 9, 493. [Google Scholar] [CrossRef] [Green Version]
  11. Li, M.; Chu, R.; Shen, S.; Islam, A.R.M.T. Quantifying Climatic Impact on Reference Evapotranspiration Trends in the Huai River Basin of Eastern China. Water 2018, 10, 144. [Google Scholar] [CrossRef] [Green Version]
  12. Zhang, Y.; Liu, C.; Tang, Y.; Yang, Y. Trends in pan evaporation and reference and actual evapotranspiration across the Tibetan plateau. J. Geophys. Res. 2007, 112. [Google Scholar] [CrossRef]
  13. Jiao, L.; Wang, D. Climate Change, the Evaporation Paradox, and Their Effects on Streamflow in Lijiang Watershed. Pol. J. Environ. Stud. 2018, 27, 2585–2591. [Google Scholar] [CrossRef]
  14. Mahyoub, H.; Buhairi, A. Analysis of Monthly, Seasonal and Annual Air Temperature Variability and Trends in Taiz City Republic of Yemen. J. Environ. Prot. 2010, 1, 401–409. [Google Scholar] [CrossRef] [Green Version]
  15. Feng, Y.; Cui, N.; Zhao, L.; Gong, D.; Zhang, K. Spatiotemporal variation of reference evapotranspiration during 1954–2013 in Southwest China. Quat. Int. 2017, 1–11. [Google Scholar] [CrossRef]
  16. Rahman, M.A.; Yunsheng, L.; Sultana, N.; Ongoma, V. Analysis of reference evapotranspiration (ET0) trends under climate change in Bangladesh using observed and CMIP5 data sets. Meteorol. Atmos. Phys. 2018. [Google Scholar] [CrossRef]
  17. Peterson, T.C.; Golubev, V.S.; Groisman, P.Y. Evaporation losing its strength. Nature 1995, 377, 687–688. [Google Scholar] [CrossRef]
  18. Lawrimore, J.H.; Peterson, T.C. Pan Evaporation Trends in Dry and Humid Regions of the United States. J. Hydrometeorol. 2000, 1, 543–646. [Google Scholar] [CrossRef]
  19. Zhang, T.; Chen, Y.; Kyaw Tha Paw, U. Quantifying the impact of climate variables on reference evapotranspiration in Pearl River Basin, China. Hydrol. Sci. J. 2019, 64, 1944–1956. [Google Scholar] [CrossRef]
  20. Yesilırmak, E. Temporal changes of warm-season pan evaporation in a semi-arid basin in Western Turkey. Stoch. Environ. Res. Risk Assess. 2013, 27. [Google Scholar] [CrossRef]
  21. Ozdogan, M.; Salvucci, G.D. Irrigation-induced changes in potential evapotranspiration in south-eastern Turkey: Test and application of Bouchet’s complementary hypothesis. Water Resour. Res. 2004, 40. [Google Scholar] [CrossRef] [Green Version]
  22. Shadmani, M.; Marofi, S.; Roknian, M. Trend Analysis in Reference Evapotranspiration Using Mann-Kendall and Spearman’s Rho Tests in Arid Regions of Iran. Water Resour. Manag. 2012, 26, 211–224. [Google Scholar] [CrossRef] [Green Version]
  23. Roderick, M.; Farquhar, G. Changes in Australian Pan Evaporation from 1970 to 2002. Int. J. Clim. 2004, 24, 1077–1090. [Google Scholar] [CrossRef]
  24. Roderick, M.L.; Farquhar, G.D. The Cause of Decreased Pan Evaporation over the Past 50 Years. Science 2002, 298, 1410–1411. [Google Scholar]
  25. Han, S.; Xu, D.; Wang, S. Decreasing potential evaporation trends in China from 1956 to 2005: Accelerated in regions with significant agricultural influence. Agric. For. Meteorol. 2012, 154–155, 44–56. [Google Scholar] [CrossRef]
  26. Chattopadhyay, N.; Hulme, M. Evaporation and potential evapotranspiration in India under conditions of recent and future climatic change. Agric. For. Meteorol. 1997, 87, 55–74. [Google Scholar] [CrossRef]
  27. Espadafor, M.; Lorite, I.J.; Gavilán, P.; Berengena, J. An analysis of the tendency of reference evapotranspiration estimates and other climate variables during the last 45 years in Southern Spain. Agric. Water Manag. 2011, 98, 1045–1061. [Google Scholar] [CrossRef]
  28. Chaouche, K.; Neppel, L.; Dieulin, C.; Pujol, N.; Ladouche, B.; Martin, E.; Salas, D.; Caballero, Y. Analyses of precipitation, temperature and evapotranspiration in a French Mediterranean region in the context of climate change. Comptes Rendus Geosci. 2010, 342, 234–243. [Google Scholar] [CrossRef]
  29. Lu, X.; Bai, H.; Mu, X. Explaining the evaporation paradox in Jiangxi Province of China: Spatial distribution and temporal trends in potential evapotranspiration of Jiangxi Province from 1961 to 2013. Int. Soil Water Conserv. Res. 2016, 45–51. [Google Scholar] [CrossRef] [Green Version]
  30. Irmak, S.; Payero, J.O.; Martin, D.L.; Irmak, A.; Howell, T.A. Sensitivity Analyses and Sensitivity Coefficients of Standardized Daily ASCE-Penman-Monteith Equation. J. Irrig. Drain. Eng. 2006, 6, 564–578. [Google Scholar] [CrossRef]
  31. Gong, L.; Xu, C.H.; Chen, D.; Holldan, S.; Chen, Y.D. Sensitivity of the Penman-Monteith Reference Evapotranspiration to Key Climatic Variables in the Changzing (Yantze River) Basin. J. Hydrol. 2006, 329, 620–629. [Google Scholar] [CrossRef]
  32. Estévez, J.; Gavilan, P.; Berengena, J. Sensitivity analysis of a Penman–Monteith type equation to estimate reference evapotranspiration in southern Spain. Hydrol. Process. 2009, 23, 3342–3353. [Google Scholar] [CrossRef]
  33. Liqiao, L.; Li, L.; Zhang, L.; Li, J.; Li, B. Sensitivity of Penman-Monteith Reference Crop Evapotranspiration in Tao’er River Basin of Northeastern China. China Geogr. Sci. 2008, 18, 340–347. [Google Scholar] [CrossRef]
  34. Pandey, A.; Pandey, R.P. Analysing trends in reference evapotranspiration and weather variables in the Tons River Basin in Central India. Stoch. Environ. Res. Risk Assess. 2012. [Google Scholar] [CrossRef]
  35. Sharifi, A.; Dinpashah, Y. Sensitivity Analysis of the Penman-Monteith Reference Crop Evapotranspiration to Climates Variables in Iran. Water Resour. Manag. 2014, 28, 5461–5476. [Google Scholar] [CrossRef]
  36. Tabari, H.; Talaee, P.H. Sensitivity of evapotranspiration to climatic change in different climates. Glob. Planet. Change 2014, 115, 16–23. [Google Scholar] [CrossRef]
  37. Tabari, H.; Marofi, S.; Aeini, A.; Talaee, P.H.; Mohammadi, K. Trend analysis of reference evapotranspiration in the western half of Iran. Agric. For. Meteorol. 2011, 151, 128–136. [Google Scholar] [CrossRef]
  38. Lamb, P.J. Persistence of sub-Saharan drought. Nature 1982, 299, 46–47. [Google Scholar] [CrossRef]
  39. Bakhtiari, B.; Ghlirman, N.; Liaghat, A.M.; Hoogenboom, G. Evaluation of Reference Evapotranspiration Models for a Semi-Arid Environment Using Lysimeter Measurements. J. Agric. Sci. Technol. 2011, 13, 223–237. [Google Scholar]
  40. Ambas, V.; Baltas, E. Sensitivity analysis of different evapotranspiration methods using a new sensitivity coefficient. Glob. Nest J. 2012, 14, 335–343. [Google Scholar]
  41. Bodian, A. Approche par modélisation pluie-débit de la connaissance régionale de la ressource en eau: Application dans le haut bassin du Fleuve Sénégal. Ph.D. Thesis, Université Cheikh Anta Diop de Dakar, Dakar, Senegal, 2011; 211p. (In French). Available online: http://hydrologie.org/THE/BODIAN.pdf (accessed on 10 March 2020).
  42. SDAGE-OMVS. Etat des Lieux et Diagnostique; Rapport Provisoire 2009, Rapport de Phase III; SDAGE-OMVS: Dakar, Senegal, 2011. [Google Scholar]
  43. Dione, O. Evolution Climatique Récente et Dynamique Fluviale dans les Hauts Bassins des Fleuves Sénégal et Gambie (Recent Climate Evolution and Fluvial Dynamics in the High Basins of the Senegal and Gambia Rivers). Ph.D. Thesis, Université de Lyon 3 Jean Moulin, ORSTOM, Paris, France, 1996; 438p. (In French). Available online: http://horizon.documentation.ird.fr/exldoc/pleins_textes/pleins_textes_7/TDM_7/010012551.pdf (accessed on 10 March 2020).
  44. Bodian, A.; Diop, L.; Panthou, G.; Dacosta, H.; Deme, A.; Dezetter, A.; Ndiaye, P.M.; Diouf, I.; Vichel, T. Recent Trend in Hydroclimatic Conditions in the Senegal River Basin. Water 2020, 12, 436. [Google Scholar] [CrossRef] [Green Version]
  45. Srivastava, P.; Han, D.; Ramirez, M.A.; Islam, T. Comparative assessment of evapotranspiration derived from NCEP and ECMWF global datasets through Weather Research and Forecasting model. Atmos. Sci. Lett. 2013, 14, 118–125. [Google Scholar] [CrossRef]
  46. Poccard-Leclercq, I. Etude diagnostique de nouvelles données climatiques: Les réanalyses. Exemples d’application aux précipitations en Afrique tropicale. Géographie. Ph.D. Thesis, Université de Bourgogne, Dijon, France, 2000; 255p. Available online: https://tel.archives-ouvertes.fr/tel-00012042/document (accessed on 8 March 2020).
  47. Wilkens, P.W.; Stackhouse, P.W., Jr.; Hoel, J.M.; White, J.W.; Hoogenboom, G. Evaluation of satellite-based, modeled-derived daily solar radiation data for the continental United States. Agron. J. 2011, 103, 1242–1251. [Google Scholar]
  48. Bai, J.; Chen, X.; Dobermann, A.; Yang, H.; Cassman, K.G.; Zhang, F. Evaluation of NASA satellite-and model-derived weather data for simulation of maize yield potential in China. Agron. J. 2010, 102, 9–16. [Google Scholar] [CrossRef]
  49. White, J.W.; Hoogenboom, G.; Stackhouse, P.W., Jr.; Hoell, J.M. Evaluation of NASA satellite-and assimilation model-derived long-term daily temperature data over the continental US. Agric. For. Meteorol. 2008, 148, 1574–1584. [Google Scholar] [CrossRef] [Green Version]
  50. Ruane, A.C.; Goldberg, R.; Chryssanthacopoulos, J. Climate forcing datasets for agricultural modeling: Merged products for gap-filling and historical climate series estimation. Agric. Meteorol. 2015, 200, 233–248. [Google Scholar] [CrossRef] [Green Version]
  51. Martins, D.S.; Paredes, P.; Razia, T.; Pires, C.; Cadima, J.; Pereira, L. Assessing reference evapotranspiration from reanalysis weather products. An application to the Iberian Peninsula. Int. J. Climatol. 2016, 1–20. [Google Scholar] [CrossRef]
  52. Stackhouse, P.W.; Westberg, D., Jr.; Chandler, W.S.; Zhang, T.; Hoell, J.M. Prediction of Worldwide Energy Resource (POWER); National Aeronautics and Space Administration: Washington, DC, USA, 2017; p. 52.
  53. Purnadurga, G.T.V.; Kumar, L.; Rao, K.K.; Barbosa, H.; Mall, R.K. Evaluation of evapotranspiration estimates from observed and reanalysis data sets over Indian region. Int. J. Climatol. 2019. [Google Scholar] [CrossRef]
  54. Estévez, J.; García-Marín, A.P.; Morábito, J.A.; Cavagnaro, M. Quality assurance procedures for validating meteorological input variables of reference evapotranspiration in Mendoza province (Argentina). Agric. Water Manag. 2016, 172, 96–109. [Google Scholar] [CrossRef]
  55. Allen, R.; Pereira, L.; Raes, D.; Smith, M. Crop Evapotranspiration. Guideline for Computing Crop Requirements; FAO-Irrigation and drainage paper 56: Rome, Italy, 1998. [Google Scholar]
  56. Diop, L.; Bodian, A.; Diallo, D. Spatiotemporal Trend Analysis of the Mean Annual Rainfall in Senegal. Eur. Sci. J. 2015, 12, 1857–7881. [Google Scholar] [CrossRef]
  57. Chu, R.; Li, M.; Shen, S.; Islam, A.; Cao, W.; Tao, S.; Gao, P. Changes in Reference Evapotranspiration and Its Contributing Factors in Jiangsu, a Major Economic and Agricultural Province of Eastern China. Water 2017, 9, 486. [Google Scholar] [CrossRef]
  58. Malamos, N.; Tsirogiannis, I.L.; Tegos, A.; Efstratiadis, A.; Koutsoyiannis, D. Spatial interpolation of potential evapotranspiration for precision irrigation purposes. Eur. Water 2017, 59, 303–309. [Google Scholar]
  59. Hodam, S.; Sarkar, S.; Marak, A.G.R.; Bandyopadhyay, A.; Bhadra, A. Spatial Interpolation of Reference Evapotranspiration in India: Comparison of IDW and Kriging Methods. J. Inst. Eng. Ser. A 2017. [Google Scholar] [CrossRef]
  60. Mann, H.B. Non-parametric test against trend. Econometrika 1945, 13, 245–259. [Google Scholar] [CrossRef]
  61. Kendall, M.G. Rank Correlation Methods; Hafner: New York, NY, USA, 1945. [Google Scholar]
  62. Azizzadeh, M.; Javan, K. Analyzing trends in reference evapotranspiration in northwest part of Iran. J. Ecol. Eng. 2015, 16, 1–12. [Google Scholar] [CrossRef]
  63. Diop, L.; Yaseen, Z.M.; Bodian, A.; Djaman, K.; Brown, L. Trend analysis of streamflow with different time scales: A case study of the upper Senegal River. J. Hydraul. Eng. 2018, 24, 105–114. [Google Scholar] [CrossRef]
  64. Sen, P.K. Estimates of the regression coefficient based on Kendall’s tau. J. Am. Stat. Assoc. 1968, 63, 1379–1389. [Google Scholar] [CrossRef]
  65. Bayazit, M.; Önöz, B. To prewhiten or not to prewhiten in trend analysis. Hydrol. Sci. J. 2009, 52, 611–624. [Google Scholar] [CrossRef]
  66. Dadaser-Celik, F.; Cengiz, E.; Guzel, O. Trends in reference evapotranspiration in Turkey: 1975–2006. Int. J. Climatol. 2016, 36, 1733–1743. [Google Scholar] [CrossRef] [Green Version]
  67. Osías, R.-A.; Singh, V.P.; Juan, E.-M.; Ernesto, R.; Capurata, O.; Arturo, C.-S. Spatiotemporal Trends of Monthly and Annual Precipitation in Aguascalientes, Mexico. Atmosphere 2020, 11, 437. [Google Scholar] [CrossRef]
  68. Aubin, A. Estimation de L’évapotranspiration par Télédétection Spatiale en Afrique de L’Ouest: Vers une Meilleure Connaissance de Cette Variable clé Pour la Région (English Title Estimation of Evapotranspiration using Space Remote Sensing in West Africa: Towards a Better Knowledge of this Key Variable for the Region). Ph.D. Thesis, Université de Montpellier, Montpellier, France, 2018; 431p. (In French). Available online: https://tel.archives-ouvertes.fr/tel-02045897/document (accessed on 15 March 2020).
  69. Zeng, Z.; Wu, W.; Zhou, Y.; Li, Z.; Hou, M.; Huang, H. Changes in Reference Evapotranspiration over Southwest China during 1960–2018: Attributions and Implications for Drought. Atmosphere 2019, 10, 705. [Google Scholar] [CrossRef] [Green Version]
  70. Oguntunde, P.G.; Abiodun, B.J.; Olukunle, O.J.; Olufayo, A.A. Trends and variability in pan evaporation and other climatic variables at Ibadan, Nigeria, 1973–2008. Meteorol. Appl. 2011, 19, 464–472. [Google Scholar] [CrossRef]
  71. McVicar, T.R.; Roderick, M.L.; Donohue, R.J.; Li, T.L.; Niel, T.G.V.; Thomas, A.; Grieser, J.; Jhajharia, D.; Himri, Y.; Mahowald, N.M.; et al. Global review and synthesis of trends in observed terrestrial near-surface wind speeds: Implications for evaporation. J. Hydrol. 2012, 416–417, 182–205. [Google Scholar] [CrossRef]
  72. Bian, Y.; Dai, H.; Zhang, Q.; Yang, L.; Du, W. Spatial distribution of potential evapotranspiration trends in the Inner Mongolia Autonomous Region (1971–2016). Appl. Clim. 2020. [Google Scholar] [CrossRef]
  73. Goyal, R.K. Sensitivity of evapotranspiration to global warming: A case study of arid zone of Rajasthan (India). Agric. Water Manag. 2004, 69, 1–11. [Google Scholar] [CrossRef]
  74. Mosaedi, A.; Sough, M.G.; Sadeghi, S.-H.; Mooshakhian, Y.; Bannayan, M. Sensitivity analysis of monthly reference crop evapotranspiration trends in Iran: A qualitative approach. Appl. Clim. 2016, 1–17. [Google Scholar] [CrossRef]
  75. Descroix, L.; Mahé, G.; Lebel, T.; Favreau, G.; Galle, S.; Gautier, E.; Olivry, J.-C.; Albergel, J.; Amogu, O.; Cappelaere, B.; et al. Spatiotemporal variability of hydrological regimes around the boundaries between Sahelian and Sudanian areas of West Africa: A synthesis. J. Hydrol. 2009, 375, 90–102. [Google Scholar] [CrossRef]
  76. Descroix, L.; Genthon, P.; Amogu, O.; Rajot, J.L.; Sighomnou, D.; Vauclin, M. Change in Sahelian Rivers hydrograph: The case of recent red floods of the Niger River in the Niamey region. Glob. Planet Chang. 2012, 98–99, 18–30. [Google Scholar] [CrossRef]
  77. Yin, Y.; Wu, S.; Dai, E. Determining factors in potential evapotranspiration changes over China in the period 1971–2008. Chin. Sci. Bull. 2010, 55, 3329–3337. [Google Scholar] [CrossRef]
  78. Han, J.; Zhao, Y.; Wang, J.; Zhang, B.; Zhu, Y.; Jiang, S.; Wang, L. Effects of different land use types on potential evapotranspiration in the Beijing-Tianjin Hebei region, North China. J. Geogr. Sci. 2019, 29, 922–934. [Google Scholar] [CrossRef] [Green Version]
  79. Ndiaye, P.M.; Bodian, A.; Diop, L.; Deme, A.; Dezetter, A.; Djaman, K. Evaluation and Calibration of Alternative Methods for Estimating Reference Evapotranspiration in the Senegal River Basin. Hydrology 2020, 7, 24. [Google Scholar] [CrossRef]
  80. Wang, X.; Liu, H.; Zhang, L.; Zhang, R. Climate change trend and its effects on reference evapotranspiration at Linhe Station, Hetao Irrigation District. Water Sci. Eng. 2014, 7, 250–266. [Google Scholar] [CrossRef]
  81. Rohina, A.; Karami, M.; Bahranifard, A.; Dehghan, M. Comparison of various sensitivity approaches to estimate evapotranspiration, to climatic variables in Fasa-synoptic station_Iran. Int. J. Adv. Biol. Biomed. Res. 2013, 1, 459–466. [Google Scholar]
  82. Ndiaye, P.M.; Bodian, A.; Diop, L.; Djaman, K. Sensitivity Analysis of the Penman-Monteith Reference Evapotranspiration to Climatic Variables: Case of Burkina Faso. J. Water Resour. Prot. 2017, 9, 1364–1376. [Google Scholar] [CrossRef] [Green Version]
  83. Ambroise, B. La Dynamique du Cycle de l’eau dans un Bassin Versant: Processus, Facteurs, Modèles, 2nd ed.; H.G.A.: Bucharest, Romania, 1999; 206p. [Google Scholar]
Figure 1. Senegal river basin: (a) main urban centers in the basin, hydraulic infrastructures and irrigated areas (b) stations used for the extraction of climatic variables and their altitude and limits of climatic zones.
Water 12 01957 g001
Figure 2. Daily average of climatic variables in the Senegal river basin according to climatic zones over 1984–2017: (a) Wind speed; (b) Maximum Temperature; (c) Minimum Temperature; (d) Relative Humidity; (e) Solar Radiation. (average calculated from 26 stations for the Sahelian zone, 36 stations for the Sudanian zone and 2 stations for the Guinean zone.).
Water 12 01957 g002
Figure 3. Autocorrelation (ACF) of the annual evapotranspiration of a few stations (the blue dotted line represents the 95% confidence interval).
Water 12 01957 g003
Figure 4. Spatial distribution of annual and seasonal evapotranspiration over 1984−2017 (IDW interpolation on a 32 km by 32 km grid).
Water 12 01957 g004
Figure 5. Spatial distribution of Mann-Kendall’s Z for annual and seasonal evapotranspiration over 1984−2017.
Water 12 01957 g005
Figure 6. Spatial distribution of Sen’s slope of annual and seasonal evapotranspiration over 1984–2017.
Water 12 01957 g006
Figure 7. Spatial distribution of Mann-Kendall’s Z of different climatic variables: u2 wind speed, Tmax maximum temperature, Tmin minimum temperature, Sr Solar radiation, Rh relative humidity.
Water 12 01957 g007
Figure 8. Spatial distribution of the Sen slope of climatic variables on an annual scale: u2 wind speed, Tmax maximum temperature, Tmin minimum temperature, Sr, Solar radiation, Rh relative humidity.
Water 12 01957 g008
Figure 9. Sensitivity of evapotranspiration to climatic variables. (u2 wind speed, Tmax maximum temperature, Tmin minimum temperature, Rh relative humidity, Sr Solar radiation).
Water 12 01957 g009
Figure 10. Average sensitivity coefficients of climatic variables over the period 1984−2017: u2 wind speed, Tmax maximum temperature, Tmin minimum temperature, Rh relative humidity, Sr Solar radiation.
Water 12 01957 g010
Table 1. Summary of Sen’s slope average values (β per year) for evapotranspiration and climatic variables: u2 wind speed, Tmax maximum temperature, Tmin minimum temperature, Rh relative humidity, Sr Solar radiation.
Climate ZonesPeriodβ(u2)β(Tmax)β(Tmin)β(Rh)β(Sr)β(ET0)
(m s−1)(°C)(°C)(%)(MJ m−2 d−1)(mm)
Dry season0.000.04−0.040.25−0.01−0.98
GuineanWet season0.010.010.030.080.020.20
Year0.000.02−0.010.14−0.00−2.60
Dry season0.000.050.020.050.022.78
SudanianWet season0.000.020.240.120.01−0.56
Year−0.050.030.030.050.021.53
Dry season0.010.020.010.050.020.78
SahelianWet season−0.00−0.010.030.280.01−2.03
Year−0.000.010.020.120.001.63
Table 2. Average Sensitivity Coefficients (S) on an annual and seasonal scale: u2 wind speed, Tmax maximum temperature, Tmin minimum temperature, Rh relative humidity, Sr Solar radiation.
Climate ZonesPeriodS(u2)S(Tmax)S(Tmin)S(Rh)S(Sr)
Dry season0.071.900.41−0.930.87
GuineanWet season−0.000.370.40−4.871.28
Year0.041.260.41−2.591.04
Dry season0.122.730.47−0.410.54
SudanianWet season0.030.630.79−3.581.25
Year0.081.850.61−1.740.84
Dry season0.152.170.45−0.540.35
SahelianWet season0.061.100.76−1.880.82
Year0.111.720.58−1.100.54

