Next Issue
Volume 8, November
Previous Issue
Volume 8, September


Atmosphere, Volume 8, Issue 10 (October 2017) – 26 articles

Cover Story (view full-size image): 
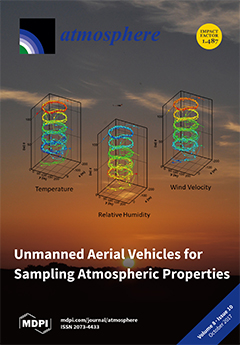
Unmanned aerial vehicles (UAVs) are rapidly becoming a viable and popular platform for conducting atmospheric research. In this study, researchers describe the development of one such UAV designed to measure the properties of turbulence in the atmospheric boundary layer. By loitering at specific altitudes, this aircraft can measure altitude dependent statistics of temperature, moisture content, pressure, mean wind velocity and the Reynolds stress tensor. View this paper
  • Issues are regarded as officially published after their release is announced to the table of contents alert mailing list.
  • You may sign up for e-mail alerts to receive table of contents of newly released issues.
  • PDF is the official format for papers published in both, html and pdf forms. To view the papers in pdf format, click on the "PDF Full-text" link, and use the free Adobe Reader to open them.
Order results
Result details
Section
Select all
Export citation of selected articles as:
2438 KiB  
Perspective
Unmanned Aerial Systems for Monitoring Trace Tropospheric Gases
by Travis J. Schuyler and Marcelo I. Guzman
Atmosphere 2017, 8(10), 206; https://doi.org/10.3390/atmos8100206 - 23 Oct 2017
Cited by 53 | Viewed by 15714
Abstract
The emission of greenhouse gases (GHGs) has changed the composition of the atmosphere during the Anthropocene. Accurately documenting the sources and magnitude of GHGs emission is an important undertaking for discriminating the contributions of different processes to radiative forcing. Currently there is no [...] Read more.
The emission of greenhouse gases (GHGs) has changed the composition of the atmosphere during the Anthropocene. Accurately documenting the sources and magnitude of GHGs emission is an important undertaking for discriminating the contributions of different processes to radiative forcing. Currently there is no mobile platform that is able to quantify trace gases at altitudes <100 m above ground level that can achieve spatiotemporal resolution on the order of meters and seconds. Unmanned aerial systems (UASs) can be deployed on-site in minutes and can support the payloads necessary to quantify trace gases. Therefore, current efforts combine the use of UASs available on the civilian market with inexpensively designed analytical systems for monitoring atmospheric trace gases. In this context, this perspective introduces the most relevant classes of UASs available and evaluates their suitability to operate three kinds of detectors for atmospheric trace gases. The three subsets of UASs discussed are: (1) micro aerial vehicles (MAVs); (2) vertical take-off and landing (VTOL); and, (3) low-altitude short endurance (LASE) systems. The trace gas detectors evaluated are first the vertical cavity surface emitting laser (VCSEL), which is an infrared laser-absorption technique; second two types of metal-oxide semiconductor sensors; and, third a modified catalytic type sensor. UASs with wingspans under 3 m that can carry up to 5 kg a few hundred meters high for at least 30 min provide the best cost and convenience compromise for sensors deployment. Future efforts should be focused on the calibration and validation of lightweight analytical systems mounted on UASs for quantifying trace atmospheric gases. In conclusion, UASs offer new and exciting opportunities to study atmospheric composition and its effect on weather patterns and climate change. Full article
(This article belongs to the Special Issue Atmospheric Measurements with Unmanned Aerial Systems (UAS))
Show Figures

Figure 1

1260 KiB  
Article
On the Redox Activity of Urban Aerosol Particles: Implications for Size Distribution and Relationships with Organic Aerosol Components
by Constantini Samara
Atmosphere 2017, 8(10), 205; https://doi.org/10.3390/atmos8100205 - 20 Oct 2017
Cited by 37 | Viewed by 4782
Abstract
This article presents the distribution of the dithiothreitol-based (DTT) redox activity of water-soluble airborne particulate matter (PM) from two urban sites in the city of Thessaloniki, northern Greece in four size ranges (<0.49, 0.49–0.97, 0.97–3.0 and >3 μm). Seasonal and spatial variations are [...] Read more.
This article presents the distribution of the dithiothreitol-based (DTT) redox activity of water-soluble airborne particulate matter (PM) from two urban sites in the city of Thessaloniki, northern Greece in four size ranges (<0.49, 0.49–0.97, 0.97–3.0 and >3 μm). Seasonal and spatial variations are examined. The correlations of the mass-normalized DTT activity with the content of PM in water-soluble organic carbon (WSOC) and non-water-soluble carbonaceous species, such as organic and elemental carbon, as well as with solvent-extractable trace organic compounds (polycyclic aromatic hydrocarbons and nitro-derivatives, polychlorinated biphenyls, organochlorines, polybrominated biphenyl ethers) and polar organic markers (dicarboxylic acids and levoglucosan), are investigated. Our study provides new and additional insights into the ambient size distribution of the DTT activity of the water-soluble fraction of airborne PM at urban sites and its associations with organic PM components. Full article
(This article belongs to the Special Issue Carbonaceous Aerosols in Atmosphere)
Show Figures

Figure 1

1998 KiB  
Article
Effect of Spatial Variation of Convective Adjustment Time on the Madden–Julian Oscillation: A Theoretical Model Analysis
by Hui Wang, Yuntao Wei and Fei Liu
Atmosphere 2017, 8(10), 204; https://doi.org/10.3390/atmos8100204 - 20 Oct 2017
Cited by 3 | Viewed by 3758
Abstract
The observed convective adjustment time (CAT) associated with Madden–Julian Oscillation (MJO) precipitation is found to vary significantly in space. Here, we investigate the effect of different spatial distributions of CAT on MJO precipitation based on the frictional coupled dynamics moisture (FCDM) model. The [...] Read more.
The observed convective adjustment time (CAT) associated with Madden–Julian Oscillation (MJO) precipitation is found to vary significantly in space. Here, we investigate the effect of different spatial distributions of CAT on MJO precipitation based on the frictional coupled dynamics moisture (FCDM) model. The results show that a large value of CAT tends to decrease the frequency and growth rate of eastward-propagating MJO-like mode in the FCDM model, delaying the occurrence of MJO deep convection and slowing down its eastward propagation. A large phase lag between circulation and convection decreases convective available potential energy (CAPE). In the observations, a small background vertical moisture gradient (BVMG) tends to increase the frequency associated with cold sea surface temperature (SST), while a large value of CAT tends to decrease the frequency. Due to their competing effect, the simulated frequency and phase speed remain the same when the convection moves from a warm to a cold SST region. The convection is heavily suppressed over the cold SST region due to the decreasing growth rate of unstable wavenumber-one mode with smaller BVMG and longer CAT. This theoretical finding should improve our understanding of MJO dynamics and simulation. Full article
(This article belongs to the Special Issue Madden-Julian Oscillation)
Show Figures

Figure 1

12066 KiB  
Article
The Peñalara Mountain Meteorological Network (1999–2014): Description, Preliminary Results and Lessons Learned
by Luis Durán, Irene Rodríguez-Muñoz and Enrique Sánchez
Atmosphere 2017, 8(10), 203; https://doi.org/10.3390/atmos8100203 - 17 Oct 2017
Cited by 10 | Viewed by 4806
Abstract
This work describes a mountain meteorological network that was in operation from 1999 to 2014 in a mountain range with elevations ranging from 1104 to 2428 m in Central Spain. Additionally, some technical details of the network are described, as well as variables [...] Read more.
This work describes a mountain meteorological network that was in operation from 1999 to 2014 in a mountain range with elevations ranging from 1104 to 2428 m in Central Spain. Additionally, some technical details of the network are described, as well as variables measured and some meta information presented, which is expected to be useful for future users of the observational database. A strong emphasis is made on showing the observational methods and protocols evolution, as it will help researchers to understand the sources of errors, data gaps and the final stage of the network. This paper summarizes mostly the common sources of errors when designing and operating a small network of this kind, so it can be useful for individual researchers and small size groups that undertake a similar task on their own. Strengths and weaknesses of some of the variables measured are discussed and some basic calculations are made in order to show the otential of the database and to anticipate future deeper climatological analyses over the area. Finally, the configuration of an automatic mountain meteorology station is suggested as a result of the lessons learned and the the common state of the art automatic measuring techniques Full article
(This article belongs to the Special Issue Atmospheric Processes over Complex Terrain)
Show Figures

Figure 1

2457 KiB  
Article
Ice Nucleating Particle Concentrations Increase When Leaves Fall in Autumn
by Franz Conen, Mikhail V. Yakutin, Karl Espen Yttri and Christoph Hüglin
Atmosphere 2017, 8(10), 202; https://doi.org/10.3390/atmos8100202 - 17 Oct 2017
Cited by 15 | Viewed by 4231
Abstract
Ice nucleating particles active at −8 °C or warmer (INP−8) are produced by plants and by microorganisms living from and on them. Laboratory studies have shown that large numbers of INP−8 are produced by decaying leaves. At three widely dispersed [...] Read more.
Ice nucleating particles active at −8 °C or warmer (INP−8) are produced by plants and by microorganisms living from and on them. Laboratory studies have shown that large numbers of INP−8 are produced by decaying leaves. At three widely dispersed locations in Northwestern Eurasia, we saw, from an analysis of PM10 filter samples, that seasonal median concentrations of INP−8 in the boundary layer doubled from summer to autumn. Concentrations of INP−8 increased in autumn soon after the normalized differential vegetation index had started to decrease. Whether the large-scale phenological event of leaf senescence and shedding in autumn has an impact on ice formation in clouds is a justified question. Full article
(This article belongs to the Special Issue Atmospheric Aerosol Composition and its Impact on Clouds)
Show Figures

Figure 1

13961 KiB  
Article
Aerosol Optical Properties over China from RAMS-CMAQ Model Compared with CALIOP Observations
by Tong Wu, Meng Fan, Jinhua Tao, Lin Su, Ping Wang, Dong Liu, Mingyang Li, Xiao Han and Liangfu Chen
Atmosphere 2017, 8(10), 201; https://doi.org/10.3390/atmos8100201 - 17 Oct 2017
Cited by 8 | Viewed by 4496
Abstract
The horizontal and vertical distributions of aerosol optical properties over China in 2013–2015 were investigated using RAMS (Regional Atmospheric Modeling System)-CMAQ (Models-3 Community Multiscale Air Quality) simulations and CALIOP (Cloud-Aerosol Lidar with Orthogonal Polarization) observations. To better understand the performance of the RAMS-CMAQ [...] Read more.
The horizontal and vertical distributions of aerosol optical properties over China in 2013–2015 were investigated using RAMS (Regional Atmospheric Modeling System)-CMAQ (Models-3 Community Multiscale Air Quality) simulations and CALIOP (Cloud-Aerosol Lidar with Orthogonal Polarization) observations. To better understand the performance of the RAMS-CMAQ model over China, comparisons with the ground-based Sun photometers AERONET (Aerosol Robotic Network), MODIS (Moderate Resolution Imaging Spectroradiometers) data and the on-board Lidar CALIOP were used for comprehensive evaluations, which could characterize the abilities of the model to simulate the spatial and vertical distributions of the AOD (Aerosol Optical Depth) as well as the optical properties for four seasons. Several high value areas (e.g., the Sichuan Basin, Taklamakan Desert, North China Plain, and Yangtze River Delta) were found over China during the study period, with the maximum mean AOD (CALIOP: ~0.7; RAMS-CMAQ: >1) in the Sichuan district. Compared with AODs of AERONET, both the CALIOP and RAMS-CMAQ AODs were underestimated, but the RAMS-CMAQ data show a better correlation with AERONET (AERONET vs. RAMS-CMAQ R: 0.69, AERONET vs. CALIOP R: 0.5). The correlation coefficients between RAMS-CMAQ and CALIOP are approximately 0.6 for all four seasons. The AEC (Aerosol Extinction Coefficient) vertical profiles over major cities and their cross sections exhibit two typical features: (1) most of the AEC peaks occurred in the lowest ~0.5 km, decreasing with increasing altitude; and (2) the RAMS-CMAQ AEC underestimated the region with high AODs in the northwest of China and overestimated the region with high AODs in the east–central plain and the central basin regions. The major difference in the AEC values of RAMS-CMAQ and CALIOP is mainly caused by the level of relative humidity and the hygroscopic growth effects of water-soluble aerosols, especially, in the Sichuan district. In general, both the column and vertical RAMS-CMAQ aerosol optical properties could be supplemented efficiently when satellite observations are not available or invalid over China in the applications of climate change and air pollution. Full article
(This article belongs to the Special Issue Aerosol Optical Properties: Models, Methods & Measurements)
Show Figures

Figure 1

12777 KiB  
Article
Monitoring and Evaluation of Terni (Central Italy) Air Quality through Spatially Resolved Analyses
by Lorenzo Massimi, Martina Ristorini, Marta Eusebio, Darla Florendo, Adeola Adeyemo, Davide Brugnoli and Silvia Canepari
Atmosphere 2017, 8(10), 200; https://doi.org/10.3390/atmos8100200 - 11 Oct 2017
Cited by 19 | Viewed by 4447
Abstract
A study of spatial variability of PM10 elemental components was conducted in Terni city (Central Italy), situated in an intramountain depression characterized by the presence of several particulate matter emission sources. The meteorological conditions of the Terni basin limit the dispersion and [...] Read more.
A study of spatial variability of PM10 elemental components was conducted in Terni city (Central Italy), situated in an intramountain depression characterized by the presence of several particulate matter emission sources. The meteorological conditions of the Terni basin limit the dispersion and enhance the accumulation of atmospheric pollutants. Thanks to the utilization of new smart samplers, used for the first time and working in parallel at 23 sampling sites, spatially resolved data were obtained. Localizations of the samplers were chosen in order to evaluate the impact of different local PM10 sources. Chemical composition of the samples was determined in combination with a chemical fractioning procedure that allowed us to discriminate water-soluble and residual fractions of analyzed elements in which proved to be a valuable approach for increasing selectivity of elements as source tracers. Spatial variability of elements underlined the contribution of local emission sources and the different dispersion capacity of each element. The city of Terni resulted to be an ideal area to test and validate a new experimental method for the acquisition of spatially resolved data providing the possibility to properly evaluate the spatial variability of PM10 and its chemical components. Full article
Show Figures

Figure 1

5243 KiB  
Article
Data Analysis of the TK-1G Sounding Rocket Installed with a Satellite Navigation System
by Lesong Zhou, Zheng Sheng, Zhiqiang Fan and Qixiang Liao
Atmosphere 2017, 8(10), 199; https://doi.org/10.3390/atmos8100199 - 11 Oct 2017
Cited by 8 | Viewed by 5680
Abstract
This article gives an in-depth analysis of the experimental data of the TK-1G sounding rocket installed with the satellite navigation system. It turns out that the data acquisition rate of the rocket sonde is high, making the collection of complete trajectory and meteorological [...] Read more.
This article gives an in-depth analysis of the experimental data of the TK-1G sounding rocket installed with the satellite navigation system. It turns out that the data acquisition rate of the rocket sonde is high, making the collection of complete trajectory and meteorological data possible. By comparing the rocket sonde measurements with those obtained by virtue of other methods, we find that the rocket sonde can be relatively precise in measuring atmospheric parameters within the scope of 20–60 km above the ground. This establishes the fact that the TK-1G sounding rocket system is effective in detecting near-space atmospheric environment. Full article
(This article belongs to the Special Issue Atmospheric Measurements with Unmanned Aerial Systems (UAS))
Show Figures

Figure 1

1774 KiB  
Article
Spatial and Temporal Trends in the Location of the Lifetime Maximum Intensity of Tropical Cyclones
by Sarah A. Tennille and Kelsey N. Ellis
Atmosphere 2017, 8(10), 198; https://doi.org/10.3390/atmos8100198 - 10 Oct 2017
Cited by 15 | Viewed by 5511
Abstract
The climatology of tropical cyclones is an immediate research need, specifically to better understand their long-term patterns and elucidate their future in a changing climate. One important pattern that has recently been detected is the poleward shift of the lifetime maximum intensity (LMI) [...] Read more.
The climatology of tropical cyclones is an immediate research need, specifically to better understand their long-term patterns and elucidate their future in a changing climate. One important pattern that has recently been detected is the poleward shift of the lifetime maximum intensity (LMI) of tropical cyclones. This study further assessed the recent (1977–2015) spatial changes in the LMI of tropical cyclones, specifically those of tropical storm strength or stronger in the North Atlantic and northern West Pacific basins. Analyses of moving decadal means suggested that LMI locations migrated south in the North Atlantic and north in the West Pacific. In addition to a linear trend, there is a cyclical migration of LMI that is especially apparent in the West Pacific. Relationships between LMI migration and intensity were explored, as well as LMI location relative to landfall. The southerly trend of LMI in the North Atlantic was most prevalent in the strongest storms, resulting in these storms reaching their LMI farther from land. The relationship between intensity and LMI migration in the West Pacific was not as clear, but the most intense storms have been reaching LMI closer to their eventual landfall location. This work adds to those emphasizing the importance of understanding the climatology of the most intense hurricanes and shows there are potential human impacts resulting from any migration of LMI. Full article
(This article belongs to the Special Issue Tropical Cyclones and Their Impacts)
Show Figures

Figure 1

5617 KiB  
Article
Evaluation of Surface Fluxes in the WRF Model: Case Study for Farmland in Rolling Terrain
by Xia Sun, Heather A. Holmes, Olabosipo O. Osibanjo, Yun Sun and Cesunica E. Ivey
Atmosphere 2017, 8(10), 197; https://doi.org/10.3390/atmos8100197 - 08 Oct 2017
Cited by 32 | Viewed by 6083
Abstract
The partitioning of available energy into surface sensible and latent heat fluxes impacts the accuracy of simulated near surface temperature and humidity in numerical weather prediction models. This case study evaluates the performance of the Weather Research and Forecasting (WRF) model on the [...] Read more.
The partitioning of available energy into surface sensible and latent heat fluxes impacts the accuracy of simulated near surface temperature and humidity in numerical weather prediction models. This case study evaluates the performance of the Weather Research and Forecasting (WRF) model on the simulation of surface heat fluxes using field observations collected from a surface flux tower in Oregon, USA. Further, WRF-modeled heat flux sensitivities to North American Mesoscale (NAM) and North American Regional Reanalysis (NARR) large-scale input forcing datasets; U.S. Geological Survey (USGS) and the Moderate Resolution Imaging Spectroradiometer (MODIS) land use datasets; Pleim-Xiu (PX) and Noah land surface models (LSM); Yonsei University (YSU) and Mellor-Yamada-Janjic (MYJ) planetary boundary layer (PBL) schemes using the Noah LSM; and Asymmetric Convective Model version 2 (ACM2) PBL scheme using PX LSM are investigated. The errors for simulating 2-m temperature, 2-m humidity, and 10-m wind speed were reduced on average when using NAM compared with NARR. Simulated friction velocity had a positive bias on average, with the YSU PBL scheme producing the largest overestimation in the innermost domain (0.5 km horizontal grid resolution). The simulated surface sensible heat flux had a similar temporal behavior as the observations but with a larger magnitude. The PX LSM produced lower and more reliable sensible heat fluxes compared with the Noah LSM. However, Noah latent heat fluxes were improved with a lower RMSE compared to PX, when NARR forcing data was used. Overall, these results suggest that there is not one WRF configuration that performs best for all the simulated variables (surface heat fluxes and meteorological variables) and situations (day and night). Full article
(This article belongs to the Special Issue Atmospheric Processes over Complex Terrain)
Show Figures

Figure 1

2919 KiB  
Article
Atmospheric Levels of Benzene and C1-C2 Carbonyls in San Nicolas de los Garza, Nuevo Leon, Mexico: Source Implications and Health Risk
by Julia Griselda Cerón Bretón, Rosa María Cerón Bretón, Jonathan D.W. Kahl, Reyna del Carmen Lara-Severino, Evangelina Ramírez Lara, María de la Luz Espinosa Fuentes, Marcela Rangel Marrón and Martha Patricia Uc Chi
Atmosphere 2017, 8(10), 196; https://doi.org/10.3390/atmos8100196 - 07 Oct 2017
Cited by 10 | Viewed by 4751
Abstract
Atmospheric benzene and carbonyls were studied in San Nicolas de los Garza, Nuevo Leon, during 2011 and 2012. The relative abundance for measured VOCs was the following: formaldehyde (9.06 µg m−3) > acetaldehyde (8.06 µg m3) > benzene (0.65 [...] Read more.
Atmospheric benzene and carbonyls were studied in San Nicolas de los Garza, Nuevo Leon, during 2011 and 2012. The relative abundance for measured VOCs was the following: formaldehyde (9.06 µg m−3) > acetaldehyde (8.06 µg m3) > benzene (0.65 µg m−3). All measured VOCs had a clear seasonal trend with higher values of concentration during summer. Benzene and formaldehyde had a marked diurnal trend with the highest levels during morning, whereas acetaldehyde did not show a clear diurnal pattern. Meteorological analysis showed that the dominant winds came from NNE and ENE, suggesting that sources located in these directions contribute to the VOC levels. Principal component analysis (PCA) analysis revealed that photochemical activity influenced benzene and carbonyl levels during summer and that benzene was associated with vehicular traffic emissions during autumn and winter, showing good correlation with CO. Meteorological data showed that measured VOCs were influenced by regional sources. A health risk assessment showed that local exposure to carbonyls and benzene exceeded 1 × 10⁻⁶ for integrated lifetime cancer risk. People living in San Nicolas de los Garza, thus, have a probable risk of suffering cancer in their lifetime. It is, therefore, necessary to improve environmental policies for controlling VOC levels in this area. Full article
(This article belongs to the Section Air Quality)
Show Figures

Figure 1

5082 KiB  
Review
A Review of Parametric Descriptions of Tropical Cyclone Wind-Wave Generation
by Ian R. Young
Atmosphere 2017, 8(10), 194; https://doi.org/10.3390/atmos8100194 - 05 Oct 2017
Cited by 71 | Viewed by 8104
Abstract
More than three decades of observations of tropical cyclone wind and wave fields have resulted in a detailed understanding of wave-growth dynamics, although details of the physics are still lacking. These observations are presented in a consistent manner, which provides the basis to [...] Read more.
More than three decades of observations of tropical cyclone wind and wave fields have resulted in a detailed understanding of wave-growth dynamics, although details of the physics are still lacking. These observations are presented in a consistent manner, which provides the basis to be able to characterize the full wave spectrum in a parametric form throughout tropical cyclones. The data clearly shows that an extended fetch model can be used to represent the maximum significant wave height in such storms. The shape stabilizing influence of nonlinear interactions means that the spectral shape is remarkably similar to fetch-limited cases. As such, the tropical cyclone spectrum can also be described by using well-known parametric models. A detailed process is described to parameterize the wave spectrum at any point in a tropical cyclone. Full article
(This article belongs to the Special Issue Tropical Cyclones and Their Impacts)
Show Figures

Figure 1

10426 KiB  
Article
Development of an Unmanned Aerial Vehicle for the Measurement of Turbulence in the Atmospheric Boundary Layer
by Brandon M. Witte, Robert F. Singler and Sean C. C. Bailey
Atmosphere 2017, 8(10), 195; https://doi.org/10.3390/atmos8100195 - 04 Oct 2017
Cited by 58 | Viewed by 8413
Abstract
This paper describes the components and usage of an unmanned aerial vehicle developed for measuring turbulence in the atmospheric boundary layer. A method of computing the time-dependent wind speed from a moving velocity sensor data is provided. The physical system built to implement [...] Read more.
This paper describes the components and usage of an unmanned aerial vehicle developed for measuring turbulence in the atmospheric boundary layer. A method of computing the time-dependent wind speed from a moving velocity sensor data is provided. The physical system built to implement this method using a five-hole probe velocity sensor is described along with the approach used to combine data from the different on-board sensors to allow for extraction of the wind speed as a function of time and position. The approach is demonstrated using data from three flights of two unmanned aerial vehicles (UAVs) measuring the lower atmospheric boundary layer during transition from a stable to convective state. Several quantities are presented and show the potential for extracting a range of atmospheric boundary layer statistics. Full article
(This article belongs to the Special Issue Atmospheric Measurements with Unmanned Aerial Systems (UAS))
Show Figures

Graphical abstract

5083 KiB  
Article
Moisture Transport Anomalies over the Danube River Basin during Two Drought Events: A Lagrangian Analysis
by Milica Stojanovic, Anita Drumond, Raquel Nieto and Luis Gimeno
Atmosphere 2017, 8(10), 193; https://doi.org/10.3390/atmos8100193 - 03 Oct 2017
Cited by 19 | Viewed by 5693
Abstract
In this paper, we provide a Lagrangian analysis of the anomalies in the moisture transport during two important drought events (1989/1990 and 2003) configured over the Danube River Basin (DRB) region. Firstly, we identified the drought episodes that occurred over the DRB in [...] Read more.
In this paper, we provide a Lagrangian analysis of the anomalies in the moisture transport during two important drought events (1989/1990 and 2003) configured over the Danube River Basin (DRB) region. Firstly, we identified the drought episodes that occurred over the DRB in the period of 1980–2014 through the Standardized Precipitation Evapotranspiration Index (SPEI). SPEI was calculated using monthly Climatic Research Unit (CRU) Time-Series (TS) Version 3.23 precipitation and potential evapotranspiration (PET) datasets with a spatial resolution of 0.5 degrees. The monthly SPEI-1 index was applied to identify the drought episodes and their respective indicators, including duration, severity, and intensity. Two significant drought events were selected: 1989/1990 (presenting dry conditions during October 1989–March 1990) and 2003 (presenting dry conditions during April 2003–September 2003). These events were associated with the two most severe SPEI-1 episodes identified over the DRB during 1980–2014. Then, an analysis of anomalies in the moisture transport was conducted in order to verify possible changes in the moisture supply from the climatological sources for the DRB during these episodes. The moisture transport analysis was performed through a Lagrangian approach, which uses the outputs of the FLEXiblePARTicle dispersion model FLEXPART integrated with one of the reanalysis produced by the European Centre for Medium-Range Weather Forecasts (ECMWF): the ECMWF Re-Analysis (ERA)-Interim dataset. The DRB receives moisture from seven different moisture source regions: the North Atlantic Ocean (NATL), North Africa (NAF), the Mediterranean Sea (MED), the Black Sea (BS), the Caspian Sea (CS), the DRB, and Central and Eastern Europe (Rest of Land (RestL)). The analysis of drought events shows that the precipitation and moisture supply from the selected sources weakened mainly during both drought events. Anomalous subsidence and an increased PET also prevailed over the DRB during these SPEI-1 episodes. RestL and MED registered the most intensive reduction in the moisture supply over the DRB during both periods. Full article
(This article belongs to the Special Issue Water Vapor in the Atmosphere)
Show Figures

Figure 1

4851 KiB  
Article
Impact of Madden–Julian Oscillation upon Winter Extreme Rainfall in Southern China: Observations and Predictability in CFSv2
by Hong-Li Ren and Pengfei Ren
Atmosphere 2017, 8(10), 192; https://doi.org/10.3390/atmos8100192 - 30 Sep 2017
Cited by 40 | Viewed by 6591
Abstract
The impact of Madden–Julian oscillation (MJO) upon extreme rainfall in southern China was studied using the Real-time Multivariate MJO (RMM) index and daily precipitation data from high-resolution stations in China. The probability-distribution function (PDF) of November–March rainfall in southern China was found to [...] Read more.
The impact of Madden–Julian oscillation (MJO) upon extreme rainfall in southern China was studied using the Real-time Multivariate MJO (RMM) index and daily precipitation data from high-resolution stations in China. The probability-distribution function (PDF) of November–March rainfall in southern China was found to be skewed toward larger (smaller) values in phases 2–3 (6–7) of MJO, during which the probability of extreme rainfall events increased (reduced) by 30–50% (20–40%) relative to all days in the same season. Physical analysis indicated that the favorable conditions for generating extreme rainfall are associated with southwesterly moisture convergence and vertical moisture advection over southern China, while the direct contributions from horizontal moisture advection are insignificant. Based on the above results, the model-based predictability for extreme rainfall in winter was examined using hindcasts from the Climate Forecast System version 2 (CFSv2) of NOAA. It is shown that the modulations of MJO on extreme rainfall are captured and forecasted well by CFSv2, despite the existence of a relatively small bias. This study suggests the feasibility of deriving probabilistic forecasts of extreme rainfall in southern China based on RMM indices. Full article
(This article belongs to the Special Issue Madden-Julian Oscillation)
Show Figures

Figure 1

4759 KiB  
Article
Historical Trends and Variability in Heat Waves in the United Kingdom
by Michael G. Sanderson, Theo Economou, Kate H. Salmon and Sarah E. O. Jones
Atmosphere 2017, 8(10), 191; https://doi.org/10.3390/atmos8100191 - 30 Sep 2017
Cited by 22 | Viewed by 6895
Abstract
Increases in numbers and lengths of heat waves have previously been identified in global temperature records, including locations within Europe. However, studies of changes in UK heat wave characteristics are limited. Historic daily maximum temperatures from 29 weather stations with records exceeding 85 [...] Read more.
Increases in numbers and lengths of heat waves have previously been identified in global temperature records, including locations within Europe. However, studies of changes in UK heat wave characteristics are limited. Historic daily maximum temperatures from 29 weather stations with records exceeding 85 years in length across the country were examined. Heat waves were defined as periods with unusually high temperatures for each station, even if the temperatures would not be considered warm in an absolute sense. Positive trends in numbers and lengths of heat waves were identified at some stations. However, for some stations in the south east of England, lengths of very long heat waves (over 10 days) had declined since the 1970s, whereas the lengths of shorter heat waves had increased slightly. Considerable multidecadal variability in heat wave numbers and lengths was apparent at all stations. Logistic regression, using a subset of eight stations with records beginning in the nineteenth century, suggested an association between the Atlantic Multidecadal Oscillation and the variability in heat wave numbers and lengths, with the summertime North Atlantic Oscillation playing a smaller role. The results were robust against different temperature thresholds. Full article
(This article belongs to the Special Issue Temperature Extremes and Heat/Cold Waves)
Show Figures

Figure 1

2329 KiB  
Article
Characterization and Seasonal Variations of Organic and Elemental Carbon and Levoglucosan in PM10 in Krynica Zdroj, Poland
by Krzysztof Klejnowski, Katarzyna Janoszka and Marianna Czaplicka
Atmosphere 2017, 8(10), 190; https://doi.org/10.3390/atmos8100190 - 25 Sep 2017
Cited by 34 | Viewed by 4215
Abstract
In this study, the ambient aerosol (PM10) concentrations of elemental carbon (EC), organic carbon (OC), total carbon (TC), and levoglucosan are reported for a Polish health resort following a one-year (March 2016–April 2017) sampling campaign. The seasonal variation of OC, EC, [...] Read more.
In this study, the ambient aerosol (PM10) concentrations of elemental carbon (EC), organic carbon (OC), total carbon (TC), and levoglucosan are reported for a Polish health resort following a one-year (March 2016–April 2017) sampling campaign. The seasonal variation of OC, EC, and levoglucosan (LG) concentrations showed their maximum during the heating season for this site, with monthly mean total carbonaceous material/PM10 ratios ranging between about 0.28 and 0.44 depending on the season. Average EC concentration was 1.1 ± 0.6 µg∙m−3 and changed from 0.3 µg∙m−3 up to 2.3 µg∙m−3 during the sampling campaign. The OC concentration at the site ranged from 2.4 µg∙m−3 during the non-heating season up to 22 µg∙m−3 in the heating season, with an average of 7 µg∙m−3. A strong correlation between OC and EC in the heating season suggested that they were produced from similar sources during this time. Mean LG concentration during the sampling campaign was 0.51 µg∙m−3, while in the heating season it was 0.72 µg∙m−3 and in 0.19 µg∙m−3 in the non-heating season. The obtained results indicated a strong influence of local primary source emissions on air quality, especially during the heating period. Full article
(This article belongs to the Special Issue Carbonaceous Aerosols in Atmosphere)
Show Figures

Figure 1

1919 KiB  
Article
Summertime Day-Night Differences of PM2.5 Components (Inorganic Ions, OC, EC, WSOC, WSON, HULIS, and PAHs) in Changzhou, China
by Zhaolian Ye, Qing Li, Shuaishuai Ma, Quanfa Zhou, Yuan Gu, Yalan Su, Yanfang Chen, Hui Chen, Junfeng Wang and Xinlei Ge
Atmosphere 2017, 8(10), 189; https://doi.org/10.3390/atmos8100189 - 25 Sep 2017
Cited by 39 | Viewed by 6184
Abstract
This work reports the day-night differences of a suite of chemical species including elemental carbon (EC), organic carbon (OC), water-soluble organic carbon (WSOC), water-soluble organic nitrogen (WSON), selected polycyclic aromatic hydrocarbons (PAHs), and secondary inorganic ions (NO3, SO42− [...] Read more.
This work reports the day-night differences of a suite of chemical species including elemental carbon (EC), organic carbon (OC), water-soluble organic carbon (WSOC), water-soluble organic nitrogen (WSON), selected polycyclic aromatic hydrocarbons (PAHs), and secondary inorganic ions (NO3, SO42−, NH4+) in ambient fine particles (PM2.5) collected from 23 July to 23 August 2016 in Changzhou, China. Mass concentrations of PM2.5 and SO42− show a 10–20% increase during daytime, while NO3 concentration decreases by a factor of three from nighttime to daytime due to its semi-volatile nature. PAHs, EC, and WSON show higher mass concentration in the night too. Mass ratios of WSOC to OC are high in both day and night, indicating that secondary organic aerosol (SOA) formation could occur throughout the day, while the slightly higher ratio during daytime suggests a more significant contribution from daytime photochemical oxidation. Strong positive correlations between HULIS-C and WSOC, and HULIS-C with O3 both in day and night, imply that HULIS-C, similar to WSOC, is mainly composed of secondary species. HULIS-C accounted for a large fraction of WSOC, with an average of ~60%. Moreover, the average WSON concentrations are 1.08 and 1.46 µg/m3, constituting ~16% and ~18% of water-soluble total nitrogen in day and night, respectively. Correlation analyses suggest that WSON is also predominantly produced from secondary processes. PAHs concentrations are found to be very low in summer aerosols. Overall, our findings highlight the dominant contribution of secondary processes to the major aerosol components in Changzhou, suggesting proper measures to effectively reduce gaseous precursors are also important to improve air quality. Full article
(This article belongs to the Special Issue Carbonaceous Aerosols in Atmosphere)
Show Figures

Figure 1

17393 KiB  
Article
Assimilating Conventional and Doppler Radar Data with a Hybrid Approach to Improve Forecasting of a Convective System
by Shibo Gao and Danlian Huang
Atmosphere 2017, 8(10), 188; https://doi.org/10.3390/atmos8100188 - 25 Sep 2017
Cited by 6 | Viewed by 3955
Abstract
A hybrid ensemble adjustment Kalman filter—three-dimensional ensemble—variational (EAKF-En3DVar) system is developed to assimilate conventional and radar data, and is applied to a convective case in Colorado and Kansas, USA. The system is based on the framework of the Weather Research and Forecasting model’s [...] Read more.
A hybrid ensemble adjustment Kalman filter—three-dimensional ensemble—variational (EAKF-En3DVar) system is developed to assimilate conventional and radar data, and is applied to a convective case in Colorado and Kansas, USA. The system is based on the framework of the Weather Research and Forecasting model’s three-dimensional variational (3DVar) and Data Assimilation Research Testbed. A two-step assimilation procedure with a shorter length scale and analysis cycle is used to reduce analysis noise in radar data assimilation. Results show that the hybrid experiment assimilating only conventional data improves the quantitative precipitation forecast (QPF) and quantitative reflectivity forecast over those of a 3DVar experiment, and the improvements are also evident after assimilating radar data. The assimilation of radar data substantially improves the QPF up to seven hours, with either the 3DVar or hybrid method. The hybrid experiment assimilating both conventional and radar data forecasts a more accurate convective system in terms of structure, spatial extent and intensity and produces increased low-level cooling and mid-level warming in the convective region. These improvements are attributable to an improved forecast background field of wind, temperature and water vapor mixing ratio, with maximum root mean square error reduction at the tropopause and near the surface. Full article
(This article belongs to the Section Meteorology)
Show Figures

Figure 1

3978 KiB  
Article
Impact of Grid Nudging Parameters on Dynamical Downscaling during Summer over Mainland China
by Xiaoping Mai, Yuanyuan Ma, Yi Yang, Deqin Li and Xiaobin Qiu
Atmosphere 2017, 8(10), 184; https://doi.org/10.3390/atmos8100184 - 25 Sep 2017
Cited by 12 | Viewed by 4193
Abstract
The grid nudging technique is often used in regional climate dynamical downscaling to make the simulated large-scale fields consistent with the driving fields. In this study, we focused on two specific questions about grid nudging: (1) which nudged variable has a larger impact [...] Read more.
The grid nudging technique is often used in regional climate dynamical downscaling to make the simulated large-scale fields consistent with the driving fields. In this study, we focused on two specific questions about grid nudging: (1) which nudged variable has a larger impact on the downscaling results; and (2) what is the “optimal” grid nudging strategy for each nudged variable to achieve better downscaling result during summer over the mainland China. To solve these queries, 41 three-month-long simulations for the summer of 2009 and 2010 were performed using the Weather Research and Forecasting model (WRF) to downscale National Centers for Environmental Prediction (NCEP) Final Operational Global Analysis (FNL) data to a 30-km horizontal resolution. The results showed that nudging horizontal wind or temperature had significant influence on the simulation of almost all conventional meteorological elements, while nudging water vapor mainly affected the precipitation, humidity, and 500 hPa temperature. As a whole, the optimal nudging time was one hour or three hours for nudging wind, three hours for nudging temperature, and one hour for nudging water vapor. The optimal nudged level was above the planetary boundary layer for almost every nudged variable. Despite these findings, it should be noted that the optimum nudging scheme varied with simulated regions and layers, and dedicated research for different regions, seasons, and model configuration is advisable. Full article
(This article belongs to the Special Issue WRF Simulations at the Mesoscale: From the Microscale to Macroscale)
Show Figures

Figure 1

12538 KiB  
Article
The Variability of Ozone Sensitivity to Anthropogenic Emissions with Biogenic Emissions Modeled by MEGAN and BEIS3
by Eunhye Kim, Byeong-Uk Kim, Hyun Cheol Kim and Soontae Kim
Atmosphere 2017, 8(10), 187; https://doi.org/10.3390/atmos8100187 - 23 Sep 2017
Cited by 13 | Viewed by 5089
Abstract
In this study, we examined how modeled ozone concentrations respond to changes in anthropogenic emissions when different modeled emissions of biogenic volatile organic compounds (BVOCs) are used. With biogenic emissions estimated by the Model of Emissions of Gases and Aerosols from Nature (MEGAN) [...] Read more.
In this study, we examined how modeled ozone concentrations respond to changes in anthropogenic emissions when different modeled emissions of biogenic volatile organic compounds (BVOCs) are used. With biogenic emissions estimated by the Model of Emissions of Gases and Aerosols from Nature (MEGAN) and the Biogenic Emissions Inventory System Version 3 (BEIS3), the Community Multi-scale Air Quality with the High-order Direct Decouple Method (CMAQ-HDDM) simulations were conducted to acquire sensitivity coefficients. For the case study, we chose 17–26 August 2007, when the Southern Korean peninsula experienced region-wide ozone standard exceedances. The results show that modeled local sensitivities of ozone to anthropogenic emissions in certain NOx-saturated places can differ significantly depending on the method used to estimate BVOC emission, with an opposite trend of ozone changes alongside NOx reductions often shown in model runs using MEGAN and BEIS3. Findings of increased ozone concentrations with one model and decreased ozone concentrations with the other model implies that estimating BVOCs emissions is an important element in predicting variability in ozone concentration and determining the responses of ozone concentrations to emission changes, a discovery that may lead to different policy decisions related to air quality improvement. Quantitatively, areas in the 3-km modeling domain that experienced daily maximum one-hour ozone concentrations greater than 120 ppb (MDA1O3) showed differences of over 20 ppb in MDA1O3 values between model runs with MEGAN and BEIS3. For selected monitoring sites, the maximum difference in relative daily maximum eight-hour ozone concentrations (MDA8O3) response between the methods to model BVOCs was 4.2 ppb in MDA8O3 when we adopted a method similar to the Relative Reduction Factor used by the US Environmental Protection Agency (EPA). Full article
(This article belongs to the Special Issue Tropospheric Ozone and Its Precursors)
Show Figures

Figure 1

6569 KiB  
Article
Characterization of Particulate Matter (PM2.5 and PM10) Relating to a Coal Power Plant in the Boroughs of Springdale and Cheswick, PA
by Casey D. Bray, William Battye, Pornpan Uttamang, Priya Pillai and Viney P. Aneja
Atmosphere 2017, 8(10), 186; https://doi.org/10.3390/atmos8100186 - 23 Sep 2017
Cited by 10 | Viewed by 5473
Abstract
Ambient concentrations of both fine particulate matter (PM2.5) and particulate matter with an aerodynamic diameter less than 10 micron (PM10) were measured from 10 June 2015 to 13 July 2015 at three locations surrounding the Cheswick Power Plant, which [...] Read more.
Ambient concentrations of both fine particulate matter (PM2.5) and particulate matter with an aerodynamic diameter less than 10 micron (PM10) were measured from 10 June 2015 to 13 July 2015 at three locations surrounding the Cheswick Power Plant, which is located between the boroughs of Springdale and Cheswick, Pennsylvania. The average concentrations of PM10 observed during the periods were 20.5 ± 10.2 μg m−3 (Station 1), 16.1 ± 4.9 μg m−3 (Station 2) and 16.5 ± 7.1 μg m−3 (Station 3). The average concentrations of PM2.5 observed at the stations were 9.1 ± 5.1 μg m−3 (Station 1), 0.2 ± 0.4 μg m−3 (Station 2) and 11.6 ± 4.8 μg m−3 (Station 3). In addition, concentrations of PM2.5 measured by four Pennsylvania Department of Environmental Protection air quality monitors (all within a radius of 40 miles) were also analyzed. The observed average concentrations at these sites were 12.7 ± 6.9 μg m−3 (Beaver Falls), 11.2 ± 4.7 μg m−3 (Florence), 12.2 ± 5.3 μg m−3 (Greensburg) and 12.2 ± 5.5 μg m−3 (Washington). Elemental analysis for samples (blank – corrected) revealed the presence of metals that are present in coal (i.e., antimony, arsenic, beryllium, cadmium, chromium, cobalt, lead, manganese, mercury, nickel and selenium). Full article
(This article belongs to the Special Issue Air Quality Monitoring and Forecasting)
Show Figures

Figure 1

17400 KiB  
Article
Empirical Subseasonal Prediction of Summer Rainfall Anomalies over the Middle and Lower Reaches of the Yangtze River Basin Based on Atmospheric Intraseasonal Oscillation
by Zhiwei Zhu, Shengjie Chen, Kai Yuan, Yini Chen, Song Gao and Zhenfei Hua
Atmosphere 2017, 8(10), 185; https://doi.org/10.3390/atmos8100185 - 22 Sep 2017
Cited by 14 | Viewed by 4074
Abstract
The middle and lower reaches of the Yangtze River basin (MLRYB) are prone to flooding because their orientation is parallel to the East Asian summer monsoon rain belt. Since the East Asian summer monsoon presents pronounced intraseasonal variability, the subseasonal prediction of summer [...] Read more.
The middle and lower reaches of the Yangtze River basin (MLRYB) are prone to flooding because their orientation is parallel to the East Asian summer monsoon rain belt. Since the East Asian summer monsoon presents pronounced intraseasonal variability, the subseasonal prediction of summer precipitation anomalies in the MLRYB region is an imperative demand nationwide. Based on rotated empirical orthogonal function analysis, 48 stations over the MLRYB with coherent intraseasonal (10–80-day) rainfall variability are identified. Power spectrum analysis of the MLRYB rainfall index, defined as the 48-station-averaged intraseasonal rainfall anomaly, presents two dominant modes with periods of 20–30 days and 40–60 days, respectively. Therefore, the intraseasonal (10–80-day) rainfall variability is divided into 10–30-day and 30–80-day components, and their predictability sources are detected separately. Spatial-temporal projection models (STPM) are then conducted using these predictability sources. The forecast skill during the period 2003–2010 indicates that the STPM is able to capture the 30–80-day rainfall anomalies 5–30 days in advance, but unable to reproduce the 10–30-day rainfall anomalies over MLRYB. The year-to-year fluctuation in forecast skill might be related to the tropical Pacific sea surface temperature anomalies. High forecasting skill tends to appear after a strong El Niño or strong La Niña when the summer seasonal mean rainfall over the MLRYB is enhanced, whereas low skill is apparent after neutral conditions or a weak La Niña when the MLRYB summer seasonal mean rainfall is weakened. Given the feasibility of STPM, the application of this technique is recommended in the real-time operational forecasting of MLRYB rainfall anomalies during the summer flooding season. Full article
(This article belongs to the Special Issue Madden-Julian Oscillation)
Show Figures

Figure 1

235 KiB  
Review
Air Pollution and Public Health: A PRISMA-Compliant Systematic Review
by Marco Quarato, Luigi De Maria, Maria Franca Gatti, Antonio Caputi, Francesca Mansi, Pietro Lorusso, Francesco Birtolo and Luigi Vimercati
Atmosphere 2017, 8(10), 183; https://doi.org/10.3390/atmos8100183 - 22 Sep 2017
Cited by 30 | Viewed by 5691
Abstract
(1) Background: Particulate matter increases the risk of respiratory, allergic and oncological diseases in both exposed workers and the general population due to its toxic compounds (e.g., PAHs, gases, heavy metals, microorganisms). The aim of this review is to show the results obtained [...] Read more.
(1) Background: Particulate matter increases the risk of respiratory, allergic and oncological diseases in both exposed workers and the general population due to its toxic compounds (e.g., PAHs, gases, heavy metals, microorganisms). The aim of this review is to show the results obtained by our department regarding air pollution’s contributions to health damage in both occupationally and non-occupationally exposed people. (2) Methods: This review was performed according to Preferred Reporting Items for Systematic Reviews and Meta-Analyses (PRISMA) guidelines, searching articles on PubMed, using eligibility criteria, extracting data independently from reports to reduce bias and considering the accuracy of the statistical analyses. (3) Results: Of fifteen papers, only three respected the abovementioned criteria. A total of 453 cases (174 occupationally exposed and 279 non-occupationally exposed individuals) were included in the review. Qualitative analysis showed that among workers, occupational exposure to air pollution increased the risk of allergic and pulmonary diseases, whereas environmental exposure to PM increased heavy metal intake, the last of which was characterized by well-known carcinogenic effects. 4) Conclusion: The use of personal protective equipment, a meticulous health surveillance program and specific environmental protection policies are needed to protect public health from damages due to air pollution. Full article
(This article belongs to the Special Issue Urban Air Pollution)
1653 KiB  
Review
Interpreting Mobile and Handheld Air Sensor Readings in Relation to Air Quality Standards and Health Effect Reference Values: Tackling the Challenges
by George M. Woodall, Mark D. Hoover, Ronald Williams, Kristen Benedict, Martin Harper, Jhy-Charm Soo, Annie M. Jarabek, Michael J. Stewart, James S. Brown, Janis E. Hulla, Motria Caudill, Andrea L. Clements, Amanda Kaufman, Alison J. Parker, Martha Keating, David Balshaw, Kevin Garrahan, Laureen Burton, Sheila Batka, Vijay S. Limaye, Pertti J. Hakkinen and Bob Thompsonadd Show full author list remove Hide full author list
Atmosphere 2017, 8(10), 182; https://doi.org/10.3390/atmos8100182 - 21 Sep 2017
Cited by 33 | Viewed by 7130
Abstract
The US Environmental Protection Agency (EPA) and other federal agencies face a number of challenges in interpreting and reconciling short-duration (seconds to minutes) readings from mobile and handheld air sensors with the longer duration averages (hours to days) associated with the National Ambient [...] Read more.
The US Environmental Protection Agency (EPA) and other federal agencies face a number of challenges in interpreting and reconciling short-duration (seconds to minutes) readings from mobile and handheld air sensors with the longer duration averages (hours to days) associated with the National Ambient Air Quality Standards (NAAQS) for the criteria pollutants-particulate matter (PM), ozone, carbon monoxide, lead, nitrogen oxides, and sulfur oxides. Similar issues are equally relevant to the hazardous air pollutants (HAPs) where chemical-specific health effect reference values are the best indicators of exposure limits; values which are often based on a lifetime of continuous exposure. A multi-agency, staff-level Air Sensors Health Group (ASHG) was convened in 2013. ASHG represents a multi-institutional collaboration of Federal agencies devoted to discovery and discussion of sensor technologies, interpretation of sensor data, defining the state of sensor-related science across each institution, and provides consultation on how sensors might effectively be used to meet a wide range of research and decision support needs. ASHG focuses on several fronts: improving the understanding of what hand-held sensor technologies may be able to deliver; communicating what hand-held sensor readings can provide to a number of audiences; the challenges of how to integrate data generated by multiple entities using new and unproven technologies; and defining best practices in communicating health-related messages to various audiences. This review summarizes the challenges, successes, and promising tools of those initial ASHG efforts and Federal agency progress on crafting similar products for use with other NAAQS pollutants and the HAPs. NOTE: The opinions expressed are those of the authors and do not necessary represent the opinions of their Federal Agencies or the US Government. Mention of product names does not constitute endorsement. Full article
(This article belongs to the Special Issue Air Quality Monitoring and Forecasting)
Show Figures

Figure 1

2445 KiB  
Article
Effects of N Fertilizer Application on Soil N2O Emissions and CH4 Uptake: A Two-Year Study in an Apple Orchard in Eastern China
by Baohua Xie, Jiangxin Gu, Junbao Yu, Guangxuan Han, Xunhua Zheng, Yu Xu and Haitao Lin
Atmosphere 2017, 8(10), 181; https://doi.org/10.3390/atmos8100181 - 21 Sep 2017
Cited by 21 | Viewed by 4676
Abstract
Land use changes from cropland to orchards in Eastern China have raised serious concerns about the regional nitrogen (N) cycle and greenhouse gas balance. We measured soil nitrous oxide (N2O) emissions and methane (CH4) uptake using manual static chambers [...] Read more.
Land use changes from cropland to orchards in Eastern China have raised serious concerns about the regional nitrogen (N) cycle and greenhouse gas balance. We measured soil nitrous oxide (N2O) emissions and methane (CH4) uptake using manual static chambers in an apple orchard. The primary aims were to assess the effect of N fertilizer application on gas fluxes and quantify the site-specific N2O emission factor (EFd). Field experiments were arranged in a randomized block design with three N input rates (0, 800 and 2600/2000 kg N ha−1 year−1). We found that orchard soils were a negligible CH4 sink (−1.1 to −0.4 kg C ha−1 year−1). Annual N2O emissions responded positively to N input rates, ranging from 34.1 to 60.3 kg N ha−1 year−1. EFd ranged from 1.00% to 1.65% with a mean of 1.34%. The extremely large background emissions of N2O (34.1–34.3 kg N ha−1 year−1) most likely originated from nitrate accumulation in the soil profile because of historical overuse of N fertilizer. We conclude that (1) site-specific EFd is suitable for assessing regional direct N2O emissions from upland orchards; and (2) conventional fertilization regimes must be avoided, and reduced N input rates are recommended in the study region. Full article
(This article belongs to the Special Issue C and N Cycling and Greenhouse Gases Emission in Agroecosystem)
Show Figures

Figure 1

Previous Issue
Next Issue
Back to TopTop