Article

Atmospheric Ozone and Methane in a Changing Climate

1
Department of Geosciences, University of Oslo, N-0315 Oslo, Norway
2
Center for International Climate and Environmental Research—Oslo (CICERO), N-0318 Oslo, Norway
3
Department of Geology and Geoenvironment, University of Athens, 15784 Athens, Greece
4
NORWEGIAN Institute for Air Research (NILU), N-2027 Kjeller, Norway
5
Academy of Athens, 10680 Athens, Greece
6
University of California, Irvine, CA 92697, USA
*
Author to whom correspondence should be addressed.
Atmosphere 2014, 5(3), 518-535; https://doi.org/10.3390/atmos5030518
Submission received: 13 September 2013 / Revised: 19 March 2014 / Accepted: 17 June 2014 / Published: 29 July 2014
(This article belongs to the Special Issue Climate-Chemistry Interactions)

Abstract

:
Ozone and methane are chemically active climate-forcing agents affected by climate–chemistry interactions in the atmosphere. Key chemical reactions and processes affecting ozone and methane are presented. It is shown that climate-chemistry interactions have a significant impact on the two compounds. Ozone, which is a secondary compound in the atmosphere, produced and broken down mainly in the troposphere and stratosphre through chemical reactions involving atomic oxygen (O), NOx compounds (NO, NO2), CO, hydrogen radicals (OH, HO2), volatile organic compounds (VOC) and chlorine (Cl, ClO) and bromine (Br, BrO). Ozone is broken down through changes in the atmospheric distribution of the afore mentioned compounds. Methane is a primary compound emitted from different sources (wetlands, rice production, livestock, mining, oil and gas production and landfills).Methane is broken down by the hydroxyl radical (OH). OH is significantly affected by methane emissions, defined by the feedback factor, currently estimated to be in the range 1.3 to 1.5, and increasing with increasing methane emission. Ozone and methane changes are affected by NOx emissions. While ozone in general increase with increases in NOx emission, methane is reduced, due to increases in OH. Several processes where current and future changes have implications for climate-chemistry interactions are identified. It is also shown that climatic changes through dynamic processes could have significant impact on the atmospheric chemical distribution of ozone and methane, as we can see through the impact of Quasi Biennial Oscillation (QBO). Modeling studies indicate that increases in ozone could be more pronounced toward the end of this century. Thawing permafrost could lead to important positive feedbacks in the climate system. Large amounts of organic material are stored in the upper layers of the permafrost in the yedoma deposits in Siberia, where 2 to 5% of the deposits could be organic material. During thawing of permafrost, parts of the organic material that is deposited could be converted to methane. Furthermore, methane stored in deposits under shallow waters in the Arctic have the potential to be released in a future warmer climate with enhanced climate impact on methane, ozone and stratospheric water vapor. Studies performed by several groups show that the transport sectors have the potential for significant impacts on climate-chemistry interactions. There are large uncertainties connected to ozone and methane changes from the transport sector, and to methane release and climate impact during permafrost thawing.

1. Introduction

The chemically active climate gases ozone (O3) and methane (CH4) respond to variability in the current climate and will be affected by future climate change ([1,2]). O3 and CH4 will in addition to being influenced by atmospheric chemistry respond on changes in solar radiation, atmospheric temperature and dynamics, and are expected to play an important role for processes determining the interaction between the biosphere and the atmosphere ([2,3,4]). CH4 chemistry is also affecting climate through its impact on ozone ([5]). Emissions of air pollutants and their precursors, which determine regional air quality by perturbing ozone and methane has also the possibility to alter climate. Climate changes will affect chemical processes in the atmosphere through transport on local and large scales and through removal and formation of pollutants ([6,7]).
Ozone is a secondary compound formed and partly broken down in the atmosphere, but also deposited at the Earth’s surface, where it has a negative impact ([8,9]). High surface ozone levels harm humans through the respiratory system, and damage plant growth. Important changes in climate-chemistry interactions involving ozone occur via emission changes in ozone precursors and surface deposition of ozone due to changes in surface dryness ([1,10]). Furthermore, ozone is affecting the stratosphere through impact on dynamical chemical processes ([11,12,13]), and thereby on tropospheric gaseous distribution through modification of solar input ([14]). Enhanced oxidation is due to higher temperatures in synoptic high pressure systems with more sunlight favoring ozone production [15]. In addition, enhanced CH4 emission from permafrost thawing in the Arctic and from other sources like wetlands and mining will enhance global methane and thereby ozone.
The chemical distribution, the oxidation potential and climate will be affected by O3 and CH4 perturbations ([4,16,17]). Perturbation of climate from O3 and CH4 changes will take place in the troposphere and in the stratosphere on local and global scales ([6]). Additional effects of ozone include reduced CO2 uptake by plants ([9,18]).
Large methane changes will affect climate. For instance CH4 seems to have been involved in a sudden warming that took place at the end of the Younger Dryas cold period with release from wetlands as a possible source ([19]). A potential important CH4 source during permafrost thawing is the direct release from sub-sea deposits at the Siberian Shelf ([20,21,22]). Changes in CH4 loss through the reaction with OH could also affect methane.
Emission of NOx from ships is estimated to increase OH in the background atmosphere and lead to enhanced loss of methane ([23,24]). Enhanced release of CH4 and CO are of particular importance, since the reactions with these two compounds are major loss processes for OH, giving reductions in OH, thereby leading to further increases in CH4.
In this article we will review studies of climate-chemistry interactions affecting current and future distributions of atmospheric O3 and CH4. Included in the review are one way studies of how the transport sector affects climate. We include studies by other groups and by the participating groups. In Section 2—“Atmospheric chemistry affecting ozone and methane in the atmosphere”, some key chemical reactions (2.1) for O3 and CH4 in the troposphere and stratosphere are given, along with pollutant emission and their impact on ozone, methane and radiative forcing (RF) (2.2) and the impact of increased temperatures on tropospheric ozone levels (2.3). In Section 3—“Studies of climate-chemistry interactions”; IPCC activities (3.1), biosphere-atmosphere couplings (3.2), impact of methane emission from Arctic thawing (3.3), the impact of transport on the late winter ozone values in the Arctic in 2011 (3.4), and stratospheric ozone variability due to changes in dynamics (3.5) are presented. Section 4—“Conclusions” summarizes the findings.

2. Processes Affecting Ozone and Methane

2.1. Important Ozone and Methane Chemistry

Shortwave solar radiation is essential for ozone production. Nitrogen oxides (NO, NO2) and free hydrogen radicals (H, OH, HO2) are involved in the ozone formation processes in sunlit regions (Equations (1)–(5)):
NO + HO2 → NO2 + OH
OH + CO → H + CO2
H + O2 + M → HO2 + M
NO2 + hν → NO + O
O + O2 + M → O3 + M
Here, represents the energy of a solar photon and M is a third body (usually O2 or N2).
A main ozone loss reaction in the troposphere, in addition to surface deposition, is the reaction with the hydrogen peroxy radical (Equation (6)):
O3 + HO2 → 2O2 + OH
This reaction also represents a key process for OH production in the background atmosphere.
In the middle and upper stratosphere, ozone is produced through solar dissociation of O2 (Equation (7)) followed by recombination of atomic oxygen with an O2 molecule (Equation (8)):
O2 + → O + O
O + O2 + M → O3 + M
In the stratosphere, ozone is lost mainly through reactions involving NOx and halogen-containing compounds (chlorine and bromine). Key reactions are of the type (Equations (9)–(11)):
O3 + → O + O2
O + OX → O2 + X
X + O3 → XO + O2
X could either be an OH, NO, Cl or Br radical.
Tropospheric O3 can be lost through photolysis (Equation (9)) in the presence of water vapor (Equation (12)):
O(1D) + H2O → OH + OH
where O(1D) is an excited state atomic oxygen atom. Besides the loss to hydrogen peroxy radical in Equation (6), another important O3 loss in the troposphere is the reaction with hydroxyl (Equation (13)):
O3 + OH → O2 + HO2
Equations (1), (9) and (12), with NO, O3 and H2O, respectively, represent key primary source of OH in the troposphere and lower stratosphere, while Equation (13) represents a loss reaction in the free troposphere. The main loss reaction for OH in the free troposphere is Equation (2) with CO.
Another important loss reaction for OH in the atmosphere is the reaction with methane (Equation (14)):
CH4 + OH → CH3 + H2O
CH4 is a primary compound, emitted by different natural and anthropogenic sources (wetlands, rice production, livestock, mining, oil and gas production and landfills). The reaction with OH is the key loss reaction for atmospheric methane.
Through the reaction OH methane has a lifetime of the order of 8 years in the lower atmosphere (troposphere and stratosphere). CH3 is oxidized rapidly in the atmosphere to yield O3 (in the presence of NOx) and CO ([2,25]). Since CO is formed in the oxidation chain it will give further loss of OH. A minor fraction of methane will be removed through surface deposition (5% or less). Since the reaction with OH represents a main loss for CH4 as well as an additional sink for OH, it affects the CH4 lifetime. This process defines a feedback factor, which under current conditions is in the range 1.3 to 1.5 ([26,27,28]). The feedback factor could increase in the future if methane emissions increase. It has been shown that the increase in O3 is non-linear with relatively higher impact on ozone for high CH4 emissions ([20]).

2.2. Pollutant Emissions and Their Impact on Ozone, Methane and Radiative Forcing (RF)

There could be significant changes in the production of NOx from lightning as a result of changes in climate. Mickley et al. [29] considered earlier observations of ozone in connection with estimates of NOx emissions from lightning and impact on ozone and RF, and they concluded that the uncertainties in ozone production from lightning NOx emissions was larger than previously estimated.
Fiore et al. [6] looked at the impact of changes in lightning activity on the NOx distribution and furthermore on the ozone distribution. They found that emissions of air pollutants affect climate and that climate has an impact on chemical processes and on dynamical processes transporting pollutants from one region to a neighboring region. It was found that reducing the precursor CH4 would slow near-term warming by decreasing both CH4 and tropospheric O3. There was significant uncertainty with the net climate forcing from anthropogenic nitrogen oxides (NOx) emissions, which increased tropospheric O3 (warming) but also decreased CH4 (cooling). Anthropogenic emissions of carbon monoxide (CO) and non-methane volatile organic compounds (NMVOC) were found to increase both O3 and CH4 because these compounds are ozone precursors, and increased methane since OH is reduced. A better understanding of how air pollution control influences climate is needed [30]. Comparisons with earlier studies were made. They also reviewed studies of the implications of projected changes in methane and ozone precursors for climate change and hemispheric-to-continental scale air quality.
Brasseur et al. [31] studied the impact of climate change on the future chemical composition of the atmosphere over the period 2000 to 2100 with the MOZART-2 model using meteorological fields provided by the ECAM5/Max Planck Ocean Institute Model. The study suggests that the impact on ozone of climate change is negative in large part of the troposphere as a result of enhanced destruction due to high levels of water vapor. The magnitude of the impact from climate change is smaller than the positive impact from emission changes. They also found that NOx levels from lightning production are increasing substantially.
Ozone levels are enhanced substantially when methane increases. Figure 1 shows the estimated ozone levels in the troposphere and UTLS (upper troposphere/lower stratosphere) region from Brasseur et al. [31] when the contribution from methane is included and not included.
Studies of the impact of precursor emissions on O3 and OH in different regions, and from different transport sub-sectors have been performed for compounds like NOx, CO, CH4 and NMHC, ([2,7,24,32,33,34,35,36,37,38,39]). In particular the effects from the transport sub-sectors aircraft and ship have been studied extensively ([2,6,7,24,32,34]).
Large scale ship emissions (remote areas) and aircraft (altitude range 8 km to 12 km) emissions occur in regions with moderate emission from other sources, while land based (road) emissions occur in areas where emission from other sources often are large. Estimates of the transport subsectors impact on O3, CH4 and on RF from the transport sectors show large differences in individual studies.
To illustrate the differences in impact from the transport subsectors we present the results from the study of [7]. They report results from 14 global chemistry transport models (CTMs). Regional distribution of the ensemble-mean surface ozone change is reproduced well. By using the Representative Concentration Pathway (RCP) emission scenarios it is shown how regional surface ozone is likely to respond to emission changes by 2050 and how changes in precursor emissions and atmospheric methane contribute to this. In the SRES A1B, A2 and B2 scenarios surface O3 increases in 2050 there is little pollution control, whereas the RCP scenarios project stricter controls on precursor emissions. The study gave lower surface O3 than at present. A large fraction of the difference between scenarios can be attributed to differences in methane abundance. The study showed the importance of limiting atmospheric methane growth, but also showed the uncertainty of modeled ozone responses to methane changes.
Figure 1. Percent change in the July zonally averaged ozone concentration between years 2000 and 2100, when the adopted change in the methane level (top) is included in the calculations and (bottom) is ignored. (Figure 1 is from Brasseur et al. [31])
Atmosphere 05 00518 g001
Global-scale NOx emission from aviation enhances ozone and reduces methane in the UTLS region. Skowron et al. [34] estimated that warming from ozone exceeded cooling from methane. This is in agreement with other studies of aircraft impact on RF from NOx initiated impact on ozone and methane ([24,33]). Methane reduction results in a small long-term reduction in tropospheric ozone (cooling) and a long-term reduction in water vapor in the stratosphere (cooling) from reduced oxidation of methane. Both have negative radiative forcing impacts.
Future impact of traffic emissions on atmospheric ozone and OH has been investigated separately for the three sectors: aircraft, maritime shipping and road traffic [32]. Results were presented from an ensemble of six different CTMs. The models simulated the atmospheric chemical composition in a possible high emission scenario (A1B), and with emissions from each of the transport sectors reduced by 5% to estimate sensitivities. The results were compared with more optimistic future emission scenarios (B1 and B1 ACARE). Current emissions are closer to the A1B than to the B1 scenario.
As a response to expected increase in emissions, air and ship traffic will increase their impacts on atmospheric O3 and OH in the future, while the impact of road traffic is assumed to be reduced as a result of technological improvements. Summer maximum aircraft-induced O3 occurs in the UTLS region at high latitudes, and could in 2050 be as high as 9 ppb for the zonal mean. Emissions from ship traffic have their largest O3 impact in the maritime boundary layer with a maximum of 6 ppb over the North Atlantic Ocean during the summer months in 2050. The O3 perturbations of road traffic emissions are less pronounced than the perturbations from aircraft and ship. Maximum future impact of road is in the lower troposphere and peaks at 3 ppb over the Arabian Peninsula. However, for 2003, the emission assumed was much lower than the emission in 2000. A negative development in RF from road traffic prior to 2050 is temporary and induced by the strong decline in road emissions assumed. An emission scenario for road emissions (A1ACARE) assumes failures in the adopted B1 and A1B scenarios.
Calculations of NOx RF from ship have a negative overall impact from ozone and methane combined, while RF from aircraft and road NOx emissions are slightly positive. The RF from ship is estimated to become more negative in 2050 than in 2000.
Although the results vary between different model studies, the impact on RF is still positive if we consider all NOx effects from aircraft emissions. The Skowron et al. [34] paper, where six different aircraft NOx emission inventories were applied, gave rise to positive and negative RF impacts from air traffic. However, the variability of net radiative forcing impacts was significant between the inventories. From these calculations on aviation NOx, a wide range of Global Warming Potentials (GWP) for a 100-year time horizon was estimated. The estimates of vertical displacement of emission at chemically sensitive cruise altitudes strongly affects the assessment of the total radiative impact. In a study [40], it was also found that aviation NOx has an overall warming impact. Their study gave a GWP that was estimated to be 52 ± 52.

2.3. Impact of Increased Temperatures on Tropospheric Ozone Levels
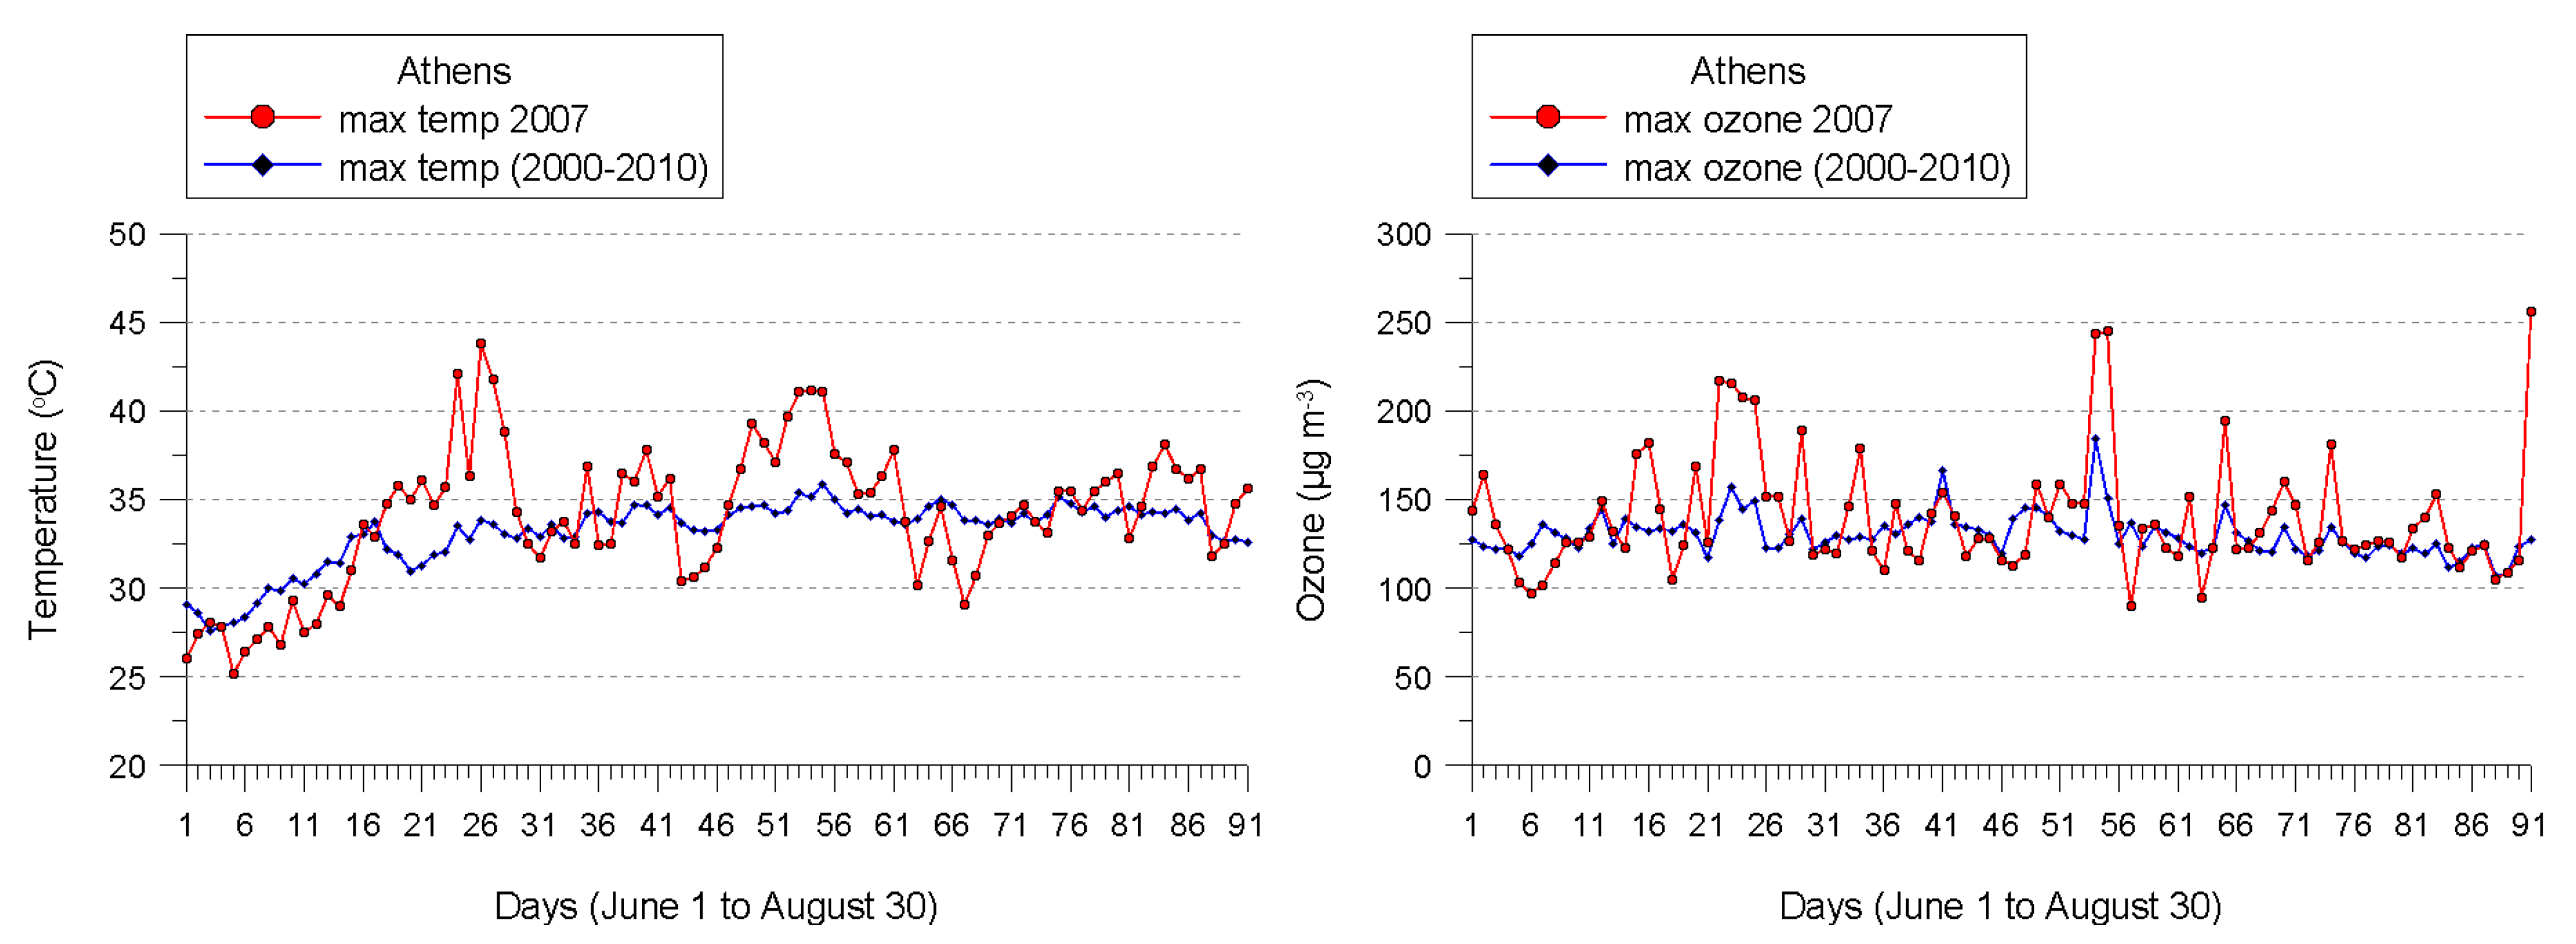
The increase in ozone production with increasing atmospheric temperatures was demonstrated for Western Europe for the summer months of 2003 in the paper by Solberg et al. [10] and for the Eastern Mediterranean region for the summer months of 2007 by Hodnebrog et al. [41]. The study by Solberg et al. [10] showed that an increase of atmospheric temperatures of 10 degrees, enhanced ozone levels by 4 ppb. They also argued that high temperatures triggered fires and isoprene emissions that will lead to more ozone production. Another positive link demonstrated in the papers was the strong relation of ozone levels to reduced uptake from enhanced surface dryness. Ozone levels above the ground were enhanced by 17 ppb when surface deposition was omitted.
Figure 2 shows that, during periods with high temperatures during the summer of 2007, ozone levels were higher than during the reference period 2000 to 2010. This is an indication that in a future warmer climate with more frequent heat waves, ozone levels are likely to be enhanced.
Figure 2. Observed maximum diurnal temperatures (red left) and ozone levels (red right) during the summer months (1 June to 30 August) of 2007, compared to average diurnal maximum for the period 2000 to 2010.
Atmosphere 05 00518 g002
In order to show the impact of enhanced atmospheric temperatures on ozone levels we compare the observed diurnal maximum for each of the three summer months of 2007 with the reference period 2000–2010. We have also included in Table 1 the ozone values for the period 1961–1990. Two factors are important for increased ozone levels in recent years compared to earlier years. Enhanced emission of ozone precursors is a major factor for the increase in ozone levels as demonstrated in Table 1. We also suggest that increased frequency of heath waves due to climate change in the future will enhance pollution levels, including ozone, over regions with high emissions, as is shown for Western Europe in 2003 [10], and for the Eastern Mediterranean region in 2007 [41].
Table 1. Observed maximum monthly average of surface ozone (ppb) over Athens during June, July and August 2007, compared with observed monthly during the periods 2000–2010 and 1961–1990.
Maximum Monthly Average (Observations)JuneJulyAugust3 Months Average
200773706870
2000–201065686165
1961–199035474041

3. Climate-Chemistry Interactions

3.1. IPCC Relevance

O3, its precursors and methane are affected by climate change through climate-chemistry interactions in the troposphere and in the stratosphere. Since ozone and methane are chemically active and important climate gases emission of ozone precursors and methane emission affect their contributions to climate change and their chemical behavior.
Modeling and observational analyses suggest a warmer climate degrades air quality (increasing surface ozone and particulate matter) in many populated regions. Such situations could be rather severe during pollution episodes. Although prior Intergovernmental Panel on Climate Change (IPCC) emission scenarios (SRES) had no restrictions on air pollutants, current Representative Concentration Pathway (RCP) scenarios assume uniformly an extensive reduction in emissions of air pollutants. More recent estimates from the current generation of chemistry-climate models project improved air quality over the next century relative to those using the IPCC SRES scenarios. It is assumed that the two sets of projections likely bracket possible future emission scenarios. One finding is that uncertainties in emission-driven changes in air quality are generally greater than uncertainties in climate-driven changes.
Confidence in air quality projections is limited by the reliability of anthropogenic emission trajectories and the uncertainties in regional climate responses and feedback with the terrestrial biosphere, and oxidation pathways affecting ozone.

3.2. Biosphere-Atmosphere Coupling

Changes in land cover may have significant consequences for atmospheric composition and air quality. Biogenic volatile organic compounds (VOCs; e.g., isoprene and monoterpenes) and nitric oxide (NO) emitted from certain vegetation species are important precursors for tropospheric ozone [3]. Although there have been several studies dealing with land use changes ([42,43,44,45]) possible effects on atmospheric chemistry and air pollution are still connected with significant uncertainties [46]. Wu et al. [46] studied the potential effects associated with future changes in vegetation driven by atmospheric CO2 concentrations, climate, and anthropogenic land use over the 21st century. They performed a series of model experiments, which combined a general circulation model with a dynamic global vegetation model and an atmospheric chemical-transport model. Their studies indicate that climate-and CO2-induced changes in vegetation composition and density between 2000 and 2100 could lead to decreases in summer afternoon surface ozone of up to 10 ppb over large areas of the northern mid-latitudes. This is largely driven by the substantial increases in ozone dry deposition associated with increases in vegetation density in a warmer climate with higher atmospheric CO2 abundance. Climate-driven vegetation changes over the period 2000–2100 lead to general increases in isoprene emissions, globally by 15% in 2050 and 36% in 2100. These increases in isoprene emissions result in decreases in surface ozone concentrations where the NOx levels are low, such as in remote tropical rainforests. Over polluted regions, such as the north-eastern United States, ozone concentrations are calculated to increase with higher isoprene emissions in the future. For a future scenario with anthropogenic land use changes, Wu et al. [46] find less increase in global isoprene emissions due to replacement of higher-emitting forests by lower-emitting cropland. They find large regional variations in surface ozone toward 2100.
In a review article on ecosystems-atmosphere interactions and atmospheric composition change, Fowler et al. [3] included studies of ozone and methane. They were also considering a large number of gaseous and particle compounds (NO, NO2, HONO, HNO3, NH3, SO2, DMS, biogenic VOC and N2O) that could affect ozone and methane processes and distributions. They found that changes in climate and chemical conditions could have a wide range of effects on the interaction of the biosphere with tropospheric ozone and hydroxyl radicals. Included in the study were ozone deposition, removal of NOx and biogenic emissions of ozone depleting compounds.
Changes in precursor emissions and long term changes in meteorology could affect tropospheric chemistry and the dry deposition process. Characteristics of vegetation cover and land use may be altered on different scales as a result of human activities.
Higher future temperatures and changes in precipitation patterns could elevate CO2 and O3 concentrations, and may act as significant modifiers of surface uptake of gases. Sitch et al. [9] showed that uptake of CO2 in vegetation is significantly less for high levels of ozone, although Kvalevåg and Myhre [18] got smaller reduction in the CO2 uptake than in the previous study.

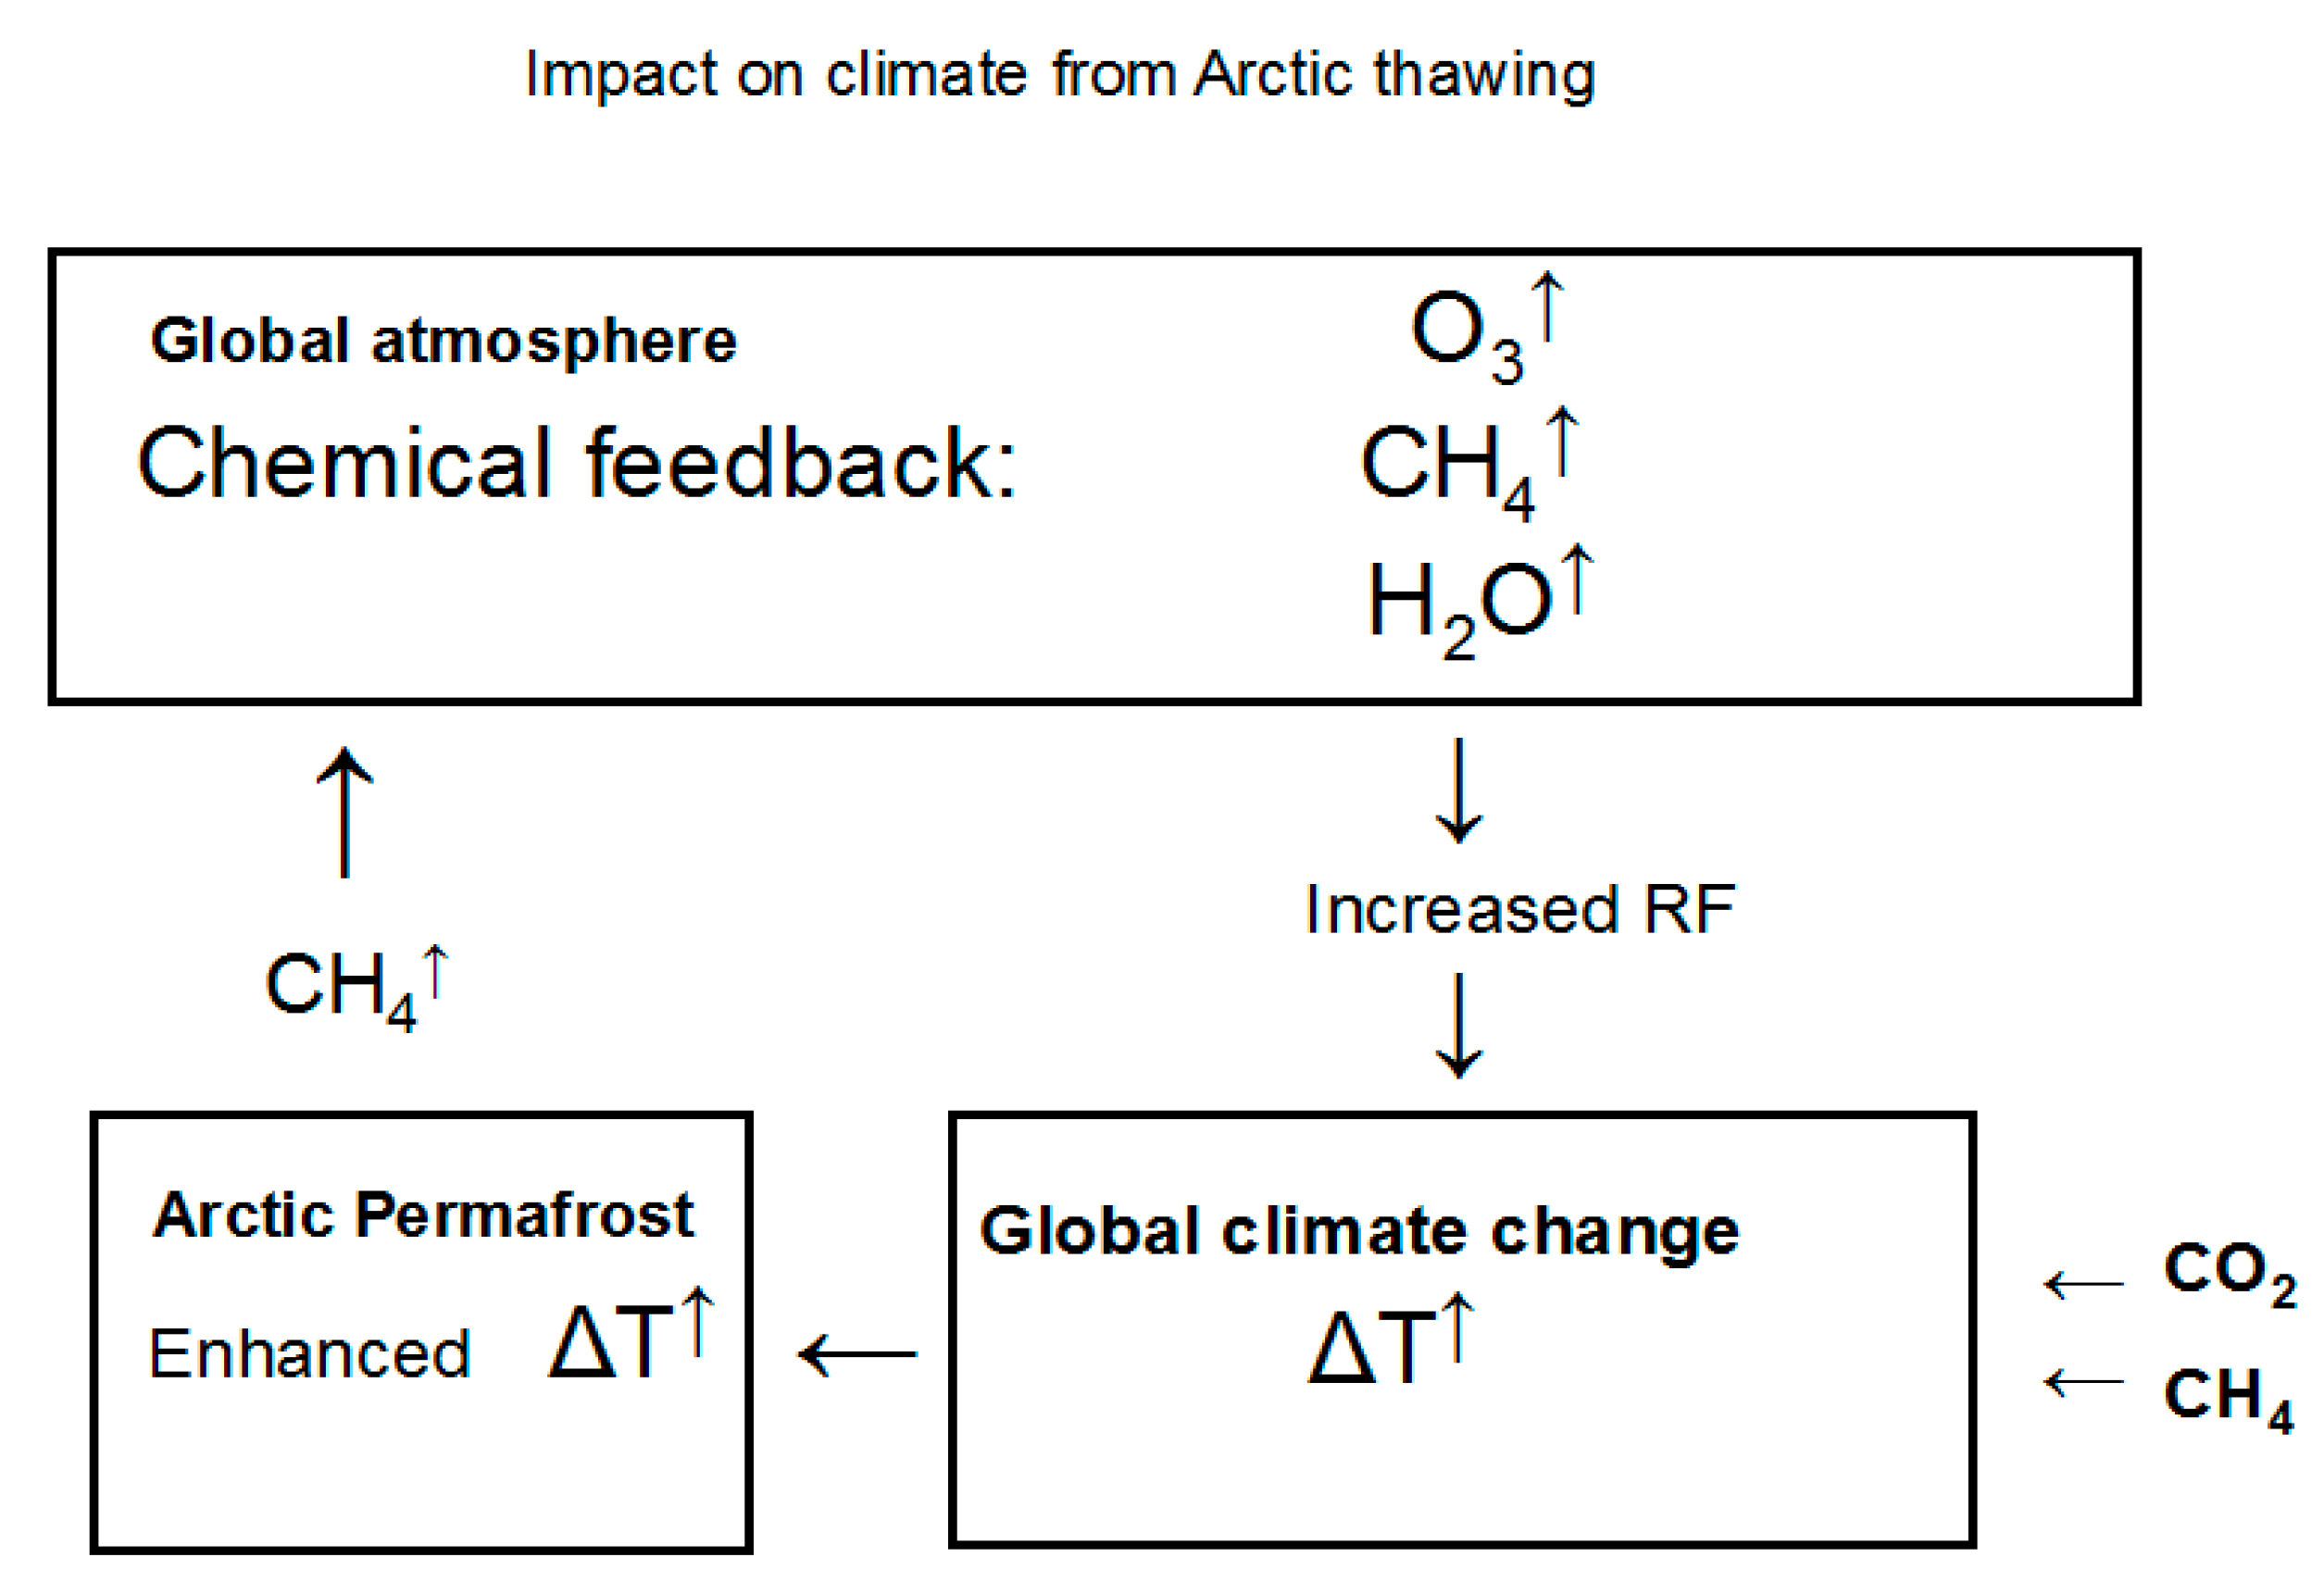
3.3. Impact of Methane Emissions from Permafrost Thawing in the Arctic

Figure 3 shows an example of climate-chemistry interactions, which has the potential for non-linear effects on the atmospheric concentrations of methane, ozone and stratospheric water vapor, yielding further climate warming in a positive feedback loop. Methane is likely to be released from the Arctic as a result of strong future thawing of permafrost [47]. The release could be from conversion of organic carbon in the yedoma region where the organic content is high, 2% to 5% in the upper 25 m [48], or methane could be released from methane hydrates on the Arctic shelf during thawing in a warmer future climate ([29,49]). Zimov et al. [48] estimated that the yedoma region in Siberia contains 500 Gt of organic carbon and non-yedoma permafrost (excluding peatlands) contains another 400 Gt of organic carbon. Schuur et al. [50] estimate the carbon pool in permafrost areas to be 1672 Gt carbon (including peatlands). The deposited organic carbon is partly expected to be converted to methane (up to 30%) and released to the atmosphere after thawing [48]. There are some disagreements when it comes to the atmospheric impacts of methane deposited on the shallow continental shelf in permafrost regions, or conversion of organic carbon to methane. Shakhova et al. [49] assumes that methane could be rapidly released after a few years during thawing in the Arctic, while others argue that permafrost thawing will take much longer time ([19]).
In Table 2 we estimate the additional amount of methane emissions, from permafrost thawing or other sources, that would be required to raise atmospheric methane to 3, 6 or 12 times the current concentrations. The required emissions are significantly higher than current methane emissions, which are approximately 0.5 Gt/year, but could be supplied by thawing Arctic soils. Such methane perturbations would also increase tropospheric ozone and stratospheric water vapor. The numbers for the ozone increases are for the gridbox with the highest ozone increase in the UTLS region (given in ppb), while water vapor increases are from the lower stratosphere (given in % increase). There are significant impacts of enhanced RF from permafrost release of methane. These numbers are based on the work by Isaksen et al. [29], and show that for large potential emissions of methane from permafrost thawing, we can expect significant climate impact, which represents a strong feedback in the climate system. Isaksen et al. [29] also found that large permafrost emissions lead to increases in the methane lifetime through a significant impact of methane on its own lifetime, far beyond current feedback of 1.3 to 1.5.
Figure 3. Schematic presentation of climate-chemistry interaction as a result of permafrost thawing and methane emissions.
Atmosphere 05 00518 g003
Table 2. Modeled increase in the global release of CH4, the tropospheric increase of ozone and stratospheric increase of water vapor, and the total radiative forcing for the selected atmospheric methane enhancements. Calculations are done with the Oslo chemistry transport model (Oslo CTM2).
Adopted Relative Increase in Atmospheric CH4(%)3.06.012.0
Increase in global release of CH4 (Gt/year)1.93.04.8
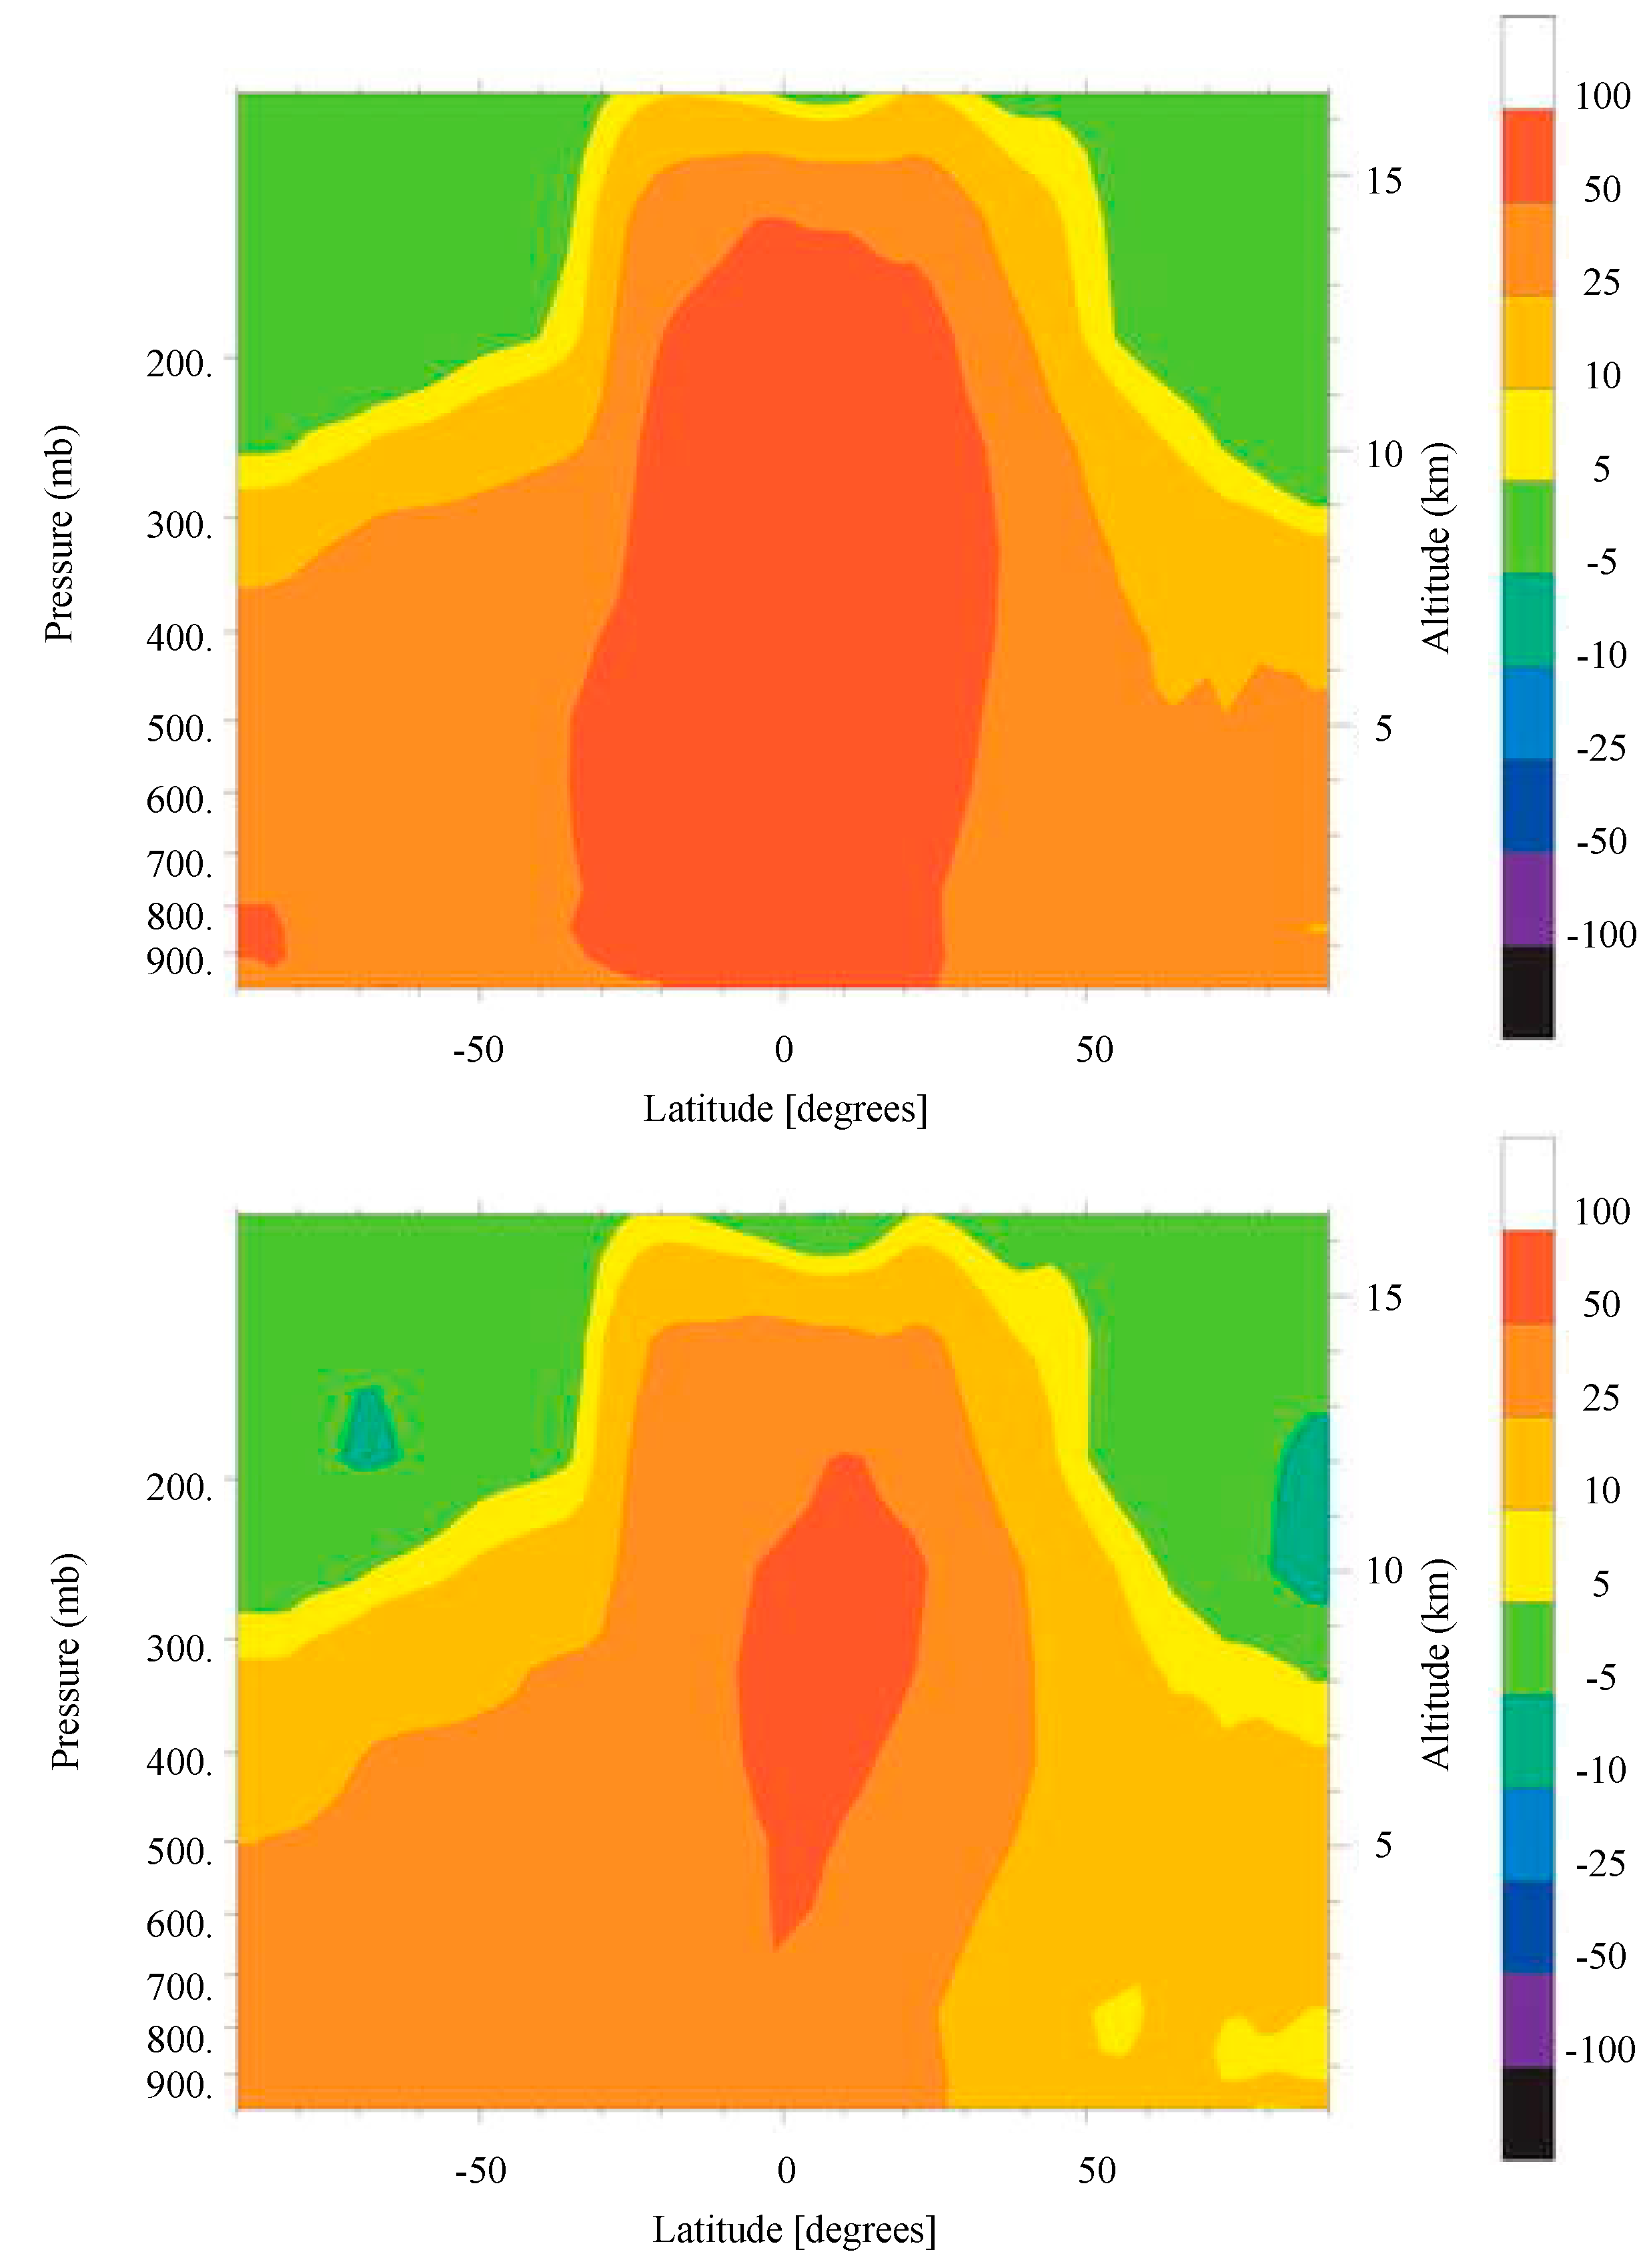
Maximum increase in tropospheric ozone (ppb)5070120
Increase in stratospheric H2O (%)30–8040–12080–120
Increase in RF (W∙m−2)2.13.45.2

3.4. Impact of Transport on the Low Late-Winter Ozone Values in the Arctic in 2011

Arctic column ozone reached record low values (~230 DU) during March of 2011 ([11,12,13]) exposing the Arctic ecosystems to enhanced UV-B radiation. In the study by Isaksen et al. [13] ozone column north of 60 degrees N for the month of March in 2011 is given as 327 DU, compared with the range of average monthly values for the previous 10 years of 377 to 462 DU for the same region and the same month. The highest average monthly value for March in the Arctic was found in 2010. None of the previous 10 years had a similarly low column ozone during March in the Arctic as 2011. The study clearly showed that there are large year to year variations in late winter ozone columns over the Arctic. The cause of this anomaly was studied using the atmospheric Oslo CTM2 (chemistry transport model) driven by ECMWF meteorology. Simulations of Arctic ozone from 1997 to 2012 were performed, comparing parallel model runs with and without Arctic ozone chemistry between 1 January and 1 April in 2011. Even though there was considerable chemical loss of ozone in spring 2011 [51], a major part of the low ozone values observed over the Arctic in 2011 was dynamically driven [13]. Weakened transport of ozone from middle latitudes, at the same time as the polar vortex was strong, was the primary cause of the low ozone values. Pommereau et al. [52] have come to the same conclusion that reduced transport and a strong vortex were the main reason for the late winter low stratospheric ozone values in the Arctic in 2011. They also discussed the possibility for a relation to climate change, but did not find any indication of such connections.
Earlier studies on the effects of transport and chemistry on the inter-annual variability of ozone in the Arctic stratosphere for the period 1990 to 1998 [53] and for the period from 1992 to 2004 [54] concluded that both transport and chemistry contributed to ozone variability.

3.5. Stratospheric Ozone Changes due to Changes in Dynamics

We have studied how changes in dynamics affect ozone columns in the atmosphere [14]. Monthly mean ozone column from the chemical transport model Oslo CTM2 are compared with solar backscatter ultraviolet (SBUV) satellite observations (Figure 4). Ozone column values for different latitude zones in the Northern and Southern Hemispheres were compared. Ozone column variations from Oslo CTM2 are highly correlated with SBUV retrievals at all latitude zones. Equatorial zonal winds at 30 hPa were used as index to study the impact of quasi-biennial oscillation (QBO) on ozone. The impact of QBO was most pronounced at equatorial latitudes with amplitudes of +4% to −4%. At higher northern and southern latitudes, the amplitude is less pronounced and the oscillation phase lags that at the equator. We notice the lack of QBO effects at Southern Hemisphere mid-latitudes between about 2001 and 2004. We find that dynamics have a significant impact on the stratospheric ozone distribution as shown in this study. Seasonal variations in surface ozone and tropospheric ozone column calculated by the model are also presented in the study.
Figure 4. Column ozone variations, modeled (Oslo CTM2) and observed (SBUV) for different latitude zones between 1997 and 2012 (updated from [14]).
Atmosphere 05 00518 g004
Tropospheric OH is clearly modified by stratospheric ozone columns and by QBO as shown in Figure 5, where modeled and observed ozone columns, observed UV-B radiation and modeled surface OH distribution for three Japanese stations are given for the period 1998 to 2012 [15] along with the equatorial zonal winds between 30 and 50 hPa. Column ozone variations, basically in the stratosphere, modify the shortwave solar radiation (UV-B radiation) penetrating to the troposphere. High ozone columns give reduced OH production in the troposphere, affecting methane lifetime and ozone production. We have also looked at high latitude stations in Canada. The relation between column ozone and tropospheric OH is not as clear at the stations in Canada.
Figure 5. Column ozone variation (modeled and observed), tropospheric OH variation (modeled with Oslo CTM2) and observed tropospheric UV-B radiation for three Japanese stations, and observed zonal winds at 30 and 50 hPa at the Equator (updated from [15])
Atmosphere 05 00518 g005

4. Conclusions

We have demonstrated that there are possibilities for significant climate-chemistry interactions involving ozone and methane as key compounds. The interactions include the effect of temperature increases on chemical reactions, surface emissions of chemical compounds and dynamic changes affecting the ozone distribution in the stratosphere.
We have shown that during a period with enhanced summer temperatures over Athens in 2007 ozone levels were signficantly higher than the average for the same months during the period 2000 to 2010. The studies by Solberg et al. [10] and Hodnebrog et al. [41] demonstrated the link between increased atmospheric temperatures and enhanced ozone levels.
A future potential important area of climate-chemistry interactions is the release of methane from deposits under shallow ocean waters in the Arctic [49] or decomposition of organic deposits during Arctic thawing. Release of methane from the Arctic region could have impacts through enhancements of the atmospheric levels of methane itself, tropospheric ozone, stratospheric water vapor, and on radiative forcing, yielding a positive feedback in the climate system.
We have further demonstrated that we are able to represent well the observed column ozone change at different latitudinal bands, and that tropospheric OH variations are partly affected by ozone column variations [55]. The year-to-year variation in modeled ozone column distribution is large, basically showing the impact of transport, with some contribution from chemistry.

Acknowledgments

Air temperature data for Athens were provided by the Institute for Environmental Research and Sustainable Development of the National Observatory of Athens. This work has been supported by grant no by the Norwegian Research Council.

Author Contributions

Isaksen has carried out the main part of writing, although all coauthors have contributed to the text. The research has mainly been carried out by the co-authors, comprising both modelling work and also data analysis.

Conflicts of Interest

The authors declare no conflict of interest.

References

  1. IPCC. Climate Change 2007: The Physical Science Basis. Contribution of Working Group I to the Fourth Assessment Report of the Intergovernmental Panel on Climate Change; Solomon, S., Qin, D., Manning, M., Chen, Z., Marquis, M., Averyt, K.B., Tignor, M., Miller, H.L., Eds.; Cambridge University Press: Cambridge, UK/New York, NY, USA, 2007. [Google Scholar]
  2. Isaksen, I.S.A.; Granier, C.; Myhre, G.; Berntsen, T.K.; Dalsøren, S.B.; Gauss, M.; Klimont, Z.; Benestad, R.; Bousquet, P.; Collins, W. Atmospheric composition change: Climate-Chemistry interactions. Atmos. Environ. 2009, 43, 5138–5192. [Google Scholar] [CrossRef]
  3. Fowler, D.; Pilegaard, K.; Sutton, M.A.; Ambus, P.; Raivonen, M.; Duyzer, J.; Simpson, D.; Fagerli, H.; Fuzzi, S.; Schjoerring, J.K. Atmospheric composition change: Ecosystems-Atmosphere interactions. Atmos. Environ. 2009, 43, 5193–5267. [Google Scholar] [CrossRef]
  4. Monks, P.S.; Granier, C.; Fuzzi, S.; Stohl, A.; Williams, M.; Akimoto, H.; Amman, M.; Baklanov, A.; Baltensperger, U.; Bey, I. Atmospheric composition change-global and regional air quality. Atmos. Environ. 2009, 43, 5268–5351. [Google Scholar] [CrossRef]
  5. Stevenson, D.S.; Johnson, C.E.; Collins, W.J.; Derwent, R.G.; Edwards, J.M. Future estimates of tropospheric ozone radiative forcing and methane turnover—The impact of climate change. Geophys. Res. Lett. 2000, 27, 2073–2076. [Google Scholar] [CrossRef]
  6. Fiore, A.M.; Naik, A.; Spracklen, D.V.; Steiner, A.; Unger, N.; Prather, M.; Bergmann, D.; Cameron-Smith, M.; Cionni, I.; Collins, W.J. Global air quality and climate. Chem. Soc. Rev. 2012, 41, 6663–6683. [Google Scholar] [CrossRef] [PubMed]
  7. Wild, O.; Fiore, A.M.; Shindell, D.T.; Doherty, R.M.; Collins, W.J.; Dentener, F.J.; Schultz, M.G.; Gong, S.; MacKenzie, I.A.; Zeng, G.; et al. Modelling future changes in surface ozone: A parameterized approach. Atmos. Chem. Phys. 2012, 12, 2037–2054. [Google Scholar] [CrossRef] [Green Version]
  8. National Academy of Sciences. Environmental Impact of Stratospheric Flight, Biological and Climatic Effects of Airceaft Emissions in the Stratosphere; National Academy of Sciences: Washington, DC, USA, 1975. [Google Scholar]
  9. Sitch, S.; Cox, P.M.; Collins, W.J.; Huntingford, C. Indirect radiative forcing of climate change through ozone effects on the land-carbon sink. Nature 2007, 448, 791–794. [Google Scholar] [CrossRef] [PubMed]
  10. Solberg, S.; Hov, Ø; Søvde, A.; Isaksen, I.S.A.; Coddeville, P.; de Backer, H.; Forster, C.; Orsolini, Y.; Uhse, K. European surface ozone in the extreme summer 2003. J. Geophys. Res.: Atmos. 2008. [Google Scholar] [CrossRef]
  11. Manney, G.L.; Santee, M.L.; Rex, M.; Livesey, N.J.; Pitts, M.C.; Veefkind, P.; Nash, E.R.; Wohltmann, I.; Lehmann, R.; Froidevaux, L.; et al. Unprecedented Arctic ozone loss in 2011. Nature 2011, 478, 469–475. [Google Scholar] [CrossRef] [PubMed]
  12. Sinnhuber, B.-M.; Stiller, G.; Ruhnke, R.; von Clarmann, T.; Kellmann, S.; Aschmann, J. Arctic winter 2010/2011 at the brink of an ozone hole. Geophys. Res. Lett. 2011. [CrossRef]
  13. Isaksen, I.S.A.; Zerefos, C.; Wang, W.-C.; Balis, D.; Eleftheratos, K.; Rognerud, B.; Stordal, F.; Berntsen, T.K.; LaCasce, J.H.; Søvde, O.A.; et al. Attribution of Arctic ozone loss in March 2011. Geophys. Res. Lett. 2012. [CrossRef]
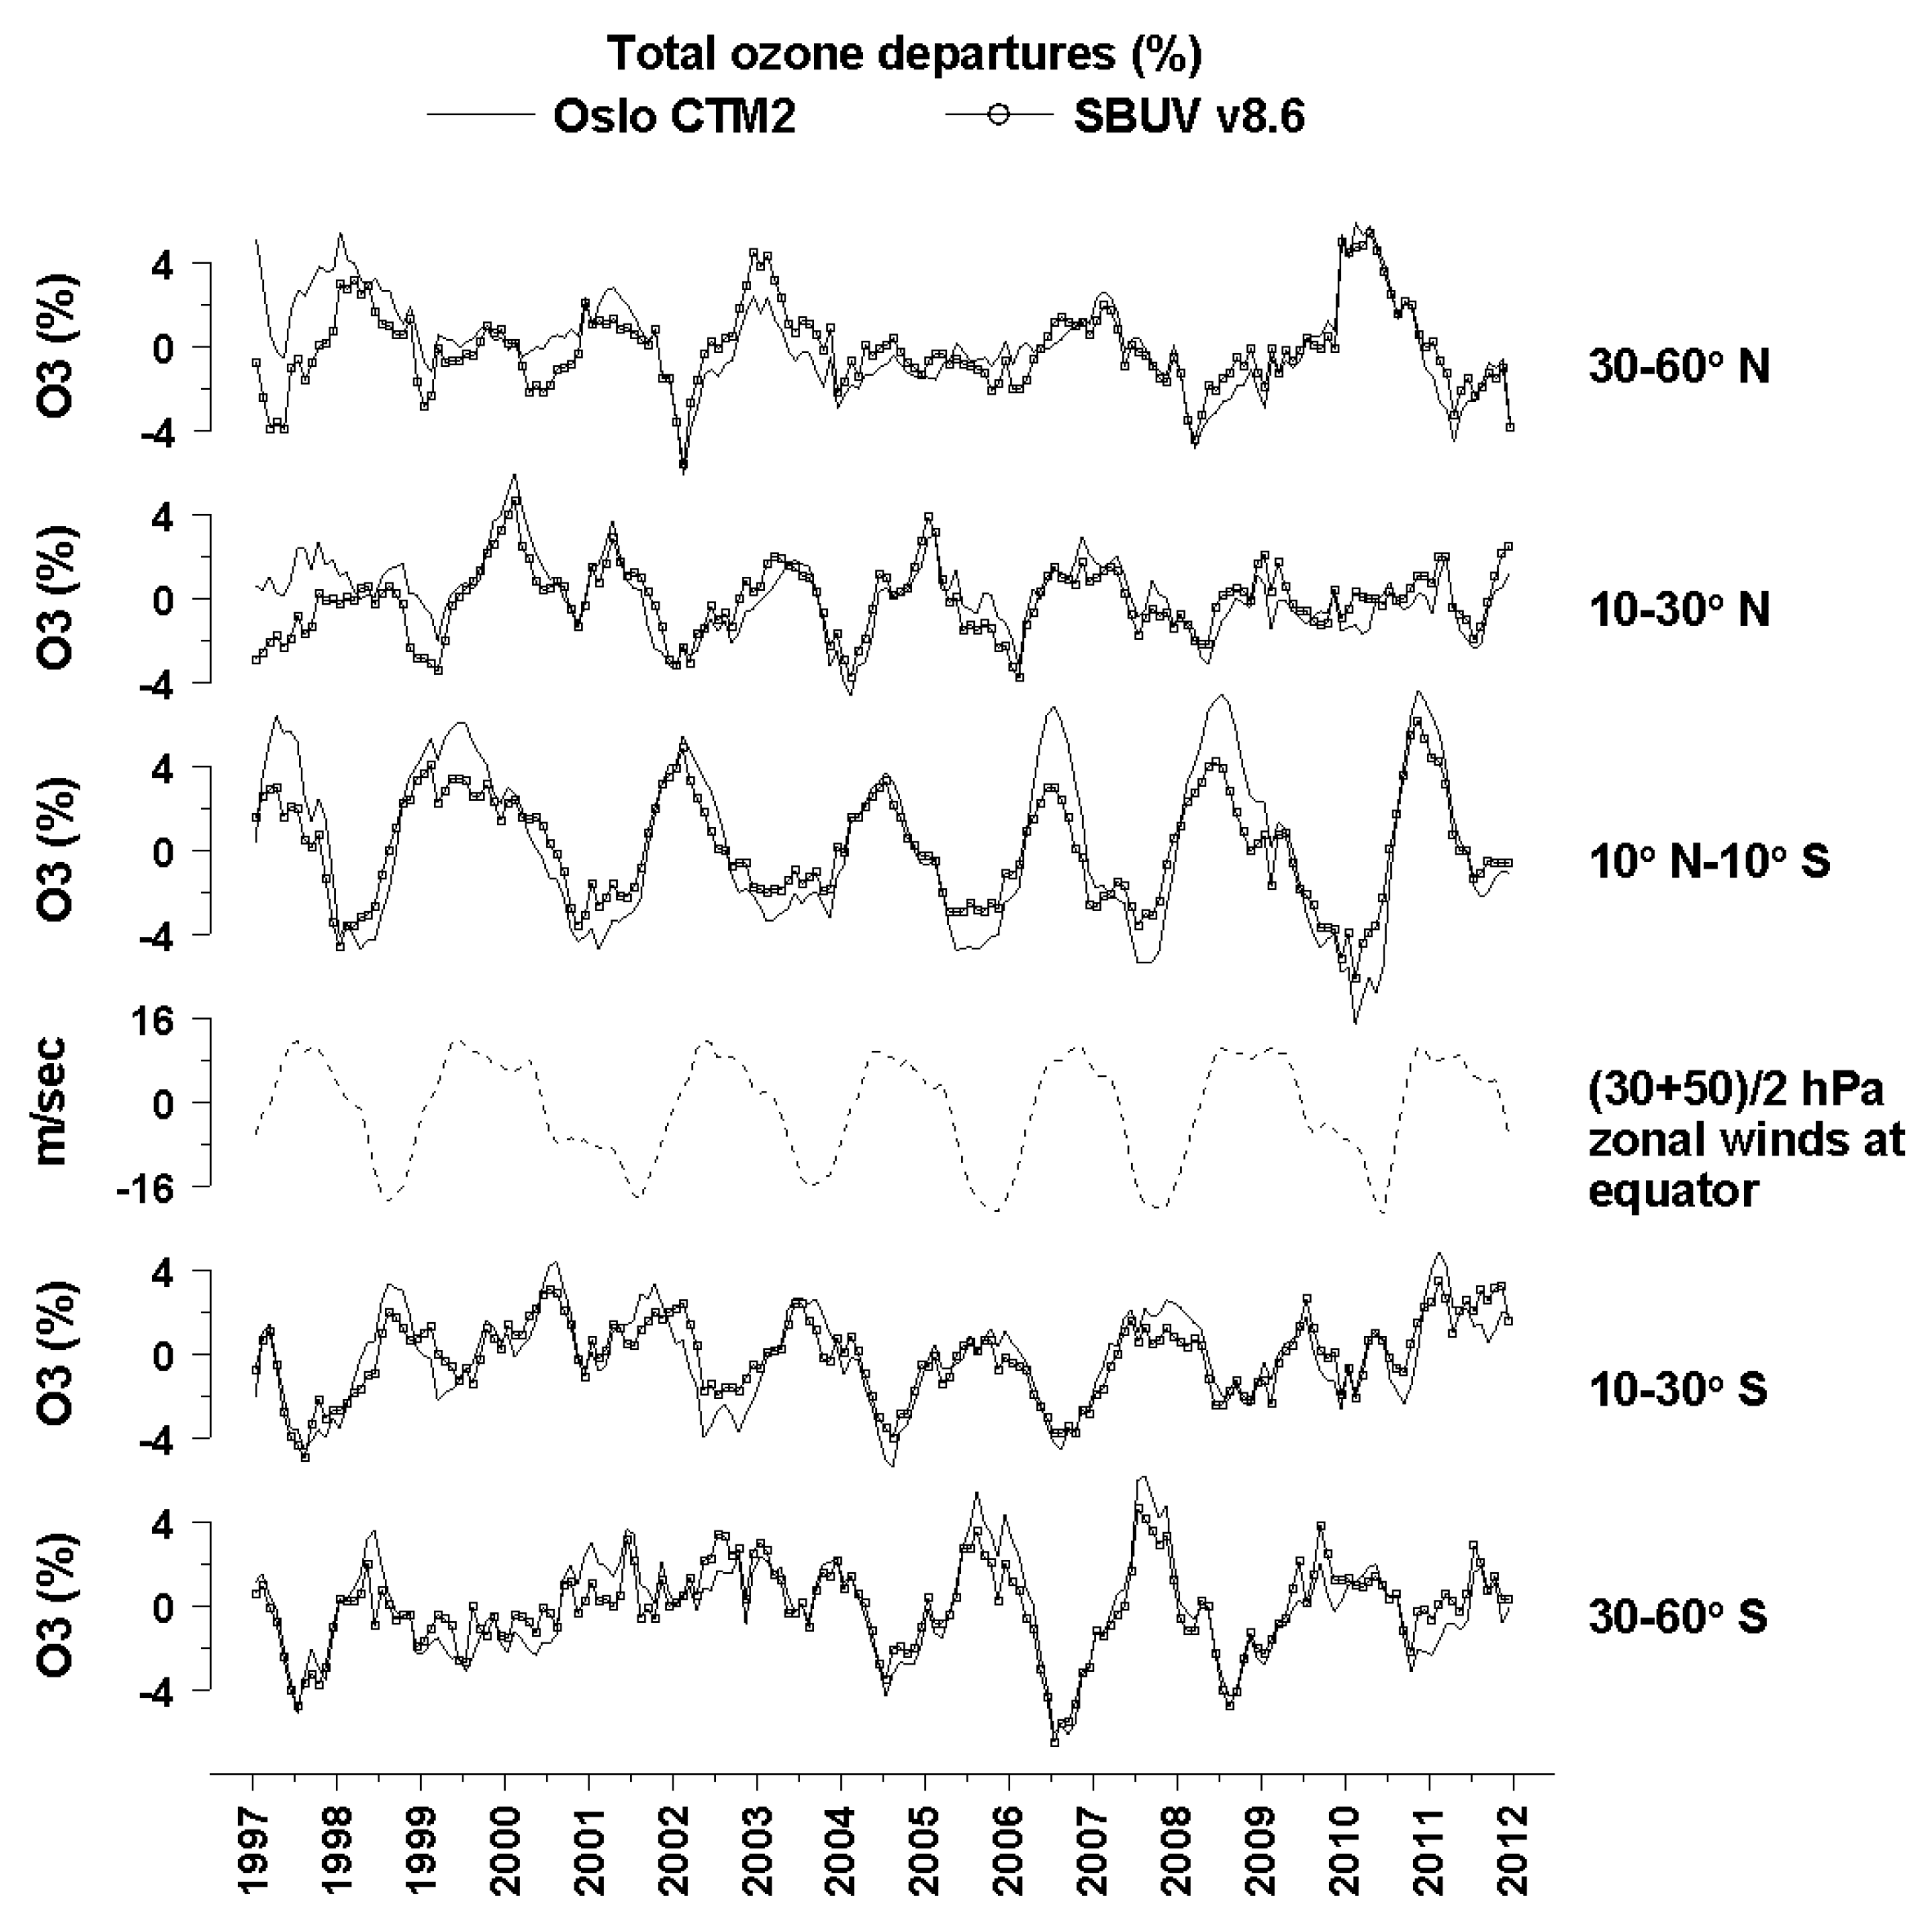
  14. Eleftheratos, K.; Isaksen, I.S.A.; Zerefos, C.; Nastos, P.; Tourpali, K.; Rognerud, B. Ozone variations derived by a chemical transport model. Water Air Soil Pollut. 2013. [CrossRef]
  15. Zerefos, C.S.; Tourpali, K.; Eleftheratos, K.; Kazadzis, S.; Meleti, C.; Feister, U.; Koskela, T.; Heikkilä, A. Evidence of a possible turning point in solar UV-B over Canada, Europe and Japan. Atmos. Chem. Phys. 2012, 12, 2469–2477. [Google Scholar] [CrossRef] [Green Version]
  16. Hauglustaine, D.A.; Lathière, J.; Szopa, S.; Folberth, G.A. Future tropospheric ozone simulated with a climate-chemistry-biosphere model. Geophys. Res. Lett. 2005. [CrossRef]
  17. Liao, H.; Chen, W.-T.; Seinfeld, J.H. Role of climate change in global predictions of future tropospheric ozone and aerosols. J. Geophys. Res.: Atmos. 2006. [Google Scholar] [CrossRef]
  18. Kvalevåg, M.M.; Myhre, G. The effect of carbon-nitrogen coupling on the reduced land carbon sink caused by tropospheric ozone. Geophys. Res. Lett. 2013, 40, 3227–3231. [Google Scholar] [CrossRef]
  19. Nisbet, E.G.; Chappellaz, J. Shifting Gear, Quickly. Science 2009, 324, 477–478. [Google Scholar] [CrossRef] [PubMed]
  20. Isaksen, I.S.A.; Gauss, M.; Myhre, G.; Walter Anthony, K.M.; Ruppel, C. Strong atmospheric chemistry feedback to climate warming from Arctic methane emissions. Glob. Biogeochem. Cycles 2011. [CrossRef]
  21. Schmidt, G.A.; Shindell, D.T. Atmospheric composition, radiative forcing, and climate change as a consequence of massive methane relies from gas hydrates. Paleoceanography 2003. [CrossRef]
  22. Shakhova, N.; Semiletov, I.; Leifer, I.; Sergienko, V.; Salyuk, A.; Kosmach, D.; Chernykh, D.; Stubbs, C.; Nicolsky, D.; Tumskov, V.; Gustafsson, Ö. Ebullition and storm-induced methane release from the East Siberian Arctic shelf. Nat. Geosci. 2014, 7, 64–70. [Google Scholar]
  23. Eyring, V.; Isaksen, I.S.A.; Berntsen, T.; Collins, W.J.; Corbett, J.J.; Endresen, O.; Grainger, R.G.; Moldanova, J.; Schlager, H.; Stevenson, S. Transport impacts on atmosphere and climate: Shipping. Atmos. Environ. 2010, 44, 4735–4771. [Google Scholar] [CrossRef]
  24. Hoor, P.J.; Borken-Kleefeld, D.; Caro, O.; Dessens, O.; Endresen, M.; Gauss, V.; Grewe, D.; Hauglustaine, I.S.A.; Isaksen, P.; Jöckel, J.; et al. The impact of traffic emissions on atmospheric ozone and OH: Results from QUANTIFY. Atmos. Chem. Phys. 2009, 9, 3113–3136. [Google Scholar] [CrossRef]
  25. IPCC. Atmospheric Chemistry and Greenhouse Gases; IPCC WGI Third Assessment Report; IPCC: Geneva, Switzerland, 2001; pp. 239–287. [Google Scholar]
  26. Isaksen, I.S.A.; Hov, Ø. Calculation of trends in the tropospheric concentration of O3, OH, CO, CH4 and NOx. Tellus 1987, 39B, 271–285. [Google Scholar]
  27. Prather, M.; Ehhalt, D. Atmospheric chemistry and greenhouse gases. In Climate Change 2001: The Scientific Basis; Houghton, J.T., Ding, Y., Griggs, D.J., Noguer, N., van der Linden, P.J., Xiaosu, D., Maskell, K., Johnson, C.A., Eds.; Cambridge University Press: Cambridge, UK, 2001; pp. 239–287. [Google Scholar]
  28. Voulgarakis, A.; Naik, V.; Lamarque, J.-F.; Shindell, D.T.; Young, P.J.; Prather, M.J.; Wild, O.; Field, R.D.; Bergmann, D.; Cameron-Smith, P.; et al. Analysis of present day and future OH and methane lifetime in the ACCMIP simulations. Atmos. Chem. Phys. 2013, 13, 2563–2587. [Google Scholar] [CrossRef] [Green Version]
  29. Mickley, L.J.; Jacob, D.J.; Rind, D. Uncertainty in preindustrial abundance of tropospheric ozone: Implications for radiative forcing calculations. J. Geophys. Res.: Atmos. 2001, 106, 3389–3399. [Google Scholar]
  30. Fiore, A.M.; Levy, H., II; Ming, Y.; Fang, Y.; Horowitz, L.W. Interactions between air quality and climate. In Air Pollution Modeling and Its Application XX; Springer: Dordrecht, The Netherlands, 2010; pp. 481–489. [Google Scholar]
  31. Brasseur, G.P.; Schultz, M.; Granier, C.; Saunois, M.; Diehl, T.; Botzet, M.; Roeckner, E.; Walters, S. Impact of climate change on the future chemical composition of the global troposphere. J. Clim. 2006, 19, 3932–3951. [Google Scholar] [CrossRef]
  32. Hodnebrog, O.; Berntsen, T.K.; Dessens, O.; Gauss, M.; Grewe, V.; Isaksen, S.A.; Koffi, B.; Myhre, G.; Olivie, D.; Prather, M.J.; et al. Future impact of traffic emissions on atmospheric ozone and OH based on two scenarios. Atmos. Chem. Phys. 2012, 12, 12211–12225. [Google Scholar]
  33. Hoyle, C.R.; Myhre, G.; Isaksen, I.S.A. Present-day contribution of anthropogenic emissions from China to the global burden and radiative forcing of aerosol and ozone. Tellus 2009, 61B, 618–626. [Google Scholar] [CrossRef]
  34. Skowron, A.; Lee, D.S.; de Leon, R.R. The assessment of the impact of aviation NOx on ozone and other radiative forcing responses—The importance of representing cruise altitudes accurately. Atmos. Environ. 2013, 74, 159–168. [Google Scholar] [CrossRef]
  35. Søvde, O.A.; Gauss, M.; Smyshlyaev, S.P.; Isaksen, I.S.A. Evaluation of the chemical transport model Oslo CTM2 with focus on arctic winter ozone depletion. J. Geophys. Res.: Atmos. 2008. [Google Scholar] [CrossRef]
  36. Søvde, O.A.; Prather, M.J.; Isaksen, I.S.A.; Berntsen, T.K.; Stordal, F.; Zhu, X.; Holmes, C.D.; Hsu, J. The chemical transport model Oslo CTM3. Geosci. Model Dev. 2012, 5, 1441–1469. [Google Scholar] [CrossRef]
  37. Tsai, I.-C.; Chen, J.-P.; Lin, P.-Y.; Wang, W.-C.; Isaksen, I.S.A. Sulfur cycle and sulfate radiative forcing simulated from a coupled global climate-chemistry model. Atmos. Chem. Phys. 2010, 10, 3693–3709. [Google Scholar] [CrossRef]
  38. Unger, N.; Shindell, D.T.; Koch, D.M.; Amann, M.; Cofala, J.; Streets, D.G. Influences of man-made emissions and climate changes on tropospheric ozone, methane, and sulfate at 2030 from a broad range of possible futures. J. Geophys. Res.: Atmos. 2006. [Google Scholar] [CrossRef]
  39. Ødemark, K.; Dalsøren, S.B.; Samset, B.H.; Berntsen, T.K.; Fuglestvedt, J.S.; Myhre, G. Short-lived climate forcers from current shipping and petroleum activities in the Arctic. Atmos. Chem. Phys. 2012, 12, 1979–1993. [Google Scholar] [CrossRef] [Green Version]
  40. Holmes, C.D.; Tang, Q.; Prather, M.J. Uncertainties in climate assessment for the case of aviation NO. Proc. Natl. Acad. Sci. USA 2011, 108, 10997–11002. [Google Scholar] [CrossRef] [PubMed]
  41. Hodnebrog, Ø.; Solberg, S.; Stordal, F.; Svendby, T.M.; Simpson, D.; Gauss, M.; Hilboll, A.; Pfister, G.G.; Turquety, S.; Richter, A.; et al. Impact of forest fires, biogenic emissions and high temperatures on the elevated eastern mediterranean ozone levels during the hot summer of 2007. Atmos. Chem. Phys. 2012, 12, 8727–8750. [Google Scholar] [CrossRef] [Green Version]
  42. Ganzeveld, L.; Bouwman, L.; Stehfest, E.; van Vuuren, D.P.; Eickhout, B.; Lelieveld, J. Impact of future land use and land cover changes on atmospheric chemistry-climate interactions. J. Geophys. Res.: Atmos. 2010. [Google Scholar] [CrossRef]
  43. Sanderson, M.G.; Jones, C.D.; Collins, W.J.; Johnson, C.E.; Derwent, R.G. Effect of climate change on Isoprene emissions and surface ozone levels. Geophys. Res. Lett. 2003. [CrossRef]
  44. Turner, B.L., II; Meyer, W.B.; Skole, D.L. Global landuse/land cover change: Towards an integrated study. Ambio 1994, 23, 91–95. [Google Scholar]
  45. Turner, B.L., II; Skole, D.; Sanderson, S.; Fischer, G.; Fresco, L.; Leemans, R. Land-Use and Land-Cover Change Science/Research Plan; IHDP Report No. 7; Royal Swedish Academy of Sciences: Stockholm, Sweden, 1995. [Google Scholar]
  46. Wu, S.; Mickley, L.J.; Kaplan, J.O.; Jacob, D.J. Impacts of changes in land use and land cover on atmospheric chemistry and air quality over the 21st century. Atmos. Chem. Phys. 2012, 12, 1597–1609. [Google Scholar] [CrossRef]
  47. Shakhova, N.E.; Sergienko, V.I.; Semiletov, I.P. The contribution of the East Siberian shelf to the modern methane cycle. Her. Russ. Acad. Sci. 2009, 79, 217–246. [Google Scholar] [CrossRef]
  48. Zimov, S.A.; Schuur, E.A.G.; Chapin, F.S., III. Permafrost and global carbon budget. Science 2006, 312, 1612–1613. [Google Scholar] [CrossRef] [PubMed]
  49. Shakhova, N.E.; Alekseev, V.A.; Semiletov, I.P. Predicted methane emission on the east Siberian shelf. Dokl. Earth Sci. 2010, 430, 190–193. [Google Scholar] [CrossRef]
  50. Schuur, E.A.G.; Bockheim, J.; Candell, J.G.; Auskirchen, E.; Field, C.B.; Goeyachkin, S.V.; Hagemann, S.; Kuhry, P.; Lafleur, P.M.; Lee, H.; et al. Vunerability of permafrost carbon to climate change: Implications for the carbon cycle. Bioscience 2008, 58, 701–714. [Google Scholar] [CrossRef]
  51. Kuttippurath, J.; Godin-Beekmann, S.; Lefèvre, F.; Nikulin, G.; Santee, M.L.; Froidevaux, L. Record-breaking ozone loss in the Arctic winter 2010/2011: Comparison with 1996/1997. Atmos. Chem. Phys. 2012, 12, 7073–7085. [Google Scholar]
  52. Pommereau, J.-P.; Goutail, F.; Lefevre, F.; Pazmino, A.; Adams, C.; Dorokhov, V.; Eriksen, P.; Kivi, R.; Stebel, K.; Xhou, X.; et al. Why unpresedented ozone loss in the Arctic in 2011? Is it related to climate change? Atmos. Chem. Phys. 2013, 13, 5299–5308. [Google Scholar]
  53. Chipperfield, M.P.; Jones, R.L. Relative influences of atmospheric chemistry and transport on Arctic ozone trends. Nature 1999, 400, 551–554. [Google Scholar] [CrossRef]
  54. Tegtmeier, S.; Rex, M.; Wohltmann, I.; Krüger, K. Relative importance of dynamical and chemical contributions to Arctic wintertime ozone. Geophys. Res. Lett. 2008. [CrossRef]
  55. Eleftheratos, K.; Zerefos, C.S.; Gerasopoulos, E.; Isaksen, I.S.A.; Rognerud, B.; Dalsoren, S.; Varotsos, C. A note on the comparison between total ozone from Oslo CTM2 and SBUV satellite data. Int. J. Remote Sens. 2011, 32, 2535–2545. [Google Scholar] [CrossRef]

