Article

Factors Affecting Indoor Radon Levels in Buildings Located in a Karst Area: A Statistical Analysis

1
National Institute for Insurance against Accidents at Work (INAIL), DiMEILA, 00078 Monte Porzio Catone, Italy
2
Department of Mathematics and Physics “E. De Giorgi”, University of Salento and National Institute of Nuclear Physics (INFN) Section of Lecce, 73100 Lecce, Italy
3
SPP-Prevention and Protection Service, University of Salento, 73100 Lecce, Italy
4
Department of Astronautical, Electrical and Energy Engineering, University of Rome “Sapienza”, 00185 Rome, Italy
*
Authors to whom correspondence should be addressed.
Atmosphere 2023, 14(6), 950; https://doi.org/10.3390/atmos14060950
Submission received: 4 May 2023 / Revised: 19 May 2023 / Accepted: 23 May 2023 / Published: 29 May 2023
(This article belongs to the Section Air Quality and Human Health)

Abstract

:
In this paper, the averages annual radon concentrations in buildings placed in a karst area are analyzed in order to understand which factors may affect the occurrence of high levels of radon indoor. Statistical analysis on the radon dataset is performed using analytical factors described by two or three levels according to the characteristic of the measured buildings. The factors that determine higher radon levels in terms of arithmetic mean (AM) at ground floor (GF) are mainly the presence of sedimentary calcareous rock (SCR) in walls and the direct attack or crawl space as type of foundation. At first floors (FF), the presence of walls of only SCR showed radon levels higher (in terms of AM) than the one found for walls of mixed typology. These outcomes suggest that in karstic area buildings with SCR as the main construction material and direct attack or crawl space as the type of foundation, can be considered as radon-prone buildings. Moreover, this study confirms the need to measure radon levels not only at below ground floor and at GF, but also at FF and above for buildings in karst areas with construction materials including SCR blocks.

1. Introduction

Radon (222Rn) is a colorless, odorless, and chemically inert radioactive natural gas that comes from the decay of radium (226Ra) present in bedrocks and soils, well water, and building materials, and tends to accumulate to harmful levels in indoor environments, such as homes and office buildings [1,2]. The accumulation of radon inside buildings is a consequence of technological progress: insulation work, tightly closed windows, and poor ventilation of the rooms lead to an increase in the concentration of radon inside [3,4]. Several epidemiological studies have found a statistically significant connection between radon exposure and lung cancer risk [5,6,7,8].
The monitoring and control of the concentration of indoor radon in dwellings and workplaces is a very important issue worldwide, for such reason it is also important to understand which factors may affect the occurrence of high levels of indoor radon [9,10]. To investigate the influence of different factors on indoor radon concentrations, several studies considered measurements at different locations and different story levels inside buildings; moreover, some authors have also taken into account other factors, such as building materials and improvements, and the use and age of the building. In several EU countries, radon concentrations higher than the reference levels applied in the respective country were reported [11,12,13,14,15].
A previous paper [16] reported the results of a radon survey carried out in a high number of buildings placed in a small part of an Italian karst area to evaluate the variations of indoor radon concentrations. These buildings present different characteristics in terms of year of construction, materials used, building size, and type of fixtures and heating system. In this paper, the averages of annual radon concentrations are further analyzed in order to understand which factors (e.g., materials of construction, direct connection to the underground/ground floor or presence of crawl space) may affect the occurrence of high levels of indoor radon in buildings. The association between the story level of the monitored room and concentration levels across rooms belonging to various buildings were investigated. The radon concentrations were also compared to the national and international reference levels.

2. Materials and Methods

2.1. The Radon Survey and the Sample

INAIL and UniSalento conducted a radon survey on 54 buildings of UniSalento from March 2018 to April 2019. Salento is a karstic area in the Apulia region (Southeast Italy). This area is characterized by a subsoil of limestone, dolomite, and gypsum, and presents lot of sinkholes, caves, and underground drainages [17]. The buildings measured in this survey are placed mostly in the city of Lecce (50 buildings) but also in more distant municipalities (4 buildings). In order to ensure a higher homogeneity of the sample and to minimize confounding factors, the analysis here reported examines only the 50 buildings located in the city of Lecce.
The average radon activity concentration was measured by NRPB/SSI passive dosimeters coupled with CR-39 (Intercast, Europe) as detectors, for two consecutive semesters (March–October and October–April) by means of the analytical procedure described in Leonardi et al. [18] and references within. This device, according to the protocol adopted in our laboratory, has an LLD in terms of radon exposure of 14 kBqhm−3. The uncertainties associated to this device, taking into account also the calibration uncertainty, varies from 14% to 10% (with k = 2) for exposure from ~100 kBqhm−3 to 3000 kBqhm−3, respectively. Moreover, due to the holder diffusion half time, greater than a few minutes, this device is not sensitive to 220Rn [19].
A dosimeter or multiple dosimeters (for large rooms) were placed in all rooms below ground and at ground floor. Some rooms at upper floors (mostly at first floor) were also monitored. In each room, the annual average radon value has been computed as weighted arithmetic mean on the number of exposure days in each sampling period.

2.2. Data Analysis Description

The sample consists of buildings that can differ in year of construction, construction materials, and type of foundation. These characteristics, summarized in Table 1, represent the analytical factors [20] described by two or three levels and considered in the present analysis.
The natural stones used in the building material in this region are generally calcarenites, sedimentary calcareous rocks characterized by high porosity, named “Pietra Leccese”, “Pietra Mazzara”, and “Carparo”. These last two types are characterized by low contain of radium-226 (a tenth of Bq/kg), coarse grain, and are frequently used as building materials, for example, in the construction of roof vaults (Pietra Mazzara) and for the load-bearing structures of the building or as cladding material (Carparo) [21].
In the first part of this analysis, only radon levels at GF (excluding mezzanine) have been analyzed. The sample is thus reduced from 50 to 49 buildings because one building only has the underground floor. For each building, the radon level at GF is the arithmetic mean of the annual average radon value of all the rooms located at GF.
The construction techniques used in the analyzed buildings are different since the year of construction varies over a very wide range (from 1170 to 2017). Hence, for this factor (F1) two levels, which are distinctly separated in the construction techniques, were considered (pre-1960 and post-1960): a further annual division was not considered because it would not provide any benefit to the analysis leading only to not very populated numerous levels.
Since some buildings showed inhomogeneous characteristics, some factors, such as the type of foundation and the typology of construction, are not uniform throughout the entire building. In these cases, for example, when the BGF was present only in a portion of the building, the building has been separated in two or three sub-buildings, each one considered as a single structure with homogenous factors. Due to this, the sample size increases from 49 to 63 building-units.
In the second part of the analysis, radon values at FF have been compared to those at GF. In this case, the sample size is reduced from 63 to 36 building-units because the FF is not present in all buildings. As for GF, for each building, the radon level at FF is the arithmetic mean of the annual average radon value computed for all the rooms located at that floor.

2.3. Statistical Analysis

Statistical analysis was performed with IBM SPSS version 25.0 [22]. Descriptive statistics, in terms of AM, median, SD with the formula of the corrected sample, minimum value (min), maximum value (max), and CV = SD/AM has been applied to the overall set of building radon values at GF and FF, and the set of radon values at GF and FF divided into levels for each factor (as described previously).
The Shapiro–Wilk test has been applied to each level of all factors in order to evaluate the normality of distribution in the analyzed dataset. For each factor, at least one level has been found to be non-normal. For this reason, non-parametric tests, the Mann–Whitney test or the Kruskal–Wallis [23] have been used for comparing levels of the same factor, respectively, in case of two or three. Moreover, in the case of three levels, since the Levene test of Homogeneity of Variance has been found to be statistically significant, multiple pairwise comparisons on the levels have been performed by means of the Games–Howell test [24]. p-values < 0.05 were considered significant.
Bivariate logistic regression [25,26] has been applied to examine how the factors F2 and F3 affect the risk of having high radon concentration at GF. The general model relation of the bivariate logistic regression is
P y = a 0 + a 1   x 1 + + a n   x n
where the term a 0 is a constant, the terms a 1 , …, a n are the constant coefficients, which explain the dependence probabilistic relation of the dichotomous variable y as function of the predictor variables x 1 , …, x n , respectively. Interactions between variables x 1 , …, x n can also be considered. P in Equation (1) stands for statistical probability.
For the present analysis, the model tested is
P ( R n > 300 ) = A + B ·   F 2 · F 3
with A model constant and B constant coefficient of the predictor variable F 2 · F 3 . This model tests the likelihood of having radon levels (in terms of annual mean concentration— R n ) above 300 Bq/m3. R n is a continuous variable but this statistical test requires it to become a dichotomous one. To address this issue, the radon level has been dichotomized by assigning value 0 if its value is below 300 Bq/m3 or value 1 if it is greater than 300 Bq/m3 which is the Italian radon reference level [27] for the protection from radon exposure at workplaces [28,29]. Consequently, the bivariate logistic regression analyzes the radon levels as dichotomized dependent variable in terms of chosen factors as predictor variables. The predictive power of the models implemented into the bivariate logistic regression has been measured by means of Nagelkerke R2 values [30].

3. Results

3.1. Radon Distribution at Ground Floor

The distribution of radon levels at GF is described in Table 2. They are ranged on a wide interval of values from 45 Bq/m3 to 1072 Bq/m3. The AM, equal to 218 Bq/m3, is far above the median, 121 Bq/m3, with a SD of 216 Bq/m3.
The wide range of radon values strongly depends on the construction characteristics of the buildings, as it can be observed in Table 3. In fact, the GFs of buildings constructed before 1960 (F1L1) show radon levels distributed from 98 Bq/m3 to 1072 Bq/m3 with an AM of 389 Bq/m3, a median of 380 Bq/m3, and a SD of 273 Bq/m3. On the contrary, the GFs of buildings constructed after 1960 (F1L2) report radon values distributed on a smaller range from 45 Bq/m3 to 438 Bq/m3 with lower AM, median, and SD, respectively corresponding to 120 Bq/m3, 99 Bq/m3, and 72 Bq/m3.
The difference in the distribution of radon levels between pre-1960 (F1L1) and post-1960 (F1L2) is extremely significant with p < 0.001. In Table 4, all statistical testing results are shown.
A similar trend is also found if the dataset is observed in terms of materials of construction because all buildings constructed with walls of only SCR (F2L1) are pre-1960 (19 out of 23 pre-1960 buildings have only SCR blocks). Therefore, the distributions of radon levels of buildings constructed pre-1960 or post-1960 reflect the distributions of radon levels in buildings constructed with only SCR (F2L1) or mixed typology (F2L2 and F2L3), respectively. It is noteworthy that higher AM or median values are found in the case of only SCR (F2L1) compared to mixed typology with concrete and SCR (F2L2) or concrete without SCR (F2L3) with high statistical significance (p = 0.001 or p < 0.001, respectively, in Table 4). See also 
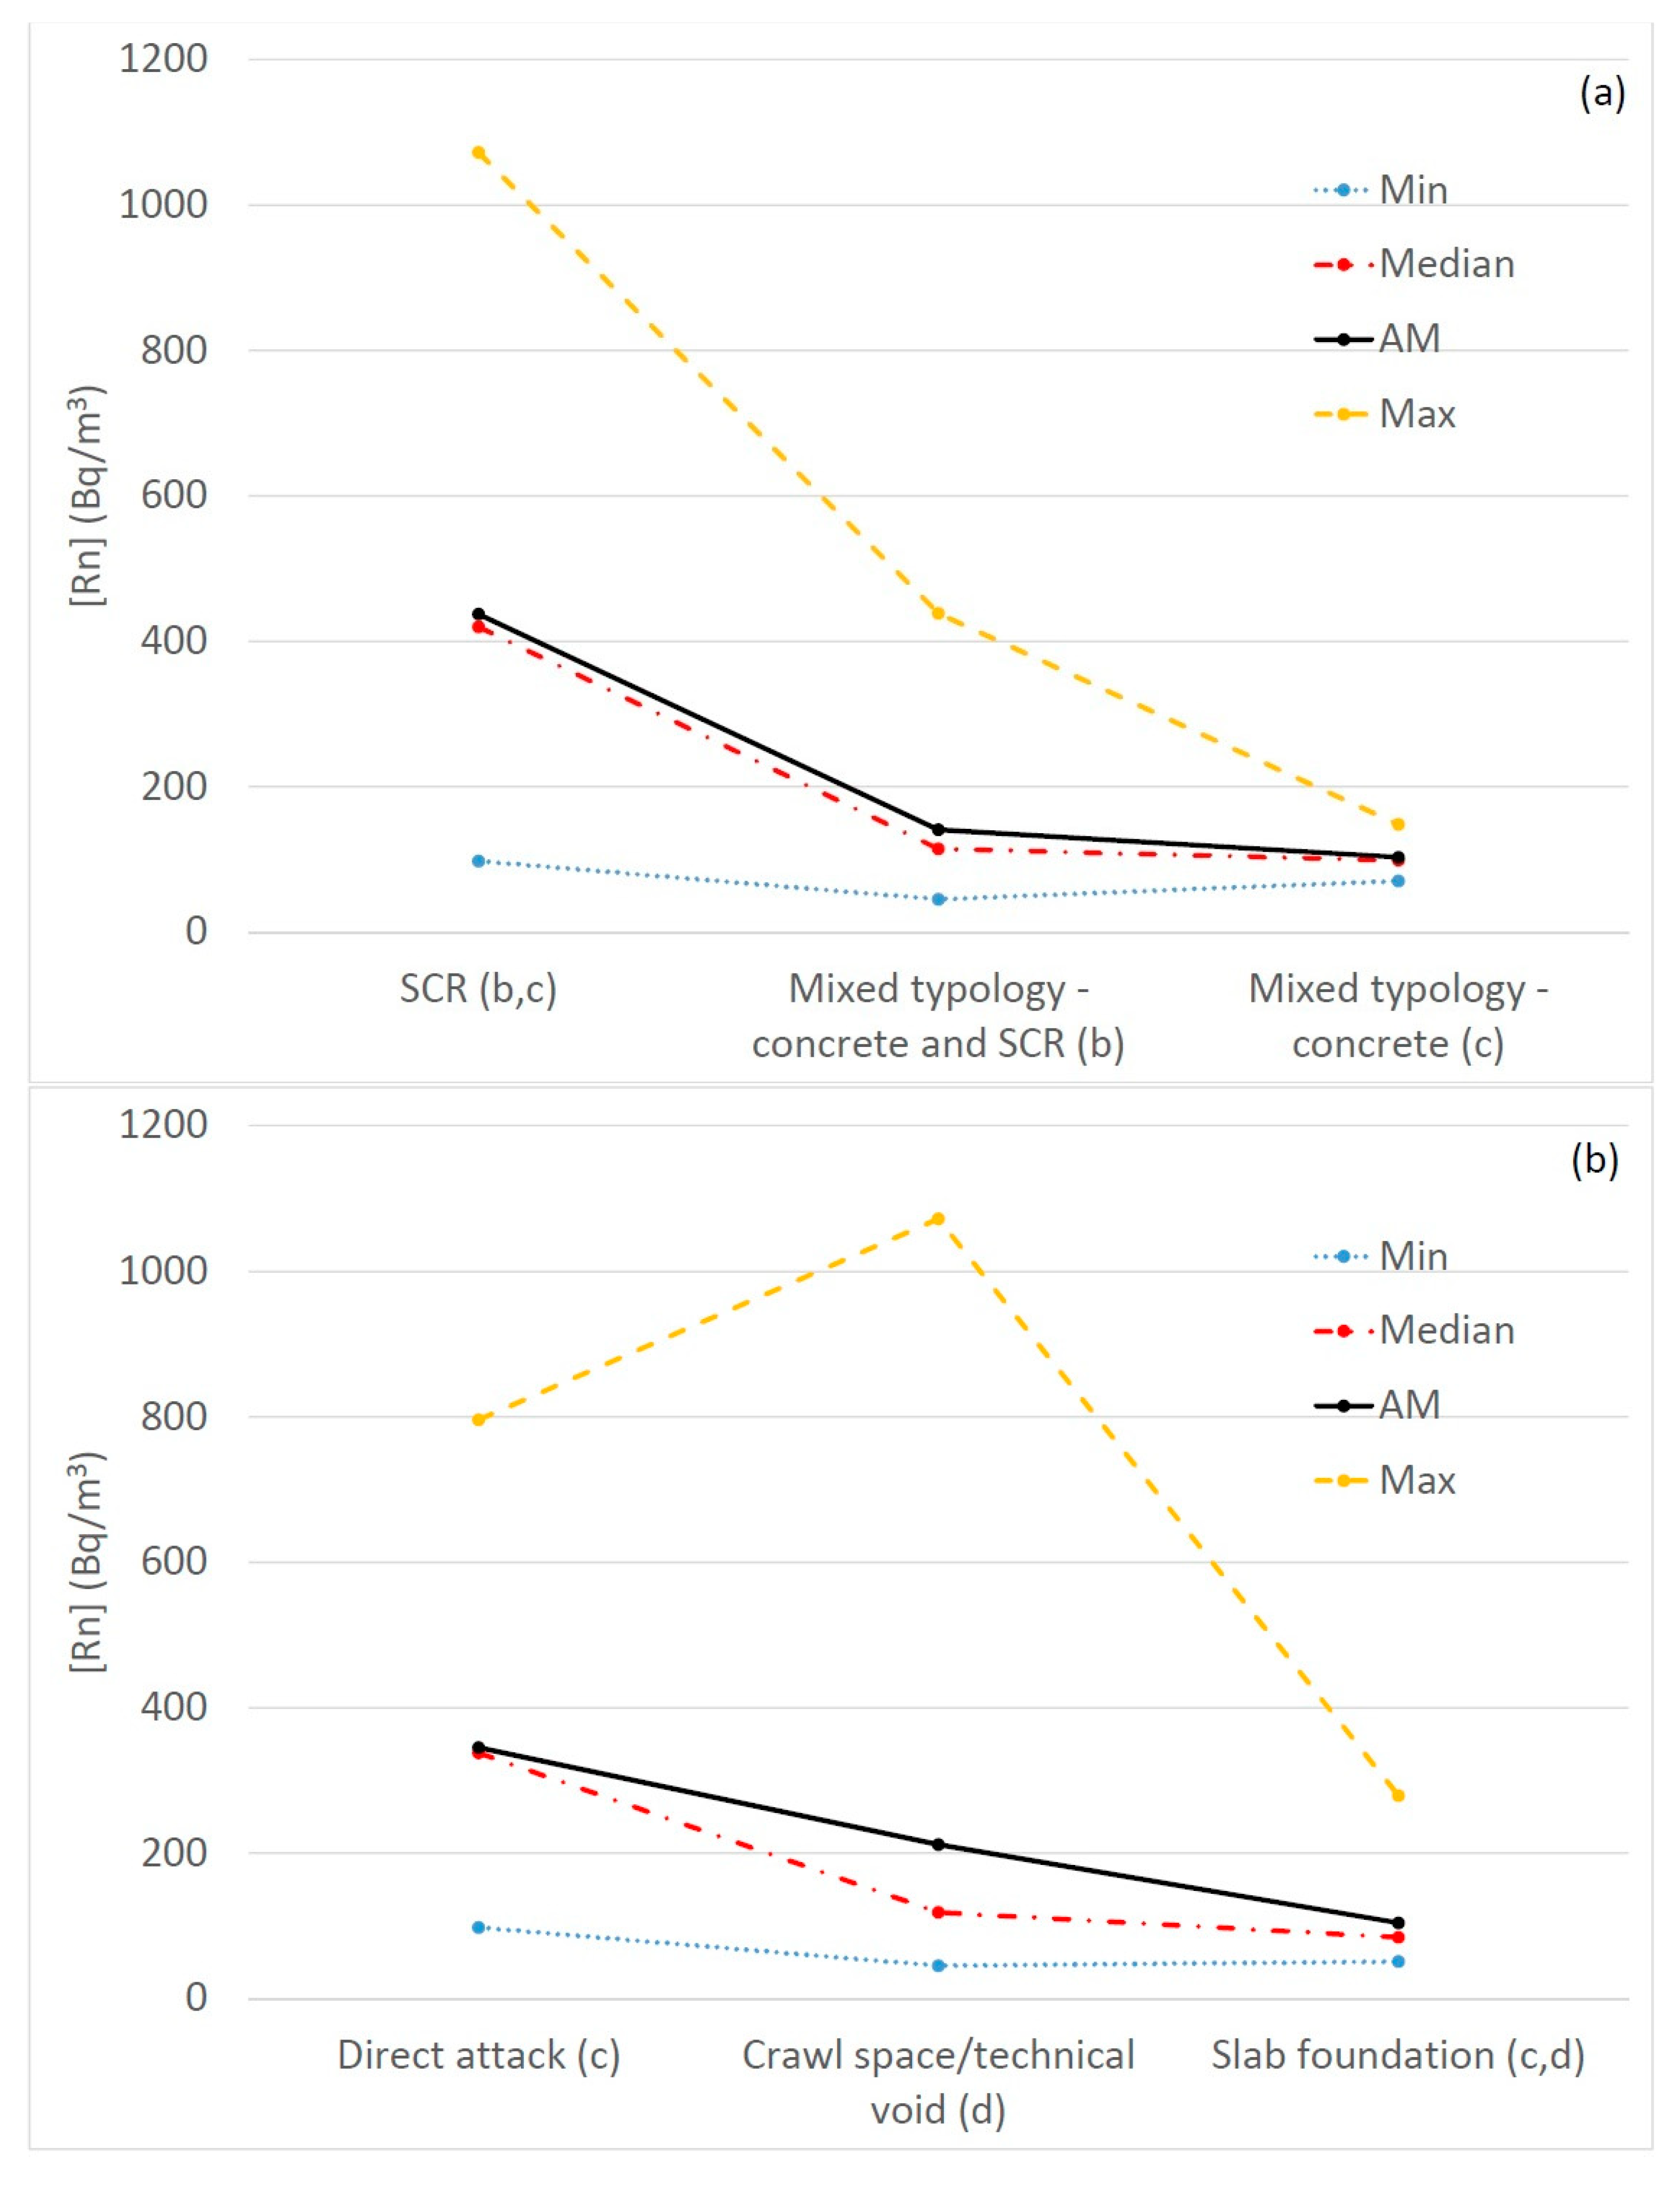
Figure 1a for an immediate comparison between levels. Moreover, the CV value, as measure of the spatial variability at GF, sharply decreases, from about 60% for F2L1 and F2L2 to about 20% for F2L3 which does not contain SCR. The case of mixed typology with iron and SCR (F2L4) shows a radon level of 79 Bq/m3, which is intermediate between the case of only SCR (F2L1) and the other cases of mixed typology. However, it is a single case.
If radon values at GF are observed as a function of the factor F3, the type of foundation (see also Figure 1b), buildings with slab foundation (F3L3) show the lowest radon levels in terms of AM, median, and SD if compared to crawl space/technical void (F3L2) and direct attack (F3L1) with statistical significance (p = 0.042 and p = 0.003, respectively; see Table 4). The difference between crawl space/technical void and direct attack is not statistically significant (p = 0.164, see Table 4).
The last factor examined is the typology of construction (F4): radon levels at GF are compared based on the presence of below ground floor (BGF in the following). The two distributions of values show similar AM but with a higher median where there is no BGF (F4L2). Ranges of values are wide in both cases, but SD and CV are higher in buildings with BGF (F4L1). The presence of the BGF seems to work as an insulation from the subsoil and affects the spatial variability, increasing the spread of radon levels around AM. Conversely, the absence of BGF lead to higher but less dispersed radon values. However, statistical testing does not give significance, as reported in Table 4.
In order to evaluate how specific combinations of factors could affect the radon levels, the factor “materials of construction” (F2) has been analyzed in combination with the factor “type of foundation” (F3). The descriptive statistics and the statistical comparisons are reported in Table 5 and Table 6, respectively, where the Games–Howell test has been applied because the Kruskal–Wallis test and the Levene test of Homogeneity of Variance have been found to be statistically significant with p < 0.001.
In Table 5, radon levels at GF are subdivided according to materials of construction (F2) and type of foundation (F3). Regarding materials of construction, the levels considered are SCR (F2L1), mixed typology with concrete and SCR (F2L2), mixed typology with concrete and no SCR (F2L3), while about the type of foundation the levels considered are direct attack (F3L1), crawl space/technical void (F3L2), and slab foundation (F3L3). F2L4—mixed typology with iron and SCR as single case is excluded.
The combination of walls with only SCR (F2L1) and direct attack (F3L1) shows higher radon levels with statistical significance if compared to:
  • walls of mixed typology with concrete and SCR (F2L2) combined to direct attack (F3L1)—p = 0.046
  • walls of mixed typology with concrete and SCR (F2L2) combined to slab foundation (F3L3)—p = 0.016;
  • walls of mixed typology with concrete and no SCR (F2L3) combined to crawl space/technical void (F3L2)—p = 0.014
  • walls of mixed typology with concrete and no SCR (F2L3) combined to slab foundation (F3L3)—p = 0.008.
Other combinations do not show statistical significance. However, it is worth noting that the highest radon levels in terms of AM and median are shown by the combination of walls with only SCR (F2L1) and crawl space (in the specific case of walls with only SCR, there is no combination with technical void) (F3L2).
In order to further investigate the effect of crawl space combined to walls of only SCR on radon levels, the bivariate logistic regression has been applied. For this test, the combination between the factor levels SCR (F2L1) and direct attack (F3L1) or mixed typology of construction materials (F2L2 and F2L3) and any type of foundation (F3L1 or F3L2 or F3L3) has been chosen as the reference interaction. To apply the bivariate logistic regression, radon level at GF has been treated as dichotomous variable by assigning value 0 if it is below 300 Bq/m3 or value 1 if it is above 300 Bq/m3 (dependent variable). In this way, the test helps to understand which, among the analyzed factors (independent variables), lead to radon levels above the European Union and Italian reference levels for radon in workplaces [28,29]. Results are shown in Table 7.
According to the model presented in Equation (2), a positive B value of 2.57 confirms that the combination of walls with only SCR (F2L1) with crawl space (F3L2) increases the likelihood of having radon levels exceeding 300 Bq/m3 with high statistical significance (p = 0.005). In particular, the likelihood of having such radon levels raises by about 13 times if compared to any other combination (the reference). This model explains 20% of variations in radon levels according to Nagelkerke R2: it is worth noting that all pseudo-R2, as Nagelkerke R2, produce low R2 values compared to those associated with good fits in least squares regression. Therefore, the combined presence of SCR, as unique building material, with crawl space seems to make buildings more radon-prone than other combinations.

3.2. Radon Distribution at First Floor

The distribution of radon levels at first floor (FF) are described in Table 8.
The values range between 65 Bq/m3 and 688 Bq/m3, with AM of 179 Bq/m3, median of 103 Bq/m3, and SD of 173 Bq/m3. These values are lower than ones at GF discussed previously (see 
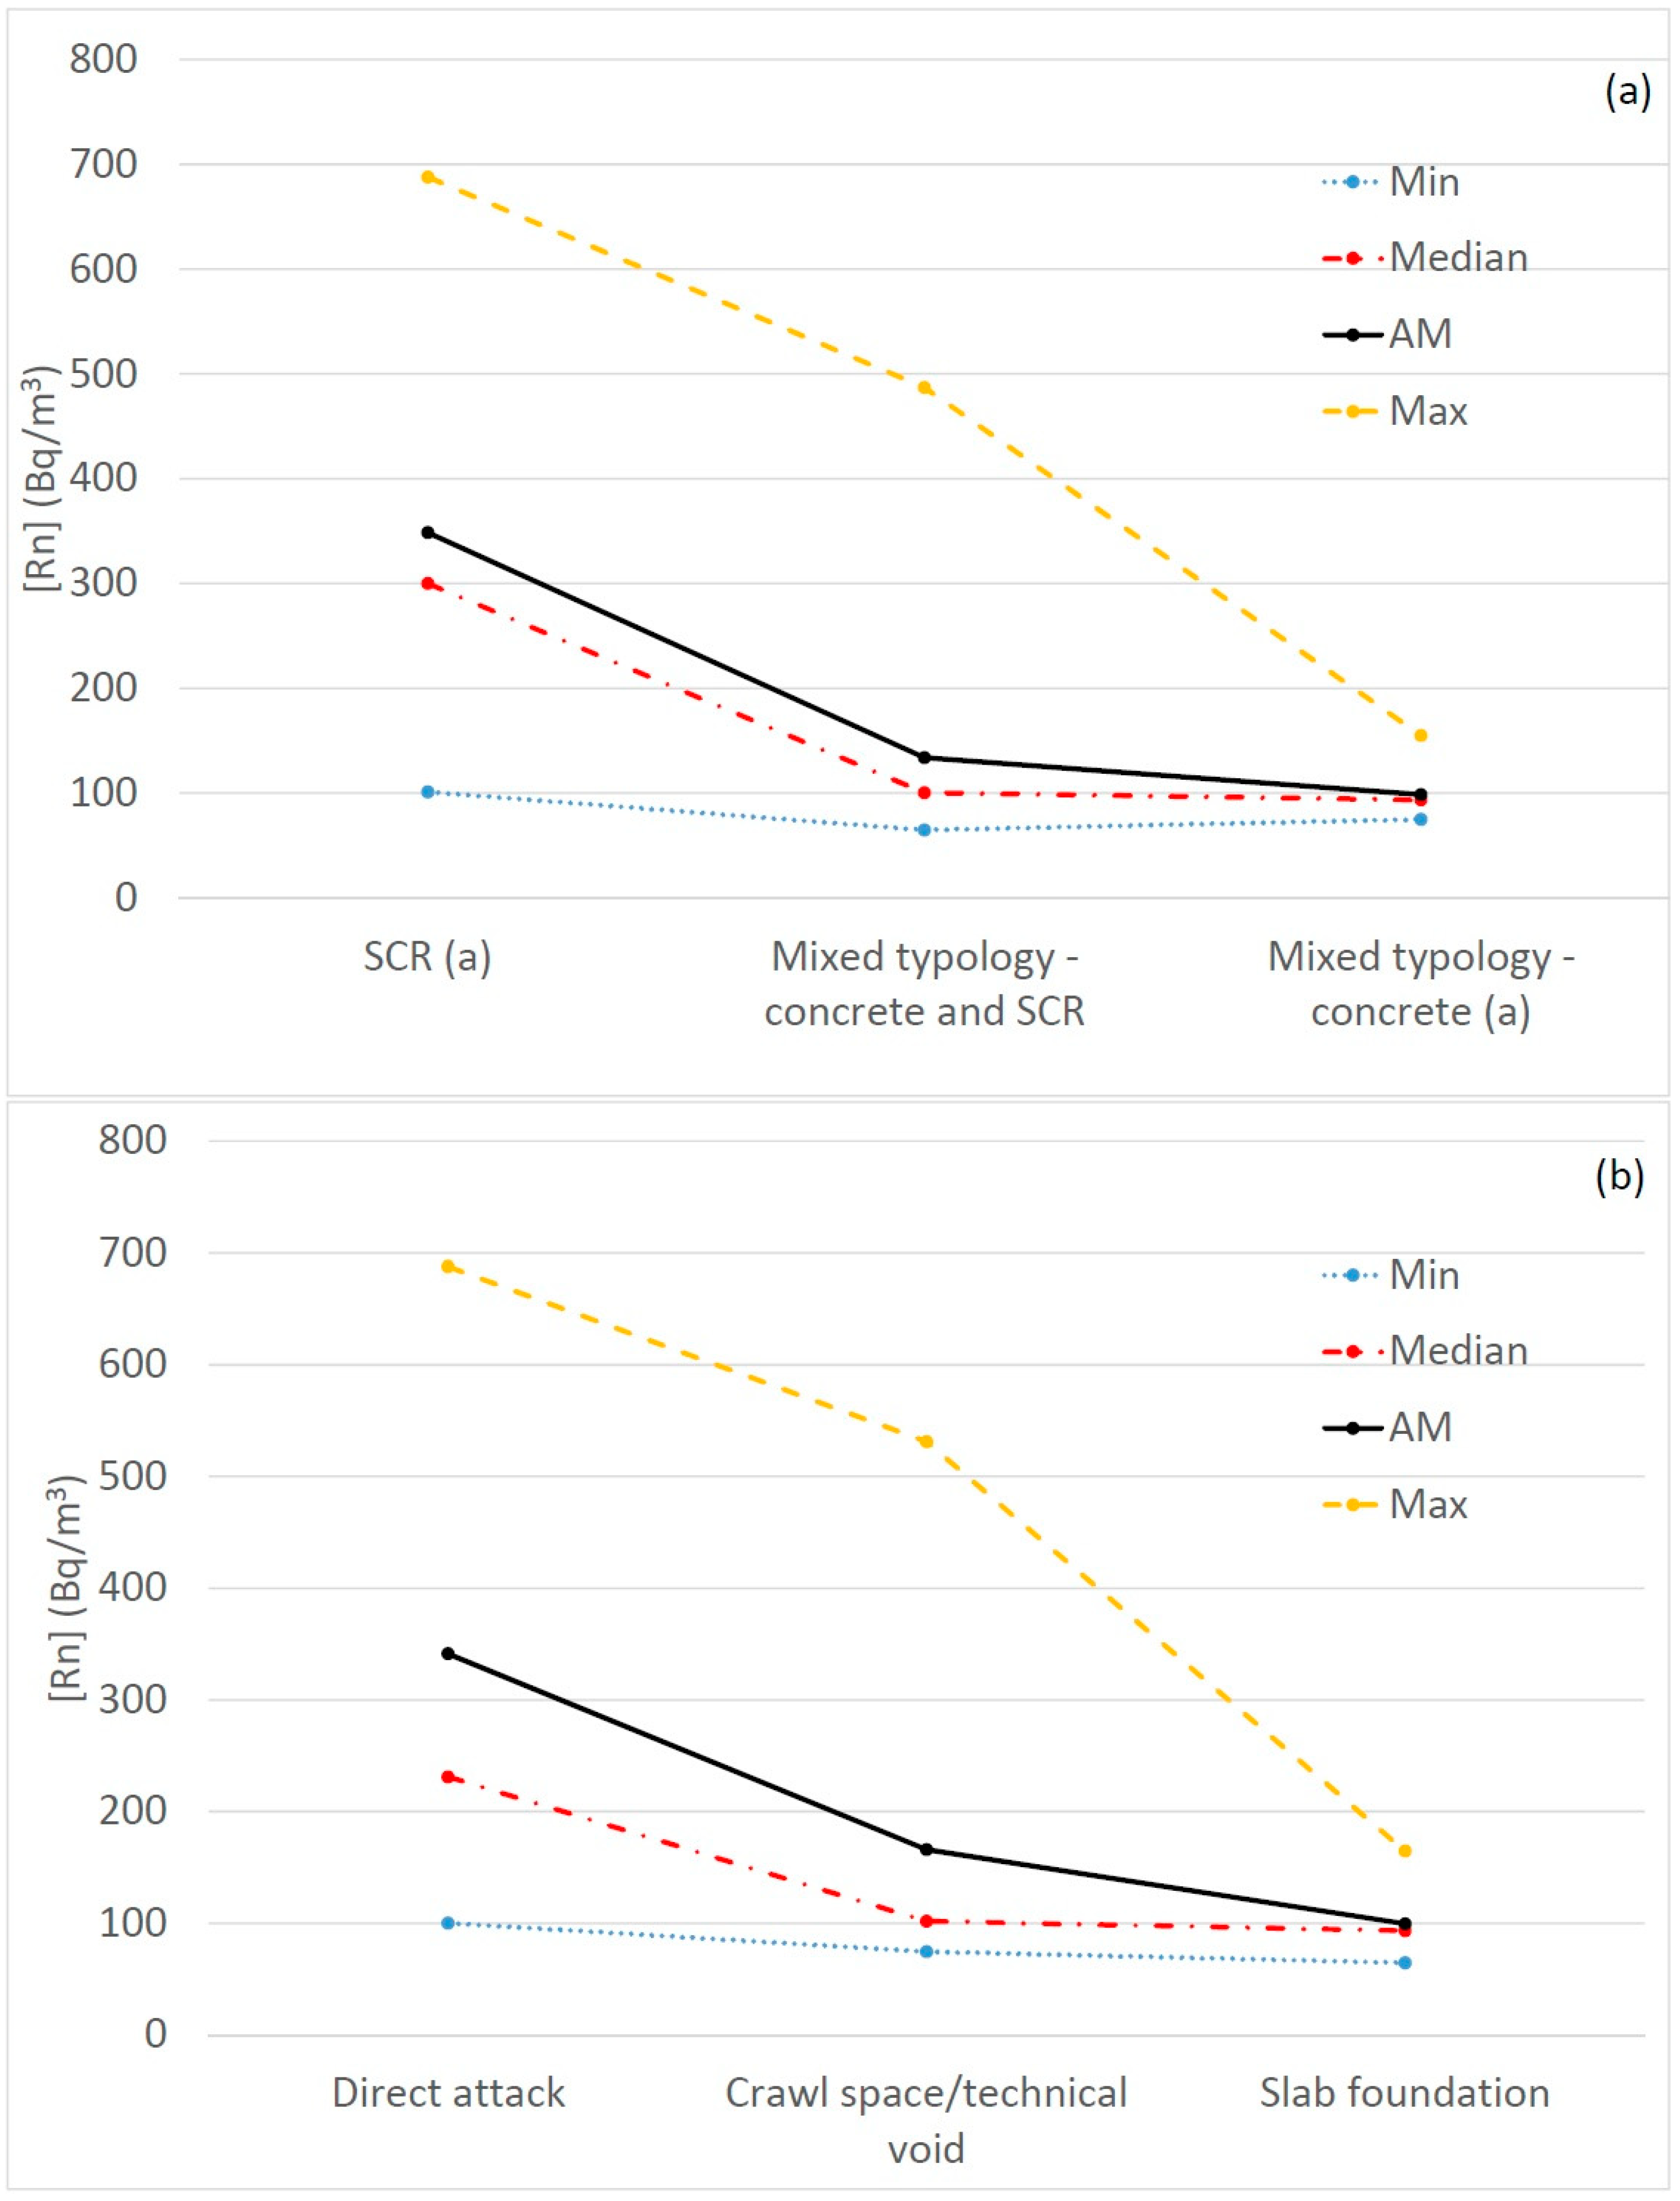
Table 2), however, it is worth noting that the two groups are not homogeneous since not all 63 buildings with GFs have also FFs. The subdivisions of radon levels for factors and levels and the statistical comparison are shown in Table 9 with Figure 2 and Table 10, respectively. The behavior of radon levels respect to the factors F2 and F3 at FF is similar to the one at GF. The radon levels, in terms of AM and median, at FF are higher for F2L1 (walls of only SCR) than for F2L3 (concrete and no SCR) with statistical significance (p = 0.020). The spatial variability between FFs, expressed as CV, is higher in presence of SCR if compared to absence of SCR (CV = 67% in the first case, CV = 22% in the second case). On the contrary, the differences between the distributions of radon levels for factor F3 are not statistically significant.
Table 11 shows the descriptive statistics of radon levels at FF for combinations of materials of construction (F2) and type of foundation (F3) as identified in the sample. In particular, for materials of construction (F2), the levels are SCR (F2L1), mixed typology with concrete and SCR (F2L2), and mixed typology with concrete and no SCR (F2L3), while for type of foundation (F3), the levels are direct attack (F3L1), crawl space/technical void (F3L2), and slab foundation (F3L3).
According to the statistical comparisons (not reported in the present paper), there is not a specific combination with statistically significant differences in the distribution of radon levels. However, it is worth noting that the statistical significances could be affected by the reduced number of radon data at FFs (36) and by the further numerical subdivision in factors and levels.

4. Discussion and Conclusions

The first part of data analysis focused on the distribution of radon levels in 63 buildings-units by observing how several building characteristics can affect the radon level at GF. The factors that determine higher radon levels in terms of AM at GF with statistical significance are:
  • the presence of only SCR (AM = 437 Bq/m3) in the walls compared with mixed typologies of construction materials such as concrete with (AM = 141 Bq/m3) or without SCR (AM = 103 Bq/m3);
  • the presence of direct attack (AM = 345 Bq/m3) or crawl space or technical void (AM = 212 Bq/m3) as type of foundation compared with slab foundation (AM = 104 Bq/m3).
If the radon levels at GFs are analyzed by matching the information about the construction materials and the type of foundation, the presence of only SCR in the walls combined to direct attack causes higher radon levels in terms of AM at GF (AM = 394 Bq/m3) with statistical significance if compared with:
  • mixed typology with concrete and infill of SCR combined to direct attack (AM = 148 Bq/m3) or slab foundation (AM = 112 Bq/m3);
  • mixed typology with concrete without SCR combined to crawl space or technical void (AM = 107 Bq/m3) or slab foundation (AM = 82 Bq/m3).
As already mentioned, the SCR blocks used as construction materials for vertical walls have a high porosity and, due to the sedimentary origin, very low natural radioactivity content (comparable to the one found in typical limestone [31]). Despite that, GFs in buildings constructed with only SCR showed the highest radon levels with AM and median exceeding 300 Bq/m3. In the sample, 19 GFs have only SCR in vertical walls: 12 GFs have direct attack as foundation, while 7 GFs have crawl space. The respective radon distributions show AM and median that are higher in the latter case (AM = 510 Bq/m3) than in the other (AM = 394 Bq/m3), although the differences are not statistically significant. However, in the analyzed sample it has been observed with statistical significance that the combination of only SCR walls with crawl space increases the likelihood of having radon levels above 300 Bq/m3.
In the second part of the analysis, it has been analyzed how construction materials and type of foundation can affect the distribution of radon levels in 36 FFs. FFs with walls of only SCR have shown an AM of radon levels (AM = 348 Bq/m3) higher than the AM value at FFs with walls of mixed typology without SCR (AM = 98 Bq/m3), as already observed at GF. If the dataset of FFs is subdivided for type of foundation or for combination of construction materials and foundation, the respective distributions of radon levels do not show statistically significant differences. Though the statistics have been applied to a small number of cases, it could be hypothesized that the materials of construction are the only factor affecting the radon levels at FF.
The karstic origin of both the subsoil and the materials of construction could be responsible for these findings. The high porosity facilitates the transport of radon gas from the subsoil to upper floors of buildings. Indeed, in a karstic area, if local rocks are used as the material of construction, both factors (F2 and F3) concur to enhance radon values at GF: radon migrates from the subsoil via the building foundation and the construction materials, particularly in presence of SCR in vertical walls [32]. At FF, instead, the only component influencing radon levels is the construction material, particularly in the presence of SCR as unique construction material or mixed with concrete.
This hypothesis seems to be supported by both the statistical evidences of the present analysis and the analysis carried out in Leonardi et al. [16] on the same dataset. In that study, a very low spatial variability was found: homogenous radon levels were observed among rooms at all floors of 54 buildings, including 4 buildings far from Lecce and excluded in the present analysis. With statistical significance, the analysis of the radon spatial variability showed more homogeneous values at FF than at GF.
All these outcomes suggest that in karstic areas buildings with sedimentary rock as the main construction material and direct attack or crawl space as type of foundation, can be considered as radon-prone buildings: the combined presence of both factors play a role in the migration of radon, produced in deeper rock strata, within the entire building. Moreover, these findings suggest that in buildings with crawl space, the implementation of ventilation of crawl space can be an effective action to reduce radon levels at ground floor [33], while its effectiveness at first (or at upper) floor is not guaranteed due to the role played by construction materials as main factor affecting the presence of radon.
These findings, finally, suggest the need to measure radon levels not only at BGF and at GF, but also at FF and above when the buildings have been built in karst areas and with construction materials including SCR blocks.

Author Contributions

Conceptualization, T.B., A.P.C., F.L. and R.T.; methodology, T.B., A.P.C., F.L. and R.T.; validation, A.P.C., F.L. and R.T.; formal analysis, T.B., A.P.C., F.L. and R.T.; investigation, A.C. and L.L.; data curation, T.B., G.B., A.P.C., F.L. and R.T.; writing—original draft preparation, T.B.; writing—review and editing, A.P.C., A.C., F.L., L.L. and R.T. All authors have read and agreed to the published version of the manuscript.

Funding

This research received no external funding.

Institutional Review Board Statement

Not applicable.

Informed Consent Statement

Not applicable.

Data Availability Statement

Not applicable.

Acknowledgments

The authors wish to thank S. Tonnarini and M. Veschetti for their technical support.

Conflicts of Interest

The authors declare no conflict of interest.

Nomenclatures

Acronyms and AbbreviationsLtHoVLevene test of Homogeneity of Variance
AMarithmetic meanMaxmaximum value
BGFbelow ground floorminminimum value
CI 95%confidence interval 95%mixed typology-CMixed typology: concrete, gypsum board; no calcarenite blocks
CVcoefficient of variationmixed typology-CIMixed typology: concrete with infill of calcarenite blocks, plaster
FFfirst floormixed typology-ITMixed typology: iron and calcarenite blocks
GFground floorMW testMann-Whitney test
GH testGames-Howell testNnumber of observations in terms of building-units
INAILNational Institute for Insurance Against Accidents at workSCRCalcarenite-sedimentary calcareous rocks
SEStandard error
KW testKruskal-Wallis testSDstandard deviation
LLDLower Limit of DetectionUniSalentoUniversity of Salento

References

  1. Zeeb, H.; Shannoun, F.; World Health Organization. WHO Handbook on Indoor Radon: A Public Health Perspective; World Health Organization: Geneva, Switzerland, 2009. [Google Scholar]
  2. United Nations Scientific Committee on the Effects of Atomic Radiation. UNSCEAR 2008 Report Vol. I. In Sources and Effects of Onizing Radiation; United Nation: New York, NY, USA, 2008. [Google Scholar]
  3. McGrath, J.A.; Aghamolaei, R.; O’Donnell, J.; Byrne, M.A. Factors Influencing Radon Concentration during Energy Retrofitting in Domestic Buildings: A Computational Evaluation. Build. Environ. 2021, 194, 107712. [Google Scholar] [CrossRef]
  4. Cosma, C.; Cucoş-Dinu, A.; Papp, B.; Begy, R.; Sainz, C. Soil and Building Material as Main Sources of Indoor Radon in Băiţa-Ştei Radon Prone Area (Romania). J. Environ. Radioact. 2013, 116, 174–179. [Google Scholar] [CrossRef] [PubMed]
  5. Bochicchio, F.; Forastiere, F.; Farchi, S.; Quarto, M.; Axelson, O. Residential Radon Exposure, Diet and Lung Cancer: A Case-Control Study in a Mediterranean Region. Int. J. Cancer 2005, 114, 983–991. [Google Scholar] [CrossRef]
  6. Lubin, J.H.; Wang, Z.Y.; Boice, J.D., Jr.; Xu, Z.Y.; Blot, W.J.; De Wang, L.; Kleinerman, R.A. Risk of Lung Cancer and Residential Radon in China: Pooled Results of Two Studies. Int. J. Cancer 2004, 109, 132–137. [Google Scholar] [CrossRef] [PubMed]
  7. Darby, S.; Hill, D.; Auvinen, A.; Barros-Dios, J.M.; Baysson, H.; Bochicchio, F.; Deo, H.; Falk, R.; Forastiere, F.; Hakama, M.; et al. Radon in Homes and Risk of Lung Cancer: Collaborative Analysis of Individual Data from 13 European Case-Control Studies. Br. Med. J. 2005, 330, 223–226. [Google Scholar] [CrossRef] [PubMed]
  8. Clement, C.H.; Tirmarche, M.; Harrison, J.D.; Laurier, D.; Paquet, F.; Blanchardon, E.; Marsh, J.W. Lung Cancer Risk from Radon and Progeny and Statement on Radon. Ann. ICRP 2010, 40, 1–64. [Google Scholar] [CrossRef] [PubMed]
  9. Stanley, F.K.T.; Irvine, J.L.; Jacques, W.R.; Salgia, S.R.; Innes, D.G.; Winquist, B.D.; Torr, D.; Brenner, D.R.; Goodarzi, A.A. Radon Exposure Is Rising Steadily within the Modern North American Residential Environment, and Is Increasingly Uniform across Seasons. Sci. Rep. 2019, 9, 18472. [Google Scholar] [CrossRef]
  10. Ivanova, K.; Stojanovska, Z.; Tsenova, M.; Kunovska, B. Building-Specific Factors Affecting Indoor Radon Concentration Variations in Different Regions in Bulgaria. Air Qual. Atmos. Health 2017, 10, 1151–1161. [Google Scholar] [CrossRef]
  11. Trevisi, R.; Leonardi, F.; Simeoni, C.; Tonnarini, S.; Veschetti, M. Indoor Radon Levels in Schools of South-East Italy. J. Environ. Radioact. 2012, 112, 160–164. [Google Scholar] [CrossRef]
  12. Csordás, A.; Szabó, K.Z.; Sas, Z.; Kocsis, E.; Kovács, T. Indoor Radon Levels in Hungarian Kindergartens. J. Radioanal. Nucl. Chem. 2021, 328, 1375–1382. [Google Scholar] [CrossRef]
  13. Kojo, K.; Kurttio, P. Indoor Radon Measurements in Finnish Daycare Centers and Schools—Enforcement of the Radiation Act. Int. J. Environ. Res. Public Health 2020, 17, 2877. [Google Scholar] [CrossRef]
  14. Bochicchio, F.; Žunić, Z.S.; Carpentieri, C.; Antignani, S.; Venoso, G.; Carelli, V.; Cordedda, C.; Veselinović, N.; Tollefsen, T.; Bossew, P. Radon in Indoor Air of Primary Schools: A Systematic Survey to Evaluate Factors Affecting Radon Concentration Levels and Their Variability. Indoor Air 2014, 24, 315–326. [Google Scholar] [CrossRef] [PubMed]
  15. Venoso, G.; Iacoponi, A.; Pratesi, G.; Guazzini, M.; Boccini, L.; Corbani, E.; Bucci, S.; Leonardi, F.; Trevisi, R.; Ampollini, M.; et al. Impact of Temporal Variability of Radon Concentration in Workplaces on the Actual Radon Exposure during Working Hours. Sci. Rep. 2021, 11, 16984. [Google Scholar] [CrossRef] [PubMed]
  16. Leonardi, F.; Botti, T.; Buresti, G.; Caricato, A.P.; Chezzi, A.; Pepe, C.; Spagnolo, S.; Tonnarini, S.; Veschetti, M.; Trevisi, R. Radon Spatial Variations in University’s Buildings Located in an Italian Karst Region. Atmosphere 2021, 12, 1048. [Google Scholar] [CrossRef]
  17. Trevisi, R.; Caricato, A.; D’Alessandro, M.; Fernández, M.; Leonardi, F.; Luches, A.; Tonnarini, S.; Veschetti, M. A Pilot Study on Natural Radioactivity in Schools of South-East Italy. Environ. Int. 2010, 36, 276–280. [Google Scholar] [CrossRef]
  18. Leonardi, F.; Veschetti, M.; Tonnarini, S.; Cardellini, F.; Trevisi, R. A Step towards Accreditation: A Robustness Test of Etching Process. Appl. Radiat. Isot. 2015, 102, 93–97. [Google Scholar] [CrossRef]
  19. Bartlett, D.T.; Gilvin, P.J.; Still, R.; Dixon, D.W.; Miles, J.C.H. The NRPB Radon Personal Dosimetry Service. J. Radiol. Prot. 1988, 8, 19. [Google Scholar] [CrossRef]
  20. Borgoni, R.; De Francesco, D.; De Bartolo, D.; Tzavidis, N. Hierarchical Modeling of Indoor Radon Concentration: How Much Do Geology and Building Factors Matter? J. Environ. Radioact. 2014, 138, 227–237. [Google Scholar] [CrossRef]
  21. La Verde, G.; Raulo, A.; D’Avino, V.; Paternoster, G.; Roca, V.; La Commara, M.; Pugliese, M. Pietra Leccese and Other Natural Stones in Puglia Region: A New Category of Building Materials for Radiation Protection? Int. J. Environ. Res. Public Health 2021, 18, 11213. [Google Scholar] [CrossRef]
  22. IBM Corp. Released 2017 IBM SPSS Statistics for Windows; Version 25.0; IBM Corp: Armonk, NY, USA, 2017. [Google Scholar]
  23. Kruskal, W.H.; Wallis, W.A. Use of Ranks in One-Criterion Variance Analysis. J. Am. Stat. Assoc. 1952, 47, 583–621. [Google Scholar] [CrossRef]
  24. Games, P.A.; Howell, J.F. Pairwise Multiple Comparison Procedures with Unequal N’s and/or Variances: A Monte Carlo Study. J. Educ. Stat. 1976, 1, 113–125. [Google Scholar] [CrossRef]
  25. Hosmer, D.W.; Lemeshow, S. Applied Logistic Regression, 2nd ed.; Hosmer, D.W., Lemeshow, S., Eds.; John Wiley & Sons, Ltd.: Hoboken, NJ, USA, 2000; ISBN 0-471-35632-8. [Google Scholar]
  26. Cox, D.R. The Regression Analysis of Binary Sequences. J. R. Stat. Soc. Ser. B 1958, 20, 215–232. [Google Scholar] [CrossRef]
  27. Online Resources: Decreto Legislativo 31 Luglio 2020, n. 101 2020. Available online: https://www.gazzettaufficiale.it/eli/id/2020/08/12/20G00121/sg (accessed on 12 August 2020).
  28. Online Resources: European Commission. Radiation Protection 193 Radon in Workplaces. Implementing the Requirements in Council Directive 2013/59/Euratom; Publications Office of the European Union. 2020. Available online: https://op.europa.eu/s/pDS7 (accessed on 5 May 2023).
  29. European Commission. Council Directive 2013/59/Euratom of 5 December 2013. Off. J. Eur. Union 2014, L13-1, 1–73. [Google Scholar]
  30. Nagelkerke, N.J.D. A Note on a General Definition of the Coefficient of Determination. Biometrika 1991, 78, 691–692. [Google Scholar] [CrossRef]
  31. Nuccetelli, C.; Risica, S.; Onisei, S.; Leonardi, F.; Trevisi, R. Natural Radioactivity in Building Materials in the European Union: A Database of Activity Concentrations and Radon Exhalations; Rapporti ISTISAN 17/36; Istituto Superiore di Sanità: Roma, Italy, 2017; ISSN 2384-893. [Google Scholar]
  32. Hughes, J.; Turk, B.H.; Cardwell, R.; Brooks, P.O.-S.; White, M.; Fitzgerald, F.S.; Wilson, D. Karst geology, radon fluctuations, and implications for measurement and mitigation. In Proceedings of the “Radon in the Living Environment”, Athens, Greece, 19–23 April 1999. [Google Scholar]
  33. Tunno, T.; Caricato, A.P.; Fernandez, M.; Leonardi, F.; Tonnarini, S.; Veschetti, M.; Zannoni, G.; Trevisi, R. Critical Aspects of Radon Remediation in Karst Limestone Areas: Some Experiences in Schools of South Italy. J. Radiol. Prot. 2017, 37, 160–175. [Google Scholar] [CrossRef] [PubMed]
Figure 1. Values of min, median, AM, and max of radon levels at GF subdivided for (a) material of construction (F2L1, F2L2, F2L3), (b) type of foundation (F3L1, F3L2, F3L3) as reported by Table 3. The levels that share the same letter in brackets show data distribution with statistical significance according to the testing results showed in Table 4.
Atmosphere 14 00950 g001
Figure 2. Values of min, median, AM, and max of radon levels at FF subdivided for (a) material of construction (F2L1, F2L2, F2L3), (b) type of foundation (F3L1, F3L2, F3L3) as reported in Table 9. The levels that share the same letter in brackets show data distribution with statistical significance according to the testing results showed in Table 10.
Atmosphere 14 00950 g002
Table 1. Factors and levels considered in the analysis.
Id. NumberFactorId. NumberLevel
F1year of constructionL1pre-1960
L2post-1960
F2materials of constructionL1SCR
L2mixed typology-CI
L3mixed typology-C
L4mixed typology-IT
F3type of foundationL1direct attack 1
L2crawl space or technical void
L3slab foundation
F4typology of constructionL1presence of BGF 2
L2absence of BGF
1 No insulation between subsoil and building base. 2 Included underground floor and basement.
Table 2. Descriptive statistics of radon levels at GF.
NMinMaxAMMedian (CI 95%)SDCV R n >   300   Bq / m 3
Bq/m3%
63451072218121 (101; 148)2169922
Table 3. Descriptive statistics of radon concentrations at GF subdivided in factors and levels as described in Table 1. Levels with the same letter in brackets show data distribution with statistical significance according to the testing results showed in Table 4.
Factor/LevelNMinMaxAMMedianSDCV
Bq/m3%
F1L1 (a)2398107238938027370
F1L2 (a)4045438120997260
F2L1 (b,c)1998107243742027763
F2L2 (b)24454381411159064
F2L3 (c)1970148103992221
F2L4179-----
F3L1 (c)159879634533822766
F3L2 (d)33451072212118230109
F3L3 (c,d)1551279104845957
F4L127451072217101262121
F4L2367979621812717882
Table 4. Statistical comparisons and testing results between radon levels at GF. Bold numbers highlight results with statistical significance. The level 4 of factor 2 is excluded because it is a single case.
FactorMW TestKW TestLtHoVGH Test
F1<0.001 (L1–L2)---
F2 <0.001<0.0010.001 (L1–L2)
<0.001 (L1–L3)
0.218 (L2–L3)
F3 <0.0010.0100.164 (L1–L2)
0.003 (L1–L3)
0.042 (L2–L3)
F40.134 (L1–L2)---
Table 5. Descriptive statistics of radon levels at GF subdivided for combination of materials of construction (F2) and type of foundation (F3). The levels that share the same letter in brackets show data distribution with statistical significance according to the testing results showed in Table 6.
Factor/LevelNMinMaxAMMedianSDCV
Bq/m3%
F2L1–F3L1 (a, b, c, d)129879639439422858
F2L1–F3L2 *7108107251048835469
F2L2–F3L1 (a)31011831481614229
F2L2–F3L2104543817015211668
F2L2–F3L3 (b)1151279112846860
F2L3–F3L2 (c)16791481071052120
F2L3–F3L3 (d)3709282841113
* Crawl space, no technical void.
Table 6. Statistical comparisons with the Games–Howell test and testing results for combination of materials of construction (F2) and type of foundation (F3) at GF. Bold numbers highlight results with statistical significance.
GH TestF2L1–F3L2 *F2L2–F3L1F2L2–F3L2F2L2–F3L3F2L3–F3L2F2L3–F3L3
F2L1–F3L10.9820.0460.0970.0160.0140.008
F2L1–F3L2 * 0.2440.3010.1810.1710.140
F2L2–F3L1 0.9980.8970.6890.392
F2L2–F3L2 0.8000.6220.301
F2L2–F3L3 1.0000.785
F2L3–F3L2 0.178
* Crawl space, no technical void.
Table 7. Bivariate logistic regression for radon levels at GF. B represents the coefficients of Equation (2). Nagelkerke R2 value: 0.20.
Factor/LevelBSEpExp(B)CI (95%)
F2L1–F3L1
or
F2L2/F2L3–F3L1/F3L2/F3L3
Ref.
F2L1–F3L2 *2.570.910.00513.06(2.18; 78.05)
* Crawl space, no technical void.
Table 8. Descriptive statistics of radon levels at FF.
NMinMaxAMMedian (CI 95%)SDCV R n >   300   Bq / m 3
Bq/m3%
3665688179103 (96;121)1739717
Table 9. Descriptive statistics of radon concentrations at FF subdivided levels of factors, as materials of construction (F2) and type of foundation (F3), as reported in Table 1. The levels with the same letter in brackets show data distribution with statistical significance according to the testing results showed in Table 10.
Factor/LevelNMinMaxAMMedianSDCV
Bq/m3%
F2L1 (a)1010168834830023367
F2L2116548713410012090
F2L3 (a)157515598932122
F3L1610068834123127280
F3L2217553116610215091
F3L3965165100933333
Table 10. Statistical comparisons and testing results between radon levels at FF. Bold numbers highlights results with statistical significance.
FactorKW TestLtHoVGH Test
F20.001<0.0010.052 (L1–L2)
0.020 (L1–L3)
0.613 (L2–L3)
F30.0310.0010.350 (L1–L2)
0.168 (L1–L3)
0.155 (L2–L3)
Table 11. Descriptive statistics of radon levels at FF subdivided for combination of materials of construction (F2) and type of foundation (F3).
Factor/LevelNMinMaxAMMedianSDCV
Bq/m3%
F2L1–F3L1512768839030827370
F2L1–F3L2 *510153130729220868
F2L2–F3L11100-----
F2L2–F3L248848719399196101
F2L2–F3L3665165100903939
F2L3–F3L2127515598962122
* Crawl space, no technical void.
Disclaimer/Publisher’s Note: The statements, opinions and data contained in all publications are solely those of the individual author(s) and contributor(s) and not of MDPI and/or the editor(s). MDPI and/or the editor(s) disclaim responsibility for any injury to people or property resulting from any ideas, methods, instructions or products referred to in the content.

