Article

Nexus between Social Vulnerability and Resilience to Agricultural Drought amongst South African Smallholder Livestock Households

Department of Agricultural Economics, The University of the Free State, P.O. Box 339, Bloemfontein 9300, South Africa
*
Author to whom correspondence should be addressed.
Atmosphere 2023, 14(5), 900; https://doi.org/10.3390/atmos14050900
Submission received: 31 March 2023 / Revised: 17 May 2023 / Accepted: 19 May 2023 / Published: 21 May 2023

Abstract

:
Livestock farmers in Sub-Saharan Africa rely on rain-fed agriculture, which exposes them to the risks of agricultural drought. Agricultural drought has become a significant threat to the extreme mortality of livestock, thus negatively impacting social vulnerability and household resilience to agricultural drought and extreme events. Researchers rarely empirically assess the connection between vulnerability and resilience, which are highly related concepts. By measuring and connecting vulnerability and resilience concepts closely related to disasters such as agricultural drought, this article makes a contribution to the body of disaster literature. The study aimed to empirically examine the relationship between smallholder livestock farming households’ social vulnerability and their resilience to agricultural drought. A survey of 217 smallholder livestock farmers was conducted. The Social Vulnerability Index (SVI), the Agricultural Drought Resilience Index (ADRI), and Pearson’s correlation coefficient were used for data analysis. A correlation was identified between resilience to agricultural drought and social vulnerability, indicating that smallholder livestock farmers are more susceptible to harm and lack the means to rebound effectively. Unsurprisingly, the majority of resource-poor smallholder livestock farmers (79%) lack safety nets during agricultural droughts. They are less resilient and more vulnerable households, leading them to social vulnerability. This study provides input/guidance to identify farming households with high social vulnerability and less resilience to threats and their capabilities of recouping and adopting after experiencing an agricultural drought. Additionally, looking at household resilience and social vulnerability to agricultural droughts could provide a way to pinpoint at-risk areas, assisting emergency planners in directing resources and intervention programs to those areas where assistance is most likely to be needed during disasters such as agricultural droughts. This implies that thorough policy intervention programs need to be tailored toward reducing damage or finding the path to recovery.

1. Introduction

Research on vulnerability and resilience to hazards such as agricultural drought is becoming increasingly important in a world with more extreme weather patterns and global occurrences of disasters, including agricultural drought. Understanding how farming households differ regarding the damage that threats can cause, as well as the resources and recovery strategies available to farming households, is critical to assisting farmers in planning for and recovering from disasters. In assessing agricultural drought risks and coping and adaption capacities, social vulnerability, sustainability, and farming household resilience are crucial concepts [1]. Agricultural drought has put sub-Saharan Africa under significant pressure, and it will negatively influence future generations without adaptation. Hence, it is crucial to look from the perspective of adaptation and coping strategies, the resilience of agricultural drought, its implication on the sustainability of the livestock sector, and developing future interventions [2].
Vulnerability as a concept suggests some risk, combined with the social and economic viability and the capacity to handle the consequences. Vulnerability refers to how a system or part of a system reacts negatively to a hazardous event, such as an agricultural drought. As a result, people become “vulnerable” when they lack access to resources to secure their livelihoods or recover from disasters. Those households with access to tools, capital, able-bodied members, and equipment are the fastest to recoup from a disaster. Therefore, the poorest are the most susceptible, leaving them with few options other than to live in risky conditions [3]. This study focuses on disaster management literature, where vulnerability is more often defined as the conditions and characteristics leading to humans becoming vulnerable to agricultural droughts (e.g., inequalities and social structures) in dealing with agricultural drought rather than simply the likelihood of experiencing a disaster [4]. Even though social vulnerability is only one component of a more extensive vulnerability evaluation, it is noteworthy concerning agricultural drought risk evaluation.
Social vulnerabilities are based on the fact that social systems significantly influence human vulnerability to hazards. Assessment of social vulnerability determines how social characteristics relate to agricultural drought vulnerability and identifies those at risk, in accordance with Dunning and Durden [5]. Social vulnerability has been defined as susceptibility, coping capacity, and exposure [6]. Folke [7] also discusses how climate change leaves households, communities, states, and countries vulnerable. Understanding what causes social vulnerability is a critical step toward assisting households and communities in acquiring the resources and strategies required to minimize disaster losses.
Households and communities are vulnerable when facing hazards, such as droughts, but resilient when dealing with and recovering from these hazards. Various fields utilize resilience, along with vulnerability [8]. Generally, resilience suggests the capacity to recover from adversity. Specifically, resilience refers to everything from the elasticity of physical materials to how people deal with trauma psychologically. The aptitude to handle stressful and adverse situations positively is an example of psychological resilience [9].
Regarding stresses and shocks, resilience relates to social system dynamics such as adaptability and transformability and the ability of complex socio-ecological systems and communities to learn, transform, adapt, and cope. The ability to bounce back would be defined as resilience. Resilience emphasizes the interaction of gradual and abrupt change. In turbulent times, it emphasizes the ability to cope with change [10,11]. Complex adaptive systems have the property of resilience. It is about improving the ability of the system to remain on a specific path of development despite incremental and abrupt changes, and expected and unanticipated changes [12].
Resiliency is an integral part of a community’s social and economic fabric [13]. Communities lacking resiliency may experience increased mental health and health problems and delayed recovery. According to Paton and Johnston [14], Cutter et al. [15], and Carmen et al. [16] resilient communities may furthermore recover, grow due to threats and provide opportunities before a disaster occurs, during the acute phase, and in recovery planning to identify and address inequalities, and they are important for inclusive recovery strategies that support the needs of all in the community.
As concepts, social vulnerability and community resilience are distinct but frequently intertwined. Essentially, vulnerability refers to qualities measured for a social system before disasters strike, which leads to the risk of exposure and degree of harm. Resilience, on the other hand, refers to social systems’ ability to adapt to hazards and disasters, and to cope with and absorb shocks [15].
Social vulnerability and agricultural drought put additional strain on already scarce resources and their long-term sustainability. Africa is the most vulnerable to the effects of agricultural drought due to limited resources. In developing countries, agricultural drought causes 80% of economic losses and affects the sustainability of agriculture by reducing social well-being as well as decreasing economic and environmental resources [17]. Agricultural drought-induced changes to social, economic, and environmental resources affect the livelihoods of smallholder farmers unless adequate measures are taken through adaptation and coping strategies [2]. The adaptation and coping strategies, agricultural drought resilience, and the sustainability of the agricultural sector, including livestock sectors, depend on economic, social, institutional, environmental, and community factors [18].
Adaptation refers to improving resilience and reducing households’ vulnerability when responding to agricultural drought impacts. Wang et al. [19] defined adaptation as the ability of economic, environmental, and social systems to adjust to change and cope with the consequences of agricultural drought. Agricultural sustainability, including livestock, refers to the state where agricultural production levels are maintained within the ecosystem’s capacity while supporting and utilizing sustainability indicators that cover the three pillars of sustainable development (environmental, economic, and social) [20]. On the other hand, resilience thinking sees sustainability as a process of studying how to keep a system running in the face of adversity, such as agricultural drought [21].
Many scholars have noted conceptual connections between these two indices (Social Vulnerability Index and Agricultural drought Index). Still, few have empirically examined the relationship between farming household resilience and social vulnerability (an exception can be found in Sherrieb et al. [13] and Bergstrand et al. [1]). However, whereas these studies conducted their research at national and regional levels, the current study deals with the provincial level. This begs the question of whether the most vulnerable farming households are also the least resilient. There appears to be an implicit assumption in the literature that farming households with low agricultural drought resiliency also have high social vulnerability. However, this has yet to be tested at the provincial level, such as in South Africa’s Northern Cape Province. To direct resources and guide decision makers’ actions, the relationship between social vulnerability and farming households’ resilience could be useful in identifying the risks and preparing for them, such as by developing policy interventions to enhance the resilience of the less fortunate smallholder livestock farmers.
This study focused on the Northern Cape province of South Africa and aimed to empirically examine the relationship between smallholder livestock farming households’ social vulnerability and their resilience to agricultural drought. During the survey, 217 smallholder livestock respondents were interviewed. The Social Vulnerability Index (SVI), Agricultural Drought Resilience Index (ADRI), and Pearson’s correlation coefficients were used to analyze the data.

2. Materials and Methods
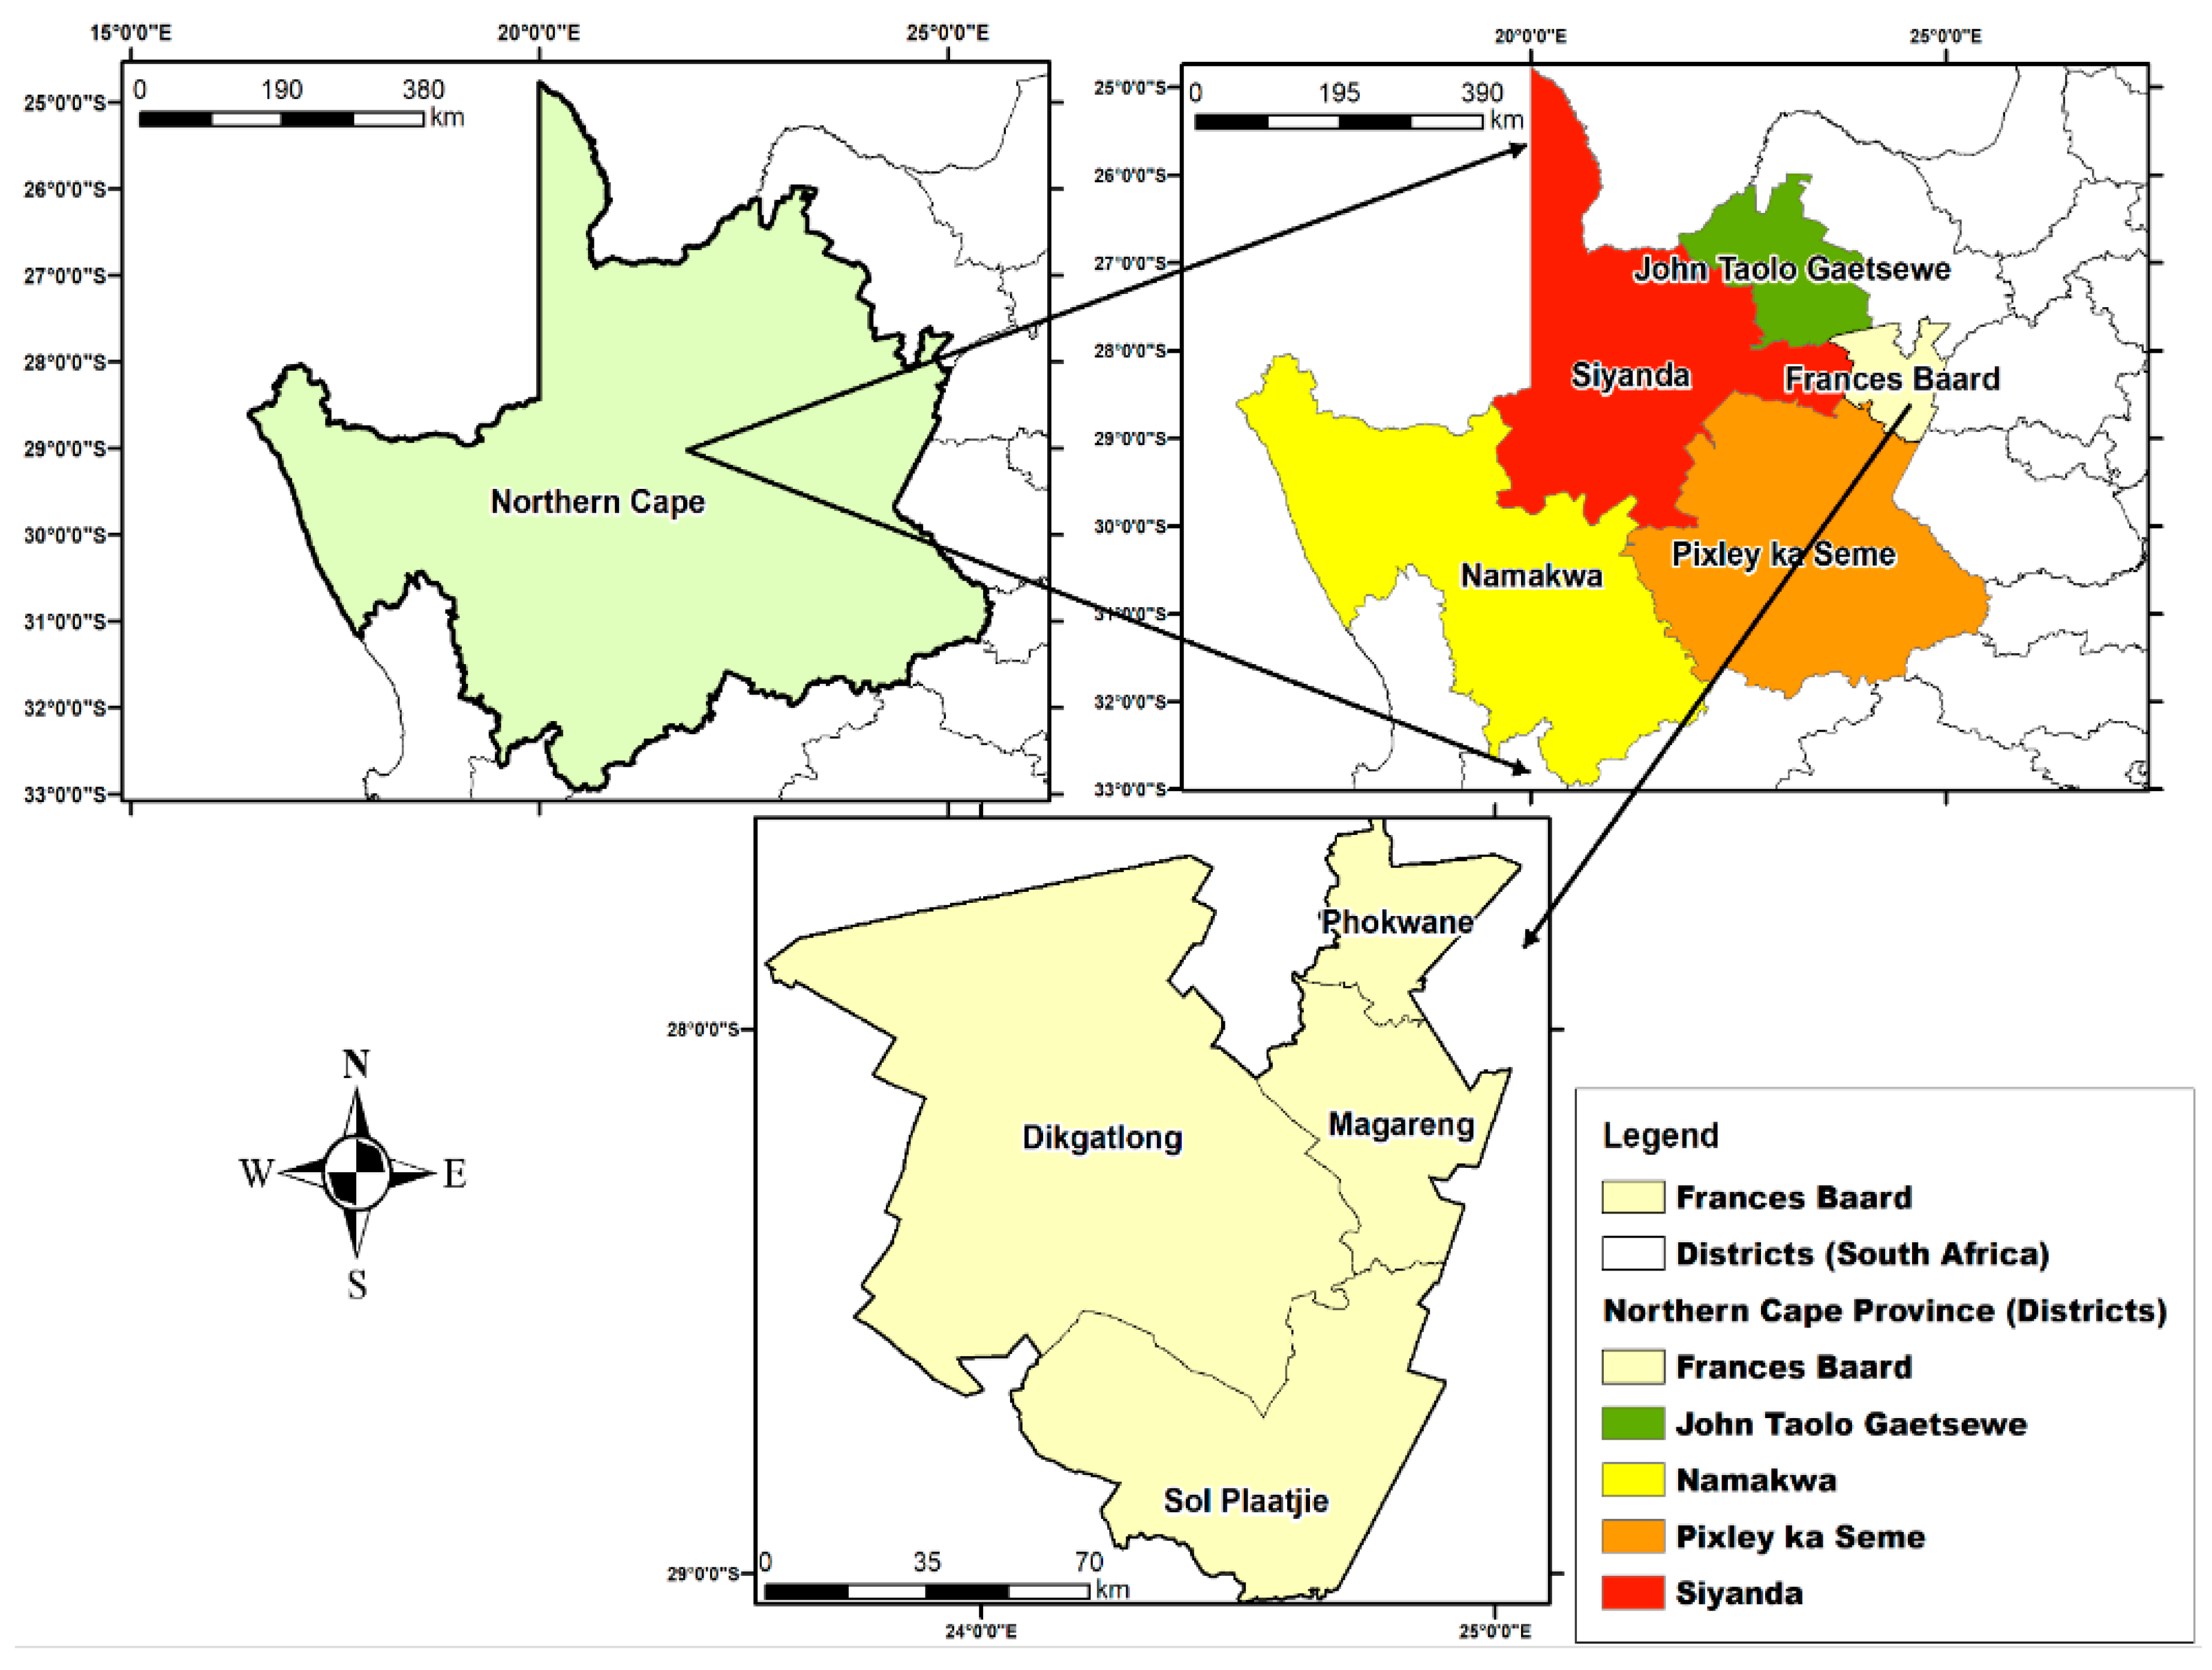
To assess the relationship between social vulnerability and agricultural drought resilience among smallholder livestock farmers, first, the study turned to the disaster preparedness literature and selected two prominent and currently widely utilized indicators signifying the concepts of vulnerability and resilience: the Social Vulnerability Index (SVI) and the Agricultural Drought Resilience Index (ADRI). The SVI was compared to the negative ADRI to see if increased vulnerability was associated with decreased resilience. The study computed Pearson’s correlation coefficients to determine the relationship between these concepts, and then to determine whether increased vulnerability correlated with decreased resilience.

2.1. Study Area

The Northern Cape Province is situated in South Africa’s northwest area. Frances Baard, Pixley Ka Seme, ZF Mgcawu, John Taolo Gaetsewe, and Namakwa are the province’s five district municipalities.
Located in the middle of the desert, the province has an arid climate and is divided into semi-deserts and deserts [22]. There are many different agricultural commodities given the climatic differences between district municipalities [23].
The recent agricultural drought has crippled agriculture in the Northern Cape Province, with slow or non-existent recovery. Smallholder farmers’ livelihoods have suffered as a result of a scarcity of water, insufficient grazing and fodder, and a shortage of resources, all of which have placed severe strain on the livestock industry [24]. The Frances Baard District Municipality (FBDM) was used as the study area of this study. The FBDM is in the Northern Cape Province of South Africa (Figure 1) and consists of four local municipalities: Phokwane, Sol Plaatje, Dikgatlong, and Magareng [25].
Approximately 48,300 households in the Northern Cape province were engaged in agriculture in 2016 [23]. The agricultural sector mainly comprises extensive commercial livestock farming, with communal farming concentrated in rural municipal areas. The fertile Orange River area provides valuable irrigation to grape and fruit farmers, with wheat, maize, peanuts, cotton, and Lucerne closer to Douglas and Prieska [26]. Various agricultural production takes place in the Northern Cape Province of South Africa due to the vast difference in climate between the regions; 15.2% of South Africa’s groundnuts were produced in the province in the 2016/2017 season as well as 11.3% of the country’s wheat. Livestock production remains the leading enterprise, with 75% of agricultural households farming livestock, while other households were engaged in cultivating only crops (15%) and mixed farming (10%) [23]. In the context of South Africa, the Northern Cape produces approximately 4% of the country’s cattle, 24% of the sheep, 7% of the goats, and 1.4% of the chickens [23]. Smallholder farmers contribute substantially to the rural economy and are considered the channel through which rural development can be expedited and poverty can be alleviated [27].
Figure 1. Maps of Frances Baard District Municipality (FBDM) (study area). Source: FBDM [28] and authors.
Atmosphere 14 00900 g001

2.2. Analytical Technique and Sampling Procedure

A multi-stage sampling method was used to conduct the survey. Because it is South Africa’s primary livestock-producing province, the Northern Cape Province was purposefully chosen in the first round. The FBDM was selected randomly through balloting in the second stage of the sampling. All four local municipalities within FBDM were purposefully chosen as the primary livestock-producing municipalities. Finally, the sample frame was selected from a list of smallholder farmers identified and assisted during the 2015/2016 and 2018/2019 agricultural seasons (Table 1). According to the Northern Cape Department of Agriculture, Forestry, and Fisheries [29], the four local municipalities assisted 878 smallholder livestock farming units in FBDM. The government helped by providing animal feed and medication, increasing smallholder farmers’ participation in agricultural drought resilience measures through training and information dissemination, and improving access to agricultural financing and farm inputs. From the 878 helped farmers, 217 smallholder livestock producers were chosen using Cochran’s [30] and Bartlett et al.’s [31] simple random sample formula.
The correct sample size was determined using Cochran’s [30] sample size formula (Equation (1)):
S a m p l e   s i z e = q 2 z ( r ) ( w ) 2
where “q” is the level of confidence/alpha level (value for the selected alpha level indicates the level of risk the researcher is willing to take so that the true margin of error may exceed the acceptable margin). “z” and “r” are the estimates of the variance of the population; the estimate of variance is calculated as =0.25 (maximum possible proportion (0.5) ∗ 1 = maximum likely proportion (0.5), which produces the maximum possible sample size). “w” is the acceptable margin of error for the proportion being estimated =0.05% (5%) (error researchers are willing to accept).
If this formula is applied to the study, and an alpha level of 1.65 (0.10), an estimated variance of 0.5, and an error level of 0.05 were used, the formula would be as follows (Equation (2)):
S a m p l e   s i z e = 1.65 2 0.5 ( 0.5 ) ( 0.05 ) 2
S a m p l e   s i z e = 272 (resulting in a sample size of 272 respondents).
As mentioned above, according to the Northern Cape Department of Agriculture, Forestry, and Fisheries [20], 878 smallholder livestock farming units in FBDM were assisted by the four local municipalities. A sample size of 272 would represent 31% of the total population and requires the application of Cochran’s [30] formula. Applying this formula (Equations (3) and (4)) reveals that a sample size of at least 208 respondents would ensure accurate results.
However, to determine the sample size when exceeding 5% of the population (288.83), Cochran’s [30] formula should be applied (Equations (3) and (4)):
N 1 = S a m p l e   s i z e 1 + ( N 0 / p o p u l a t i o n )
N 1 = 272 1 + ( 272 / 878 )
𝑁1 = 208
The study obtained complete sets of questionnaires from 217 participants, and all the questionnaires were used. Table 1 shows the distribution of these participants throughout the different local municipalities.

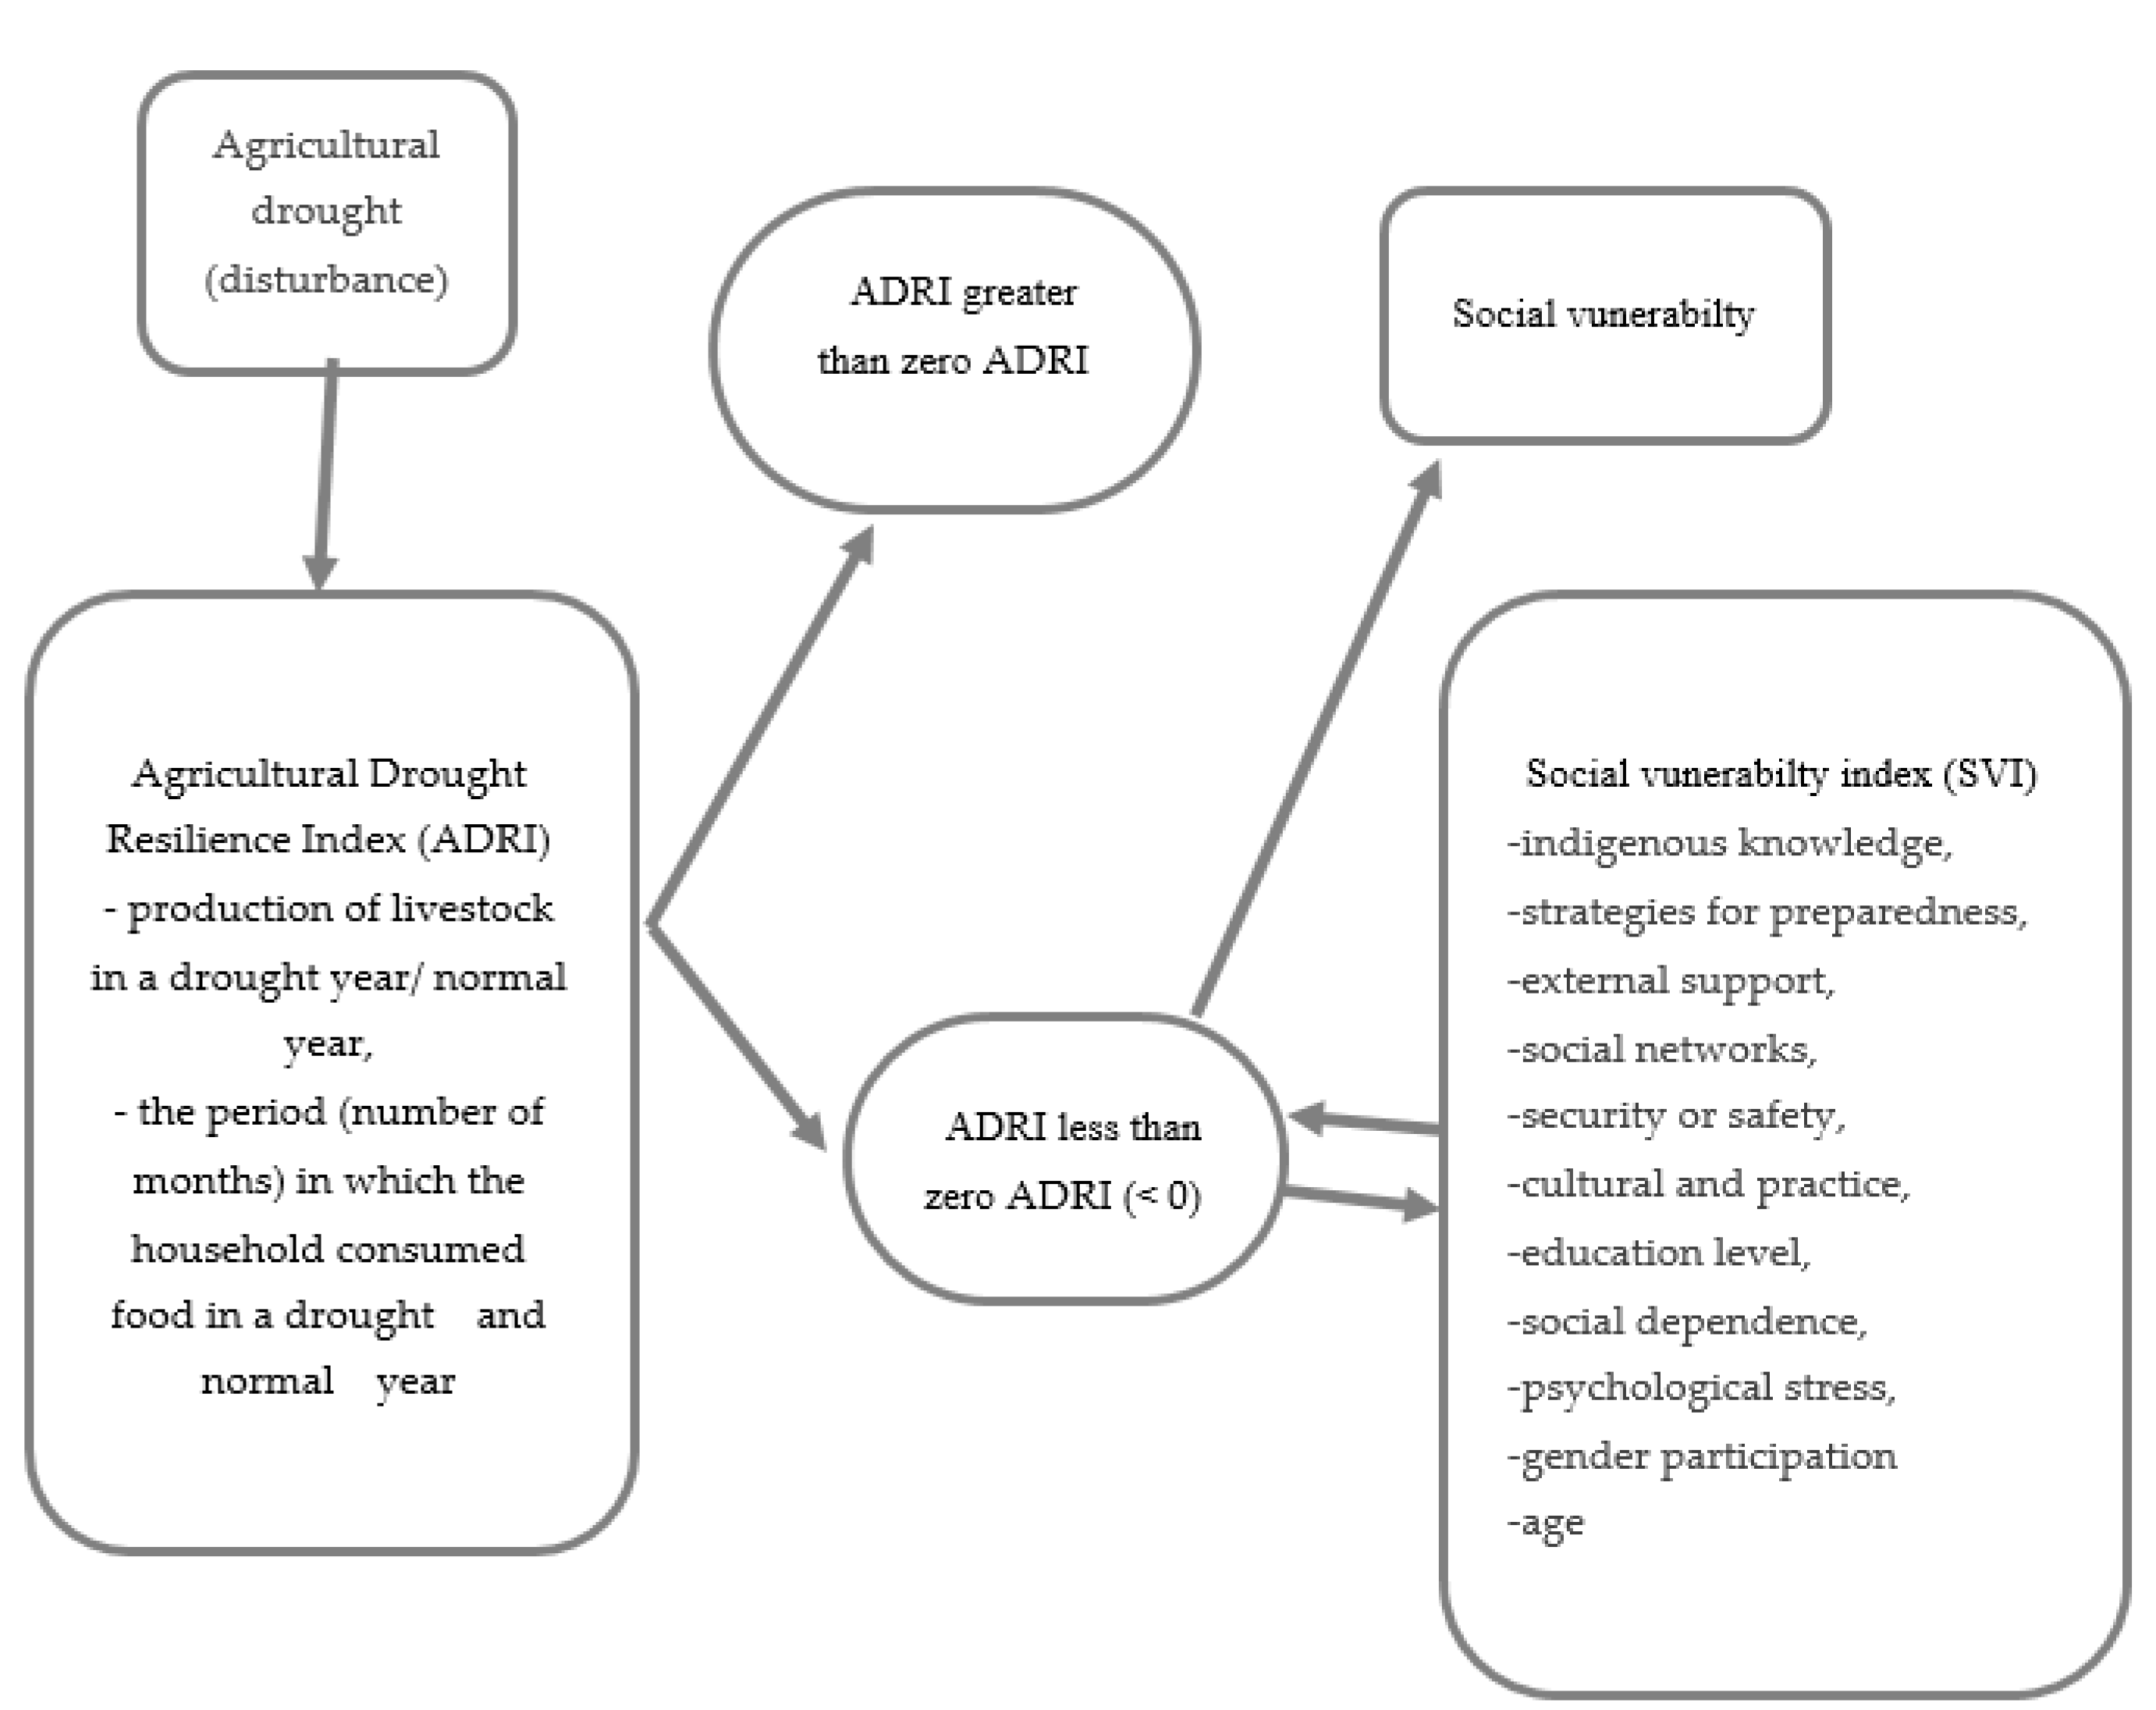
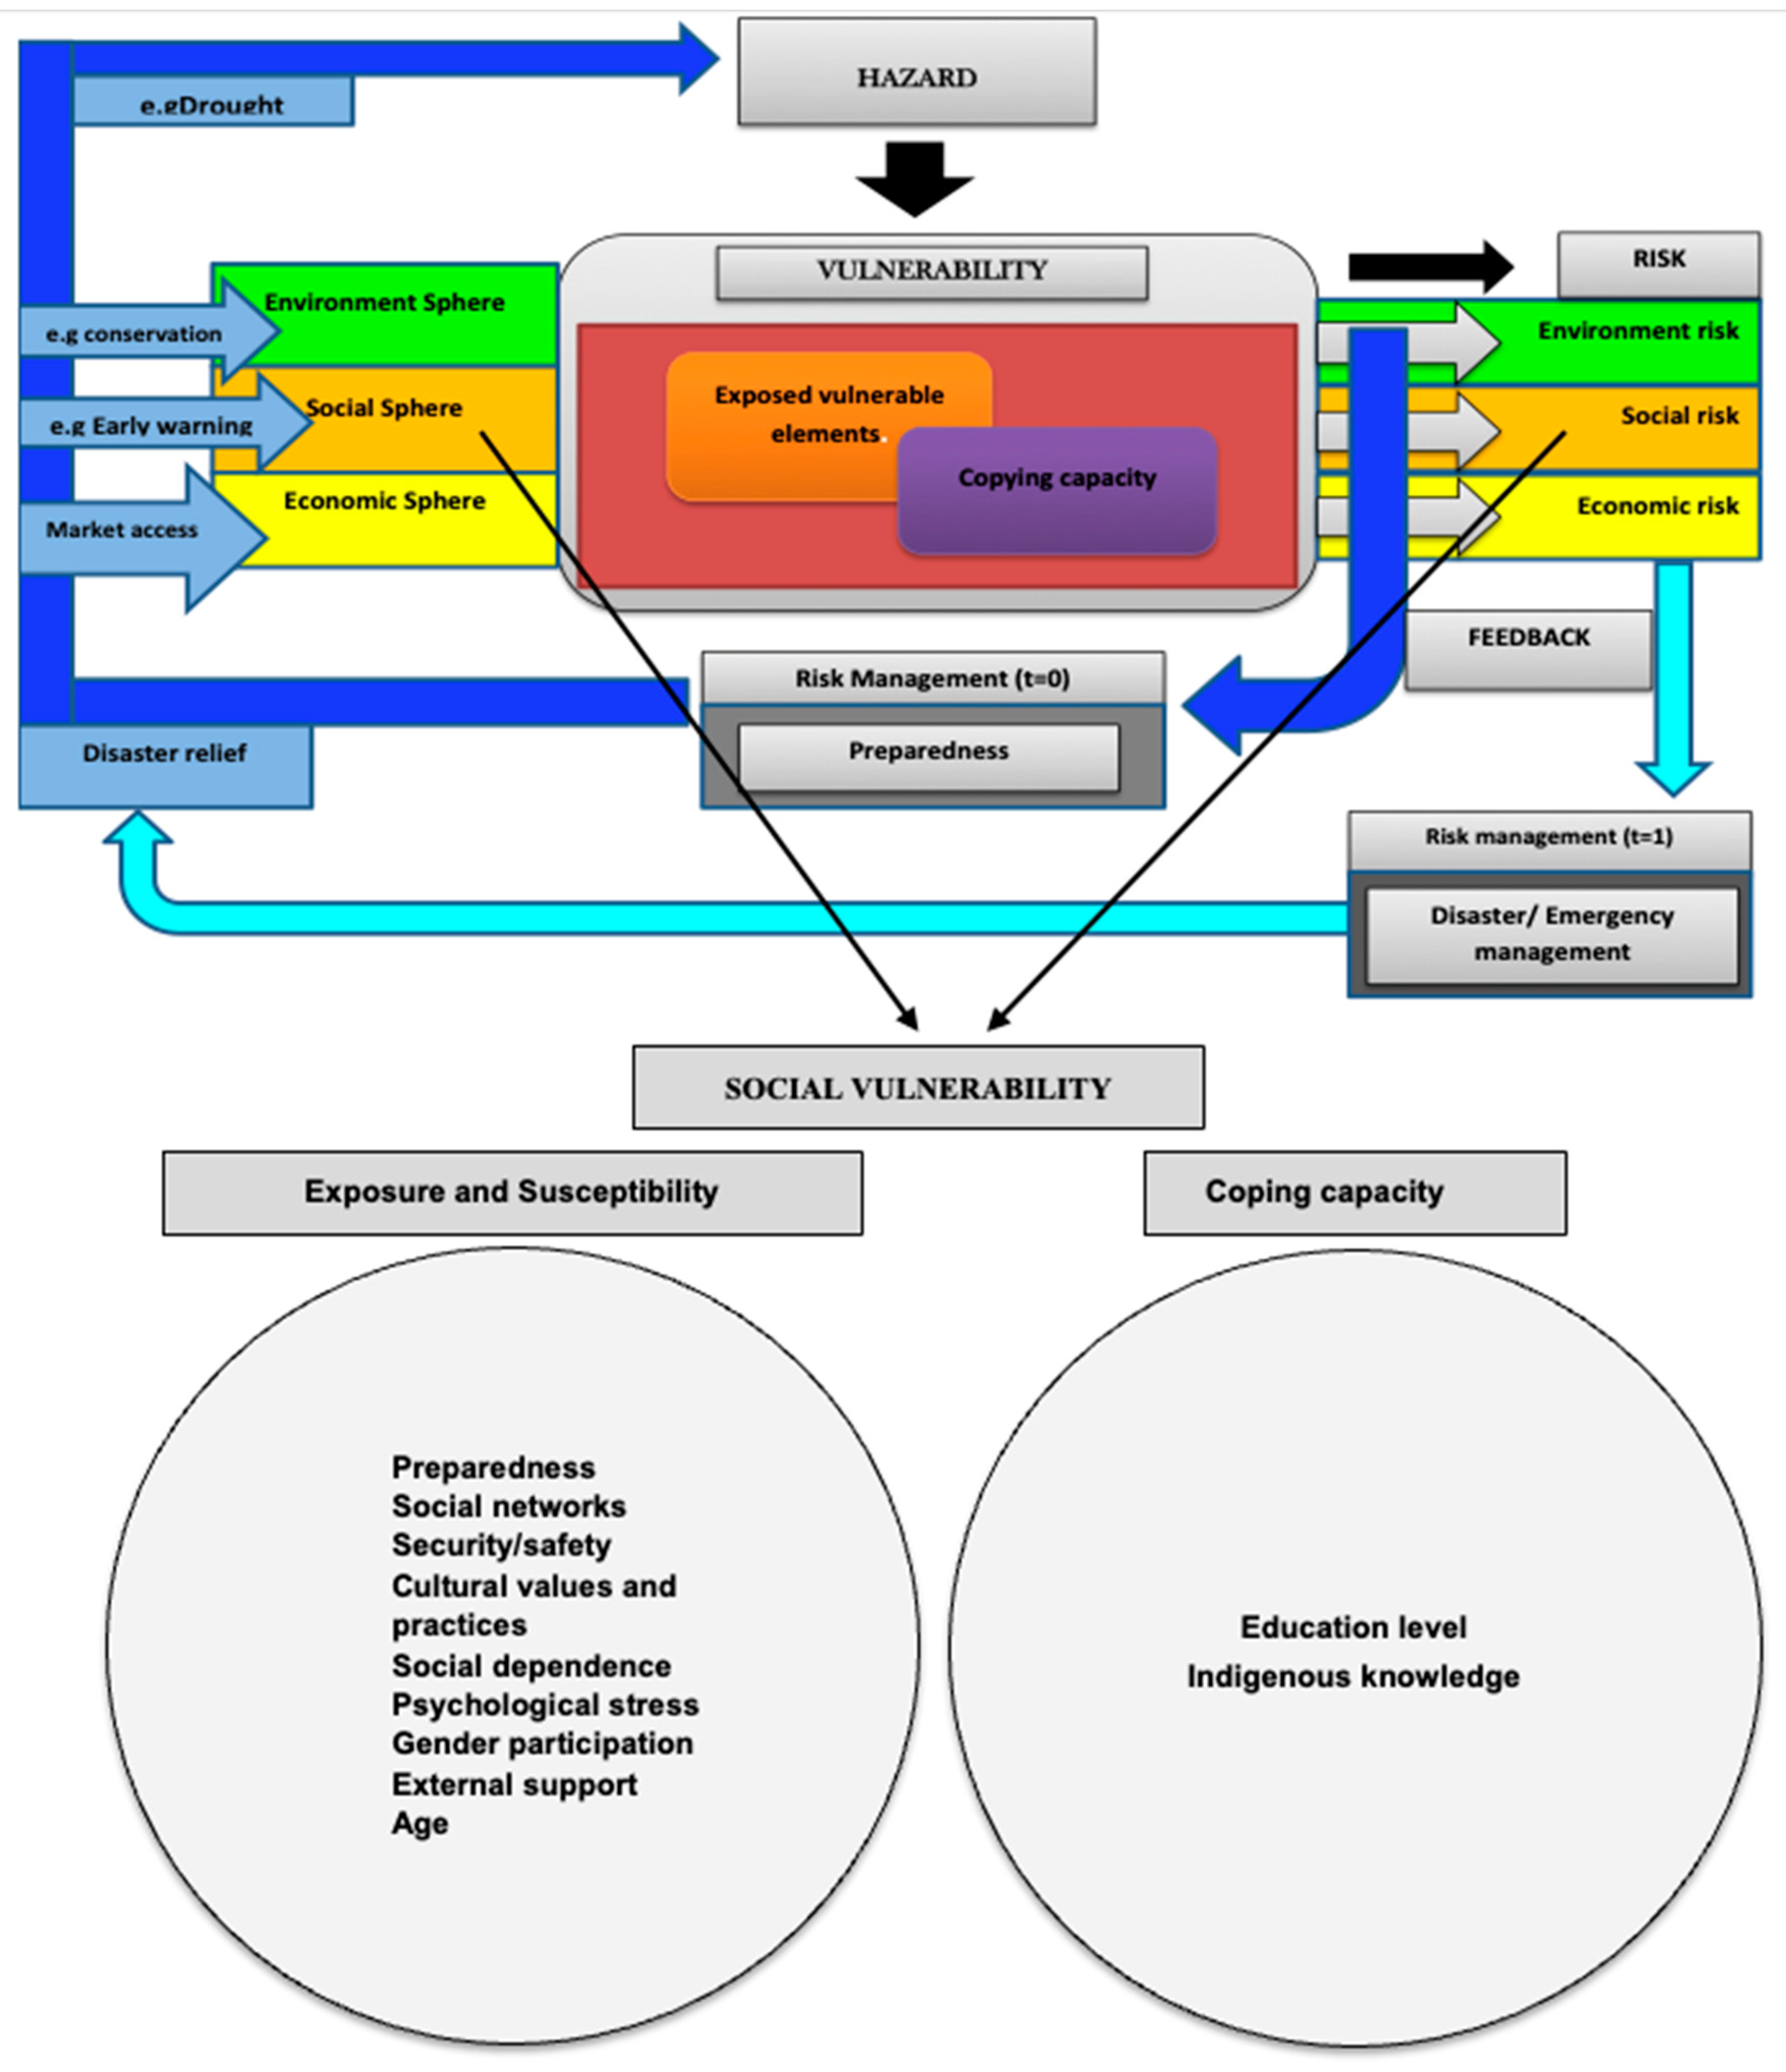
2.3. Conceptual/Analytical Frame Work

The study used a conceptual framework developed by the authors, as shown in Figure 2. A blended philosophical approach was adopted in this study to inform the conceptual framework and unravel the concepts of vulnerability and resilience. The Social Vulnerability Index (SVI) and the Agricultural Drought Resilience Index (ADRI) are two essential concepts for examining the relationship between smallholder livestock farming households’ social vulnerability and their resilience to agricultural drought [2,32]. While vulnerability speaks to the conditions that make smallholder livestock farmers susceptible to harm, resiliency refers to coping with and recovering from the agricultural drought that has already occurred. Like its sister concept of vulnerability, resiliency is used across various fields [8]. This paper empirically evaluates the correlation between smallholder livestock farmers’ agricultural resilience and social vulnerability measured through the Agricultural Drought Resilience Index (ADRI) and the Social Vulnerability Index (SVI), respectively. The study examined a low level of resilience measured when ADRI is less than zero (ADRI < 0) and a high level of social vulnerability measured by SVI. The concept of social vulnerability was operationalized with variables of indigenous knowledge, strategies for preparedness, external support, social networks, security or safety, cultural practices, education level, social dependence, psychological stress, gender participation, and age, while the concept of agricultural drought resilience was operationalized with variables of production of livestock in a drought year, production of livestock in a normal year, the period (number of months) in which the household consumed food produced by the household in a drought year, and the period (number of months) in which the household consumed food produced by the household in a normal year. Then, this study focused on negative ADRI (<0) related to social vulnerability. These relationships are shown in the conceptual framework (Figure 2).

2.4. Study Design

Smallholder livestock farmers from the area; the Department of Agriculture, Land Reform, and Rural Development; and the African Farmers Association of South Africa (AFASA) were all included as participants in meetings held as part of the standard study protocol. Participation in the study was voluntary, and all participants were explained the study’s purpose at the meeting. Through a structured questionnaire, information on participants’ sociocultural characteristics, demographics, etc., was collected during face-to-face interviews held between October and December 2020. Ethical approval was granted by Free State University.

2.5. Social Vulnerability Index

The BBC framework (Figure 3) was used to identify variables. The term “BBC framework” is derived from the work of Bogardi and Birkmann [6] and Cardona [33,34]. Figure 3 also depicts the various social factors that have been identified as contributing to agricultural drought-related social vulnerability. Elements of coping capacity, vulnerability, exposure, and susceptibility interact in the vulnerability segment of the BBC model [35]. Fekete [36] makes the point that no community is entirely secure. Education levels and indigenous knowledge were classified as coping capacities, which contributed to the resilience of agricultural drought-affected communities.
The Social Vulnerability Index (SVI) was used in this study to identify factors influencing smallholder livestock farmers’ social vulnerability to agricultural drought in South Africa’s Northern Cape Province. A variety of factors influence social vulnerability to agricultural drought. Three methods were used to make the indicator selection as comprehensive as possible. The first method involved discussions and questioning experts such as smallholder livestock farmers, agricultural extension officers, municipal managers, and employees from the disaster risk department and the Department of Agriculture, Land Reform, and Rural Development in determining what factors contribute to social vulnerability. The second approach involved gathering indicators from previously published literature [37,38,39,40]. Third, the contextual vulnerability framework (Figure 3) was used to identify variables and interpret results. Eleven indicators (Table 2) were identified for this study using a survey and data from Statistics South Africa to assess the level of social vulnerability to agricultural droughts. A Likert scale was used to quantify vulnerability, categorizing indicators according to their severity: very low vulnerability (0–1.0), low vulnerability (1.1–2.0), moderate vulnerability (2.1–3.0), high vulnerability (3.1–4.0), and very high vulnerability (4.1–5.0).
A growing concern exists that social grants will discourage unemployed people from searching for and finding employment opportunities, creating a “culture of dependency and entitlement” [41]. Individuals who receive grants may also face negative social consequences. One common criticism is that grants boost dependency on the government in South Africa [42]. The dependency ratio was obtained by adding the percentages of children (under 15 years of age) and the elderly (aged 65+), dividing that percentage by the working-age population (aged 15–64 years), and multiplying that percentage by 100 to obtain the number of “dependents” per 100 people.
Each indicator or variable was given equal weight when calculating the Social Vulnerability Index (SVI). Individual factors contributing to social vulnerability at the farm household level have no theoretical justification or standard procedures for allocating distinctive weights [38,43,44]. This is due to the various activities involved and the number of role-players involved. In order to obtain the average SVI for the Northern Cape Province of South Africa, the study added all the indices together and divided the total number of indices. The following equation was used to calculate SVI:
V o S V I = i = 1 11 w i s v i v o i s v i
V 0 S V I = f ( w 1 s v i v o 1 s v i , w 2 s v i v o 2 s v i , w 3 s v i v o 3 s v i ,     w 11 s v i v o 11 s v i
where Vo = indicators, w = weight, v o 1 s v i = age, v o 2 s v i = gender participation, v o 3 s v i = psychological stress, v o 4 s v i = social dependence, v o 5 s v i = level of education, v o 6 s v i = cultural practices and values, v o 7 s v i = safety/security, v o 8 s v i = social networks, v o 9 s v i = external support, v o 10 s v i = preparedness strategies, v o 11 s v i = indigenous knowledge, and  w 1 11 s v i = uniform weights applied to each indicator or variable.

2.6. Resilience Index for Agricultural Drought (ADRI)

Using principal component analysis (PCA), the ADRI was computed by totaling livestock production during normal years (WnPrn), livestock production during agricultural drought (WdPrd), the number of months in which a household consumes food produced by the household in a normal year (WcnMon), and the number of months in which a household consumes food produced by the household during an agricultural drought (WcdMod) (Table 3). According to Boukary et al. [45], PCA is concerned with reducing the dimensionality of a large number of inter-correlated variables in a dataset while preserving variance as much as possible. This is typically accomplished by transitioning to a new set of variables, which are the main uncorrelated components required to maintain the variety of original variables. ADRI is calculated using Equation (7):
ADRI = WtnPrn + WtdPrd + WtcnMon + WtcdMod
Using SPSS Version 23 software, Bartlett’s test of sphericity and the Kaiser–Meyer–Olkin (KMO) test were used to analyze the data. Four variables were examined: livestock production in a normal year (Prn), livestock production during an agricultural drought (Prd), the number of months in which a household consumes food produced by the household during a drought year (Mod), and the number of months in which a household consumes food produced by the household in a normal year (Mon).
As shown in Table 3, there was a high correlation among variables because they were measuring the same construct. There was no doubt that the commonalities and the initial commonalities were all greater than 0.30, a positive sign. Based on the eigenvalue analysis, one factor was extracted. Regarding the total variance explained, 94.402% of the components account for it. According to Bartlett’s sphericity test, the null hypothesis that the inter-correlation matrix is an identity matrix is true.
On the other hand, as the inter-correlation matrix was not derived from a population, the variable reduction is rejected. In terms of KMO statistics, the model had a KMO value of 0.636, while the Bartlett test of sphericity showed a significant result (p = 0.000, chi-square = 2224.837). The ADRI can be written as follows (Equation (8)):
ADRI = 0.979 × Prd + 0.967 × Prn + 0.977 × Mod + 0.963 × Mon
where:
ADRI: Agricultural Drought Resilience Index;
Prd: production of livestock in a drought year;
Prn: production of livestock in a normal year;
Mod: the period (number of months) in which the household consumed food produced by the household in a drought year;
Mon: the period (number of months) in which the household consumed food produced by the household in a normal year;
Numerical value: weights derived using PCA (component factors).

2.7. Pearson Correlation Coefficient

Household resilience to agricultural drought and its relationship with social vulnerability was assessed using the Pearson correlation coefficient. A Pearson correlation coefficient (r) shows the direction and degree of correlation between two variables [46,47]. A larger absolute value demonstrates the greater association between social vulnerability and household resilience to agricultural drought. A Pearson correlation coefficient was calculated using Equation (9):
i = 1 n ( S V I i S V I ¯ ) ( A D R L i A D R I ¯ ) i = 1 n ( S V I i S V I ¯ ) 2 i = 1 n ( A D R L i A D R I ¯ ) 2
where n is the number of variables, and i is the number of observations during the study period. SVIi and ADRIi are the values of social vulnerability and agricultural drought resilience, respectively. r is the coefficient of correlation, and S V I ¯ and A D R I ¯ are the means during the study periods.

3. Results

3.1. Social Vulnerability Index

In Table 4, the Social Vulnerability Index to agricultural drought is presented. The results of a social vulnerability assessment of smallholder livestock producers to agricultural drought in South Africa’s Northern Cape Province reveal a high vulnerability score of 3.55 (Table 4). Two indicators (cultural practices and security) contributed more strongly to social vulnerability to agricultural drought in South Africa’s Northern Cape Province. These two variables all received a score of 5 on the vulnerability scale, indicating a very high level of vulnerability and less resilience. Findings from the social vulnerability assessment in Northern Cape Province revealed that 82% of the respondents indicated that cultural practices influence vulnerability. Most livestock farmers (≥85%) indicated that livestock theft and farm attacks were major challenges.
Four variables (age, gender participation, psychological stress, and external support) play a significant role in the social vulnerability of smallholder livestock producers to agricultural drought in South Africa’s Northern Cape province, with a score of 4 (high vulnerability) (Table 3). Findings from the social vulnerability assessment in Northern Cape Province revealed that 40% of respondents indicated that their age is above or equal to 60 years.
Furthermore, the results show that most of the respondents were not satisfied with the role that the government plays in agricultural drought risk mitigation, which agricultural extension officers confirmed. Only 16% of respondents indicated that the government is adequately involved in drought risk reduction. According to the social vulnerability assessment results, external support scored 4, significantly contributing to social vulnerability.
A high level of vulnerability is exacerbated by psychological stress. According to 62% of respondents, stress affects vulnerability. Three variables earned a score of 3: social dependence, education level, and social networks (moderate vulnerability). Thirty percent of respondents believe that participating in social networks helps reduce the risk of agricultural drought. Moreover, 33% indicated that they depend on social grants, and 59% indicated that they have high school and above qualifications. Two variables (preparedness strategies and indigenous knowledge) earned a score of 2 (low vulnerability).

3.2. Agricultural Drought Resilience Index (ADRI)

The ADRI of the study area was calculated using Equations (6) and (7). An ADRI value greater than zero represents agricultural-drought-resilient households. In contrast, an ADRI value less than zero represents households that are not resilient (vulnerable) when faced with agricultural drought. According to the ADRI values, 79% (172) of livestock-farming households were not resilient to agricultural drought, while the remaining 21% (45) were resilient. This study focused on negative ADRI (<0) related to social vulnerability (Table 5). This result implies that due to a lack of resilience to agricultural drought, a high degree of social vulnerability was experienced by 79% of livestock-farming households, and only 21% of these households were resilient to agricultural drought. Drought conditions occur frequently in the Northern Cape Province, and a delay in or lack of rainfall can negatively impact smallholder livestock farmers, resulting in social vulnerability.

3.3. The Relationship between Household Resilience and Social Vulnerability (Pearson’s Correlation Coefficient)

The study related the SVI to the negative ADRI to establish whether decreased resilience is associated with increased vulnerability. The idea that the SVI is related to the ADRI of smallholder livestock farmers is supported by the results of this study. The SVI had a mean of 3.55 and a standard deviation of 1.04 (Table 6). Further, the result indicates that more vulnerability implies less resilience and vice versa. The negative ADRI score had a mean of −7.00 and a standard deviation of 6.88. Pearson’s correlation coefficient was −0.4 with T-statistics of 0.61 and a p-value of 0.03, indicating that ADRI and SVI have a negative correlation at a 5% significance level (Table 5). The practical implications are that policy makers, authorities, and emergency planners should prioritize and identify the target resources needed in FBDM to enhance the resilience to agricultural drought and reduce social vulnerability.

4. Discussion

4.1. Social Vulnerability

Age, psychological stress, gender, level of education, social dependence, safety, culture, security, external support, preparedness, and indigenous knowledge affect social vulnerability. This implies that a significant disparity in agricultural drought risk mitigation decision making will significantly impact social vulnerability. As a result, female participation in decision making and farming was adversely affected and more limited. A score of 5 indicates high vulnerability for cultural values and practices linked to this indicator. In the face of imminent agricultural droughts, women traditionally cannot make decisions about cattle reductions. Cultural values and traditions also contribute to men’s pride when they own larger numbers of livestock. They will be reluctant to reduce their livestock numbers in the face of drought. A study on communal farmers in the Eastern Cape Province of South Africa by Muyambo et al. [37] revealed a disparity in gender participation in decision making. Researchers have found vulnerability to be highly gendered [48,49,50,51]. Moreover, the results of this study revealed that 72% of respondents attributed gender participation to agricultural decision making.
External support scored 4 in this study for the social vulnerability assessment, significantly contributing to social vulnerability. Only a few respondents specified that the government was involved in reducing drought risk. Studies conducted by Ngaka [52] and Bahta [53] also indicate a low level of government willingness and interest to be involved in agricultural drought actions, including reducing agricultural drought risk. This implies that smallholder livestock farmers are susceptible to agricultural drought and social vulnerability. In contrast, Ortega-Gaucin et al. [54] reported that the government introduced a policy intervention focused on risk management and drought prevention and mitigation measures to reduce the impact of drought in Mexico.
It is well known that psychological stress significantly impacts social vulnerability to agricultural droughts, and this study established that psychological stress plays a significant role. Other studies have found stress to be the United States’ number one killer, backed up by this study [55]. The effects of the worst agricultural drought in the country led a commercial cattle farmer, 34 years of age, to commit suicide on 29 December 2015 in the Eastern Cape Province of South Africa [56]. Moreover, there was an increase in suicides in the Northern Cape in 2016 among farmers over the age of 55 [57]. The findings imply that the government and other stakeholders need to work together to assist farmers and avoid unnecessary loss of life.
Moderate vulnerability is indicated by education level, social networks, and social dependence (Table 4). Gardiner [58] found that one more year of schooling increased wheat and rice farm output by 1.28%. Climate change risks can be perceived and understood by literate people so that they can take action. According to the findings, farmer resilience to agricultural drought was attributed to indigenous knowledge. No community is completely unaffected, as Folke asserted [7]. Indigenous knowledge can be beneficial to a rural community. Communities with indigenous knowledge of agriculture will be able to deal with agricultural droughts more easily. This is echoed by UNEP [59]; most African local or indigenous populations still rely on indigenous knowledge. Elderly people use traditional wisdom to mitigate disaster effects. According to Muyambo et al. [60], most respondents (64.4%) used indigenous knowledge in their farming practices. This implies that education, either formal or informal (indigenous knowledge), has an impact on agricultural drought resilience and social vulnerability. It equips farmers with the necessary information to reduce the effects of agricultural drought to a certain extent.
The social network has a moderate vulnerability score of 3. In contrast, Muyambo et al. [37] found that farmers were incredibly susceptible to the impacts of agricultural drought because they lacked drought preparedness strategies and social support, significantly reducing their ability to cope. This study’s findings concur with Kuhlicke et al. [61], who found that reducing social vulnerability requires community networks and preparedness techniques. This implies the significance of social networks to support smallholder livestock farmers when drought occurs, such as by sharing access to some resources.
Indigenous knowledge and preparedness strategies, which scored 2 (low vulnerability), positively impacted agricultural drought resilience. The Northern Cape Province social vulnerability assessment showed that 51% of participants were prepared for a drought, and 69% practiced indigenous farming methods. Muyambo et al. [60] found in their study of communal farmers that indigenous knowledge enhances resilience to the impact of agricultural droughts, contrary to these findings. Moreover, they discovered that strategies of preparedness had very high vulnerability (score 5), in contrast to this study (low vulnerability, score 2), which means Eastern Cape communal producers were not prepared as well for droughts as smallholder livestock producers in the Northern Cape.
In summary, all 11 social vulnerability indicators—old age, gender stereotypes, psychological stress, social dependence, dependence on culture, lack of security and safety, lack of support, lack of preparedness, and inappropriate usage of indigenous knowledge—affect social vulnerability of smallholder livestock farmers, this implies that not enhancing smallholder livestock farmers resilience to agricultural drought and vice versa. This study’s findings align with Maltou and Bahta [62] and Nunes [63], who found that households were more resilient to agricultural droughts when they received government assistance and access to assets and resources.

4.2. Agricultural Drought Resilience

In the Frances Baard District Municipality, the resilience index for an average household was −7.00, which indicates that average households cannot withstand agricultural drought. Additionally, the findings confirmed that only 21% (45) of farming households participating in smallholder livestock farming were able to withstand agricultural drought. In other words, 79% (172) of smallholder livestock farmers cannot withstand agricultural drought, which implies that the government should provide them with funds, fodder, and other farm inputs during the dry season. This study’s findings agree with the results from Bahta [64], who found that the social vulnerability of South African livestock farmers would be minimized by improving smallholder farmer resilience to drought. As part of the constituents of community resilience, Maltou and Bahta [62] emphasized that smallholder livestock farmers need assistance in effective communication and resource exchange amongst community members. Moreover, Nunes [63] found that vulnerability reduces access to and availability of human, financial, physical, place-based, and social assets. As a result, the resilience of farmers would decline.

4.3. The Relationship between Social Vulnerability and Household Resilience

Smallholder livestock farmers are likelier to experience losses and lack the resources to recoil efficiently, as the study finds that vulnerability and resilience are correlated. This is not surprising since less than 21% of the survey sample reported having sufficient resources to protect against agricultural droughts and capital that can be implemented in reaction to risks. In comparison, livestock farmers who are poor in resources (79%) are expected to lack safety nets when preparing for and responding to agricultural drought, are more vulnerable, and are less resilient. This reflects disproportionate trends in social capital and resource dispersal. The findings have practical implications and policy makers, emergency planners, and authorities should prioritize and identify the target resources needed in the area of study to enhance resilience to agricultural drought and reduce social vulnerability through different policy intervention programs. Derakhshan et al. [65] found that the Social Vulnerability Index (SVI) is negatively associated with Baseline Resilience Indicators for Communities (BRIC). Bergstrand et al. [1] also found that a higher level of vulnerability was correlated with a lower level of resilience in counties across the United States, suggesting that the least resilient countries are also the most vulnerable. This study used primary data collected through face-to-face interviews; however, the COVID-19 pandemic caused some data collection delays, and the language barrier was also a limitation. The most widely spoken languages in the Northern Cape Province are Afrikaans and Setswana (local South African languages), making communication between the researchers and the respondents difficult. The Social Vulnerability Index was calculated using only 11 variables, and the study also focused only on smallholder livestock farmers, which is also a limitation.

5. Conclusions

This article assesses the relationship between the resilience of smallholder livestock farming households and social vulnerability to agricultural droughts. The study revealed a correlation between high vulnerability and less resilience to agricultural drought in smallholder livestock farming households. This implies that smallholder livestock farmers are susceptible to agricultural drought, and that disparities in agricultural drought risk mitigation decision making significantly impact social vulnerability. This study can be used by policy makers, different stakeholders, authorities, disaster planners, and others as input/guidance to identify high-risk district and local municipalities as well as socially vulnerable smallholder livestock farmers in disaster response and preparation. Further, this work can be used to assist farmers by implementing policy interventions to prepare households and reduce harm prior to the recurrent agricultural drought that has been happening in South Africa in particular and Sub-Saharan Africa in general, as well as to provide direct assistance and resources to the highly vulnerable smallholder livestock farmers to enhance their resilience and reduce social vulnerability to agricultural drought.
Examining household resilience to agricultural droughts and social vulnerability can be seen as a tool to identify district municipalities at risk. This information can assist emergency planners in allocating resources and directing intervention programs to the areas most likely to require them during disasters such as agricultural drought. By fostering smallholder livestock farmers’ perseverance and adaptation, the government and major participants in the agricultural sector should focus on disadvantaged smallholder farmers in order to increase their resilience. Some of the help might come in the form of providing fodder, improving access to resources, and boosting smallholder farmers’ participation in drought-resilient agricultural practices by providing training and information.
The authors recommend that future research in developing countries concentrate on economic and environmental vulnerability in relation to agricultural drought resilience for smallholder and commercial livestock and crop farmers, as this was beyond the scope of this study.

Author Contributions

Both authors significantly contributed to the present manuscript’s preparation. Y.T.B. was involved in the analysis and writing the first draft. Y.T.B. was the project leader and administrator. W.A.L. aided in the review, and in the writing of the final draft. All authors have read and agreed to the published version of the manuscript.

Funding

National Research Foundation (NRF) of South Africa funded this research, grant number TTK170510230380.

Institutional Review Board Statement

The study obtained an ethical clearance certificate from the University of the Free State General/Human Research Ethics Committee (GHREC), and the reference number is UFSHSD2020/0359/2704.

Informed Consent Statement

Informed consent was obtained from all subjects involved in the study.

Data Availability Statement

The datasets used and analyzed during the current study are available from the corresponding author (Y.T.B.) upon reasonable request.

Acknowledgments

We acknowledge and thank the National Research Foundation (NRF), Thuthuka funding instrument, for funding the project “Household resilience to agricultural drought in the Northern Cape province of South Africa” (contract number/project number TTK170510230380).

Conflicts of Interest

The authors declare that they have no competing interests.

References

  1. Bergstrand, K.; Mayer, B.; Brumback, B.; Zhang, Y. Assessing the Relationship between Social Vulnerability and Community Resilience to Hazards. Soc. Indic. Res. 2015, 122, 391–409. [Google Scholar] [CrossRef] [PubMed]
  2. Bahta, Y.T.; Myeki, V.A. Adaption, coping strategies and resilience of agricultural drought in South Africa: Implication for the sustainability of livestock sector. Heliyon 2021, 7, E089280. [Google Scholar] [CrossRef] [PubMed]
  3. Proag, V. The concept of vulnerability and resilience. Proc. Econ. Financ. 2014, 18, 369–376. [Google Scholar] [CrossRef]
  4. De Ruiter, M.C.; van Loon, A.F. The challenges of dynamic vulnerability and how to assess it. iScience 2022, 25, 104720. [Google Scholar] [CrossRef] [PubMed]
  5. Dunning, C.M.; Durden, S. Social vulnerability analysis: A comparison of tools. In IWR White Paper; U.S. Army Corps of Engineers; Institute for Water Resources: Alexandria, VA, USA, 2013. [Google Scholar]
  6. Bogardi, J.; Birkmann, J. Vulnerability assessment: The first step towards sustainable risk reduction. In Disasters and Society–from Hazard Assessment to Risk Reduction; Malzahn, D., Plapp, T., Eds.; Logos Verlag: Berlin, Germany, 2004; pp. 75–82. [Google Scholar]
  7. Folke, C. Resilience: The emergence of a perspective for social-ecological systems analyses. Glob. Environ. Change 2006, 16, 253–267. [Google Scholar] [CrossRef]
  8. Norris, F.H.; Stevens, S.P.; Pfefferbaum, B.; Wyche, K.F.; Pfefferbaum, R.L. Community resilience as a metaphor, theory, set of capacities, and strategy for disaster readiness. Am. J. Commun. Psychol. 2008, 41, 127–150. [Google Scholar] [CrossRef]
  9. Den Hartigh, R.J.R.; Hill, Y. Conceptualizing and measuring psychological resilience: What can we learn from physics? New Ideas Psychol. 2022, 66, 100934. [Google Scholar] [CrossRef]
  10. Colburn, L.; Seara, T. Resilience, vulnerability, adaptive capacity, and social capital. In Proceedings of the 2nd National Social Indicators Workshop, East West Highway, North America, 27–29 September 2011. [Google Scholar]
  11. Folke, C. Opinion/Why Resilience? Resilience Frontiers for Global Sustainability; Stockholm Resilience Centre: Stockholm, Sweden, 2017. [Google Scholar]
  12. Reyers, B.; Moore, M.-L.; Opinion/We All Want to Be Resilient. Or Do We? 2017. Available online: https://rethink.earth/we-all-want-to-be-resilient-or-do-we/ (accessed on 20 May 2022).
  13. Sherrieb, K.; Norris, F.H.; Galea, S. Measuring capacities for community resilience. Soc. Indic. Res. 2010, 99, 227–247. [Google Scholar] [CrossRef]
  14. Ewett, R.L.; Mah, S.M.; Howell, N.; Larsen, M.M. Social Cohesion and Community Resilience during COVID-19 and Pandemics: A Rapid Scoping Review to Inform the United Nations Research Roadmap for COVID-19 Recovery. Int. J. Health Serv. 2021, 51, 325–336. [Google Scholar]
  15. Cutter, S.L.; Barnes, L.; Berry, M.; Burton, C.; Evans, E.; Tate, E.; Webb, J. A place-based model for understanding community resilience to natural disasters. Glob. Environ. Change 2008, 18, 598–606. [Google Scholar] [CrossRef]
  16. Carmen, E.; Fazey, I.; Ross, H.; Bedinger, M.; Smith, F.M.; Prager, K.; McClymont, K.; Morrison, D. Building community resilience in a context of climate change: The role of social capital. Ambio 2022, 51, 1371–1387. [Google Scholar] [CrossRef] [PubMed]
  17. Orimoloye, I.R. Agricultural Drought and Its Potential Impacts: Enabling Decision-Support for Food Security in Vulnerable Regions. Front. Sustain. Food Syst. 2022, 6, 838824. [Google Scholar] [CrossRef]
  18. Fahad, S.; Bajwa, A.A.; Nazir, U.; Anjum, S.A.; Farooq, A.; Zohaib, A.; Sadia, S.; Nasim, W.; Adkins, S.; Saud, S. Crop Production under Drought and Heat Stress: Plant Responses and Management Options. Front. Plant Sci. 2017, 8, 1147. [Google Scholar] [CrossRef] [PubMed]
  19. Wang, Z.; Ma, Q.; Wang, J.; Chen, S.; Fan, Y.; Deng, L. Empirical study on agricultural drought adaptation of typical rainfed areas in Shidian County, China. Int. J. Disaster Risk Reduct. 2018, 28, 394–403. [Google Scholar] [CrossRef]
  20. Mangukiya, R.D.; Sklarew, D.M. Analyzing three pillars of sustainable development goals at sub-national scales within the USA. World. Dev. Sustain. 2023, 2, 100058. [Google Scholar] [CrossRef]
  21. Duru, M.; Therond, O. Livestock system sustainability and resilience in intensive production zones: Which form of ecological modernization? Reg. Environ. Change 2015, 15, 1651–1665. [Google Scholar] [CrossRef]
  22. Von Maltitz, L.; Bahta, Y.T. Empowerment of smallholder female livestock farmers and its potential impacts to the resilience to agricultural drought. AIMS-Agric. Food. 2021, 6, 603–630. [Google Scholar] [CrossRef]
  23. Statistics South Africa. Community Survey 2016: Provincial Profile Northern Cape, Report No. 03-01-14; Statistics South Africa: Pretoria, South Africa, 2016.
  24. DAFF (Department of Agriculture, Forestry and Fisheries). Drought Status in the Agriculture Sector; Portfolio Committee on Water and Sanitation: Pretoria, South Africa, 2018.
  25. FBDM (Frances Baard District Municipality). Frances Baard District Municipality. 2018. Available online: http://francesbaard.gov.za/our-regions (accessed on 19 July 2022).
  26. DAFF (Department of Agriculture, Forestry, and Fisheries). Abstract of Agricultural Statistics; DAFF: Pretoria, South Africa, 2018.
  27. Pienaar, L.; Traub, L.N. Understanding the smallholder farmer in South Africa: Towards a sustainable livelihoods classification. Agriculture in an Interconnected World. In Proceedings of the International Conference of Agricultural Economics, Milan, Italy, 9–14 August 2015. [Google Scholar]
  28. FBDM (Frances Baard District Municipality). Map of the Four Local Municipalities of the Frances Baard Municipal District in the Northern Cape. 2019. Available online: https://municipalities.co.za/map/134/frances-baard-district-municipality, (accessed on 22 July 2022).
  29. Northern Cape Department of Agriculture, Forestry, and Fisheries (NDAFF). Beneficiaries of an Agricultural Drought Relief Program; NDAFF: Kimberly, South Africa, 2020. [Google Scholar]
  30. Cochran, W.G. Sampling Techniques, 3rd ed.; John Wiley and Sons: New York, NY, USA, 1997. [Google Scholar]
  31. Bartlett, J.E.; Kotrlik, J.W. Higgins, C.C. Organizational research: Determining appropriate sample size in survey research. Inf. Technol. Learn. Perform. J. 2001, 19, 43–50. [Google Scholar]
  32. Bahta, Y.T. Nexus between coping strategies and household’s agricultural drought resilience to food insecurity in South Africa. Land 2022, 11, 893. [Google Scholar] [CrossRef]
  33. Cardona, O.D. Environmental management and disaster prevention: Two related topics: A holistic risk assessment and management approach’. In Atural Disaster Management; Ingleton, J.N., Ed.; Tudor Rose: London, UK, 1999. [Google Scholar]
  34. Cardona, O.D. Estimación Holística del Riesgo Sísmico Utilizando Sistemas Dinámicos Comple; Technical University of Catalonia: Barcelona, Spain, 2001. [Google Scholar]
  35. Birkmann, J. Measuring vulnerability to promote disaster-resilient societies: Conceptual frameworks and definitions. In Measuring Vulnerability to Natural Hazards: Towards Disaster Resilient Societies; Birkmann, J., Ed.; United University Press: New York, NY, USA, 2006; pp. 9–54. [Google Scholar]
  36. Fekete, A. Assessment of Social Vulnerability for River-Floods in Germany. Ph.D. Thesis, University of Bonn, Bonn, Germany, 2010. [Google Scholar]
  37. Muyambo, F.; Jordaan, A.J.; Bahta, Y.T. Assessing social vulnerability to drought in South Africa: Policy implication for drought risk reduction. Disaster Risk Stud. 2017, 9, a326. [Google Scholar] [CrossRef]
  38. Cutter, S.L.; Emrich, C.T.; Webb, J.J.; Morath, D. Social Vulnerability to Climate Variability Hazards: A Review of the Literature; Final Report to Oxfam America; Routledge: Columbia, SC, USA, 2009; Volume 5, pp. 1–44. [Google Scholar]
  39. Shirley, W.L.; Boruff, B.J.; Cutter, S.L. Social Vulnerability to Environmental Hazards. Hazards Vulnerability and Environmental Justice; Routledge: Oxfordshire, UK, 2012; pp. 143–160. [Google Scholar]
  40. Katic, K. Social Vulnerability Assessment Tools for Climate Change and DRR Programming: A guide to practitioners, United Nations Development Programme, New York, United States. 2017. Available online: https://reliefweb.int/report/world/social-vulnerability-assessment-tools-climate-change-and-drr-programming-guide, (accessed on 22 October 2022).
  41. DSD (Department of Social Development). Strategic plan 2006/7-2009/10; Department of Social Development: Pretoria, South Africa, 2006; R.P. 22/2006.
  42. Devereux, S. Social protection in South Africa: Exceptional or exceptionalism? Can. J. Dev. Stud. 2011, 32, 414–425. [Google Scholar] [CrossRef]
  43. European Commission. A generic conceptual framework for vulnerability measurement. Seventh Framework Programme Cooperation Theme 6—Environment (including Climate Change) Collaborative Project. Methods for the Improvement of Vulnerability Assessment in Europe (MOVE), Brussels, Belgium. 2011. Available online: https://cordis.europa.eu/project/id/211590 (accessed on 8 July 2022).
  44. Yates, R.; Yates, R.; Chiwaka, E. Participatory Vulnerability Analysis, A Step by Step Guide for Field Staff, Action Aid International, UK. 2010. Available online: https://www.eldis.org/document/A32191 (accessed on 8 September 2022).
  45. Boukary, A.G.; Diaw, A.; Wünscher, T. Factors Affecting Rural Households’ Resilience to Food Insecurity in Niger. Sustainability 2016, 8, 181. [Google Scholar] [CrossRef]
  46. Qian, X.; Liang, L.; Shen, Q.; Sun, Q.; Zhang, L.; Liu, Z.; Zhao, S.; Qin, Z. (2016) Drought trends based on the VCI and its correlation with climate factors in the agricultural areas of China from 1982 to 2010. Environ. Monit. Assess. 2016, 188, 639. [Google Scholar] [CrossRef] [PubMed]
  47. Guo, W.; Ni, X.; Jing, D.; Li, S. Spatial-temporal patterns of vegetation dynamics and their relationships to climate variations in Qinghai Lake Basin using MODIS time-series data. J. Geogr. Sci. 2014, 24, 1009–1021. [Google Scholar] [CrossRef]
  48. Babugura, A.; Mtshali, N.; Mtshali, M. Gender and Climate Change: South Africa Case Study, Heinrich Böll Stiftung Southern Africa, Cape Town, South Africa. 2010. Available online: https://www.boell.de/sites/default/files/assets/boell.de/images/download_de/ecology/south_africa.pdf (accessed on 8 July 2022).
  49. Goh, A.H. A Literature Review of the Gender-Differentiated Impacts of Climate Change on Women’s and Men’s Assets and Well-Being in Developing Countries; CAPRi Working paper No. 106; International Food Policy Research Institute: Washington, DC, USA, 2012. [Google Scholar]
  50. Flato, M.; Kotsadam, A. Droughts and Gender Bias in Infant Mortality in Sub-Saharan Africa. Memorandum 2014. [Google Scholar]
  51. Xenarios, S.; Kakumanu, K.R.; Nagothu, U.S.; Kotapati, G.R. Gender differentiated impacts from weather extremes: Insight from rural communities in South India. Environ. Dev. 2017, 24, 156–169. [Google Scholar] [CrossRef]
  52. Ngaka, M.J. Drought preparedness, impact, and response: A case of the Eastern Cape and Free State provinces of South Africa. Disaster Risk Stud. 2012, 4, 1–10. [Google Scholar] [CrossRef]
  53. Bahta, Y.T. Smallholder livestock farmers coping and adaptation strategies to agricultural drought. AIMS-Agric. Food. 2020, 5, 964–982. [Google Scholar] [CrossRef]
  54. Ortega-Gaucin, D.; Ceballos-Tavares, J.A.; Ordoñez Sánchez, A.; Castellano-Bahena, H.V. Agricultural Drought Risk Assessment: A Spatial Analysis of Hazard, Exposure, and Vulnerability in Zacatecas, Mexico. Water 2021, 13, 1431. [Google Scholar] [CrossRef]
  55. Connor, T. Stress Is the Number One Killer Today! 2014. Available online: http://www.myarticlearchive.com/articles/6/214.htm (accessed on 22 March 2023).
  56. Chabalala, J. Drought: Farmers Commit Suicide a Day Before Rainfalls. 2016. Available online: http://www.news24.com/SouthAfrica/News/drought-farmer-commits-suicide-a-day-before-rain-falls-20160101 (accessed on 8 March 2023).
  57. Momentum. Farmer Suicides Soar as the Worst Drought in Decades Drives Them to Ruin. 2017. Available online: https://www.businesslive.co.za/rdm/news/2017-04-19-farmer-suicides-soar-as-worst-drought-in-decades-drives-them-to-ruin/ (accessed on 16 February 2023).
  58. Gardiner, M. Education in Rural Areas. Issues in Education Policy; Centre for Education Policy Development (CEPD): Braamfontein, Johannesburg, South Africa, 2008; Volume 4, pp. 1–33. [Google Scholar]
  59. UNEP (United Nations Environment Programme). Indigenous Knowledge in Disaster Management in Africa; UNEP: Nairobi, Kenya, 2008. [Google Scholar]
  60. Muyambo, F.; Bahta, Y.T.; Jordaan, A.J. The role of indigenous knowledge in drought risk reduction: A case of communal farmers in South Africa. J. Disaster Risk Stud. 2017, 9, a420. [Google Scholar] [CrossRef]
  61. Kuhlicke, C.; Steinführer, A.; Begg, C.; Bianchizza, C.; Bründl, M.; Buchecker, M.; Tarditti, D.M.; Hoppner, C.; Komac, B.; Lemkow, L.; et al. Perspectives on social capacity building for natural hazards: Outlining an emerging field of research and practice in Europe. Environ. Sci. Policy 2011, 14, 804–814. [Google Scholar] [CrossRef]
  62. Maltou, R.; Bahta, Y.T. Factors influencing resilience of smallholder livestock farmers to agricultural drought in South Africa: Implication for adaptive capabilities. J. Disaster Risk Stud. 2019, 11, a805. [Google Scholar] [CrossRef] [PubMed]
  63. Nunes, A.R. Exploring the interactions between vulnerability, resilience and adaptation to extreme temperatures. Nat. Hazards 2021, 109, 2261–2293. [Google Scholar] [CrossRef]
  64. Bahta, Y.T. Social vulnerability to agricultural drought: Insights from Northern Cape, South Africa. Sci. Afr. 2022, 17, e01324. [Google Scholar] [CrossRef]
  65. Derakhshan, S.; Emrich, C.T.; Cutter, S.L. Degree and direction of overlap between social vulnerability and community resilience measurements. PLoS ONE 2022, 17, e0275975. [Google Scholar] [CrossRef] [PubMed]
Figure 2. An analytical framework of the study. Source: Authors’ compilation.
Atmosphere 14 00900 g002
Figure 3. Vulnerability conceptual framework. Source: Bogardi and Birkmann [6] and Cardona [33,34], and authors’ compilation.
Atmosphere 14 00900 g003
Table 1. The number of smallholder livestock farmers who received support, and the sampling technique.
Local Municipality Number of Smallholder Farmers Share of Farmers (Number of Farmers/Total) %Number of Samples (Percentage * Total Sample Size (217))
Phokwane2663065
Sol Plaatje 1411635
Magareng 1201430
Dikgatlong 3514087
Total 878100217
Note: The asterisk (*) represents multiplication. Source: Northern Cape Department of Agriculture, Forestry, and Fisheries (NDAFF) [29].
Table 2. Identified indicators to assess the level of social vulnerability to agricultural drought.
IndicatorsMeasurement Vulnerability Association with Data Source Explanation
Indigenous knowledgeRating Higher Likert scale rating = more indigenous knowledge associated with vulnerabilityStudy Traditional and cultural beliefs
Preparedness strategiesPreparedness for agricultural drought Better prepared = less vulnerableStudyAccessibility of preparedness strategies and plans for agricultural drought
External supportLevel of agricultural drought mitigation and response Greater = less vulnerabilityStudy Government’s participation in response and mitigation against drought, as well as funding, information, training, and interest in agricultural drought
Social networks Extent Increased social network immersion = lower vulnerability Study Farmers’ organizations (e.g., African Farmers Association of Southern Africa; AFASA), churches, clubs, stokvels, and family networks
Safety or securityFarm attacks/Livestock theftIncreasing livestock theft and farm attacks = higher vulnerabilityStudy Adverse agricultural drought impacts are less likely to affect more secure farmers, who tend to invest in their businesses
Cultural practicesInfluence vulnerability Stronger cultural practices = greater vulnerability Study Status, wealth, and honor are linked to livestock (cattle).
Non-males are not permitted in a corral where a large number of goats for religious rituals have been slaughtered.
An individual is allowed to set the veld on fire after attending a sacred dance.
Social dependence Ratio of dependency Higher = more vulnerability Study/Statistics S.A.Social grants
Education levelEducation of formal nature Higher level of education = less vulnerableStudy A higher level of education should lead to better income opportunities
Psychological stress Stress influences vulnerability Higher stress = more vulnerableStudyThe well-being of smallholder livestock farmers
Gender participationDecision-making equality in activities at the farm levelLess decision making = more vulnerableStudyMale or female
Age >60 years of age Older = more vulnerableStudyValue
Source: Authors’ compilation.
Table 3. Principal component analysis of the Agricultural Drought Resilience Index (ADRI).
VariablesCommunalityComponent FactorsCorrelation: ADRI
First Extraction1
Prn10.9350.9670.894
Prd10.9580.9790.995
Mod10.9550.9770.984
Mon10.2800.9630.890
Total = 3.776. Chi-square = 2224.837; Bartlett’s test of sphericity is significant at p = 0.0000; the Kaiser–Meyer–Olkin (KMO) test of sampling adequacy = 0.636; cumulative (%) = 94.402 and eigenvalue variances (%) = 94.402.
Table 4. Estimation of Social Vulnerability Index score.
Social Indicator Findings from StudyIndex Vulnerability
Indigenous knowledge69% of participants applied knowledge of indigenous nature 2Low
Strategies of preparedness 51% actively prepare for drought conditions 2Low
External support Government was perceived to play a role in drought risk reduction by 16% of the sample 4High
Social networks 30% of participants believe that the risk from drought is reduced by being part of social networks3Moderate
Safety or securityFarm attacks and livestock theft were reported as major challenges by more than 85% of participants 5Very high
Level of education59% had secondary education or higher 3Moderate
Social dependence33% dependency ratio 3Moderate
Psychological stressAccording to 62% of the participants, vulnerability was affected by stress4High
Gender participation72% of participants felt that gender influences decision making in agriculture4High
Cultural practicesVulnerability is reportedly influenced by cultural practices according to 82% of the participants5Very high
Age 40% of participants were 60 years of age or older 4High
Total score
SVI (total score ÷ no. of variables): 39/11 = 3.55
39
High
STDV 1.04
Note: Rating calculated for SVI: (0 to 1.0) very low vulnerability, (1.1 to 2.0) low vulnerability, (2.1 to 3.0) moderate vulnerability, (3.1 to 4.0) high vulnerability, and (4.1 to 5.0) very high vulnerability. Source: Authors’ calculation.
Table 5. Calculated and summary statistics of the Agricultural Drought Resilience Index of the study area.
NMeanStand. Dev.MinMax
ADRI 2170.00−0.269.801.00
ADRI > 0 450.511.870.146.69
Negative ADRI < 0172−7.006.88−2.43−0.008
Source: Authors’ calculation.
Table 6. Summary statistics of Agricultural Drought Resilience and Social Vulnerability Indexes of the study area.
NMeanStand. Dev.MinMax
ADRI 2170.00−0.269.801.00
ADRI > 0 450.511.870.146.69
Negative ADRI < 0172−7.006.88−2.43−0.008
SVI2173.551.0425
Correlation coefficient (rs)−0.40
T-statics0.62
p-value 0.03
Source: Authors based on the survey.
Disclaimer/Publisher’s Note: The statements, opinions and data contained in all publications are solely those of the individual author(s) and contributor(s) and not of MDPI and/or the editor(s). MDPI and/or the editor(s) disclaim responsibility for any injury to people or property resulting from any ideas, methods, instructions or products referred to in the content.

