

The Effects of Drought in the Huaibei Plain of China Due to Climate Change
by
 , ,
, ,
Ousmane Badji
1,
Yonghua Zhu
1,*,
Haishen Lü
1,*,
Kanon Guédet Guédé
1,
Tingxing Chen
1,
Abdoulaye Oumarou
1,
Kouassi Bienvenue Mikael Onan Yao
1 and
Sika Brice
2 1
State Key Laboratory of Hydrology-Water Resources and Hydraulic Engineering, College of Hydrology and Water Resources, Hohai University, Nanjing 210098, China
2
College of Environment, Hohai University, Nanjing 210098, China
*
Authors to whom correspondence should be addressed.
Atmosphere 2023, 14(5), 860; https://doi.org/10.3390/atmos14050860
Submission received: 21 March 2023
/
Revised: 30 April 2023
/
Accepted: 5 May 2023
/
Published: 11 May 2023
(This article belongs to the Special Issue Climate Change and Climate Variability, and Their Impact on Extreme Events)
Abstract
:Damage from climate change is widespread throughout the world. This change has brought about calamities, the most prevalent of which is the emergence of numerous droughts which are increasingly threatening human lives. In this paper, we studied the spatial and temporal variations of drought under the effect of climate change in the Huaibei Plain, which is a very important agricultural zone in China. Drought has attracted increasing attention in research due to its heavy impact on agriculture, the environment, livelihood, and food security. The SPEI (Standardized Precipitation Evapotranspiration Index) has been used in this study to express and identify drought events in the Huaibei Plain due to climate change. A general circulation model (GCM), HadGEM2-AO, which was the most appropriate for the study area’s precipitation simulation, and three Representative Concentration Pathways (RCP), RCP 2.6, RCP 4.5, and RCP 8.5, were used to analyze and compare the drought effect for the baseline (1985–2017) and the future climate scenarios (2025–2090). At 3 and 6 months, the SPEI successfully detects agricultural drought in temporal and spatial variation. However, according to the analysis, more severe agricultural drought events are foreseen in the future than in the baseline because of climate change. SPEI performed better than SPI in detecting drought in the baseline and simulated data due to increased evapotranspiration. Between the SPEI-3 and SPEI-6, the Pearson coefficient correlation reveals a positive association. The Mann-Kendall test was used to cover the two studied periods in order to establish the drought trend. Both decreasing and increasing trends, in different timescales, were detected by Sen’s Slope in the baseline and future periods with all RCPs.
1. Introduction
Due to the growing global population in the twenty-first century, research on drought in the context of climate change is crucial. Drought is the major factor of observed famine due to the lack of water causing agriculture to fall into ruin. As one of China’s main agricultural regions, research into agricultural drought in the Huaibei Plain is crucial and urgent, particularly in light of climate change.
Droughts are typically considered high-risk worldwide [1]. According to [2], the main contributor to climate change is human activities, which are predicted to increase the severity and the frequency of droughts in the near future [3]. This century’s major global threat from droughts will cause significant agricultural, societal, and economic damage. The deficient availability of soil moisture, due to either reduced precipitation and/or increased evapotranspiration, is the main characteristic of drought [4]. Droughts manifest after a prolonged period of no rain, but it is not easy to pinpoint their start, extent, and end. In addition, it is also challenging to quantify their characteristics in terms of intensity, duration, spatial extent, and magnitude [5]. However, several efforts have been dedicated to developing drought monitoring and analysis [6]. Like many countries, during the second half of the 20th century, China experienced very frequent severe droughts [7]. China is one of the countries most seriously affected by drought. The total farmland area affected by drought in China is about 21.56 million ha, which is about 60% of the total amount affected by all types of meteorological drought [8]. Many indices are available for drought measuring and monitoring, but the PDSI (Palmer Drought Severity Index) [9], the SPI (Standardized Precipitation Index) [10], and the SPEI (Standardized Precipitation Evapotranspiration Index) [6,11] are the most used because they are the least complex.
PDSI requires temperature and precipitation as sources of information. However, compared to SPI, PDSI cannot assess drought characteristics on a multi-scale [12,13]. To solve this issue, ref. [10] built an SPI related to the nature of multi-scalar droughts. Although the WMO (World Meteorological Organization) has viewed the SPI as the principal reference drought index [5], it can only use precipitation data sets, which do not divulge a dry season condition due to climate variability [13,14], or consider the monthly climatic rainfall and adjusting the disparities between Potential Evapotranspiration (PET) and precipitation [13]. SPEI gives an improved supplementary drought record while addressing the shortcoming of SPI. In addition, SPEI includes PET, a crucial component of the hydrological cycle [15].
Index selection is, however, very important as it is area-specific and relies upon the availability of data input. It is also important to monitor or classify drought considering the timescale [16]. For example, 1 month, 3–6 months, and 9–12 months are usually considered meteorological, agricultural, and hydrological droughts, respectively; more than 12 months could be denoted as a socio-economic drought [17]. Meteorological drought is related to the degree of dryness compared to normal precipitation in a specific region and high spatial variability; agricultural drought depends more on various conditions such as precipitation scarcity, evapotranspiration, and agricultural impact; hydrological drought is related to rain and snow shortfall that impact subsurface and surface water supply which in turn affects agricultural drought [18]. As a result, we utilized 3 and 6 months as the length of the drought in our current study. Because SPEI is adaptable and standardized, it is simple to calculate and compare over a range of time scales. The timescale and the drought classification for the SPEI are shown in Table 1.
To compare the strengths and accuracy of the various indices, robust studies have been followed globally by [13,19,20,21,22,23,24,25]. Ref. [19] presented an analysis of spatial variability and trends between SPI and PDSI in 10 regions of China. An overall assessment of different drought indices performance is provided to monitor drought effects on forest growth, stream flows, soil moisture, and crop yields [20]. Ref. [21] used the SPEI and SPI to monitor drought over the Republic of Moldova territory in recent decades. A study by [22] systematically evaluated the regional applicability of seven drought indices and their ability to represent the long-term trend of dry/wet variations in China. Additionally, a previous study by [23] analyzed the performance of SPI, PDSI, and SPEI to monitor drought in the (NCP) North China Plain. The SPEI and SPI indices were used to analyze their performance in Bangladesh [13], investigate drought in Balochistan-Pakistan [24], and study wet and dry events in the Andean city in northern Peru [25].
To the best of our knowledge, few studies have researched drought due to climate change in the Huaibei Plain of which SPEI indices were not used [26,27,28,29,30]. A study by [26] made a complete assessment of Regional Agriculture Drought Resilience (RADR) based on the theoretical analysis of the natural disaster risk system in the Huaibei Plain of China. [27] used CSM (cropping system model) to simulate the growth processes of summer maize under various drought patterns during the 2016 and 2017 seasons in Huaibei Plain. Furthermore, ref. [28] analyzed maize evapotranspiration under different drought conditions. Ref. [29] developed a risk management approach using the Agricultural Drought Disaster model (ADD). Ref. [30] studied climate change effect on the root zone groundwater contribution to the winter wheat crop in the Huaibei Plain. There is no specific drought monitoring study using SPEI at 3 and 6-month time scales using HadGEM2-AO in the Huaibei Plain. Hence, several studies were conducted using this index in other parts of China. The primary purpose of this research is: (1) to use SPEI-3 and SPEI-6 indices to monitor agricultural drought in the baseline and the future in the Huaibei Plain using meteorological data and GCM (HadGEM2-AO) data with three RCPs (2.6, 4.5 and 8.5). (2) To determine which time exhibits more drought, which period (baseline and future) will present a harsher drought, and, to determine the frequency of drought in the Huaibei Plain, and (3) to use Pearson correlation to determine the relationship between both time scales and Mann-Kendall and Sen’s Slop estimation test to detect an increasing or decreasing severity trend under different timescales. All this will help to better understand and manage water availability in the area.
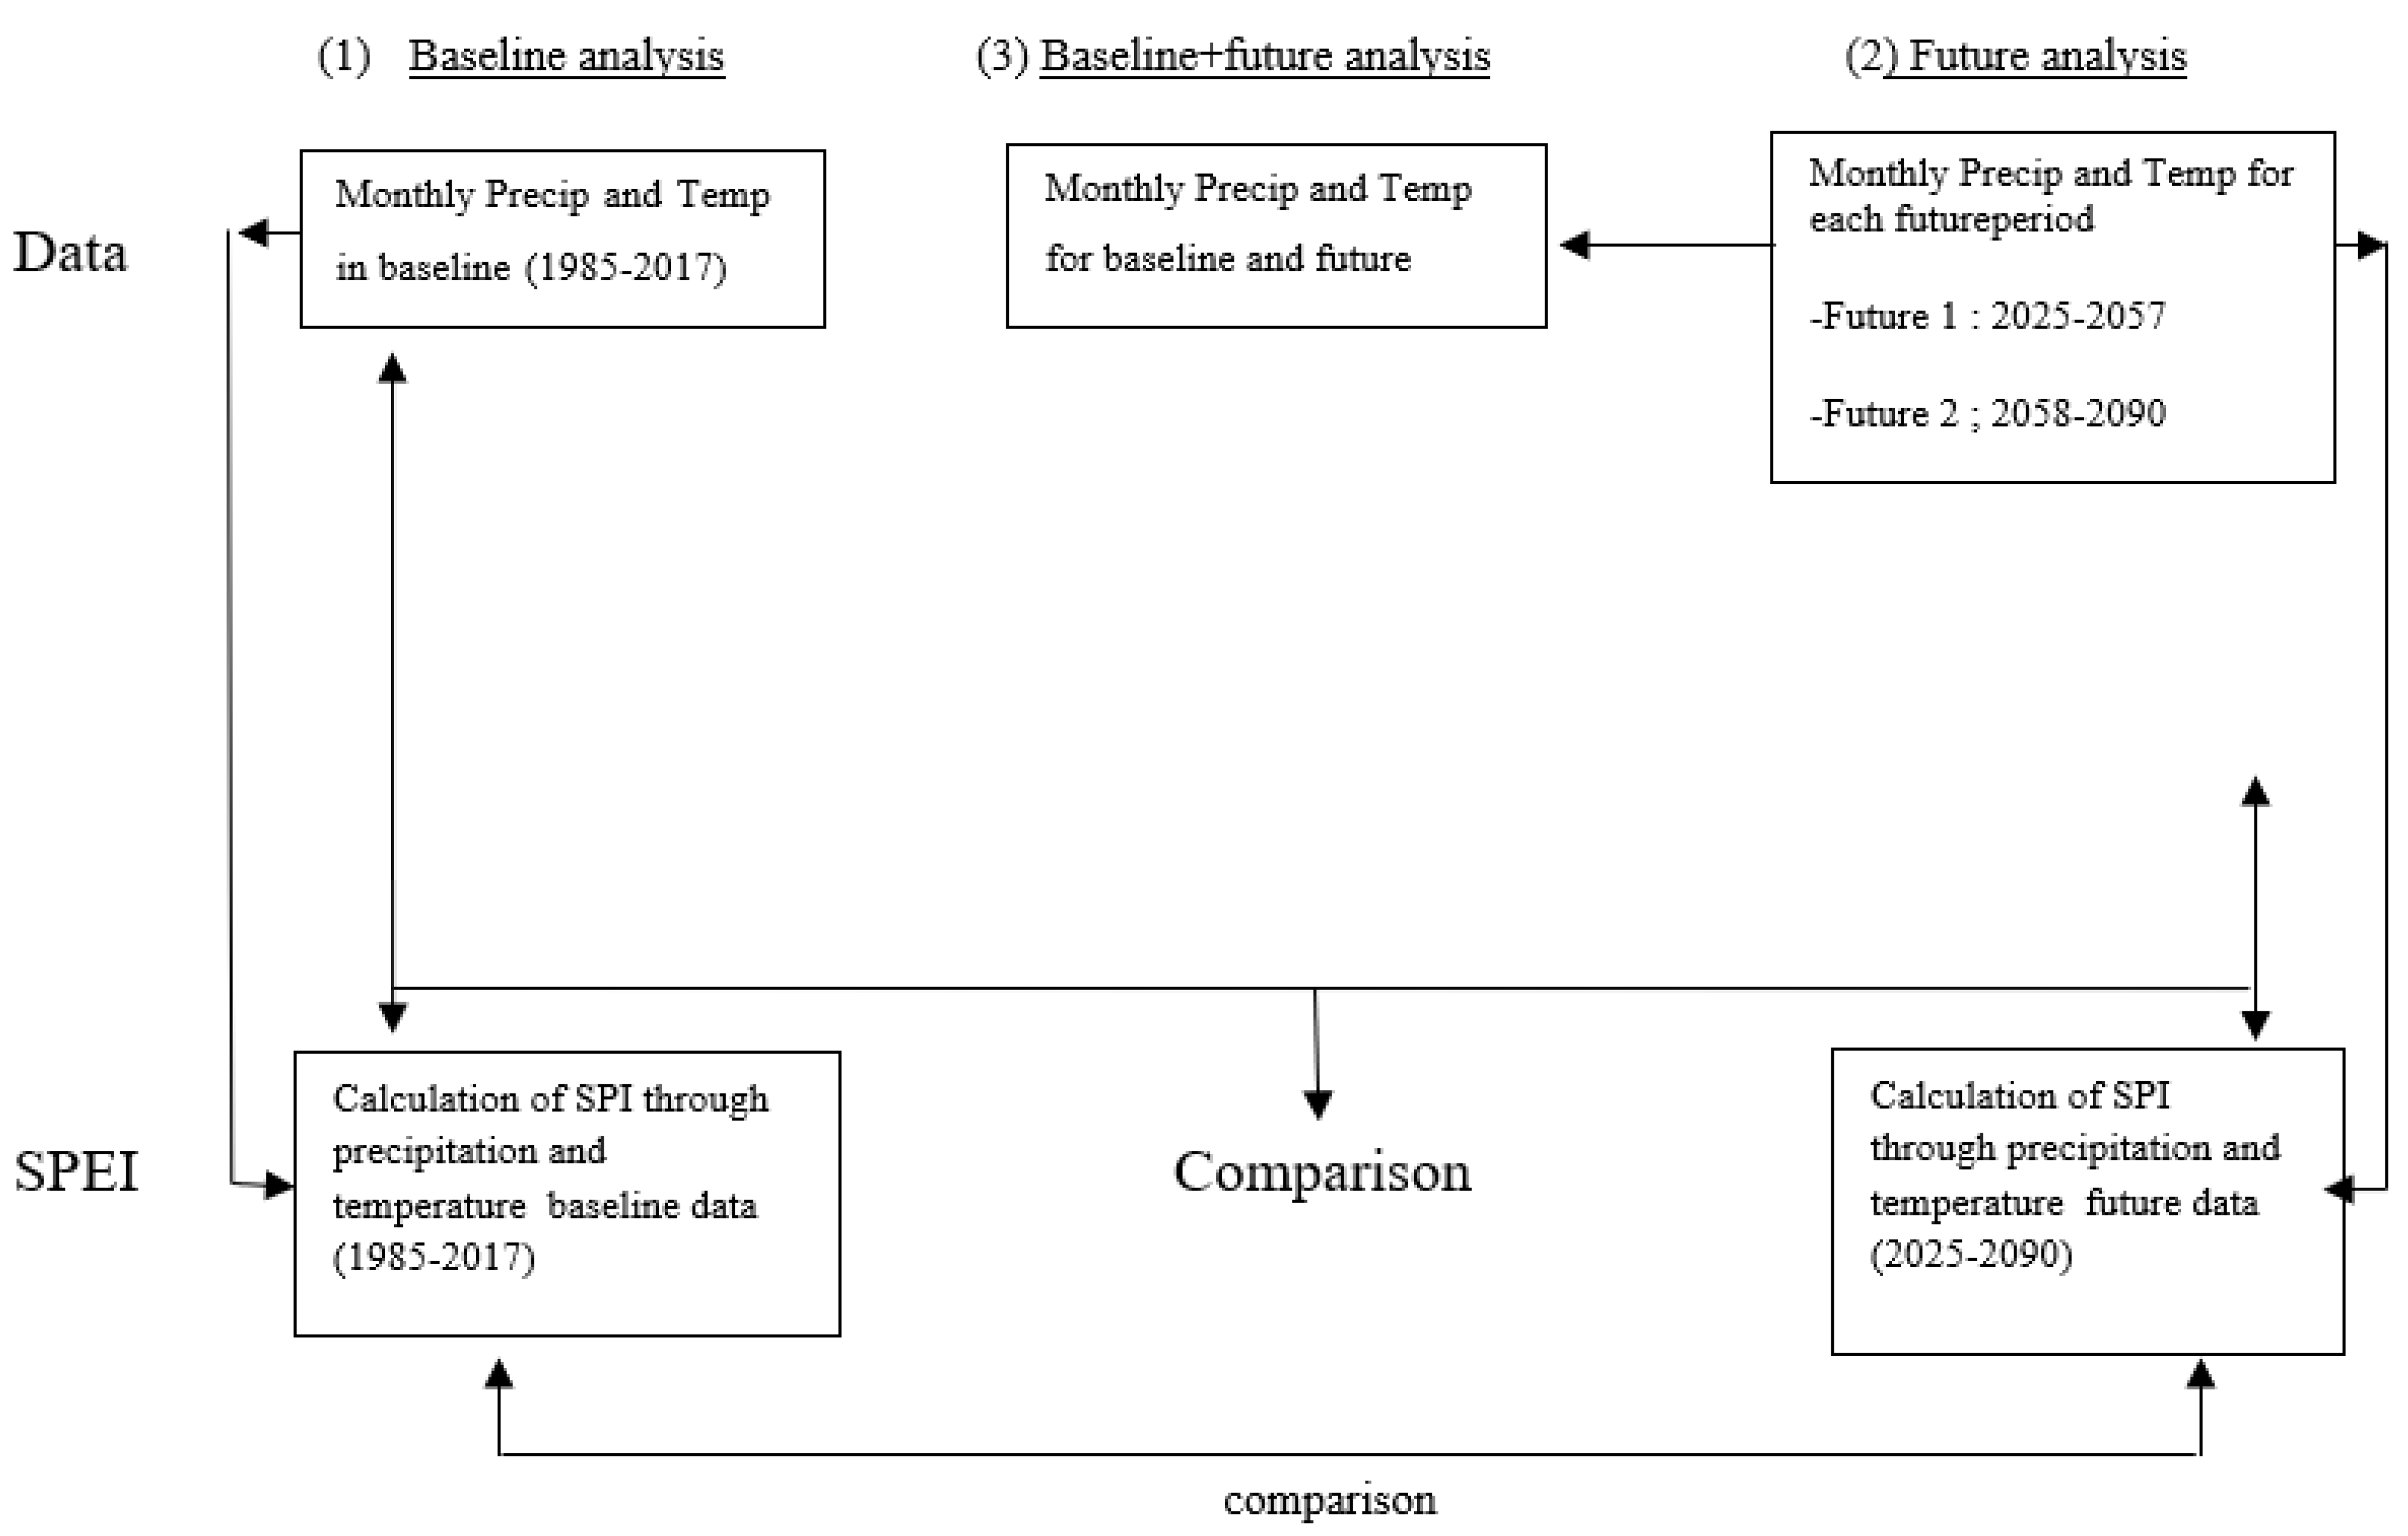
Figure 1 shows the way this study was designed, from the collection of the data to the manipulation of the data until the analysis of the results obtained. The first step is the data collection (baseline and future), and the second consist of calculating, comparing, analyzing, and discussing the SPEI results.
2. Materials and Methods
2.1. Study Area
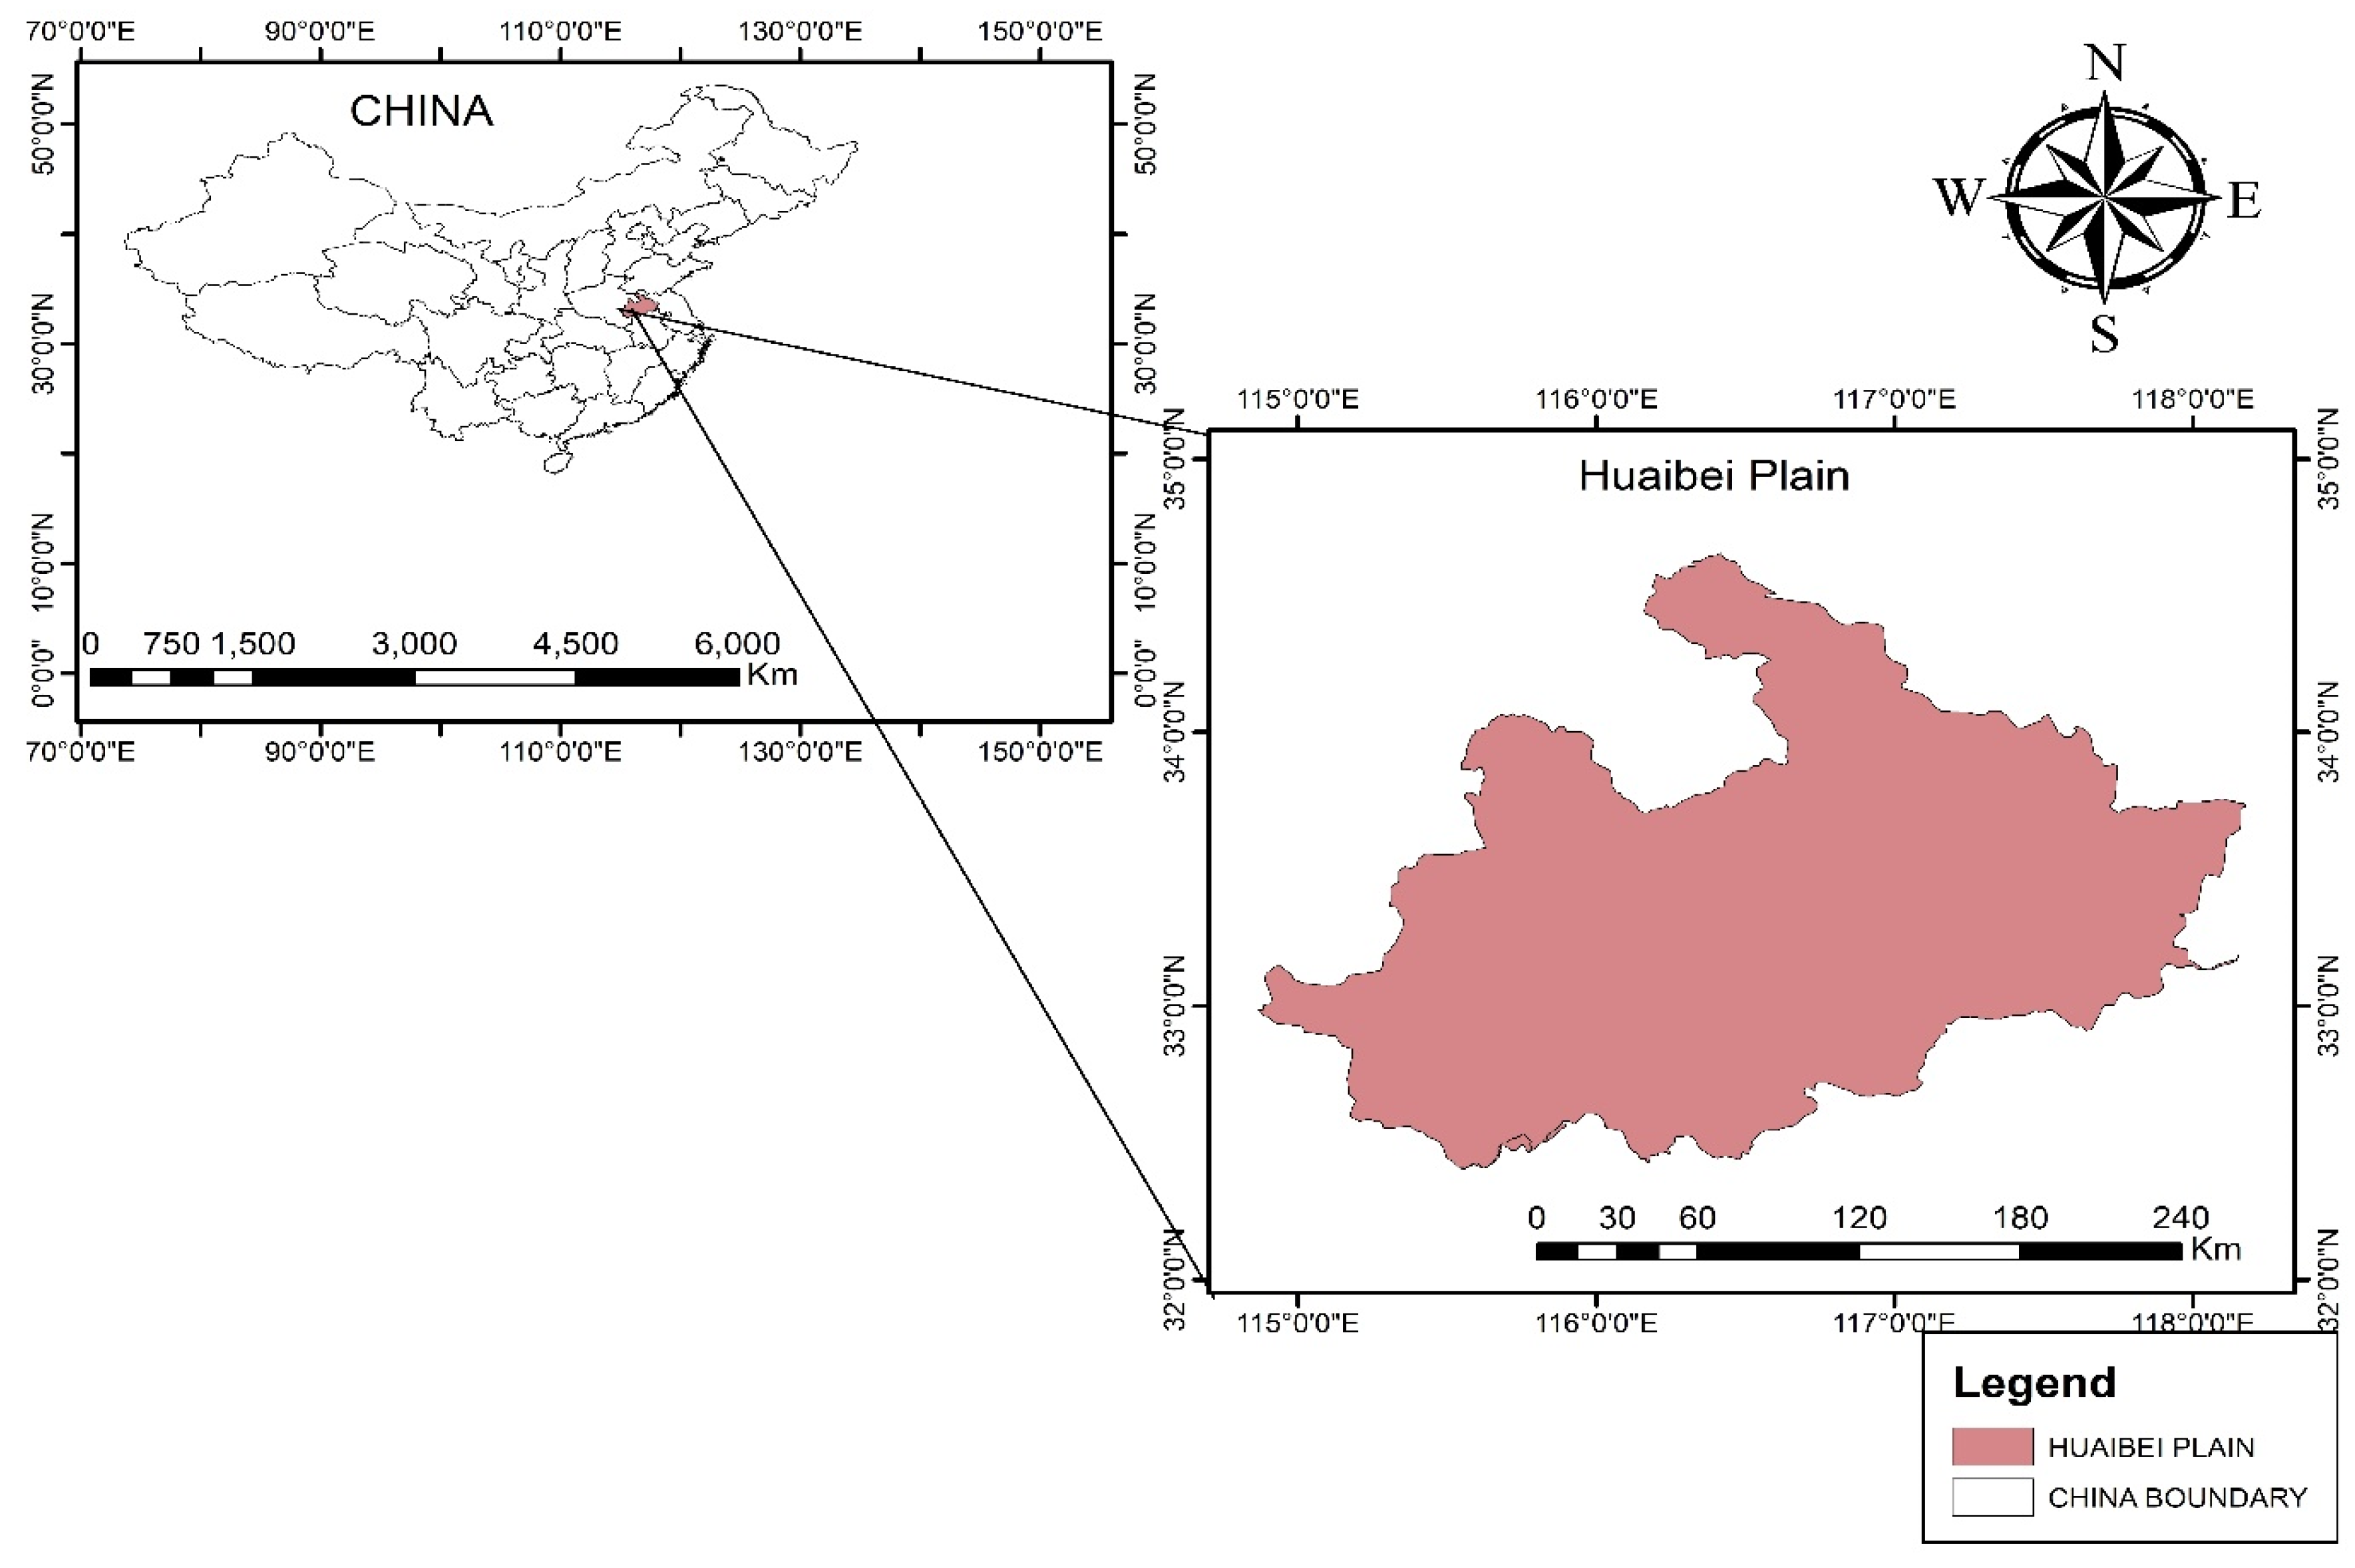
The work is based on gathered data from 17 meteorological stations between 1985–2017 in the Huaibei Plain. The Huaibei Plain is located in the north of the province of Anhui, China [31]. The plain cover a total area of 37,420 km2 between 32°25′ to 34°35′ N and 114°55′ to 118°10′ E. Its primary soils are fluvial-aquic soil and lime concretion black soils, which account for 33% and 54%, respectively [32], of Huaibei Pain (Figure 2).
The Huaibei Plain is a northern warm subtropical transitional climate zone [32]. In the Supplementary Materials, we display the average monthly temperature and precipitation during the study period for the 17 stations in the Huaibei Plain. The annual precipitation of the Huaibei Plain decreases from southeast to northwest (1100–750 mm) [32].
The WERS (Wudaogou Experimentation Research Station) of Hohai University records an average annual precipitation of 890 mm, with more than 60% occurring from June to September [33]. The average evaporation volume is 1000 mm, the mean annual temperature is 14 °C, and the mean annual relative humidity is 70%. The annual range of the water table depth is 0.71–4.19 m, and the annual average water depth is 2.0 m. Groundwater is mainly discharged by artificial abstraction and evapotranspiration and recharged mainly by vertical seepage of atmospheric moisture [31]. In the Huaibei Plain, winter wheat is the primary crop produced. Notably, WERS is identified in fields with representative phenoplasts of winter wheat [31]. The temperature and hydrological conditions of WERS represent the average climatic conditions of the Huaibei Plain. Consequently, as a representative and typical station, the WERS is selected to investigate the climate change effect on drought monitoring and assessment in the Huaibei Plain [31]. The average annual temperature for the 17 stations in the Huaibei Plain from 1985 to 2017 is shown in the Supplementary Materials.
2.2. Data
This study used 17 meteorological station’s data from 32 years of monitoring at Huaibei Plain. Precipitation data and temperature are used to calculate SPEI and SPI to monitor drought in the Huaibei Plain. Temperature and precipitation data for future years (2025–2090) show a very-low forcing scenario (RCP 2.6), a medium stabilization scenario (RCP 4.5), and a high baseline emission scenario (RCP 8.5) which are estimated by HadGEM2-AO of CMIP5. The radiative forcing of 8.5, 4.5, and 2.6 correspond to approximately 3.6%, 1.9%, and 1.1% of solar radiation, respectively [34]. The evaluation periods were divided into three 32-year periods: baseline (1985–2017) and the two futures (2025–2057, 2058–2090). A graph showing the average monthly precipitation and temperature recorded in the Huaibei Plain is shown in a figure in Supplementary Materials, and the annual average of temperature and precipitation is shown in in a figure in Supplementary Materials.
2.3. Methodology
2.3.1. General Circulation Model
CMIP5 (The fifth phase of the Coupled Model Intercomparison Project) published more than 40 GCMs. In 2016, Ouyang compared the monthly average temperature and precipitation of 40 GCMs and 14 meteorological stations in the Huaibei Plain [30]. He concluded that the HadGEM2-AO climate model performed best in simulating precipitation in the study area. To simulate future drought events in the Huaibei Plain, HadGEM2-AO was used for three scenarios (RCP 2.6, RCP 4.5, and RCP 8.5). The climate model HadGEM2-AO was developed by the National Institute of Meteorological Research of Korea and Met Office Hadley Centre using the Hadley Centre Global Environmental Model version 2 coupled with atmosphere-ocean configuration [35] with a resolution of 1.25° × 1.875°.
2.3.2. Downscaling Method
Many downscaling methods exist; in this study, quantile mapping (QM) was used as a downscaling method. The QM method was derived from empirical transformation [36]. It was successfully applied in hydrological applications [30,37] and error correc-tion of GCMs [38,39]. The QM principle is to build empirical cumulative distribution functions (ECDF) with modeled and observed datasets in validation and calibration periods, respectively, and to correct the daily precipitation and temperature of GCM simulation.
2.3.3. Drought Indices
The different indices have been extensively reported in many regions worldwide for monitoring and assessing drought. However, only SPEI is used because of its standardized nature in the current research.
Standardized Precipitation Index (SPI)
McKee et al. [10] developed the SPI index in 1993. The WMO recommends SPI as one of the most useful indexes and can determine the precipitation amount in a specified period and is used worldwide [40]. Precipitation is transformed in SPI based on numerical measurements into normalized common units. The standard deviation number is where the long-term average deviates from the standardized measures [24]. SPI assumes the precipitation X in a certain period obeys distribution, whose density probability function is:
where α, β the shape and scale parameters are estimated by the maximum likelihood method.
If the rainfall in a year is x0, the probability that the variable random x is less than x0 is:
When the precipitation is 0:
where m is the number of samples without rain, and n is the total number of samples. Normalize the distribution:
When the cumulative probability P (x) ≤ 0.5:
When the cumulative probability P (x) > 0.5:
Among them c0 = 2.5155; c1 = 0.8028; c2 = 0.0103; d1 = 1.4327; d2 = 0.1892; d3 = 0.0013
Standardized Precipitation Evapotranspiration Index (SPEI)
Vicente et al. [6] based on SPI, proposed the SPEI [6]. SPEI utilizes the difference between precipitation (P) and potential evapotranspiration (PET) based on the principle of water balance as the main input condition to evaluate the wet and dry conditions of the area [6,13]. Different methods, including Penman-Monteith, Thornthwaite, and Hargreaves, exist depending on the data available to calculate PET [24,41,42]. The most important advantage of SPEI is to combines the multi-time scale of SPI with evapotranspiration information to make it a more physical drought index [6].
Firstly, we used the Penman formula to calculate the potential evaporation. Then we calculate the difference Di between rainfall Pi and evapotranspiration PETi by [6]
2.3.4. Trend Analysis
Mann–Kendall Analysis
The Mann-Kendall (M-K) method is similar to a nonparametric statistical test method [8] and is recommended by the WMO to analyze meteorological and hydrological variables [43,44]. The analysis process is as follows: original hypothesis H0: time series data (x1, x2,……xn) are independent samples with the same distribution of random variables; H1 hypothesis alternative is a bilateral test. For all i, j ≤ n, and i ≠ j, the distribution of xi and xj is different. The statistical variable test S of the test is calculated as follows [45,46]:
Here “xi” ranges from i = 1, 2, 3,…. n − 1 and “xj” from i + 1, 2, ……, n. “xi” is taken as a reference point and compared with the remaining data points “xj” where:
where S is the normal distribution with a mean value of 0 and the variance of
where the number of the ties up to “i” sample is denoted by “ti” and the test statistic “Zc” is given as:
In the two-sided trend test, based on the given confidence level α, if [Z] ≥ Z (1−α/2), then reject the original hypothesis H0; that is, there is a significant upward or downward time trend in series data at the confidence level α. A positive value for Z designates an upward trend and vice versa [47].
Sen’s Slope Estimation
Sen’s Slope Estimator method accounts for the seasonality of the precipitation data. This method uses a non-parametric simple procedure developed to evaluate the slope [48]. The residuals of the variance must be continuous in time. To derive an estimate of the slope, Q, all data of slopes pairs are calculated as follows:
where xj and xk are data values at times j and k. The median of these values N of Qi is Sen’s estimator of the slope. The values N of Qi are ranked from the smallest to the largest and ten’s estimator is computed by [48]:
A 100 (1 − α) % two-sided confidence interval about the slope estimate is obtained by the non-parametric technique based on the normal distribution [49].
2.3.5. Person Correlation Coefficients
Person coefficients correlation (R) is calculated by using the indices SPEI and SPI in SPSS statistics 26 software at various time scales. The value of the Person correlation recommended n between both indices can be found in results section. An R-value≥ 0.5 was taken as indicating a strong correlation. R was computed by using Equation (17) (Taylor, 1990)
where the number of the observations is denoted by “n” and “x” and “y” are, respectively, the SPI and SPEI.
2.3.6. Drought Frequency
Drought frequency (Pij) [50] refers to the percentage of drought disaster years in the total number of years, which can generally represent the frequency of disasters. In this study, SPEI was extracted from each SPEI time scale and period for the calculation of the drought frequency.
where nij is the number of years that occurred j-level drought in the i-time scale, and N is the total number of years.
Pij = nij/N × 100%
3. Results and Discussion
3.1. Applicability Analysis of SPEI
One of China’s major agricultural bases for producing and exporting domestic animals, cotton, and grains is the Huaibei Plain. The main crops are wheat, maize, cotton, broad bean, rice, and potatoes. The National Agricultural Comprehensive Development Zones include the Huaibei Plain. The Plain is situated in the drought-prone Anhui Province, where hotter summers result in significant evaporation. SPEI-3 and SPEI-6 were used in the past (1985–2017) and future (2025–2090) to analyze the spatial and temporal variation of drought changes.
However, since the Huaibei Plain is one of the major agricultural production areas, the drought would directly affect this area. This paper used the SPEI index to monitor drought in the study area. The daily precipitation and temperature data from 17 meteorological stations were used and averaged into monthly data to demonstrate the applicability of the drought indices. The application of SPEI was also examined using the Pearson correlation coefficient, and the findings indicated a good correlation between the two-time scales SPEI-3 and SPEI-6 for both the past and the future. The World Meteorological Organization (WMO) has adopted the SPEI as one of the indices used worldwide to characterize droughts. The map results show the spatial and temporal distribution of drought in the whole study area with a great resemblance between the past and the future in both time scales. In addition, we also calculated the drought frequency and Sen’s slope trend estimator to compare the applicability of the drought indices in the Huaibei Plain.
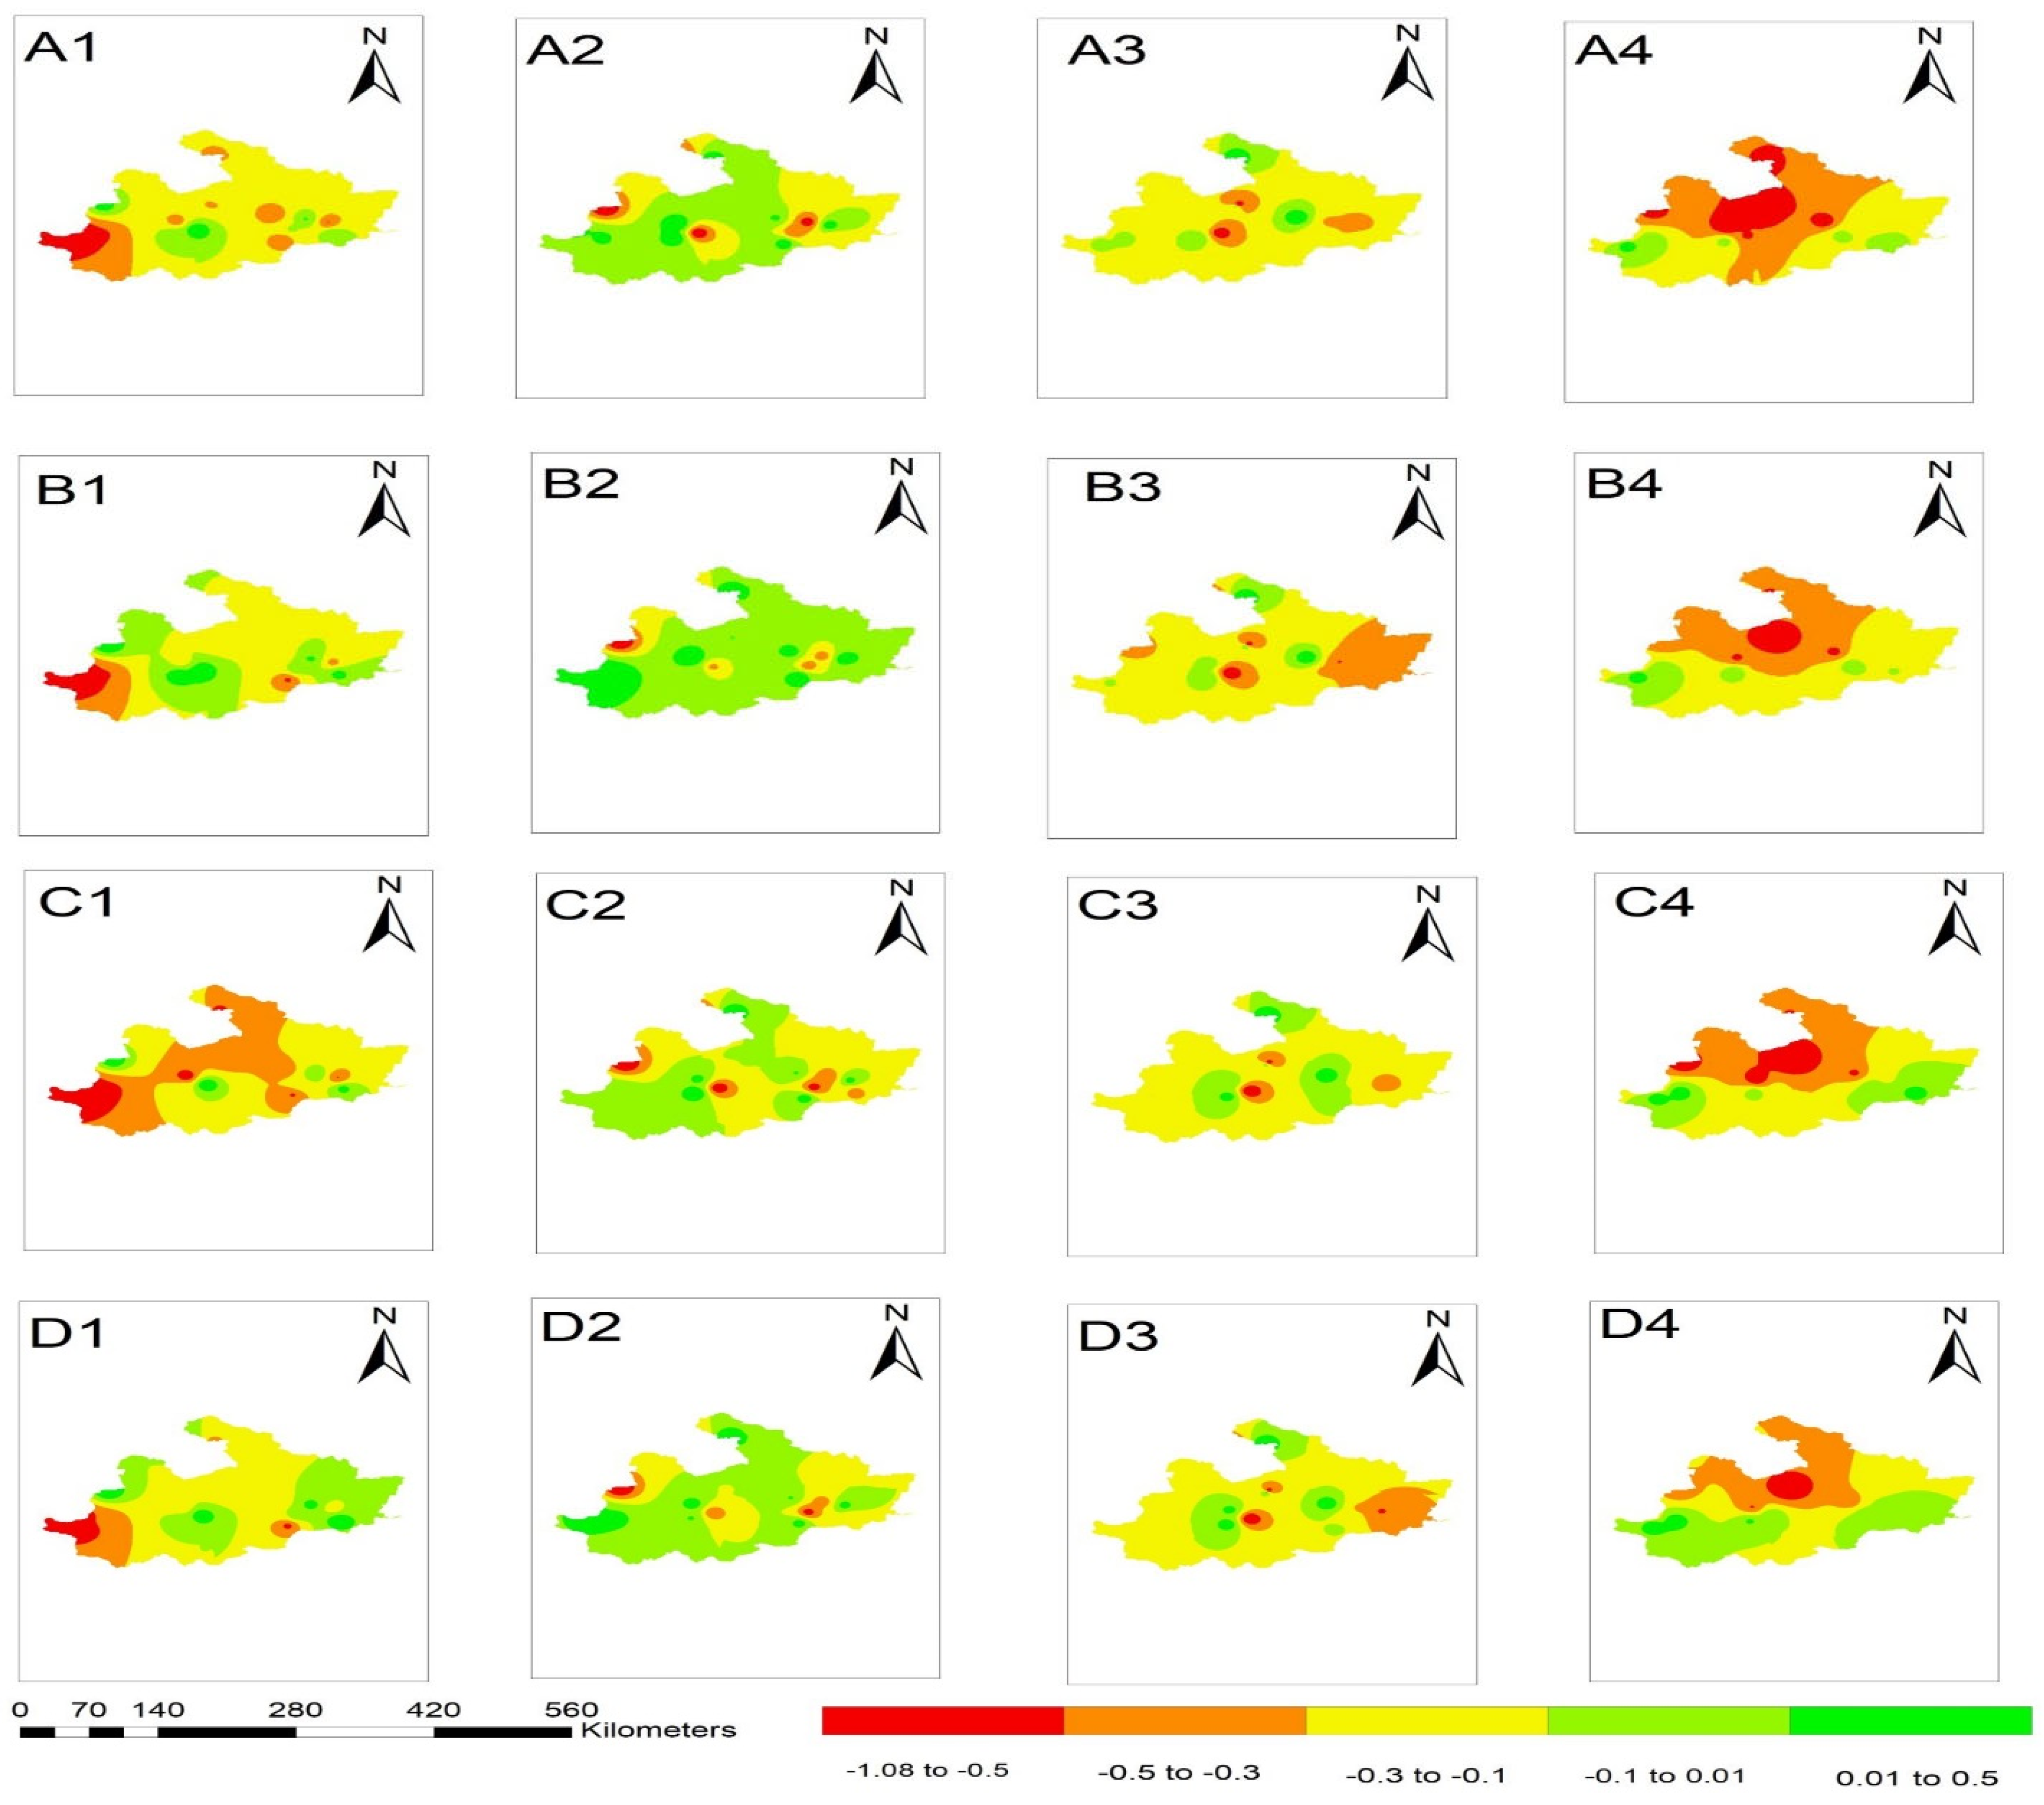
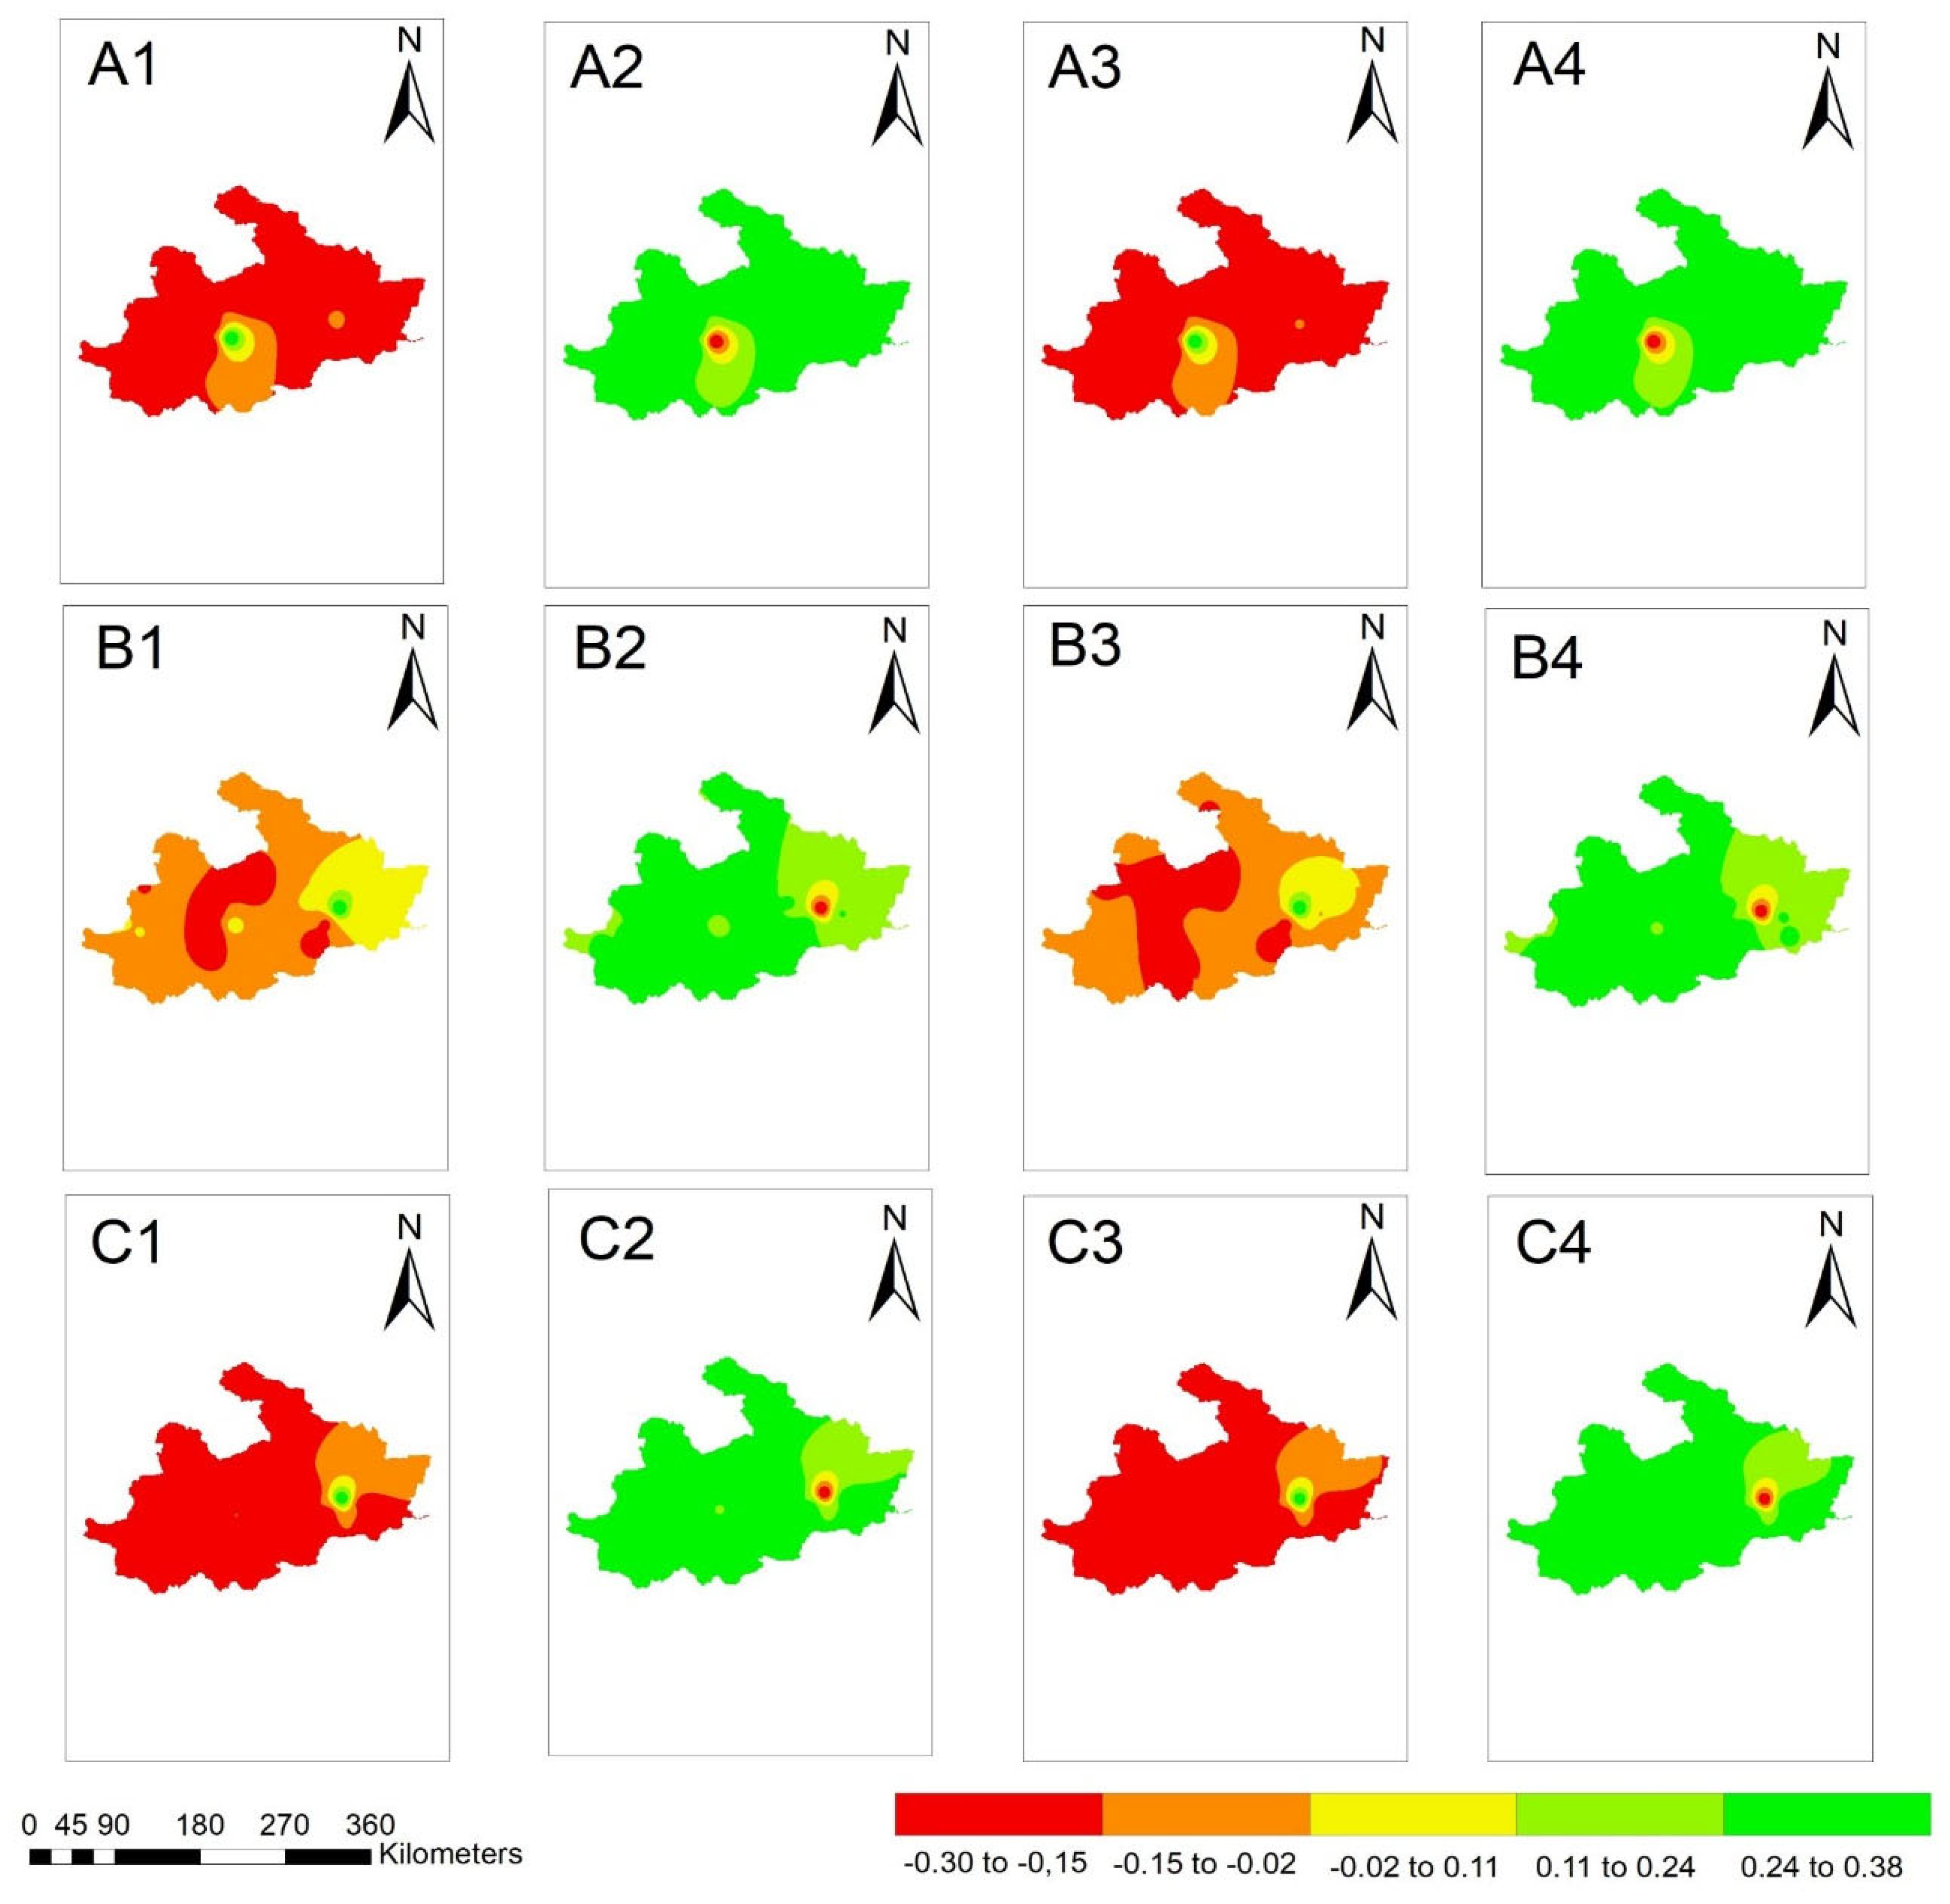
In addition, we also calculated SPI-3 and SPI-6 to make a comparison between those two indices (SPEI and SPI) and see which one is more suitable. For this reason, we have selected 4 years of drought events from a paper published by Gou Qiqi [33]. We determined, from the calculation, that both indices at 3 and 6 months’ time scales detected drought events in almost the whole Plain during those 4 years of drought events for Gou. However, SPEI detected more drought events than SPI. That is why we concluded that SPEI is more suitable for the analysis hence the decision to use SPEI as the index for our work. Table 2 shows the flash drought event, and Figure 3 shows the results of SPEI and SPI 3- and 6-months’ time scales for the 4 years, respectively, 2001, 2002, 2009, and 2012.
3.2. Spatial Variation of Drought in Baseline and Future Period
3.2.1. Spatial Variation of SPEI in the Baseline Period
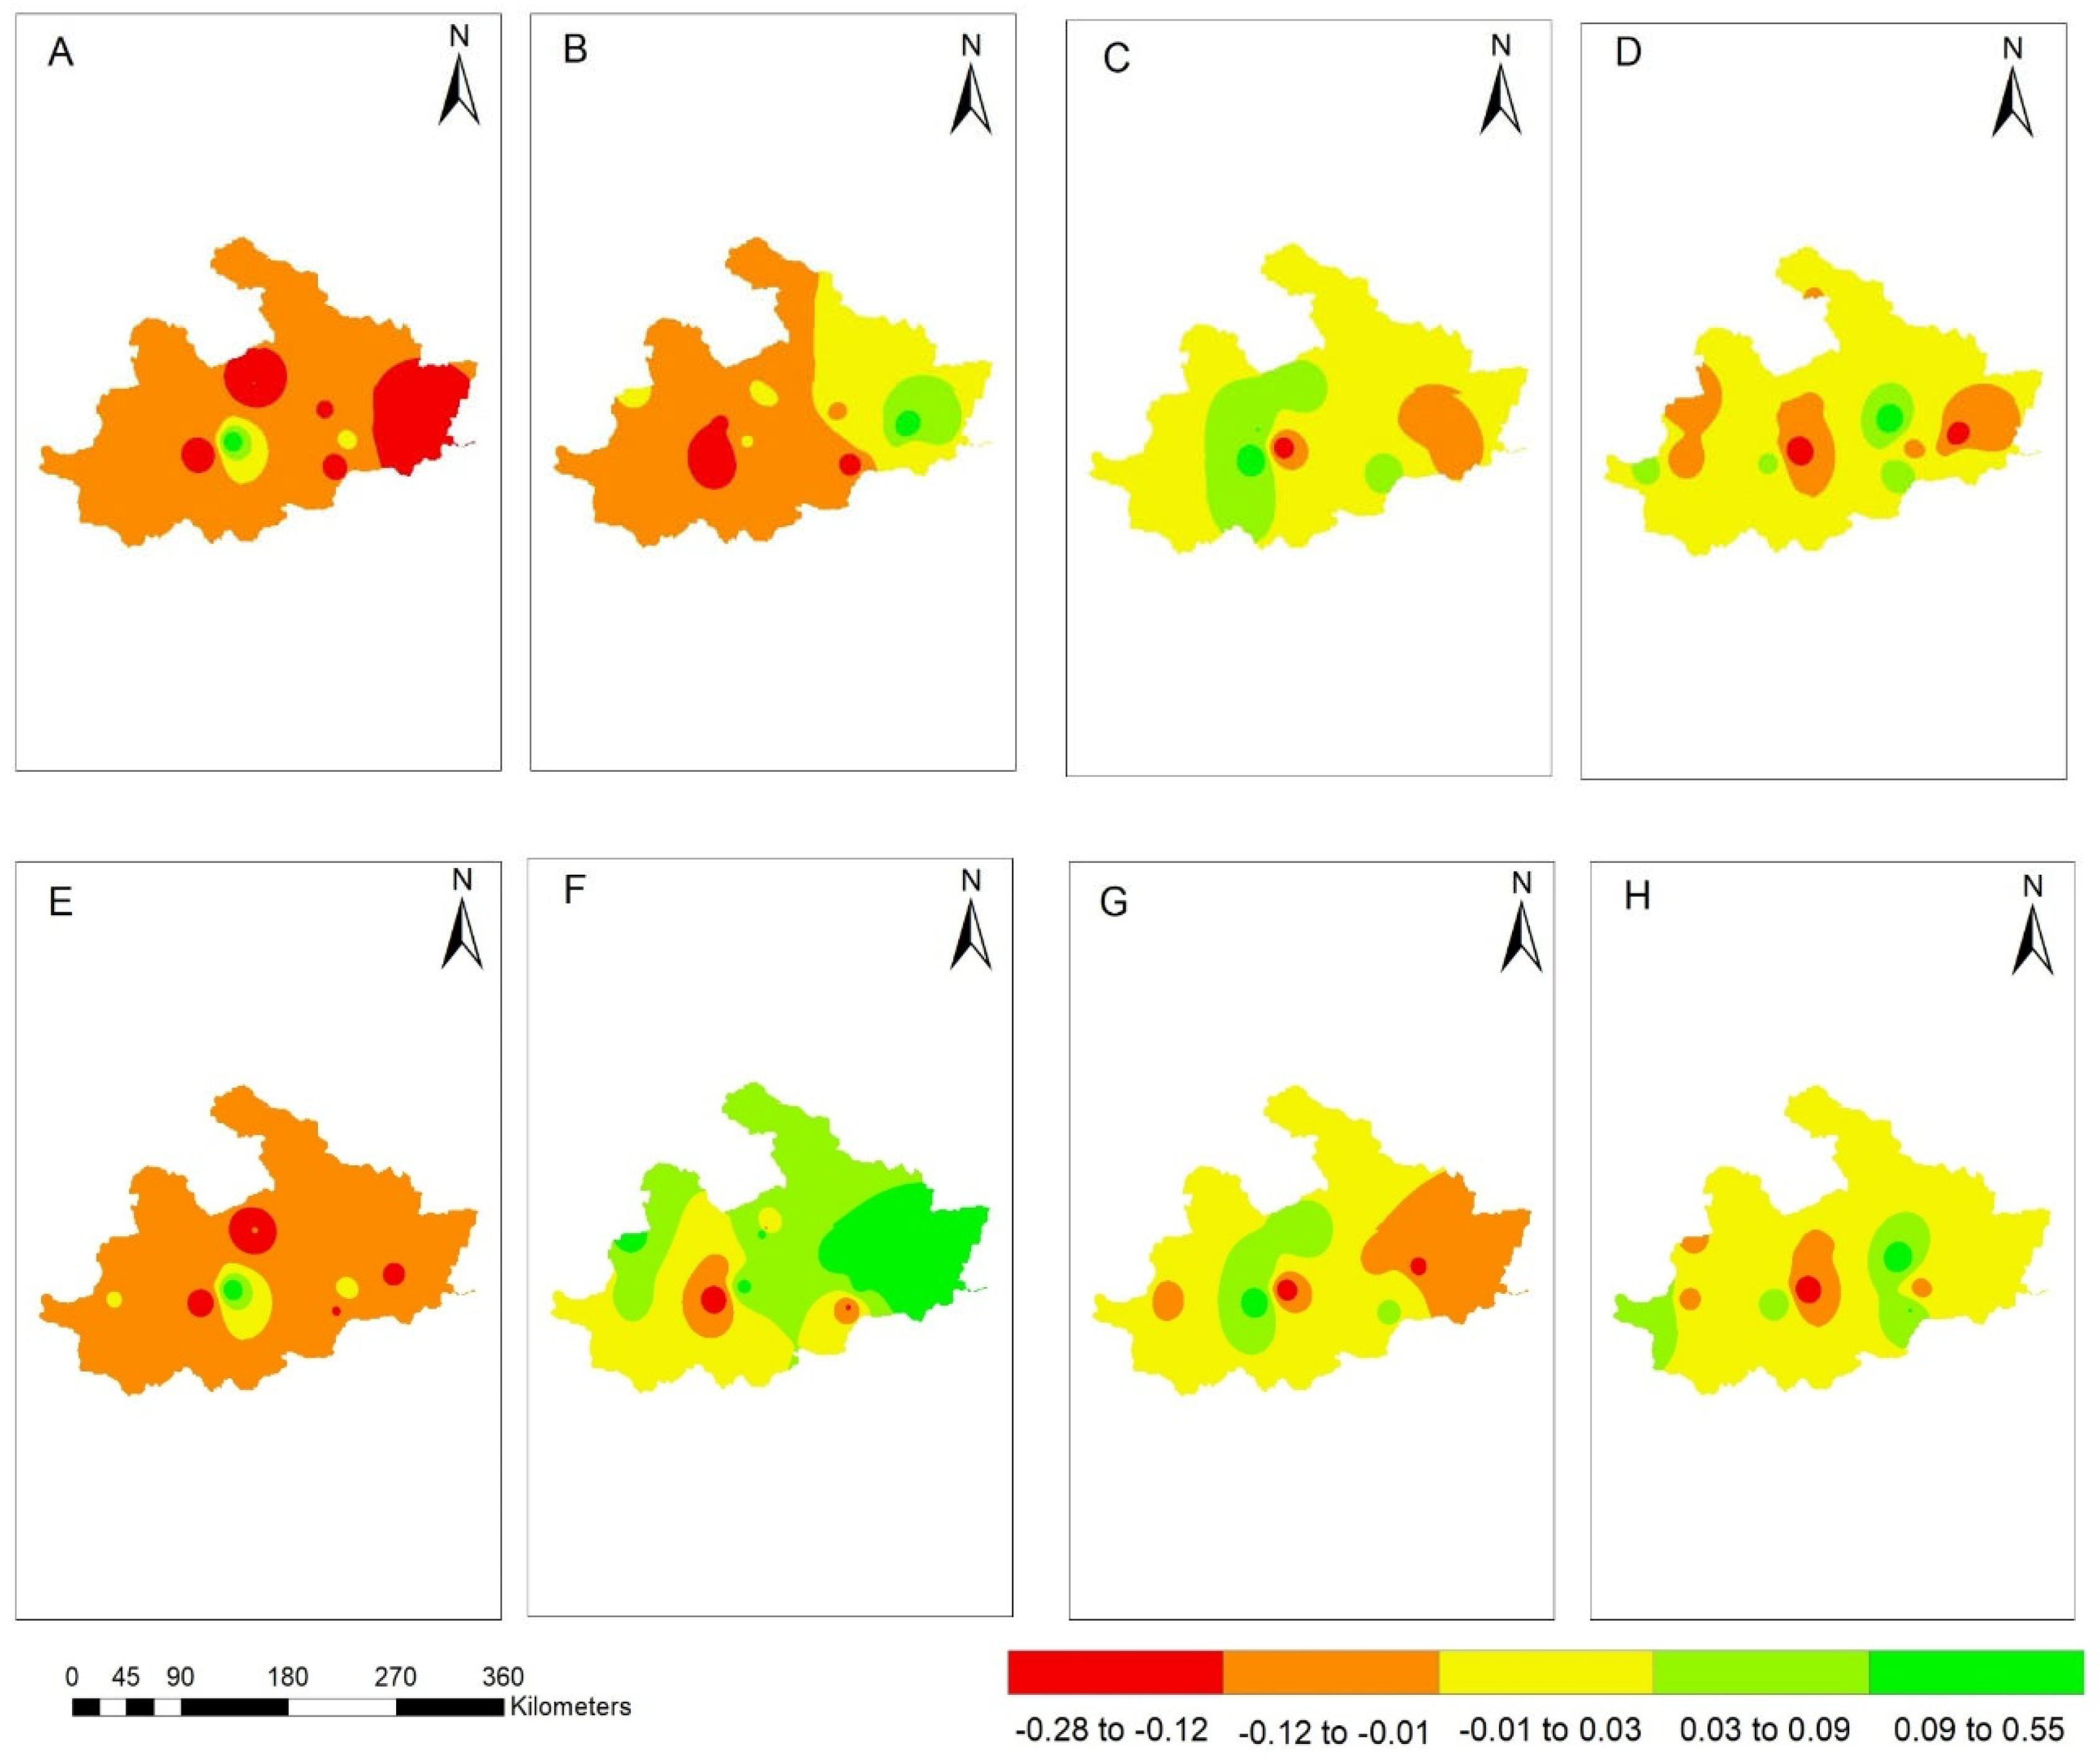
Figure 4 shows the spatial variations of SPEI-3 and SPEI-6 at different periods. This study has divided the work into four periods: 1985–1989, 1990–1999, 2000–2009, and 2010–2017. The results show that drought varies according to the period. Both time scales (SPEI-3 and SPEI-6) detect drought in the whole plain except in the center, where we observe a small wetland between 1985 and 1989. The northeast part was the least affected by drought compared to other areas from 1990 to 1999. Between 2000 and 2009, we observed drought, spreading throughout the plain except for a small part of the center. Drought appeared throughout the Huaibei Plain from 2010–2017, except for a small portion of the center-east, center, and west.
3.2.2. Spatial Variation of SPEI in the Future Period
To better analyze the spatial variations of drought in the Huaibei Plain, we have divided the future years into two groups, future-1 (2025–2057) and future-2 (2058–2090), and used three RCPs (2.6, 4.5, and 8.5). Figure 5 shows that all RCPs, SPEI-3, and SPEI-6 detect more drought in future-1 than in future-2. For RCP 2.6, a significant drought is observed throughout the plain except in a very small part of the center in future-1. The opposite happened in future-2, with only a small part of the center affected by drought. The same scenarios are observed for RCPs 4.5 and 8.5. RCP 4.5 detected drought in most of the Plain, omitting the center and west, where we have the least affected part in future-1, and future-2 because they are wetter, and only the center-west part is dry. RCP 8.5 presents drought in almost the entire Plain except in the center-west. In future-1, and future-2, it is only the center-west zone that is affected by drought, which is the opposite of other areas.
3.3. Temporal Variation of Drought in the Baseline and Future Period
3.3.1. Temporal Variation of SPEI in the Baseline Period
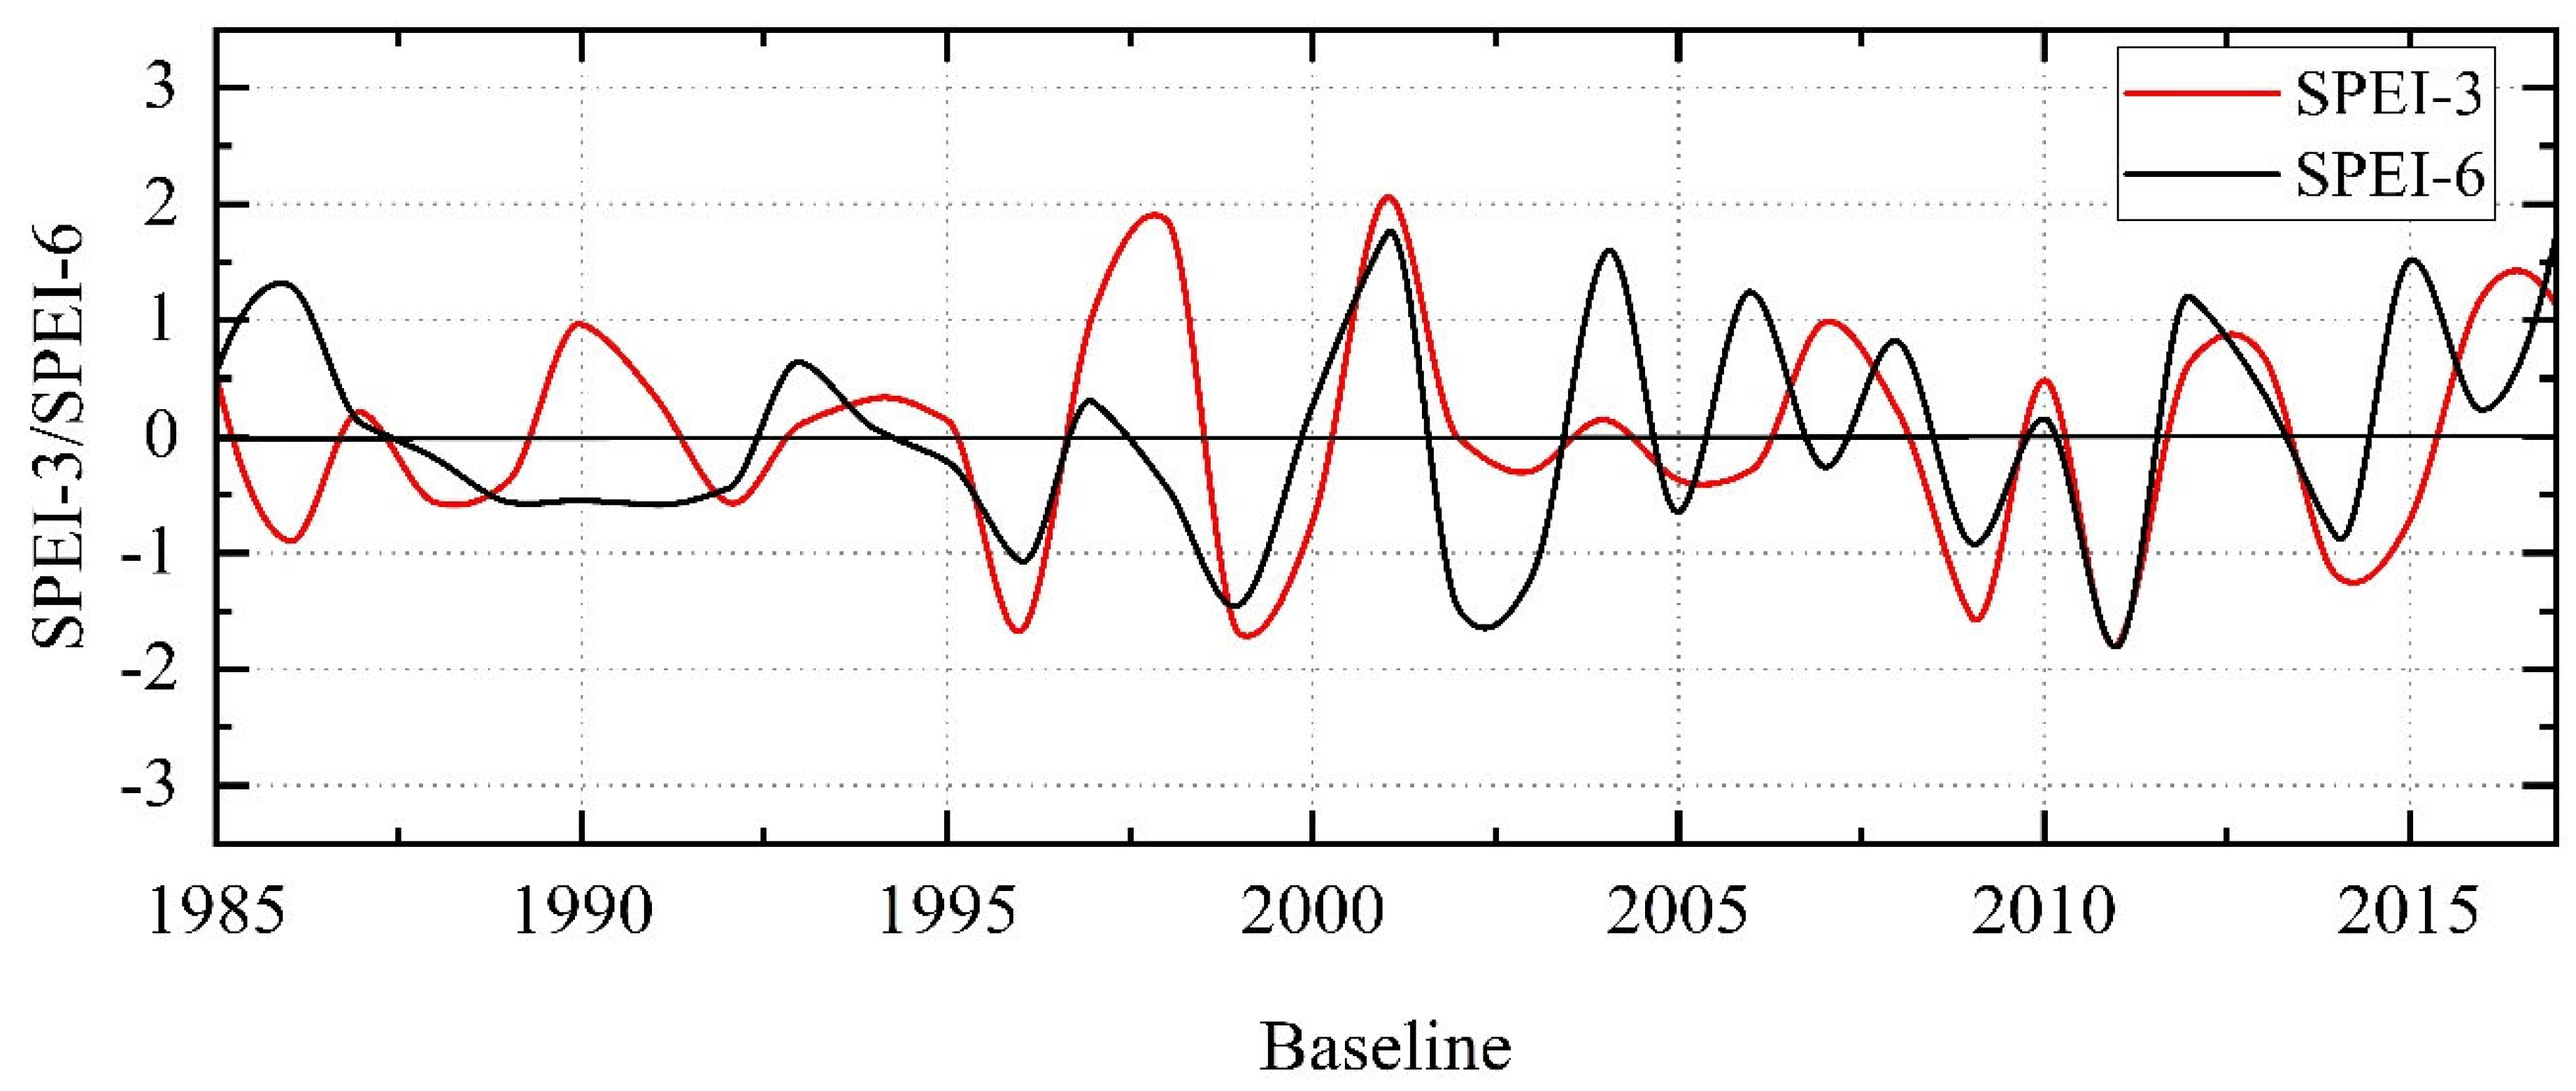
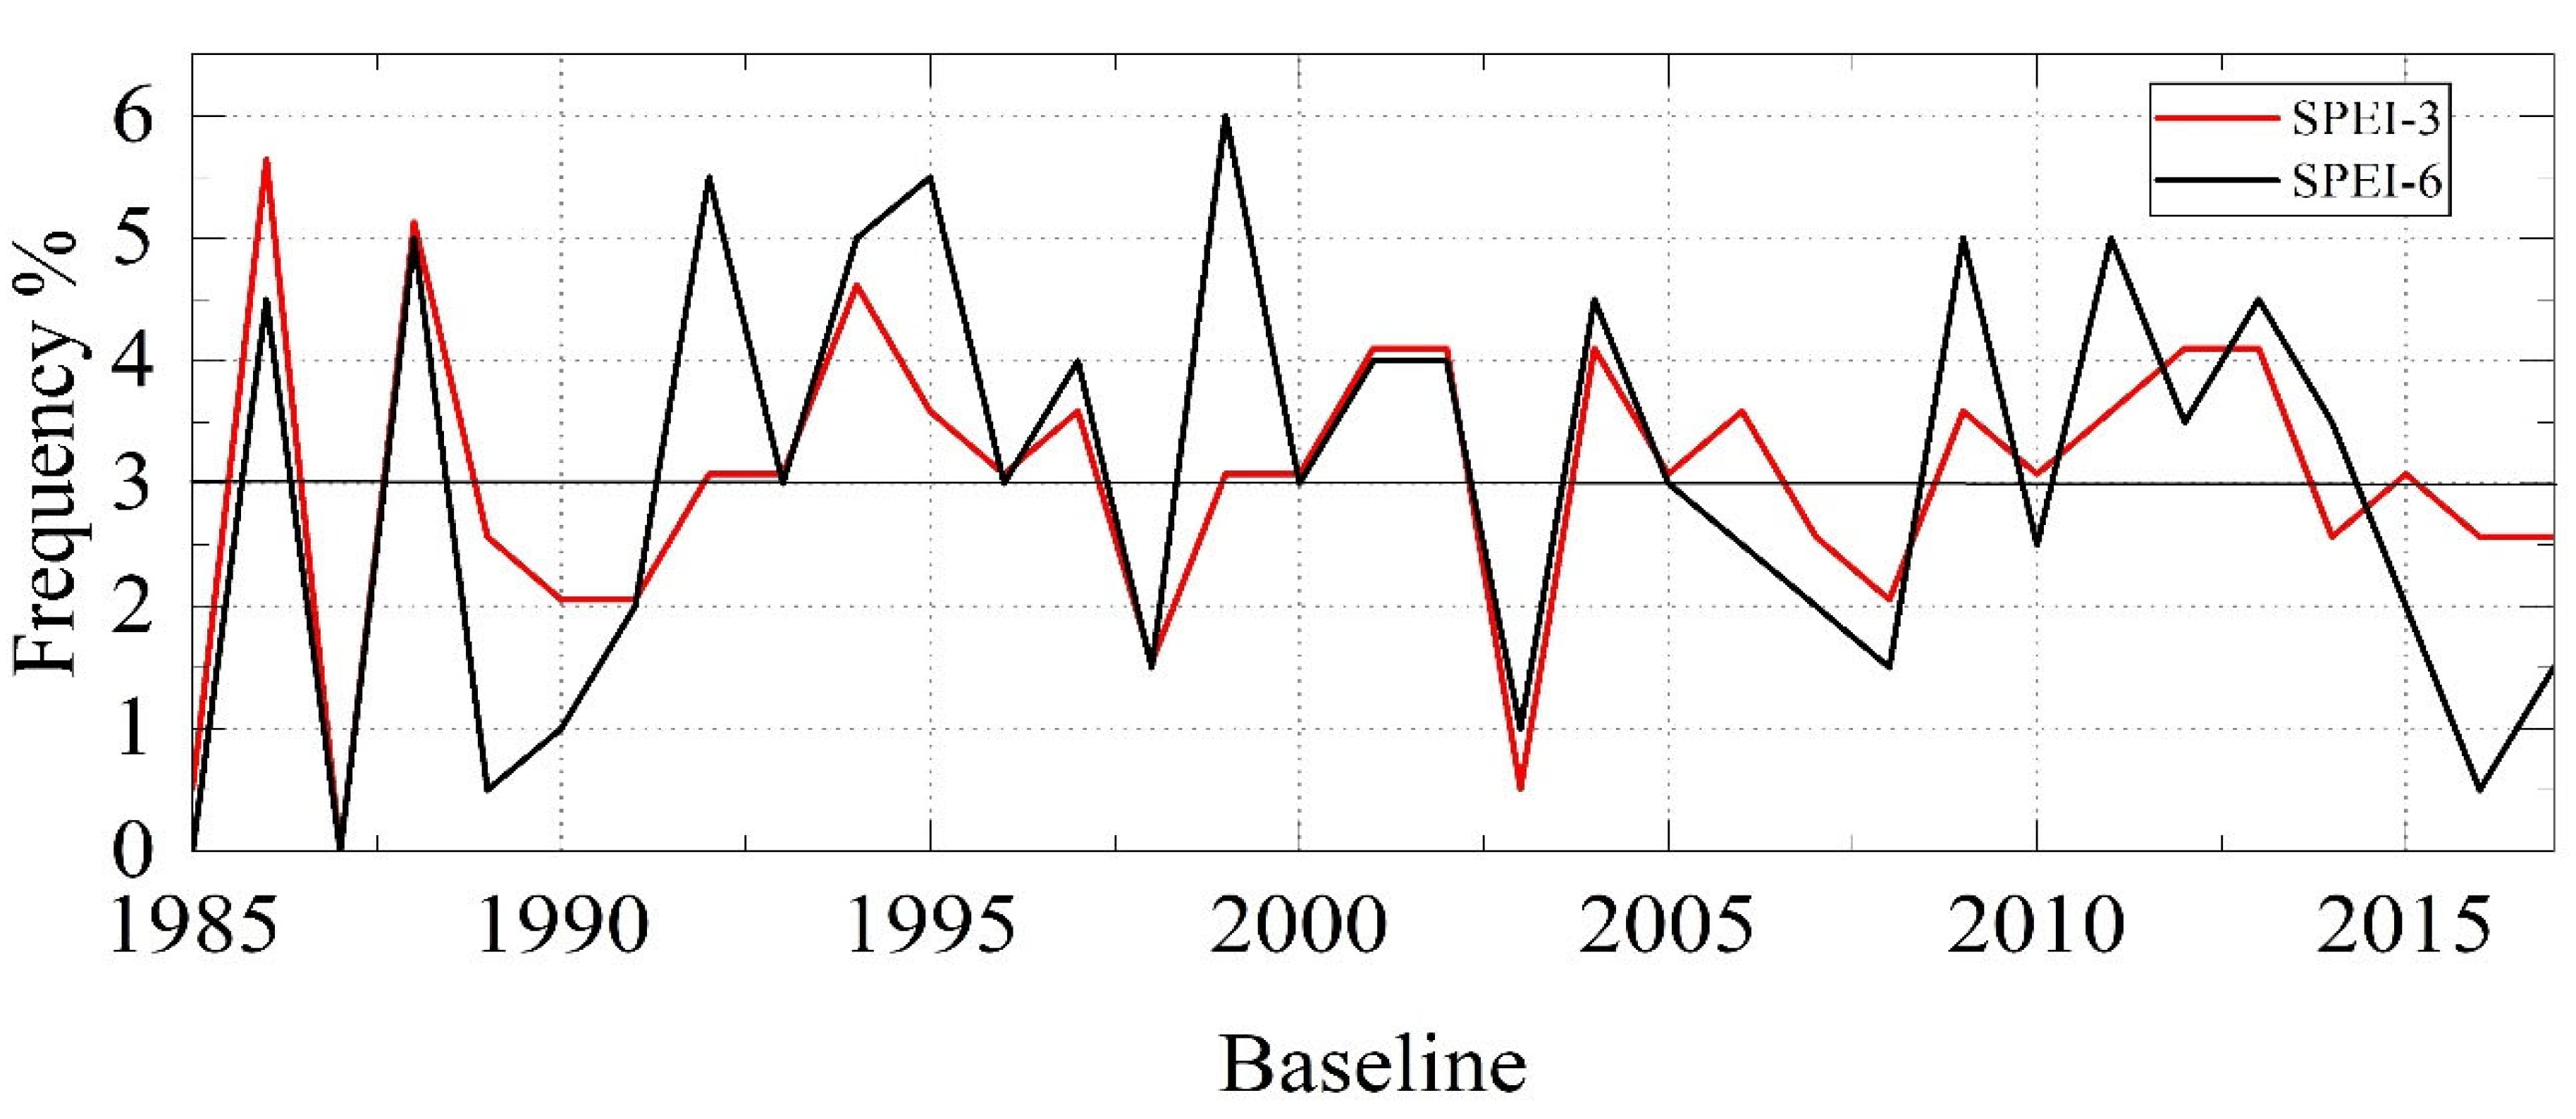
From Figure 6 and Figure 7, drought varies from year to year with logically different frequency rates at both SPEI time scales. For the SPEI-3, the year 1986 experienced more drought than any other year, with 11 dry months and a frequency of 5.65% over 32 years, followed by the year 1988 with 5.10% of frequency and 10 dry months, then 1994 with 9 dry months and 4.61% of frequency, and finally the years 2001, 2002, 2004, 2012 and 2013 with 8 dry months and 4.10% as frequency.
For SPEI-6, we note the same trend with some changes. The year 1991 was the driest, with 12 dry months and 6% frequency, followed by 1992 and 1995, which recorded a 5.5% rate frequency and 11 dry months. In addition, the years 1988, 1994, 2009, and 2011 have 10 dry months and a 5% frequency, followed by the years 1986, 2004, and 2013 which have 9 dry months with a 4.5% frequency, and the years 1997, 2001, and 2002, which have 8 dry months with a 4% frequency. Furthermore, we observed that the Huaibei Pain suffered drought at various times scales within the baseline era, with the effect being most pronounced after the 2000s.
3.3.2. Temporal Variation of SPEI in the Future Period
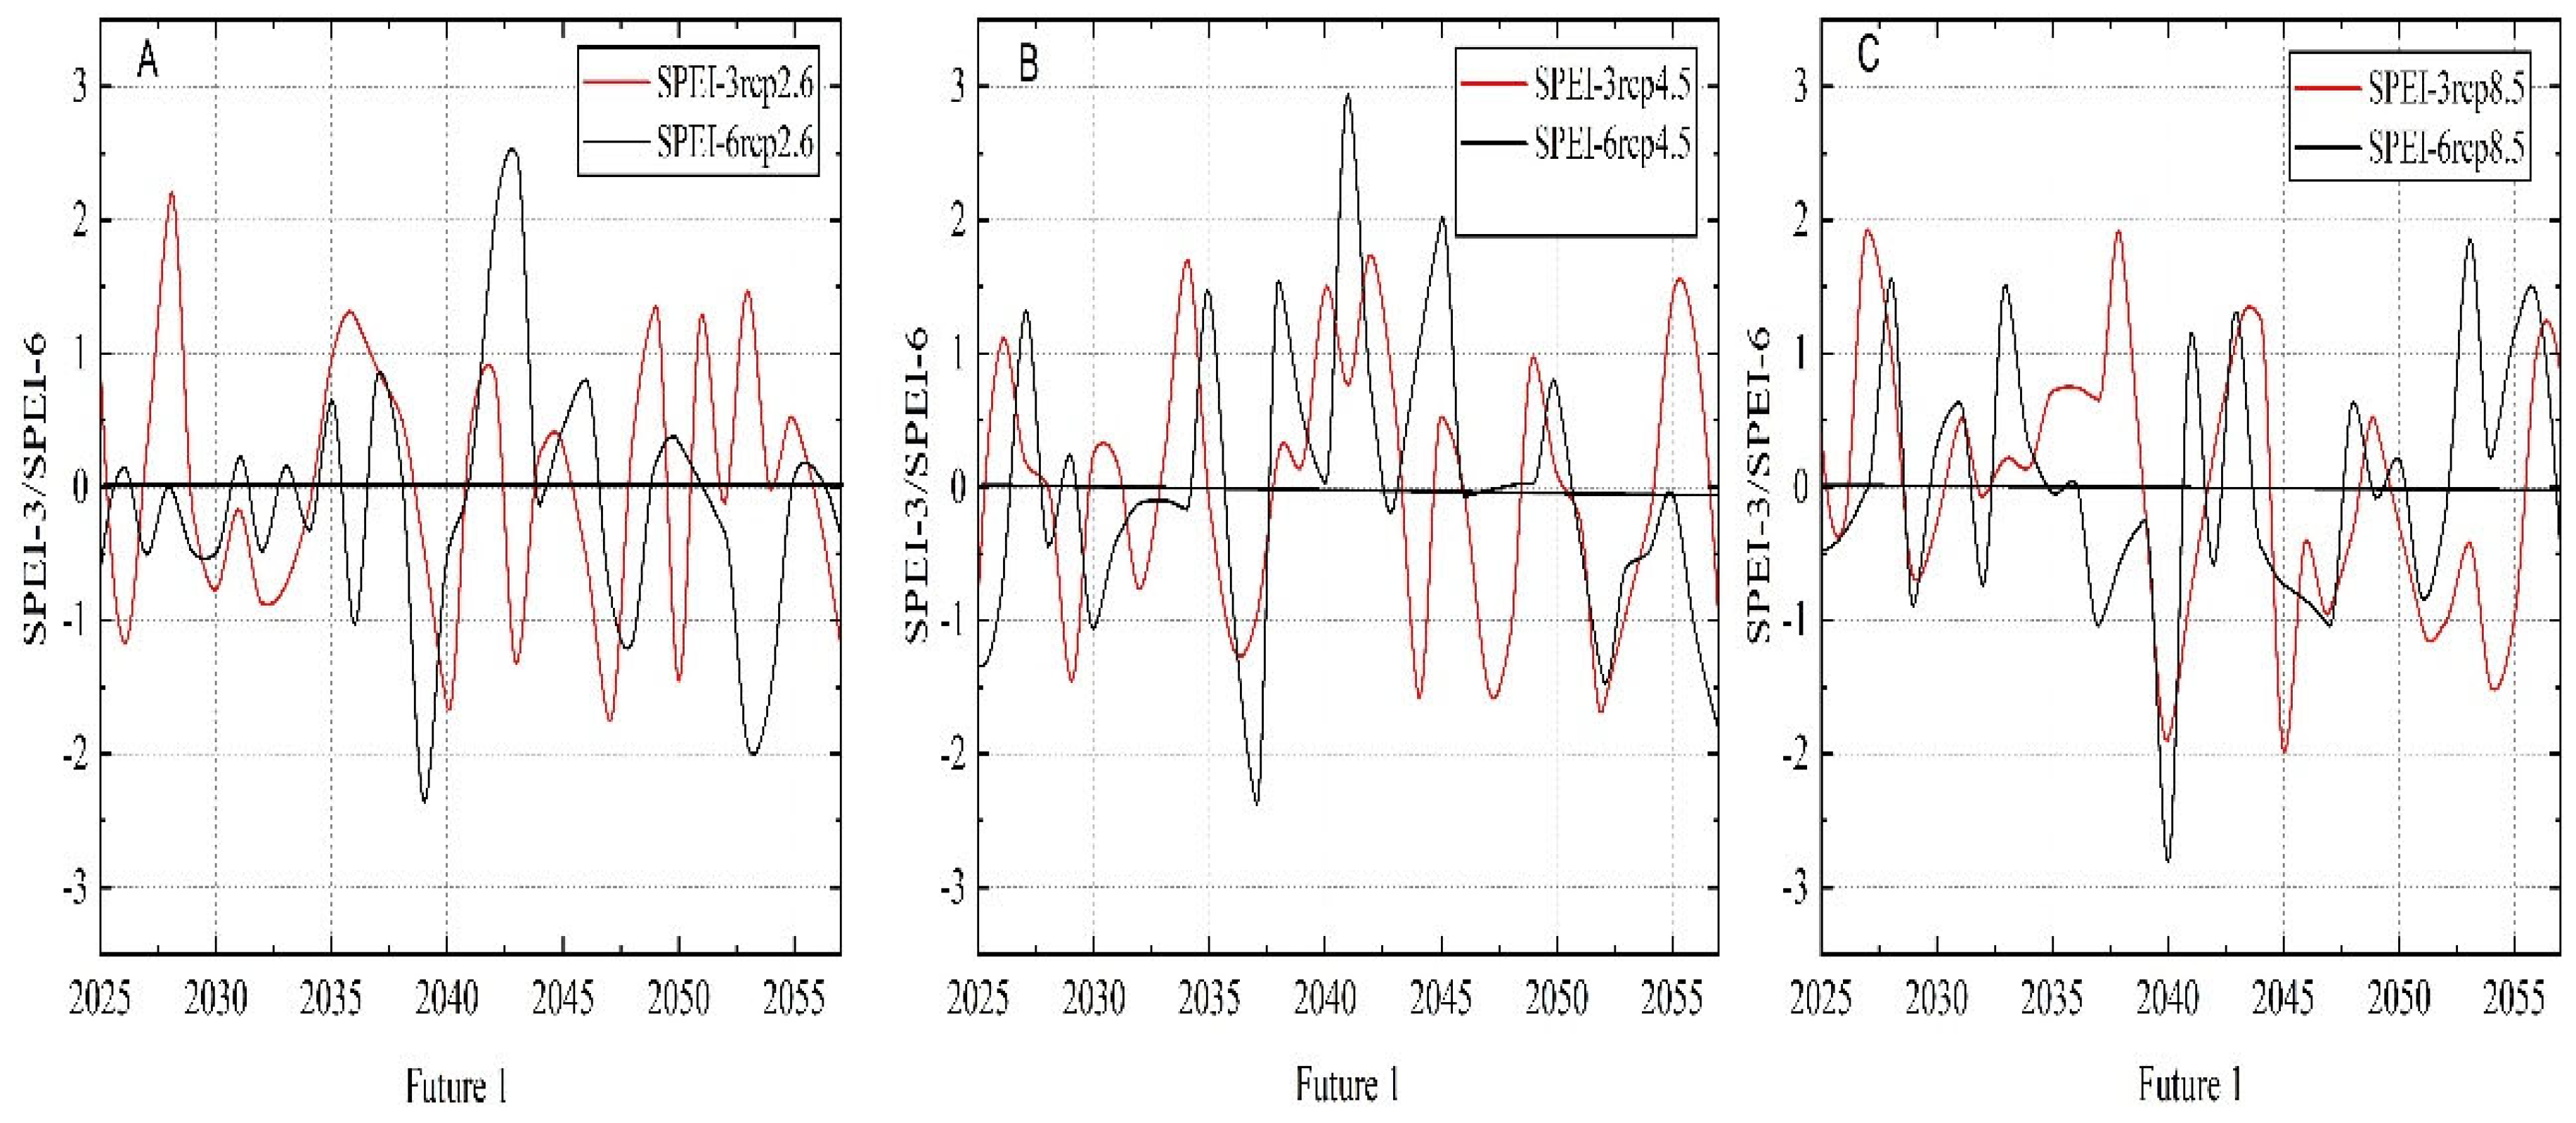
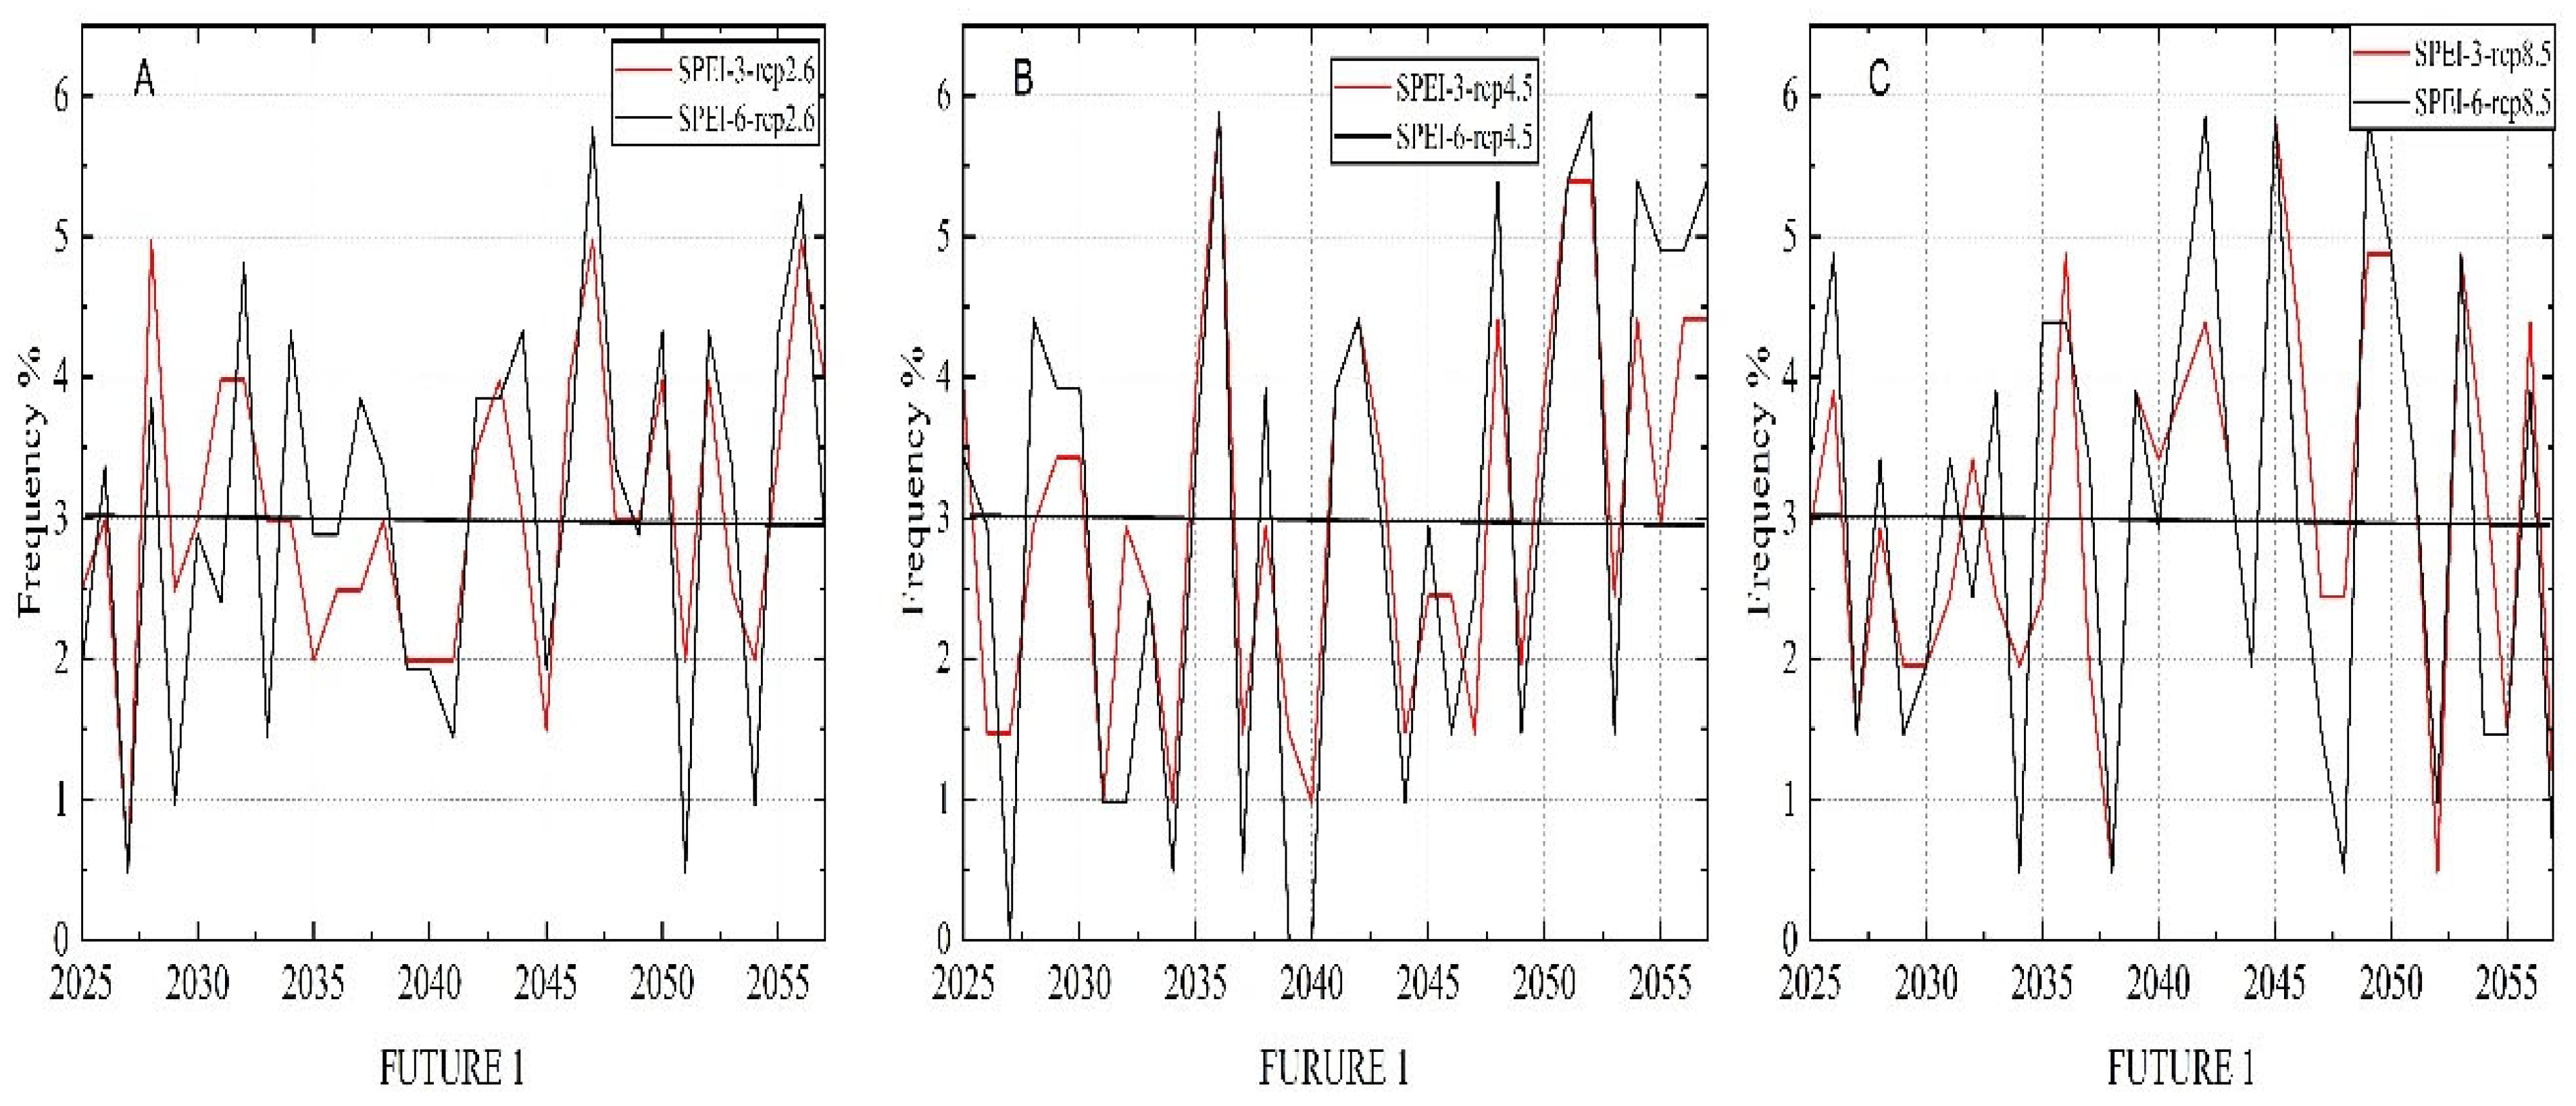
Future predictions of droughts use the same timescales as those used to study spatial scale variations and RCPs. Drought is observed with the same period scales as spatial scale variations and RCPs. Figure 8, Figure 9, Figure 10 and Figure 11 show the temporal distribution and frequency of drought for RCPs 2.6, 4.5, and 8.5 in future-1.
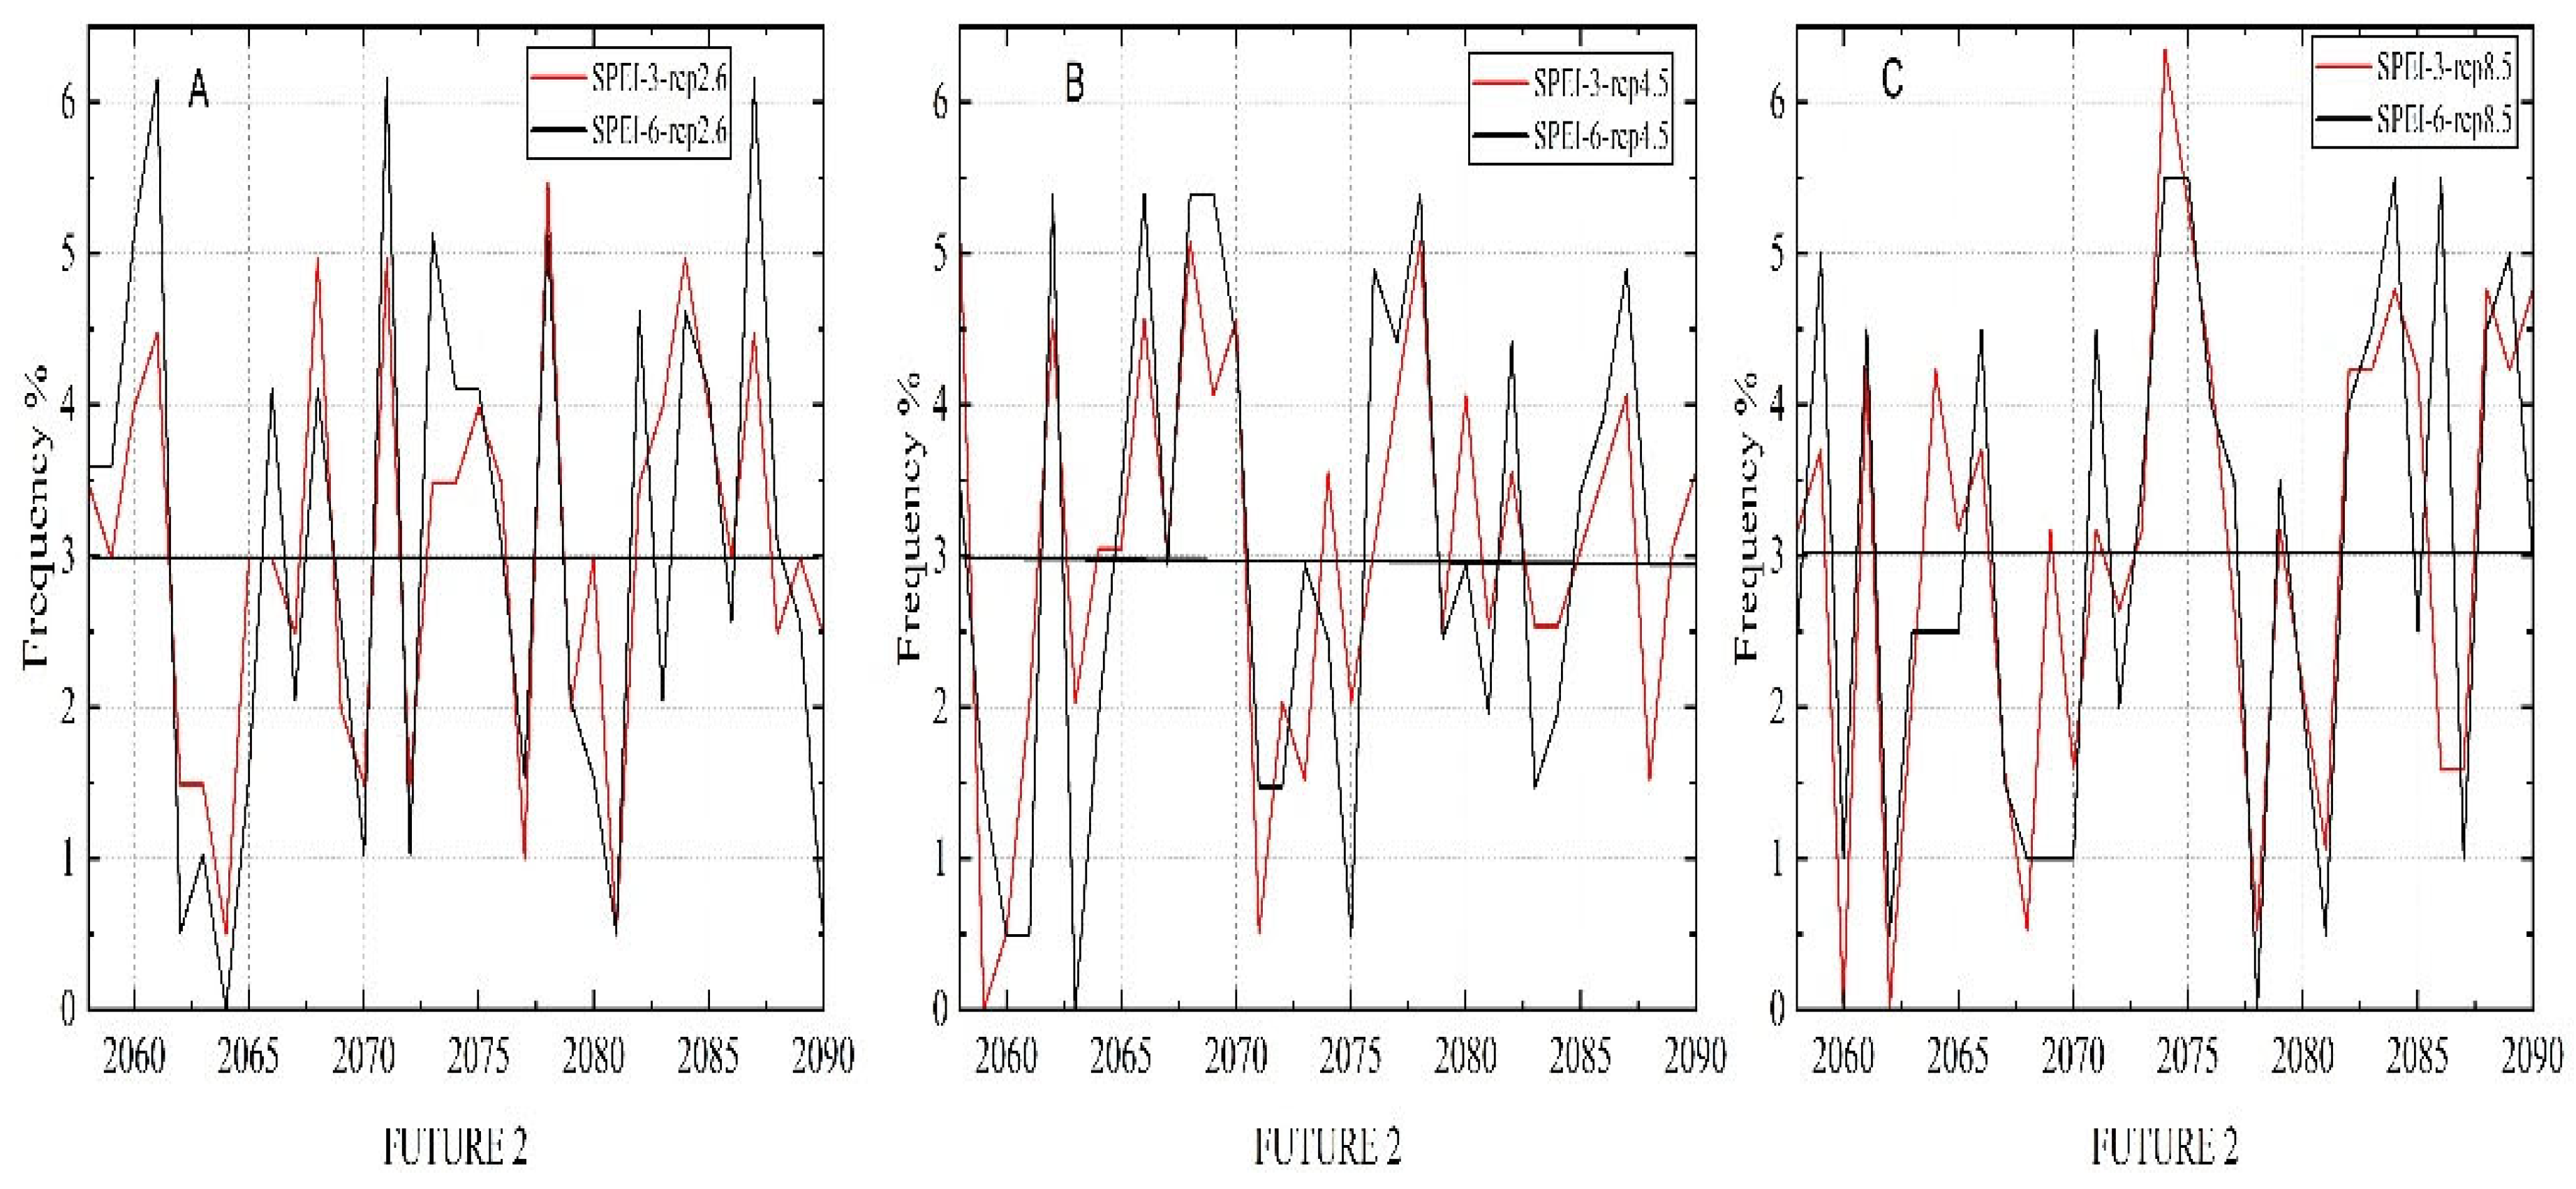
For RCP 2.6, in years 2028, 2047, and 2057 more droughts are indicated with 10 dry months and 4.97% as frequency, followed by years 2031, 2032, 2043, 2046, 2050, and 2057 with 8 dry months and 3.98% as the frequency for SPEI-3. In terms of SPEI-6, 2047 has the driest months, with 12 at a frequency of 5.76%, followed by 2056 with 11 dry months at a frequency of 5.26%, 2032 with a frequency of 4.80% and 10 dry months, and then 2034, 2044, 2050, 2052 and 2055 with 9 dry months at a frequency of 4.32%. For future-2, 2078 is the driest year with 11 dry months and 5.47% as frequency; then we have 2068, 2071, and 2084, which present a frequency of 4.97% and 10 dry months, followed by 2061 and 2087 with 9 dry months and 4.47% frequency and 2060, 2075, 2083 and 2085 with 8 dry months and 3.98% frequency for SPEI-3. For SPEI-6, with 12 months dry and 6.15% of frequency, 2061, 2071, and 2087 show a more serious drought occurrence than all the other years. The years 2060, 2073, and 2078 present 10 dry months and 5.12% frequency, 2084 with 9 dry months and 4.61% frequency, and 2066, 2068, 2078, 2075, and 2085 with 4.10% frequency and 8 dry months.
For RCP 4.5, in future 1 of SPEI-3, we observe dry years that are follows: 2036 with the highest frequency of 5.88% and 12 dry months, 2051 and 2052 followed with 11 dry months and 5.39%, followed by 2042, 2048, 2054, 2056 and 2057 with 4.41% frequency and 9 dry months, and 2025, 2035, 2041 and 2050 with a frequency of 3.92% and 8 dry months. For SPEI-6, in future 1, 2036, and 2056 show the highest drought frequency, 5.88%, with 12 dry months, followed by 2048, 2051, 2054, and 2057, which have 11 dry months and 5.39% frequency, 2055 and 2056, which have 4.90% of frequency, and 10 dry months, 2028 and 2042 with 9 dry months and 4.41% frequency, and 2029, 2030, 2038 and 2041 which have 8 dry months and 3.92% frequency. For SPEI-3 in future 2, the years 2058, 2068, and 2078 depict more drought with 10 dry months and a frequency of 5.07%, 2062, 2066, and 2070 with 4.56% frequency and 9 dry months, 2069, 2077, 2080 and 2087 with 8 dry months and 4.06% frequency. For SPEI-6, 2062, 2066, 2068, 2069, and 2078 will have 11 drought months and 5.39% frequency, 2076 and 2087 will have 10 dry months and 4.90% frequency, 2070, 2077, and 2082 will have 4.41% frequency and 9 dry months, and 2086 will have 8 dry months and 3.92% frequency.
Furthermore, RCP 8.5, in future-1 of SPEI-3, 2045, shows the highest drought frequency of 5.85% and 12 drought months; 2039, 2049, 2050, and 2053 with 10 dry months and 4.87% frequency; 2042 and 2056 with 9 dry months and a frequency of 4.39%; and finally, 2026, 2039, and 2041 with 8 dry months and 3.90% frequency. For future 1 of SPEI-6, 2042 and 2049 showed more drought with 5.85% frequency and 12 dry months; followed by 2026, 2050, and 2053 with 10 dry months and a frequency of 4.87%; then we have a frequency of 4.39% with 9 dry months observed during 2035, 2036; and lastly, years 2033, 2039 and 2056 with 8 dry months and 3.90% frequency. For future-2, a frequency rate of 6.34% was observed during 2074 with 12 dry months, followed by the year 2075 with 10 dry months and 5.29% frequency; 2084, 2088, and 2090 with a rate of 4.76% and 9 dry months; 2061, 2064, 2076, 2083, 2085 and 2089 with 8 dry months and 4.23%. For SPEI-3 and SPEI-6, the highest frequency rate is observed in 2074, 2075, 2084, and 2086 with 5.5% and 11 dry months; followed by 2059, and 2089 with 10 dry months and 5% frequency; 2061, 2066, 2071, 2083 and 2088 with 9 dry months and 4.5% rate of drought frequency; and finally, 2076 and 2082 with 8 dry months and 4% of frequency.
3.4. Correlation and Trend Analysis of SPI and SPEI
3.4.1. Person Correlation Coefficients
A positive correlation was observed between both time scales (SPEI-3 and SPEI-6, Table 3). The RCP 4.5 future 1 presents the largest value (0.72) followed by the baseline period and RCP 8.5 future-2 (0.69); RCP 4.5 future 2 (0.68), RCP 8.5 future-1 (0.66); and finally, the RCP 2.6 future 1 and future 2 which present a small value (0.63).
3.4.2. Sen’s Slope Estimation Results
Based on Sen’s Slope magnitude, negative and positive trends were found, as shown in Table 4. In the baseline period, SPEI-3 shows a negative trend, and SPEI-6 shows a positive trend. Except for SPEI-6 of RCP 4.5, which is positive for future 1, and SPEI-6 of baseline, all other RCPs (4.5 and 8.5) have a negative trend for futures 1 and 2. For future 1, we have one negative value for RCP 2.6 while the others are positive.
3.5. Discussion
In this study, the SPEI index used for monitoring drought in the Huaibei Plain is one of the most reliable tools because it is recommended by the WMO (World Meteorological Organization). SPEI index is part of standard indices chosen by WMO to monitor drought worldwide. In addition, we used data from 17 meteorological stations and a general circulation model HadGEM2-AO and three Representative Concentration Pathways (RCPs, RCP 2.6, RCP 2.6, RCP 4.5, and RCP 8.5). A downscaling method, quantile mapping (QM) has been used. The method allows downscaling the global data to regional data. The process help for better accuracy of the data. We analyzed and compared the spatial and temporal variations of drought using SPEI-3 and SPEI-6 in two different periods (baseline 1985–2017 and future 2025–2090) in order to better understand the performance of the indices (SPEI) in monitoring drought in the baseline and future with the context of climate change. Considering that the data we used are different and due to different parameters, it is inevitable that there are differences between SPEI results in baseline and future periods and also some similarities.
SPEI found most drought events in the future rather than the baseline period. The future period presents a stronger Pearson correlation than the baseline period. In contrast to the future periods, we saw that drought was present in every period during the baseline period. In the future, Future-1 will be dry while Future-2 will be wet (Figure 4 and Figure 5). In addition, the SPEI index is more suitable for detecting future drought than the baseline. However, even if there is a difference between SPEI results in monitoring drought in the baseline and future, we also have similarities.
Here we observed that in the future and baseline period, SPEI detected positive and negative trends in both time scales, 3 and 6 months. In the baseline and future periods, SPEI-3 and SPEI-6 recognized drought almost similarly.
SPEI fluctuations at each time scale were somewhat similar in the baseline and future periods from the perspectives of time scale and period. However, it is important to discuss if the threshold selection of SPEI can consistently identify and compare drought events for baseline and future periods.
Due to the difference in climatic conditions in many different regions and climate change, there will always be differences between SPEI indices, and their applicability in monitoring drought has been discussed for some time [40,51,52]. SPEI describes drought variations by considering precipitation and evapotranspiration parameters, and in the global warming context and climate change, it is more suitable for monitoring drought in arid and semiarid areas [1,52,53]. SPEI index is very suitable for drought monitoring. The SPEI results in this study demonstrate the index’s applicability in the Huaibei Plain, the area of study. SPEI detected drought in future and baseline periods and is accurate according to precipitation and evapotranspiration.
Using the SPEI-3 and SPEI-6 indexes to monitor droughts in two different time scales and two different periods (baseline and future) in the Huaibei Plain allowed us to have a good understanding of spatial and temporal variations of agricultural droughts in our study area. In this study, SPEI-3 and SPEI-6 enabled us to observe the droughts during our two study periods and determine that most agricultural droughts will affect our study area more in future-1 rather than future-2.
The results obtained are of great importance because of the status of our study area as an agricultural plain. They will allow anticipation of the decision-making of the political authorities. With the actual climate change phenomenon, these results obtained are those expected. However, in the future other parameters may be added to the current ones. For example, changes in temperature, showers, and lack of rainfall can be a handicap in the case of the use of the SPEI index in the future.
Indeed, these droughts will harm human beings, the environment, agriculture, and the economy. Climate variability provokes meteorological drought (precipitation reduction and evaporation increase), agricultural drought with (soil water decrease, evaporation increase, vegetation stress, and reduced crop yields), and hydrological drought (precipitation reduction, evaporation increase, soil water decrease, reduced streamflow, reduced groundwater and inflows to lake, reservoirs, wetlands). All of these aforementioned results have economic, social, and ecological impacts. This study used SPEI-3 and SPEI-6 to determine the applicability of the SPEI index in monitoring agricultural drought in the Huaibei Plain.
Drought studies have been conducted in the area by other researchers [28,29,33] with different tools. However, similar to us, they detected droughts in the plain. In addition, using this index helped us analyze and compare the spatial and temporal variations of drought at different time scales and periods to determine the index’s performance in Huaibei Plain to help decision-makers.
A study taking into account all types of drought, namely meteorological, agricultural, and hydrological with a higher SPEI threshold, would also be of great importance. Therefore, the authorities must put in place alternatives to deal with the phenomenon in the future.
4. Conclusions
After calculating the SPEI 3 and 6 months’ time scale at 17 weather stations in the Huaibei Plain from 1985 to 2017, using the general circulation model HadGEM2-AO, and three Representative Concentration Pathways (RCPs, RCP 2.6, RCP 4.5, and RCP 8.5) from 2025 to 2190, the results compared the and analyzed the SPEI performance in monitoring the spatial and temporal variations of drought in the baseline and future periods, compared which period is more alarming, and discussed their correlation, comparing and analyzing the SPEI performance in monitoring drought of temporal variations in the baseline and future periods, comparing which period is more alarming, and discussing their correlation and trend in Huaibei Plain, the main findings are as follows:
- (1)
- In general, SPEI is very suitable for monitoring drought in the Huaibei Plain, which shows the importance of incorporating evapotranspiration data assessment of drought occurrence. Between both periods (baseline and future), more drought events were detected in the future. In future-1, SPEI detected more agricultural droughts than in future-2 and baseline.
- (2)
- Between future and baseline, a Person correlation showed a strong correlation between SPEI in baseline and future periods. The correlation is higher for agricultural drought in future-1 of RCP 4.5
- (3)
- Sen’s Slope trend estimator showed a trend between both periods. SPEI detected a negative and positive trend, as shown in the results.
- (4)
- As the SPEI’s applicability in the Huaibei Plain was examined for the baseline and future periods, it became clear that using the 3 and 6 months SPEI time scale had its own benefits and could monitor regional drought in general and the Huaibei Plain in particular.
This study provides a good understanding and reference for evaluating and selecting indexes, GCM model, and RCPs in future drought monitoring in the Huaibei Plain by using the SPEI drought index at three and six months and the HadGEM2-AO model. This will assist in better managing and accessing water availability in climate change in the Huaibei Plain.
Supplementary Materials
The supporting information can be downloaded at: https://www.mdpi.com/article/10.3390/atmos14050860/s1. Figure S1. Monthly average temperature and precipitation between 1985–2017. “P” indicates monthly precipitation, and “T” the monthly temperature; Figure S2. Annual average temperature and precipitation during the period 1985–2017. In these charts, A indicates annual precipitation, and B is the annual temperature.
Author Contributions
Conceptualization, O.B., Y.Z. and H.L.; Funding acquisition, H.L.; Methodology, O.B.; Project administration, Y.Z.; Resources, Y.Z.; Software, O.B. and T.C.; Supervision, Y.Z.; Validation, Y.Z. and H.L.; Writing—original draft, O.B.; Writing—review & editing, O.B., A.O., K.G.G., K.B.M.O.Y. and S.B. All authors have read and agreed to the published version of the manuscript.
Funding
This work was supported by the National Key Research and Development Program (grant Nos. 2019YFC1510504); NNSF (grant Nos. 41830752, 41961134003, and 42071033).
Conflicts of Interest
The authors declare that they have no known competing financial interests or personal relationships that could have appeared to influence the work reported in this paper.
References
- Tirivarombo, S.; Osupile, D.; Eliasson, P. Drought monitoring and analysis: Standardised Precipitation Evapotranspiration Index (SPEI) and Standardised Precipitation Index (SPI). Phys. Chem. Earth Parts A/B/C 2018, 106, 1–10. [Google Scholar] [CrossRef]
- Kim, B.S.; Chang, I.G.; Sung, J.H.; Han, H.J. Projection in Future Drought Hazard of South Korea Based on RCP Climate Change Scenario 8.5 Using SPEI. Adv. Meteorol. 2016, 2016, 4148710. [Google Scholar] [CrossRef]
- Kwon, M.; Sung, J.H. Changes in Future Drought with HadGEM2-AO Projections. Water 2019, 11, 312. [Google Scholar] [CrossRef]
- Seneviratne, S.I.; Lehner, I.; Gurtz, J.; Teuling, A.J.; Lang, H.; Moser, U.; Grebner, D.; Menzel, L.; Schroff, K.; Vitvar, T.; et al. Swiss prealpine Rietholzbach research catchment and lysimeter: 32 year time series and 2003 drought event. Water Resour. Res. 2012, 48. [Google Scholar] [CrossRef]
- Hayes, M.J.; Svoboda, M.D.; Wiihite, D.A.; Vanyarkho, O.V. Monitoring the 1996 Drought Using the Standardized Precipitation Index. Bull. Am. Meteorol. Soc. 1999, 80, 429–438. [Google Scholar] [CrossRef]
- Vicente-Serrano, S.M.; Beguería, S.; López-Moreno, J.I. A Multiscalar Drought Index Sensitive to Global Warming: The Standardized Precipitation Evapotranspiration Index. J. Clim. 2010, 23, 1696–1718. [Google Scholar] [CrossRef]
- Zou, X.; Zhai, P.; Zhang, Q. Variations in droughts over China: 1951–2003. Geophys. Res. Lett. 2005, 32. [Google Scholar] [CrossRef]
- Tan, C.; Yang, J.; Li, M. Temporal-Spatial Variation of Drought Indicated by SPI and SPEI in Ningxia Hui Autonomous Region, China. Atmosphere 2015, 6, 1399–1421. [Google Scholar] [CrossRef]
- Palmer, W.C. Meteorological Drought; US Department of Commerce, Weather Bureau: Washington, DC, USA, 1965; Volume 30. [Google Scholar]
- McKee, T.B.; Doesken, N.J.; Kleist, J. The relationship of drought frequency and duration to time scales. In Proceedings of the 8th Conference on Applied Climatology, Boston, MA, USA, 17–22 January 1993. [Google Scholar]
- Anshuka, A.; van Ogtrop, F.F.; Vervoort, R.W. Drought forecasting through statistical models using standardised precipitation index: A systematic review and meta-regression analysis. Nat. Hazards 2019, 97, 955–977. [Google Scholar] [CrossRef]
- Belayneh, A.; Adamowski, J. Drought forecasting using new machine learning methods. J. Water Land Dev. 2013, 18, 3–12. [Google Scholar] [CrossRef]
- Uddin, M.; Eibek, K.U.; Nasrin, Z.M. A comprehensive statistical assessment of drought indices to monitor drought status in Bangladesh. Arab. J. Geosci. 2020, 13, 323. [Google Scholar] [CrossRef]
- Wang, K.-Y.; Li, Q.-F.; Yang, Y.; Zeng, M.; Li, P.-C.; Zhang, J.-X. Analysis of spatio-temporal evolution of droughts in Luanhe River Basin using different drought indices. Water Sci. Eng. 2015, 8, 282–290. [Google Scholar] [CrossRef]
- Oki, T.; Kanae, S.J. Global hydrological cycles and world water resources. Science 2006, 313, 1068–1072. [Google Scholar] [CrossRef] [PubMed]
- Gurrapu, S.; Chipanshi, A.; Sauchyn, D. Comparison of the SPI and SPEI on predicting drought conditions and streamflow in the Canadian prairies. In Proceedings of the 28th Conference on Hydrology, Atlanta, GA, USA, 2–6 February 2014; American Meteorological Society: Atlanta, GA, USA, 2014. [Google Scholar]
- Jasim, A.I.; Awchi, T.A. Regional meteorological drought assessment in Iraq. Arab. J. Geosci. 2020, 13, 284. [Google Scholar] [CrossRef]
- Svoboda, M.D.; Fuchs, B.A. Handbook of Drought Indicators and Indices; World Meteorological Organization: Geneva, Switzerland, 2016. [Google Scholar]
- Zhai, J.; Su, B.; Krysanova, V.; Vetter, T.; Gao, C.; Jiang, T. Spatial Variation and Trends in PDSI and SPI Indices and Their Relation to Streamflow in 10 Large Regions of China. J. Clim. 2010, 23, 649–663. [Google Scholar] [CrossRef]
- Vicente-Serrano, S.M.; Beguería, S.; Lorenzo-Lacruz, J.; Camarero, J.J.; Lopez-Moreno, I.; Azorin-Molina, C.; Revuelto, J.; Morán-Tejeda, E.; Sanchez-Lorenzo, A. Performance of Drought Indices for Ecological, Agricultural, and Hydrological Applications. Earth Interact. 2012, 16, 1–27. [Google Scholar] [CrossRef]
- Nedealcov, M.; Răileanu, V.; Sîrbu, R.; Cojocari, R. The Use Of Standardized Indicators (SPI And SPEI) In Predicting Droughts Over The Republic Of Moldova Territory. Present Environ. Sustain. Dev. 2015, 9, 149–158. [Google Scholar] [CrossRef]
- Yang, Q.; Li, M.; Zheng, Z.; Ma, Z. Regional applicability of seven meteorological drought indices in China. Sci. China Earth Sci. 2017, 60, 745–760. [Google Scholar] [CrossRef]
- Liu, X.; Zhu, X.; Pan, Y.; Bai, J.; Li, S. Performance of different drought indices for agriculture drought in the North China Plain. J. Arid. Land 2018, 10, 507–516. [Google Scholar] [CrossRef]
- Qaisrani, Z.N.; Nuthammachot, N.; Techato, K. Drought monitoring based on Standardized Precipitation Index and Standardized Precipitation Evapotranspiration Index in the arid zone of Balochistan province, Pakistan. Arab. J. Geosci. 2021, 14, 11. [Google Scholar] [CrossRef]
- Rascón, J.; Angeles, W.G.; Huatangari, L.Q.; Oliva, M.; Gurbillón, M.B. Dry and Wet Events in Andean Populations of Northern Peru: A Case Study of Chachapoyas, Peru. Front. Environ. Sci. 2021, 9, 54. [Google Scholar] [CrossRef]
- Chen, M.; Ning, S.; Cui, Y.; Jin, J.; Zhou, Y.; Wu, C. Quantitative Assessment and Diagnosis for Regional Agricultural Drought Resilience Based on Set Pair Analysis and Connection Entropy. Entropy 2019, 21, 373. [Google Scholar] [CrossRef] [PubMed]
- Wei, Y.; Jin, J.; Jiang, S.; Ning, S.; Cui, Y.; Zhou, Y. Simulated Assessment of Summer Maize Drought Loss Sensitivity in Huaibei Plain, China. Agronomy 2019, 9, 78. [Google Scholar] [CrossRef]
- Yuan, H.; Cui, Y.; Ning, S.; Jiang, S.; Yuan, X.; Tang, G. Estimation of maize evapotraspiration under drought stress-A case study of Huaibei Plain, China. PLoS ONE 2019, 14, e0223756. [Google Scholar] [CrossRef] [PubMed]
- Chen, M.; Ning, S.; Jin, J.; Cui, Y.; Wu, C.; Zhou, Y. Risk Assessment of Agricultural Drought Disaster on the Huaibei Plain of China Based on the Improved Connection Number and Entropy Information Diffusion Method. Water 2020, 12, 1089. [Google Scholar] [CrossRef]
- Gou, Q.; Zhu, Y.; Horton, R.; Lü, H.; Wang, Z.; Su, J.; Cui, C.; Zhang, H.; Wang, X.; Zheng, J.; et al. Effect of climate change on the contribution of groundwater to the root zone of winter wheat in the Huaibei Plain of China. Agric. Water Manag. 2020, 240, 106292. [Google Scholar] [CrossRef]
- Zhu, Y.; Ren, L.; Lü, H.; Drake, S.; Yu, Z.; Wang, Z.; Fang, X.; Yuan, F. Effect of Water Table Depth on Growth and Yield of Soybean Yudou 16. J. Hydrol. Eng. 2013, 18, 1070–1076. [Google Scholar] [CrossRef]
- Zhu, Y.; Ren, L.; Horton, R.; Lü, H.; Chen, X.; Jia, Y.; Wang, Z.; Sudicky, E.A. Estimating the contribution of groundwater to rootzone soil moisture. Hydrol. Res. 2013, 44, 1102–1113. [Google Scholar] [CrossRef]
- Gou, Q.; Zhu, Y.; Lü, H.; Horton, R.; Yu, X.; Zhang, H.; Wang, X.; Su, J.; Liu, E.; Ding, Z.; et al. Application of an improved spatio-temporal identification method of flash droughts. J. Hydrol. 2022, 604, 127224. [Google Scholar] [CrossRef]
- Pachauri, R.; Meyer, L. Climate Change 2014: Synthesis Report. Contribution of Working Groups I, II and III to the Fifth Assessment Report of the Intergovernmental Panel on Climate Change; IPCC: Geneva, Switzerland, 2014. [Google Scholar]
- Baek, H.-J.; Lee, J.; Lee, H.-S.; Hyun, Y.-K.; Cho, C.; Kwon, W.-T.; Marzin, C.; Gan, S.-Y.; Kim, M.-J.; Choi, D.-H.; et al. Climate change in the 21st century simulated by HadGEM2-AO under representative concentration pathways. Asia Pac. J. Atmos. Sci. 2013, 49, 603–618. [Google Scholar] [CrossRef]
- Panofsky, H.A.; Brier, G.W. Some Applications of Statistics to Meteorology; Earth and Mineral Sciences Continuing Education; College of Earth and Mineral Sciences: Philadelphia, PA, USA, 1968. [Google Scholar]
- Wood, A.; Leung, L.R.; Sridhar, V.; Lettenmaier, D.P. Hydrologic Implications of Dynamical and Statistical Approaches to Downscaling Climate Model Outputs. Clim. Change 2004, 62, 189–216. [Google Scholar] [CrossRef]
- Piani, C.; Haerter, J.O.; Coppola, E. Statistical bias correction for daily precipitation in regional climate models over Europe. Theor. Appl. Clim. 2010, 99, 187–192. [Google Scholar] [CrossRef]
- Cannon, A.J.; Sobie, S.R.; Murdock, T.Q. Bias Correction of GCM Precipitation by Quantile Mapping: How Well Do Methods Preserve Changes in Quantiles and Extremes? J. Clim. 2015, 28, 6938–6959. [Google Scholar] [CrossRef]
- Li, W.; Duan, L.; Wang, W.; Wu, Y.; Liu, T.; Quan, Q.; Chen, X.; Yin, H.; Zhou, Q. Spatiotemporal characteristics of drought in a semi-arid grassland over the past 56 years based on the Standardized Precipitation Index. Meteorol. Atmos. Phys. 2021, 133, 41–54. [Google Scholar] [CrossRef]
- Thornthwaite, C.W. An Approach toward a Rational Classification of Climate. Geogr. Rev. 1948, 38, 55–94. [Google Scholar] [CrossRef]
- Hargreaves, G.H. Defining and using reference evapotranspiration. J. Irrig. Drain. Eng. 1994, 120, 1132–1139. [Google Scholar] [CrossRef]
- Li, W.-G.; Yi, X.; Hou, M.-T.; Chen, H.-L.; Chen, Z.-L. Standardized precipitation evapotranspiration index shows drought trends in China. Chin. J. Eco-Agric. 2012, 20, 643–649. [Google Scholar] [CrossRef]
- Li, Y.; Wang, Z.; Zhang, Y.; Li, X.; Huang, W. Drought variability at various timescales over Yunnan Province, China: 1961–2015. Theor. Appl. Clim. 2019, 138, 743–757. [Google Scholar] [CrossRef]
- Yue, S.; Pilon, P.; Cavadias, G.J. Power of the Mann–Kendall and Spearman’s rho tests for detecting monotonic trends in hydrological series. J. Hydrol. 2002, 259, 254–271. [Google Scholar] [CrossRef]
- Gocic, M.; Trajkovic, S. Change, Analysis of changes in meteorological variables using Mann-Kendall and Sen’s slope estimator statistical tests in Serbia. Glob. Planet. Chang. 2013, 100, 172–182. [Google Scholar] [CrossRef]
- Kendall, M.G. Rank Correlation Methods. 1948. Available online: https://scirp.org/reference/ReferencesPapers.aspx?ReferenceID=2275550 (accessed on 20 March 2023).
- Sen, P.K. Estimates of the regression coefficient based on Kendall’s tau. J. Am. Stat. Assoc. 1968, 63, 1379–1389. [Google Scholar] [CrossRef]
- Drápela, K.; Drápelová, B. Application of Mann-Kendall test and the Sen’s slope estimates for trend detection in deposition data from Bílý Kříž (Beskydy Mts., the Czech Republic) 1997–2010. Beskydy 2011, 4, 133–146. [Google Scholar]
- Yang, L.; Tian, J.; Fu, Y.; Zhu, B.; He, X.; Gao, M.; Odamtten, M.T.; Kong, R.; Zhang, Z. Will the arid and semi-arid regions of Northwest China become warmer and wetter based on CMIP6 models? Hydrol. Res. 2022, 53, 29–50. [Google Scholar] [CrossRef]
- Vicente-Serrano, S.M.; Chura, O.; López-Moreno, J.I.; Azorin-Molina, C.; Sanchez-Lorenzo, A.; Aguilar, E.; Moran-Tejeda, E.; Trujillo, F.; Martínez, R.; Nieto, J.J. Spatio-temporal variability of droughts in Bolivia: 1955–2012. Int. J. Clim. 2015, 35, 3024–3040. [Google Scholar] [CrossRef]
- Labudová, L.; Labuda, M.; Takáč, J. Comparison of SPI and SPEI applicability for drought impact assessment on crop production in the Danubian Lowland and the East Slovakian Lowland. Theor. Appl. Clim. 2017, 128, 491–506. [Google Scholar] [CrossRef]
- Huang, J.; Xue, Y.; Sun, S.; Zhang, J. Spatial and temporal variability of drought during 1960–2012 in Inner Mongolia, north China. Quat. Int. 2015, 355, 134–144. [Google Scholar] [CrossRef]
Figure 1.
Concept of this study.

Figure 2.
The study area location (the Huaibei Plain, China).

Figure 3.
Spatial distribution of SPEI and SPI of draught years 2001, 2002, 2009, and 2012. (A1–A4) mean SPEI-3 of the years 2001, 2002, 2009, and 2012. (B1–B4) mean SPI-3 of the years 2001, 2002, 2009, and 2012. (C1–C4) mean SPEI-6 of the years 2001, 2002, 2009, and 2012. (D1–D4) mean SPI-6 of the years 2001, 2002, 2009, and 2012.

Figure 4.
Spatial variation of SPEI at different time scales and time periods: (A) SPEI-3 1985–1989; (B) SPEI-3 1990–1999; (C) SPEI-3 2000–2009; (D) SPEI-3 2010–2017 and (E) SPEI-6 1985–1989; (F) SPEI-6 1990–1999; (G) SPEI-G 2000–2009; (H) SPEI-6 2010–2017.
Figure 4.
Spatial variation of SPEI at different time scales and time periods: (A) SPEI-3 1985–1989; (B) SPEI-3 1990–1999; (C) SPEI-3 2000–2009; (D) SPEI-3 2010–2017 and (E) SPEI-6 1985–1989; (F) SPEI-6 1990–1999; (G) SPEI-G 2000–2009; (H) SPEI-6 2010–2017.

Figure 5.
Spatial variation of SPEI at different time scales, time periods, and RCPs: (A1) SPEI-3 2025–2057 RCP 2.6; (A2) SPEI-3 2058–2090 RCP 2.6; (A3) SPEI-6 2025–2057 RCP 2.6; (A4) SPEI-6 2058–2090 RCP 2.6. (B1) SPEI-3 2025–2057 RCP 4.5; (B2) SPEI-3 2058–2090 RCP 4.5; (B3) SPEI-6 2025–2057 RCP 4.5; (B4) SPEI-6 2058–2090 RCP 4.5. (C1) SPEI-3 2025–2057 RCP 8.5; (C2) SPEI-3 2058–2090 RCP 8.5; (C3) SPEI-6 2025–2057 RCP 8.5; (C4) SPEI-6 2058–2090 RCP 8.5.

Figure 6.
Results of SPEI-3 and SPEI-6. SPEI-3 (red color) is the Standardized Precipitation Evapotranspiration Index, and SPEI-6 (black color) is the Standardized Precipitation Evapotranspiration Index. The number 3 means three months, and the number 6 means six months; they were chosen to detect agricultural drought.

Figure 7.
Results of SPEI-3 and SPEI-6 drought frequency during baseline (1985–2017). SPEI-3 (red color) is the frequency, and SPEI-6 (black color) is the frequency.
Figure 7.
Results of SPEI-3 and SPEI-6 drought frequency during baseline (1985–2017). SPEI-3 (red color) is the frequency, and SPEI-6 (black color) is the frequency.

Figure 8.
Results of SPEI-3 and SPEI-6. The red color is the Standardized Precipitation Evapotranspiration Index, and the black color is the Standardized Precipitation Evapotranspiration Index of SPEI-3 and SPEI-6 of RCP 2.6 The number 3–6 means three and six months was chosen to detect the agricultural drought. (A–C) mean respectively RCPs 2.6, 4.5, and 8.5 in future 1.

Figure 9.
Results of SPEI-3 and SPEI-6. The red color is the Standardized Precipitation Evapotranspiration Index, and the black color is the Standardized Precipitation Evapotranspiration Index of SPEI-3 and SPEI-6. The number 3–6 means three and six months was chosen to detect the agricultural drought. (A–C) mean respectively RCPs 2.6, 4.5, and 8.5 in future 2.

Figure 10.
Results of SPEI-3 and SPEI-6 drought frequency during future-1 period (2025–2057). (A–C) mean respectively RCPs 2.6, 4.5, and 8.5 drought frequency in future 1.
Figure 10.
Results of SPEI-3 and SPEI-6 drought frequency during future-1 period (2025–2057). (A–C) mean respectively RCPs 2.6, 4.5, and 8.5 drought frequency in future 1.

Figure 11.
Results of SPEI-3 and SPEI-6 drought frequency during future-2 periods (2058–2090). (A–C) mean respectively RCPs 2.6, 4.5, and 8.5 drought frequency in future 2.
Figure 11.
Results of SPEI-3 and SPEI-6 drought frequency during future-2 periods (2058–2090). (A–C) mean respectively RCPs 2.6, 4.5, and 8.5 drought frequency in future 2.


Table 1.
Drought classification based on SPEI values.
| SPI/SPEI Values | Categories |
|---|---|
| ≥2.00 | Extremely wet |
| 1.50 to 1.99 | Very wet |
| 1.00 to 1.49 | Moderately wet |
| − 0.99 to 0.99 | Normal |
| −1 to −1.49 | Moderate drought |
| −1.50 to −1.99 | Severe drought |
| ≤−2.00 | Extreme drought |
Table 2.
Flash drought events and their characteristics in the Huaibei Plain during growing seasons.
Table 2.
Flash drought events and their characteristics in the Huaibei Plain during growing seasons.
| Num | Start-End Date | Duration (Days) | Drought Area (%) |
|---|---|---|---|
| 1 | 2001/08/05 to 2001/10/16 | 72 days | 59.9% |
| 2 | 2002/03/30 to 2002/06/18 | 80 days | 49.2% |
| 3 | 2009/08/13 to 2009/10/24 | 72 days | 37.9% |
| 4 | 2012/04/06 to 2012/08/26 | 80 days | 63.7% |
Source: Gou Qiqi 2022.
Table 3.
Pearson correlation coefficients.
| Periods | Observed | 2.6 F1 | 2.6 F2 | 4.5 F1 | 4.5 F2 | 8.5 F1 | 8.5 F2 |
|---|---|---|---|---|---|---|---|
| SPEI 3 and 6 | 0.69 | 0.63 | 0.63 | 0.72 | 0.68 | 0.66 | 0.69 |
Note: Table 3 shows the Pearson correlation coefficients (SPEI-3 and SPEI-6) at baseline period 1985–2017 and future periods (2025–2090) with future 1 (2025–2057) and future 2 (2058–2090).
Table 4.
Sen’s Slope values of SPEI-3 and SPEI-6 at baseline and future periods.
| Baseline (1985–2017) | RCP 2.6 Future-1/Future-2 | RCP 4.5 Future-1/Future-2 | RCP 8.5 Future-1/Future-2 |
|---|---|---|---|
| −0.0001 | − 0.0003/0.0001 | −0.0017/−0.0005 | −0.0007/−0.0017 |
| 0.0002 | 0.0008/0.0001 | −0.0018/−0.0008 | 0.0003/−0.0013 |
Note: The table shows the results of Sen’s Slope for SPEI-3 and SPEI-6 in baseline and future periods. The two results correspond respectively to 3 and 6 months of SPEI for the baseline period (1985–2017) and future period (2025–2090).
Disclaimer/Publisher’s Note: The statements, opinions and data contained in all publications are solely those of the individual author(s) and contributor(s) and not of MDPI and/or the editor(s). MDPI and/or the editor(s) disclaim responsibility for any injury to people or property resulting from any ideas, methods, instructions or products referred to in the content. |
© 2023 by the authors. Licensee MDPI, Basel, Switzerland. This article is an open access article distributed under the terms and conditions of the Creative Commons Attribution (CC BY) license (https://creativecommons.org/licenses/by/4.0/).
Share and Cite
MDPI and ACS Style
Badji, O.; Zhu, Y.; Lü, H.; Guédé, K.G.; Chen, T.; Oumarou, A.; Yao, K.B.M.O.; Brice, S. The Effects of Drought in the Huaibei Plain of China Due to Climate Change. Atmosphere 2023, 14, 860. https://doi.org/10.3390/atmos14050860
AMA Style
Badji O, Zhu Y, Lü H, Guédé KG, Chen T, Oumarou A, Yao KBMO, Brice S. The Effects of Drought in the Huaibei Plain of China Due to Climate Change. Atmosphere. 2023; 14(5):860. https://doi.org/10.3390/atmos14050860
Chicago/Turabian StyleBadji, Ousmane, Yonghua Zhu, Haishen Lü, Kanon Guédet Guédé, Tingxing Chen, Abdoulaye Oumarou, Kouassi Bienvenue Mikael Onan Yao, and Sika Brice. 2023. "The Effects of Drought in the Huaibei Plain of China Due to Climate Change" Atmosphere 14, no. 5: 860. https://doi.org/10.3390/atmos14050860
Note that from the first issue of 2016, this journal uses article numbers instead of page numbers. See further details here.