Article

Methane Emissions from a State-of-the-Art LNG-Powered Vessel

Emission Control and Sustainable Fuels Team, VTT Technical Research Centre of Finland Oy, Tietotie 4C, 02150 Espoo, Finland
*
Author to whom correspondence should be addressed.
Atmosphere 2023, 14(5), 825; https://doi.org/10.3390/atmos14050825
Submission received: 31 March 2023 / Revised: 27 April 2023 / Accepted: 28 April 2023 / Published: 4 May 2023
(This article belongs to the Special Issue Atmospheric Shipping Emissions and Their Environmental Impacts)

Abstract

:
To meet stringent fuel sulfur limits, together with NOx limits, ships are increasingly utilizing dual-fuel (DF) engines operating with liquified natural gas (LNG) as the primary fuel. Compared to diesel, LNG combustion produces less CO2, which is needed in targeting the reduction of the shipping impact on the climate; however, this could be significantly interfered with by the methane emission formation. In this study, the methane emissions, together with other emission components, were studied by measurements onboard a state-of-the-art RoPax ferry equipped with two different development-stage engines. The results from the current standard state-of-the-art DF engine showed methane levels that were, in general, lower than what has been reported earlier from onboard studies with similar sized DF engines. Meanwhile, the methane emission from the DF engine piloting the new combustion concept was even lower, 50–70% less than that of the standard DF engine setup. Although the CO2 was found to slightly increase with the new combustion concept, the CO2 equivalent (including both methane and CO2) was smaller than that from the standard DF engine, indicating that the recent development in engine technology is less harmful for the climate. Additionally, lower NOx and formaldehyde levels were recorded from the new combustion concept engine, while an increase in particle emissions compared to the standard DF engine setup was observed. These need to be considered when evaluating the overall impacts on the climate and health effects.

1. Introduction

Shipping emissions and fuel characteristics are increasingly being regulated. Since 2020, the International Maritime Organization (IMO) has regulated the fuel sulfur level to 0.5%. In addition, there are special sulfur emission control areas (SECA) in which the limitation is set to 0.1%. The IMO also limits nitrogen oxides and emission control areas for NOx (NECA) set requirements for emission reduction technologies onboard the vessels. One solution to meet the stringent fuel sulfur limits, together with NOx limits, is to utilize liquified natural gas (LNG) in ships equipped with dual-fuel engines. Since LNG is mainly composed of methane, with a higher hydrogen-to-carbon ratio compared to diesel, it also produces less CO2 compared to diesel combustion. This is important when targeting the reduction of the shipping impact on the climate, with IMO’s target being a reduction of 50% by 2050.
According to the IMO data collection system (DCS) data, the total reported use of LNG as a maritime fuel was 12.62 Mt in 2021. Out of all combusted maritime fuel, this represents a share of 5.9% in 2021. Most of the total LNG combusted was used by LNG carriers (78.9%), which was then followed by gas carriers (16.9%), while the remaining vessel types (e.g., container vessels and Ro-Pax ships) represented 4.2% of all LNG combusted in 2021. The most common engine type for the LNG vessels is the low-pressure dual-fuel (LPDF) engine. Out of the 614 vessels with an identified LNG engine, 350 had a LPDF four-stroke engine, 157 had a LPDF two-stroke engine and 96 had a high-pressure dual-fuel (HPDF) engine [1]. Additionally, more LNG vessels are being built; according to a recent report, about 20% of the total vessel orders in 2021 were LNG-fueled [2].
The use of LNG as a shipping fuel instead of diesel improves the air quality and reduces the detrimental human health impacts of air emissions. LNG is a nearly sulfur-free fuel and, when combusted in a low-pressure dual-fuel engine, the Tier III NOx limits set by IMO can be reached. Natural gas combustion is also known to produce very low particle emissions, significantly lower than that of diesel combustion (without any exhaust after-treatment) [3,4,5,6]. As the lower CO2 level from LNG combustion compared to diesel combustion is important, the methane emission needs addressing. As the LNG is mainly methane, methane is also the main hydrocarbon component found in the exhaust. Since methane is a strong greenhouse gas (GHG), its emissions should be minimized.
In the most common LNG engine type, the LPDF engine, the air–fuel mixture is ignited with a diesel fuel (pilot fuel) injection into the cylinder. The occurrence of methane slip can be explained either by the temporary hiding of methane in cylinder crevices or quenching, both of which lead to a fraction of the injected natural gas exiting the engine unburned (see ref. [1] and refs. therein). This is acknowledged by the engine manufacturers, who have announced that they are developing technologies to reduce this methane slip. At the moment, there is limited information available that publicly presents the methane slip in terms of the recent developments adopted in the use of state-of-the-art vessels operating using LNG. Additionally, altogether, there are only few emission studies that have been conducted onboard vessels operating with dual-fuel engines, from the years 2015 [4], 2019 [7,8], 2020 [5,9], and 2022 [10], and studies have been conducted regarding four or five different vessels.
The present study provides the results of the methane slip levels together with other emissions from a state-of-the-art LNG-powered vessel. Two different engines from the vessel were included in the study, both with five different loading conditions, while the vessel operated on its normal route.

2. Materials and Methods

2.1. Ships, Engines, and Fuels

Studies were conducted on board the Aurora Botnia, Wasaline’s RoPax ferry, operating the route between Vaasa (Finland) and Umeå (Sweden) in December 2022. This modern, state-of-the-art ferry was built in 2021, starting its operation in autumn, 2021. The ferry is operated by four Wärtsilä 31DF dual-fuel engines capable of operating using LNG. These engines are medium-speed 4-stroke marine engines and have 8 cylinders, with a power of 550 kW per cylinder. One of the engines was piloting a new combustion concept, while the others were standard setups built in 2021. According to the engine manufacturer, the main innovation employed in the engine piloting the new combustion concept revolves around achieving ultra-high energy conversion efficiency. It also involves precise control of the engine in aiming to achieve reductions in exhaust emission levels.
The emission measurements were made from the exhausts of two different engines, i.e., the engine piloting the new combustion concept (Main Engine 3, ME3) and an engine with a normal 31DF setup (Main Engine 4, ME4). Altogether, five different engine loading modes were included in the measurement campaign: 10%, 25%, 50%, 75% and 90% engine loads, with both engines. The loadings were realized with an accuracy of ±2%-units. During all the measurements of the present study, the vessel operated on its normal route.
LNG was utilized as the primary fuel and marine diesel oil (MDO) was utilized as the pilot fuel. The methane content of the LNG was high, i.e., 95.1% (see Table 1). The MDO had a very low sulfur level, containing only 0.01% of sulfur (see Table 2).
MDO usage as a pilot fuel contributed to around 3–28% of the total fuel flow, depending on the engine and engine loading. For ME4, the share of pilot fuel was 3–13%, and for ME3, piloting the new combustion concept, the share of pilot fuel was 10–28%. With both engines, the higher proportions of MDO were at the lowest loads.

2.2. Emission Measurements

Raw exhaust gas was sampled from one measurement point in the exhaust pipe with a few meters distance from the engine and was then divided into separate devices, equipped with different sampling conditioning, measuring both gaseous and particle emissions.
The concentrations of methane, as well as other light hydrocarbon components, were speciated with a gas chromatograph (Agilent MicroGC, Santa Clara, CA, USA). In addition, methane was measured using Fourier transform infrared spectroscopy (FTIR, DX4000 by Gasmet, Vantaa, Finland) together with several other components, such as water, NO, NO2, N2O and formaldehyde. The FTIR—as well as the sampling line and the filter—were heated to 180 °C prior to their use by the FTIR spectrometer. NOx in exhaust emissions was also measured using the standard method of a chemiluminescence detector (CLD) by Horiba PG-250A analyzer (HORIBA, Kyoto, Japan). This same device was also used to measure carbon monoxide (CO) and carbon dioxide (CO2) using a nondispersive infrared (NDIR) analyzer.
Particle emissions were studied using particle number (PN) measurements. The PN measurement followed the procedure mandated by the EU Stage V regulation for inland waterway vessels and considered nonvolatile particles with a diameter greater than 23 nm. A Dekati Engine Exhaust Diluter (DEED by Dekati, Kangasala, Finland) was used for PN sample conditioning in the current study. The system consists of two ejector diluters, providing a total dilution ratio of 1000:1. The temperature of the first ejector was ∼200 °C, and the temperature at the outlet of the DEED unit was below 35 °C. PN > 23 nm concentrations were determined using an Airmodus A23 Condensation Particle Counter (CPC by Airmodus, Helsinki, Finland). For comparison, and also to study the smaller particles, we included another CPC, Airmodus A20, (Airmodus, Helsinki, Finland) with a cut-off size of 10 nm in parallel to this 23 nm cut-off size device.
All these measurements of gaseous and particle emissions were made similarly for both engines studied. At each load mode, the measurement time was minimum of 0.5 h, while in several load modes, the time was 1 h (or more). The results as #/kWh were calculated based on the carbon balance method (described, e.g., in ISO 8178 and NOx technical code). For this, the fuel consumption measured during the onboard studies was provided by the vessel operator together with the engine loading data (power in kW). The LNG bunkering report, including the composition info, presented in Table 1, was also provided by the vessel operator. The pilot fuel sample was received from the vessel and was further analyzed for C, H and N to include these in the calculation of the exhaust gas mass flow rate using the carbon balance method.

3. Results

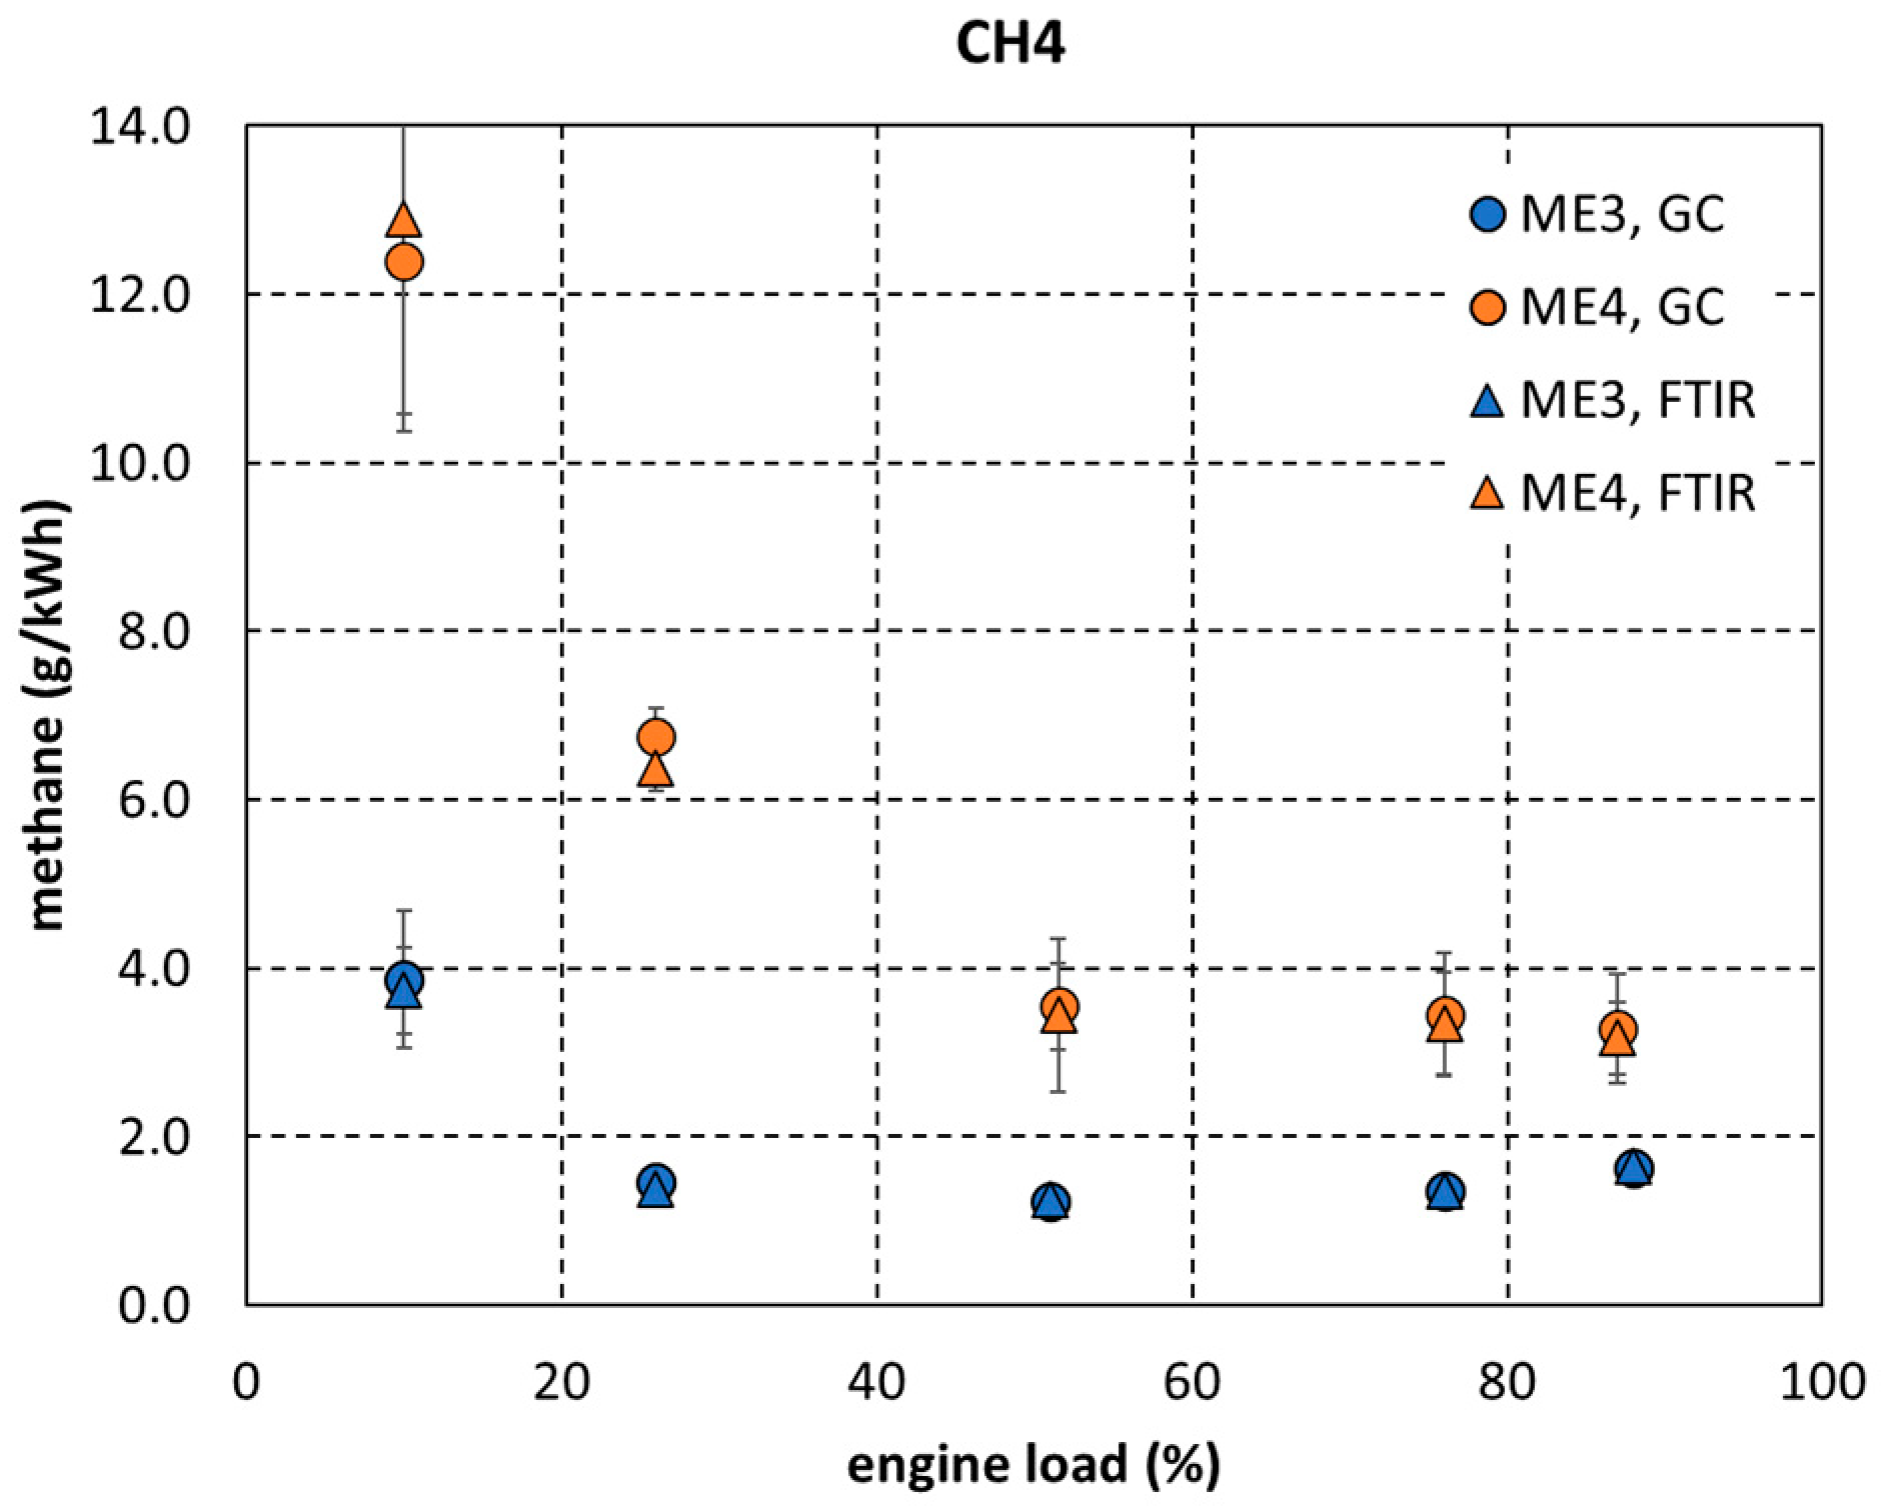
3.1. Methane Emissions

The measurement of methane was conducted with two parallel instruments: GC and FTIR. In Figure 1, we present the calculated methane emissions (g/kWh) measured using both instruments for both engines as a function of engine load. First, Figure 1 shows that similar methane levels were measured, with both instruments increasing the confidence in these results. Second, Figure 1 shows lower methane levels at higher engine loads, especially compared to the lowest engine load of 10%, for both engines. Third, Figure 1 shows lower methane levels recorded from the engine with the new combustion concept. At the engine loads of 50–90%, the new combustion engine produced 50–65% less methane compared to the standard engine, and at the lower loads (with higher absolute methane levels), the difference between the engines was even higher. At 10% load, the engine with the new combustion concept produced methane emission below 4 g/kWh, while at the same load condition with the standard engine, the methane emission was over 12 g/kWh.
In addition to methane, other hydrocarbons (ethane, propane and ethene) were also analyzed with the GC. As expected, much lower emission values were seen for all other hydrocarbons compared to the methane emission. For the ME4, ethane, propane and ethene were found in the exhaust gas, while for the ME3, only ethane was found. With ME3, the concentrations of hydrocarbons other than methane and ethane were so low that they were below the detection limit of the GC in use, the detection limit for ethane and propane being approx. 2 ppm. Calculating the portions of different hydrocarbon components from the total hydrocarbon emissions of the ME4 exhaust results to 95.1–95.9 mol-% of methane, 3.2–3.8 mol-% of ethane and 0.44–0.56 mol-% of propane. Comparing these to the portions found in the LNG fuel (Table 1: methane 95.1 mol-%, ethane 4.1 mol-% and propane 0.6 mol-%) shows that these are on the same level.

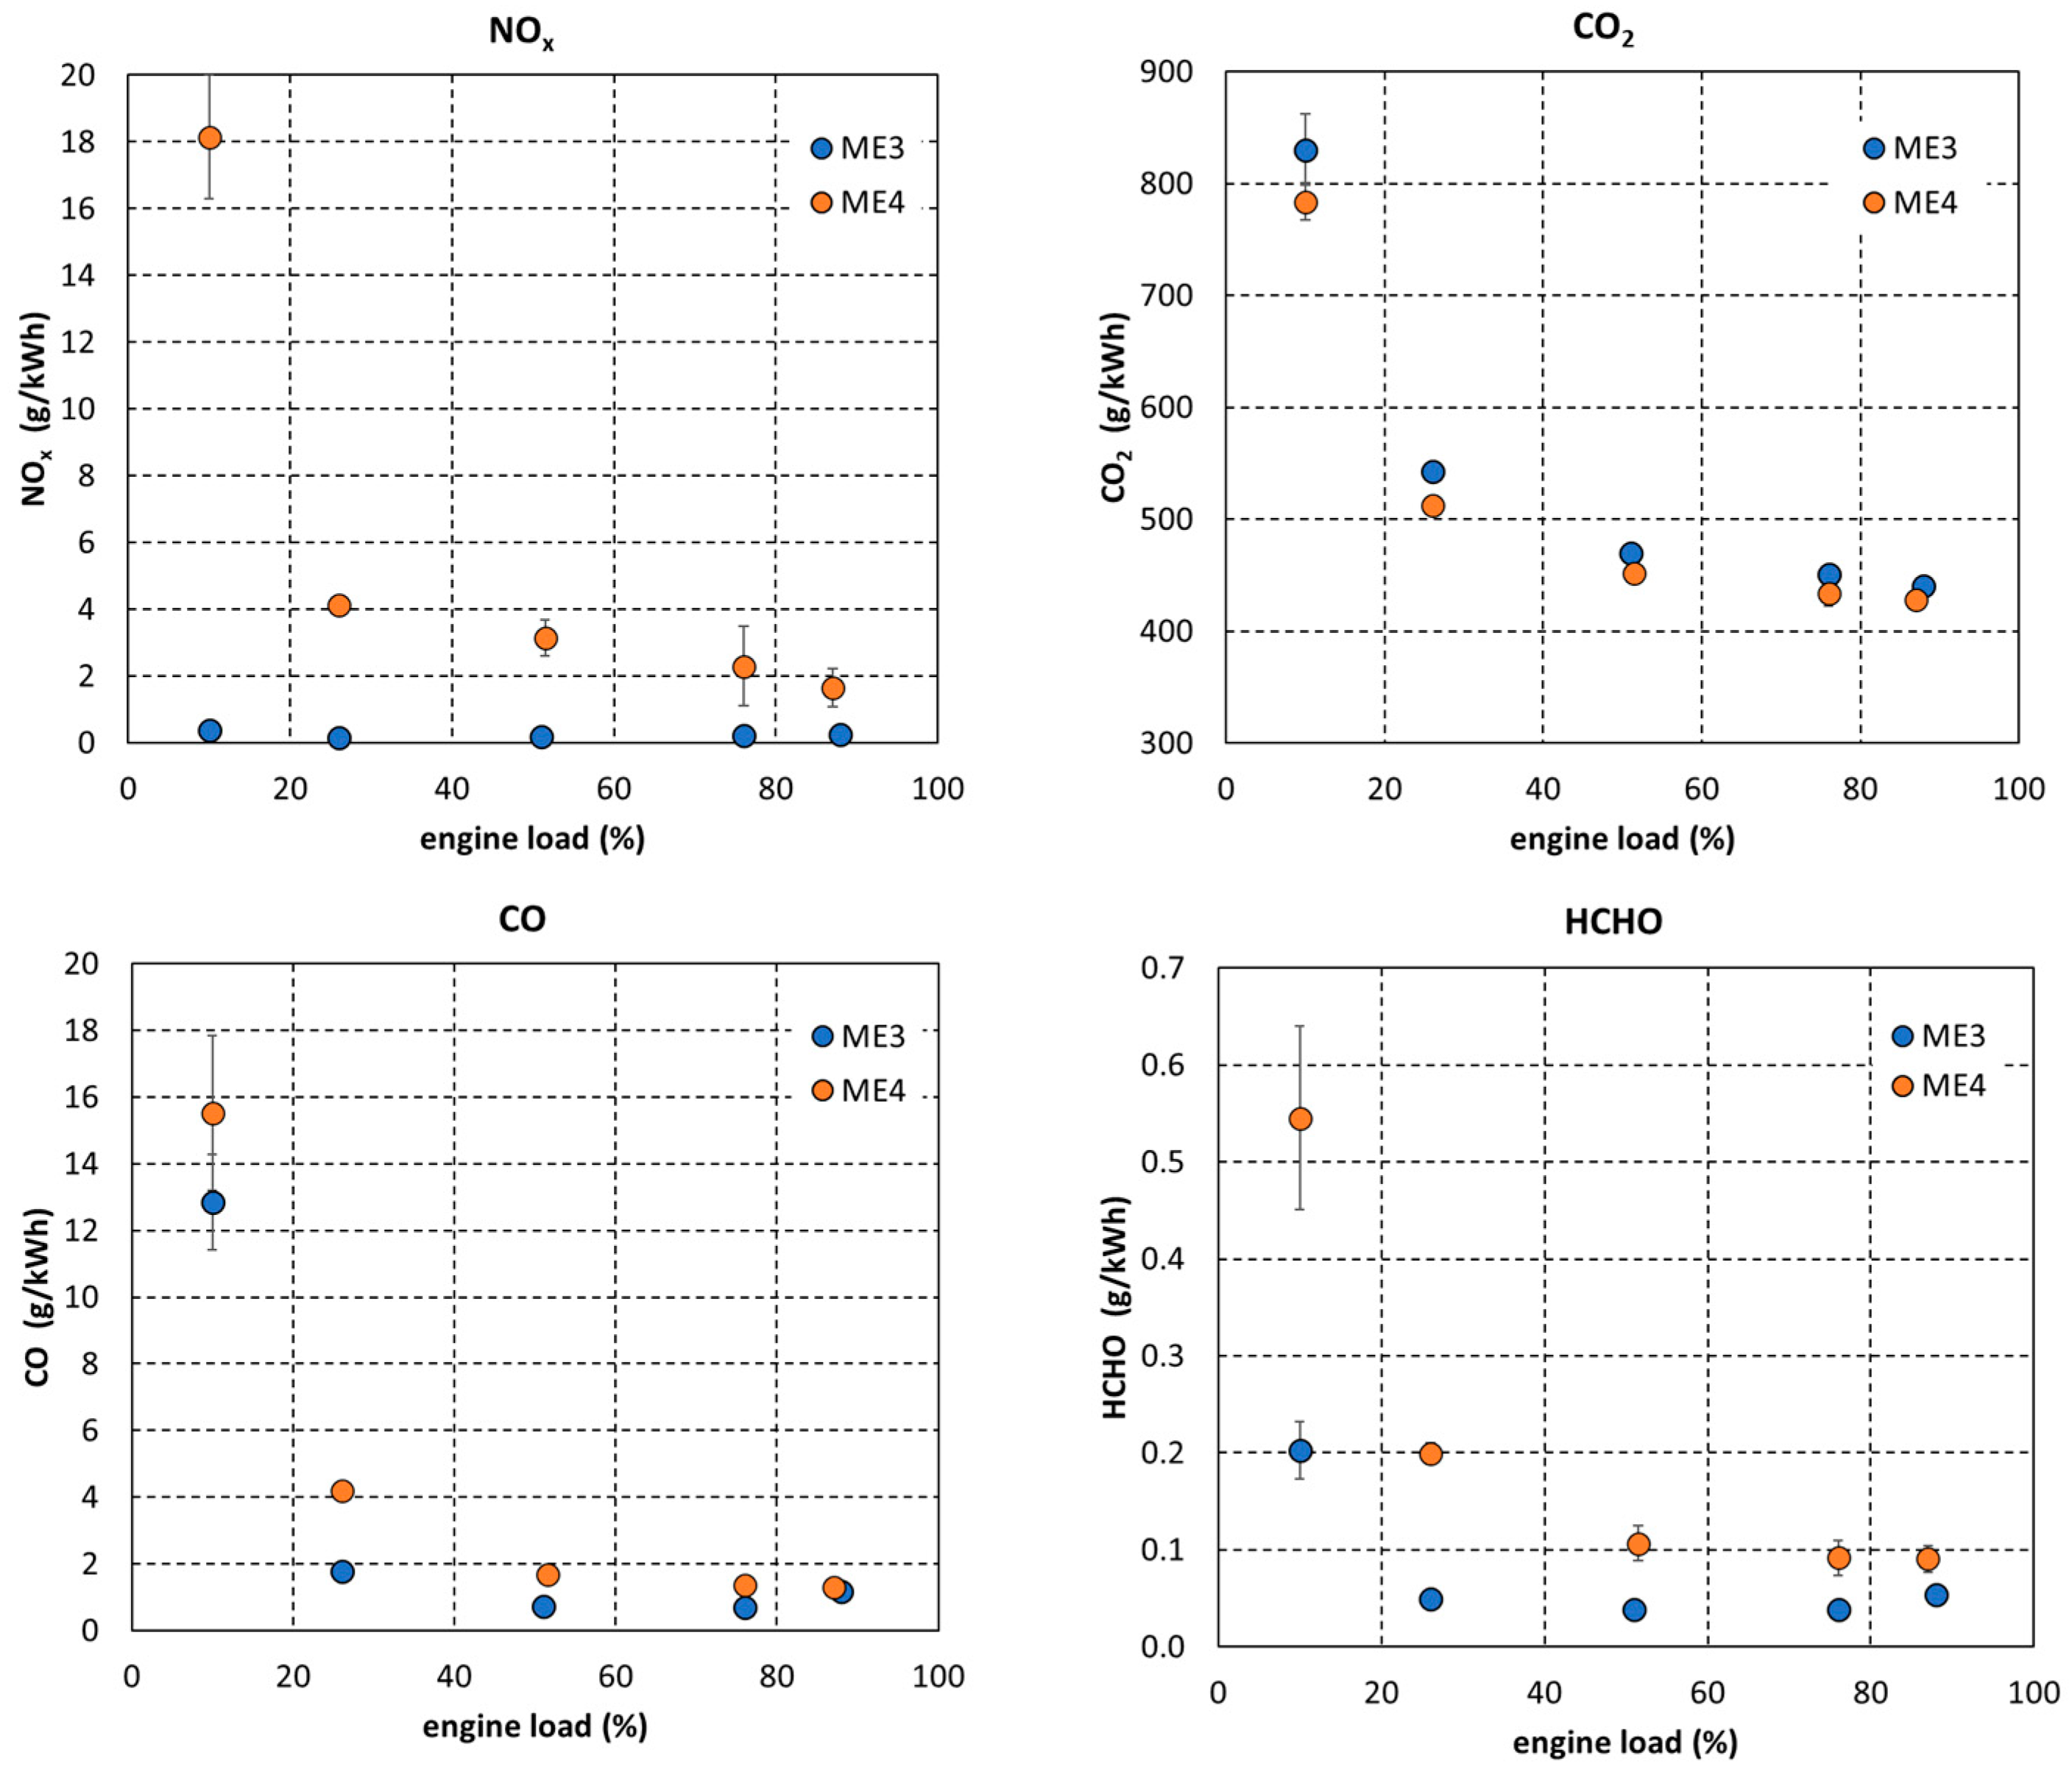
3.2. Other Gaseous Emissions
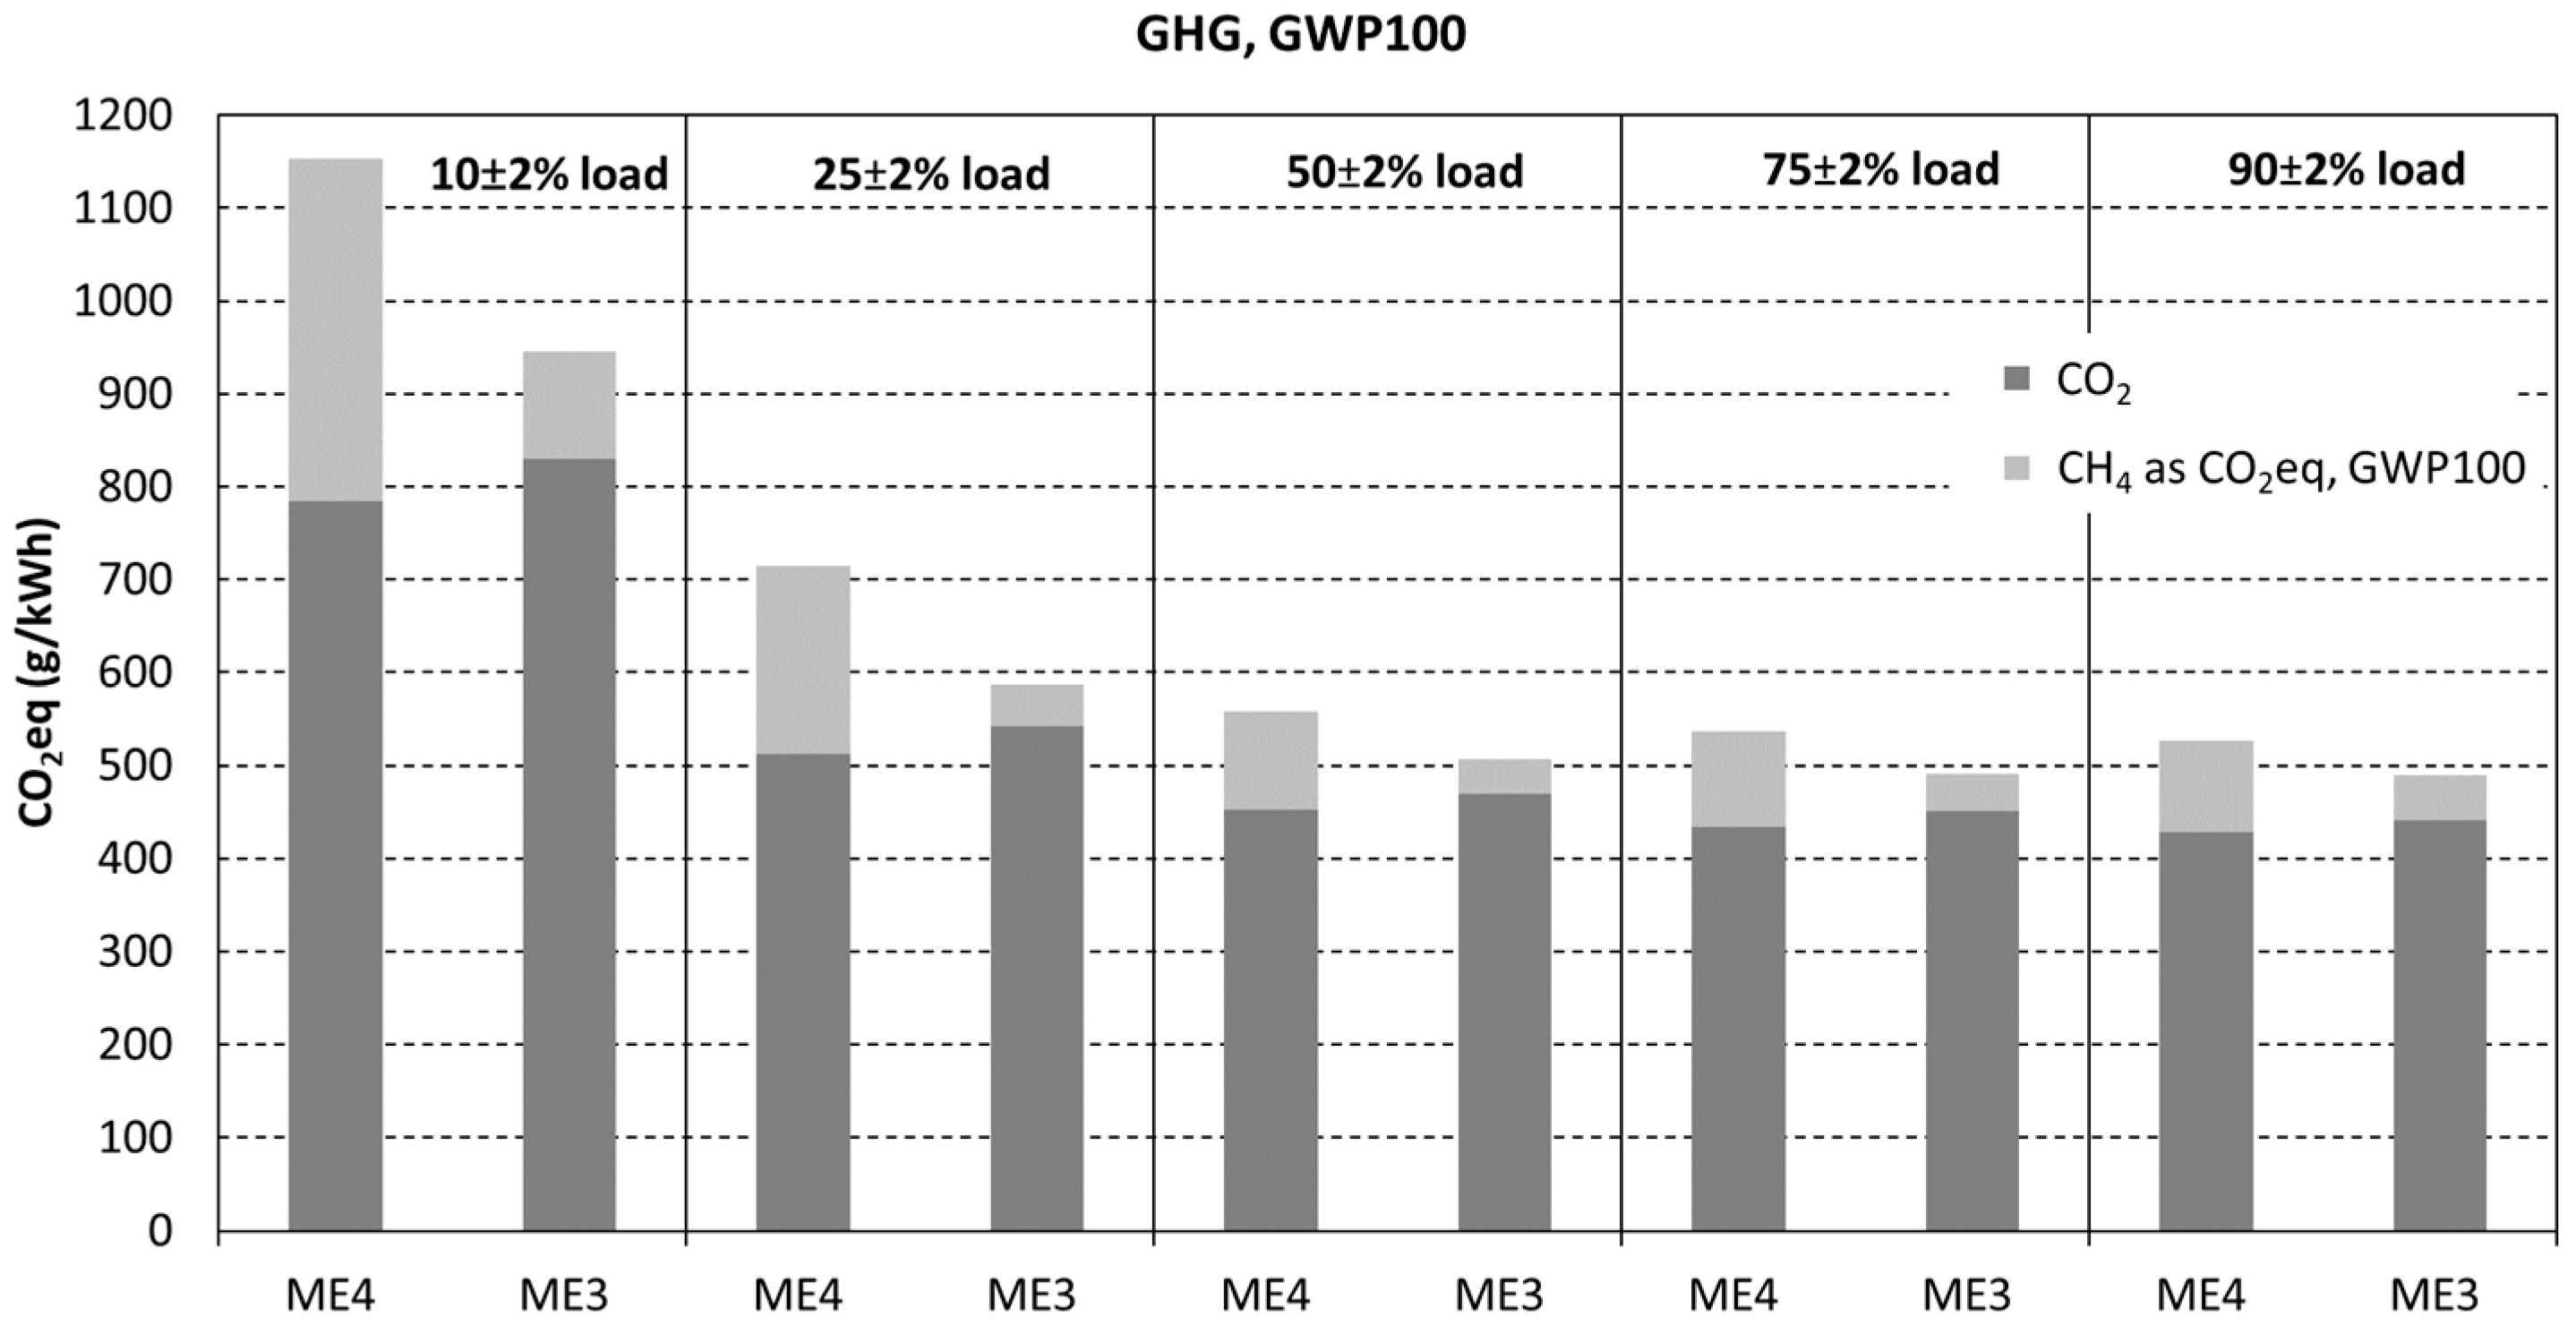
NOx, CO and CO2 emissions, for both engines, as a function of engine load, are presented in Figure 2. From the FTIR data, the formaldehyde was also analyzed, and this is included in Figure 2. This shows that NOx emissions are significantly smaller for ME3 compared to ME4, since NOx levels were below 0.5 g/kWh for ME3 at all loading conditions, while for ME4, NOx was 2–4 g/kWh at 25–90% load and higher (close to 18 g/kWh) at the lowest load of 10%. CO2 emission was found to be slightly higher for the ME3 compared to ME4. CO and HCHO emissions behaved similarly to the methane emissions, showing the highest levels at the lowest loads, and for ME3, both CO and HCHO were found to be on a lower level than for ME4, at all studied engine loads.
Using FTIR, N2O was also measured. However, at all measurement points of the present study, the FTIR showed values below 2 ppm for N2O, which were all below the reliable detection limit of the FTIR device in use.

3.3. CO2 Equivalent

To obtain a better overview of the total GHG emissions, we combined the CO2 and CH4 results, calculating the CH4 as CO2 equivalent using the 100-year global warming potential of 29.8 for CH4 [11]. Figure 3 shows the CO2eq for both engines and all load modes. For the ME3, the CO2eq is lower than that of the ME4. At a higher engine load of 50–90%, CO2eq is 7–9% lower for ME3, compared to ME4, while at lower engine loads, the difference is even greater, with ME3 producing 18% lower CO2eq at 10% load and 25% load compared to ME4.

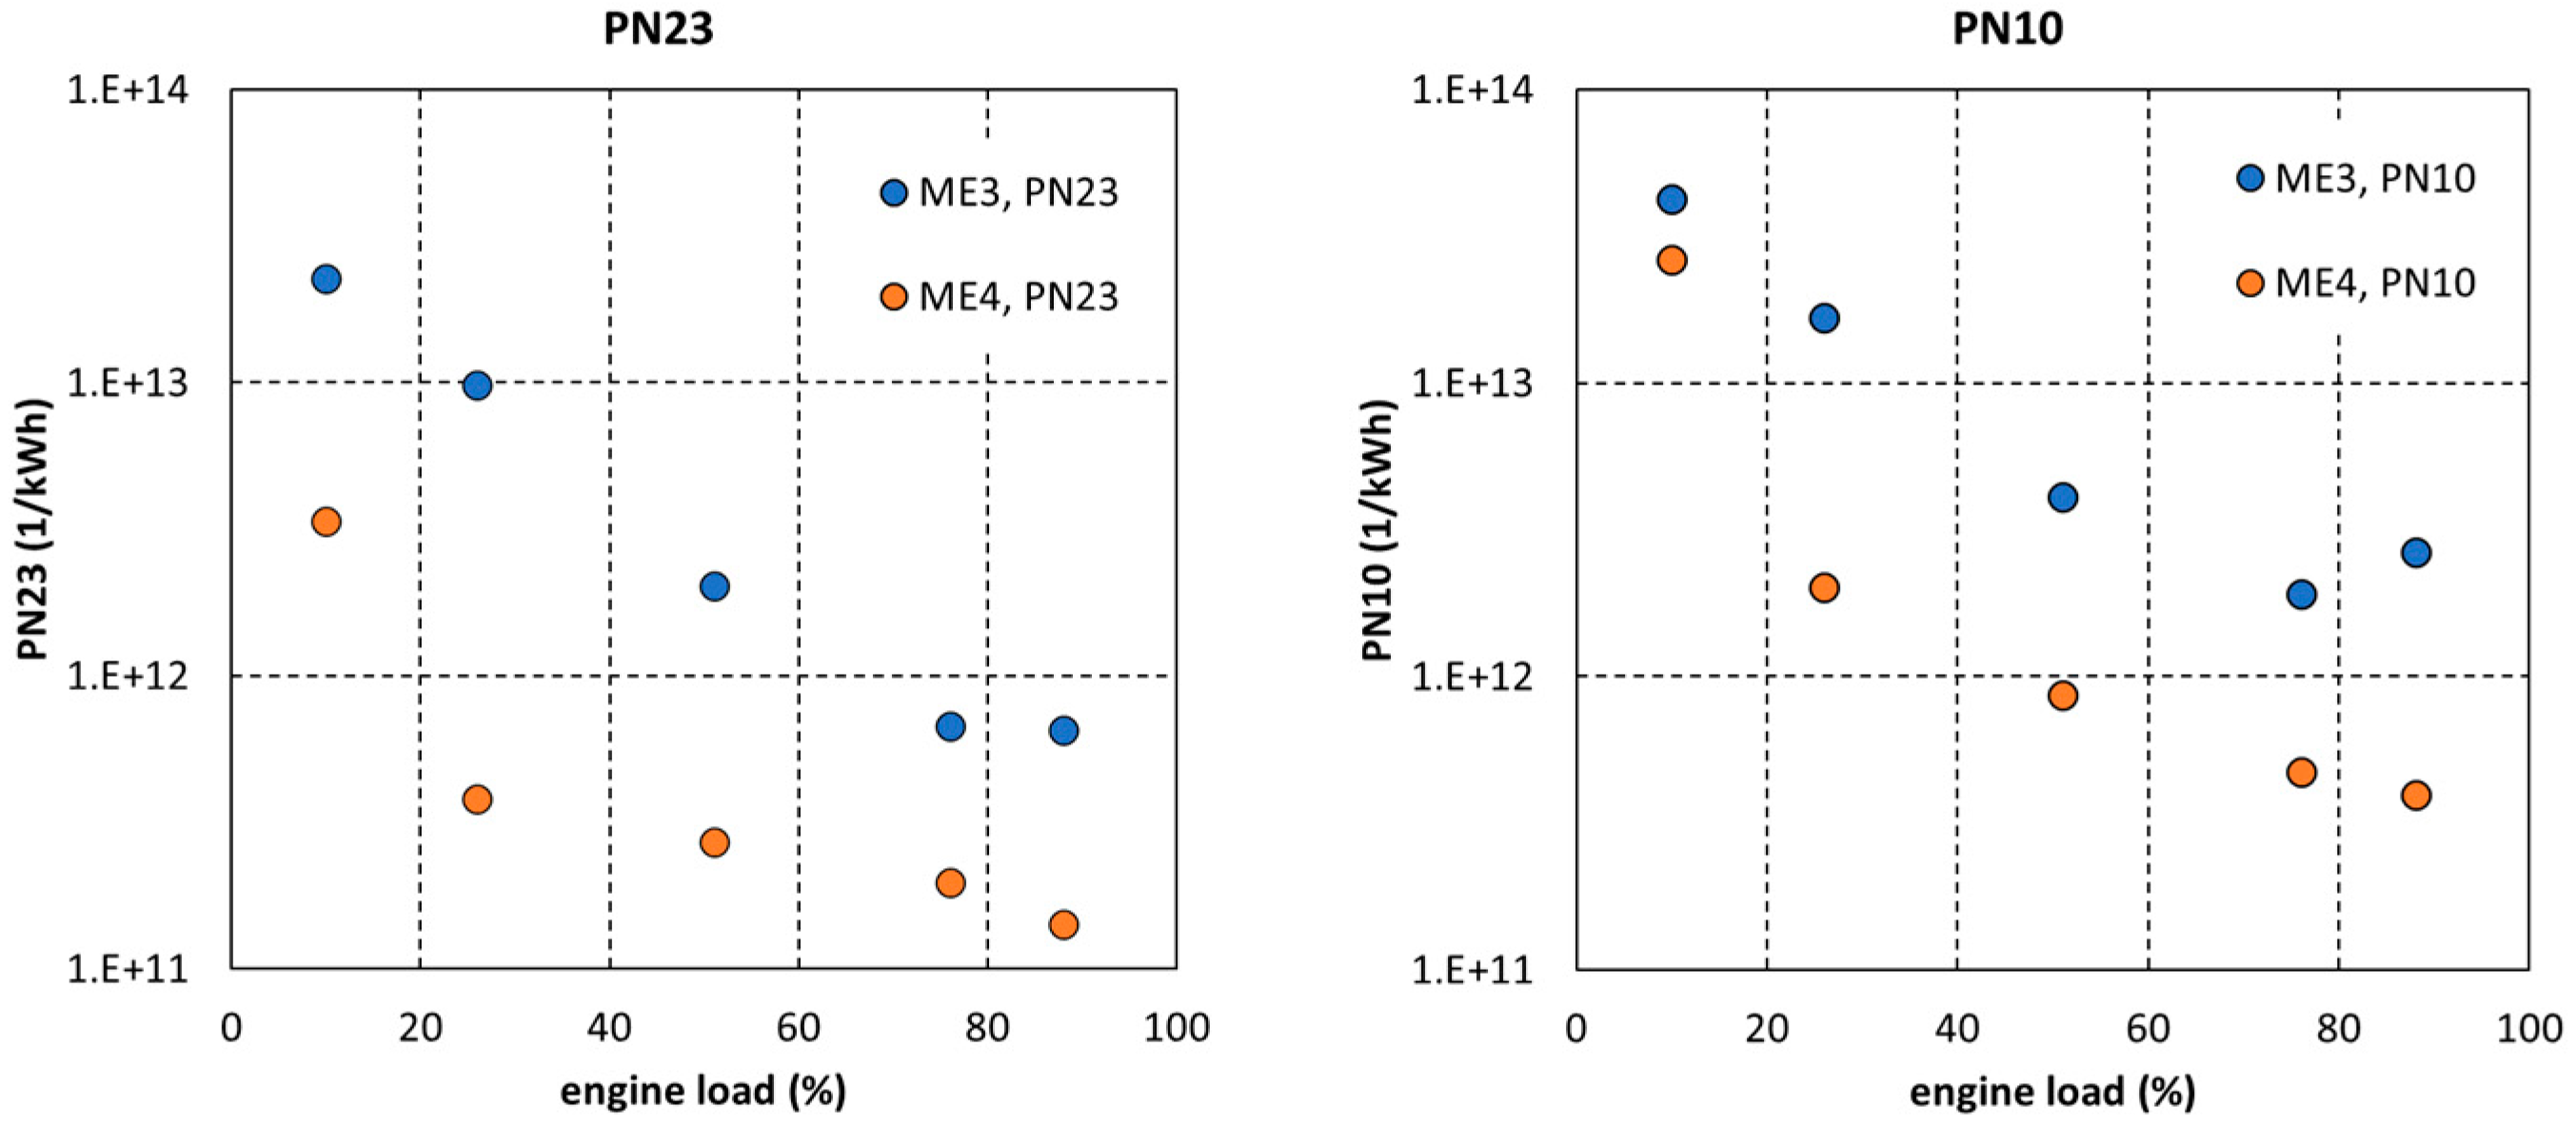
3.4. Particle Emissions

In addition to gaseous emission measurements, particle emissions were studied using continuous PN measurement. Both the PN > 23 nm and PN > 10 nm concentrations were studied and are presented in Figure 4 as 1/kWh as a function of engine load for both engines studied. The lowest particle emission levels were recorded at the higher loads of 75% and 90%, while the emission levels increase at the lower loads. ME3, with the new combustion concept, showed higher particle emission levels than the ME4 (standard engine setup).
As anticipated, PN > 10 nm showed higher concentrations compared to PN > 23 nm, covering the particles in the size range of 10–23 nm, in addition to PN > 23 nm. Especially at the lower loads of 10–50%, the difference between the PN > 10 concentrations of ME3 and ME4 is less than that observed in the case of PN > 23 concentrations. Thus, considering the fraction of 10–23 nm particles in addition to 23 nm increases the total particle number by 142–680% in the case of ME4, whereas in the case of ME3, the addition is 70–306%.

4. Discussion

4.1. Methane and Climate Impacts

Methane slips measured onboard LNG-powered vessels equipped with 4-S LPDF engines have previously been published in only six studies [4,5,7,8,9,10]. To compare the results of the current study to those of earlier publications, we gathered all the methane slips reported in previous studies to produce Figure 5, together with the methane slips measured in the present study. This shows that the methane slip results from previous studies vary quite a lot, depending on the engine load (as was also observed in the present study), while significant variation also occurs between the different studies (meaning different vessels and engines). Altogether, the methane slip varies from close to 1 g/kWh to even above 100 g/kWh. At the loads of 50% and higher, the variation within the previous studies is between roughly 1–13 g/kWh. The methane results for ME4 of the present study are clearly at the lower side of this scale, with values below 4 g/kWh at loads of 50% and higher.
The lowest methane emission values found among the previous studies were from study by Anderson et al. [4], where the engine onboard was a larger, 7600 kW engine (with a larger cylinder and lower speed) compared to the engines in the present study. To obtain a comparison closer to the engine used in the present study in terms of engine size (4400 kW), we used the 3840 kW generator engine, which was recently studied onboard by Balcombe et al. [10], and the 4320 kW engine, which was studied by Peng et al., Sommer et al. and Corbin et al. [5,7,9]. Their results show methane levels from approx. 3 g/kWh (at 100% load) to above 100 g/kWh (at 10% load) (Figure 5). To make a more specific comparison, we show that, at an engine load of 75% these earlier studies (with a similar sized engine as the present study), a methane emission of 4.3–6.3 g/kWh was recorded, while in the present study, ME4 at 75% load resulted in 3.5 g/kWh of methane. Similarly, at lower load, close to 25%, the earlier studies show 18.9–70.2 g/kWh of methane, while the present study, for ME4 at 25% load, shows 6.7 g/kWh of methane. Based on these comparisons, the ME4 clearly shows lower methane levels than found in the earlier studies.
Since the ME3 has already shown lower methane emissions than that of the ME4, it also obviously presents the lowest levels among the earlier studies in Figure 5 (excluding the measurement points reported at 75% and 90% load in a previous study by Andersson et al. with the larger engine). In conclusion, based on current and previous studies, both of the engines of the current study, i.e., ME4 and, especially, ME3 with the new combustion concept, show that the 4-S LPDF engine development is proceeding in right direction when considering the need to decrease the methane slip from the LNG engine exhaust.
For the ME3 (with lower methane slip compared to ME4), however, the CO2 was found to be slightly increased compared to ME4. An increase in CO2 could be expected, since more CH4 is fully oxidized to CO2. Additionally, a higher pilot fuel amount in ME3 compared to ME4 contributes to higher CO2 emission, due to the higher carbon level of MDO compared to LNG. Overall, the CO2 emissions for both engines (428–543 g/kWh) at loads between 90% and 25% are on a similar level (395–485 g/kWh in ref. [4]) or lower (502–660 g/kWh in ref. [10]) than those previously reported for similar load conditions. In the present paper, no measurements were conducted when utilizing diesel fuel. However, in comparison to diesel, an earlier study by Peng et al. [5] reported that CO2 emissions to decreased by 18% when switching a dual-fuel marine vessel from diesel to natural gas. Earlier study at an engine laboratory with one dual-fuel engine has also shown a CO2 decrease of 24–30% when switching the fuel from MDO or MGO to natural gas [6].
To evaluate the effect on climate more comprehensively, we calculated the total CO2 equivalent emissions, including CH4 measurement results together with the CO2 (Figure 3). Figure 3 shows that the total CO2 equivalent is lower for ME3 compared to ME4 at all studied loading conditions, indicating that the ME3, piloting the new combustion concept, is less harmful for the climate compared to current standard state-of-the-art engines such as ME4 in the present study.
We also note that when making this type of evaluations in general, other climate warming compounds should also be included, meaning, at least, black carbon (BC) and N2O. In the present study, no N2O was found in the engine exhaust. Black carbon was not included in the present study. Earlier studies have, however, reported BC values from LNG combustion, showing low BC levels [5,6], meaning values between 0.5–1.7 mg/kWh at engine loads of 25–100%, while diesel combustion has been shown to produce more than 10 times higher BC emissions. To have an estimation of the BC contribution to the CO2eq, by assuming a BC level of 1.7 mg/kWh and a global warming potential of 900 [12], we obtain a value of 1.5 g/kWh for CO2eq. This implies a rather minor contribution of BC to the total CO2eq from LNG combustion, e.g., at engine loads of 50–90%, in the present study, the BC contribution to the CO2eq would be 0.3%. However, since the exhaust gas composition, also from LNG combustion, might be changing due to the engine development, as is shown in the present study when studying the new combustion concept engine, black carbon is not to be excluded from future studies with LNGs or any of the other fuels when considering the climate impact of shipping emissions.

4.2. Other Pollutants

In addition to climate impacts, LNG combustion is known to have low NOx emissions, and this was also found to be true in the present study. NOx emission factors of 0.5–4.3 g/kWh have been reported in earlier onboard studies [4,5,8]. For the ME4 of the current study, the NOx levels at 25–90% loads are at the same level as the values reported in the earlier studies mentioned above, while the NOx at the lowest load of 10% is higher than what has been previously reported. For ME3, the NOx levels at all loads studied (i.e., 10–90% loads) were below 0.5 g/kWh, clearly showing lower NOx levels compared to the ones reported from earlier onboard studies. The measured levels are below marine NOx regulatory limits (IMO Tier III) and reach the lowest levels of non-road (EU Stage V) and heavy duty on-road (Euro VI) regulations (0.4 g/kWh).
Carbon monoxide was previously reported in three different studies with values of 1–7 g/kWh at 25–100% engine loads, and a significantly higher value of 36 g/kwh was reported from one onboard study during idle [4]. The CO levels of the present study were below 4.2 g/kWh at engine loads of 25–90%, finding the same level as presented by previous studies.
Formaldehyde is a toxic compound which is hazardous even in low concentrations and is known to be emitted from natural gas engines due to the partial oxidation of hydrocarbons in the engine [13,14]. Formaldehyde has also been reported in two previous studies of dual-fuel engines [5,15]. These show formaldehyde levels of 0.1–0.7 g/kWh. All formaldehyde levels from the ME4 of the present study also fall into this range. However, the HCHO values of ME3 at engine loads of 25–90% were lower, being between 0.04–0.05 g/kWh. This is obviously a benefit for the new combustion concept engine, as it produces less hazardous formaldehyde compared to the standard engine setup (ME4) or to other engines previously studied.
Particle emissions have also been studied in previous onboard studies. The direct comparison of these particle emission levels is, however, challenging, since different methods and devices are used to measure particles. The method, i.e., the sampling conditions, can have a big effect on the result, even when utilizing the same method but a different dilution ratio for the sample, which can result in significant differences [16]. In the present study, we measured PN > 23 nm with a method required by the EU Stage V regulation for inland waterway vessels. The exact same method was utilized in previous dual-fuel engine studies conducted in engine laboratories [6,17], representing one DF engine (retrofitted in 2016), one 2017 production series DF engine and, in addition, onboard studies with engines operating using diesel fuels. These earlier PN > 23 results from DF engines with LNG fuel varied between 1.3 × 10¹¹ and 1.4 × 10¹² kWh−1, while the PN > 23 results when utilizing diesel fuel (either MDO or heavy fuel oil) were 7 × 10¹³–3 × 10¹⁴ kWh−1. The PN > 23 values for ME4 in the present study were between 1.4 × 10¹¹–3.4 × 10¹² kWh−1 and for ME3 between 6.5 × 10¹¹–2.3 × 10¹³ kWh−1. For both engines, the highest values were recorded at the lowest load mode of 10%, for which there is no comparison with the previous publications. For ME4, at 25–90% loads, all PN > 23 values were below 1 × 10¹² kWh−1, and for ME3, at 25–90% loads, all PN > 23 values were below 1 × 10¹³ kWh−1. This shows that the PN results for ME4 correlate well with the earlier results, as do the PN results for ME3 at higher loads above 50%, while the PN levels at 25% and 50% loads for ME3 are a bit higher compared to the previously published levels.
Obviously, less PN means fewer negative impacts on air quality and human health due to particle emissions. Although ME3 introduces many benefits when considering the lower gaseous emissions it achieves, it produces more PN than the standard ME4 engine. However, compared to diesel combustion and PN emissions from ships operating using diesel fuels, the PN levels measured for ME3 are still roughly one tenth of those produced when diesel fuel is in use. While there are no global regulations for particle emissions from international ships, in EU inland waterway vessels, the PN > 23 nm is limited to 1.0 × 10¹² kWh 1. In the present study, both engines, studied at higher load conditions (above 50%), showed PN > 23 nm concentrations that are below this value, while the lower loads, especially those of ME3, showed concentrations above this limit value. Of course, we have not yet studied the complete range of conditions, i.e., all the load modes required to fulfill the official test cycle, for which the limit value is set. The results of the different load modes of the present study, however, indicate that there is a potential for LNG usage to reach the EU Stage V PN emission level, in the case of ME4, while in the case of ME3, this seems more challenging.
In the present study, PN > 10 was also measured, utilizing the same sampling conditions as for the PN > 23 measurement. This showed a clear difference between the PN > 10 and PN > 23 levels, implying that a significant share of the particles is in the size range of 10–23 nm. PN10 emissions measured with the same method and cut point for LNG engines were not found in previous studies; however, comparison can be made with studies where instruments used a lower cut-off size of 6 nm [4,9] together with a catalytic stripper or thermodenuder for the removal of volatile compounds. Anderson et al. [4] reported PN > 6 of 1–3 × 10¹² kWh−1 for a variety of loads from 30–90%, whereas Corbin et al. [9] observed a level of 2 × 10¹² kWh−1 at high loads of 53–90% and significantly increased levels of 1 × 10¹⁴–3 × 10¹⁵ kWh−1 at lower loads of 6–50%. They also reported PN > 6 for the same engine operating on diesel, which showed 1–2 × 10¹⁴ kWh−1 at 25–75% load. The PN > 10 for ME3 is on a similar level to the PN > 6 values [4,9] reported by Anderson and Corbin at loads of 50–90%, but the results of 2–4 × 10¹³ at 10–25% are lower than those reported by Corbin et al. [9]. In the case of ME4, the measured PN > 10 of 4 × 10¹¹–3 × 10¹³ kWh−1 is lower than the previously reported PN > 6 values at the corresponding load conditions.
These nanosized particles have also been previously observed for natural gas combustion and particles smaller than 10 nm have also been found, down to few nm [18]. The origin of these particles was studied in ref. [18], showing particles originating from both the fuel and from lubrication oil. Even though the particle emissions from ships are not globally limited, ultrafine particles (below 100 nm in size) are associated with negative health impacts [19,20] and, e.g., for vehicles, the upcoming Euro 7 will regulate particle size down to 10 nm. While the use of LNG is one solution to decreasing particle emissions, attention should also be paid to the high fraction of small-sized particles, i.e., those below 23 nm, when developing sustainable mitigation solutions for shipping.
Overall, LNG is considered to be a transition fuel which facilitates the decarbonization of maritime transport. Methane, the main component of LNG, may be a fossil fuel, as is the case today, but could also be a biofuel or a renewable synthetic in origin. In targeting very low- or zero-carbon fuel, the origin of the biomaterial and electricity used in the fuel synthesis must be sustainable. Ideally, existing engine solutions and tank arrangements could be used with these very low- or zero-carbon fuels with minimal need for modifications [2,21]. The utilization of LNG in dual-fuel (DF) engines, together with liquid fuel for ignition, also allows fuel flexibility for the ship operators. Methane slip minimization and avoiding other pollutants produced are not only important for the fuels of today, but also for future fuels, even though such fuels could be produced sustainably. This study shows that the current state-of-the-art LPDF engine shows lower methane levels compared to previous studies, and further improvements seem to be achievable using the new engine combustion concept, as is demonstrated onboard a vessel during normal operation, resulting in benefits for the air quality and also the climate.

Author Contributions

Conceptualization, K.L. and N.K.; methodology, K.L. and H.V.; formal analysis, K.L. and N.K.; investigation, H.V. and P.K.; data curation, K.L., N.K., H.V. and P.K.; writing—original draft preparation, K.L.; writing—review and editing, K.L. and N.K.; visualization, K.L. and N.K.; project administration, K.L.; funding acquisition, K.L. All authors have read and agreed to the published version of the manuscript.

Funding

This research was funded by European Union, grant number 101056642.

Institutional Review Board Statement

Not applicable.

Informed Consent Statement

Not applicable.

Data Availability Statement

All the data relevant to interpretation of results are available in the article.

Acknowledgments

The crew onboard is gratefully acknowledged for their collaboration during the measurements. We also thank Mikko Karppanen for his help during the measurements.

Conflicts of Interest

The authors declare no conflict of interest.

References

  1. Kuittinen, N.; Heikkilä, M.; Lehtoranta, K. Review of Methane Slip from LNG Engines; GREEN RAY Project. Deliverable D1.1; GREEN RAY, EU: Brussels, Belgium, 2023.
  2. Plevrakis, G.; Koutsourakis, P.; Stamopoulos, S.; Sarvaiya, J.; Soultanias, I.; Vaidhyanathan, S.; Seward, N.; Shen, T.; Zhu, A.; Koliniati, R.; et al. Setting the Course to Low Carbon Shipping. Available online: https://safety4sea.com/setting-the-course-to-low-carbon-shipping-zero-carbon-outlook/ (accessed on 15 June 2022).
  3. Aakko-Saksa, P.T.; Lehtoranta, K.; Kuittinen, N.; Järvinen, A.; Jalkanen, J.P.; Johnson, K.; Jung, H.; Ntziachristos, L.; Gagné, S.; Takahashi, C.; et al. Reduction in Greenhouse Gas and Other Emissions from Ship Engines: Current Trends and Future Options. Prog. Energy Combust. Sci. 2023, 94, 101055. [Google Scholar] [CrossRef]
  4. Anderson, M.; Salo, K.; Fridell, E. Particle- and Gaseous Emissions from an LNG Powered Ship. Environ. Sci. Technol. 2015, 49, 12568–12575. [Google Scholar] [CrossRef] [PubMed]
  5. Peng, W.; Yang, J.; Corbin, J.; Trivanovic, U.; Lobo, P.; Kirchen, P.; Rogak, S.; Gagné, S.; Miller, J.W.; Cocker, D. Comprehensive Analysis of the Air Quality Impacts of Switching a Marine Vessel from Diesel Fuel to Natural Gas. Environ. Pollut. 2020, 266, 115404. [Google Scholar] [CrossRef] [PubMed]
  6. Lehtoranta, K.; Aakko-Saksa, P.; Murtonen, T.; Vesala, H.; Ntziachristos, L.; Rönkkö, T.; Karjalainen, P.; Kuittinen, N.; Timonen, H. Particulate Mass and Nonvolatile Particle Number Emissions from Marine Engines Using Low-Sulfur Fuels, Natural Gas, or Scrubbers. Environ. Sci. Technol. 2019, 53, 3315–3322. [Google Scholar] [CrossRef] [PubMed]
  7. Sommer, D.E.; Yeremi, M.; Son, J.; Corbin, J.C.; Gagné, S.; Lobo, P.; Miller, J.W.; Kirchen, P. Characterization and Reduction of In-Use CH 4 Emissions from a Dual Fuel Marine Engine Using Wavelength Modulation Spectroscopy. Environ. Sci. Technol. 2019, 53. [Google Scholar] [CrossRef]
  8. Ushakov, S.; Stenersen, D.; Einang, P.M. Methane Slip from Gas Fuelled Ships: A Comprehensive Summary Based on Measurement Data. J. Mar. Sci. Technol. 2019, 24, 1308–1325. [Google Scholar] [CrossRef]
  9. Corbin, J.C.; Peng, W.; Yang, J.; Sommer, D.E.; Trivanovic, U.; Kirchen, P.; Miller, J.W.; Rogak, S.; Cocker, D.R.; Smallwood, G.J.; et al. Characterization of Particulate Matter Emitted by a Marine Engine Operated with Liquefied Natural Gas and Diesel Fuels. Atmos. Environ. 2020, 220, 117030. [Google Scholar] [CrossRef]
  10. Balcombe, P.; Heggo, D.A.; Harrison, M. Total Methane and CO2 Emissions from Liquefied Natural Gas Carrier Ships: The First Primary Measurements. Environ. Sci. Technol. 2022, 56, 9632–9640. [Google Scholar] [CrossRef] [PubMed]
  11. IPCC. Climate Change 2022—Mitigation of Climate Change—Working Group III Contribution to the Sixth Assessment Report of the Intergovernmental Panel on Climate Change; IPCC: Geneva, Switzerland, 2022.
  12. Bond, T.C.; Doherty, S.J.; Fahey, D.W.; Forster, P.M.; Berntsen, T.; Deangelo, B.J.; Flanner, M.G.; Ghan, S.; Kärcher, B.; Koch, D.; et al. Bounding the Role of Black Carbon in the Climate System: A Scientific Assessment. J. Geophys. Res. Atmos. 2013, 118, 5380–5552. [Google Scholar] [CrossRef]
  13. Mitchell, C.E.; Olsen, D.B. Formaldehyde Formation in Large Bore Natural Gas Engines Part 1: Formation Mechanisms. J. Eng. Gas Turbine Power 2000, 122, 603–610. [Google Scholar] [CrossRef]
  14. Olsen, D.B.; Mitchell, C.E. Formaldehyde Formation in Large Bore Engines Part 2: Factors Affecting Measured CH2O. J. Eng. Gas Turbine Power 2000, 122, 611–616. [Google Scholar] [CrossRef]
  15. Lehtoranta, K.; Murtonen, T.; Vesala, H.; Koponen, P.; Karjalainen, P.; Ntziachristos, L.; Kuittinen, N.; Alanen, J.; Rönkkö, T.; Keskinen, J.; et al. Particle and Gaseous Emissions from a Dual-Fuel Marine Engine. In Proceedings of the 22nd International Transport and Air Pollution Conference, Zürich, Switzerland, 15–16 November 2017. [Google Scholar]
  16. Ntziachristos, L.; Saukko, E.; Rönkkö, T.; Lehtoranta, K.; Timonen, H.; Hillamo, R.; Keskinen, J. Impact of Sampling Conditions and Procedure on Particulate Matter Emissions from a Marine Diesel Engine. In Proceedings of the 28th CIMAC World Congress, Helsinki, Finland, 6–10 June 2016. [Google Scholar]
  17. Lehtoranta, K.; Aakko-Saksa, P.; Murtonen, T.; Vesala, H.; Kuittinen, N.; Rönkkö, T.; Ntziachristos, L.; Karjalainen, P.; Timonen, H.; Teinilä, K. Particle and Gaseous Emissions from Marine Engines Utilizing Various Fuels and Aftertreatment Systems. In Proceedings of the 29th CIMAC World Congress, Vancouver, DC, Canada, 10–14 June 2019. [Google Scholar]
  18. Alanen, J.; Isotalo, M.; Kuittinen, N.; Simonen, P.; Martikainen, S.; Kuuluvainen, H.; Honkanen, M.; Lehtoranta, K.; Nyyssönen, S.; Vesala, H.; et al. Physical Characteristics of Particle Emissions from a Medium Speed Ship Engine Fueled with Natural Gas and Low-Sulfur Liquid Fuels. Environ. Sci. Technol. 2020, 54, 5376–5384. [Google Scholar] [CrossRef] [PubMed]
  19. Kwon, H.-S.; Ryu, M.H.; Carlsten, C. Ultrafine Particles: Unique Physicochemical Properties Relevant to Health and Disease. Exp. Mol. Med. 2020, 52, 318–328. [Google Scholar] [CrossRef] [PubMed]
  20. Schraufnagel, D.E. The Health Effects of Ultrafine Particles. Schraufnagel Exp. Mol. Med. 2020, 52, 311–317. [Google Scholar] [CrossRef] [PubMed]
  21. Lindstad, E.; Eskeland, G.S.; Rialland, A.; Valland, A. Decarbonizing Maritime Transport: The Importance of Engine Technology and Regulations for LNG to Serve as a Transition Fuel. Sustainability 2020, 12, 8793. [Google Scholar] [CrossRef]
Figure 1. Methane emissions measured with GC (dots) and FTIR (triangles) for both engines—ME3 and ME4—as a function of engine load. Error bars show the standard deviations.
Atmosphere 14 00825 g001
Figure 2. NOx, CO2, CO and formaldehyde (HCHO) emissions for both engines—ME3 and ME4—as a function of engine load. Error bars show the standard deviations.
Atmosphere 14 00825 g002
Figure 3. Total greenhouse gas emissions calculated based on measured CO2 and CH4 emissions as CO2 equivalents for both engines—ME4 and ME3—at different engine load conditions. The 100-year global warming potential (GWP100) was used to convert methane emissions to CO2 equivalents.
Atmosphere 14 00825 g003
Figure 4. Particle number emissions as function of engine load for both engines—ME3 and ME4. PN23 denotes particles larger than 23 nm and PN10 denotes particles larger than 10 nm in diameter.
Atmosphere 14 00825 g004
Figure 5. Methane emission factors (g/kWh) for ME3 and ME4 compared with previously reported values from onboard measurements of LPDF 4-S engines as a function of engine load [4,5,7,8,9,10]. The same engine was studied in Sommer et al. 2019 [7], Corbin et al. 2020 [9] and Peng et al. 2020 [5]. Emissions from two separate engines were reported in the studies of Sommer et al. 2019 [7] and Ushakov et al. 2019 [8].
Atmosphere 14 00825 g005
Table 1. Main specifications of LNG used onboard.
LNG
methane (mol-%)95.1
ethane (mol-%)4.1
propane (mol-%)0.6
nitrogen (mol-%)0.1
ibutane (mol-%)0.07
nbutane (mol-%)0.07
carbon dioxide (mol-%)0.00
density (kg/m3)0.75
Table 2. Main specifications of the MDO used onboard.
MDO
carbon (m-%)84.4
hydrogen (m-%)14.0
nitrogen (m-%)0.06
sulfur (m-%)0.01
density at 15 °C (kg/m3)877.4
viscosity at 80 °C (mm2/s)2.87
Disclaimer/Publisher’s Note: The statements, opinions and data contained in all publications are solely those of the individual author(s) and contributor(s) and not of MDPI and/or the editor(s). MDPI and/or the editor(s) disclaim responsibility for any injury to people or property resulting from any ideas, methods, instructions or products referred to in the content.

