

Climate Indices and Their Impact on Maize Yield in Veracruz, Mexico
by
 , ,
, ,
Citlali Villa-Falfán
1,*,
Ofelia Andrea Valdés-Rodríguez
1 ,
,
Jorge Luis Vázquez-Aguirre
2 and
Fernando Salas-Martínez
1 1
El Colegio de Veracruz, 26 Carrillo Puerto, Zona Centro, Xalapa 91000, Mexico
2
Licenciatura en Ciencias Atmosféricas, Universidad Veracruzana, Circuito Gonzalo Aguirre Beltrán s/n, Zona Universitaria, Xalapa 91090, Mexico
*
Author to whom correspondence should be addressed.
Atmosphere 2023, 14(5), 778; https://doi.org/10.3390/atmos14050778
Submission received: 31 January 2023
/
Revised: 6 April 2023
/
Accepted: 22 April 2023
/
Published: 25 April 2023
(This article belongs to the Special Issue Agrometeorology, Agricultural Water Management and Impacts of Extreme Events)
Abstract
:The State of Veracruz (Mexico) is highly vulnerable to climate change. Therefore, it is necessary to identify and analyze local climate extreme trends and explore potential relationships between climate indices and maize. The objectives of this research were (1) to describe recent trends of climate indices (1979–2018) and (2) to compare these climate indices with maize yields produced in Veracruz, Mexico, under rainfed conditions. The methodology calculated and analyzed the sector-specific climate indices (Rx5day, PRCPTOT, SPI6, R20mm, TXx, TNn, TXgt50p, and TXge35) in 18 observation sites using Climpact. Climate indices were calculated over the spring-summer agricultural cycle and correlated with rainfed maize yields. Results show increasing trends for Rx5day, TXx, TXgt50p, and TXge35 indices in 65%, 56%, 89%, and 67% of the analyzed sites, respectively, whereas decreasing trends in PRCPTOT and R20mm indices were detected in 59% and 47% of the sites. Significant correlations (p < 0.05) between climate indices and maize yield were found in eight municipalities, of which 62% were positive. In conclusion, extreme temperature and precipitation local events are increasing in frequency, duration, and intensity, and depending on the site’s local climate, these might positively or negatively impact maize yields.
1. Introduction
The last report of the Intergovernmental Panel on Climate Change (IPCC) indicates that human-induced climate change has reduced agricultural productivity during the previous 50 years on a global scale. The increments in frequency and intensity of climate change phenomena, such as heat waves, droughts, and heavy rainfall, negatively affect crop productivity; however, the impacts are different in each region [1].
Due to its geographic and socioeconomic characteristics, Mexico is one of the most vulnerable countries to the effects of climate change [2]. Specifically, in Veracruz state (region central of the Gulf of Mexico), the agricultural sector presents a high vulnerability because most production systems are rainfed and based on monocultures [3,4].
Therefore, it is necessary to constantly monitor climate change by identifying and analyzing quantitative indicators at the local scale and determining its possible impacts on the agricultural sector. These types of indicators can be the climate indices proposed by the Expert Group on Climate Change Detection and Indices (ETCCDI) of the World Meteorological Organization (WMO) [5].
The ETCCDI formulated a set of 27 basic climate indices, which show some of the characteristics of climate extremes (such as frequency, amplitude, and persistence), detect changes in the behavior, and identify trends from daily precipitation data and temperature. These indices are based on statistical calculations and can be referenced to absolute and relative thresholds (such as percentiles) or combined indices [5,6]. However, not all indices are relevant to the socioeconomic sectors. Therefore, in recent years, these indices have been extended by the WMO Expert Team on Sector-Specific Climate Indices (ET-SCI) to adapt the ETCCDI indices to include other sectors (mainly agriculture, water, and health), as well as to design new indices. As a result, these indices are known as “sector-specific climate indices” or “sectoral climate indices” and consist of 61 climate indices (considering the 27 indices previously proposed) estimated for annual and monthly scales [7].
The sets of ETCCDI and ET-SCI climate indices have been calculated and analyzed internationally by the scientific climatology community and included in National Adaptation Plans (NAPs) in developing countries such as Sierra Leone [8]. However, these studies have been mainly focused on exploring the trend of indices for heat waves, extreme precipitation, and temperature [9,10,11,12,13]. Only a few authors have applied the indices in the agricultural sector, such as Herold et al. [14], who examined sectoral climate indices relevant to the health and agriculture sectors. Their findings indicated that the indices showed increased extremes related to heat and drought. They also foresee that wheat yields in Australia will be less likely to exceed the historical annual average. Likewise, Croitoru et al. [15] used temperature climate indices to identify changes in agroclimatology conditions and suitability zones for maize crops in Romania. Their results indicated that, although there were no significant changes in temperature indices, better conditions for maize crops were reported in some regions.
On the other hand, McGree et al. [16] concluded that in western Fiji, it is likely that the increase in temperature over the last century has contributed to the decline in sugarcane yields. However, they believe that factors such as factory efficiency and farm management play a more significant role in sugarcane production than climate.
In Mexico, numerous studies are based on the climate indices proposed by the ETCCDI; however, most have not been analyzed for any specific sector. Among the most recent studies are those of Ruiz-Alvarez et al. [17], Pineda-Martínez et al. [18], Colorado-Ruiz and Cavazos [19], Mendoza-Uribe [20], and Montero-Martínez et al. [21], who analyzed the trends of ETCCDI indices. Regarding sectoral climate indices, no evidence was found that they have been calculated or used in agricultural research, even though 10% of the population works in that sector [22].
In terms of crops, maize (Zea mays L.) is the most globally widespread due to its use for food processing in the poultry, swine, and human food industries. However, it is one of the most vulnerable to climate change because it is susceptible to changes in precipitation and temperature [15,23]. In Mexico, maize is the most significant crop due to its nutritional, economic, social, and cultural importance [24]. Maize is grown almost throughout the country in the autumn-winter and spring-summer agricultural cycles and can be rainfed (depending on rainfall behavior) or irrigated.
One of the states with the highest agricultural production is Veracruz, with 20,708,733.11 tons/hectare. In Veracruz, maize is one driver of the State’s economy and a solid cultural component [4,25]. However, because 98% of the municipalities have rainfed crops, maize cultivars are highly exposed to extreme weather events associated with climate change [25,26].
Studies related to maize yields in Mexico [27,28,29,30] and specifically in Veracruz [4,31,32,33] have analyzed the impact of climate change on maize. However, these studies have not used the calculation of sectoral climate indices as a method. Therefore, the objectives of this research were (1) to describe recent trends of climate indices (1979–2018) and (2) to compare these climate indices with maize yields produced in Veracruz, Mexico, under rainfed conditions. The hypothesis is that extreme climate events impact the yield of rainfed maize.
2. Materials and Methods
In summary, the sequence of steps carried out in this study is the following: (1) we obtained and processed climate and agricultural data, (2) we calculated climate indices using the online software Climpact v3.1.3, (3) we selected sectoral climate indices relevant to maize cultivation, (4) we analyzed decadal trends of precipitation and temperature indices, and (5) we correlated and obtained linear regressions between average climate indices and maize yields (for the spring-summer agricultural cycle).
2.1. Study Area
Veracruz state is located in the southeastern side of Mexico, between latitude 17°03′ to 22°27′ North and longitude 93°36′ to 98°36′ West. The State has a land area of 78,815 km2 and is divided into 212 municipalities located in altitudes from 0 m above sea level up to more than 3250 m above sea level [27].
Veracruz has two rain and drought periods; the rainiest months are between June and September, showing a bimodal behavior known as Midsummer Drought, Intra-festival Drought, or Canícula, where there is a decrease in precipitation during the summer. In contrast, the least rainy months run from December to February in the mountainous region and from March to May in the coastal plain [28].
May is the hottest month, with values between 25 and 30 °C, and the coldest month is January, with values that oscillate between 20 and 25 °C [28].
In agricultural terms, Veracruz is the national leader in producing sugarcane, orange, pineapple, and grapefruit and is among the top ten entities producing sesame, rice, cherry coffee, beans, lemon, and maize, to name a few. Specifically, Veracruz is one of the three states with the most significant planted surface of maize (586,174.99 ha) and one of the ten states with the highest crop production [22].
2.2. Climate Data
Daily precipitation and temperature data were obtained from the national climatological database of the National Meteorological Service (SMN-CONAGUA), which is the official source in Mexico. This database contains historical records from a network of conventional climatological stations [29]. However, the availability of information is limited because its coverage has decreased due to some suspended stations, causing the records to be relatively short and not being transmitted in real time. As a result, the available climate information has missing periods and outliers, and the data require quality control [30,31].
Selection of Meteorological Stations (1979–2018)
Considering that some stations have been discontinued and that the database is only available until 2018, the following selection criteria were applied:
- (1)
- The station is currently in operation.
- (2)
- Time series passed homogeneity and quality control tests.
- (3)
- Data were available from 1979 to 2018.
- (4)
- The station is located in a municipality where maize is produced.
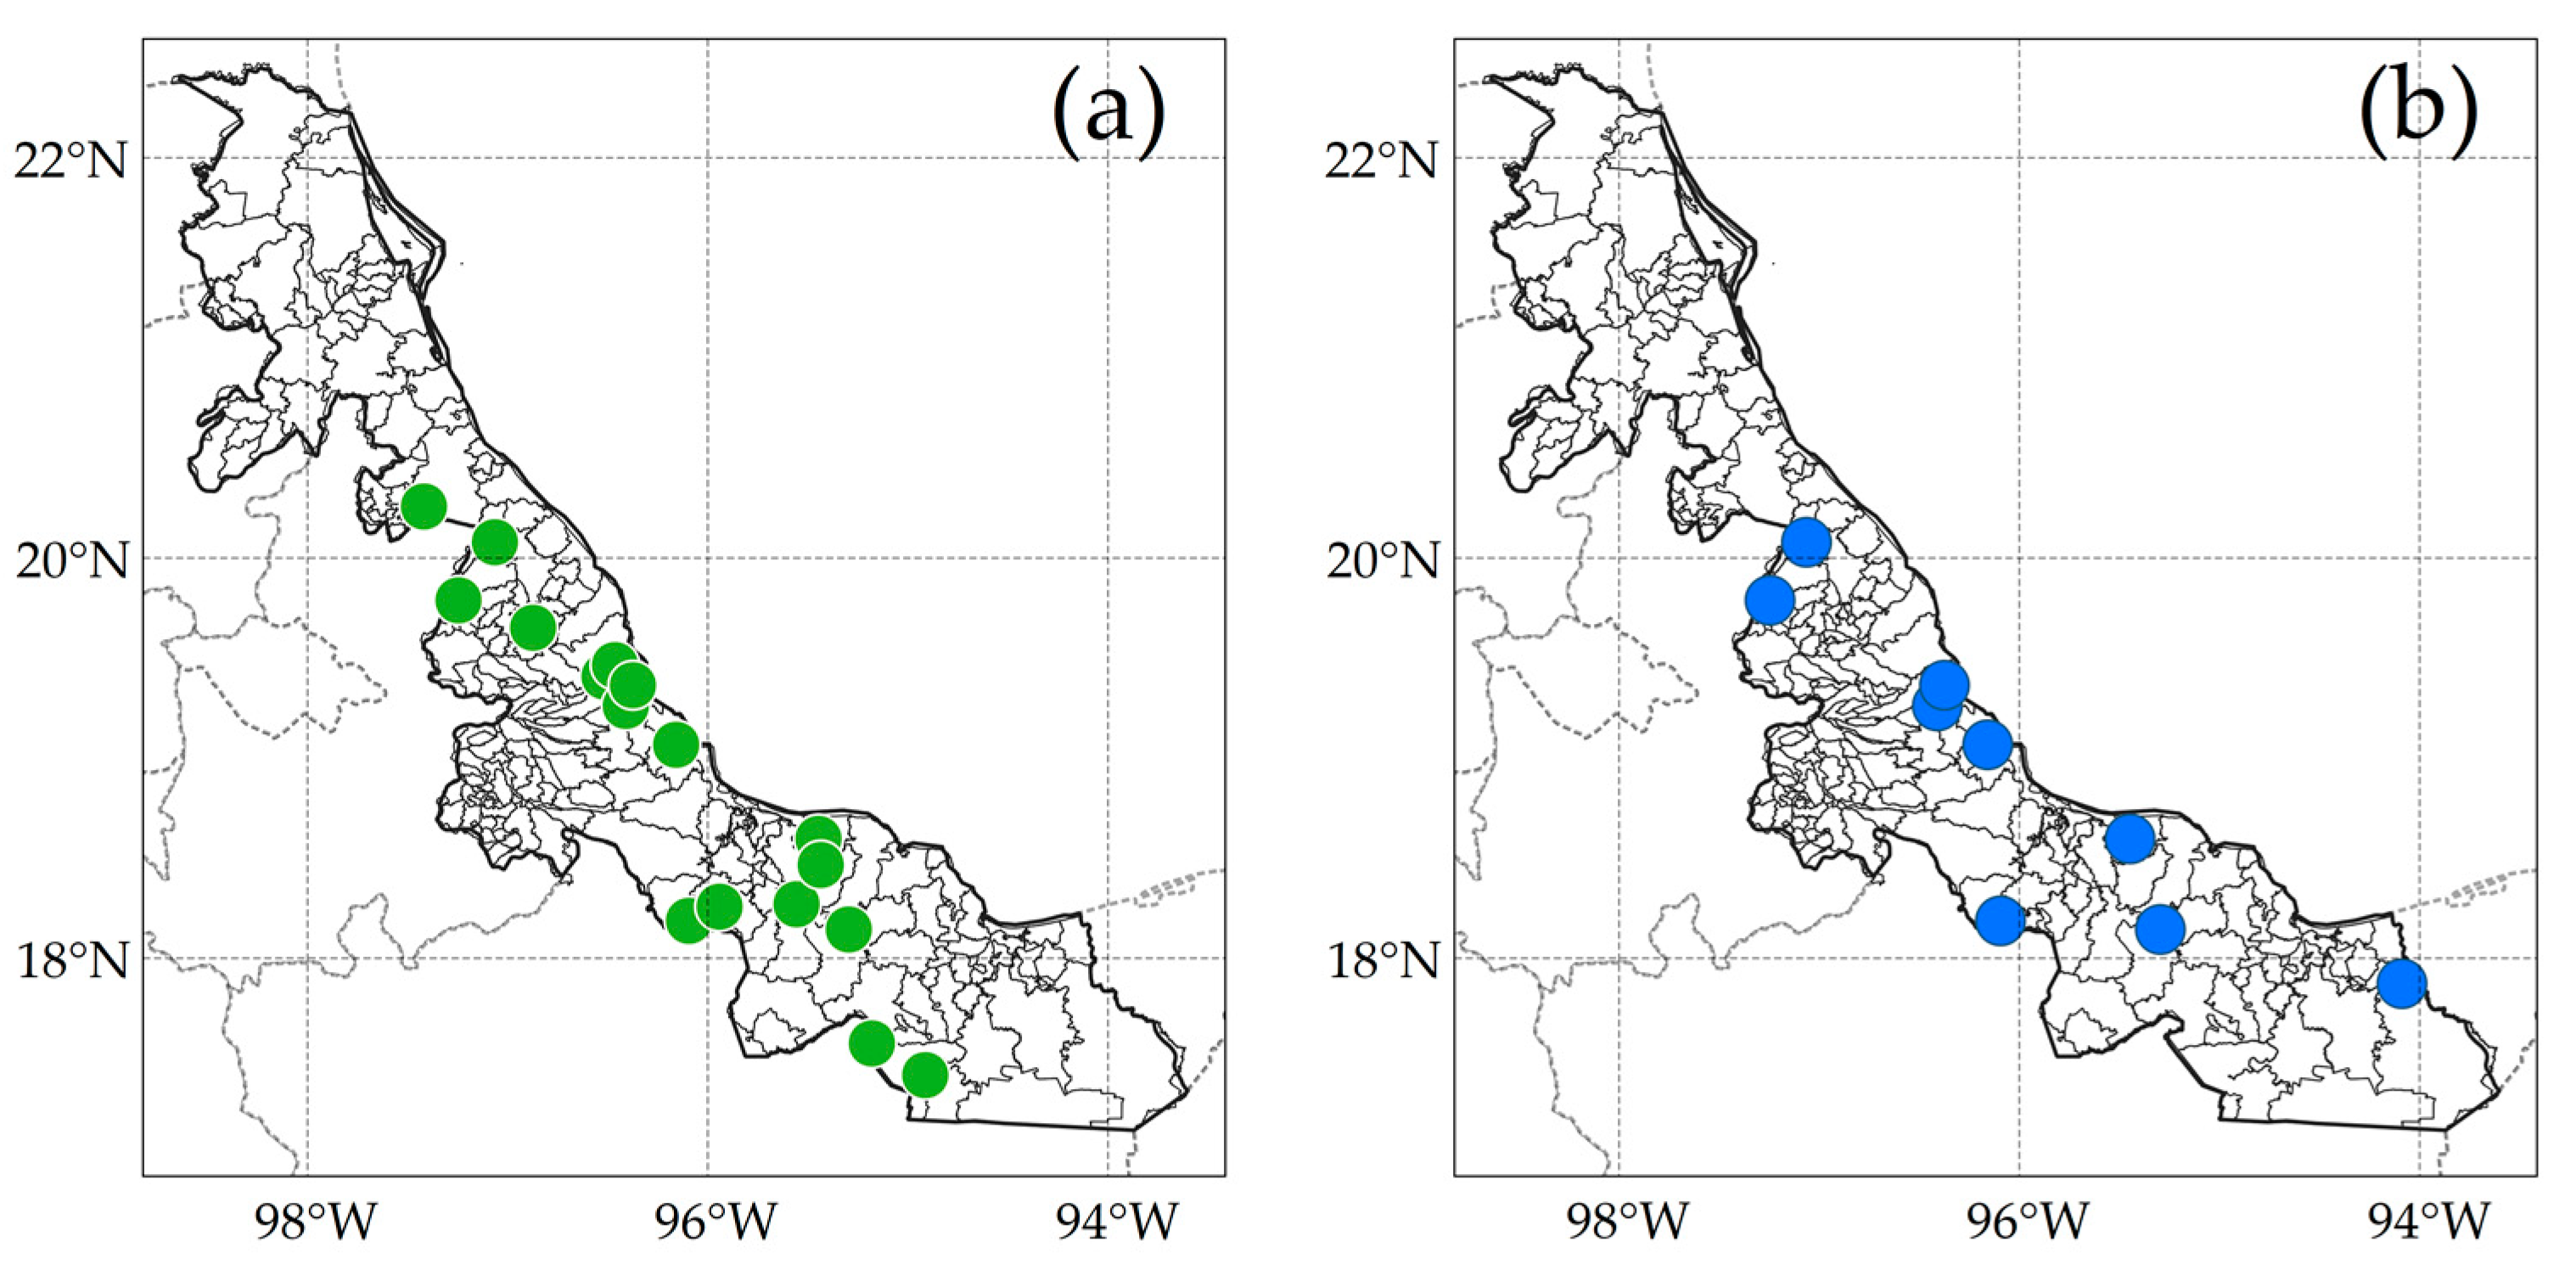
These criteria resulted in 17 stations for precipitation and nine stations for temperature (Figure 1 and Appendix A).
2.3. Agricultural Yield Data for Maize
The maize yield data for the selected meteorological stations were obtained from the Agrifood and Fisheries Information System (SIAP) [25]. A list of municipalities can be consulted in Appendix A.
Yield data (tons/hectares) of all available types of maize, in the rainfed modality, for the period 2003–2018 were used. However, the study was limited only to the spring-summer agricultural cycle because the yield data in the autumn-winter cycle were incomplete for six municipalities.
2.4. Calculation of Climate Indices
The climate indices were estimated with the online Climpact software (written in R language), based on the RClimDEX software created for calculating the ETCCDI indices [7].
2.5. Selection of Climate Indices
Only the indices impacting maize yield were selected. For the indices trend analysis, we used the yearly indices, and for regression and correlation analysis, we used the monthly indices. Both types are indicated in Table 1.
2.6. Trend Analysis
The trend analysis of precipitation and temperature indices is based on Sen’s slope integrated with Climpact [33]. This slope reflects the median slope of all pairs of ordered points in a dataset and is considered the most suitable for extreme values [7].
In addition, Climpact calculates 95% confidence intervals of the slope and the upper and lower limits. The significance of this trend is evaluated when the three estimated parameters have the same sign [7,34].
Positive values indicate increasing trends, whereas negative values show decreasing trends [35].
2.7. Calculation of Climate Indices for the Spring-Summer Agricultural Cycle
Sectorial climate indices for the spring-summer cycle were estimated by the arithmetic means of the monthly values from April to September of each year for the period 2003–2018. This calculation was repeated for all the indices considered in this study. As a result, the expression is shown in Equation (1):
where: = average of the year and index i; = value of the index of month m of the spring-summer (April to September) cycle, and 6 = the total number of months evaluated for the spring-summer cycle.
2.8. Correlation and Regression Analysis
The correlation analysis was performed between climate indices and maize yield data for the spring-summer cycle 2003–2018 since this is the period in which both databases have information.
The correlation method was selected based on the results obtained from the normality tests by the Shapiro–Wilk method, using Past 4.08 software. These indicated non-parametric data; therefore, Spearman’s rho coefficient was used, with a statistical significance of 0.05.
The correlations obtained by each station were presented on maps of the State of Veracruz, elaborated using QGIS 3.16.6-Hannover software.
Additionally, regression tests were implemented only for the significant correlations.
3. Results
3.1. Description of Annual Climate Indices Trends
3.1.1. Precipitation Indices
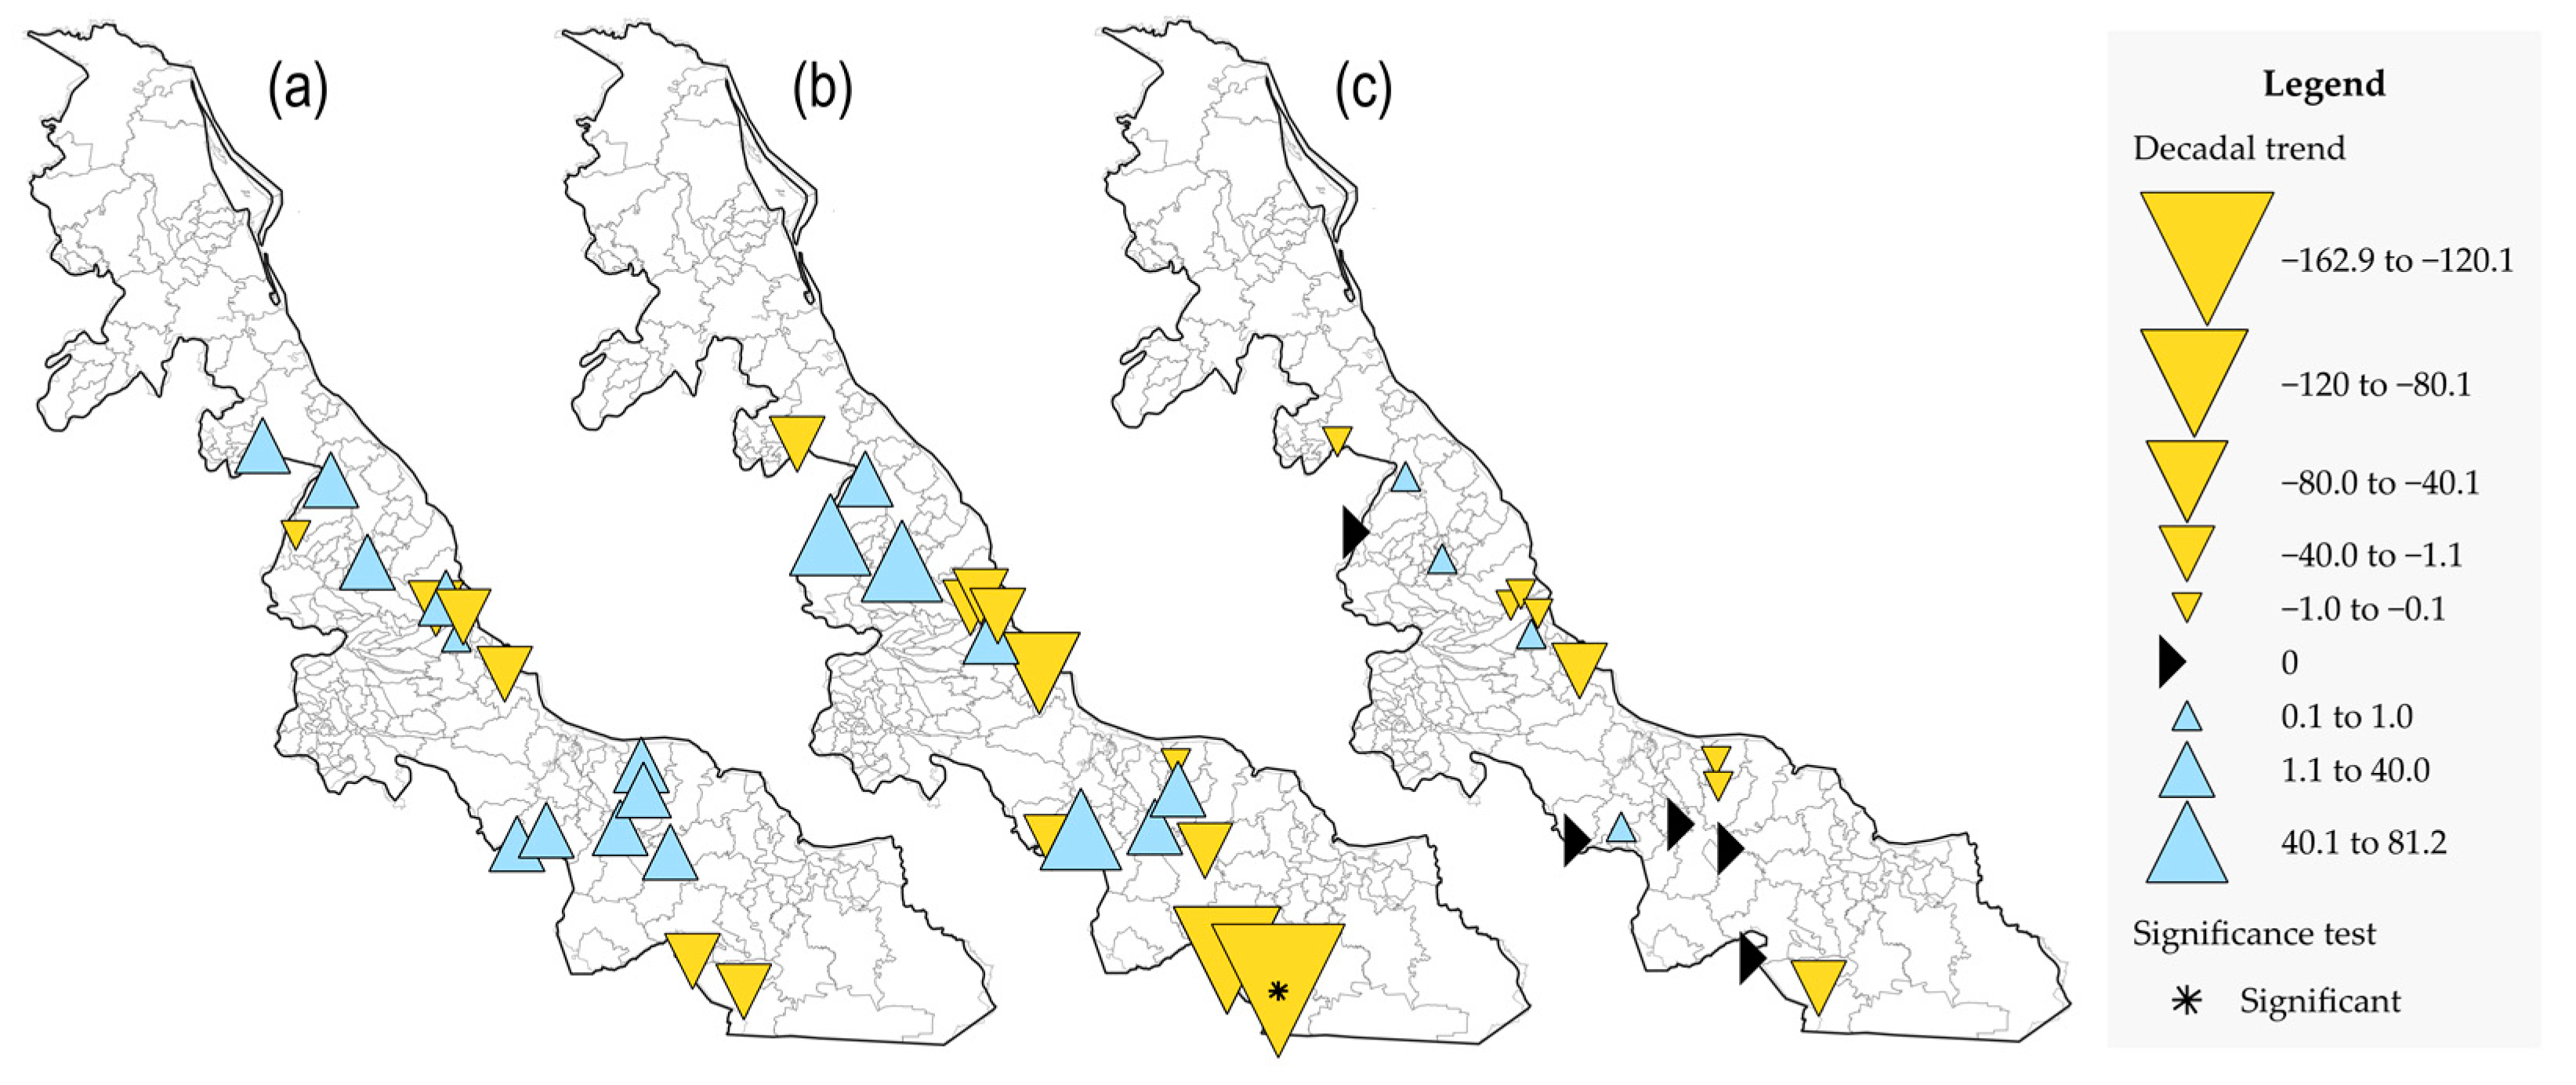
Figure 2 and Table 2 show three of the four indices analyzed in this study. Regarding SPI6, a different and individual analysis is required to ensure its correct interpretation. Only in Jesus Carranza’s municipality is there a statistically significant trend for the PRCPTOT index.
The Rx5day index (Figure 2a) shows increasing positive trends in 11 municipalities, ranging from 0.7 to 20.5 mm/decade, concentrated mainly on the coastal plain and part of the mountainous region. In the remaining municipalities, decreasing trends are observed, mainly in the State’s southern and central coast.
In Figure 2b, the PRCPTOT index shows positive trends in seven municipalities; specifically, significant statistical changes are detected in the municipalities of Atzalan, Naolinco, and Cosamaloapan de Carpio, with increments of 81.0, 50.5, and 48.3 mm/decade, respectively (Table 2). On the other hand, decremental trends were found in 10 of the 17 analyzed sites. The most negative trends were found in the south of Veracruz, in San Juan Evangelista (92.7 mm per decade) and Jesús Carranza (162.9 mm per decade) (Table 2).
Furthermore, the R20mm index (Figure 2c) shows four municipalities with increasing trends, eight with decreasing trends, and five with no trend, with magnitudes between −1 and 1 day/decade. It is worth noting that the decreasing trends are observed mainly on the State’s central coast.
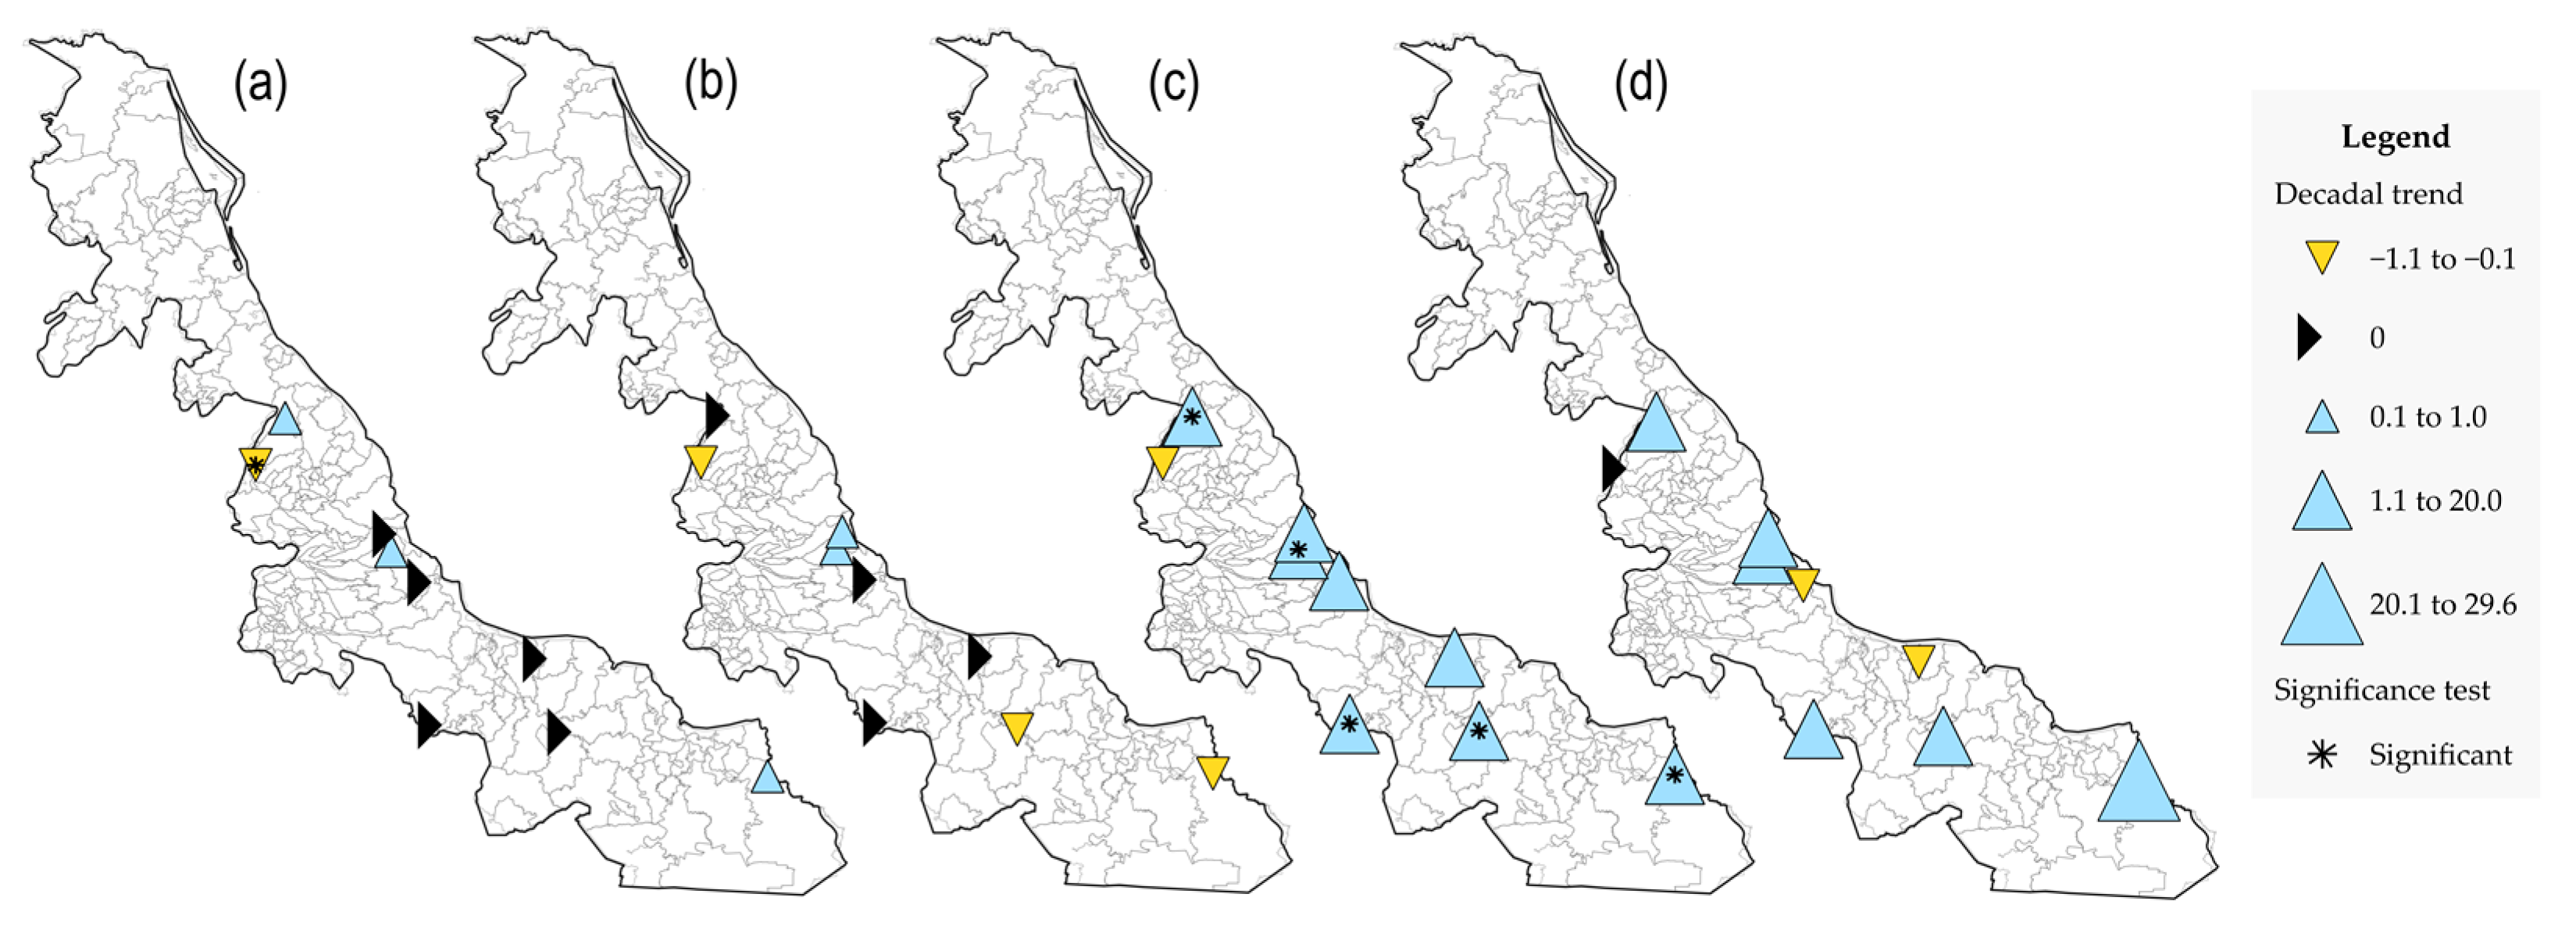
3.1.2. Temperature Indices
The TXx index (Figure 3a) shows five of nine municipalities with zero trend. These locations are La Antigua, Medellín, Ángel R. Cabada, and Cosamaloapan de Carpio, located on Veracruz’s coast and coastal plain. On the other hand, positive trends are observed in Martínez de la Torre and Las Choapas, with relevant growth of 0.7 and 1.1 °C/decade, respectively. In addition, it should be noted that only the municipality of Atzalan has a statistically significant negative trend of −1.1 °C/decade (Table 3).
Similarly, the TNn index (Figure 3b shows four municipalities with no trend (Martínez de la Torre, Medellín, Cosamaloapan de Carpio, and Ángel R. Cabada). However, negative and statistically significant trends are observed in Atzalan, Hueyapan de Ocampo, and Las Choapas, with changes between −1 and 1 °C per decade (Table 3).
Eight of nine municipalities show increasing trends for the TXgt50p index (Figure 3c). The trends are statistically significant in Martínez de la Torre, Paso de Ovejas, Cosamaloapan de Carpio, Hueyapan de Ocampo, and Las Choapas, with growth trends of up to 20.0% per decade. The only decreasing trend is located in Atzalan (although not significant), as in the TXx index; however, its magnitude is minimal (0.04%/decade) (Table 3).
Six out of nine sites show positive trends for the TXge35 index (Figure 3d). The highest was found in Las Choapas, with a growth of 29.6 days per decade (Table 3). On the other hand, decreasing trends are observed in the coastal municipalities of Medellín and Ángel R. Cabada. In addition, a trend equal to zero is shown in Atzalan.
3.2. Relationship between Sectoral Climate Indices of the ET-SCI and Maize Yields
The correlations between the sectoral climate indices obtained by the spring-summer agricultural cycle and the yield values of rainfed maize for 2003–2018 are shown below.
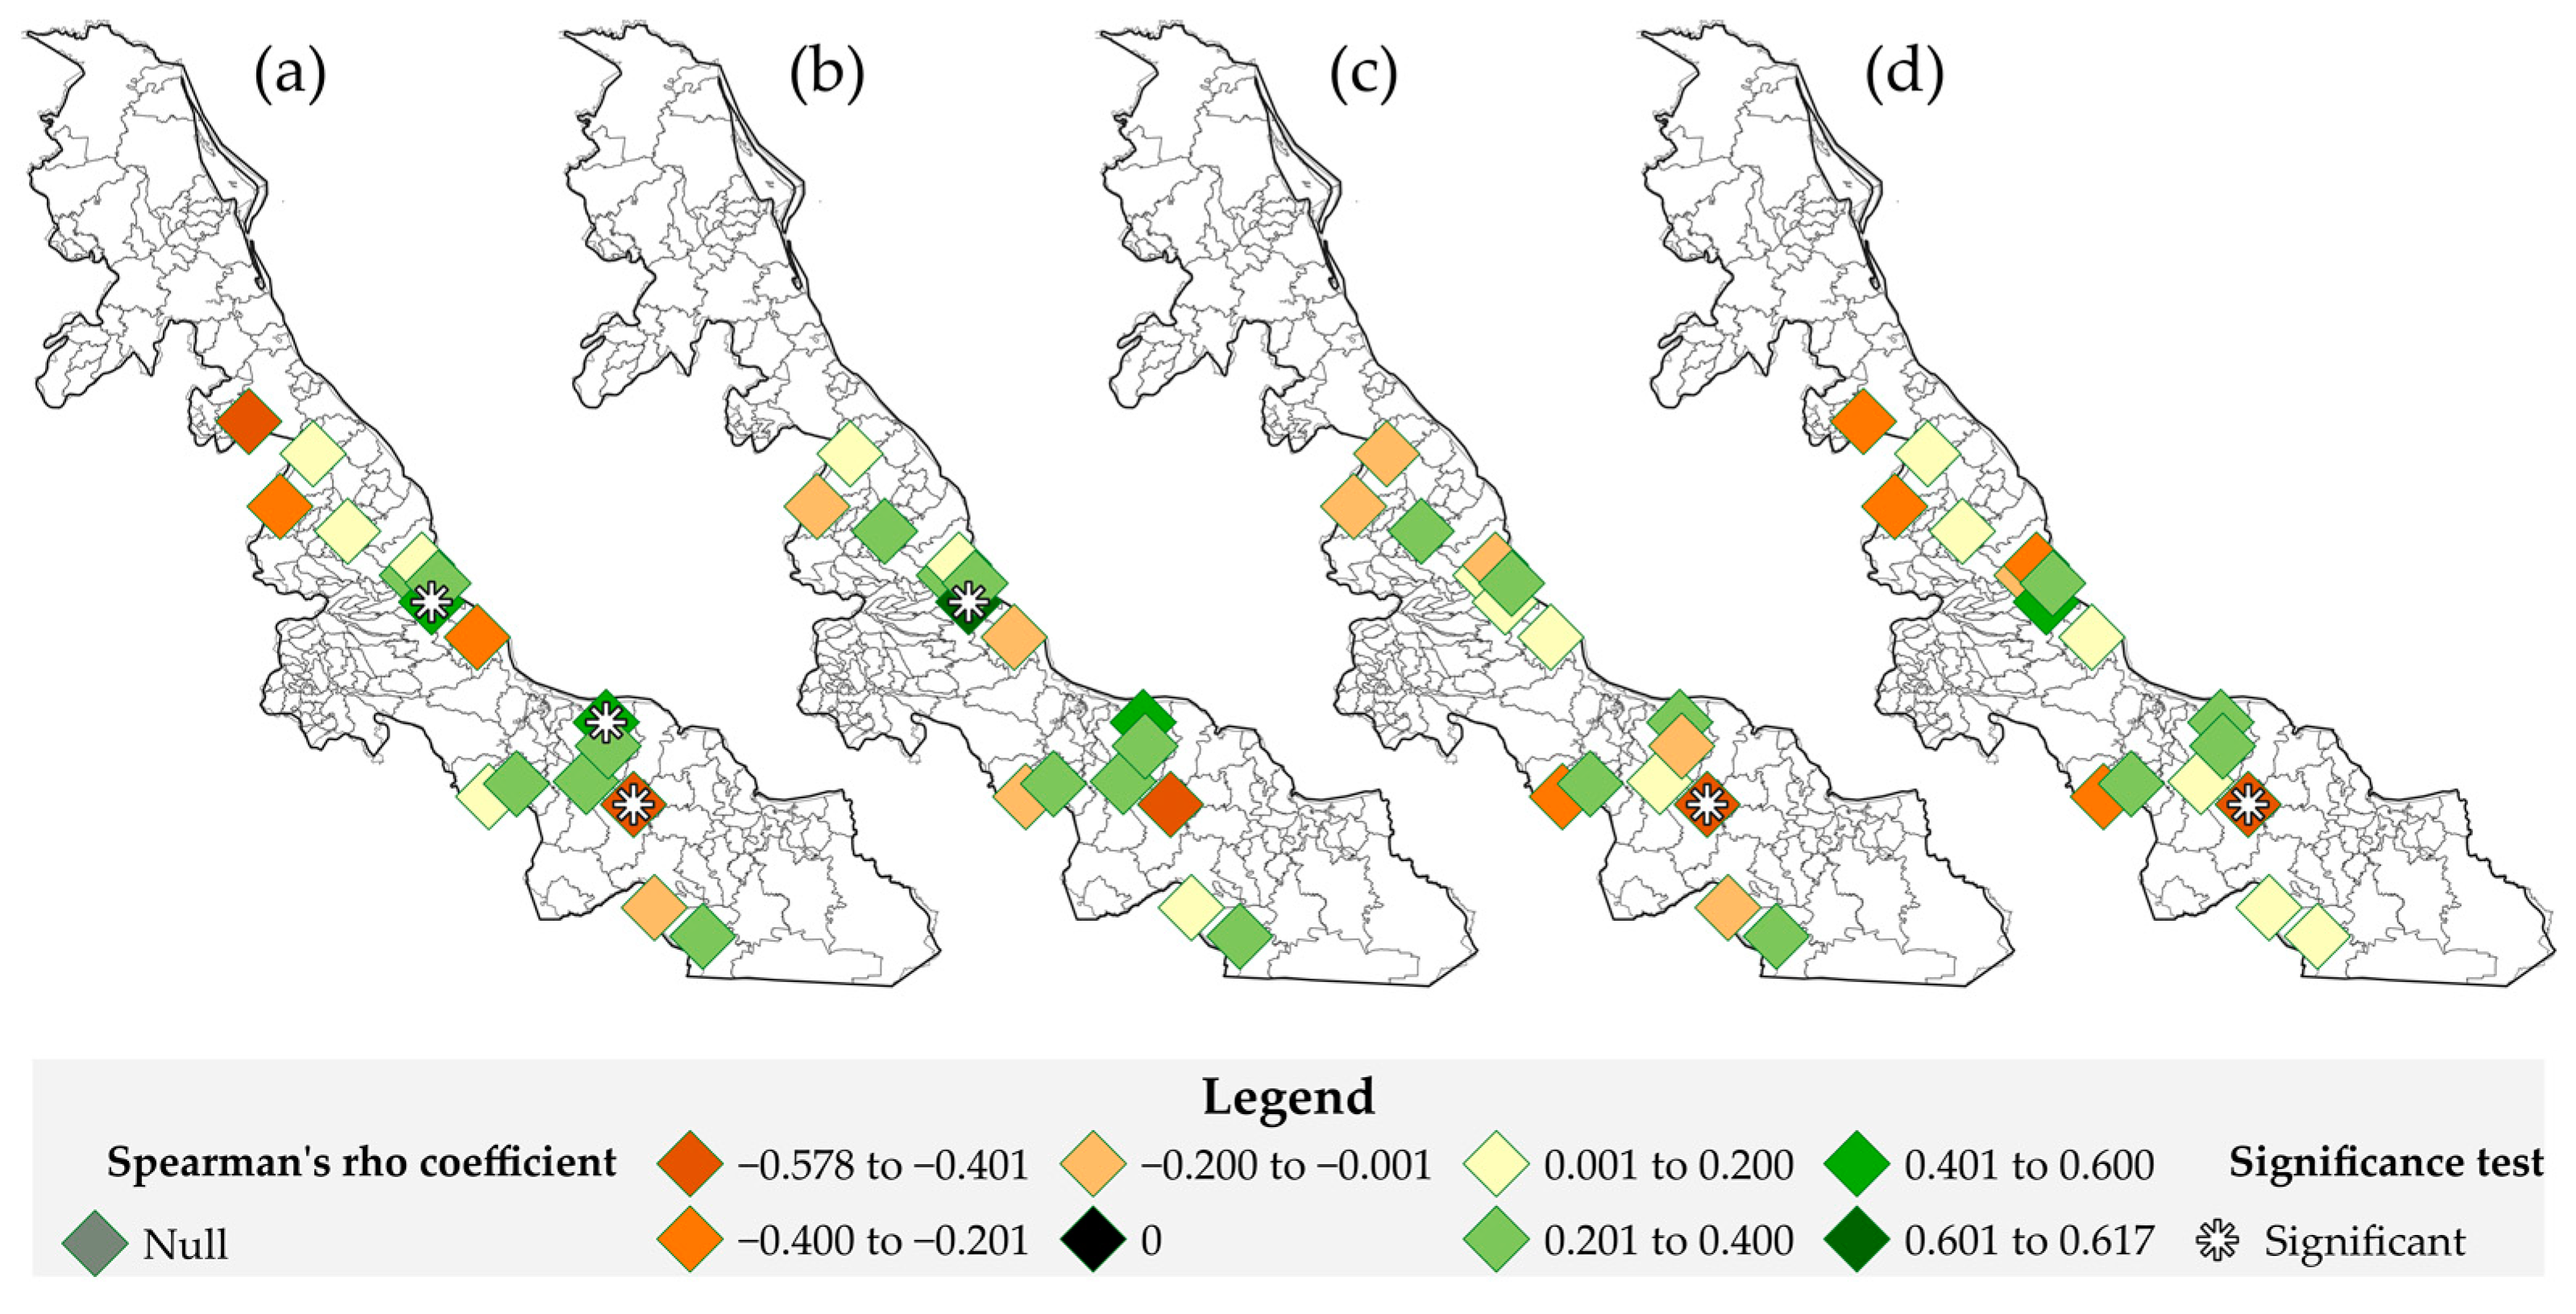
3.2.1. Precipitation Indices Versus Maize Yields
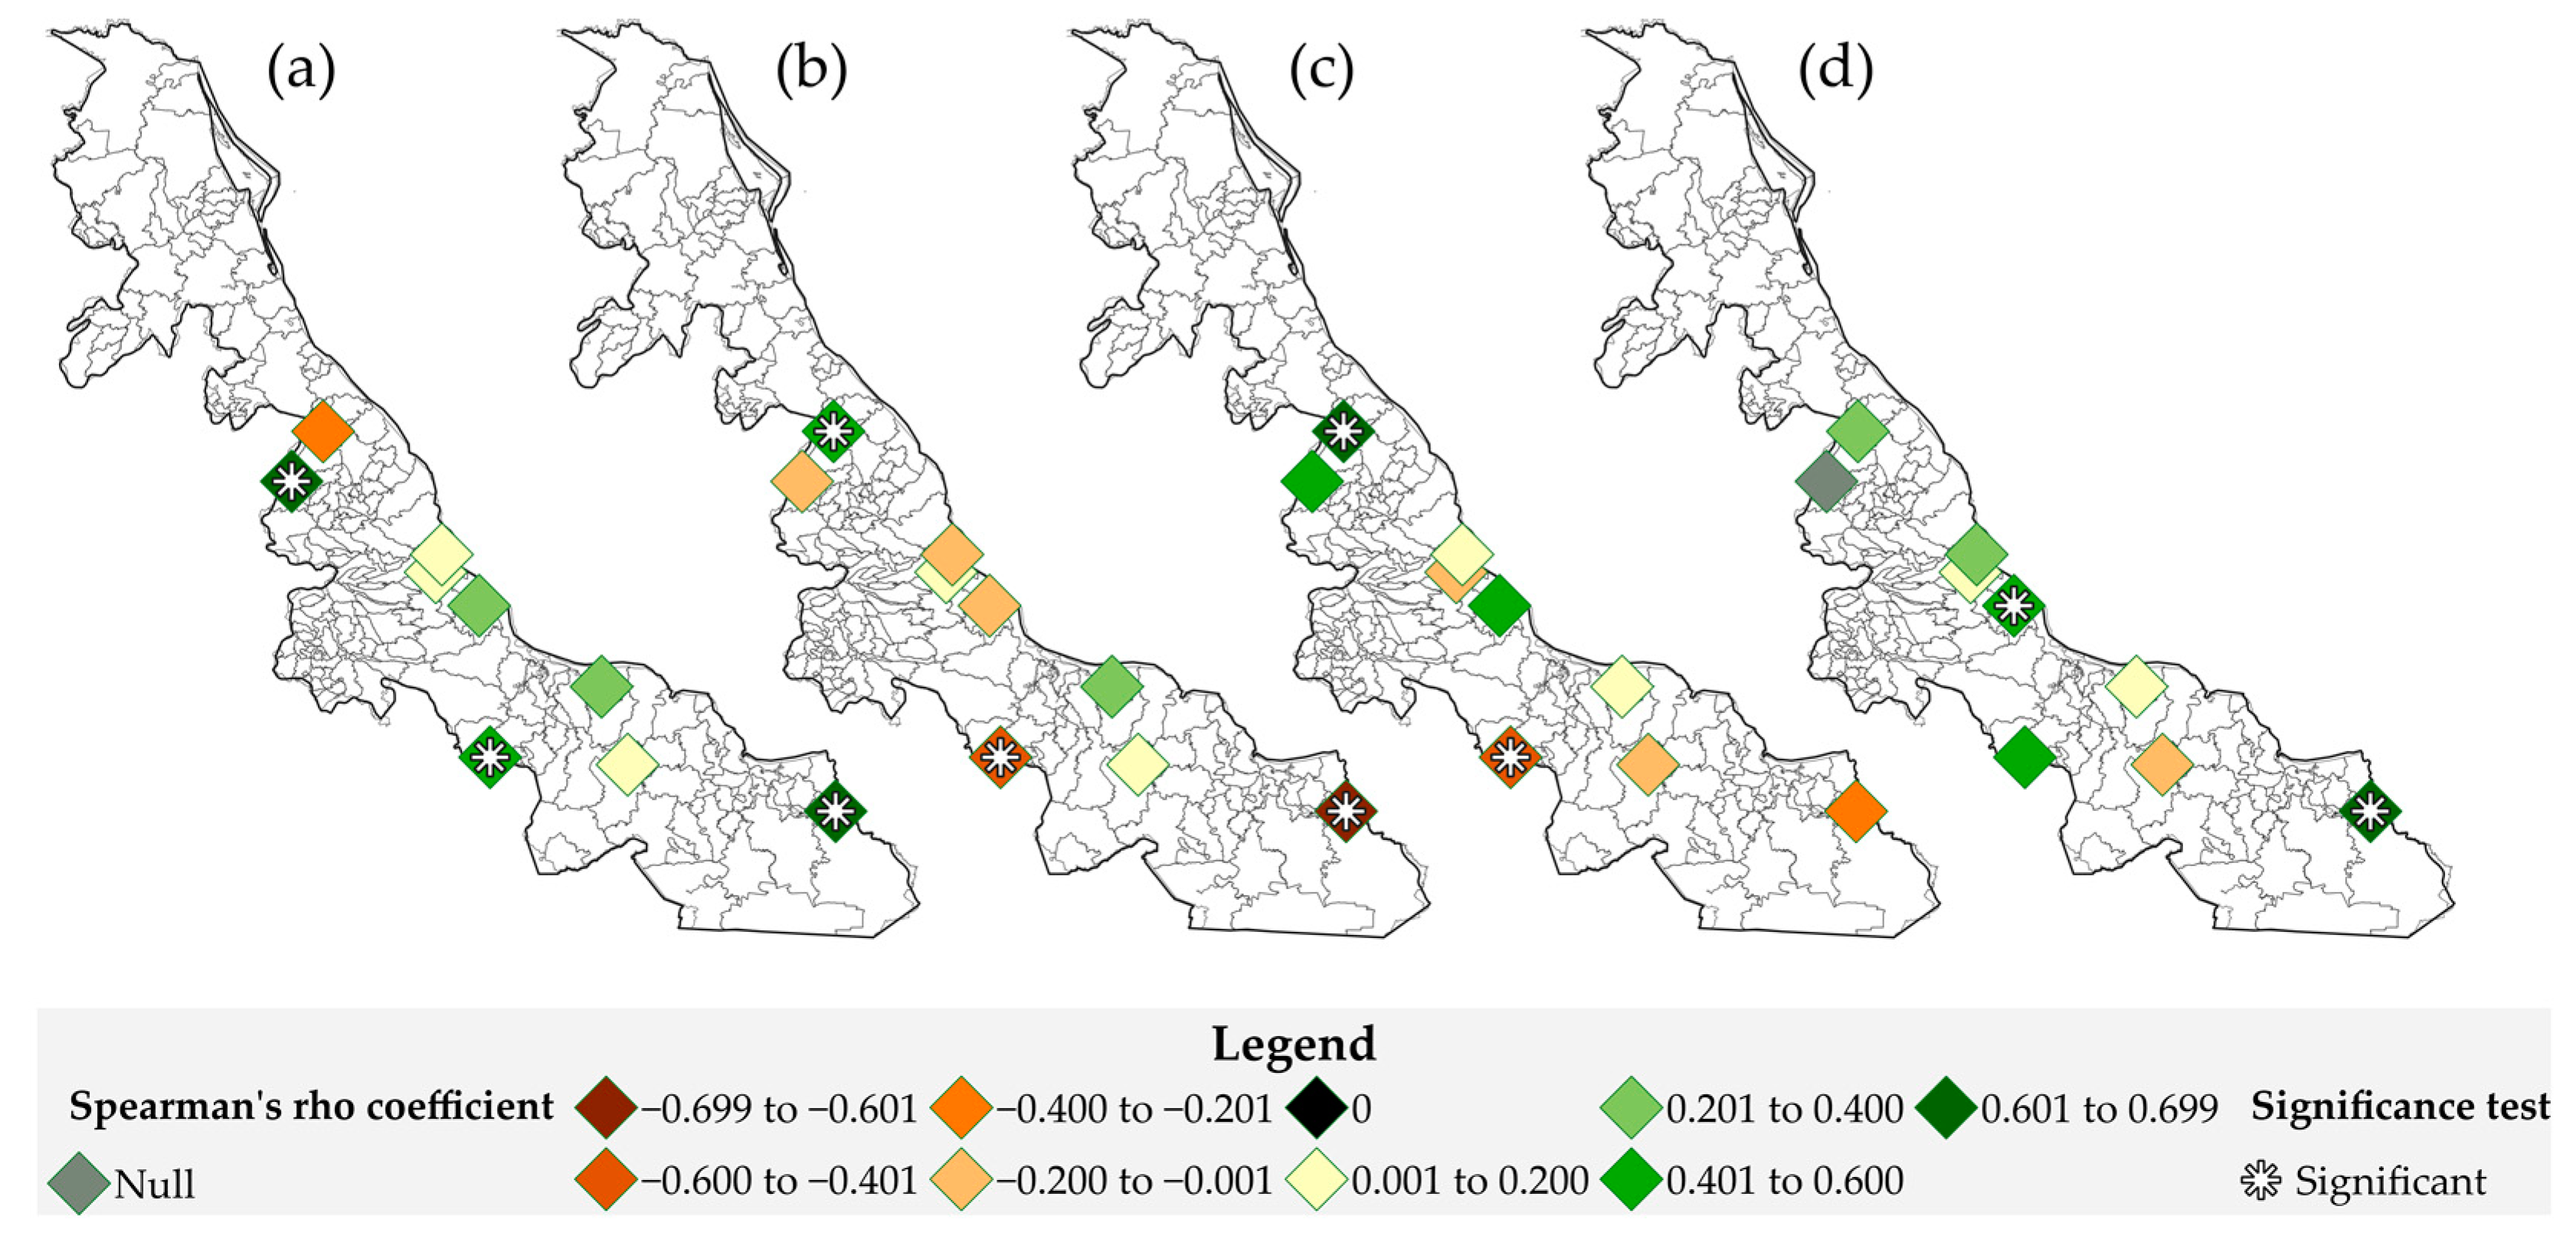
The Rx5day index (Figure 4a) indicates positive correlations in 12 municipalities, with statistical significance in Ángel R. Cabada and Paso de Ovejas. Conversely, negative correlations are observed in five municipalities with statistical significance in Hueyapan de Ocampo.
Similarly, in the PRCPTOT index (Figure 4b), positive correlations were found in 12 municipalities, with a statistically significant value in Paso de Ovejas. Concerning the five negative correlations, no statistical significance was observed.
On the other hand, for the SPI6 (Figure 4c), positive correlations are shown in nine municipalities without statistically significant values in any site and negative correlations in eight municipalities with statistical significance only in Hueyapan de Ocampo.
Regarding the R20mm index (Figure 4d), positive correlations were found in eleven municipalities without statistically significant values in any site. In contrast, one statistically significant value was found in Hueyapan de Ocampo for the six negative correlations.
3.2.2. Temperature Indices Versus Maize Yields
In Figure 5a, the TXx index shows eight of nine municipalities with positive correlations, with statistical significance in three municipalities: Atzalan, Cosamaloapan de Carpio, and Las Choapas, whereas the only negative correlation was found in the municipality of Martínez de la Torre, although it was not statistically significant.
Regarding the TNn index (Figure 5b), positive correlations are detected in four municipalities with statistical significance in Martínez de la Torre. In contrast, negative correlations are shown in five municipalities, with statistically significant values in Cosamaloapan de Carpio and Las Choapas.
In the case of the TXgt50p index (Figure 5c), positive correlations are observed in five municipalities, with statistical significance only in Martínez de la Torre. The remaining municipalities showed negative correlations, with a statistically significant value in Cosamaloapan de Carpio.
Finally, for the TXge35 index (Figure 5d), a similar case to the TXx index is shown, where eight out of nine municipalities present positive correlations, with statistical significance in Medellín and Las Choapas. On the other hand, the negative correlation observed in Hueyapan de Ocampo was not statistically significant.
3.3. Correlation Analysis in the Municipalities with Statistical Significance
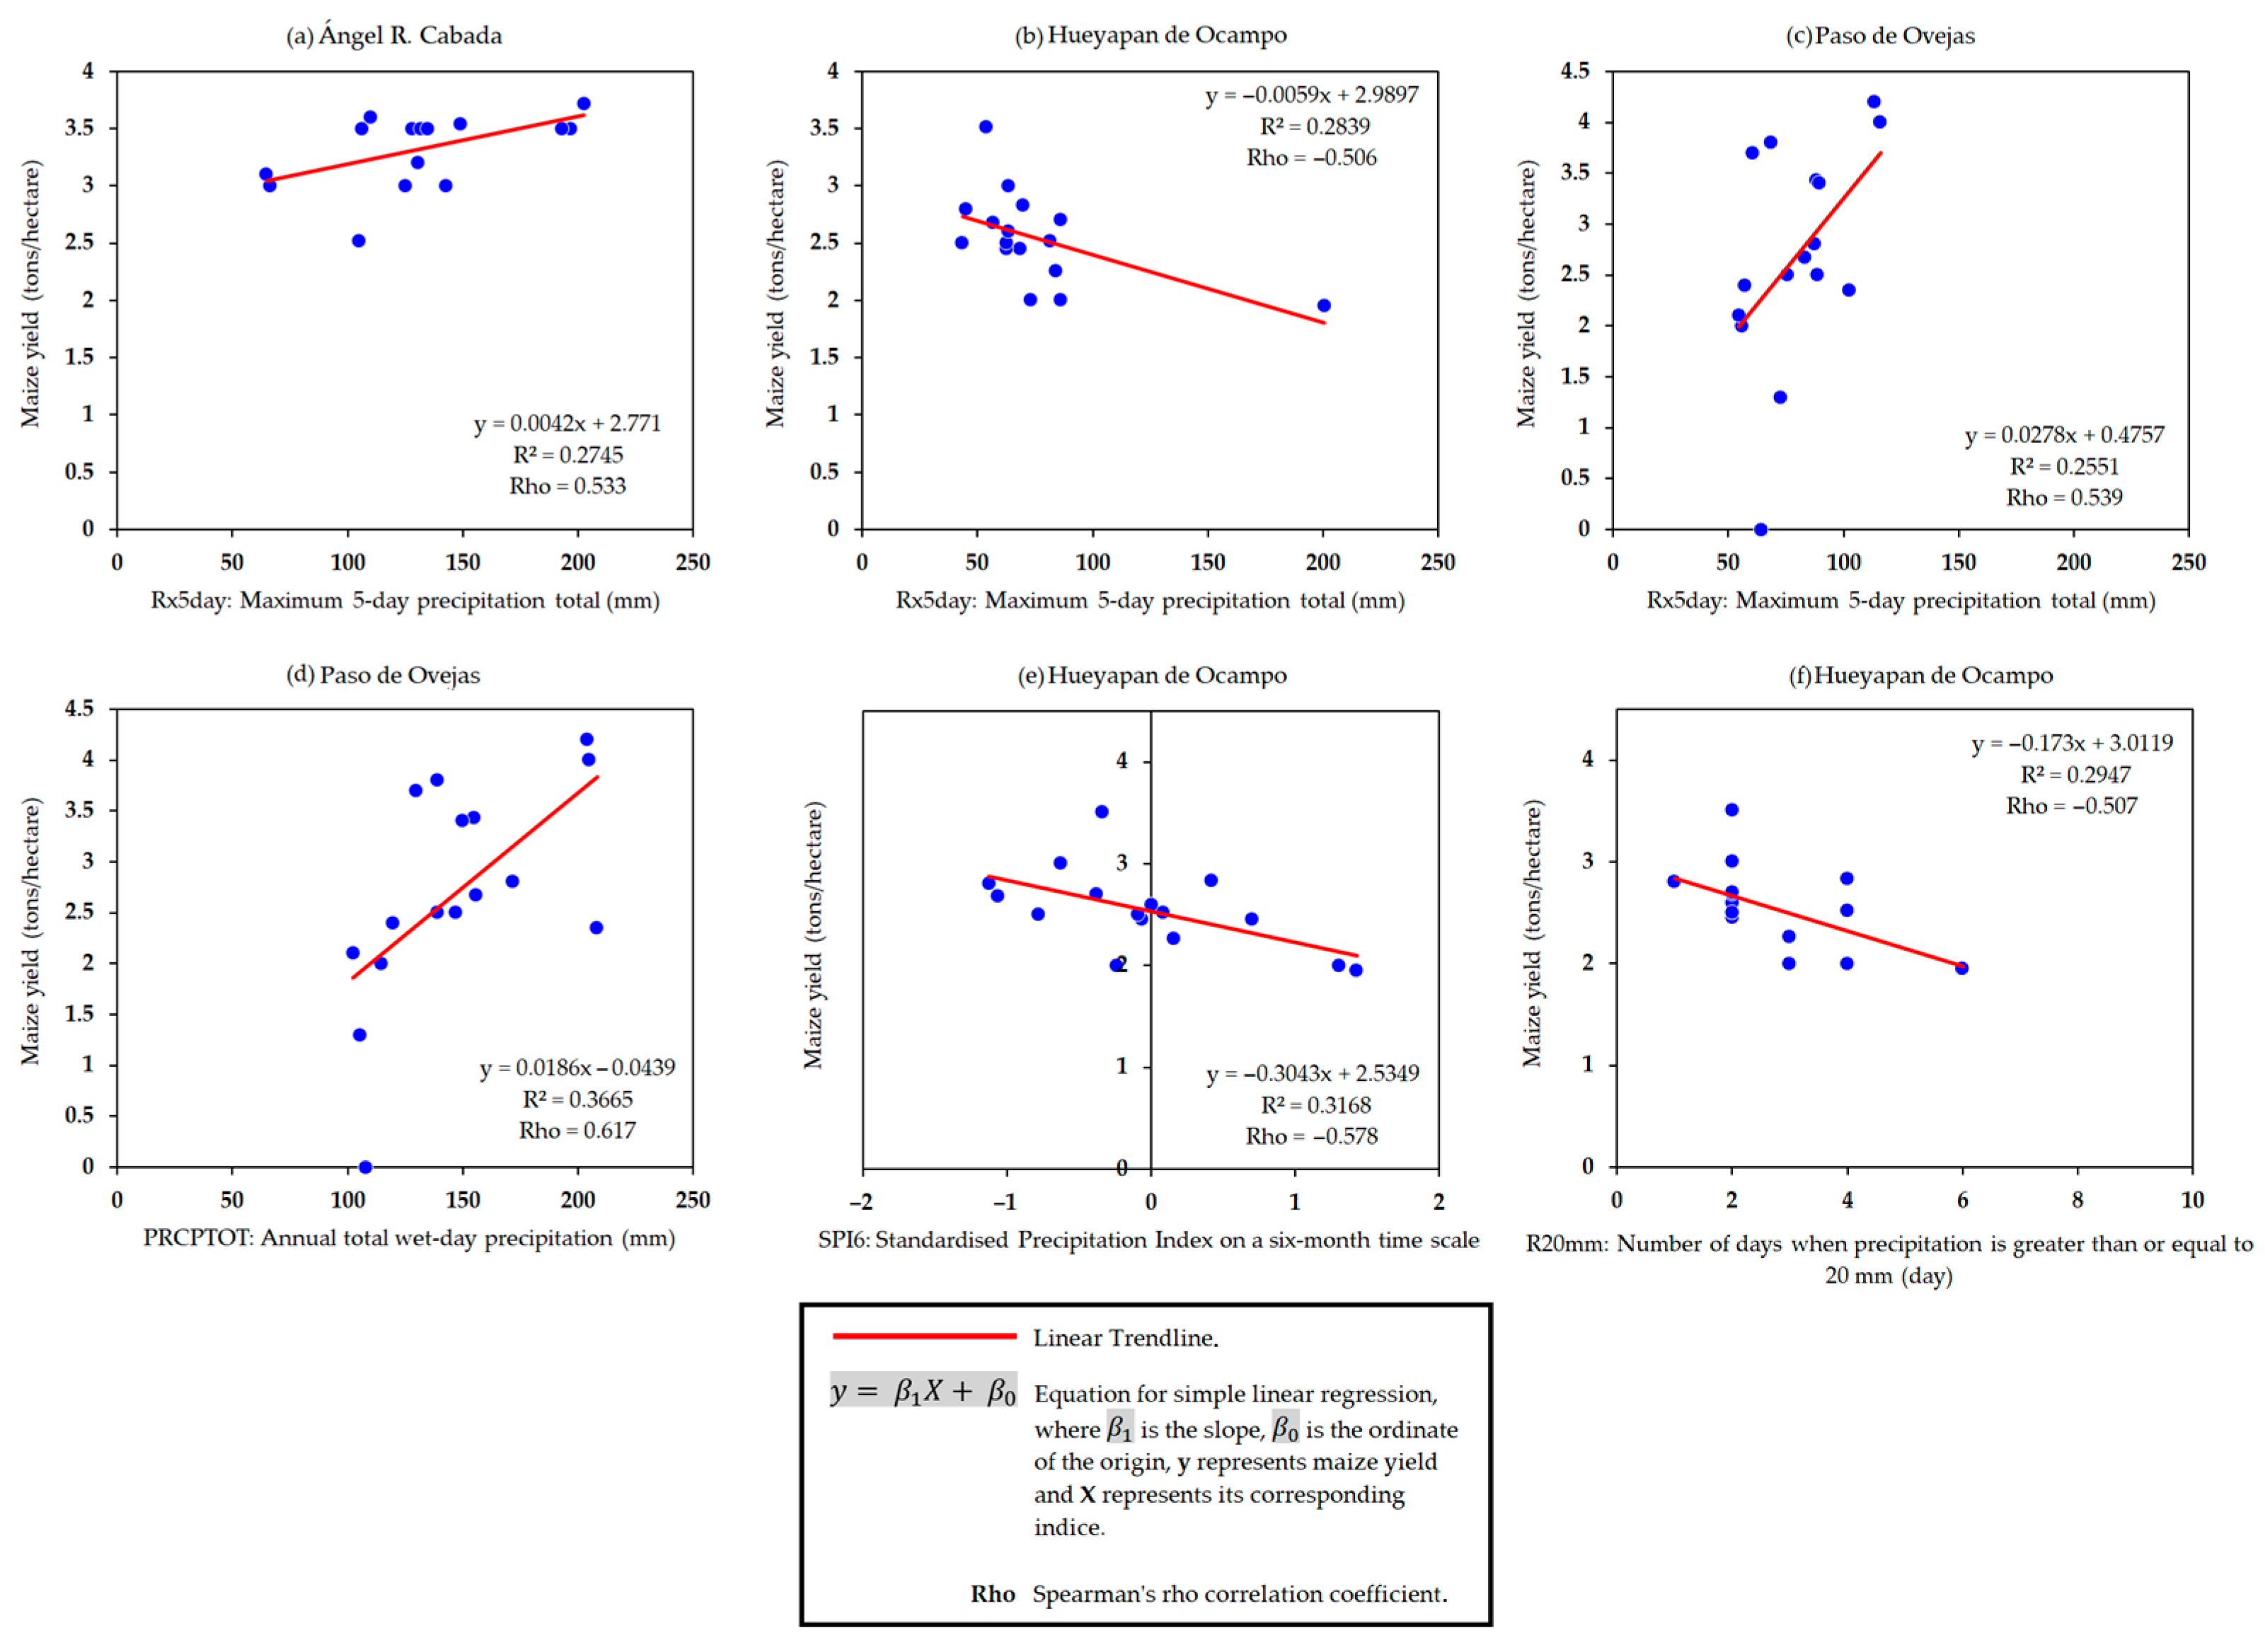
Front the total number of correlations obtained between the precipitation indices and maize yields, only 9% were statistically significant. Figure 6 shows the linear regression graphs of the municipalities where statistical significance was found for precipitation rates.
This figure shows the positive correlations with coefficients greater than 0.50 between the Rx5day and PRCPTOT indices and maize yield (Figure 6a,d,c). The determination coefficients indicate that the maximum rainfall accumulated in 5 days (Rx5day) and the total annual precipitation (PRCPTOT) explain about 37% of the maize yields.
On the other hand, the negative correlations show coefficients less than −0.50 between the Rx5day, SPI6, and R20mm indices and maize yield (Figure 6b,e,f). The determination coefficients show that the indices explain between 29% and 31% of the maize yields.
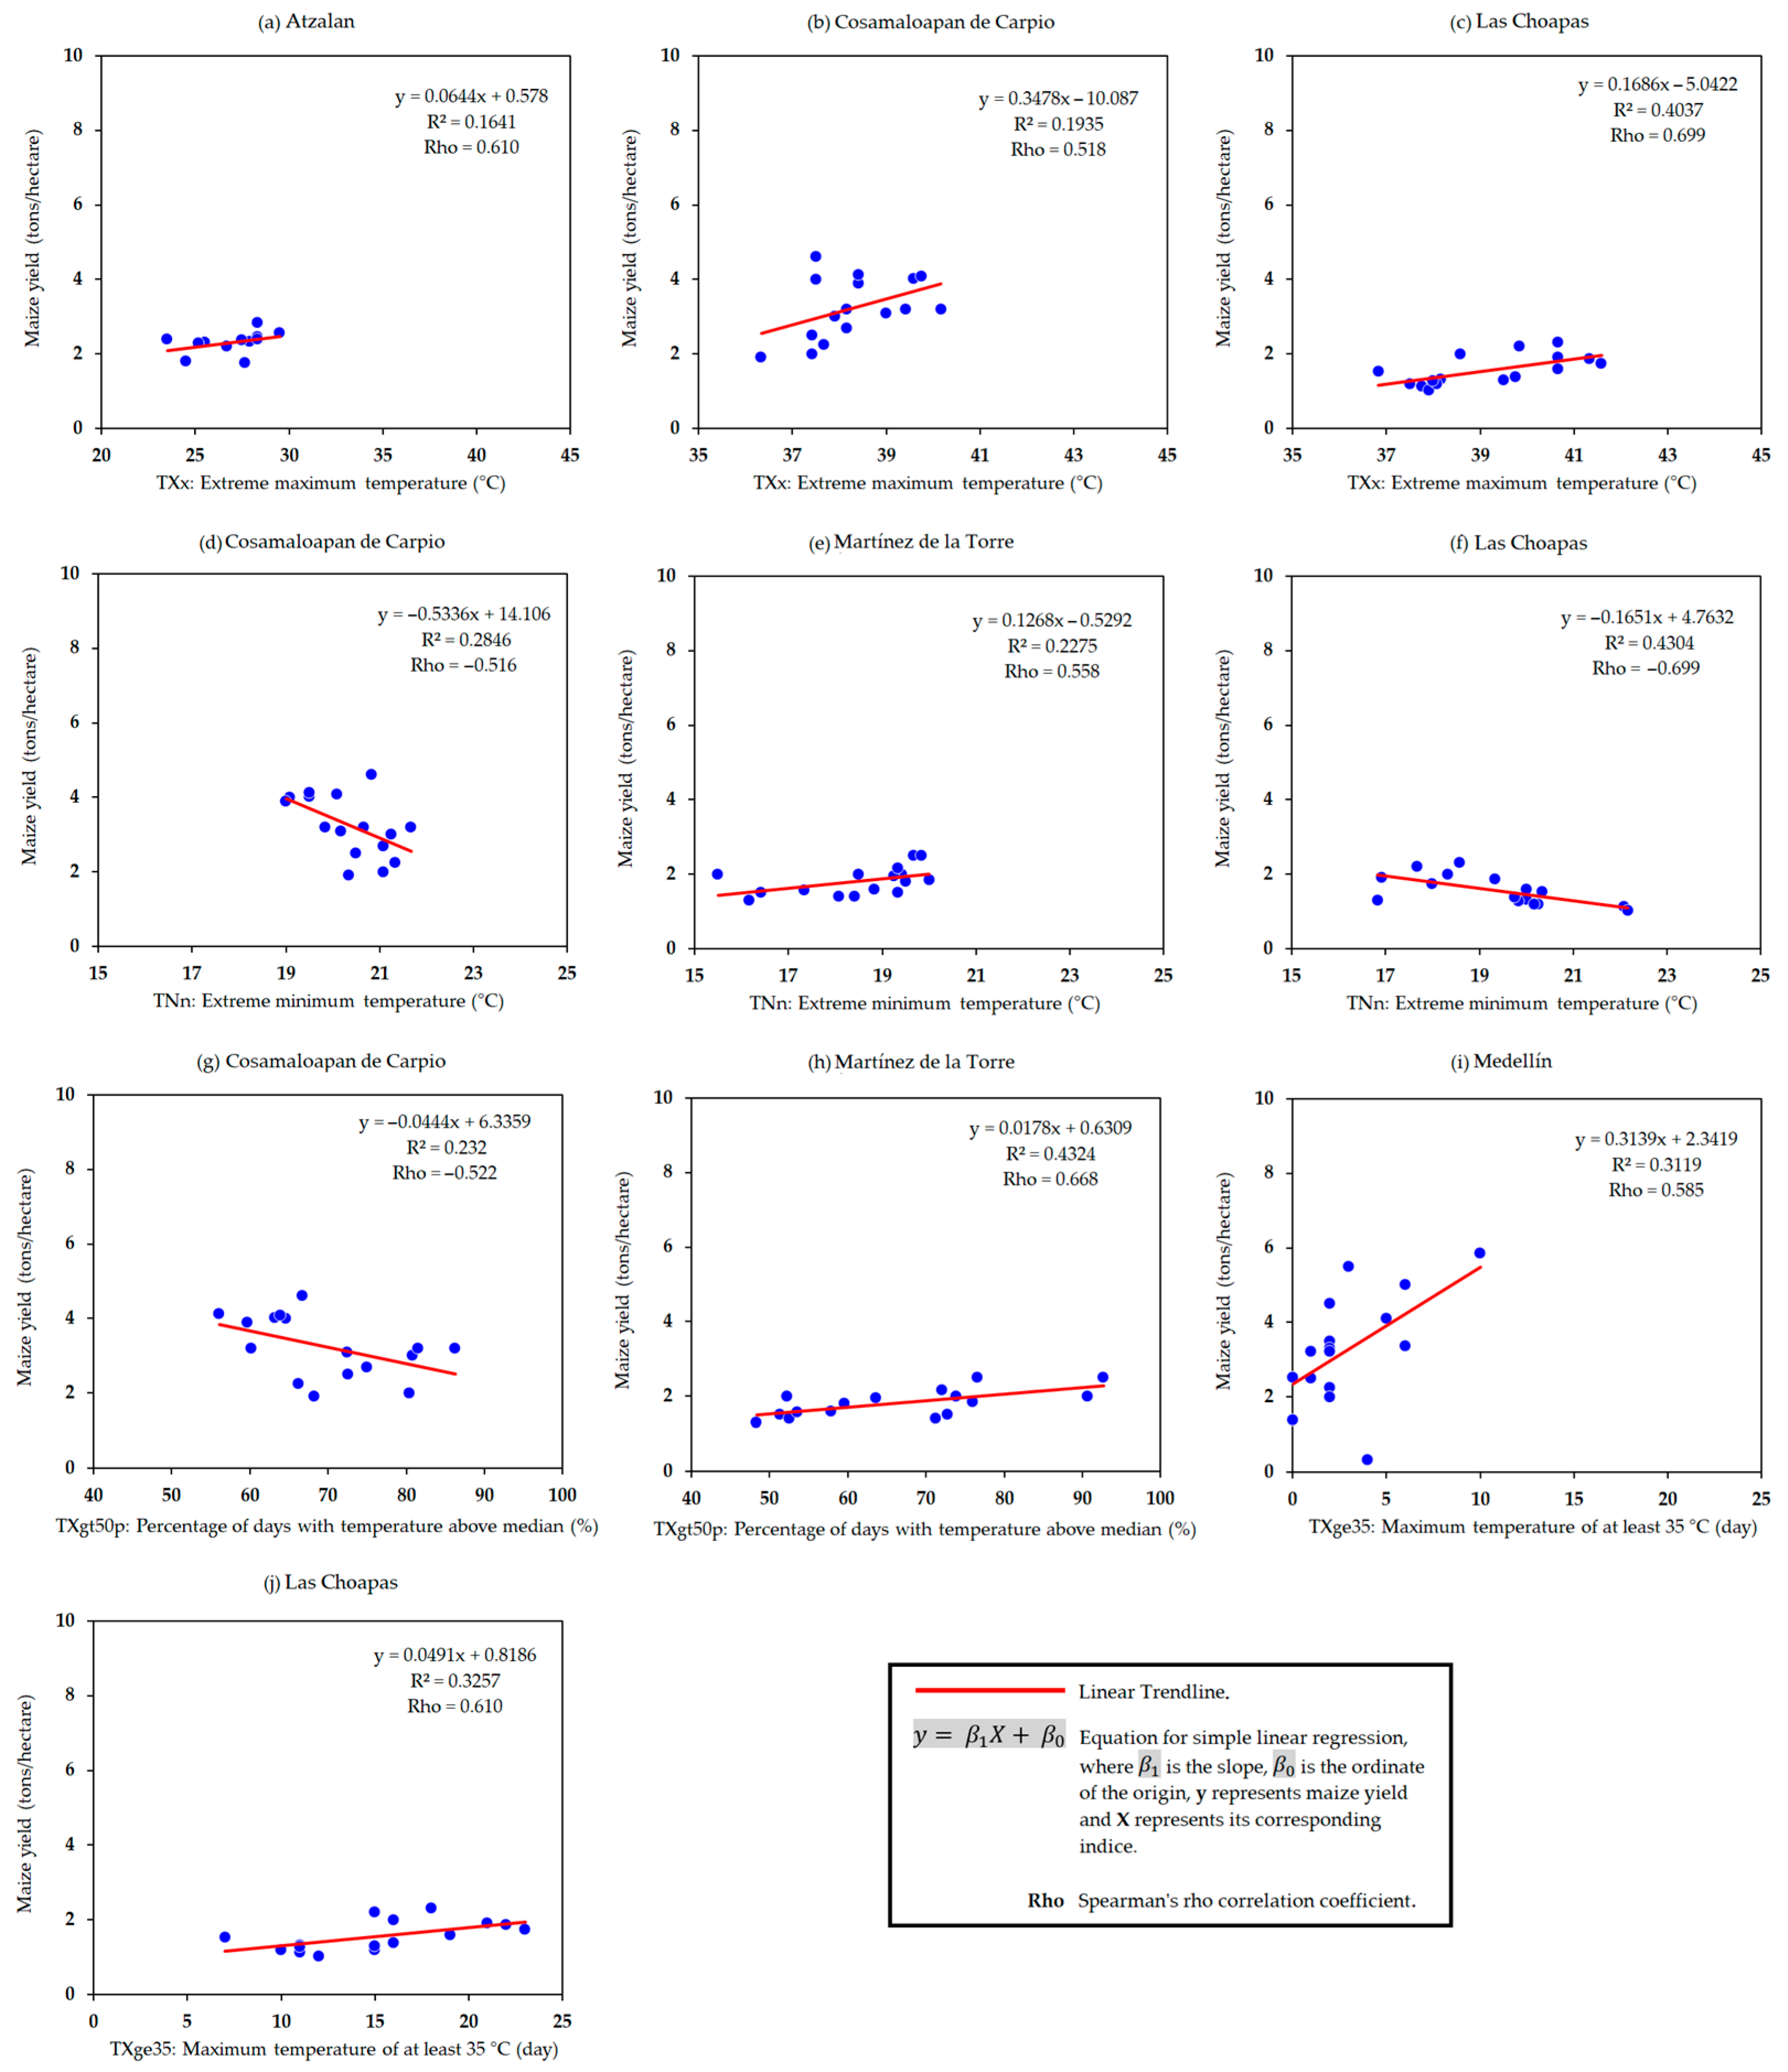
Regarding the correlations obtained between the temperature indices and maize yields, 29% were statistically significant. Figure 7 shows the linear regression graphs of the municipalities where statistical significance was found in the temperature indices analyzed.
This figure shows positive correlations between 0.518 and 0.699 between the four indices (TXx, TNn, TXgt50p, and TXge35) and maize yield in five municipalities (Figure 6a–c,e,h–j). In contrast, negative correlations were obtained in two municipalities between the indices of TNn and TXgt50p and maize yield, with coefficients between −0.699 and −0.516 (Figure 7d,f,g). It is observed that the determination coefficients for any temperature index explain between 16% and 45% of the maize yields (Figure 7a–j).
4. Discussion
4.1. Climate Indices Trends
Regarding the precipitation indices, increasing trends are detected for the Rx5day index in 65% of the analyzed municipalities. This trend means extreme precipitation persists during more extended periods (RX5day), reaching accumulated values of 20.5 mm/decade. On the other hand, decreasing trends were found for the PRCPTOT index in 59% of the studied sites, which means that the total annual precipitation in the State is decreasing up to 162.9 mm per decade.
The results presented here are consistent with studies by Félix et al. [12] and Mendoza-Uribe [20], who found decreasing trends in the PRCPTOT index and an increase in precipitation intensity (RX5day) at the local level. Likewise, Tejeda-Martínez [3] mentions that until 2019, Veracruz has less precipitation, on average, than two decades ago.
No clear trend is shown for the R20mm index; however, in 47% of the municipalities, the trend indicates that rainfall above 20 mm has decreased by approximately 1 day per decade; thus, some sites are experiencing some drier days as concluded in the study by Subba et al. [36].
In terms of the impact on maize crops, decreases in rainfall intensity and frequency associated with periods of drought and increases in intense precipitation lead to decreases in maize production and could cause the cultivable land available for this crop to be reduced [37].
For temperature indices, increasing trends for TXx, Txgt50p, and TXge35 were perceived in 56%, 89%, and 67% of the sites analyzed, with growths of up to 1.1 °C/decade, 8.6%/decade, and 29.6 day/decade, respectively. These trends indicate that the maximum temperature is increasing per decade in the territory of Veracruz, which can affect maize during the grain-filling phase, causing decrements in yield [38]. In addition, it favors the development of insect and mite pests and the presence of diseases such as the brown spot (Physoderma maydis) and bacterial stalk rot (Erwinia carotovora), which damages maize crops [32].
It should be noted that specifically, in the TXx index, the positive trends found indicate that the extreme maximum temperature has increased by 0.7 and 1.1 °C per decade in Martínez de la Torre and Las Choapas. The altitude is less than 100 m above sea level in these places, and the maximum average annual temperature is 30 and 31.4 °C, respectively. This trend in TXx is also seen in the results of Hong and Ying [39]; however, the increase found in China was lower (0.21 °C/decade).
Regarding the TNn index, the decreasing trends found in Atzalan and Hueyapan de Ocampo, where the extreme minimum temperature has decreased by about 1 °C per decade, may benefit maize as lowering the minimum temperature has been shown to increase yield (Eyherabide, 2015). However, these sites do not share any similar features.
The same situation should be noted for the precipitation and temperature indices, where a geographic distribution pattern cannot be determined given that the altitudes of the stations range between 8 and 1697 m above sea level and that data coverage is poor. The latter causes much uncertainty in the characterization of the changes in the extremes [13].
Regarding the significance, it should be noted that in precipitation, a significant trend is only shown in the municipality of Jesús Carranza. In contrast, in temperature, significant values can be observed in Atzalan, Martínez de la Torre, Paso de Ovejas, Cosamaloapan de Carpio, Las Choapas, and Hueyapan de Ocampo. Even when trends may or may not be significant, it should be noted that the indices trend analysis is needed to quantify the magnitude at which climate variables could have more significant changes over long periods [12,40].
4.2. Correlations
The correlation between sectoral climate indices and rainfed maize yields for the spring-summer cycle (2003–2018) found that 16% of Spearman’s rho coefficients indicated a statistical significance, with 62% positive and 38% negative. Based on these results, extreme precipitation and temperature events may positively or negatively impact maize yields depending on the site conditions, as revealed by Ahumada Cervantes et al. [41], Bada-Carbajal et al. [4], and Valdés-Rodríguez et al. [42].
For example, the precipitation index in the municipality of Ángel R. Cabada indicated that the increment in the maximum 5-day precipitation total (Rx5day) positively impacts maize yields. Ángel R. Cabada is one of the municipalities with the highest accumulated precipitation in the months of the spring-summer cycle (1524.4 mm) [29]. However, this high precipitation is not impacting maize; therefore, exploring other non-climate variables influencing the increase in its yield is necessary.
On the other hand, in the municipality of Hueyapan de Ocampo, it is shown that the maximum 5-day precipitation total (Rx5day) is negatively impacting maize yields. This site has accumulated rain during the spring-summer cycle lower than 950 mm. Therefore, if rain indices decrease, maize production will increase its yield because this crop needs precipitations above 1000 mm for the highest yields [26]. Likewise, the SPI6 index is also negatively impacting maize yields on this site. However, it cannot be directly attributed to SPI6 because the outliers found in the years 2007, 2010, 2012, and 2016 coincide with tropical cyclones that impacted the region and caused agricultural losses during these years [29,42,43].
In contrast, in the municipality of Paso de Ovejas, it is observed that the increments in the maximum 5-day precipitation total index (Rx5day) and the total annual precipitation (PRCPTOT) have a positive impact on maize yields since the latter increased during 2003–2018. According to the climatology of Paso de Ovejas [29], the normal accumulative precipitation for the spring-summer cycle is 890.6 mm. This precipitation is close to the minimum range for the agroclimatic requirements of maize for optimal yield [26]. Thus, the increments in these indices provide the additional rain feed necessary for higher yields.
Regarding temperature, the positive and significant correlations between the TXx index and maize yields indicate that the impact is positive in Las Choapas and negative in Atzalan. Las Choapas is located south of Veracruz state, where the highest normal maximum temperature is 33.7 °C [29], being a warm climate. Nevertheless, increments in TXx are not negatively impacting maize yield. These findings do not agree with what was reported by Eyhérabide [38] and Ahumada-Cervantes et al. [41], who indicate that the increase in high temperatures interrupts the development of maize and decreases its yield. Therefore, it is necessary to conduct a deeper analysis to determine which factors influence the increase in maize yield in this specific municipality. In contrast, in Atzalan, it is shown that maize yields for the period 2003–2018 decreased relatively. According to its geographical location and climate, Atzalan is located in the central mountainous region, where the State’s lowest maximum temperatures of 23.7 °C are recorded [29]. Therefore, the extreme maximum temperature (TXx) decrease negatively affects maize because it reduces its agroclimatic capacity to produce maize in the region [26].
TNn index decrement in the municipality of Las Choapas (negative and significant correlation) positively impacts maize yields. According to its climatology, this municipality has normal minimum temperatures of 22.9 °C [29]. Therefore, decreasing the minimum temperature has improved maize yields [29].
Regarding the TXgt50p index, it was found that the increments in the percentage of days with temperature above the median negatively impact maize yields in Cosamaloapan de Carpio. As previously mentioned, this municipality is located in the warmest region of the State; therefore, the increases in maximum temperature reduce maize productivity [29,38]. On the other side, it is observed that increases in TXgt50p have a positive correlation with Martínez de la Torre maize yields. According to the climatology of the site [29], the normal maximum temperatures that can occur in the months of April to September are 33.3 °C. This case is similar to the increases in index TXx in Las Choapas. Thus, we need to perform more profound research to find the causes of this behavior.
The positive and significant correlation between the TXge35 index and maize yield indicates that the impact is negative in Medellín. This site has normal temperatures for the cycle spring-summer of 32.3 °C [29]. Thus, increasing days with a maximum temperature of at least 35 °C impacts maize yields because more than 70% of the decrease in maize yields is due to the high temperatures [44].
In contrast, the TXge35 index is impacting positively in Las Choapas. As mentioned, this site has a normal maximum temperature of 33.7 °C from April to September [29]. However, this specific site shows results that do not correspond with the agroclimatic performance of maize [26], and therefore we still need to investigate the root causes for this behavior.
5. Conclusions
Precipitation and temperature indices in the State of Veracruz, Mexico, indicate that extreme events have changed in frequency and intensity in the last four decades. Specifically, the PRCTOT and R20mm have decreased in intensity and frequency by decade, whereas maximum 5-day precipitation (RX5day) has increased in magnitude by decade. Similarly, the TXx, TXgt50p, and TXge35 indices reveal that the maximum temperature has risen. The correlations between these indices and maize indicate that changes in precipitation and temperature can positively or negatively impact its yields depending on the site’s climatology. This study revealed the positive impacts of increased maximum 5-day precipitation total and annual total wet-day precipitation in two municipalities. However, simultaneously, the reduction of these events had negative repercussions in one municipality. The positive impact of increased maximum temperatures was observed in two locations, whereas three others experienced negative impacts due to temperature decrease. In terms of extreme minimum temperature increase, one municipality demonstrated a positive impact. However, other factors should be explored for the sites where increments in extreme maximum temperatures contrast with agroclimatic maize requirements but are not showing congruence in this research. These findings could be used in decision-making processes to design adaptations to climate change. In addition, detected trends provide insights to research on the development of maize varieties that resist specific climate conditions at the local level. As recommendations, we suggest (a) data rescue activities mainly on sites where currently no observed information is available, (b) analysis of a broader set of climate indices not only for maize but also for various crops, and (c) extending this type of analysis to other regions.
Author Contributions
Conceptualization, C.V.-F.; methodology, C.V.-F. and J.L.V.-A.; software, J.L.V.-A.; validation, C.V.-F.; formal analysis, C.V.-F., O.A.V.-R., J.L.V.-A. and F.S.-M.; investigation, C.V.-F.; resources, C.V.-F.; data curation, C.V.-F.; writing—original draft preparation, C.V.-F.; writing—review and editing, C.V.-F., O.A.V.-R., J.L.V.-A. and F.S.-M.; visualization, O.A.V.-R., J.L.V.-A. and F.S.-M.; supervision, O.A.V.-R. and J.L.V.-A.; project administration, O.A.V.-R.; funding acquisition, C.V.-F. and O.A.V.-R. All authors have read and agreed to the published version of the manuscript.
Funding
This research was funded by the National Council of Science and Technology (CONACYT), CVU number 900812 and scholarship number 783139.
Institutional Review Board Statement
Not applicable.
Informed Consent Statement
Not applicable.
Data Availability Statement
Climate data for this research are publicly available upon request to the National Meteorological Service of the National Water Commission of Mexico (Abbreviated SMN-CONAGUA). Agricultural yield data for maize are publicly available on the Agro-Food and Fisheries Information Service website (Abbreviated SIAP) https://www.gob.mx/siap/acciones-y-programas/produccion-agricola-33119 (accessed on 22 September 2022).
Acknowledgments
Authors acknowledge funding received from the National Council of Science and Technology (CONACYT): CVU 900812; scholarship number 783139; data provision from public services SMN-CONAGUA and SIAP; technical support from Martin Guillén-Cadena and for the support; and English improvements from Olga Reyes.
Conflicts of Interest
The authors declare no conflict of interest.
Appendix A

Table A1.
List of selected climatological stations (1979–2018) for precipitation and temperature and municipality in which each one is located.
Table A1.
List of selected climatological stations (1979–2018) for precipitation and temperature and municipality in which each one is located.
| # | Indices | ID | Station | Municipality | Longitude | Latitude | Altitude |
|---|---|---|---|---|---|---|---|
| 1 | prcp-tmp | 30011 | Ángel R. Cabada | Ángel R. Cabada | −95.447222 | 18.597222 | 28 |
| 2 | prcp-tmp | 30012 | Atzalan | Atzalan | −97.245833 | 19.788889 | 1697 |
| 3 | prcp-tmp | 30025 | Ciudad Alemán | Cosamaloapan de Carpio ## | −96.094444 | 18.1875 | 35 |
| 4 | prcp-tmp | 30035 | Cuatotolapan | Hueyapan de Ocampo | −95.295833 | 18.144444 | 20 |
| 5 | prcp-tmp | 30056 | El Tejar | Medellín | −96.158333 | 19.067222 | 10 |
| 6 | Prcp | 30058 | Espinal (CFE) | Espinal | −97.418611 | 20.257778 | 62 |
| 7 | Prcp | 30068 | Los ídolos | Actopan ## | −96.516389 | 19.408333 | 100 |
| 8 | Prcp | 30081 | La Florencia | San Juan Evangelista | −95.180556 | 17.575 | 109 |
| 9 | Prcp | 30090 | Las Perlas | Jesús Carranza | −94.913889 | 17.416667 | 22 |
| 10 | prcp-tmp | 30093 | Loma Fina | Paso de Ovejas | −96.41 | 19.261389 | 41 |
| 11 | prcp-tmp | 30102 | Martínez De La Torre (DGE) | Martínez de la Torre | −97.063889 | 20.079167 | 89 |
| 12 | Prcp | 30114 | Naolinco De Victoria | Naolinco | −96.873056 | 19.651944 | 1542 |
| 13 | Prcp | 30117 | Paraíso Novillero | Cosamaloapan de Carpio ## | −95.941667 | 18.258333 | 8 |
| 14 | Prcp | 30152 | Garro | Isla | −95.556944 | 18.270556 | 20 |
| 15 | Prcp | 30158 | Santa Rosa | Actopan ## | −96.463889 | 19.465278 | 65 |
| 16 | Tmp | 30167 | Tancochapa | Las Choapas | −94.088889 | 17.873611 | 13 |
| 17 | Prcp | 30189 | Tres Zapotes | Santiago Tuxtla | −95.436111 | 18.466667 | 28 |
| 18 | prcp-tmp | 30193 | José Cardel | La Antigua | −96.374444 | 19.364722 | 28 |
The “Indices”column Indices indicates whether temperature index (tmp), precipitation index (prcp), or both indices (prcp-tmp) were calculated, ## indicates that the municipality is repeated because it has two stations. Modified from SMN [29].
References
- IPCC (Intergovernmental Panel on Climate Change) Climate Change 2022—Impacts, Adaptation and Vulnerability—Summary for Policymakers. In Climate Change 2022: Impacts, Adaptation, and Vulnerability; Pörtner, D.C.; Roberts, E.S.; Poloczanska, K.; Mintenbeck, M.; Tignor, A.; Alegría, M.; Craig, S.; Langsdorf, S.; Löschke, V.; Möller, A.O. (Eds.) Cambridge University Press: Cambridge, UK, 2022; p. 40. ISBN 9789291691593. [Google Scholar]
- INECC (Instituto Nacional de Ecología y Cambio Climático). Atlas Nacional de Vulnerabilidad Al Cambio Climático, 1st ed.; Libro electrónico: Ciudad de México, México, 2019. [Google Scholar]
- Tejeda Martínez, A.; Del Valle Cárdenas, B.; Welsh Rodríguez, C.M.; Ochoa Martínez, C.A.; Méndez Pérez, I.R. Veracruz, Una Década Ante El Cambio Climático; Primera, Ed.; Gobierno del Estado de Veracruz: Xalapa, Veracruz, 2020; ISBN 9786078489701. [Google Scholar]
- Bada-Carbajal, L.M.; Osorio-Antonia, J.; Ramírez-Hernández, Z. Evolución de La Producción Del Maíz En Veracruz, México. Investig. Adm. 2021, 50, 1–19. [Google Scholar] [CrossRef]
- Zhang, X.; Yang, F. RClimDex (1.0) User Manual. Available online: https://acmad.net/rcc/procedure/RClimDexUserManual.pdf (accessed on 9 May 2022).
- Vázquez Aguirre, J.L. Guía Para El Cálculo y Uso de Índices de Cambio Climático En México, 1st ed.; Instituto Nacional de Ecología: Ciudad de México, México, 2010. [Google Scholar]
- Alexander, L.V.; Herold, N. Climpact User Guide. Available online: https://github.com/ARCCSS-extremes/climpact/blob/master/www/user_guide/Climpact_user_guide.md (accessed on 8 May 2022).
- UNDP (United Nations Development Programme). Government of Sierra Leone National Adaptation Plan 2021. 2022. Available online: https://www.undp.org/sierra-leone/publications/national-adaptation-plan-2021 (accessed on 8 May 2022).
- Junk, J.; Goergen, K.; Krein, A. Future Heat Waves in Different European Capitals Based on Climate Change Indicators. Int. J. Environ. Res. Public Health 2019, 16, 3959. [Google Scholar] [CrossRef]
- Ajjur, S.B.; Riffi, M.I. Analysis of the Observed Trends in Daily Extreme Precipitation Indices in Gaza Strip during 1974–2016. Int. J. Climatol. 2020, 40, 6189–6200. [Google Scholar] [CrossRef]
- Dunn, R.J.H.; Alexander, L.V.; Donat, M.G.; Zhang, X.; Bador, M.; Herold, N.; Lippmann, T.; Allan, R.; Aguilar, E.; Barry, A.A.; et al. Development of an Updated Global Land In Situ-Based Data Set of Temperature and Precipitation Extremes: HadEX3. J. Geophys. Res. Atmos. 2020, 125, 1–28. [Google Scholar] [CrossRef]
- Felix, M.L.; Kim, Y.K.; Choi, M.; Kim, J.C.; Do, X.K.; Nguyen, T.H.; Jung, K. Detailed Trend Analysis of Extreme Climate Indices in the Upper Geum River Basin. Water 2021, 13, 3171. [Google Scholar] [CrossRef]
- Sun, Q.; Zhang, X.; Zwiers, F.; Westra, S.; Alexander, L.V. A Global, Continental, and Regional Analysis of Changes in Extreme Precipitation. J. Clim. 2021, 34, 243–258. [Google Scholar] [CrossRef]
- Herold, N.; Ekström, M.; Kala, J.; Goldie, J.; Evans, J.P. Australian Climate Extremes in the 21st century According to a Regional Climate Model Ensemble: Implications for Health and Agriculture. Weather Clim. Extrem. 2018, 20, 54–68. [Google Scholar] [CrossRef]
- Croitoru, A.E.; Man, T.C.; Vâtca, S.D.; Kobulniczky, B.; Stoian, V. Refining the Spatial Scale for Maize Crop Agro-Climatological Suitability Conditions in a Region with Complex Topography towards a Smart and Sustainable Agriculture. Case Study: Central Romania (Cluj County). Sustainability 2020, 12, 2783. [Google Scholar] [CrossRef]
- McGree, S.; Schreider, S.; Kuleshov, Y.; Prakash, B. On the Use of Mean and Extreme Climate Indices to Predict Sugar Yield in Western Fiji. Weather Clim. Extrem. 2020, 29, 100271. [Google Scholar] [CrossRef]
- Ruiz-Alvarez, O.; Singh, V.P.; Enciso-Medina, J.; Ontiveros-Capurata, R.E.; dos Santos, C.A.C. Observed Trends in Daily Extreme Precipitation Indices in Aguascalientes, Mexico. Meteorol. Appl. 2019, 27, 1–20. [Google Scholar] [CrossRef]
- Pineda-Martínez, L.F.; León-Cruz, J.F.; Carbajal, N. Analysis of Severe Storms and Tornado Formation in the Northern Region of Mexico. Rev. Bio Ciencias 2020, 7, 15. [Google Scholar] [CrossRef]
- Colorado-Ruiz, G.; Cavazos, T. Trends of Daily Extreme and Non-Extreme Rainfall Indices and Intercomparison with Different Gridded Data Sets over Mexico and the Southern United States. Int. J. Climatol. 2021, 41, 5406–5430. [Google Scholar] [CrossRef]
- Mendoza-Uribe, I. Identification of Changes in the Rainfall Regime in Chihuahua’s State (México). Cuad. Investig. Geográfica 2022, 1–22. [Google Scholar] [CrossRef]
- Montero-Martínez, M.J.; Pita-Díaz, O.; Andrade-Velázquez, M. Potential Influence of the Atlantic Multidecadal Oscillation in the Recent Climate of a Small Basin in Central Mexico. Atmosphere 2022, 13, 339. [Google Scholar] [CrossRef]
- SIAP (Servicios de Información Agroalimentaria y Pesquera). Panorama Agroalimentario 2021; Servicio de Información Agroalimentaria y Pesquera: México City, México, 2021; ISBN 9788490225370. [Google Scholar]
- Díaz-Chuquizuta, P.; Hidalgo-Melendez, E.; Cabrejo-Sánchez, C.; Valdés-Rodríguez, O.A. Respuesta Del Maíz (Zea mays, L.) a La Aplicación Foliar de Abonos Orgánicos Líquidos. Chil. J. Agric. Anim. Sci. 2022, 38, 144–153. [Google Scholar] [CrossRef]
- SAGARPA. Maíz Grano Blanco y Amarillo Mexicano; SAGARPA (Secretary of Agriculture, Ranching, Rural Development, Fisheries, and Food supply): México City, México, 2017; Volume I, ISBN 1870-1760. [Google Scholar]
- SIAP (Servicios de Información Agroalimentaria y Pesquera). Producción Agrícola. Available online: https://www.gob.mx/siap/acciones-y-programas/produccion-agricola-33119 (accessed on 12 January 2022).
- SIAP-SADER (Servicio de Información Agroalimentaria y Pesquera-Secretaría de agricultura y Desarrollo Rural). Aptitud Agroclimática Del Maíz En México. Available online: https://www.gob.mx/cms/uploads/attachment/file/422297/12_Aptitud_agroclim_tica_de_M_xico_de_diciembre__2018.pdf (accessed on 9 May 2022).
- INEGI (Instituto Nacional de Estadística y Geografía). Anuario Estadístico y Geográfico de Veracruz de Ignacio de La Llave 2017; Instituto Nacional de Estadística y Geografía: Veracruz, México, 2017. [Google Scholar]
- Ruíz Barradas, A.; Tejeda Martínez, A.; Miranda Alonso, S.; Flores Zamudio, R.H. Climatología. In Atlas del Patrimonio Natural, Histórico y Cultural de Veracruz: Patrimonio Natural; Gobierno del Estado de Veracruz: Xalapa, Veracruz, 2010; Volume 1, pp. 65–84. [Google Scholar]
- SMN (Servicio Meteorológico Nacional). Servicio Meteorológico Nacional. Available online: https://smn.conagua.gob.mx/es/ (accessed on 28 March 2023).
- Vázquez Aguirre, J.L.; Cervantes Pérez, J.; Villa Falfán, C.; Quiroz Aparicio, C.; de Guillén Cadena, M.J.; Sánchez Martínez, Ó.; Arellano Palacios, J.; Ybañez Hernández, S.S.; García Rosas, R.; López Badillo, C. Diagnóstico de Vulnerabilidad Presente y Futura a Los Impactos de Cambio Climático de Los Tres Subsectores de Producción Agroalimentaria En Dos Regiones de La República Mexicana Informe Final; Deutsche Gesellschaft für Internationale Zusammenarbeit (GIZ) GmbH: México city, México, 2019. [Google Scholar]
- Vázquez Aguirre, J.L.; Brunet, M.; Jones, D.P. Cambios Observados En Los Extremos Climáticos de Temperatura y Precipitación En El Estado de Veracruz, México a Partir de Datos Diarios. Asoc. Española Climatol. 2008, A6, 447–456. [Google Scholar]
- Deras Flores, H. Guía Técnica. El Cultivo Del Maíz. Available online: http://repiica.iica.int/docs/b3469e/b3469e.pdf (accessed on 16 May 2022).
- Alexander, L.; Herold, N.; Goldie, J.; Bador, M. Climpact (Version 3.1.3). Available online: https://ccrc-extremes.shinyapps.io/climpact/ (accessed on 22 March 2023).
- Vázquez-Aguirre, J.L.; Universidad Veracruzana, Xalapa, México. Personal Comunication, 2022.
- Chattopadhyay, S.; Edwards, D. Long-Term Trend Analysis of Precipitation and Air Temperature for Kentucky, United States. Climate 2016, 4, 10. [Google Scholar] [CrossRef]
- Subba, S.; Ma, Y.; Ma, W. Spatial and Temporal Analysis of Precipitation Extremities of Eastern Nepal in the Last Two Decades (1997–2016). J. Geophys. Res. Atmos. 2019, 124, 7523–7539. [Google Scholar] [CrossRef]
- WMO. El Estado Del Clima En América Latina y El Caribe 2020; WMO: Genève, Suiza, 2020; ISBN 9789263312723. [Google Scholar]
- Eyhérabide, G.H. Bases Para El Manejo Del Cultivo de Maíz; INTA: Buenos Aires, Argentina, 2015; ISBN 978-987-679-141-0. [Google Scholar]
- Hong, Y.; Ying, S. Characteristics of Extreme Temperature and Precipitation in China in 2017 Based on ETCCDI Indices. Adv. Clim. Chang. Res. 2018, 9, 218–226. [Google Scholar] [CrossRef]
- Shepherd, T.G. Bringing Physical Reasoning into Statistical Practice in Climate-Change Science. Clim. Chang. 2021, 169, 1–19. [Google Scholar] [CrossRef]
- Ahumada Cervantes, R.; Velázquez Angulo, G.; Flores Tavizón, E.; Romero González, J. Impactos Potenciales Del Cambio Climático En La Producción de Maíz. Investig. Cienc. 2014, 22, 48–53. [Google Scholar]
- Valdés-Rodríguez, O.A.; Salas-Martínez, F.; Palacios-Wassenaar, O.M. Hydrometeorological Hazards on Crop Production in the State of Veracruz, Mexico. Atmosphere 2023, 14, 287. [Google Scholar] [CrossRef]
- CENAPRED, (Centro Nacional de Prevención de Desastres). Sistema de Consulta DeDeclaratoria. Available online: http://www.atlasnacionalderiesgos.gob.mx/apps/Declaratorias/ (accessed on 4 April 2023).
- Rincón-Tuexi, J.A.; Castro-Nava, S.; López-Santillán, J.A.; Huerta, A.J.; Trejo-López, C.; Briones-Encinia, F. Temperatura Alta y Estrés Hídrico Durante La Floración En Poblaciones de Maíz Tropical. Phyton Int. J. Exp. Bot. 2006, 75, 31–40. [Google Scholar]
Figure 1.
Geographical location of the selected stations in the State of Veracruz. (a) Green dots indicate selected stations for precipitation, and (b) blue dots for temperature. Source: SMN [29].
Figure 1.
Geographical location of the selected stations in the State of Veracruz. (a) Green dots indicate selected stations for precipitation, and (b) blue dots for temperature. Source: SMN [29].

Figure 2.
Spatial representation of the decadal trends of the indices (a) Rx5day: Maximum 5-day precipitation total (mm), (b) PRCPTOT: Annual total wet-day precipitation (mm), and (c) R20mm: Number of days when precipitation is greater than or equal to 20 mm (day). The inverted yellow triangles indicate if the index decreases (negative trends), the blue triangles have positive trends, and the horizontal black triangles indicate no trend (zero trends). Asterisks indicate statistically significant trends at p < 0.05. Source: Estimated data from the SMN-CONAGUA national climatological database [29].

Figure 3.
Spatial representation of the decadal trends of the indices (a) TXx: Extreme maximum temperature (°C); (b) TNn: Extreme minimum temperature (°C); (c) TXgt50p: Percentage of days with temperature above the median (%); and (d) TXge35: Maximum temperature of at least 35 °C (day). The inverted yellow triangles indicate if the index decreases (negative trends), the blue triangles if it increases (positive trend), and the horizontal black triangle that there is no trend (zero trends). Asterisks indicate significant trends at p < 0.05. Source: Estimated data from the SMN-CONAGUA national climatological database [29].

Figure 4.
Spatial representation of the Spearman correlation between the indices and maize yield for (a) Rx5day: Maximum 5-day precipitation total (mm), (b) PRCPTOT: Annual total wet-day precipitation (mm), (c) SPI6: Standardized Precipitation Index on a six-month time scale and (d) R20mm: Number of days when precipitation is greater than or equal to 20 mm. Green rhombuses indicate positive correlations, orange ones are negative, and black ones indicate no correlation. Asterisks indicate significant trends at p < 0.05. Sources: Data estimated from the national climatological database of the SMN [29] and agricultural information from SIAP [25].

Figure 5.
Spatial representation of the Spearman correlation between the indices and maize yield for: (a) TXx: Extreme maximum temperature (°C); (b) TNn: Extreme minimum temperature (°C); (c) TXgt50p: Percentage of days with temperature above the median (%). and (d) TXge35: Maximum temperature of at least 35 °C (day). Green rhombuses indicate positive correlations, orange ones are negative, and black ones indicate no correlation. Asterisks indicate significant trends at p < 0.05. Sources: Data estimated from the national climatological database of the SMN [29] and agricultural information from SIAP [25].

Figure 6.
Linear regressions between the sectoral climate indices of precipitation and maize yields in the municipalities with statistical significance.
Figure 6.
Linear regressions between the sectoral climate indices of precipitation and maize yields in the municipalities with statistical significance.

Figure 7.
Linear regressions between the sectoral climate indices of temperature and maize yields in the municipalities with statistical significance.
Figure 7.
Linear regressions between the sectoral climate indices of temperature and maize yields in the municipalities with statistical significance.

Table 1.
List of precipitation and temperature indices selected for the study.
| Index | Long Name | Definition | Unit | Justification |
|---|---|---|---|---|
| Rx5day | Maximum 5-day precipitation total. | Maximum amount of rain that falls in five consecutive days. | mm | Maize is susceptible to drought, causing loss of young plants, stagnant growth, or affecting yield, depending on the stage of the drought event. Likewise, saturated and oversaturated soils can damage crops, especially at high temperatures. |
| PRCPTOT | Annual total wet-day precipitation. | Sum of daily PR is greater than or equal to 1.0 mm. | mm | |
| SPI6 | Standardized Precipitation Index on a six-month time scale. | A drought measure specified as a precipitation deficit | unitless | |
| R20mm | Number of very heavy rain days. | Number of days when PR is greater than or equal to 20 mm. | days | |
| TXx | Extreme maximum temperature. | Warmest Daily TX/Hottest Day | °C | High temperatures are a condition that favors insect-pests expansion. In addition, it is a factor causing the losses of stored grains. Temperatures below 14 °C and above 26 °C are unsuitable for maize. |
| TNn | Extreme minimum temperature. | Coldest daily TN/Coldest night | °C | |
| TXgt50p | Percentage of days with temperature above the median. | Percentage of days where TX is greater than the 50th percentile | % | |
| TXge35 | Maximum temperature of at least 35 °C. | Number of days when TX is greater than or equal to 35 °C | days |
Table 2.
Decadal trends of precipitation indices at observation sites.
| Station ID | Municipality | Maximum 5-Day Precipitation Total (mm) (Rx5day) mm/Decade | Annual Total Wet-Day Precipitation (PRCPTOT) mm/Decade | Number of Days When Precipitation is Greater than or Equal to 20 mm (R20mm) Day/Decade |
|---|---|---|---|---|
| 30011 | Ángel R. Cabada | 19.9 | −0.4 | −0.9 |
| 30012 | Atzalan | −0.1 | 81.0 | 0 |
| 30025 | Cosamaloapan de Carpio | 13.6 | −32.82 | 0 |
| 30035 | Hueyapan de Ocampo | 1.6 | −12.9 | 0 |
| 30056 | Medellín | −14.3 | −40.7 | −1.1 |
| 30058 | Espinal | 5.9 | −26.8 | −0.5 |
| 30068 | Actopan | −9 | −10.4 | −0.8 |
| 30081 | San Juan Evangelista | −11.3 | −92.7 | 0 |
| 30090 | Jesús Carranza | −14.7 | −162.9 * | −2.2 |
| 30093 | Paso de Ovejas | 0.7 | 6.7 | 0.4 |
| 30102 | Martínez de la Torre | 6.8 | 21.1 | 0.8 |
| 30114 | Naolinco | 20.5 | 50.5 | 0.3 |
| 30117 | Cosamaloapan de Carpio | 1.7 | 48.3 | 0.6 |
| 30152 | Isla | 13.6 | 40.0 | 0 |
| 30158 | Actopan | 3.4 | −11.2 | −0.9 |
| 30189 | Santiago Tuxtla | 19.5 | 4.3 | −0.3 |
| 30193 | La Antigua | −5.2 | −38.8 | −0.7 |
Positive trends are shown in blue numbers, negative trends in yellow numbers, and statistically significant trends with *. Zeros indicate no trend. Source: Estimated data from the SMN national climatological database [29].
Table 3.
Decadal trends of temperature indices at observation sites.
| Station ID | Municipality | Extreme Maximum Temperature (TXx) °C/Decade | Extreme Minimum Temperature (TNn) °C/Decade | Percentage of Days with Temperature above the Median (TXgt50p) %/Decade | Maximum Temperature of at Least 35 °C (TXge35) Day/Decade |
|---|---|---|---|---|---|
| 30011 | Ángel R. Cabada | 0 | 0 | 1.3 | −0.4 |
| 30012 | Atzalan | −1.1 * | −0.9 | −0.4 | 0 |
| 30025 | Cosamaloapan de Carpio | 0 | 0 | 5.3 * | 13.3 |
| 30035 | Hueyapan de Ocampo | 0 | −0.7 * | 3.7 * | 2.5 |
| 30056 | Medellín | 0 | 0 | 2.0 | −1.1 |
| 30093 | Paso de Ovejas | 0.4 | 0.3 | 7.2 * | 18.2 |
| 30102 | Martínez de la Torre | 0.7 | 0 | 4.0 * | 17.1 |
| 30167 | Las Choapas | 1.1 | −0.3 | 8.6 * | 29.6 |
| 30193 | La Antigua | 0 | 0.3 | 2.7 | 3.8 |
Increasing trends are shown in blue numbers, decreasing trends in yellow numbers, and statistically significant trends with *. Zero indicates no trend. Source: Estimated data from the SMN national climatological database [29].
Disclaimer/Publisher’s Note: The statements, opinions and data contained in all publications are solely those of the individual author(s) and contributor(s) and not of MDPI and/or the editor(s). MDPI and/or the editor(s) disclaim responsibility for any injury to people or property resulting from any ideas, methods, instructions or products referred to in the content. |
© 2023 by the authors. Licensee MDPI, Basel, Switzerland. This article is an open access article distributed under the terms and conditions of the Creative Commons Attribution (CC BY) license (https://creativecommons.org/licenses/by/4.0/).
Share and Cite
MDPI and ACS Style
Villa-Falfán, C.; Valdés-Rodríguez, O.A.; Vázquez-Aguirre, J.L.; Salas-Martínez, F. Climate Indices and Their Impact on Maize Yield in Veracruz, Mexico. Atmosphere 2023, 14, 778. https://doi.org/10.3390/atmos14050778
AMA Style
Villa-Falfán C, Valdés-Rodríguez OA, Vázquez-Aguirre JL, Salas-Martínez F. Climate Indices and Their Impact on Maize Yield in Veracruz, Mexico. Atmosphere. 2023; 14(5):778. https://doi.org/10.3390/atmos14050778
Chicago/Turabian StyleVilla-Falfán, Citlali, Ofelia Andrea Valdés-Rodríguez, Jorge Luis Vázquez-Aguirre, and Fernando Salas-Martínez. 2023. "Climate Indices and Their Impact on Maize Yield in Veracruz, Mexico" Atmosphere 14, no. 5: 778. https://doi.org/10.3390/atmos14050778
Note that from the first issue of 2016, this journal uses article numbers instead of page numbers. See further details here.