
The Association between Vessel Departures and Air Pollution in Helsinki Port Area 2016–2021

Department of Atmospheric Composition Research, Finnish Meteorological Institute, 00560 Helsinki, Finland
*
Author to whom correspondence should be addressed.
Atmosphere 2023, 14(4), 757; https://doi.org/10.3390/atmos14040757
Submission received: 29 March 2023
/
Revised: 11 April 2023
/
Accepted: 19 April 2023
/
Published: 21 April 2023
(This article belongs to the Special Issue Atmospheric Shipping Emissions and Their Environmental Impacts)
Abstract
:European ports are struggling to install enough shore power connections to follow the European Commission initiative, which insists ships that lie alongside to be plugged in and have their auxiliary engines off in EU ports by 2030. The port of Helsinki is one of the busiest passenger ports in the world handling on average more than 10 million international passengers per year. As passenger ships consume more fuel than other vessel types, the shore power regulation poses additional challenges for the port of Helsinki. Passenger ferry and cruise ship terminals are in the middle of the city meaning that their air emissions carry a public health burden in the urban areas. Using port arrivals and departures combined with the EU Monitoring, Reporting and Verifying (MRV), this study estimates that 75–80% of the fuel combusted by ship auxiliary engines falls under the upcoming regulation. However, using statistical methods to find the association and effects between vessel movements and port air quality measurements, ship departures were found to have noticeable increases in the hourly mean NO2 concentration measured at the port terminals. This is most likely caused by starting cold main engines for departure and will not be solved by connecting ships to shore power.
1. Introduction
Combustion-based ship air emissions can be divided into two categories based on their effect: (1) greenhouse gas emissions, which contribute to global warming, and (2) air pollutant emissions which contribute to air quality. The importance and urgency to decrease greenhouse gas emissions are well known, and despite committing to the Paris climate agreement, international shipping GHG emissions are found to be increasing [1].
Air pollution is a major global concern to human health. Among other pollutants, there is strong evidence of the public health effects of particulate matter (PM), ozone (O3), nitrogen dioxide (NO2), sulphur dioxide (SO2) and carbon monoxide (CO) [2]. The recent scientific literature shows the detrimental effect of even lower concentrations of particles than what was previously understood, and that the burden of disease caused by air pollution is somewhat equal to smoking and an unhealthy diet [2]. Both long- and short-term exposure to air pollutants have been shown to increase mortality and morbidity. A recent systematic review and meta-analysis concluded the combined risk ratio for long-term exposure to PM2.5 and natural-cause mortality to be 1.08 (95% confidence interval 1.05–1.09) per 10 μg/m3 [3]. Another systematic review and meta-analysis found positive associations between all-cause mortality and increased 1 h maximum exposure to PM10, PM2.5, and O3. The same correlation was found with increased 24 h exposure to NO2 [4]. A recent cohort study conducted in Finland revealed that even short-term exposure to air pollutants a week before scheduled delivery raises the risk of preterm birth by 67% (95% confidence interval 14–146%) for PM2.5 and 65% (95% confidence interval 14–137%) for NO2 [5].
The new evidence led the World Health Organization (WHO) to update their Air Quality Guidelines (AQC) in 2021. All other revisions were made stricter except for SO2, which was revised upwards. The European Commission submitted a proposal for a new Air Quality Directive in October 2022 [6]. The new and old limits are presented in Table 1.
Maritime transport is one the major air polluters in the world. It is estimated that shipping’s share of global anthropogenic greenhouse gas emissions (GHG) was 3% and 15% of the world’s air pollutants in 2018 [7]. Multiple studies show a positive correlation between increased concentrations of pollutants and vessel traffic [8]. The unequal share between GHG emissions and air pollution is because the requirements for fuel quality in shipping have not been as strict as for land-based energy production or transport. A health impact assessment made in eight Mediterranean coastal cities found that shipping contributed to 430 (95% confidence interval 220–650) annual premature deaths due to an increased exposure to PM2.5 [9]. A recent modelling study concluded that the NO2 and PM2.5 emissions from inland ships sailing up and down the Yangtze River should be focussed on as they carry a burden on residential areas [10].
The global sulphur cap in marine fuel was lowered from 3.5% to 0.5% only 1 January 2020. The sulphur cap in marine fuel is restricted even more to 0.1% in Sulphur Emission Control Areas (SECA), and the whole Baltic Sea has been a SECA since May 2006. A gradual reduction of the fuel sulphur content in the Baltic Sea area towards 0.1% was made over a decade. The motivation for this restriction was to reduce the impact of ship air emissions to public health, but it came with a cost as the global cooling effect of sulphur aerosol formation was also reduced [11,12,13,14,15]. It is also debatable if the cost–benefit of a SECA area is positive or negative and if the focus should be on the long or the short-term impacts [16].
Nitrogen oxide (NOx) emissions have been restricted in specified Nitrogen Emission Control Areas (NECA) and the Baltic Sea has been included in the strictest Tier III restrictions since 1 January 2021, but the regulation concerns only new ships. Like SO2 restrictions, NOx emission restrictions are driven by their impact on public health, but also to eutrophication [17].
Many studies have been published that report the impact of ship emissions to the air quality around port areas [18,19,20], and analyses have been run to assess the cost–benefit of connecting ships to shore power while alongside [21,22]. Nevertheless, the European Commission has submitted a proposal, which will insist ports to have container vessels and passenger ships connected to an on-shore power supply or similar system by 1 January 2030 [23].
As with other measures to mitigate the impact from maritime air emissions, connecting ships to shore power might not work as planned. Shore power reduces only emissions caused by the auxiliary engines while alongside, but what about emissions that are caused by the main engines, when manoeuvring the ship in and out of the port? This study aims to fill that knowledge gap by first assessing what is the share of fuel combusted by passenger and container vessels that remain alongside for 2 h or more in the port of Helsinki and then analysing the effect of vessel arrivals, departures, and time at berth on port area air quality. Analyses were focused on two combustion-based engine pollutants: particulate matter (PM2.5) and nitrogen dioxide (NO2) as their recommended exposure limits were decreased most in the latest WHO update and due to their contribution to detrimental health effects and chemical smog.
2. Materials and Methods
Ship arrival and departure data were obtained from the Finnish Transport and Communication Agency Traficom. The dataset contains information from the Porttraffic system (www.porttraffic.fi (accessed on 1 April 2022)) which is publicly available. Duplicate records and errors in dates and times were corrected manually when identified. Arrivals, departures, vessel movement (arrival and departure) and vessels at berth were allocated to the hour of local time. In some of the port terminals, specific vessel movements could also be allocated to a specific berth at the terminal. In such cases, these were analysed separately. Ships were classified by type to calculate the cumulative berth times and to find out the effect of the shore power regulation.
Ship fuel consumption data were downloaded from the European Union (EU) Monitoring, Reporting and Verifying (MRV) Thetis database (mrv.emsa.europa.eu (accessed on 1 April 2022)). At the time of the study, data from the years 2018–2021 were available, and the versions used were 267 for 2018, 208 for 2019, 166 for 2020 and 90 for 2021. The consumption in port was calculated based on the reported values for total annual fuel consumption, total annual CO2 emitted, total annual CO2 emitted while in port and time at sea.
The hourly mean concentrations data of NO2 and PM2.5 were obtained from the Helsinki Region Environmental Services (HSY). Measuring was performed with the HSY mobile unit in different port areas in Helsinki. The location of the mobile unit changes once a year. The NOx measurements were taken with a Horiba AP-370 air pollution monitor and the PM measurements with a Fidas 200 instrument [24]. The sampling height with the mobile unit is 4 metres above ground and 6–7 metres above sea level.
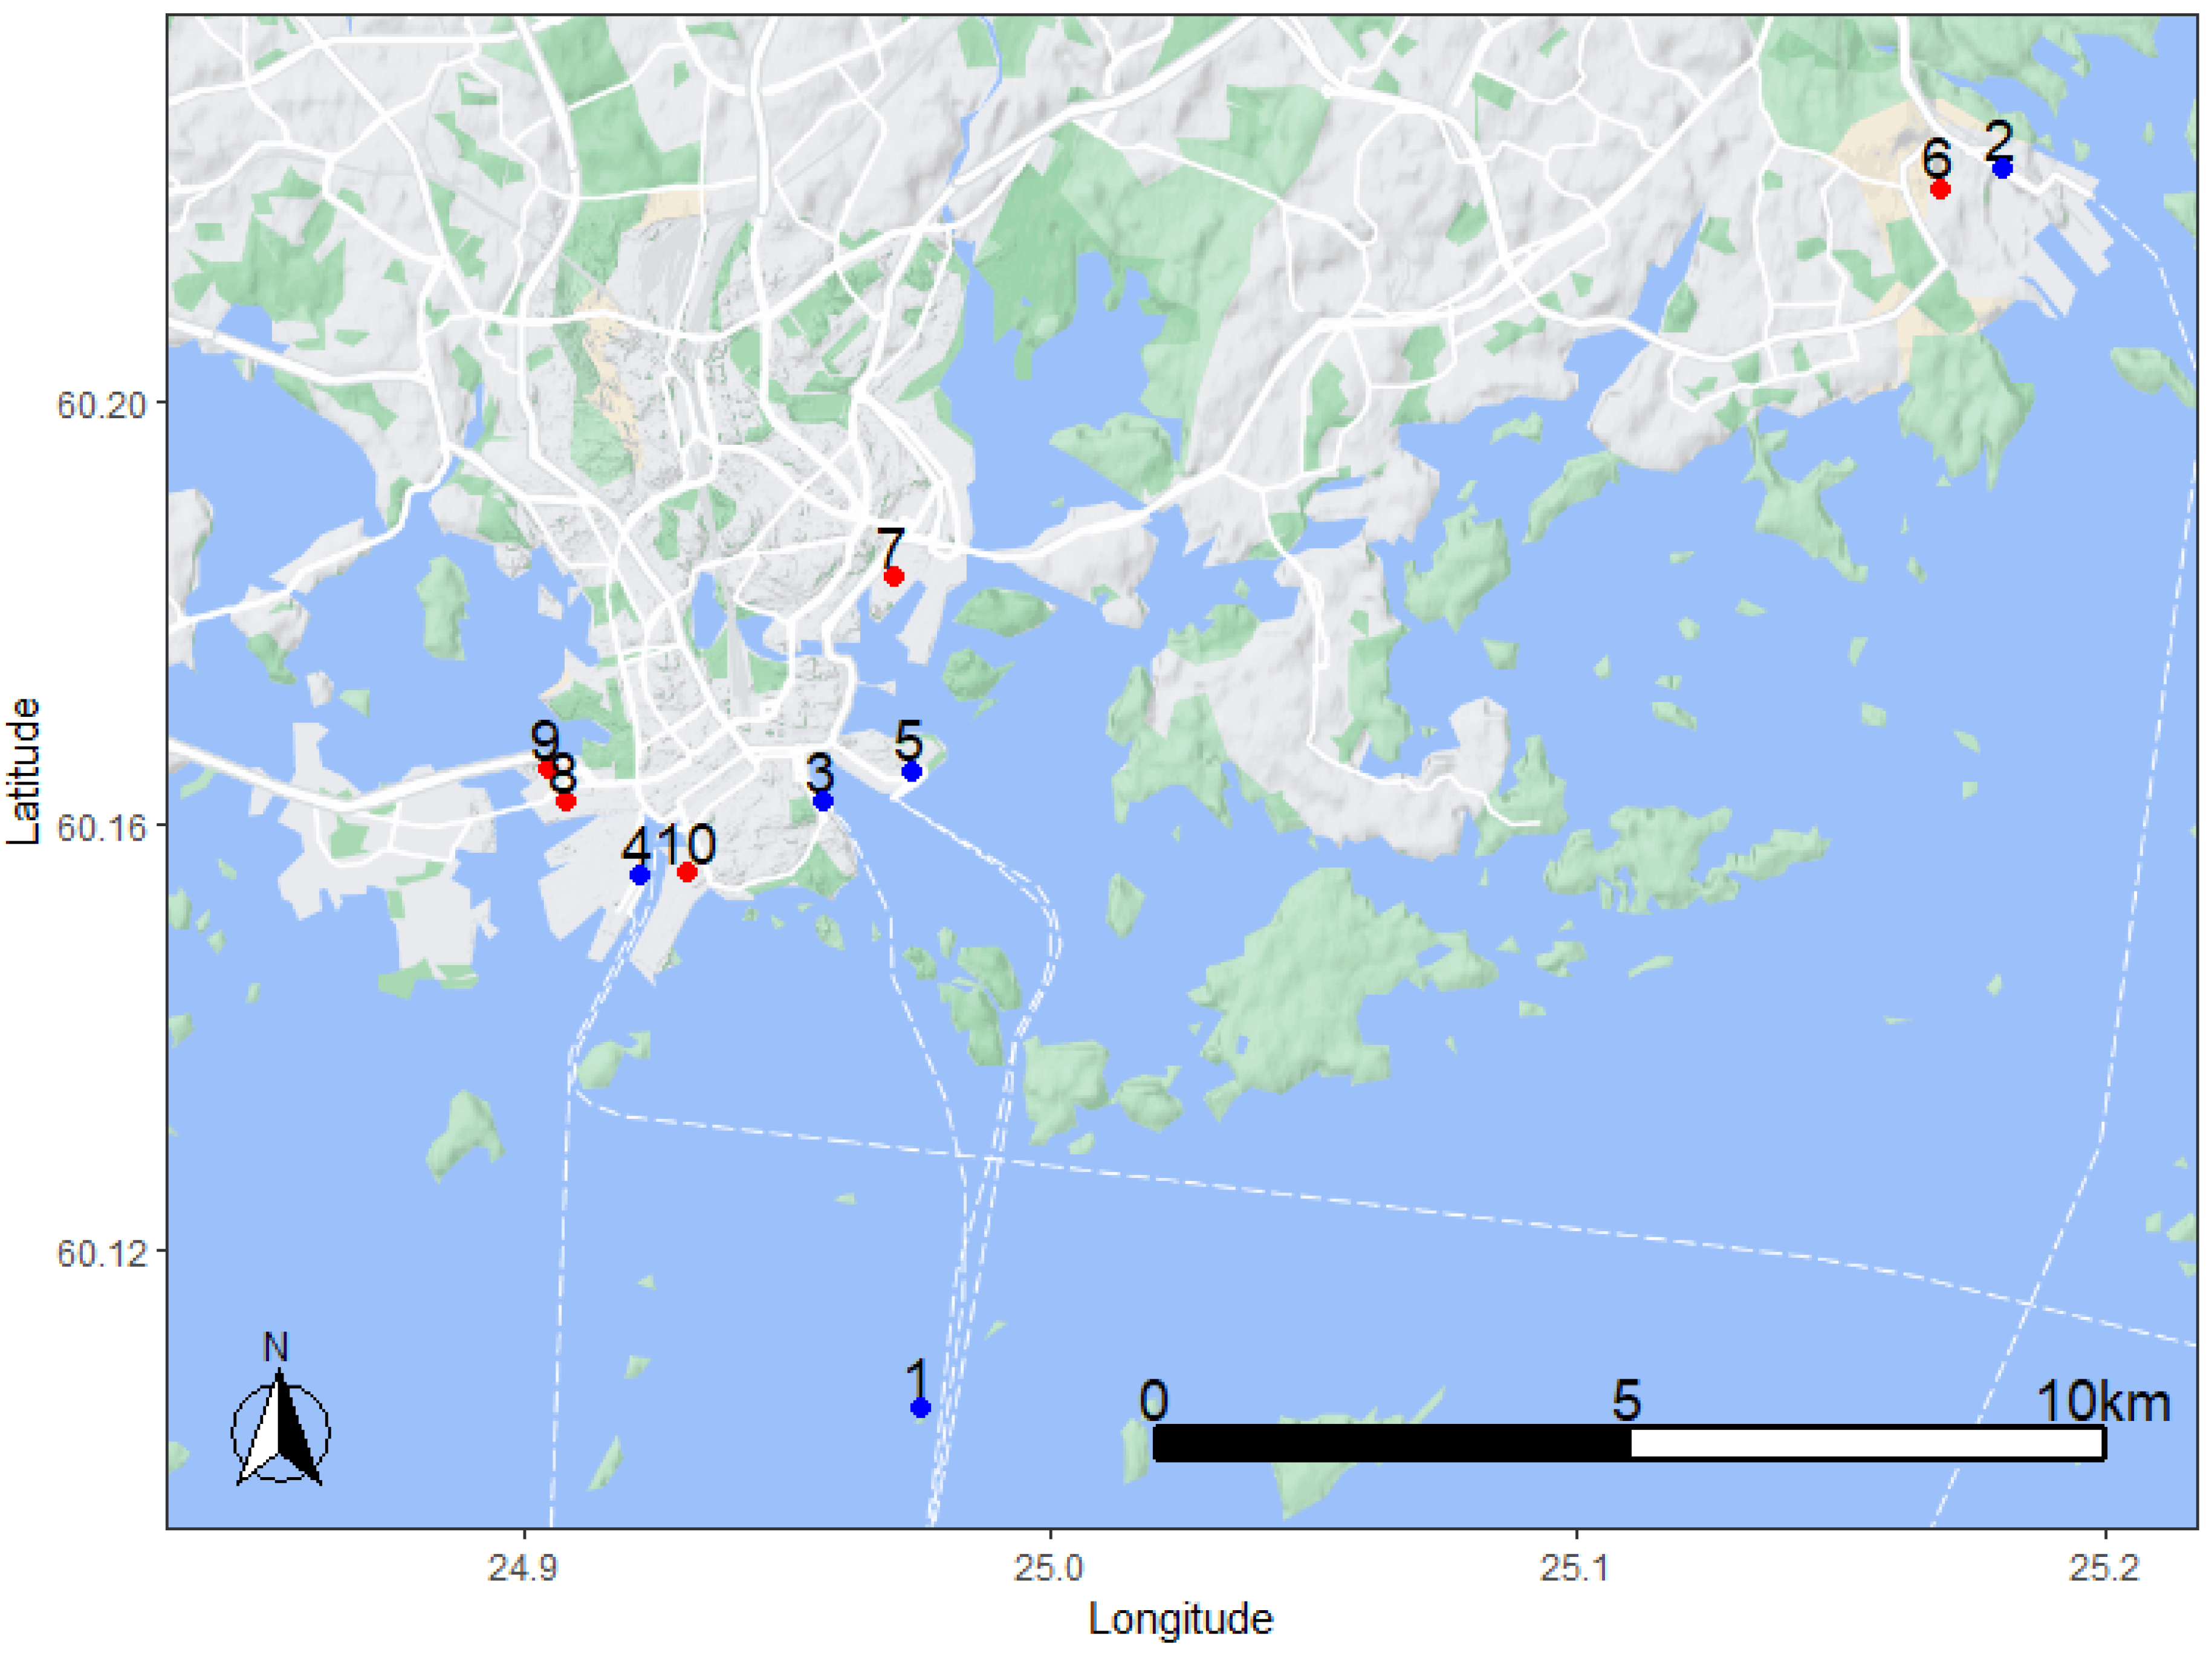
In 2016, the mobile unit was stationed in the Vuosaari port terminal, in 2018 the unit was at South Harbour Makasiiniterminaali, in 2019 and 2020 the unit was at West Harbour and in 2021 the unit was again at South Harbour but at the Katajanokka terminal. There are no data from 2017 as the unit was based at the airport of Helsinki (Figure 1).
Negative values in the data were not removed based on discussions with the data provider as they compensate for measuring inaccuracies as the instruments are calibrated on 24 h mean values.
Weather data: wind direction, wind speed, air temperature, relative humidity and atmospheric pressure were downloaded from the Finnish Meteorological Institute (FMI) open data (en.ilmatieteenlaitos.fi/download-observations (accessed on 1 April 2022)). The meteorological variables used were taken from the Helsinki Harmaja lighthouse observation station (Figure 1) to minimise the effect of local pollution sources.
A multivariable linear regression was used to model the effect of vessel air emissions to the air quality data while adjusting for confounders such as meteorological factors and local time, which are associated with variation of road traffic. As the distributions of the dependent variables (measured hourly mean NO2 and PM2.5) were skewed, a natural logarithm of the values was used for the regression analysis (Formula (1)).
where ln(Y) is the natural logarithm of the dependent variable, b0 is the intercept, b1–bn are the regression coefficients for the chosen variables and X1–Xn are the chosen variables. The variables were chosen with the backward elimination method based on the statistical significance and optimum fit of the regression model [25,26].
For the sensitivity analysis, a subset of the data was used to include only weekends (Saturday and Sunday) to minimise the effect of road traffic. Additionally, when available, the effects of different vessel types were examined in detail. The statistical analyses were completed with R using the Dplyr and Openair [27] packages. As the dependent variable was normalised by taking the natural logarithm of the measured pollutant values, the effect of the vessel movement to the hourly mean concentration in percent was calculated using Formula (2):
The obtained coefficients using Formula 1 with their corresponding statistical results are represented in the tables within each section and the calculated effect using Formula (2) is in the text in Section 3.1, Section 3.2, Section 3.3, Section 3.4 and Section 3.5 and summarised in 3.6. Linear regression models were examined for residual distribution and collinearity using diagnostic plots which can be found in the Supplementary Material (Figures S1–S34).
3. Results
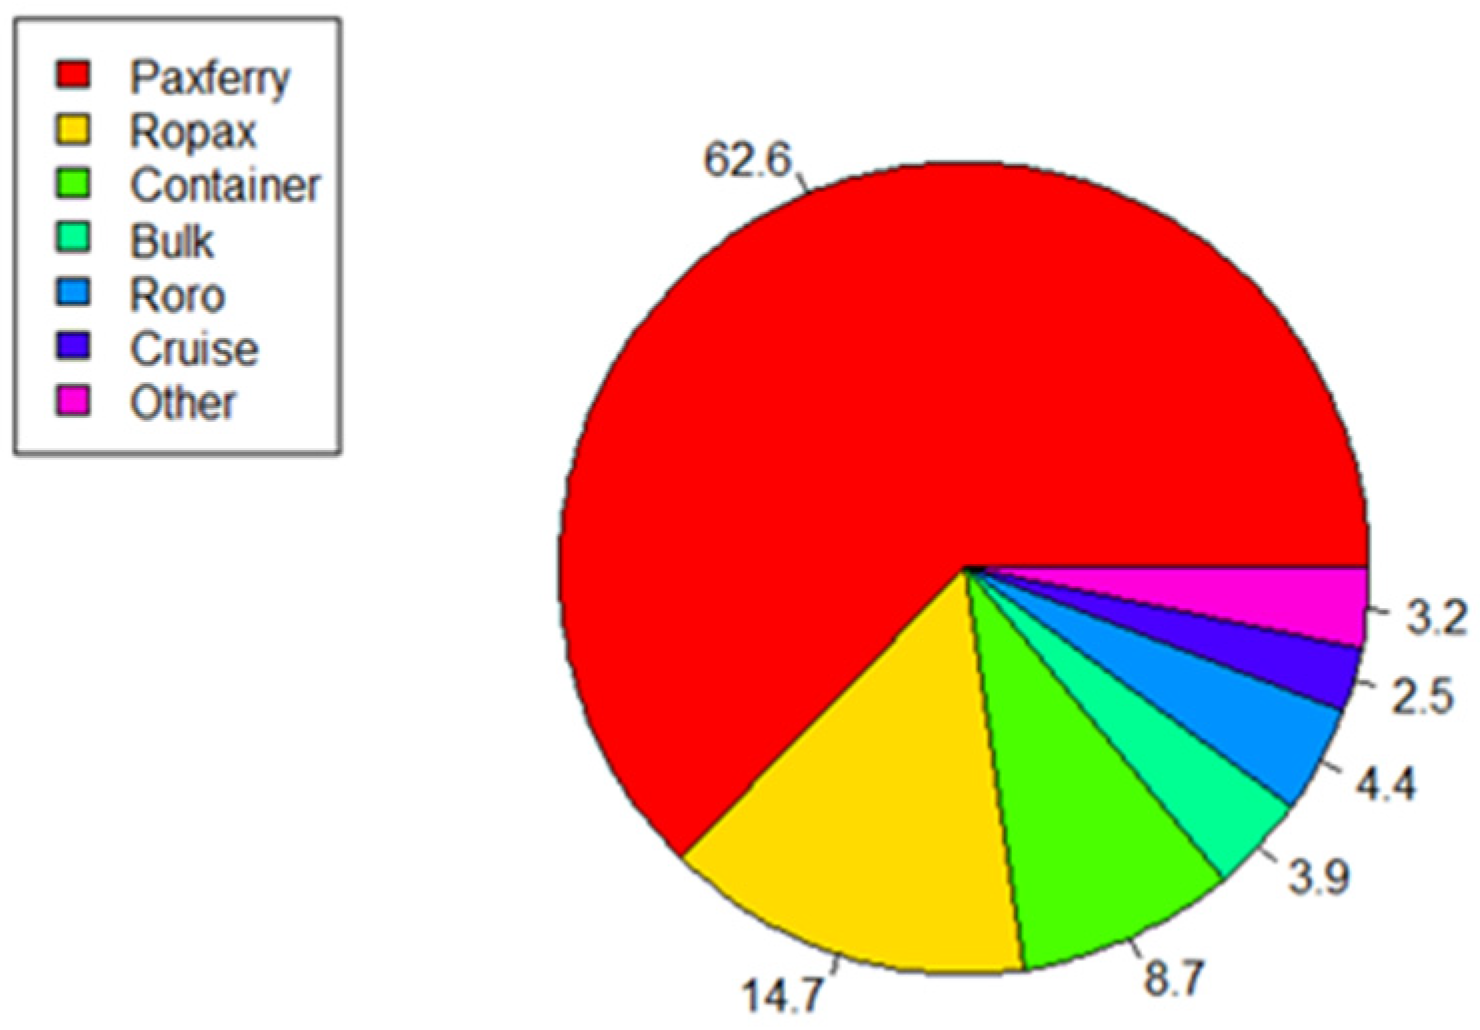
The vessel traffic in the port of Helsinki is dominated by passenger vessels and roll-on roll-off (roro) cargo transport (Figure 2 and Table 2). The COVID-19 pandemic resulted in a significant reduction in 2020 to ship visits (−17.4% to the mean 2018–2019) notably with passenger-carrying vessels such as the passenger ferry (Pax ferry) and the cruise ships. Ropax vessel visits however did not decrease during the pandemic.
Passenger ferry vessels spend less time in port than cargo ships which take time discharging and loading. On the other hand, passenger vessels consume more fuel while alongside due to their larger power consumption which is required for ship hotel operations such as air conditioning, provision cooling and restaurants. The COVID-19 pandemic effect can be observed clearly in the mean time spent alongside by the passenger ferry vessels as many of them were laid up during 2020 and by the fact that there were no cruise ship calls in Helsinki in 2020 (Table 3).
According to the MRV data, passenger carrying vessels (pax ferry, ropax and cruise) consume around 67% (64.6–71.6) of the total fuel combusted by vessels while in port in Helsinki. The second largest consumers are container vessels: 19% (15.8–24.2). These vessel types are also mandated to be connected to shore power or a similar system while alongside by 2030 for port calls more than 2 h in EU ports as per the EU Green Deal initiative. This would lead to a 78% (74.9–80.1) reduction in fuel combusted and CO2 emitted by ships while at berth in Helsinki.
Most of the port terminals examined in this study are situated in the urban populated area (South Harbour and West Harbour) whereas the Vuosaari terminal is at the outskirts of the city limits around 15 kilometres from the centre. The vessel traffic to Vuosaari consists mainly of cargo ships apart from ropax vessels which carry a limited number of passengers mainly to Travemünde in Germany and Muuga in Estonia. The port terminals at the city centre however are mainly operated by passenger ferry vessels with regular traffic to Mariehamn, St Petersburg, Stockholm and Tallinn and the seasonal cruise ships. Separate measuring studies have been completed in the same areas: both prior to the SECA [28] and after coming into force [29]. Using HSY continuous measurement data, a long-term association can be established better than with short-term measuring campaigns.
Prevailing winds are from the south-west with a mean velocity of 6.75 metres per second (5.87–7.62) as shown on the wind roses (Figure 3). It is likely that the winds blow most of the air pollutants away from the port towards the urban areas.
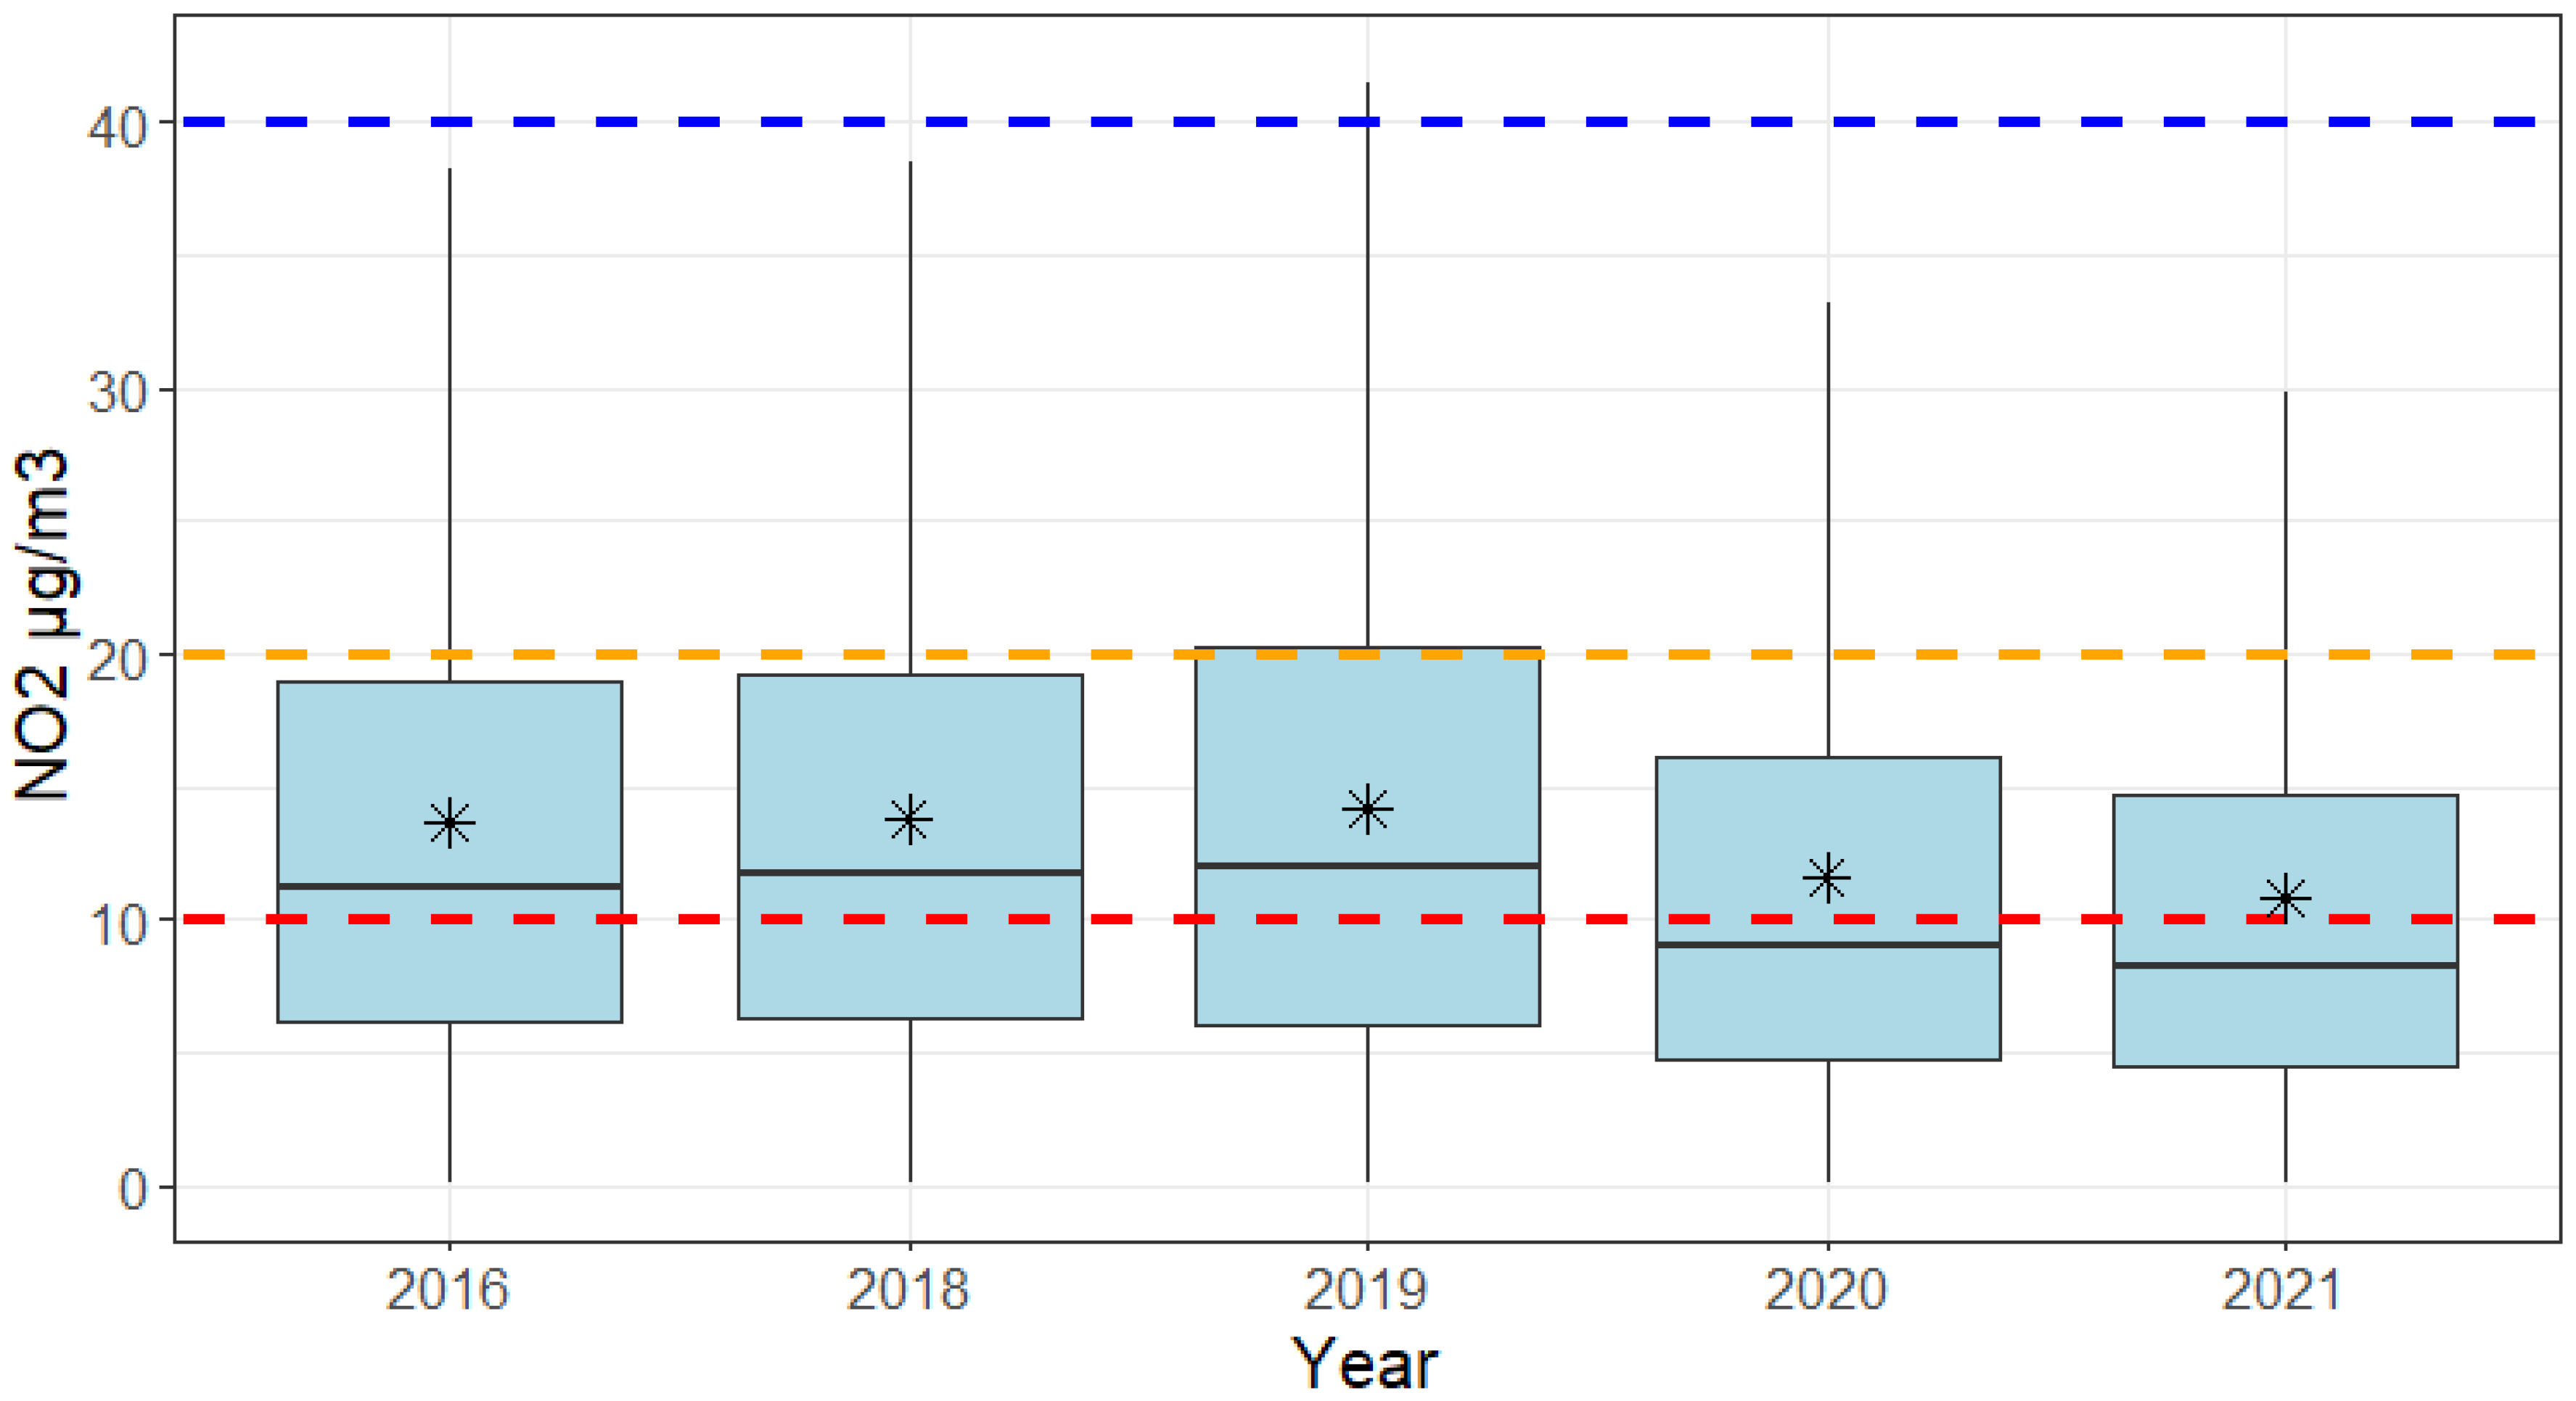
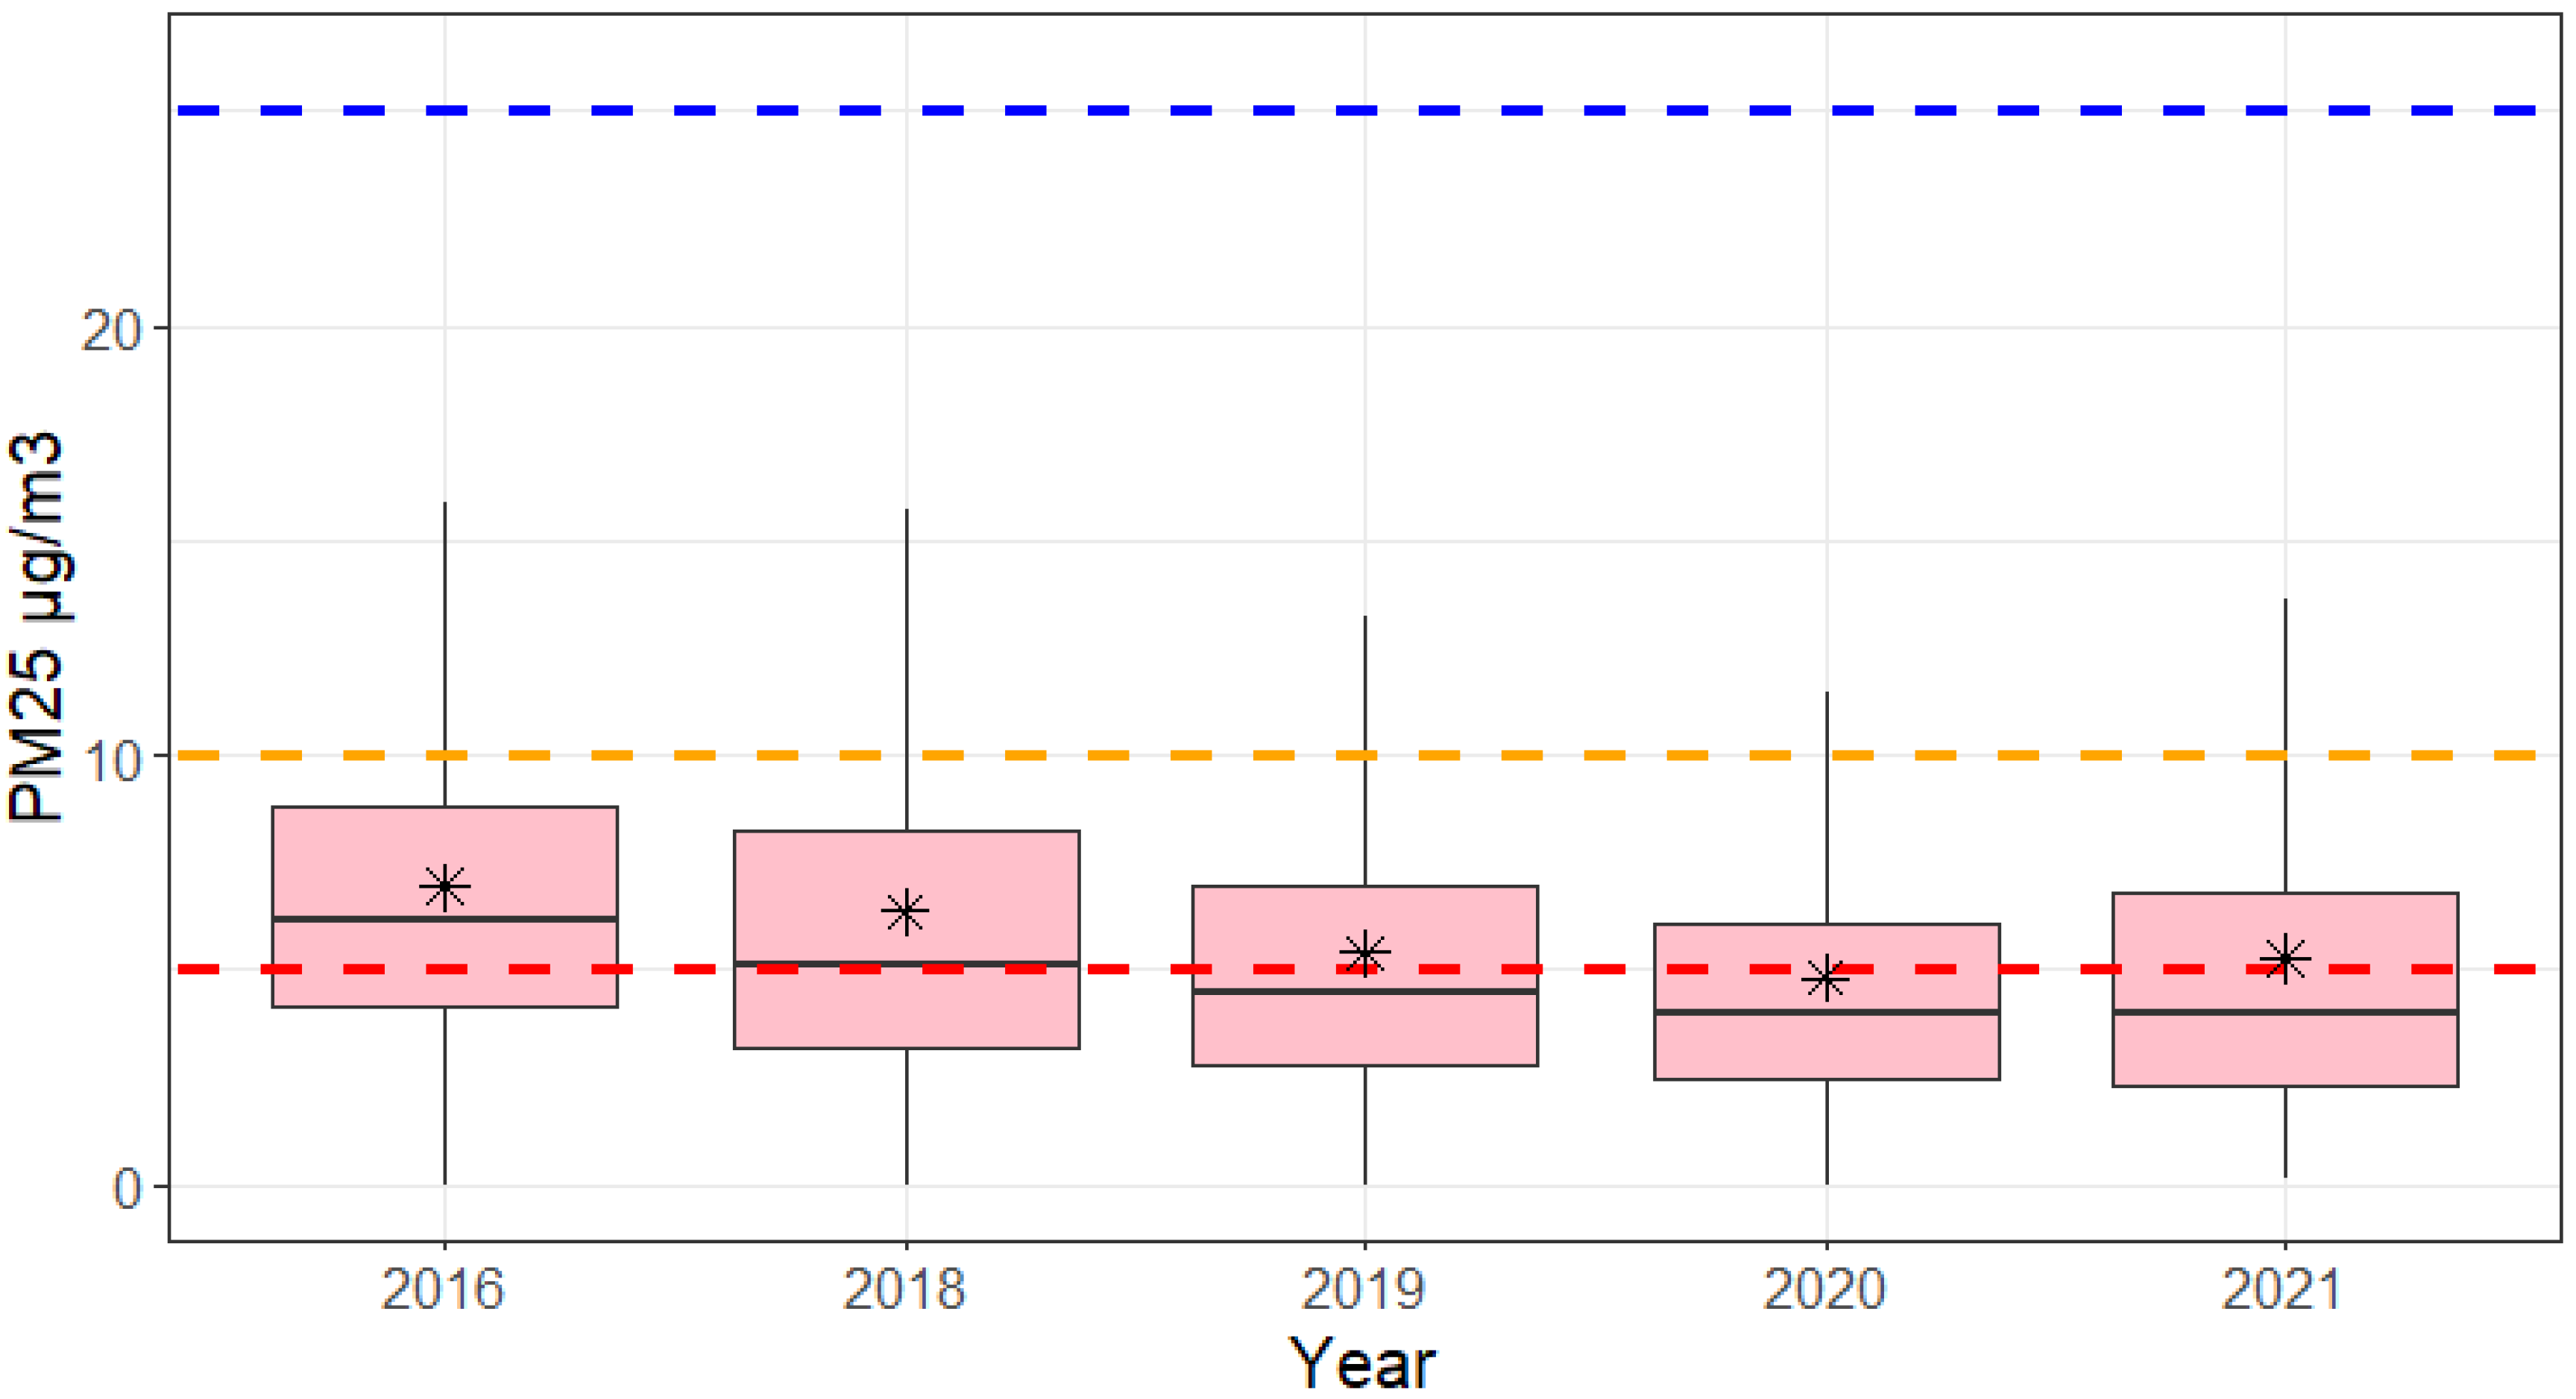
The annual mean concentrations of NO2 and PM2.5 were below the national limits (40 μg/m3 for NO2 and 25 μg/m3 for PM2.5), but above the 2021 WHO guidance limits (10 μg/m3 for NO2 and 5 μg/m3 for PM2.5) except for PM2.5 in 2020 as shown on the boxplots (Figure 4 and Figure 5). Exceedances of daily and hourly means at each port terminal are reported in Section 3.1, Section 3.2, Section 3.3, Section 3.4 and Section 3.5 and time series plots for each pollutant can be found in the Supplementary Material. Based on the annual means, port workers, ship crews, passengers and urban area populations exposed to the port emissions are affected by NO2 and PM2.5 concentrations that exceed the WHO recommendations.
3.1. Vuosaari 2016
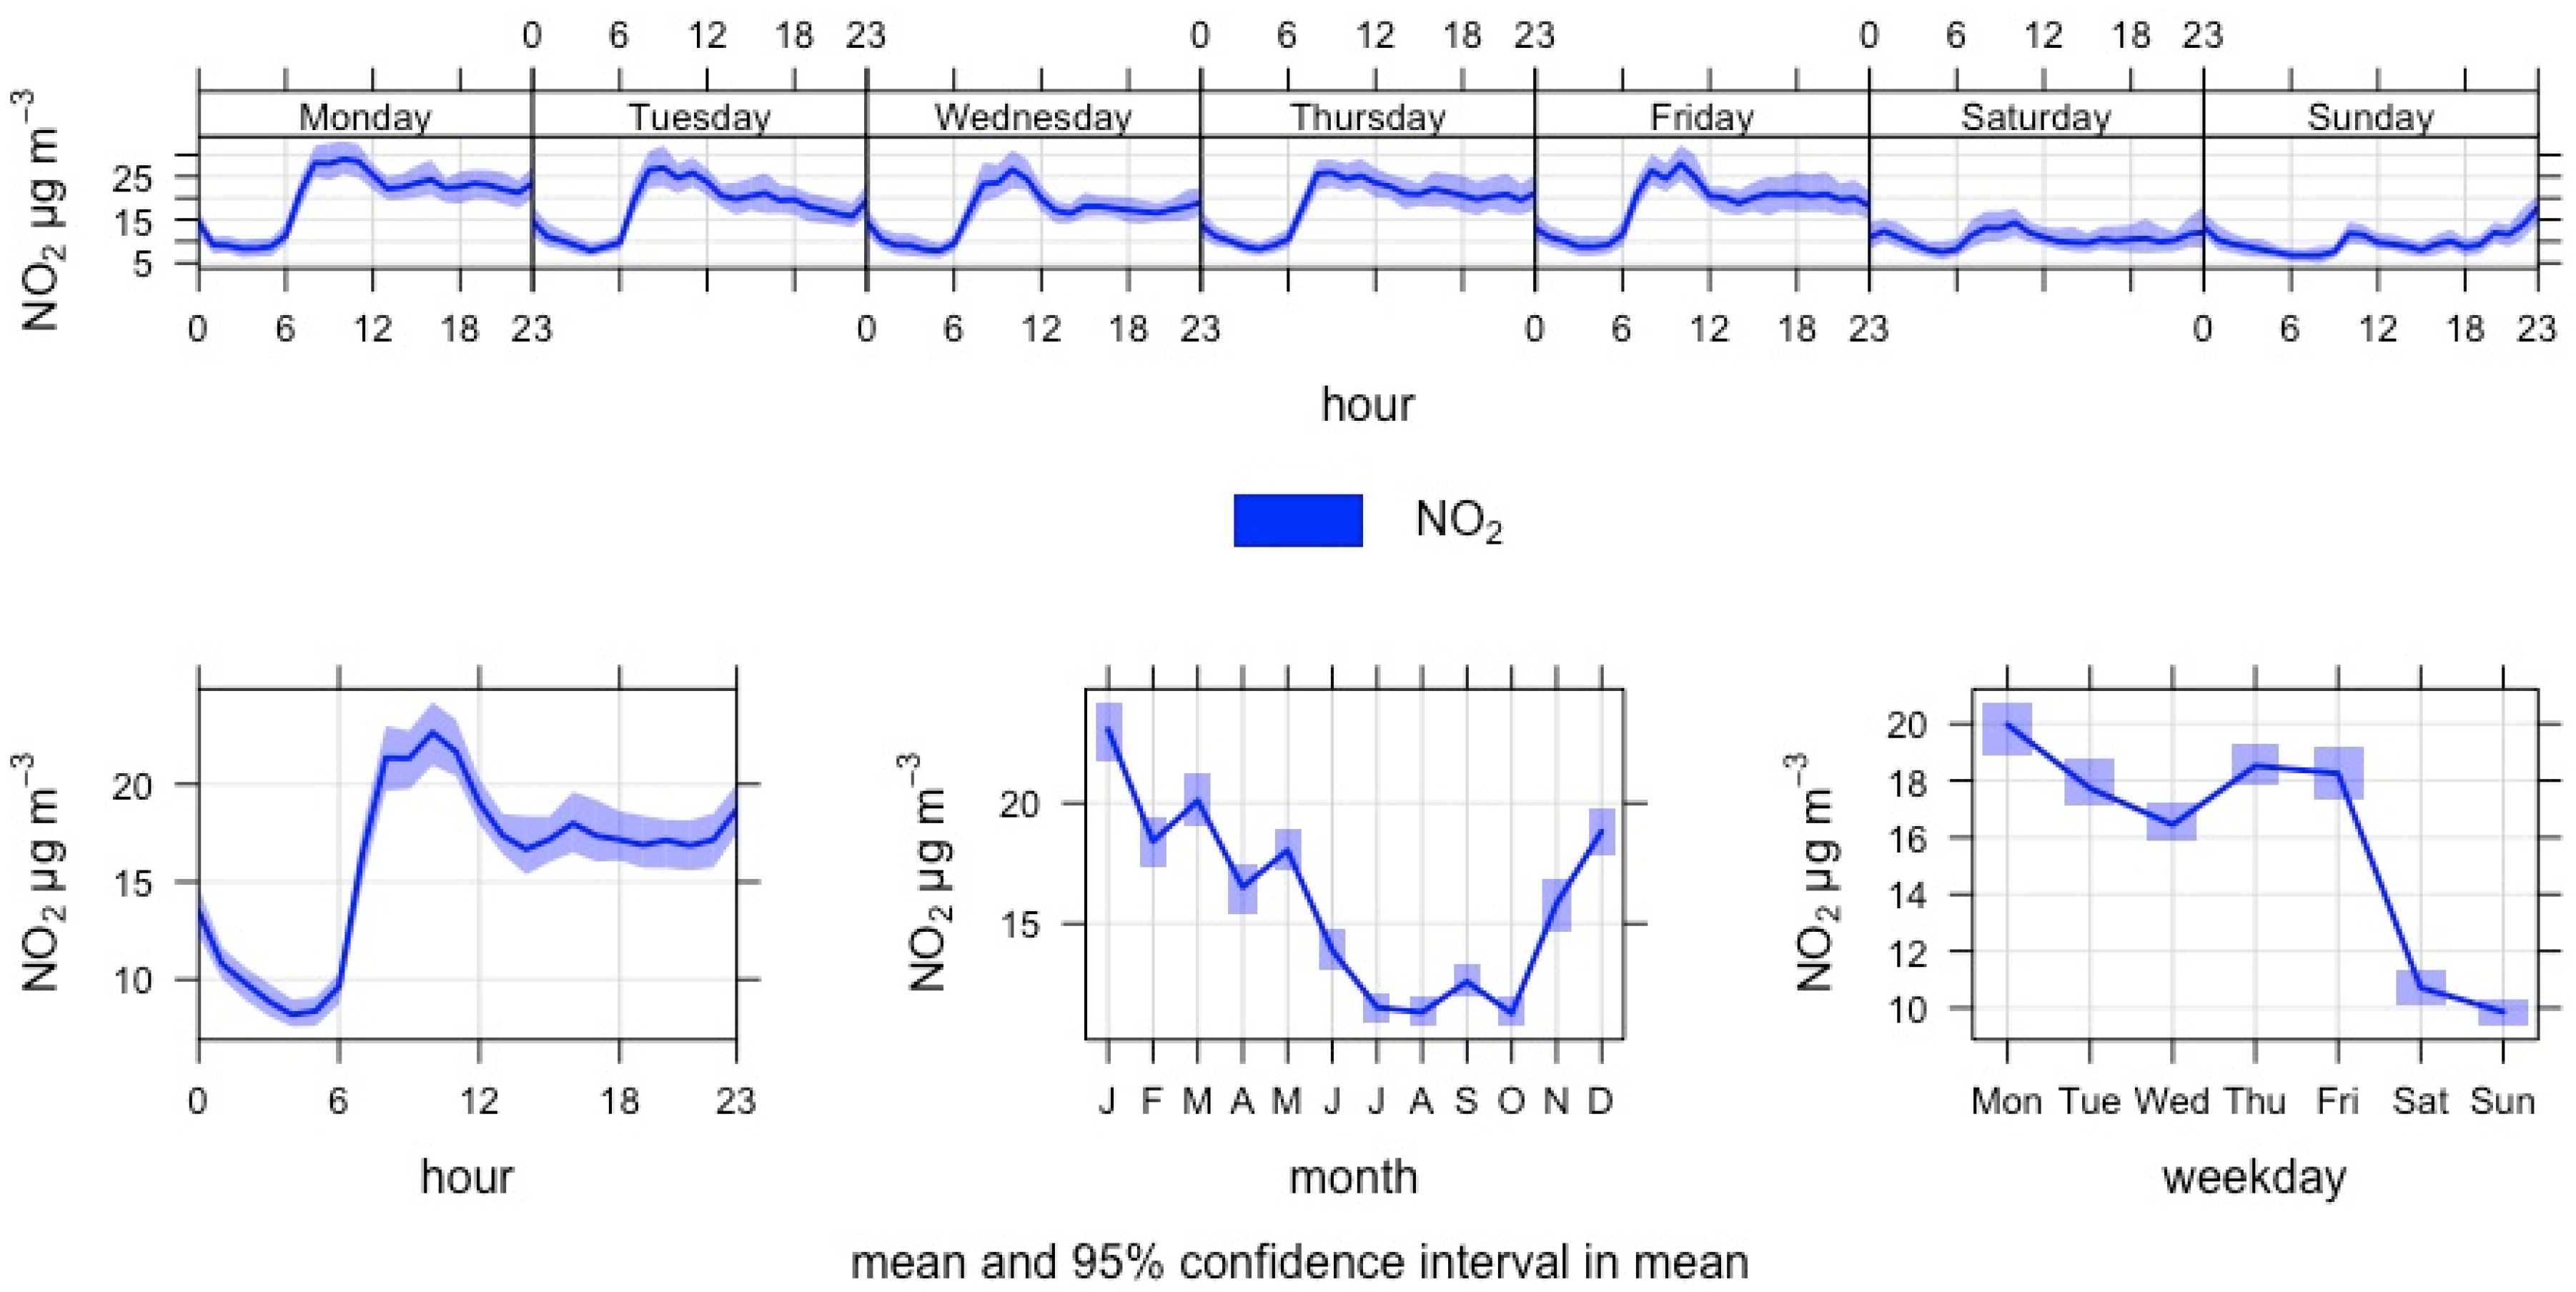
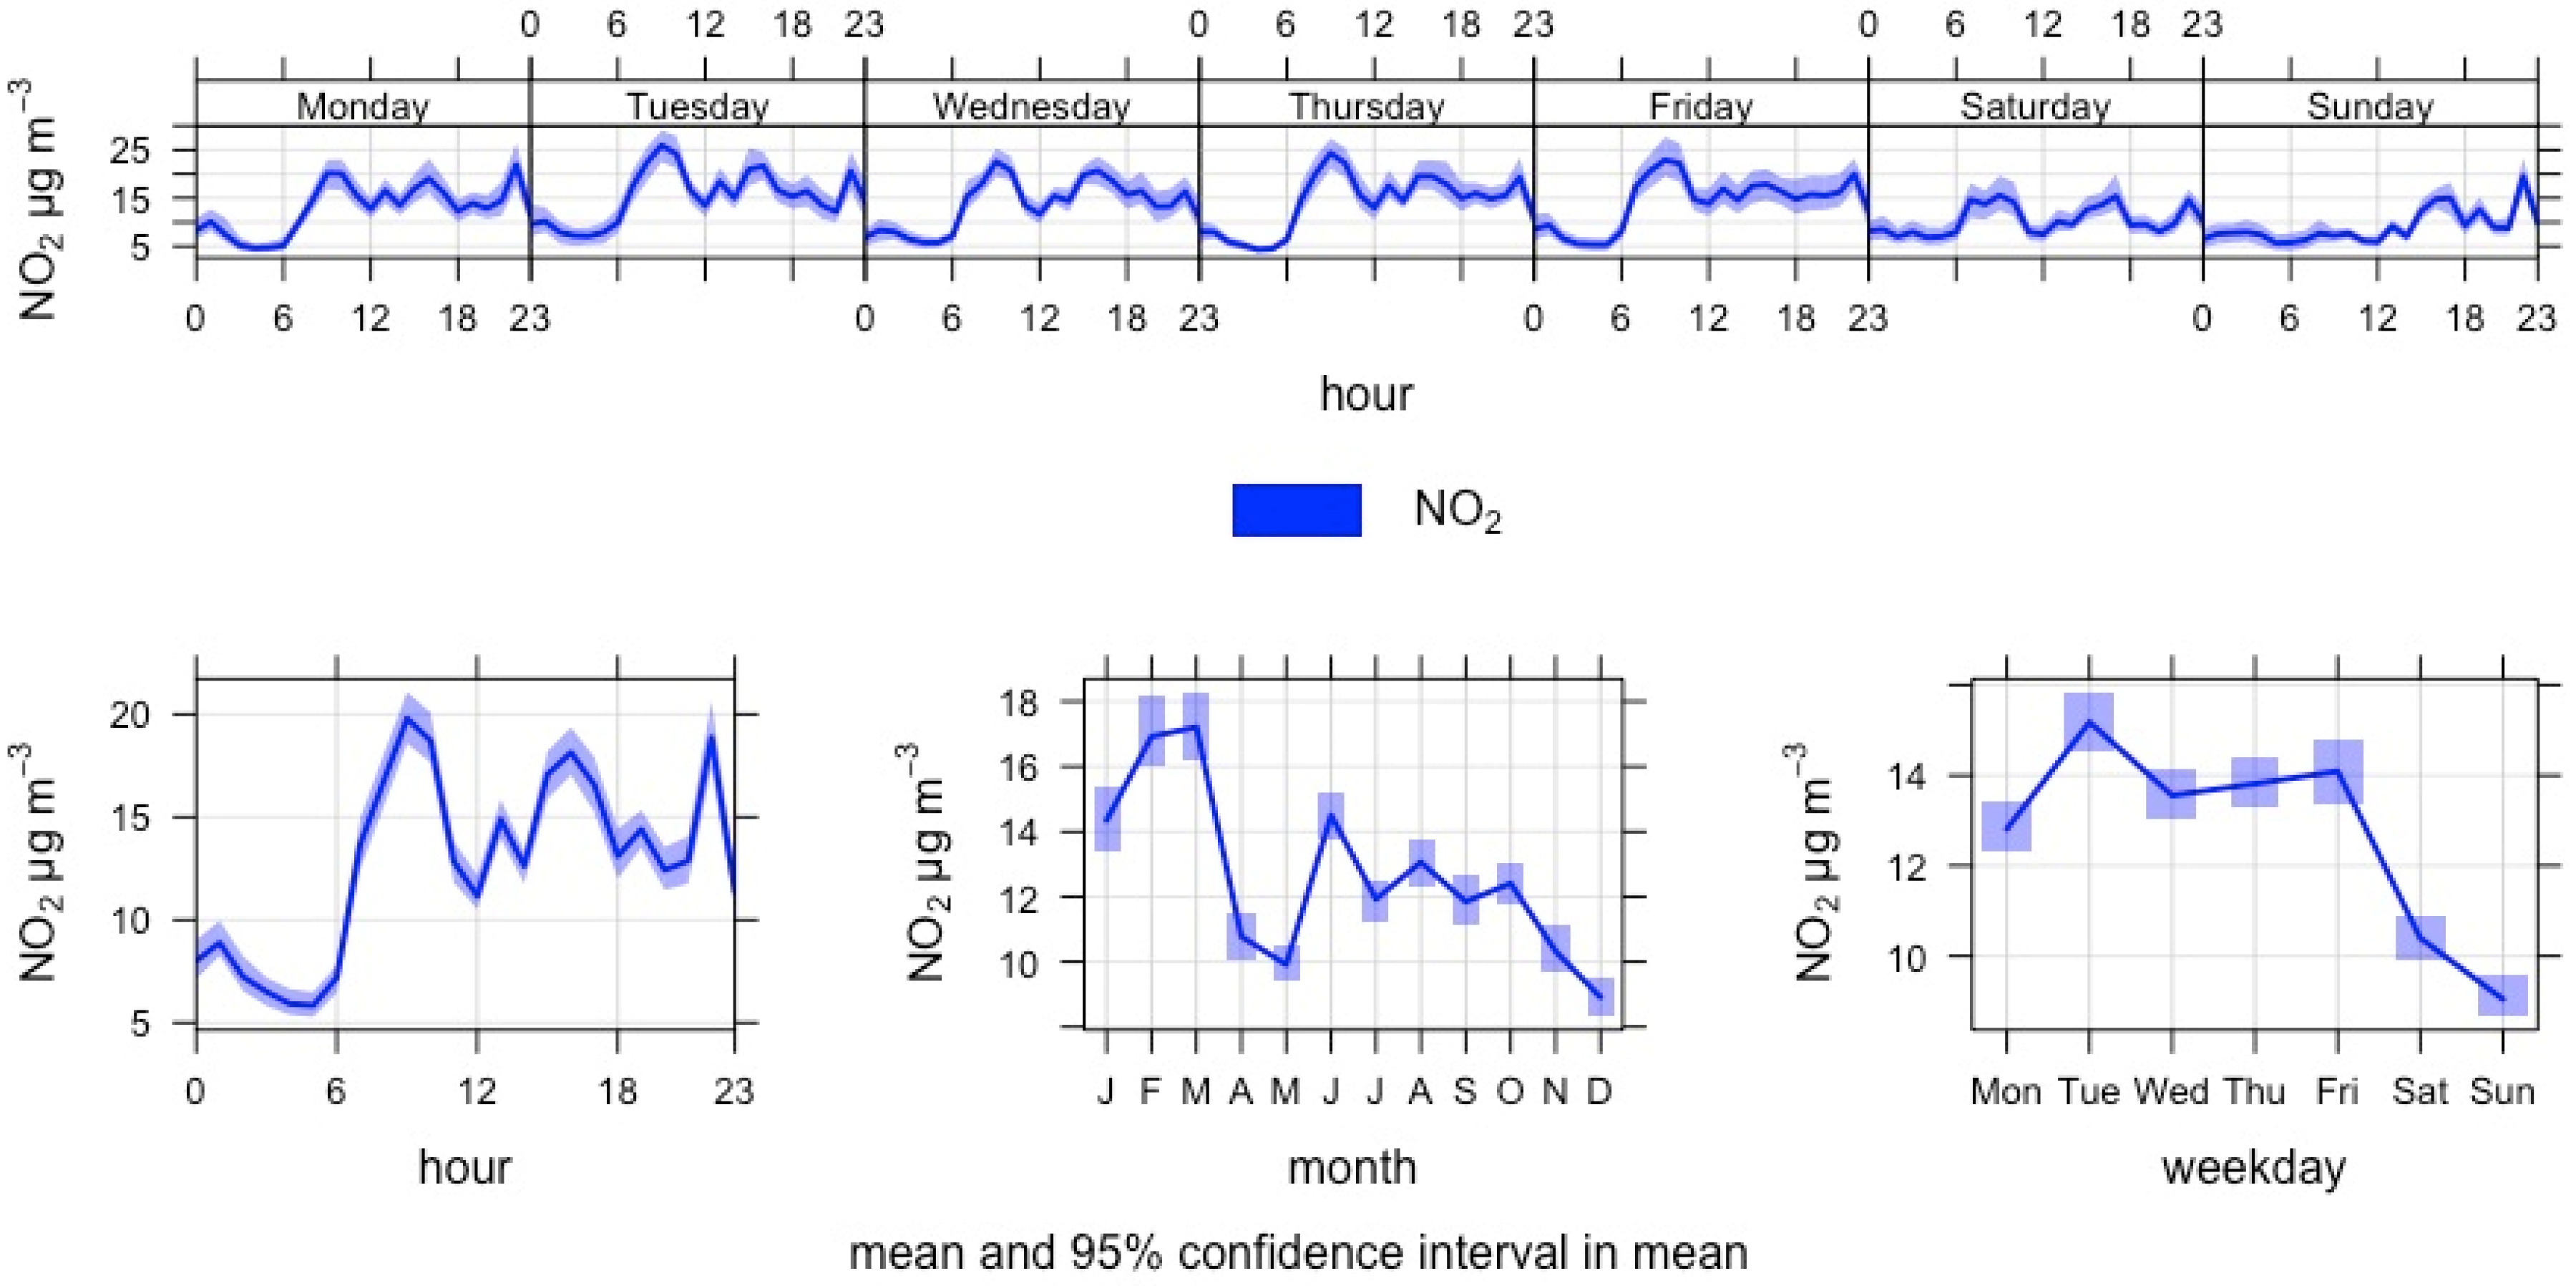
NO2 concentrations varied by time at the Vuosaari port terminal in 2016 (Figure 6) following a diurnal cycle. NO2 concentrations did not exceed the national hourly mean threshold for public health (200 µg/m3) nor the guideline daily mean (70 µg/m3), but the daily mean value exceeded the WHO 2021 guideline value (25 µg/m3) on 55 days and the EU Commission proposal value (50 µg/m3) on 1 day. Concentrations declined during the summer months: this could be explained by emissions from the near-by natural gas powerplant, which is used for district heating production during the cold time of the year. Another factor could be the chemical reaction of nitrogen oxides and ozone driven by photolysis [30]. The latter could have been examined in more detail if ozone concentrations were available, but O3 was not measured with the mobile unit. Time series plots of daily means and polar plots can be found in the Supplementary Material.
The multivariable linear regression shows a statistically significant (p < 0.05) association between vessel arrivals, departures, movement and lying at berth and the natural logarithm of hourly mean NO2 concentrations when adjusted for wind direction, wind speed, relative humidity, air temperature and time of day (Table 4). Arrivals correspond to a 25.1% increase (95% CI 21.4–29.0%) of the measured hourly mean NO2 concentration. However, arrivals were not statistically significant (p = 0.873) when the analysis was run with measurements conducted during weekends only. The effect of departures was consistent with both analyses. Each ship departure corresponds to an increase of 16.3% in the hourly mean NO2 (95% confidence interval 12.5–20.3%). All vessel movements (arrivals and departures combined) correspond to an increase of 21.3% (95% confidence interval 18.5–24.0%) during the whole year, and to 6.4% (95% confidence interval 1.1–11.9%) during the weekends only. Vessels at berth correspond to an increase of 6.0% (95% confidence interval 5.4–6.5%) during the whole year and 1.5% (95% confidence interval 0.5–2.6%) during the weekends only. The models for the whole year explain 24–27% and the weekend models 30–31% of the variance in the hourly mean NO2 concentration. The diagnostic plots (supplement) indicate an even distribution of the model residuals and some expected collinearity as the weather parameters correlate with each other and the vessel movement to the time of day. Based on the analyses, the association between vessel movement and increased NO2 concentrations seems strong, and departures show the most consistent results.
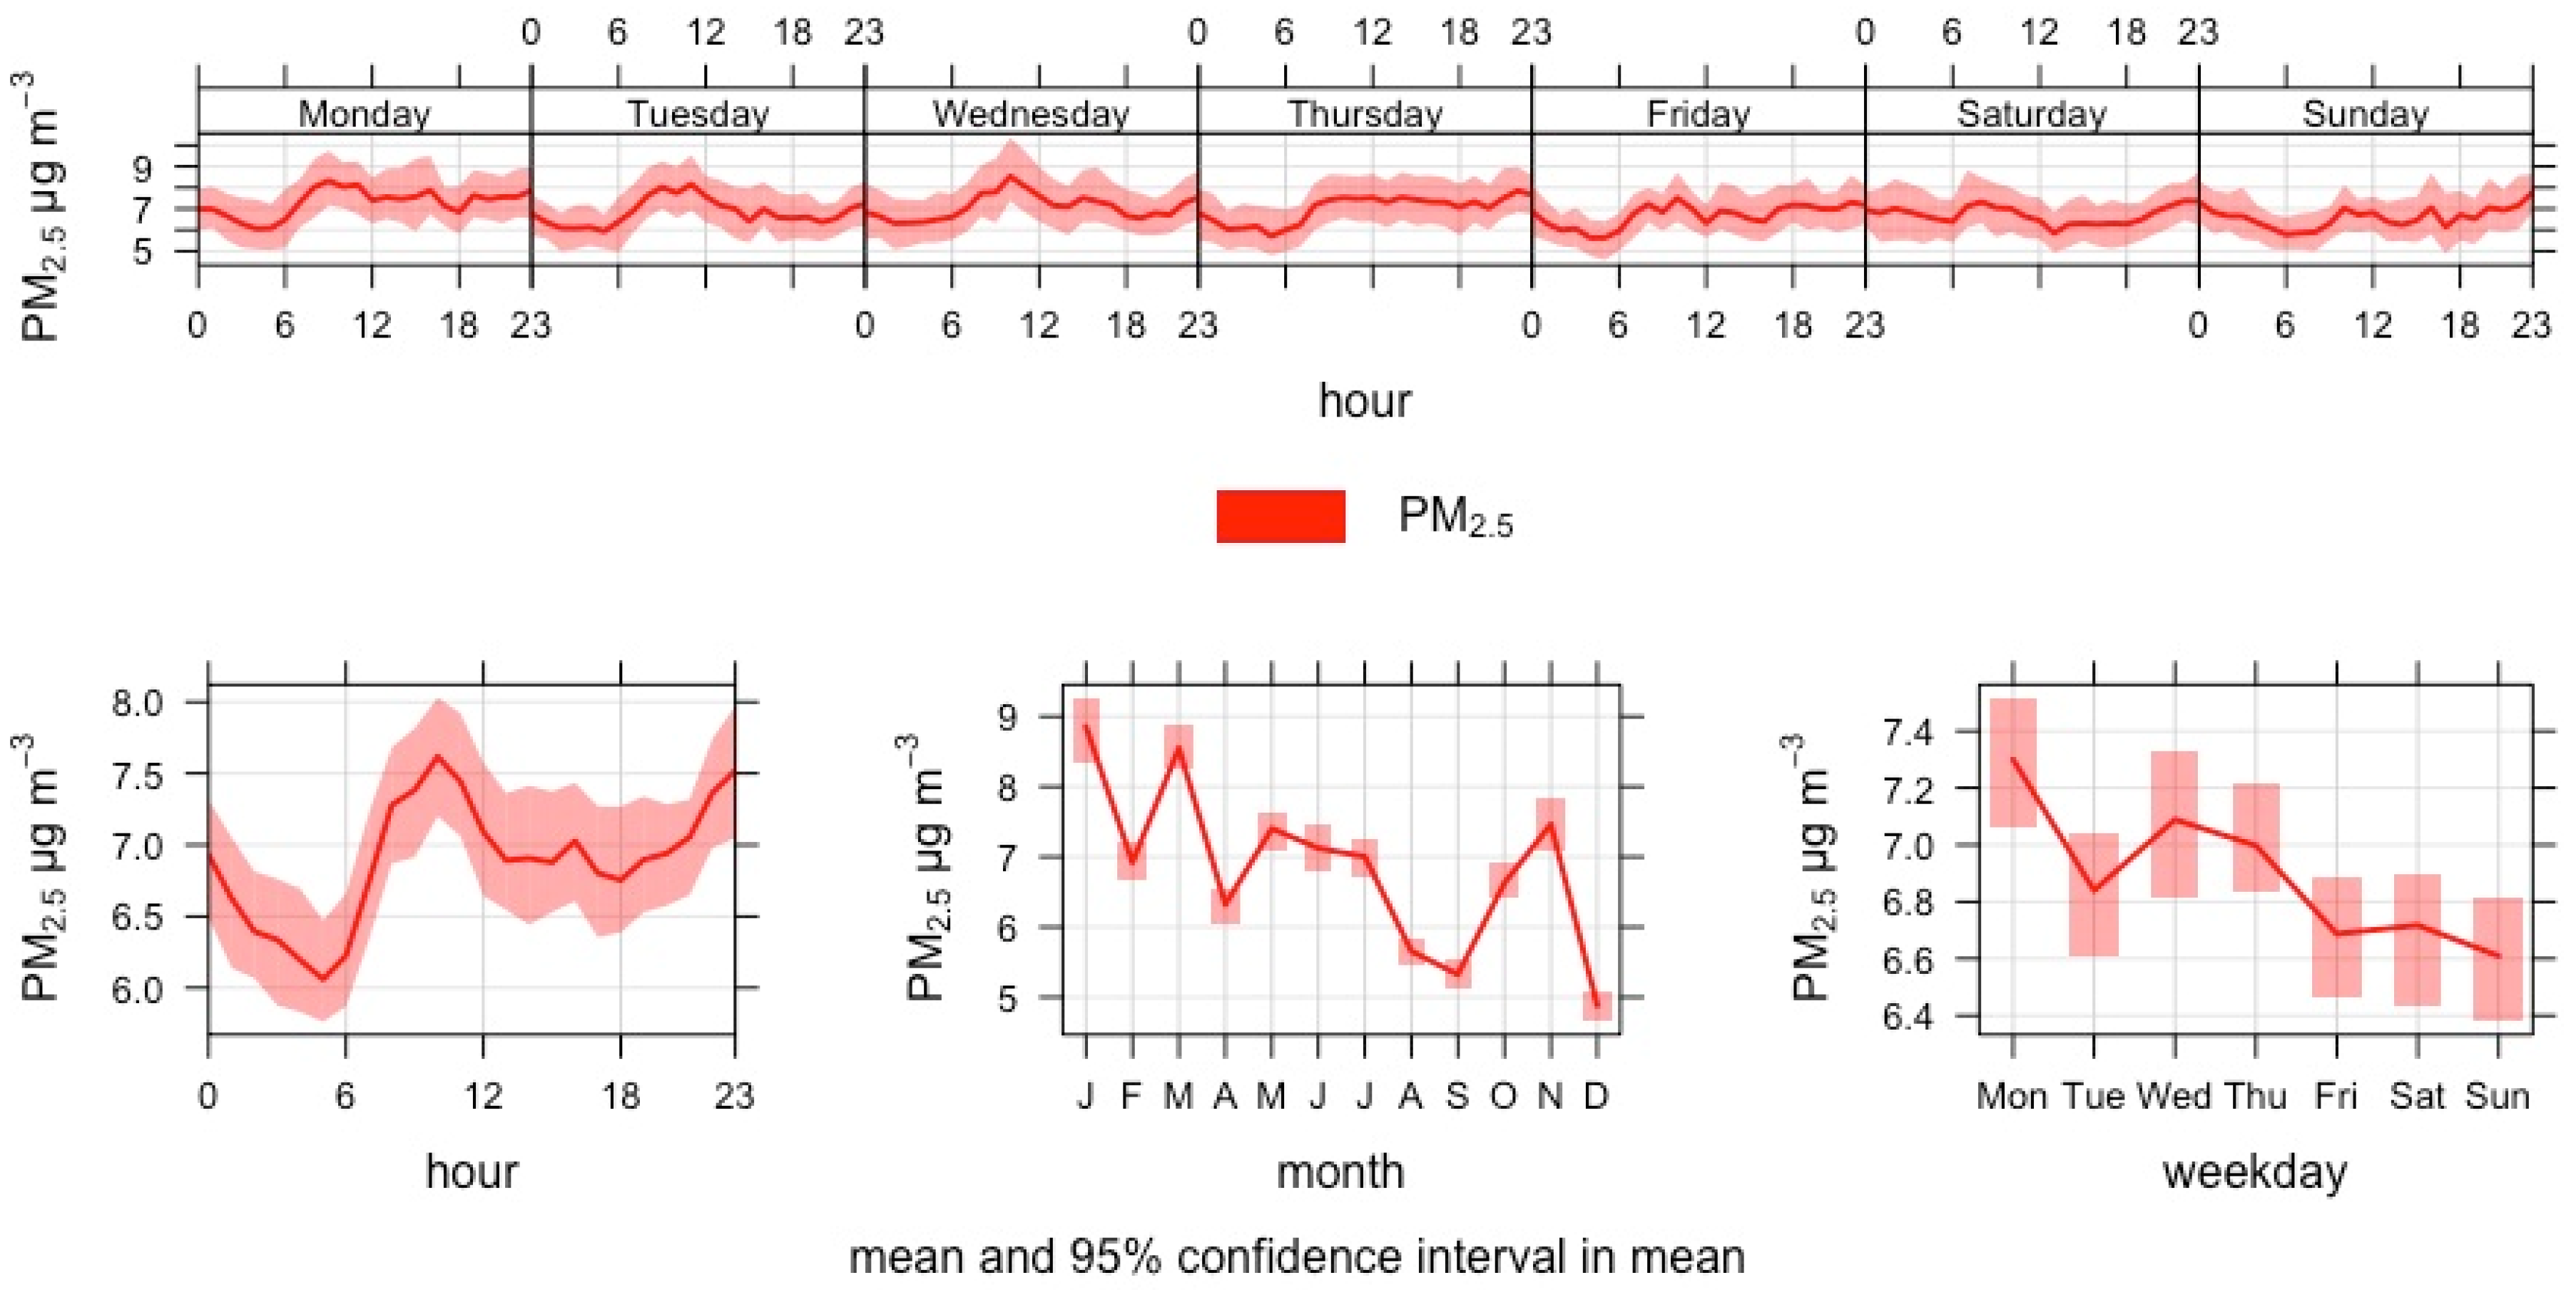
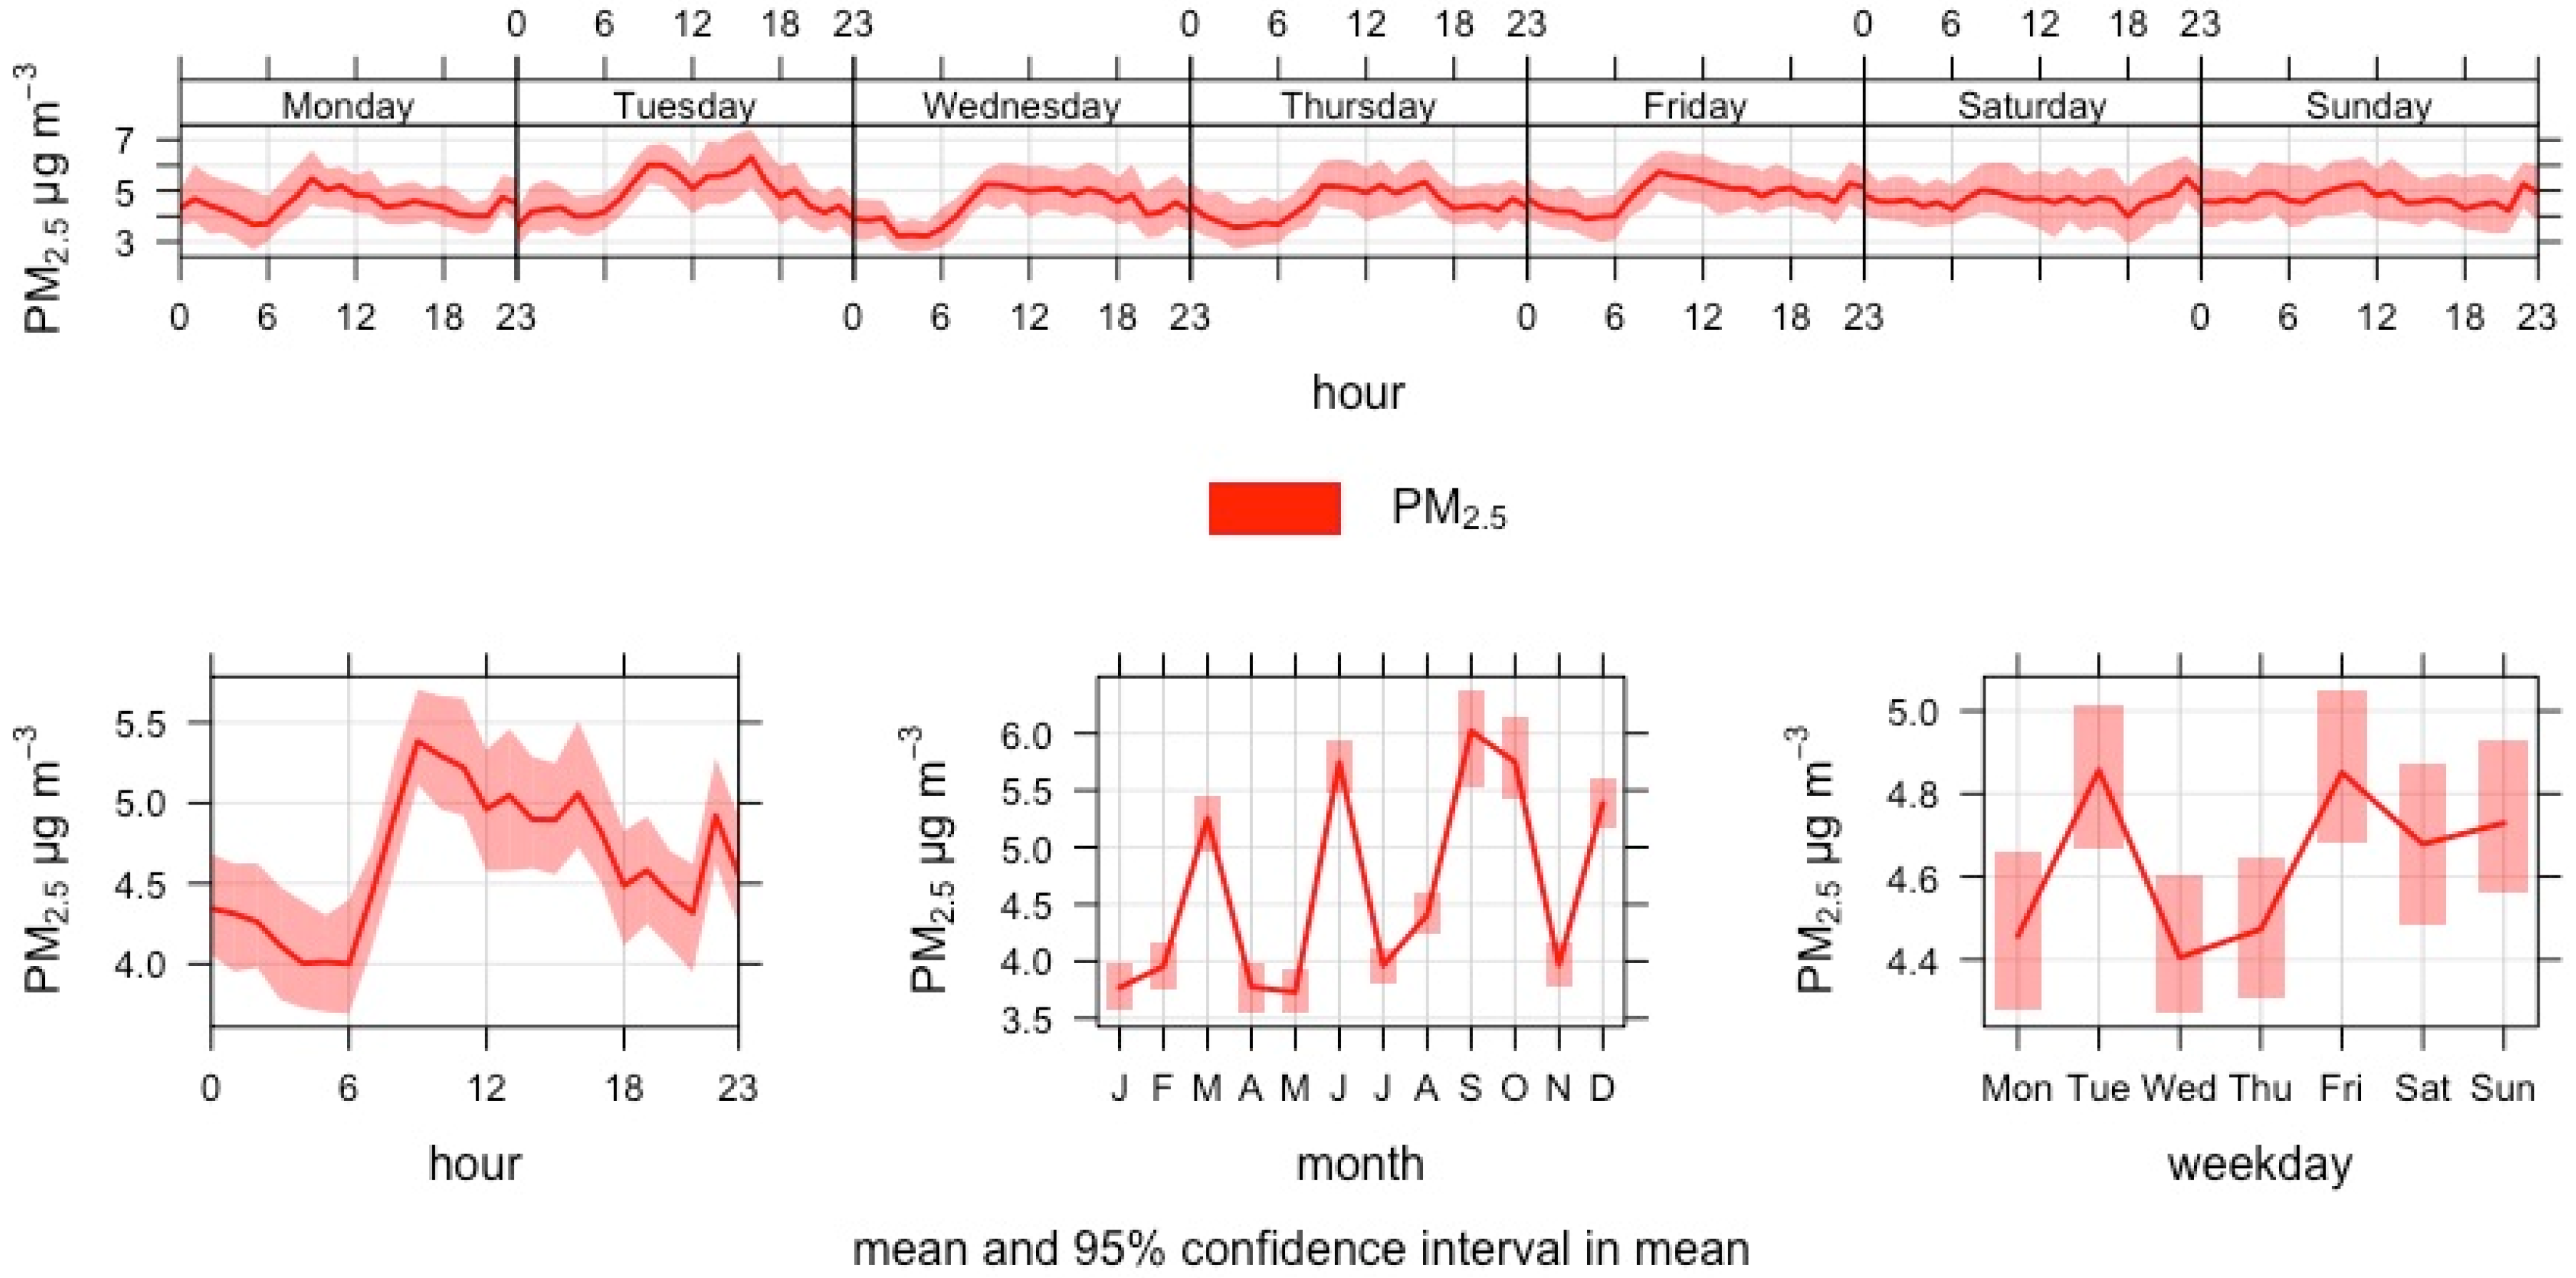
PM2.5 concentrations had less variability between seasons and even within the day than NO2, which could mean that ambient levels of particulate matter effect the concentration more than port activity (Figure 7). The daily mean concentration of PM2.5 exceeded the WHO 2021 guideline value (15 µg/m3) on 9 days in 2016 but did not exceed the EU Commission proposal (25 µg/m3).
The multivariable linear regression shows a statistically significant association for arrivals and vessels at berth with the natural logarithm of hourly mean PM2.5 concentrations. However, arrivals during the weekends are not statistically significant and the coefficient is negative. A similar result is observed for vessels at berth: the association is statistically significant for the whole year and for the weekends, but the coefficient is positive for the whole year and negative for the weekends (Table 5). The models for the whole year explain 13% and the models for the weekends explain 15% of the variation in the hourly mean logPM2.5. The diagnostic plots (supplement) show an uneven distribution of the model residuals and high collinearity between the model components. Based on the analyses, the association between vessel movement and PM2.5 concentrations is weak or non-existent.
3.2. South Harbour 2018
NO2 concentrations varied by time at the South Harbour in 2018 (Figure 8) following the diurnal cycle. NO2 concentrations did not exceed the hourly mean Finnish threshold (200 µg/m3) nor the daily mean guideline (70 µg/m3), but the daily mean exceeded the WHO 2021 guidance level (25 µg/m3) on 36 days and the EU Commission proposal (50 µg/m3) on 3 days. The months of February and May had higher mean concentrations of NO2 than other months, and the low mean value for January contradicts with the photolysis hypothesis presented with the Vuosaari 2016 data. Apart from the ships in the port, their cargo and road traffic, a significant source for emissions is the coal power plant of Hanasaari situated north from the sampling point.
The multivariable linear regression shows a statistically significant association between vessel arrivals, departures, combined movement and vessels at berth to the natural logarithm of hourly NO2 concentrations when adjusted for wind direction, wind speed, air temperature and time of day (Table 6). Relative humidity was dropped from the model as its effect was not statistically significant and did not improve the fit. Air temperature was dropped from the weekend models for the same reason. The coefficient for arrivals is the largest and corresponds to 27.3% of hourly mean NO2 (95% confidence interval 23.2–31.4%). However, the vessel arrival effect decreases when the analysis is run for the weekend-only data. The effect of departures on the other hand stays as significant with both analyses. Each departure corresponds 24.0% (95% confidence interval 19.6–28.5%) of the hourly mean NO2 concentration. Departures were also analysed for the different vessel types: passenger ferry vessel departures increased the hourly mean NO2 more than cruise ship departures, and the ferry departing from the Olympia quay had the largest effect (47%) on the hourly mean NO2 concentrations. The models for the whole year explain 22–26% and the models for the weekend only explain 21–23% of the variation in the NO2 hourly mean concentrations. Diagnostic plots for the models can be found in the Supplementary Material.
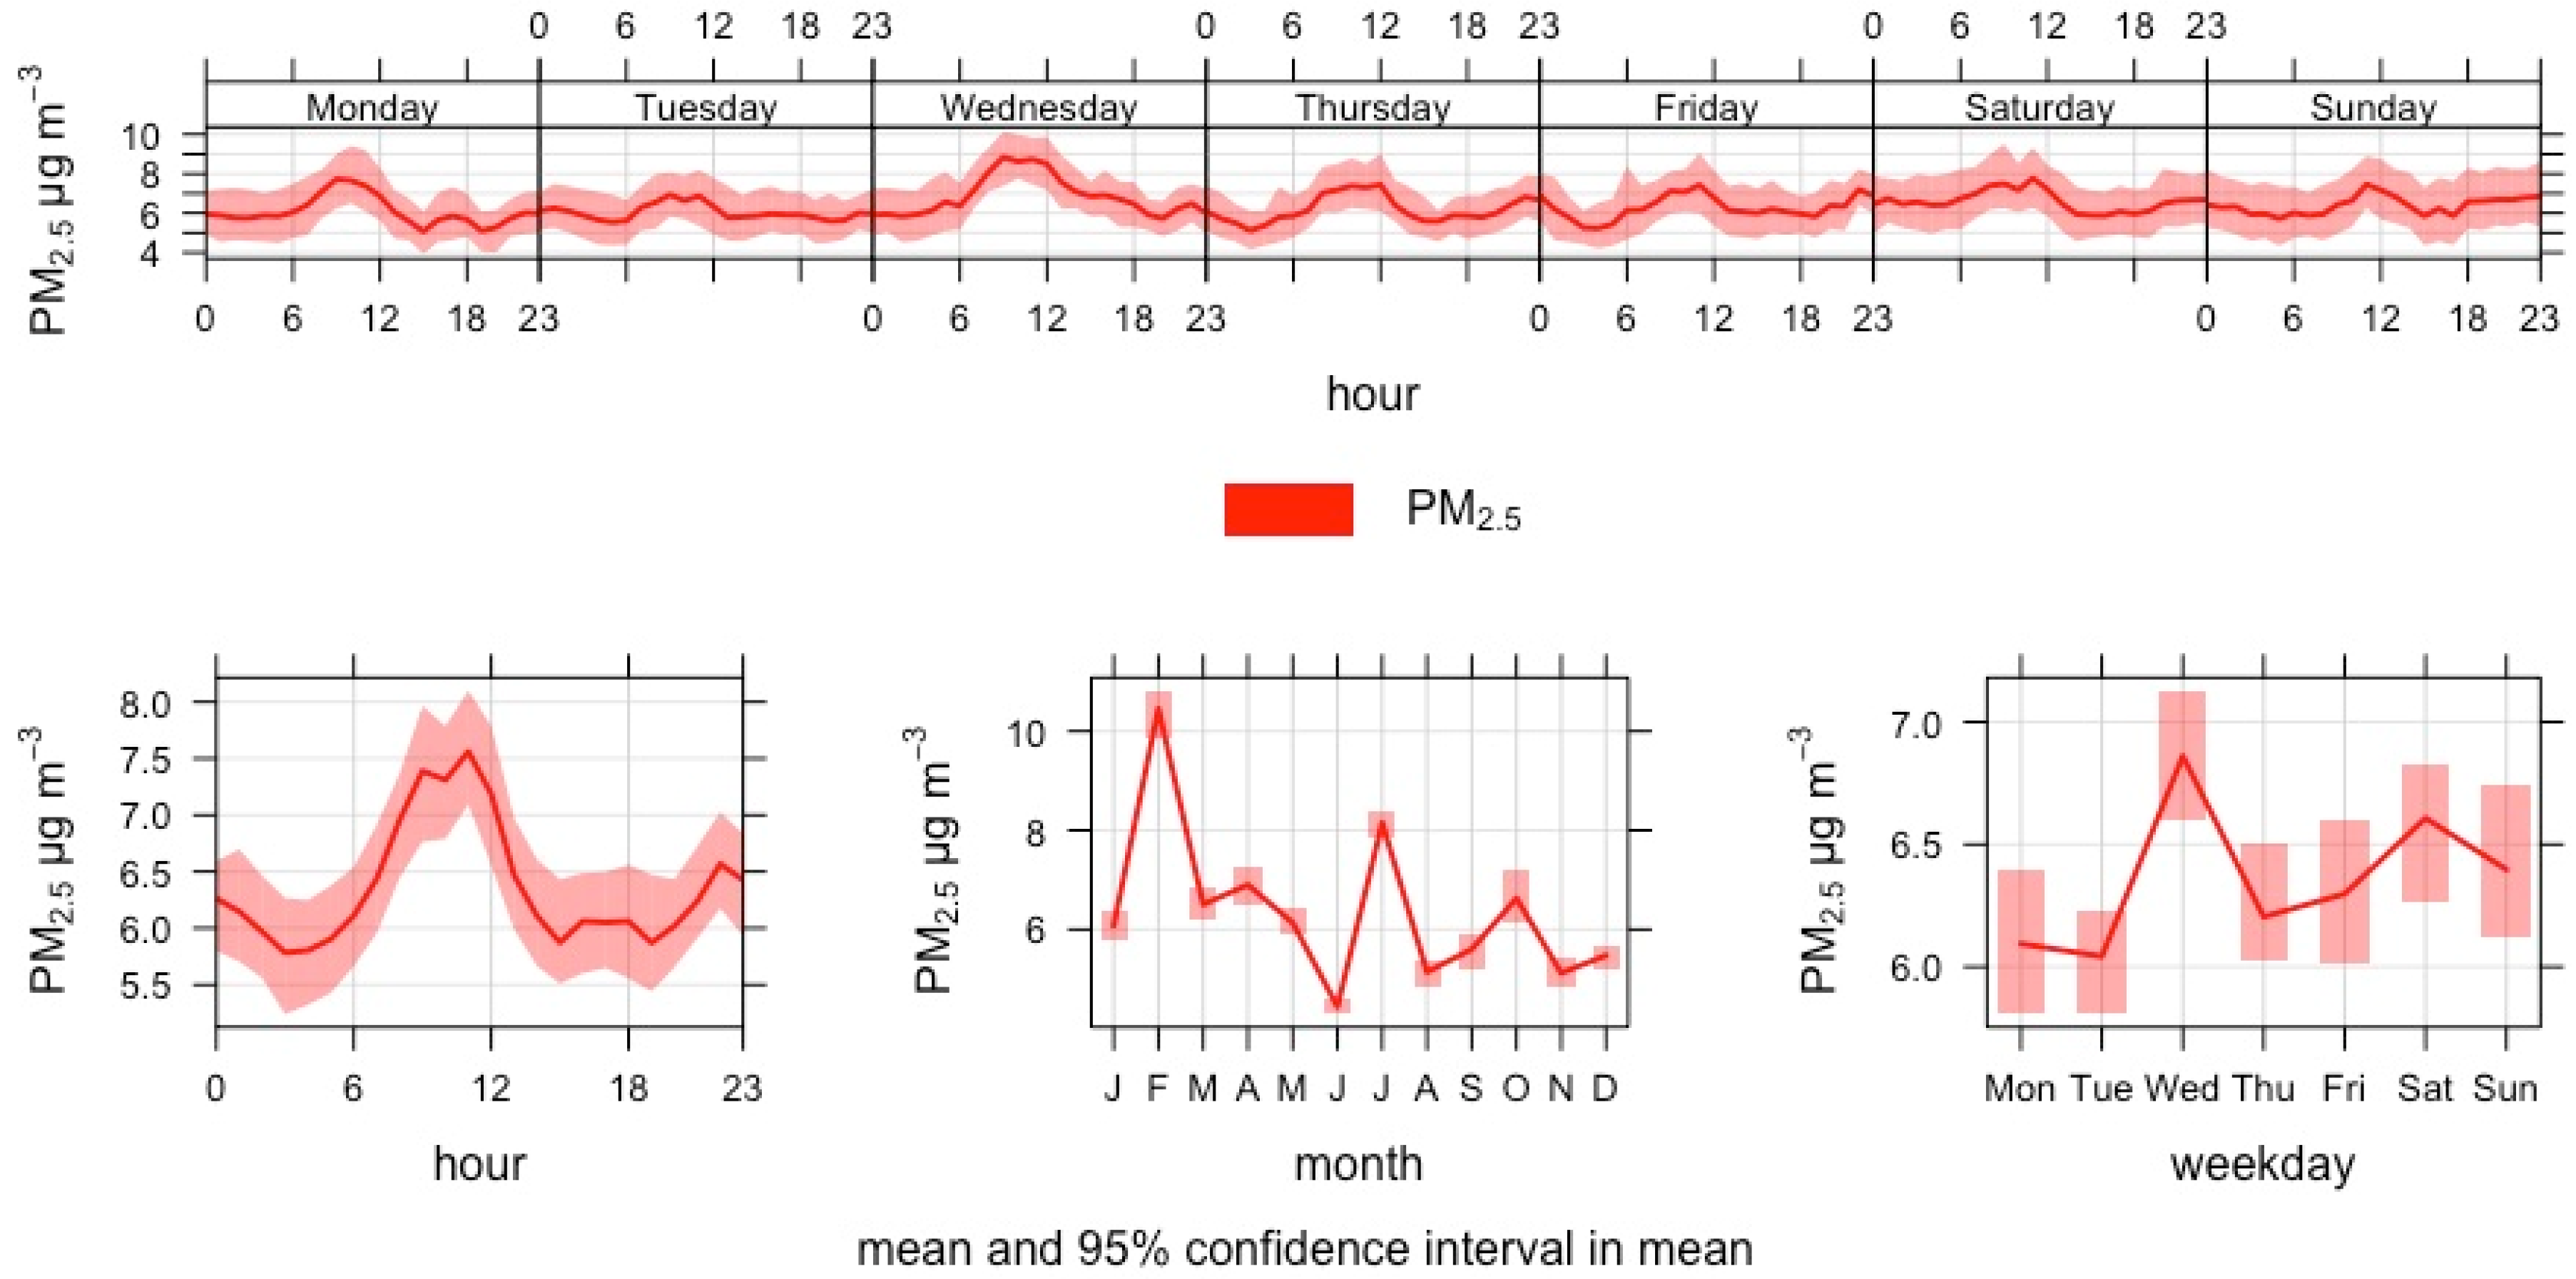
The PM2.5 hourly mean concentrations’ variability connection to the diurnal cycle was not as strong as in the case of NO2 at the South Harbour in 2018. Monthly variability within the year was large without a clear seasonal pattern indicating episodes of PM2.5 originating from sources other than port activities (Figure 9). The daily mean exceeded the WHO 2021 guidance level (15 μg/m3) on 16 days and the European Commission proposal (25 μg/m3) on 1 day.
The multivariable linear regression shows a statistically significant association between arrivals, departures, movement and vessels at berth and the natural logarithm of hourly PM2.5 concentrations when adjusted for wind direction, wind speed, relative humidity and time of day (Table 7) during the whole year. However, departures were not statistically significant in the weekend-only models. Air temperature was removed from the models as it was not statistically significant and did not improve the fit between observed and fitted values. Time of day was removed from the weekend models for the same reason. The largest effect was found with vessel arrivals to the Olympia quay, which correspond to 22.3% of the hourly mean PM2.5 (95% confidence interval 12.7–32.7%). The models for the whole year explain 14% and the models for the weekend only explain 25% of the variation in PM2.5 hourly mean concentrations. Based on the analyses, the association between vessel movement and hourly mean PM2.5 concentrations is weak, but with a positive signal for the vessels berthing at the Olympia quay.
3.3. West Harbour 2019
NO2 concentrations varied by time at the West Harbour in 2019 (Figure 10) following the weekday cycle except for the substantial increase in the late evening, which can also be seen during weekends, when the mean concentration otherwise decreases. This is probably due to the late arrivals and departures of the last Helsinki–Tallinn passenger ferries and the related road traffic. The monthly mean concentration shows variability without a seasonal pattern with January and April having the highest mean concentrations. Besides port activity and road traffic, there are two possible combustion-based sources for local NO2 emissions: the coal power plant of Salmisaari (north-west of the sampling point), the fuel oil powered backup plant of Kellosaari (north-west of the sampling point) and the fuel-oil powered backup district heating plant of Munkkisaari (east-northeast of the sampling point), both active in the coldest times of the year (Figure 1). The hourly mean threshold of 200 µg/m3 was not exceeded in 2019 nor the daily guideline value of 70 µg/m3, but the daily mean exceeded the WHO 2021 guidance level of 25 µg/m3 on 39 days and the European Commission proposal of 50 µg/m3 on 1 day.
The multivariable linear regression shows a statistically significant effect for arrivals, departures, movement and vessels at berth to the natural logarithm of hourly mean NO2 concentrations in West Harbour in 2019 when controlled for wind speed, wind direction, air temperature, relative humidity and time of day (Table 8). However, the effect of arrivals turns negative when analysed with the weekend-only data. For departures on the other hand, the effect stays significant on both analyses. Each departure corresponds to 62.6% of the hourly mean NO2 concentration (95% confidence interval 57.5–67.9%). During the summer season, large cruise vessels berth in West Harbour across the basin from where the HSY mobile air quality measuring unit was placed. The effect of the ferry vessels was larger than for the cruise ships when analysed with the data for the whole year. However, the effect size was reversed when analysed for the weekend-only data. The models explain 17–24% of the variation in the hourly mean NO2 concentrations. Based on the analyses, the association between vessel movement and the hourly mean NO2 concentration seems to be strong, and departures have the largest effect.
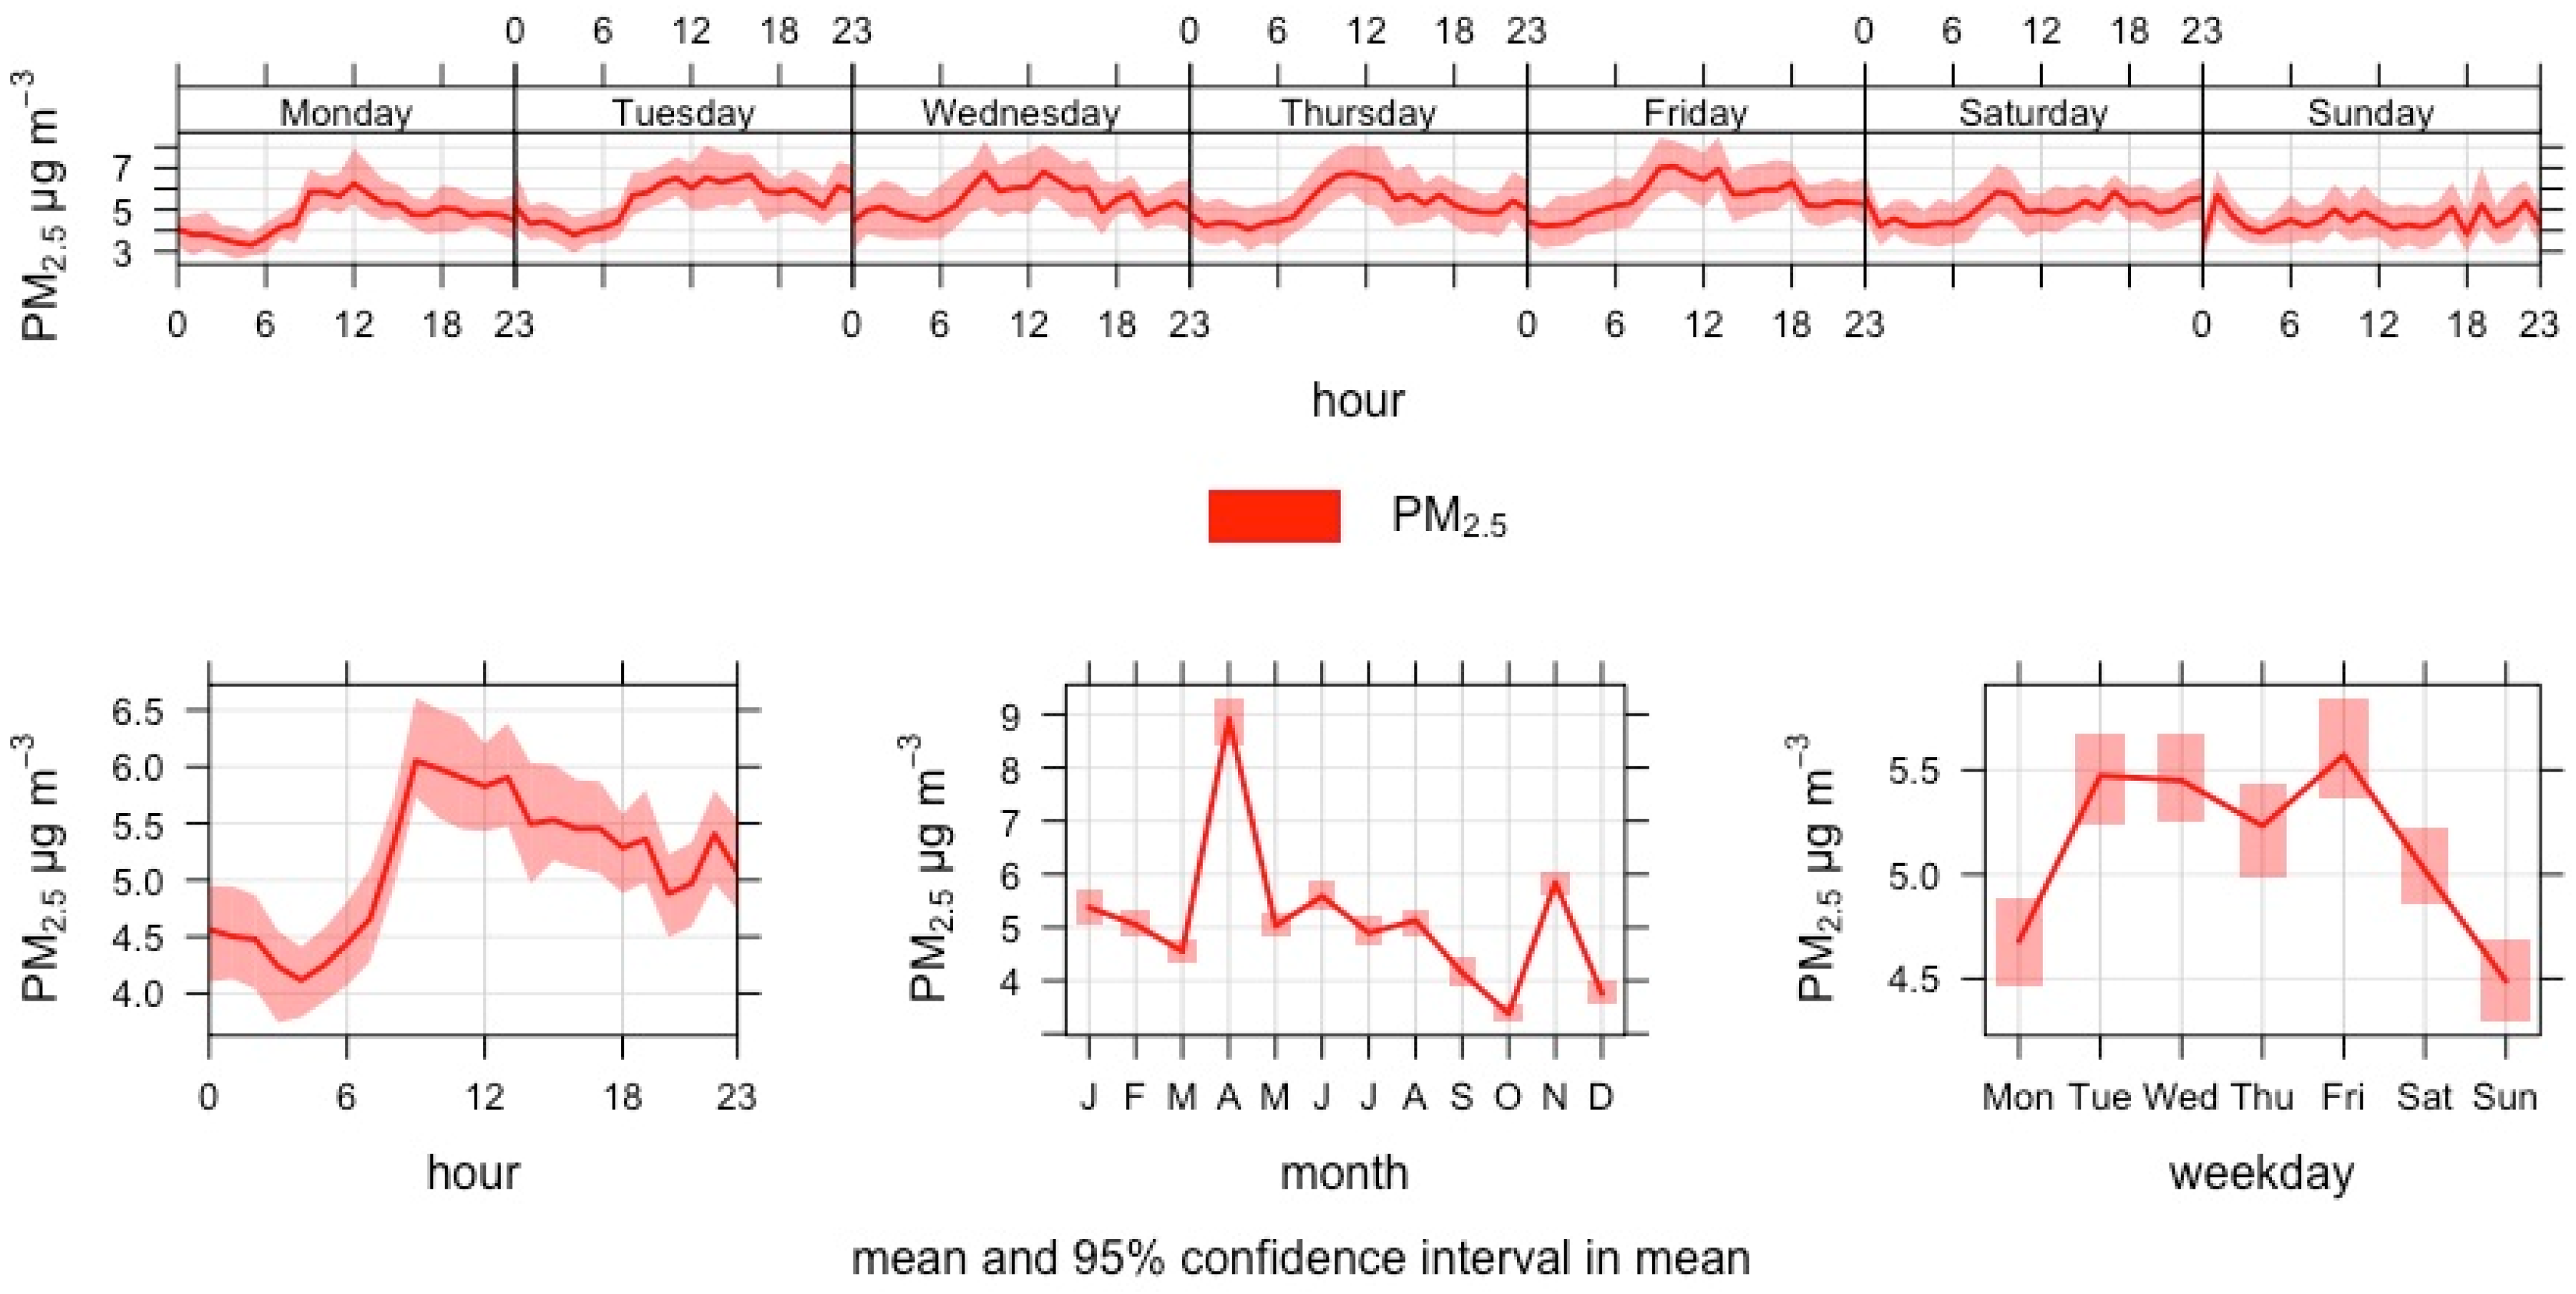
The hourly mean PM2.5 varied by time at West Harbour in 2019. The daily mean PM2.5 exceeded the WHO 2021 guidance level of 15 µg/m3 on 7 days but not the European Commission proposal of 25 µg/m3. The variability between months was small apart from April (Figure 11).
The multivariable linear regression found a statistically significant association with arrivals, departures, movement and vessels at berth and the natural logarithm of hourly mean PM2.5 concentrations when adjusted for wind direction, wind speed, relative humidity and time of day. However, none of the vessel movement parameters were statistically significant when the analyses were run with the weekend-only data (Table 9). The models explain only 7–10% of the variation in the hourly mean PM2.5. Based on the analyses, the association between vessel movement and PM2.5 concentration seems weak or non-existent.
3.4. West Harbour 2020
Air quality was significantly better at West Harbour in 2020 compared to 2019: the annual mean of NO2 was 12.7 μg/m3 in 2020 compared to 16.3 μg/m3 (NO2) in 2019. This can be explained by the effect of the COVID-19 pandemic restrictions and recommendations, as can be seen clearly in March and April. In addition, there were no cruise ship visits in Helsinki for the whole year. The NO2 hourly mean threshold value (200 µg/m3) was not exceeded nor the national daily mean guidance level (70 µg/m3), but the WHO 2021 guidance level (25 µg/m3) was exceeded on 20 days and the European Commission proposal (50 µg/m3) on 1 day. The late evening increase in the hourly mean NO2 is still identifiable similarly to the 2019 data (Figure 12).
The multivariable linear regression found a statistically significant association for arrivals, departures, movement and vessels at berth and the natural logarithm of hourly mean NO2 (Table 10), but the effect of vessels at berth was negative. However, the effect of arrivals was not statistically significant when the analysis was run with the weekend data. Departures remain significant with both datasets: departures correspond to 70.9% (95% confidence interval 64.9–77.2%) of the hourly mean NO2 concentration. The models explain 10–23% of the variation in hourly mean NO2. Based on the analyses, the association between vessel departures and increased concentration of hourly mean NO2 seems strong.
The COVID-19 pandemic restrictions and recommendations seem to have also decreased the PM2.5 concentration in West Harbour in 2020. The annual mean was 4.6 μg/m3 compared to 5.1 μg/m3 in 2019. This was the only time the annual mean was below the WHO 2021 guidance value of 5 µg/m3 during this study. The daily mean exceeded the WHO 2021 guidance level (15 µg/m3) on 4 days but not the European Commission proposal (25 µg/m3) (Figure 13).
The multivariable linear regression found a statistically significant association for departure, movement and vessels at berth and the natural logarithm of hourly mean PM2.5 (Table 11) when controlled for wind speed, wind direction, air temperature, relative humidity and time of day. However, none of the vessel movement parameters were statistically significant when analysed with the weekend-only data. Based on the analyses, the association between vessel movement and hourly mean PM2.5 concentrations was weak or non-existent.
3.5. Katajanokka 2021
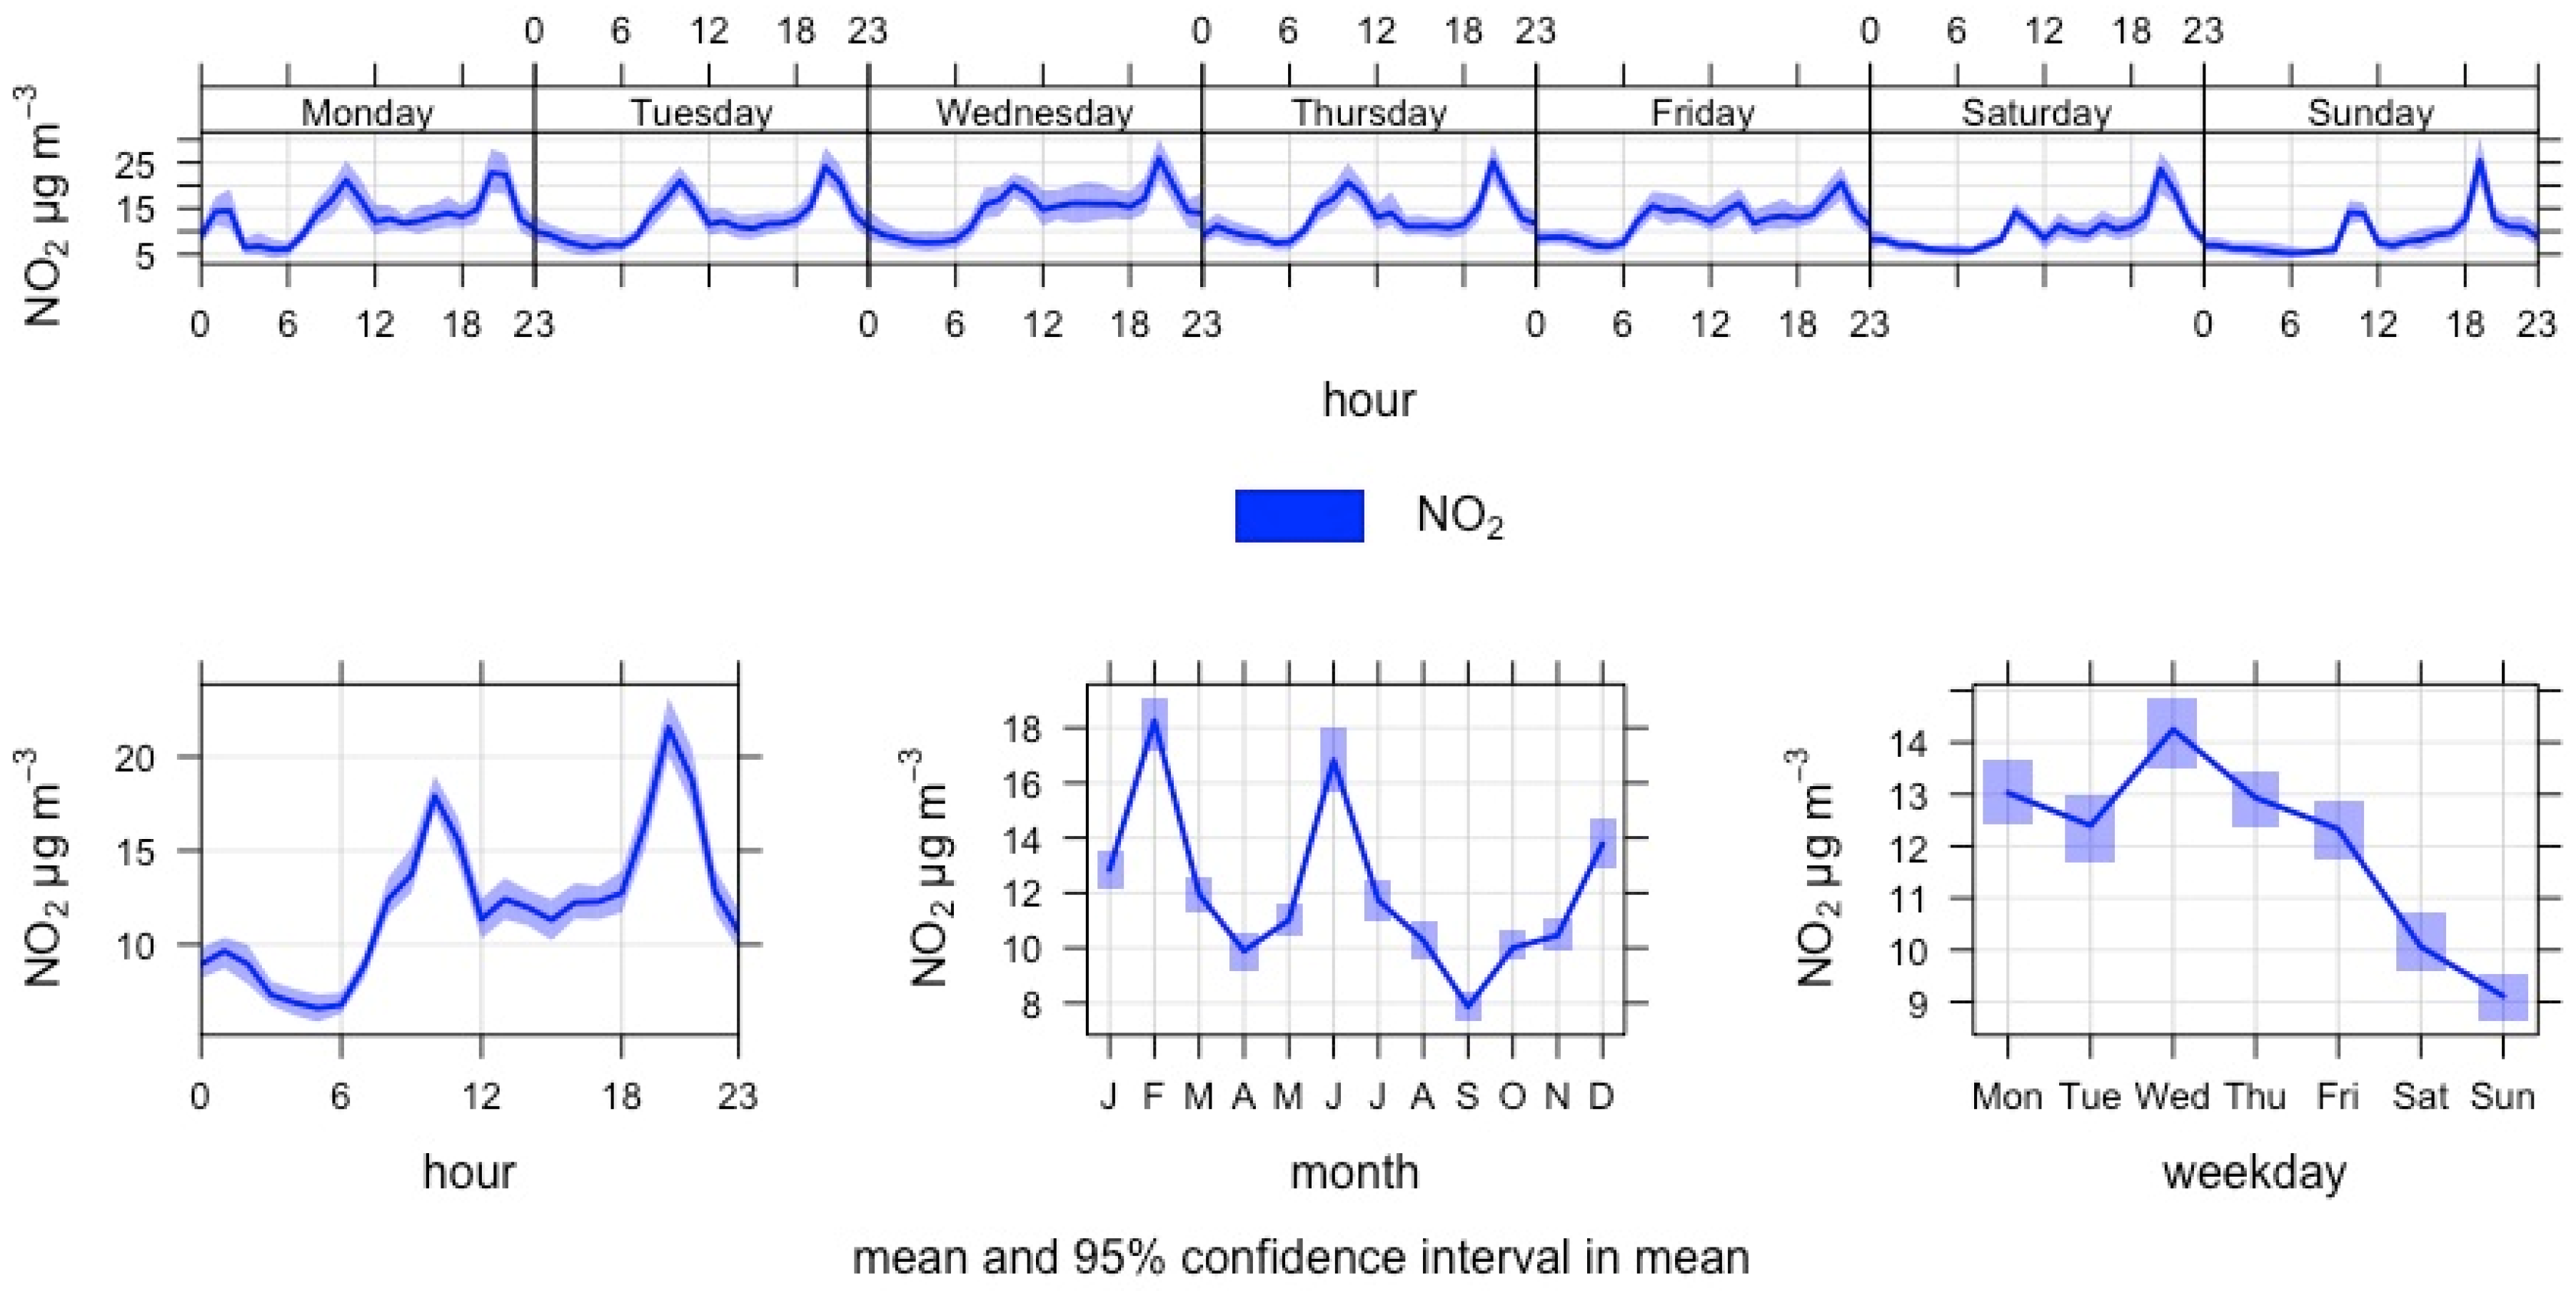
The sampling site for 2021 was at the car park area just beside the ferry terminal, which has regular daily vessel traffic to Stockholm, Mariehamn and Tallinn. During the summer months, the closest ferry operator runs extra departures to Tallinn. The late evening arrivals and departures can be seen in the NO2 concentrations, which peak between 1800–2300 h, unlike in areas that are more exposed to road traffic emissions (Figure 14). The hourly mean did not exceed the national threshold (200 µg/m3) nor the daily mean guidance level (70 µg/m3), but the daily mean exceeded the WHO 2021 guidance level (25 µg/m3) on 18 days but not the European Commission proposal (50 µg/m3).
Two passenger ferry operators use South Harbour for regular services. A twice-a-day ferry line to Tallinn has its berth closest to where the HSY mobile measuring unit was placed in 2021. Comparisons were made between ferry movements and all ship movements in the port. The multivariable linear regression analysis found a statistically significant association for arrival, departure, movement and vessels at berth and the natural logarithm of hourly mean NO2 concentrations when controlled for wind direction, wind speed, air temperature, relative humidity and time of day (Table 12). However, arrivals were not statistically significant when the analysis was run with the weekend-only data. The effect of the closest ferry departure was largest, and it corresponds to 82.2% (95% confidence interval 72.5–92.5%) of the hourly mean NO2 concentration. Based on the analyses, the association between the ship departures and increased hourly mean NO2 concentration is strong and the closer to the vessel departing, more elevated concentrations of NO2 can be observed.
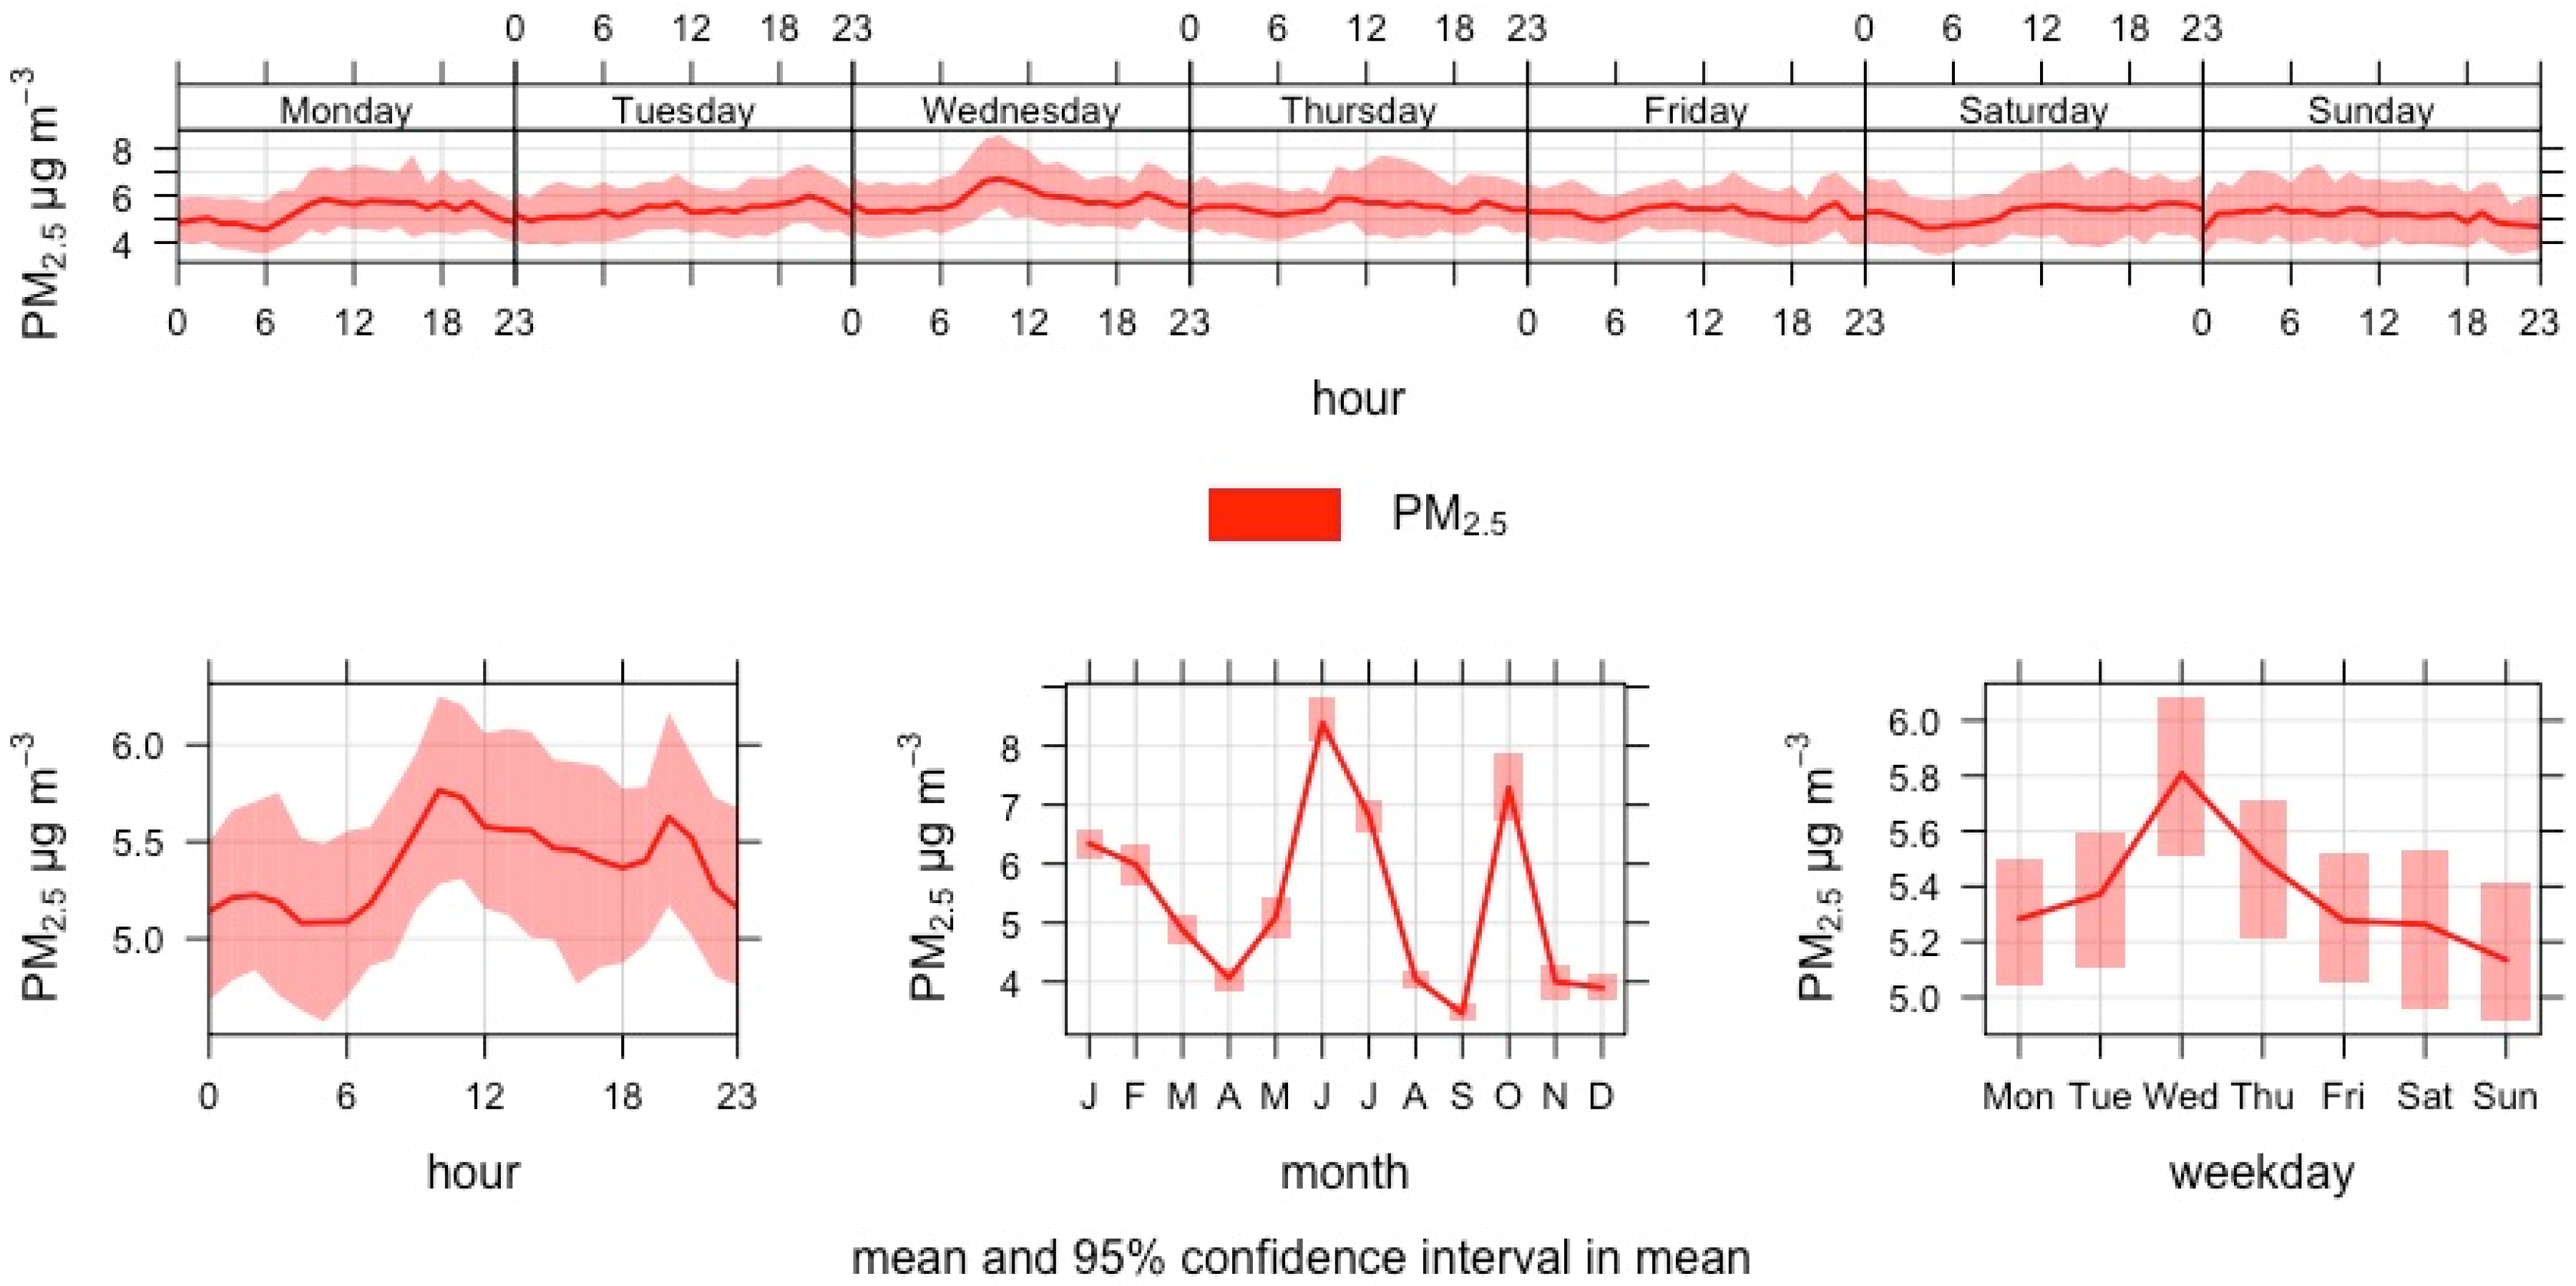
The annual mean PM2.5 at Katajanokka 2021 (5.4 µg/m3) was again above the WHO 2021 guidance level of 5 µg/m3 after being below the level in 2020 at West Harbour. The daily mean WHO 2021 guidance level (15 µg/m3) was exceeded on 12 days and the European Commission proposal (25 µg/m3) on 1 day. Within the year, there is a seasonal pattern with June and October being the peaks. There is a similar daily increase between 1800–2300 h than with NO2, which might be related to the evening arrival and departure of the nearest ferry vessels (Figure 15).
None of the vessel movement parameters had a statistically significant association with the logarithm of hourly mean PM2.5 concentrations in Katajanokka in 2021 (Table 13).
3.6. Summary of Results
Connecting vessels to shore power in the port of Helsinki following the EU Green Deal initiative would reduce the emissions caused by ship auxiliary engines. Even though most of the ship visits consist of passenger ferry vessels that stay in port for less than 2 h, the mean combined combusted fuel by passenger and container ships while alongside for more than 2 h was 78% (75–80%) of total fuel combusted while in port from 2018 to 2020.
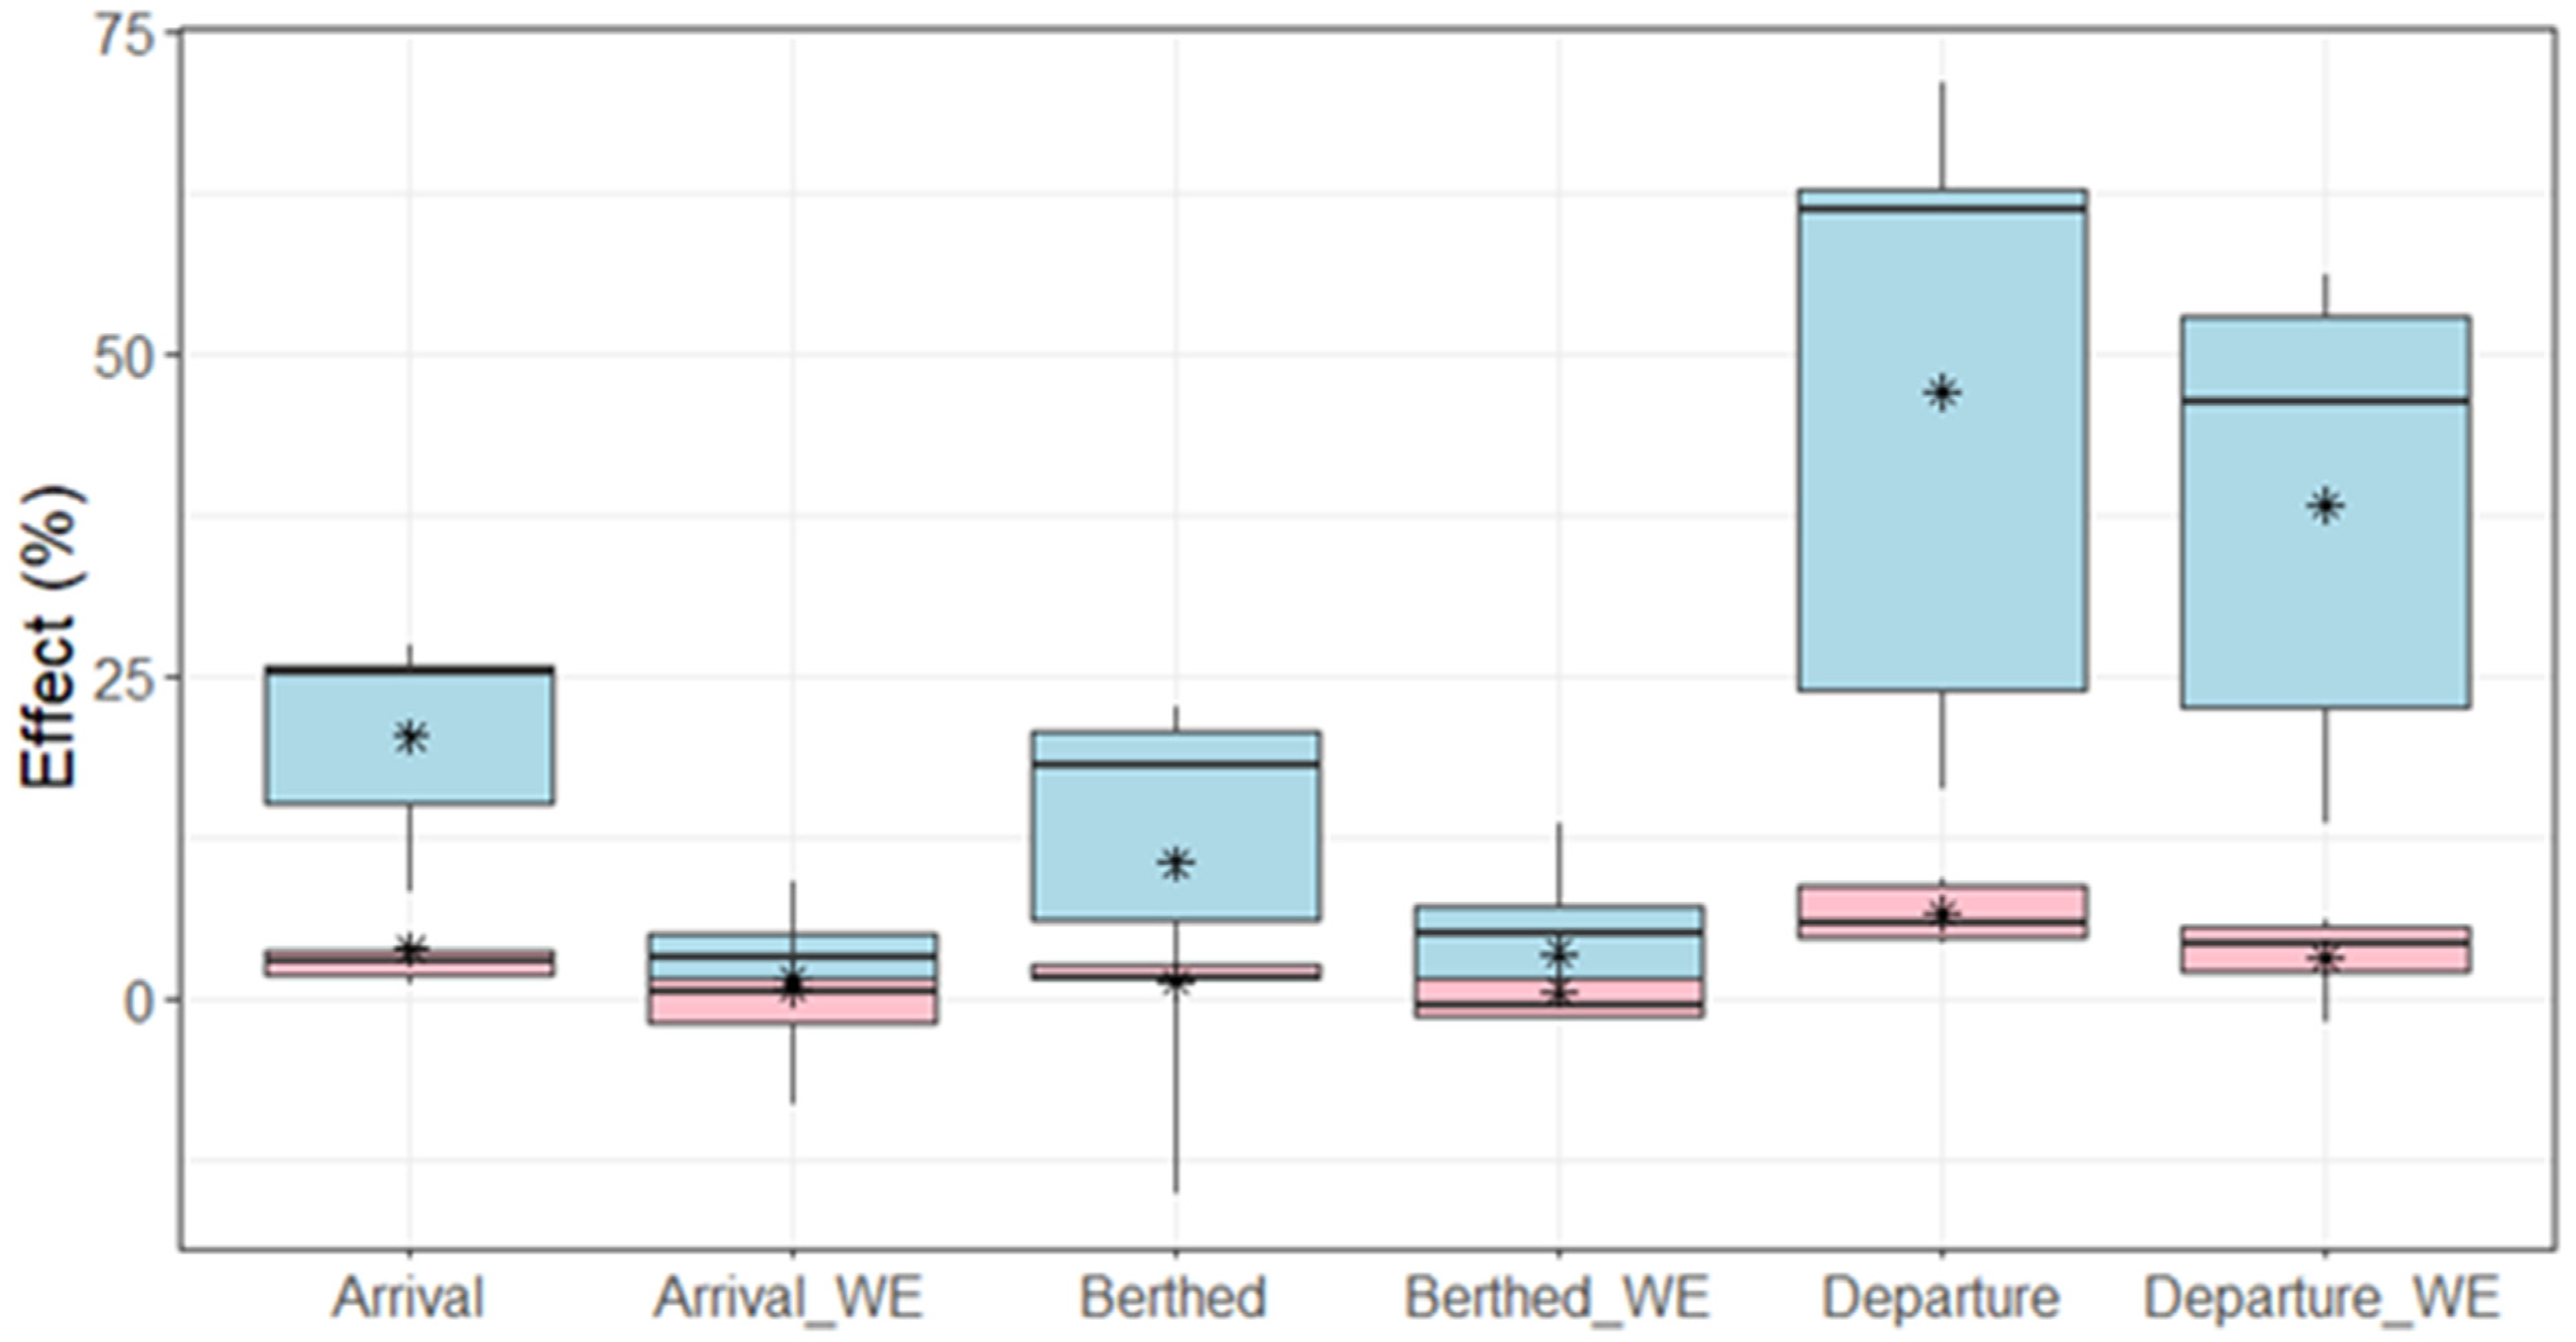
Consistent results using a multivariable linear regression analysis from four different port terminals and five different years indicate that vessel departures significantly increase the hourly mean NO2 concentrations, and the effect of arrivals is less significant or does not exist (Figure 16). The mean effect to the hourly mean NO2 concentrations of departures for all vessels was 47.0% (95% confidence interval 41.6–53.3%) for the whole year and 38.2% (95% confidence interval 28.9–48.1%) for the weekends. These results do not directly identify if the source of the NO2 were the ships themselves or the cargo loaded on them, but the variability between arrivals and departures suggest that emissions caused by the departures are higher than for the arrivals. A plausible explanation is the visually identifiable emission plume caused by starting the vessel’s main engine prior to the departure. In general, departures consume more energy than arrivals, when vessel inertia can be utilised. Nitrogen oxide emissions have been shown to increase by 1.5 times during the cold start of a marine engine [31].
The results from South Harbour in 2018, West Harbour in 2019 and South Harbour in 2021 show that the different types of ships docking at different parts of the harbour basin have a different effect size to the hourly mean NO2 concentrations. There are multiple possible explanations for this. It seems that the closest vessel to the sampling point causes the largest effect, but the results from West Harbour in 2019 for the whole year also indicate that vessels further away but with larger engines (cruise ships compared to passenger ferry vessels) might affect the NO2 concentrations more. In addition, combustion-based nitrogen oxide emissions are not all nitrogen dioxide, but also nitrogen monoxide, of which some will transform into NO2. Therefore, it is likely that a close sampling point does not identify all NO2 caused by the source.
The vessel departure effect is detectable also on hourly mean PM2.5 concentrations but the overall effect is much smaller indicating that sources other than port activity might be more influential.
Connecting container and passenger vessels to shore power, as required by future EU regulation, would reduce most of the emissions that all the vessels that visit Helsinki produce with the auxiliary engines while alongside. As shown in this study, this might not have a significant effect on NO2 or PM2.5 concentrations as the main engines seem to have a larger effect. Hybrid electric powered ships that could manoeuvre out of the port without starting their combustion engines would probably be a better option to reduce air pollution in urban areas.
4. Discussions
This study aimed to calculate the effect of connecting container and passenger vessels to shore power while alongside in port for >2 h at the port of Helsinki as required by the upcoming EU regulation. The effect, 75–80%, is surprisingly large when considering that most of the ship visits are shorter than 2 h. Shore power, or cold-ironing as it is often called, is a large modification to existing infrastructure of both the ports and visiting vessels with specific challenges related to retrofitting old vessels [32,33]. To overcome this task in the most efficient way, the feasibility of both the shore power connection and energy storage on board should be considered carefully. Modelling different options with an appropriate cost–benefit analysis could help in finding the optimum solution [34,35].
While a ship is lying at berth, the vessel’s own combustion-based air emissions are caused purely by the auxiliary engines, and during the arrivals and departures they are caused by the combination of both the main engines and the auxiliaries. On the other hand, during the port stay, additional air emissions are caused by the loading and discharging activities especially in Helsinki having a large share of roll-on/roll-off type of cargo. Based on the results, this study identified that departures seem to have the largest effect on the measured concentrations of air pollutants. The multivariable linear regression analysis shows that starting the cold main engines has a significant short-term effect on NO2 concentration, but not on PM2.5. This will probably not change by connecting the vessels to shore power, but an energy storage on board would, assuming that it has enough capacity to allow the vessel to manoeuvre besides providing the power that the auxiliary engines would for the time in port. The benefit of a hybrid system to mitigate the air pollution from ships is not limited to fuel oil powered ships, as LNG-powered vessels have been found to emit larger amounts of carbon monoxide and formaldehyde [36]. An energy storage unit on board does not mean that shore power becomes obsolete, as it can be used to charge the storage unit while the ship is alongside [37].
The limitation of the findings is that the linear regression models could only explain 20–30% of the NO2 variation. This can be caused by multiple factors: first, as the measuring unit was placed close to the emission source, some of the NOx emitted by the vessel could be in the form of nitrogen monoxide (NO) and therefore not detected in the NO2 measurements. Second, as the ship’s exhaust funnels and plume buoyancy may raise the plume much higher than the measuring point, most of the impact may not be visible in these measurements. To have a better understanding of this, the location of the measurement site should be considered carefully if ship plumes were to be studied specifically. Third, some sources of emissions or confounding factors were possibly not identified, and the hour of day was used as a proxy to model the effect of road traffic and other urban emission sources. This is not surprising as the sampling locations were in an area that is subjected to multiple emission sources such as powerplants using coal, natural gas and fuel oil as presented in Section 2. Lastly, hourly mean values were chosen to be used in the analyses, knowing that stronger associations and effects would have probably been observed with a shorter time resolution and including both NO and NO2 concentrations. The scope of the study was to find whether vessel movement causes significant increases in the measured air pollution values that are subject to regulation, specifically to NO2 and PM2.5 as their recommended limit values were recently lowered by the WHO.
Supplementary Materials
The following supporting information can be downloaded at: https://www.mdpi.com/article/10.3390/atmos14040757/s1, Figure S1: Diagnostic plots of the residuals and fitted values of the multivariable linear regression for log NO2 and vessel departures at Vuosaari weekends in 2016; Figure S2: Autocorrelation function of the multivariable linear regression for log NO2 and vessel departures at Vuosaari weekends in 2016; Figure S3: Diagnostic plots of the residuals and fitted values of the multivariable linear regression for log PM2.5 and vessels at berth; Figure S4: Autocorrelation function plot of the model collinearity of the multivariable linear regression for log PM2.5 and vessels at berth; Figure S5: Time series plot of daily mean concentration of NO2 in Vuosaari in 2016. Red dashed line is the WHO 2021 guideline value (25 µg/m3) and the orange line the EU Commission proposal (50 µg/m3); Figure S6: Polarplot of NO2 hourly mean concentration by wind speed and direction at the Vuosaari port terminal in 2016; Figure S7: Time series plot of daily mean concentration of PM2.5 in Vuosaari in 2016. Red dashed line is the WHO 2021 guideline value (15 µg/m3).; Figure S8: Polarplot of PM2.5 concentration by wind speed and direction at Vuosaari in 2016; Figure S9: Time series plot of daily mean NO2 at South Harbour in 2018. Red dashed line is the WHO 2021 guideline value (25 µg/m3) and the orange dashed line the EU Commission proposal (50 µg/m3); Figure S10: Polarplot of NO2 concentration by wind speed and direction at South Harbour in 2018; Figure S11: Time series of daily mean PM2.5 at South Harbour in 2018. Red dashed line is the WHO 2021 guideline value (15 µg/m3) and the orange dashed line the European Commission proposal (25 µg/m3); Figure S12: Polarplot of PM2.5 concentration by wind speed and direction at South Harbour in 2018; Figure S13: Diagnostic plots of the model residuals for departures and log NO2 at South Harbour in 2018; Figure S14: Autocorrelation function plot of the model residuals for departures and log NO2 at South Harbour in 2018; Figure S15: Diagnostic plots of the model residuals for arrivals to the Olympia quay at South Harbour in 2018 and log PM2.5; Figure S16: Autocorrelation function plot of the model residuals for arrivals to the Olympia quay at South Harbour in 2018 and log PM2.5; Figure S17: Time series of daily mean NO2 concentration at West Harbour in 2019. Red dashed line is the WHO 2021 guideline value (25 µg/m3) and the orange line the European Commission proposal (50 µg/m3); Figure S18: Polarplot of NO2 concentration by wind speed and direction at West Harbour in 2019; Figure S19: Diagnostic plots of the model residuals for departures and log NO2 at West Harbour in 2019; Figure S20: Autocorrelation function plot of the model residuals for departures and log NO2 at West Harbour in 2019; Figure S21: Time series plot of daily mean PM2.5 concentration at West Harbour in 2019. Red dashed line is the WHO 2021 guideline value (15 µg/m3); Figure S22: Polarplot of PM2.5 concentration by wind speed and direction at West Harbour in 2019; Figure S23: Time series plot of daily mean NO2 at West Harbour in 2020. Red dashed line is the WHO 2021 guideline value (25 µg/m3) and the orange dashed line the European Commission proposal (50 µg/m3); Figure S24: Polarplot of NO2 concentration by wind speed and direction at West Harbour in 2020; Figure S25: Diagnostic plots of the model residuals for departures and log NO2 at West Harbour in 2020; Figure S26: Autocorrelation function plot of the model residuals for departures and log NO2 at West Harbour in 2020; Figure S27: Time series plot of daily mean PM2.5 at West Harbour in 2020. Red dashed line is the WHO 2021 guideline value (15 µg/m3); Figure S28: Polarplot of PM2.5 concentration by wind direction and speed at West Harbour in 2020; Figure S29: Time series plot of daily mean NO2 at Katajanokka in 2021. Red dashed line is the WHO 2021 guideline value (25 µg/m3) and the orange dashed line the European Commission proposal (50 µg/m3); Figure S30: Polarplot of NO2 concentration by wind speed and direction at Katajanokka in 2021; Figure S31: Diagnostic plots of the model residuals for closest ferry departures and log NO2 at Katajanokka in 2021; Figure S32: Autocorrelation function plot of the model residuals for closest ferry departures and log NO2 at Katajanokka in 2021; Figure S33: Time series plot of daily mean PM2.5 at Katajanokka in 2021. Red dashed line is the WHO 2021 guideline value (15 µg/m3) and the orange dashed line the European Commission proposal (25 µg/m3); Figure S34: Polarplot of PM2.5 concentration by wind direction and speed at Katajanokka in 2021.
Author Contributions
Conceptualization, M.H.; methodology, M.H.; software, M.H.; validation, M.H. and J.-P.J.; formal analysis, M.H.; investigation, M.H.; resources, J.-P.J.; data curation, M.H.; writing—original draft preparation, M.H.; writing—review and editing, M.H. and J.-P.J.; visualisation, M.H.; supervision, J.-P.J.; project administration, J.-P.J.; funding acquisition, J.-P.J. All authors have read and agreed to the published version of the manuscript.
Funding
This paper has been produced as part of the European Union project “EMERGE: Evaluation, control, and mitigation of the environmental impacts of shipping emissions”. The EMERGE project has received funding from the European Union’s Horizon 2020—Research and Innovation Framework Programme action under grant agreement No 874990.
Institutional Review Board Statement
Not applicable.
Informed Consent Statement
Not applicable.
Data Availability Statement
Meteorological, vessel fuel consumption and movement data are publicly available as described in Section 2. The authors do not have permission to release the air quality measurement data, which can be obtained upon request from the Helsinki Region Environmental Services.
Acknowledgments
The authors thank Anu Kousa from the Helsinki Region Environmental Services and Antti Arkima from the Finnish Transport and Communications Agency for compiling the data used in this research.
Conflicts of Interest
The authors declare not having known competing financial interests or personal relationships that could have appeared to influence the work reported in this paper.
References
- Faber, J.; Hanayama, S.; Zhang, S.; Pereda, P.; Comer, B.; Hauerhof, E.; van der Loeff, W.S.; Smith, T.; Zhang, Y.; Kosaka, H.; et al. Fourth IMO GHG Study 2020. International Maritime Organization. 2021. Available online: https://www.imo.org/en/OurWork/Environment/Pages/Fourth-IMO-Greenhouse-Gas-Study-2020.aspx (accessed on 1 April 2022).
- World Health Organization. WHO Global Air Quality Guidelines: Particulate Matter (PM2.5 and PM10), Ozone, Nitrogen Dioxide, Sulfur Dioxide and Carbon Monoxide; World Health Organization: Geneva, Switzerland, 2021. [Google Scholar]
- Chen, J.; Hoek, G. Long-term exposure to PM and all-cause and cause-specific mortality: A systematic review and meta-analysis. Environ. Int. 2020, 143, 105974. [Google Scholar] [CrossRef]
- Orellano, P.; Reynoso, J.; Quaranta, N.; Bardach, A.; Ciapponi, A. Short-term exposure to particulate matter (PM10 and PM2.5), nitrogen dioxide (NO2), and ozone (O3) and all-cause and cause-specific mortality: Systematic review and meta-analysis. Environ. Int. 2020, 142, 105876. [Google Scholar] [CrossRef] [PubMed]
- Siddika, N.; Rantala, A.K.; Antikainen, H.; Balogun, H.; Amegah, A.K.; Ryti, N.R.I.; Kukkonen, J.; Sofiev, M.; Jaakkola, M.S.; Jaakkola, J.J.K. Short-term prenatal exposure to ambient air pollution and risk of preterm birth—A population-based cohort study in Finland. Environ. Res. 2020, 184, 109290. [Google Scholar] [CrossRef] [PubMed]
- European Commission. Proposal for a Revision of the Ambient Air Quality Directives; European Commission: Brussel, Belgium, 2022.
- Englert, D.; Losos, A. Charting a Course for Decarbonizing Maritime Transport: Summary for Policymakers and Industry; World Bank: Washington, DC, USA, 2021. [Google Scholar]
- Toscano, D.; Murena, F. Atmospheric ship emissions in ports: A review. Correlation with data of ship traffic. Atmos. Environ. X 2019, 4, 100050. [Google Scholar] [CrossRef]
- Viana, M.; Rizza, V.; Tobías, A.; Carr, E.; Corbett, J.; Sofiev, M.; Karanasiou, A.; Buonanno, G.; Fann, N. Estimated health impacts from maritime transport in the Mediterranean region and benefits from the use of cleaner fuels. Environ. Int. 2020, 138, 105670. [Google Scholar] [CrossRef] [PubMed]
- Huang, H.; Zhou, C.; Huang, L.; Xiao, C.; Wen, Y.; Li, J.; Lu, Z. Inland ship emission inventory and its impact on air quality over the middle Yangtze River, China. Sci. Total. Environ. 2022, 843, 156770. [Google Scholar] [CrossRef] [PubMed]
- Sofiev, M.; Winebrake, J.J.; Johansson, L.; Carr, E.W.; Prank, M.; Soares, J.; Vira, J.; Kouznetsov, R.; Jalkanen, J.-P.; Corbett, J.J. Cleaner fuels for ships provide public health benefits with climate tradeoffs. Nat. Commun. 2018, 9, 406. [Google Scholar] [CrossRef]
- Balkanski, Y.; Myhre, G.; Gauss, M.; Rädel, G.; Highwood, E.J.; Shine, K.P. Direct radiative effect of aerosols emitted by transport: From road, shipping and aviation. Atmos. Chem. Phys. 2010, 10, 4477–4489. [Google Scholar] [CrossRef]
- Lund, M.T.; Eyring, V.; Fuglestvedt, J.; Hendricks, J.; Lauer, A.; Lee, D.; Righi, M. Global-Mean Temperature Change from Shipping toward 2050: Improved Representation of the Indirect Aerosol Effect in Simple Climate Models. Environ. Sci. Technol. 2012, 46, 8868–8877. [Google Scholar] [CrossRef]
- Fuglestvedt, J.; Berntsen, T.; Eyring, V.; Isaksen, I.; Lee, D.S.; Sausen, R. Shipping Emissions: From Cooling to Warming of Climate—And Reducing Impacts on Health. Environ. Sci. Technol. 2009, 43, 9057–9062. [Google Scholar] [CrossRef]
- Capaldo, K.; Corbett, J.J.; Kasibhatla, P.; Fischbeck, P.; Pandis, S.N. Effects of ship emissions on sulphur cycling and radiative climate forcing over the ocean. Nature 1999, 400, 743–746. [Google Scholar] [CrossRef]
- Antturi, J.; Hänninen, O.; Jalkanen, J.-P.; Johansson, L.; Prank, M.; Sofiev, M.; Ollikainen, M. Costs and benefits of low-sulphur fuel standard for Baltic Sea shipping. J. Environ. Manag. 2016, 184, 431–440. [Google Scholar] [CrossRef]
- Gren, I.-M.; Brutemark, A.; Jägerbrand, A. Air pollutants from shipping: Costs of NOx emissions to the Baltic Sea. J. Environ. Manag. 2021, 300, 113824. [Google Scholar] [CrossRef] [PubMed]
- Gobbi, G.P.; Di Liberto, L.; Barnaba, F. Impact of port emissions on EU-regulated and non-regulated air quality indicators: The case of Civitavecchia (Italy). Sci. Total. Environ. 2019, 719, 134984. [Google Scholar] [CrossRef] [PubMed]
- Anastasopolos, A.T.; Sofowote, U.M.; Hopke, P.K.; Rouleau, M.; Shin, T.; Dheri, A.; Peng, H.; Kulka, R.; Gibson, M.D.; Farah, P.-M.; et al. Air quality in Canadian port cities after regulation of low-sulphur marine fuel in the North American Emissions Control Area. Sci. Total. Environ. 2021, 791, 147949. [Google Scholar] [CrossRef]
- Mousavi, A.; Sowlat, M.H.; Hasheminassab, S.; Pikelnaya, O.; Polidori, A.; Ban-Weiss, G.; Sioutas, C. Impact of particulate matter (PM) emissions from ships, locomotives, and freeways in the communities near the ports of Los Angeles (POLA) and Long Beach (POLB) on the air quality in the Los Angeles county. Atmos. Environ. 2018, 195, 159–169. [Google Scholar] [CrossRef]
- Daniel, H.; Trovão, J.P.F.; Williams, D. Shore power as a first step toward shipping decarbonization and related policy impact on a dry bulk cargo carrier. Etransportation 2021, 11, 100150. [Google Scholar] [CrossRef]
- Spengler, T.; Tovar, B. Potential of cold-ironing for the reduction of externalities from in-port shipping emissions: The state-owned Spanish port system case. J. Environ. Manag. 2020, 279, 111807. [Google Scholar] [CrossRef]
- European Comission. Proposal for Vew EU Regulation to Replace Directive 2014/94/EU; European Commission: Brussel, Belgium, 2021.
- Helsinki Region Environmental Services Authority. Air Quality in Helsinki Regional Area Supplementary Material. 2022. Available online: https://julkaisu.hsy.fi/material/attachments/jqzvxurqu/ilmanlaatu_paakaupunkiseudulla_2021_liiteosio.pdf (accessed on 1 April 2022).
- Broadhurst, D.; Goodcare, R.; Jones, A.; Rowland, J.; Kell, D. Genetic algorithms as a method for variable selection in multiple linear regression and partial least squares regression, with applications to pyrolysis mass. Anal. Chim. Acta 1997, 348, 71–86. [Google Scholar] [CrossRef]
- Suarez, E.; Perez, C.; Rivera, R.; Martinez, M. Selection of Variables in a Multiple Linear Regression Model. Appl. Regres. Model. Epidemiol. 2017, 77–86. [Google Scholar] [CrossRef]
- Carslaw, D.C.; Ropkins, K. Openair—An R package for air quality data analysis. Environ. Model. Softw. 2012, 27–28, 52–61. [Google Scholar] [CrossRef]
- Pirjola, L.; Pajunoja, A.; Walden, J.; Jalkanen, J.-P.; Rönkkö, T.; Kousa, A.; Koskentalo, T. Mobile measurements of ship emissions in two harbour areas in Finland. Atmos. Meas. Tech. 2014, 7, 149–161. [Google Scholar] [CrossRef]
- Walden, J.; Pirjola, L.; Laurila, T.; Hatakka, J.; Pettersson, H.; Walden, T.; Jalkanen, J.-P.; Nordlund, H.; Truuts, T.; Meretoja, M.; et al. Measurement report: Characterization of uncertainties in fluxes and fuel sulfur content from ship emissions in the Baltic Sea. Atmos. Meas. Tech. 2021, 21, 18175–18194. [Google Scholar] [CrossRef]
- Atkinson, R. Atmospheric chemistry of VOCs and NOx. Atmos. Environ. 2000, 34, 2063–2101. [Google Scholar] [CrossRef]
- Van, T.C.; Zare, A.; Jafari, M.; Bodisco, T.A.; Surawski, N.; Verma, P.; Suara, K.; Ristovski, Z.; Rainey, T.; Stevanovic, S.; et al. Effect of cold start on engine performance and emissions from diesel engines using IMO-Compliant distillate fuels. Environ. Pollut. 2019, 255, 113260. [Google Scholar] [CrossRef]
- Khersonsky, Y.; Islam, M.; Peterson, K. Challenges of Connecting Shipboard Marine Systems to Medium Voltage Shoreside Electrical Power. IEEE Trans. Ind. Appl. 2007, 43, 838–844. [Google Scholar] [CrossRef]
- Zis, T.P. Prospects of cold ironing as an emissions reduction option. Transp. Res. Part A Policy Pr. 2018, 119, 82–95. [Google Scholar] [CrossRef]
- Marinello, S.; Balugani, E.; Rimini, B. Sustainability of Logistics Infrastructures: Operational and Technological Alternatives to Reduce the Impact on Air Quality. 26th Summer School Francesco Turco. Conference Proceedings. 2021. Available online: http://hdl.handle.net/11380/1282140 (accessed on 25 March 2023).
- Campisi, T.; Marinello, S.; Costantini, G.; Laghi, L.; Mascia, S.; Matteucci, F.; Serrau, D. Locally integrated partnership as a tool to implement a Smart Port Management Strategy: The case of the port of Ravenna (Italy). Ocean Coast. Manag. 2022, 224, 106179. [Google Scholar] [CrossRef]
- Peng, W.; Yang, J.; Corbin, J.; Trivanovic, U.; Lobo, P.; Kirchen, P.; Rogak, S.; Gagné, S.; Miller, J.W.; Cocker, D. Comprehensive analysis of the air quality impacts of switching a marine vessel from diesel fuel to natural gas. Environ. Pollut. 2020, 266, 115404. [Google Scholar] [CrossRef]
- Kalikatzarakis, M.; Geertsma, R.D.; Boonen, E.; Visser, K.; Negenborn, R.R. Ship energy management for hybrid propulsion and power supply with shore charging. Control. Eng. Pr. 2018, 76, 133–154. [Google Scholar] [CrossRef]
Figure 1.
Map of city of Helsinki with the weather and port terminal air quality sampling locations (1: Harmaja lighthouse, 2: Vuosaari port terminal, 3: South harbour, 4: West harbour, 5: Katajanokka terminal) and electricity and district heating power plant locations, 6: Vuosaari natural gas plant, 7: Hanasaari coal power plant, 8: Kellosaari fuel oil backup plant, 9: Salmisaari coal power plant, 10: Munkkisaari fuel oil backup plant). Map data ©2023 Google.

Figure 2.
Mean ship visit shares by vessel type to port of Helsinki 2018–2021.

Figure 3.
Windroses from Harmaja Lighthouse 2016, 2018–2021.


Figure 4.
Boxplot of the measured annual median (black line), interquartile ranges and mean (stars) concentration of NO2 2016, 2018–2021 at various ports of Helsinki. The blue line is the Finnish/EU limit of 40 μg/m3, which was in force during the studied years. The red line is the WHO 2021 recommended limit of 10 μg/m3 and the orange line the EU proposal of 20 μg/m3.

Figure 5.
Boxplot of the measured annual median (black line), interquartile ranges and mean (stars) concentration of PM2.5 2016, 2018–2021 at various ports of Helsinki. The blue line is the Finnish/EU limit of 25 μg/m3, which was in force during the studied years. The red line is the WHO 2021 recommended limit of 5 μg/m3 and the orange line the EU proposal of 10 μg/m3.

Figure 6.
Time variation plot of NO2 concentration at Vuosaari port terminal of Helsinki in 2016.

Figure 7.
Time variation plot of PM2.5 concentration at Vuosaari port terminal of Helsinki.

Figure 8.
Time variation plot of NO2 concentration at Helsinki South Harbour in 2018.

Figure 9.
Time variation plot of PM2.5 concentration at Helsinki South Harbour in 2018.

Figure 10.
Time variation plot of NO2 concentration at Helsinki West Harbour in 2019.

Figure 11.
Time variation plot of PM2.5 concentration at Helsinki West Harbour in 2019.

Figure 12.
Time variation plot of NO2 concentration in West Harbour in 2020.

Figure 13.
Time variation plot of PM2.5 concentration in West Harbour in 2020.

Figure 14.
Time variation plot of hourly mean NO2 concentrations at the Katajanokka terminal in 2021.
Figure 14.
Time variation plot of hourly mean NO2 concentrations at the Katajanokka terminal in 2021.

Figure 15.
Time variation plot of hourly mean PM2.5 concentrations at the Katajanokka terminal in 2021.
Figure 15.
Time variation plot of hourly mean PM2.5 concentrations at the Katajanokka terminal in 2021.

Figure 16.
Boxplot of vessel movement effect in % on the hourly mean concentration of NO2 (blue) and PM2.5 (pink) using the whole year data and weekends only (_WE). Boxplot showing median effect as a black line with interquartile range and mean with star (*).
Figure 16.
Boxplot of vessel movement effect in % on the hourly mean concentration of NO2 (blue) and PM2.5 (pink) using the whole year data and weekends only (_WE). Boxplot showing median effect as a black line with interquartile range and mean with star (*).


Table 1.
WHO 2021 revised guideline levels (AQC 2021), previous guideline levels (AQC 2005) and the Finnish threshold values for air pollutant concentrations in µg/m3. Number of allowed exceedances per year in parenthesis. * Guidance level, one exceedance permitted, ** not to be exceeded more than 18 times per year and *** not to be exceeded more than once per year.
| Pollutant | Averaging Time | AQG 2021 | AQG 2005 | Finland | EU Proposal |
|---|---|---|---|---|---|
| PM2.5 | Annual | 5 | 10 | 25 | 10 |
| 24-h | 15 (3–4) | 25 | - | 25 ** | |
| PM10 | Annual | 15 | 20 | 40 | 20 |
| 24-h | 45 (3–4) | 50 | 50 (35) | 45 ** | |
| NO2 | Annual | 10 | 40 | 40 | 20 |
| 24-h | 25 (3–4) | - | 70* (1) | 50 ** | |
| 1-h | - | - | 200 (18) | 200 *** | |
| SO2 | 24-h * | 40 | 20 | 125 (3) | 50 ** |
| 1-h | - | - | 350 (24) | 350 *** | |
| Annual | - | - | - | 20 | |
| CO | 24-h * | 4 | - | - |
Table 2.
Ship visits to the port of Helsinki 2018–2020 by vessel type. Pax ferry: vessel that carries both roll-on roll-off cargo and passengers with the largest parts of the ship dedicated for passengers, ropax: vessel that carries both roll-on roll-off cargo with the largest parts of the ship dedicated for cargo, container: container vessel, roro: cargo vessel carrying roll-on roll-off cargo, cruise: cruise ship, other: all other vessel types.
| 2018 | 2019 | 2020 | 2021 | |||||
|---|---|---|---|---|---|---|---|---|
| Type | Visits | % | Visits | % | Visits | % | Visits | % |
| Pax ferry | 5181 | 64.0 | 5141 | 62.1 | 4259 | 61.1 | 4709 | 64.8 |
| Ropax | 892 | 11.0 | 1181 | 14.3 | 1340 | 19.2 | 1460 | 14.7 |
| Container | 766 | 9.5 | 708 | 8.6 | 660 | 9.5 | 611 | 8.7 |
| Bulk | 367 | 4.5 | 292 | 3.5 | 266 | 3.8 | 272 | 3.9 |
| Roro | 357 | 4.4 | 330 | 4.0 | 297 | 4.3 | 359 | 4.4 |
| Cruise | 283 | 3.5 | 300 | 3.6 | 0 | 0.0 | 15 | 2.5 |
| Other | 251 | 3.1 | 320 | 3.9 | 146 | 2.1 | 200 | 3.2 |
| All | 8097 | 100.0 | 8272 | 100.0 | 6968 | 100.0 | 7271 | 100.0 |
Table 3.
Mean time in port in hours (TP), mean fuel consumption in port in metric tons per hour (FP) by vessel type at port of Helsinki 2018–2020. Time in port by vessel type was calculated from the port arrival and departure data and fuel consumption in port from the MRV data.
Table 3.
Mean time in port in hours (TP), mean fuel consumption in port in metric tons per hour (FP) by vessel type at port of Helsinki 2018–2020. Time in port by vessel type was calculated from the port arrival and departure data and fuel consumption in port from the MRV data.
| 2018 | 2019 | 2020 | ||||
|---|---|---|---|---|---|---|
| Vessel type | TP | FP | TP | FP | TP | FP |
| Pax ferry | 2.48 | 0.43 | 2.46 | 0.35 | 6.39 | 0.23 |
| Ropax | 4.94 | 0.19 | 4.72 | 0.23 | 3.98 | 0.18 |
| Container | 16.87 | 0.26 | 18.65 | 0.12 | 19.67 | 0.12 |
| Bulk | 49.00 | 0.03 | 51.08 | 0.04 | 104.58 | 0.03 |
| Roro | 18.55 | 0.16 | 17.58 | 0.17 | 21.39 | 0.17 |
| Cruise | 8.38 | 0.47 | 8.51 | 0.36 | 0.0 | 0.0 |
| All | 16.1 | 0.34 | 20.5 | 0.28 | 20.1 | 0.20 |
Table 4.
Multivariable linear regression analysis results for vessel arrivals, departures, movement and laying alongside to the logarithm of NO2 hourly mean concentrations controlled for wind direction, wind speed, relative humidity, air temperature and time of day at Vuosaari 2016. Coefficients calculated for observations for the whole year and for weekends only. p-values less than 0.05 are in bold.
| Coefficient | 95% Conf. Interval | SE | t-Value | p-Value | adj. r2 | ||
|---|---|---|---|---|---|---|---|
| Linear regression models for the whole year (8437 observations) | |||||||
| Arrival | 0.224 | 0.194 | 0.255 | 0.016 | 14.404 | <0.0001 | 0.251 |
| Departure | 0.151 | 0.118 | 0.185 | 0.017 | 8.853 | <0.0001 | 0.240 |
| Movement | 0.193 | 0.170 | 0.215 | 0.015 | 16.797 | <0.0001 | 0.258 |
| Berthed | 0.058 | 0.053 | 0.063 | 0.003 | 21.72 | <0.0001 | 0.273 |
| Linear regression models for the weekends (2446 observations) | |||||||
| Arrival | −0.006 | −0.083 | 0.071 | 0.039 | −0.152 | 0.8730 | 0.303 |
| Departure | 0.126 | 0.055 | 0.196 | 0.036 | 3.507 | 0.0005 | 0.307 |
| Movement | 0.062 | 0.011 | 0.112 | 0.026 | 2.407 | 0.0162 | 0.305 |
| Berthed | 0.015 | 0.005 | 0.026 | 0.005 | 2.786 | 0.0054 | 0.306 |
Table 5.
Multivariable linear regression analysis results for vessel arrivals, departures, movement and laying alongside to the logarithm of PM2.5 hourly mean concentrations controlled for wind direction, wind speed, relative humidity and time of day at Vuosaari 2016. p-values less than 0.05 in bold.
| Coefficient | 95% Conf. Interval | SE | t-Value | p-Value | adj. r2 | ||
|---|---|---|---|---|---|---|---|
| Linear regression models for the whole year (8179 observations) | |||||||
| Arrival | 0.028 | 0.003 | 0.054 | 0.013 | 2.152 | 0.0314 | 0.126 |
| Departure | 0.056 | −0.022 | 0.034 | 0.014 | 0.395 | 0.6930 | 0.126 |
| Movement | 0.018 | −0.001 | 0.037 | 0.010 | 1.862 | 0.0626 | 0.126 |
| Berthed | 0.016 | 0.011 | 0.020 | 0.002 | 6.892 | <0.0001 | 0.131 |
| Linear regression models for weekends (2406 observations) | |||||||
| Arrival | −0.020 | −0.090 | 0.049 | 0.036 | −0.574 | 0.5660 | 0.146 |
| Departure | −0.019 | −0.083 | 0.045 | 0.033 | −0.578 | 0.5632 | 0.146 |
| Movement | −0.018 | −0.064 | 0.027 | 0.023 | −0.788 | 0.4308 | 0.146 |
| Berthed | −0.005 | −0.011 | −0.000 | 0.003 | −2.010 | 0.0446 | 0.146 |
Table 6.
Multivariable linear regression analysis results for vessel arrivals, departures, movement and laying alongside to the logarithm of NO2 hourly mean concentrations controlled for wind direction, wind speed, air temperature (not in the weekend models) and time of day at the South Harbour 2018. p-values less than 0.05 in bold.
| Coefficient | 95% Conf. Interval | SE | t-Value | p-Value | adj. r2 | ||
|---|---|---|---|---|---|---|---|
| Linear regression models for the whole year (8174 observations) | |||||||
| Arrival | 0.241 | 0.209 | 0.273 | 0.016 | 14.818 | <0.0001 | 0.224 |
| Departure | 0.215 | 0.179 | 0.251 | 0.019 | 11.534 | <0.0001 | 0.216 |
| Movement | 0.199 | 0.177 | 0.221 | 0.011 | 17.568 | <0.0001 | 0.232 |
| Berthed | 0.203 | 0.187 | 9.219 | 0.008 | 24.576 | <0.0001 | 0.258 |
| Linear regression models for weekends (2333 observations) | |||||||
| Arrival | 0.086 | 0.030 | 0.141 | 0.028 | 3.037 | 0.0024 | 0.212 |
| Departure | 0.204 | 0.139 | 0.270 | 0.034 | 6.097 | <0.0001 | 0.221 |
| Movement | 0.113 | 0.074 | 0.151 | 0.020 | 5.721 | <0.0001 | 0.220 |
| Berthed | 0.127 | 0.098 | 0.156 | 0.015 | 8.643 | <0.0001 | 0.233 |
| Departures by different vessel types for the whole year | |||||||
| All vessels | 0.215 | 0.179 | 0.251 | 0.019 | 11.534 | <0.0001 | 0.216 |
| Ferry | 0.294 | 0.256 | 0.332 | 0.020 | 14.989 | <0.0001 | 0.178 |
| Cruise | 0.275 | 0.108 | 0.443 | 0.086 | 3.218 | 0.0013 | 0.156 |
| Olympia quay | 0.385 | 0.302 | 0.468 | 0.042 | 9.087 | <0.0001 | 0.164 |
Table 7.
Multivariable linear regression analysis results for vessel arrivals, departures, movement and laying alongside to the logarithm of PM2.5 hourly mean concentrations controlled for wind direction, wind speed, relative humidity and air temperature at the South Harbour in 2018. p-values less than 0.05 in bold.
| Coefficient | 95% Conf. Interval | SE | t-Value | p-Value | adj. r2 | ||
|---|---|---|---|---|---|---|---|
| Linear regression models for the whole year (8083 observations) | |||||||
| Arrival | 0.095 | 0.063 | 0.127 | 0.016 | 5.858 | <0.0001 | 0.141 |
| Departure | 0.047 | 0.011 | 0.084 | 0.019 | 2.534 | 0.0113 | 0.138 |
| Movement | 0.064 | 0.042 | 0.087 | 0.011 | 5.654 | <0.0001 | 0.141 |
| Berthed | 0.057 | 0.011 | 0.072 | 0.008 | 6.694 | <0.0001 | 0.142 |
| Linear regression models for weekends (2344 observations) | |||||||
| Arrival | 0.059 | 0.003 | 0.115 | 0.029 | 2.065 | 0.0391 | 0.247 |
| Departure | 0.059 | −0.009 | 0.126 | 0.034 | 1.711 | 0.0871 | 0.246 |
| Movement | 0.049 | 0.010 | 0.089 | 0.020 | 2.261 | 0.0139 | 0.247 |
| Berthed | 0.046 | 0.016 | 0.076 | 0.015 | 2.997 | 0.0028 | 0.248 |
| Arrivals by different vessel types for the whole year | |||||||
| All vessels | 0.095 | 0.063 | 0.127 | 0.016 | 5.858 | <0.0001 | 0.141 |
| Ferry | 0.094 | 0.061 | 0.127 | 0.017 | 5.540 | <0.0001 | 0.110 |
| Cruise | 0.053 | −0.016 | 0.212 | 0.081 | 0.655 | 0.5124 | 0.107 |
| Olympia quay | 0.201 | 0.120 | 0.283 | 0.042 | 4.857 | <0.0001 | 0.109 |
Table 8.
Multivariable linear regression analysis results for vessel arrivals, departures, movement and laying alongside to the logarithm of NO2 hourly mean concentrations controlled for wind direction, wind speed and time of day at West Harbour in 2019. p-values less than 0.05 in bold.
Table 8.
Multivariable linear regression analysis results for vessel arrivals, departures, movement and laying alongside to the logarithm of NO2 hourly mean concentrations controlled for wind direction, wind speed and time of day at West Harbour in 2019. p-values less than 0.05 in bold.
| Coefficient | 95% Conf. Interval | SE | t-Value | p-Value | adj. r2 | ||
|---|---|---|---|---|---|---|---|
| Linear regression models for the whole year, all vessels (8512 observations) | |||||||
| Arrival | 0.079 | 0.048 | 0.109 | 0.015 | 5.106 | <0.0001 | 0.166 |
| Departure | 0.486 | 0.454 | 0.518 | 0.016 | 29.905 | <0.0001 | 0.243 |
| Movement | 0.241 | 0.220 | 0.262 | 0.011 | 22.578 | <0.0001 | 0.211 |
| Berthed | 0.167 | 0.149 | 0.185 | 0.009 | 18.162 | <0.0001 | 0.195 |
| Linear regression models for weekends, all vessels (2436 observations) | |||||||
| Arrival | −0.087 | −0.140 | −0.033 | 0.027 | −3.171 | 0.0015 | 0.189 |
| Departure | 0.380 | 0.322 | 0.438 | 0.030 | 12.822 | <0.0001 | 0.237 |
| Movement | 0.116 | 0.077 | 0.155 | 0.020 | 5.837 | <0.0001 | 0.197 |
| Berthed | 0.069 | 0.037 | 0.101 | 0.017 | 4.178 | <0.0001 | 0.192 |
| Linear regression models for departures by vessel type | |||||||
| Ferry | 0.502 | 0.468 | 0.536 | 0.017 | 29.029 | <0.0001 | 0.239 |
| Cruise | 0.368 | 0.267 | 0.469 | 0.051 | 7.157 | <0.0001 | 0.168 |
| Linear regression models for departures by vessel type, weekends only | |||||||
| Ferry | 0.372 | 0.311 | 0.433 | 0.031 | 11.993 | <0.0001 | 0.231 |
| Cruise | 0.553 | 0.325 | 0.780 | 0.116 | 4.761 | <0.0001 | 0.193 |
Table 9.
Multivariable linear regression analysis results for vessel arrivals, departures, movement and laying alongside to the logarithm of PM2.5 hourly mean concentrations controlled for wind direction, wind speed and time of day at the West Harbour in 2019. p-values less than 0.05 in bold.
Table 9.
Multivariable linear regression analysis results for vessel arrivals, departures, movement and laying alongside to the logarithm of PM2.5 hourly mean concentrations controlled for wind direction, wind speed and time of day at the West Harbour in 2019. p-values less than 0.05 in bold.
| Coefficient | 95% Conf. Interval | SE | t-Value | p-Value | adj. r2 | ||
|---|---|---|---|---|---|---|---|
| Linear regression models for the whole year, all vessels (8055 observations) | |||||||
| Arrival | 0.036 | 0.006 | 0.065 | 0.015 | 2.384 | 0.0171 | 0.065 |
| Departure | 0.085 | 0.053 | 0.118 | 0.017 | 5.126 | <0.0001 | 0.068 |
| Movement | 0.053 | 0.032 | 0.074 | 0.011 | 4.983 | <0.0001 | 0.067 |
| Berthed | 0.026 | 0.009 | 0.043 | 0.009 | 3.049 | 0.0023 | 0.066 |
| Linear regression models for weekends, all vessels (2294 observations) | |||||||
| Arrival | 0.004 | −0.052 | 0.060 | 0.028 | 0.129 | 0.8970 | 0.100 |
| Departure | 0.053 | −0.010 | 0.115 | 0.032 | 1.661 | 0.0969 | 0.101 |
| Movement | 0.024 | −0.016 | 0.065 | 0.021 | 1.176 | 0.2400 | 0.100 |
| Berthed | 0.016 | −0.018 | 0.050 | 0.017 | 0.946 | 0.3440 | 0.100 |
Table 10.
Multivariable linear regression analysis results for vessel arrivals, departures, movement and laying alongside to the logarithm of NO2 hourly mean concentrations controlled for wind direction, wind speed, relative humidity, air temperature and time of day at West Harbour in 2020. p-values less than 0.05 in bold.
| Coefficient | 95% Conf. Interval | SE | t-Value | p-Value | adj. r2 | ||
|---|---|---|---|---|---|---|---|
| Linear regression models for the whole year (7811 observations) | |||||||
| Arrival | 0.141 | 0.107 | 0.176 | 0.017 | 8.099 | <0.0001 | 0.147 |
| Departure | 0.536 | 0.500 | 0.572 | 0.018 | 29.417 | <0.0001 | 0.225 |
| Movement | 0.293 | 0.270 | 0.317 | 0.012 | 24.586 | <0.0001 | 0.201 |
| Berthed | −0.163 | −0.189 | −0.138 | 0.013 | −12.673 | <0.0001 | 0.157 |
| Linear regression models for weekends (2254 observations) | |||||||
| Arrival | 0.031 | −0.030 | 0.092 | 0.031 | 0.990 | 0.3223 | 0.095 |
| Departure | 0.424 | 0.358 | 0.490 | 0.034 | 12.532 | <0.0001 | 0.153 |
| Movement | 0.189 | 0.146 | 0.232 | 0.022 | 8.584 | <0.0001 | 0.123 |
| Berthed | −0.102 | −0.143 | −0.061 | 0.021 | −4.908 | <0.0001 | 0.104 |
Table 11.
Multivariable linear regression analysis results for vessel arrivals, departures, movement and laying alongside to the logarithm of PM2.5 hourly mean concentrations controlled for wind direction, relative humidity and air temperature at West Harbour in 2020. p-values less than 0.05 in bold.
| Coefficient | 95% Conf. Interval | SE | t-Value | p-Value | adj. r2 | ||
|---|---|---|---|---|---|---|---|
| Linear regression models for the whole year (7539 observations) | |||||||
| Arrival | 0.019 | −0.013 | 0.052 | 0.016 | 1.177 | 0.2394 | 0.069 |
| Departure | 0.089 | 0.054 | 0.125 | 0.018 | 4.951 | <0.0001 | 0.072 |
| Movement | 0.047 | 0.024 | 0.070 | 0.012 | 4.022 | <0.0001 | 0.071 |
| Berthed | −0.053 | −0.077 | −0.029 | 0.012 | −4.339 | <0.0001 | 0.071 |
| Linear regression models for weekends (2141 observations) | |||||||
| Arrival | 0.016 | −0.046 | 0.078 | 0.032 | 0.513 | 0.6082 | 0.074 |
| Departure | 0.041 | −0.028 | 0.111 | 0.035 | 1.167 | 0.2434 | 0.074 |
| Movement | 0.025 | −0.019 | 0.070 | 0.023 | 1.111 | 0.2666 | 0.074 |
| Berthed | −0.016 | −0.058 | 0.025 | 0.021 | −0.771 | 0.4408 | 0.074 |
Table 12.
Multivariable linear regression analysis results for vessel arrivals, departures, movement and laying alongside to the logarithm of NO2 hourly mean concentrations controlled for wind direction, wind speed, relative humidity, air temperature and time of day at the Katajanokka terminal 2021. p-values less than 0.05 in bold.
| Coefficient | 95% Conf. Interval | SE | t-Value | p-Value | adj. r2 | ||
|---|---|---|---|---|---|---|---|
| Linear regression models for the whole year, all vessels (8604 observations) | |||||||
| Arrival | 0.230 | 0.185 | 0.276 | 0.023 | 9.913 | <0.0001 | 0.244 |
| Departure | 0.477 | 0.430 | 0.524 | 0.024 | 20.025 | <0.0001 | 0.270 |
| Movement | 0.326 | 0.295 | 0.367 | 0.016 | 20.456 | <0.0001 | 0.271 |
| Berthed | 0.189 | 0.164 | 0.213 | 0.013 | 14.973 | <0.0001 | 0.255 |
| Linear regression models for weekends, all vessels (2495 observations) | |||||||
| Arrival | 0.048 | −0.033 | 0.129 | 0.041 | 1.161 | 0.2453 | 0.205 |
| Departure | 0.445 | 0.359 | 0.530 | 0.044 | 10.178 | <0.0001 | 0.236 |
| Movement | 0.191 | 0.138 | 0.245 | 0.027 | 7.004 | <0.0001 | 0.220 |
| Berthed | 0.050 | 0.001 | 0.099 | 0.025 | 1.987 | 0.0470 | 0.205 |
| Linear regression models for departures of various vessels | |||||||
| All vessels | 0.477 | 0.430 | 0.524 | 0.024 | 20.025 | <0.0001 | 0.270 |
| Ferry | 0.600 | 0.545 | 0.655 | 0.028 | 21.464 | <0.0001 | 0.274 |
Table 13.
Multivariable linear regression analysis results for vessel arrivals, departures, movement and laying alongside to the logarithm of PM2.5 hourly mean concentrations controlled for wind direction, wind speed, relative humidity, air temperature and time of day at Katajanokka in 2021.
Table 13.
Multivariable linear regression analysis results for vessel arrivals, departures, movement and laying alongside to the logarithm of PM2.5 hourly mean concentrations controlled for wind direction, wind speed, relative humidity, air temperature and time of day at Katajanokka in 2021.
| Coefficient | 95% Conf. Interval | SE | t-Value | p-Value | adj. r2 | ||
|---|---|---|---|---|---|---|---|
| Linear regression models for the whole year (8599 observations) | |||||||
| Arrival | 0.011 | −0.031 | 0.054 | 0.022 | 0.538 | 0.5900 | 0.173 |
| Departure | 0.042 | −0.002 | 0.086 | 0.023 | 1.853 | 0.0639 | 0.173 |
| Movement | 0.024 | −0.005 | 0.054 | 0.015 | 1.616 | 0.1060 | 0.173 |
| Berthed | 0.017 | −0.006 | 0.041 | 0.012 | 1.470 | 0.1420 | 0.173 |
| Linear regression models for weekend (2495 observations) | |||||||
| Arrival | −0.021 | −0.102 | 0.061 | 0.042 | −0.492 | 0.6225 | 0.241 |
| Departure | 0.020 | −0.068 | 0.108 | 0.045 | 0.441 | 0.6593 | 0.241 |
| Movement | −0.002 | −0.056 | 0.053 | 0.028 | −0.056 | 0.9555 | 0.241 |
| Berthed | −0.013 | −0.063 | 0.037 | 0.025 | −0.506 | 0.6131 | 0.241 |
Disclaimer/Publisher’s Note: The statements, opinions and data contained in all publications are solely those of the individual author(s) and contributor(s) and not of MDPI and/or the editor(s). MDPI and/or the editor(s) disclaim responsibility for any injury to people or property resulting from any ideas, methods, instructions or products referred to in the content. |
© 2023 by the authors. Licensee MDPI, Basel, Switzerland. This article is an open access article distributed under the terms and conditions of the Creative Commons Attribution (CC BY) license (https://creativecommons.org/licenses/by/4.0/).
Share and Cite
MDPI and ACS Style
Heikkilä, M.; Jalkanen, J.-P. The Association between Vessel Departures and Air Pollution in Helsinki Port Area 2016–2021. Atmosphere 2023, 14, 757. https://doi.org/10.3390/atmos14040757
AMA Style
Heikkilä M, Jalkanen J-P. The Association between Vessel Departures and Air Pollution in Helsinki Port Area 2016–2021. Atmosphere. 2023; 14(4):757. https://doi.org/10.3390/atmos14040757
Chicago/Turabian StyleHeikkilä, Mikko, and Jukka-Pekka Jalkanen. 2023. "The Association between Vessel Departures and Air Pollution in Helsinki Port Area 2016–2021" Atmosphere 14, no. 4: 757. https://doi.org/10.3390/atmos14040757
Note that from the first issue of 2016, this journal uses article numbers instead of page numbers. See further details here.