
Recent Urban Issues Related to Particulate Matter in Ploiesti City, Romania
by
 ,
,
Mia Sanda
1,
Daniel Dunea
2,* ,
,
Stefania Iordache
3,*,
Laurentiu Predescu
3,
Mirela Predescu
3,
Alin Pohoata
4 and
Ion Onutu
1 1
Faculty of Petroleum Processing and Petrochemistry, Petroleum-Gas University, Bulevardul București 39, 100680 Ploiesti, Romania
2
Department of Environmental Engineering, Faculty of Environmental Engineering and Food Science, Valahia University of Targoviste, Aleea Sinaia no.13, 130004 Targoviste, Romania
3
Department of Food Engineering, Faculty of Environmental Engineering and Food Science, Valahia University of Targoviste, Aleea Sinaia no.13, 130004 Targoviste, Romania
4
Faculty of Sciences and Arts, Valahia University of Targoviste, Aleea Sinaia no.13, 130004 Targoviste, Romania
*
Authors to whom correspondence should be addressed.
Atmosphere 2023, 14(4), 746; https://doi.org/10.3390/atmos14040746
Submission received: 15 March 2023
/
Revised: 14 April 2023
/
Accepted: 18 April 2023
/
Published: 20 April 2023
(This article belongs to the Special Issue Challenges in Modelling and Observing Urban Environments: Recent Trends, Current Progress and Future Directions)
Abstract
:The present work aimed to assess the ambient levels of air pollution with particulate matter for both mass concentrations and number of particles for various fractions in Ploiesti city during the lockdown period determined by the COVID-19 pandemic (March–June 2020). The PM10 continuously monitored data was retrieved from four air quality automatic stations that are connected to the Romanian National Network for Monitoring Air Quality and located in the city. Because no other information was available for other more dangerous fractions, we used monitoring campaigns employing the Lighthouse 3016 IAQ particle counter near the locations of monitoring stations assessing size-segregated mass fraction concentrations (PM0.5, PM1, PM2.5, PM5, PM10, and TPM) and particle number concentration (differential Δ) range between 0.3 and 10 microns during the specified timeline between 8.00 and 11.00 a.m., which were considered the morning rush hours interval. Interpolation maps estimating the spatial distribution of the mass concentrations of various PM fractions and particle number concentration were drawn using the IDW algorithm in ArcGIS 10.8.2. Regarding the particle count of 0.5 microns during the lockdown, the smallest number was recorded when the restriction of citizens’ movement was declared (24 March 2020), which was 5.8-times lower (17,301.3 particles/cm3) compared to a common day outside the lockdown period (100,047.3 particles/cm3). Similar results were observed for other particle sizes. Regarding the spatial distribution of the mass concentrations, the smaller fractions were higher in the middle of the city and west (PM0.5, PM1, and PM2.5) while the PM10 was more concentrated in the west. These are strongly related to traffic patterns. The analysis is useful to establish the impact of PM and the assessment of urban exposure and better air quality planning. Long-term exposure to PM in conjunction with other dangerous air pollutants in urban aerosols of Ploiesti can lead to potential adverse effects on the population, especially for residents located in the most impacted areas.
1. Introduction
Air pollution is a major environmental problem mainly because of its negative impact on human health. Most of the research in the field highlights the effects of the atmosphere’s pollution on the ecosystems through a series of adverse effects, disturbances in the cycles of carbon, oxygen, and sulfur, consequences on major irreversible changes in the planet processes, plant species, and ecosystems, and the existence of fauna [1]. Negative impacts occur more clearly on humans themselves, as the generator of anthropogenic pollution that destabilizes the ecological balance [2], and, in particular, on the urban population and the material goods in the areas polluted by heavy traffic, industrial or domestic uncontrolled emissions, respectively [3].
The assessment of the effects of air pollution is differentiated according to the type and characteristics of the source of pollution and the mechanism of distribution of these pollutants in the atmosphere under the influence of local and regional climatic factors [4]. In urban areas, the concentration of a large number of buildings in a relatively small area causes changes in meteorological factors such as air temperature and speed, respectively, and the wind direction by their position, height, and number [5]. Many other factors influence the conditions of urban climate, namely, latitude, and longitude, local topography, land cover/land use, and the presence of surface waters in the area. Human activities have an important impact on urban climate conditions as well due to intensive industry and transport, both activities that are responsible for substantial emissions into the atmosphere [6].
Regarding the trends in emissions of major air pollutants, the values of emissions of pollutants released into the atmosphere depend on several factors: the level of products made from various sectors of activity; refurbishment of installations (cleaner technologies, with minimum emissions of pollutants); replacement of old installations, which is not economically and financially justified to be refurbished, with new, non-polluting installations; transposition of European legislation to achieve targets for limiting pollutant emissions into the atmosphere, maintaining and improving air quality indicators [7].
One of the most important components in developing air quality indices is the mass concentration of particulate matter (PM). It must be noted that PM is a complex mixture of organic and inorganic pollutant species varying dramatically between locations and originating from natural and anthropogenic sources. The size and chemical composition of PM depends on the characteristics of emission sources [8]. These particles are classified into several categories depending on their aerodynamic diameter. PM10 represents the mass concentration of particles with sizes < 10 μm. Another important fraction that is usually monitored is PM2.5, which represents the mass concentration of particles with sizes less than 2.5 µm. The sub-micrometric fraction of particles (PM1) and the “ultrafine particles” with sizes less than 0.1 µm (PM0.1) are of interest lately to extensively monitor the urban areas for exposure assessments and epidemiological studies [9].
High levels of various PM fractions in urban areas are mainly associated with traffic-related emissions, particularly from vehicles with diesel engines. A significant part of PM levels in urban areas derives also from industrial combustion plants and residential heating. Natural sources contribute to a small percentage of fine particulate concentrations in urban areas [10].
According to IQAir’s 2021 World Air Quality Report [11], which is the first air quality report that considers the updated annual World Health Organization’s (WHO) air quality guideline for the annual PM2.5 average (5 µg m−3), only 3% of cities and no single country met the latest PM2.5 annual air quality guidelines. The report aggregates PM2.5 air pollution measurements in 6475 cities in 117 countries, regions, and territories from various types of air monitoring stations. In 2021, Romania was positioned in 66th place with an annual average of 15.3 μg m−3 PM2.5 behind Hungary (15.5 μg m−3) and before Italy (15.2 μg m−3). In 2020, Romania ranked 57th place (15.8 μg m−3), while in 2019, it ranked 54th (at 18.3 μg m−3). Ploiesti city ranked in position 1432, reaching an annual average of 17.2 μg m−3 in 2021 (Figure S1).
Numerous studies regarding PM air pollution in Europe were reported covering Western, Central, or Northern Europe (e.g., [12,13,14]). Other studies presented the issue in the Mediterranean area in correlation with other connected atmospheric processes [15] in central Europe [16]. In comparison, the available information concerning urban air pollution in Eastern Europe based on ground measurements is still scarce. Even if there is some valuable information on PM air pollution resulting from the synergistic use of satellite-derived products and large-scale modeling studies [17], the critical PM pollution episodes at a local scale can be identified properly by in situ continuous measurements [18]. The characteristics of PM can vary from one region to another due to the spatial and temporal dependence of the pollutant, so they cannot be replicated in other geographical spaces [19]. Accordingly, specific research for every zone of interest is technically necessary.
Several PM studies were conducted in Romania, e.g., [20,21,22], including Ploiesti city [10]. These are mainly focused on the characterization of spatial and temporal variation of PM10 or PM2.5. Other research activities have been conducted to link the PM2.5 characteristics to the meteorological parameters (e.g., relative humidity, temperature, wind direction [5,23]). These studies revealed that the concentration of the particles is highly correlated to wind speed, temperature, and relative humidity as the main factors that influence the PM levels in urban areas. Only a few studies have been related to the chemical composition of PM in Romania (e.g., [22,24,25]). Based on the reports, PM2.5 concentrations tend to be more severe in Eastern and Southern Europe than in Western and Northern Europe. For example, a combustion-related PM10 fraction varies from 73% (cold season) to 59% (warm season) in Bucharest and is higher with 22–26% than in similar polluted areas from Southeast Europe [20]. The average concentration of PM2.5 and PM10 from 2009 to 2018 in eight Romanian regions varied between 17.01 and 22.91 µg m−3 and 23.02–33.29 µg m−3, while the PM2.5/PM10 ratio varied between 0.52 and 0.76, respectively [23].
Consequently, PM mass concentration is particularly pronounced during the winter months, more intensively in cities that rely on coal-based energy and biomass burning for heating observing the largest seasonal fluctuations. Furthermore, many urban areas experienced the high contribution of heavy metals (especially lead) in PM formation, emphasizing industrial sources’ contributions to air pollution [21]. Overall, the number of recent studies regarding the PM levels in Romanian cities is low and the present study brings new information regarding the particle number concentration and PM1 and PM0.5 mass concentrations.
The International Agency for Research on Cancer (IARC) has classified PM, a key component of ambient air pollution, as carcinogenic to humans (Group 1), noticing an increasing risk of lung cancer with increased levels of exposure to various harmful air pollutants independently of the world’s region. Numerous epidemiological studies provided evidence of the adverse effects pointing out that air pollution, especially with PM, is associated with exacerbations of respiratory symptoms, increased hospital admissions, and mortality from both respiratory and cardiovascular diseases [26,27,28,29]. Our previous study in Ploiesti city pointed out that exposure to submicrometric fraction PM1 influenced the frequency of wheezing episodes, increased hospitalizations, and the levels of allergic blood indicators in sensitive children [30].
In Romania, the health structure by disease categories in 2020 compared to 2011 maintains a high incidence of respiratory diseases (representing 32.0% of the total number of diseases in 2020 and 42.4% in 2011). In 2020, the most frequent hospitalizations were 15.9% due to respiratory diseases, followed by circulatory diseases, tumors, pregnancy, childbirth, etc. [31].
Specific mortality from respiratory diseases is on the rise in the period 2011–2020, increasing with 4.12 ‱, from 5.55 ‱ in 2011 to 9.67 ‱ in 2020. Large increases due to these diseases have been recorded since 2017 and peaked in 2020 when there was an increase of 1.68 ‱ compared to 2019 (7.99 ‱). The highest mortality rate was recorded in the north, in Satu-Mare County (21.94 ‱), and high rates were also recorded in other counties such as Timiș, Prahova (in which Ploiesti is the key city of the county), Olt, Maramureș, and Mureș. In 2020, in the whole country, the life years potentially lost by deaths due to respiratory diseases were 252,274.9, which is 43,184.3 more than in 2019, when there were 209,090.6 years of life potentially lost by premature deaths caused by diseases of the respiratory system. In Bucharest and the counties of Prahova (13,880.4), Timiș, Constanța, Iași, Satu-Mare, and Mureș recorded the most years of life lost in 2020 [31]. Consequently, Prahova County including Ploiesti agglomeration is a region affected by respiratory symptoms and diseases that can be aggravated by high levels of air pollution.
Starting in March 2020, COVID-19 became a pandemic. Consequently, numerous restrictions on socio-economic activities, traveling, and commuting, and significant modifications in human behavior were enforced all over the globe [32]. Lockdown and other related public health measures resulted in billions sheltered at home for various periods with limited mobility of people and other constraints and thus lower emissions that contributed to air quality improvements across the world [33].
While the substantial modifications in human behavior and the economy led to healthier air in 2020 (with improvements observed in 67% of global cities) following the lockdown restrictions, these environmental health improvements were coupled with the spread of the deadly SARS-CoV-2 virus [11]. A growing body of research suggests that people exposed to air pollution, particularly long-term air pollution, are more vulnerable to the serious health impacts of COVID-19, which attacks people’s respiratory and cardiovascular systems [11].
In this context, the present work aimed to assess the ambient levels of various fractions of particulate matter during the lockdown determined by the COVID-19 pandemic in 2020 (March–June), in Ploiesti city. The assessment of the PM impact during this unique event that occurred at the global level could provide interesting insights regarding the drivers of PM pollution in urban environments. Ploiesti city is under the impact of oil refining and the analysis is useful to establish the impact of PM and the assessment of urban exposure and better air quality planning. Long-term exposure to PM in conjunction with other dangerous air pollutants in urban aerosols of Ploiesti can lead to potential adverse effects on the population, especially for residents located in the most impacted areas.
2. Materials and Methods
2.1. Study Area
Ploiesti is one of the largest urban agglomerations in Romania with an area of 58 km2, ranking 10th in the 2022 Romanian census (Figure 1). It is located in the southeast of Romania (44°56′24″ N Lat.; 26°01′00″ E Long.; 150 m a.s.l.).
Ploiești city is an important industrial center, which experienced rapid economic growth in the last two decades. Its industrial activity is concentrated especially on the oil production and refining industry. Actually, Ploiesti is the only city in Europe surrounded by four oil refineries [25]. Even if the oil production in the region is declining steadily, there is still a significant processing industry that operates. The city remained anchored mainly in the oil processing industry and extractive industries related to this sector (construction equipment/building machinery, electrical equipment, metallic construction, metal products, chemicals, human-made fibers, the manufacturing of rubber and plastic products, etc.) [10]. Unfortunately, the urban residential areas are located too close to the industrial facilities. Due to its relatively large population, Ploiesti city also has a heavy traffic density [30]. Regarding the evolution of the population in Ploiesti city, according to the census carried out in 2011, there were 209,945 inhabitants, down from the previous census performed in 2002, when 232,527 inhabitants were registered. In the most recent census from 2022, Ploiesti’s resident population is 29,406 residents lower than in 2011, respectively, at 180,539 residents.
Ploiesti is an important transport hub facilitating links to other regions of Romania (i.e., Moldavia and Transylvania). Many commuters come to and leave the city every day, using private cars because of an undersized public transportation system. The motorization index increased from 335 cars per 1000 inhabitants (in 2013) to more than 400 in 2020, values that are much higher than those existing at the national level. These reasons lead to traffic congestion within the city center—more than 85,000 vehicles per day transit to the inner city. The network of streets in Ploiești city is radially polarized in the center of the city, with a length of 296 km, of which 5% are dirt roads, according to the Ploiești Sustainable Urban Mobility Plan (http://www.ploiesti.ro/Hotarari/2017/11_(26_iunie_2017)/027%20TCE%20PLOIESTI%20-%20V14%20-%20Raport%20final%20proiect.pdf—accessed on 15 March 2023).
The main sources of emissions were presented in Figure S2 (oil refineries, suburban area sources, Northwest industrial area including a chemical factory, roads, and railroads).
2.2. Climate and Meteorological Data
The climate of Ploieşti is influenced by its position in Ploiestilor plain and winds from the northeast (40%) and southeast (23%) that reach an average speed of 3.1 m s−1. The air temperature shows an annual average of 10.5 °C with a minimum temperature recorded on 25 January 1952 (−30 °C), while the maximum temperature was recorded on 19 July 2007 (43 °C). The multiannual precipitations quantity is around 600 mm (average values of 30–40 mm in January and 88 mm in June). The dominant winds are as follows: North—17.1%, Northeast—17.5%, East—9.9%, and West—9.7%.
During the lockdown period (13 March–15 May), the sum of precipitations was 66 mm and the average was 11.7 °C based on the data extracted from the ERA-5 reanalysis dataset (https://cds.climate.copernicus.eu/cdsapp#!/dataset/reanalysis-era5-land?tab=overview—accessed on 15 March 2023) using the Climate Data store resources (CDS API) for the city center (44°56′ N, 26°01′ E). Figure S3 presents the daily average temperature (annual average temperature = 13 °C) and Figure S4 shows the precipitation amounts during 2020 (the annual sum of precipitations = 562 mm).
2.3. Monitoring Systems and Instrumentation
In the Ploieşti agglomeration, the air quality monitoring is performed through 6 automatic stations connected to the Romanian National Network for Monitoring Air Quality—RNMCA (https://calitateaer.ro/public/home-page/?__locale=en, accessed on 19 February 2023), 4 of which are located in the city that were considered in the present study (Figure 1), i.e., PH-1 (AirBase ID: RO0175)—EPA Prahova, urban traffic (N 44°56.264′; E 025°59.724′); PH-2 station (RO0176), Piața Victoriei, (city center), background urban (N 44°56.355′; E 026°01.550’); PH-5 (RO0179), Blvd. București, urban traffic (N 44°55.312′; E 026°02.035′); and PH-6 (RO0180), Str. Mihai Bravu, industrial type (N 44°56.286′; E 026°02.699′). The methods of analysis used in the automatic stations for PM10 comply with the European standards (SR EN 12341/2014—gravimetric PM10 measurement) reference method and continuous measurements using an optical system (model LSPM10 UNITEC, Italy) in parallel. In this study, we used the data retrieved from the optical systems equipping the stations.
Furthermore, we have performed independent PM measurements near the locations of monitoring stations using a Lighthouse 3016 IAQ particle counter [34] assessing size-segregated mass fraction concentrations (PM0.5, PM1, PM2.5, PM5, PM10, and TPM) and particle number concentration (PN/cm3) a range between 0.3 and 10 microns during the specified timeline. Particle counters provide the results in two ways: cumulative (∑ sigma) and differential (∆ delta), respectively. The cumulative total explains the number of particles that were assessed at that size and greater, while the differential total gives the counts which are at least that size in diameter and up to, but not including, the next size. In this work, we presented the differential (∆ delta) data—Figure S5. According to the manufacturer’s manual, the counting efficiency for the particles with diameters up to 0.3 μm is 50%, and for the particles with diameters > 0.45 μm is 100% which complies with the ISO21501-4 standard. The sampling air flow rate is 2.83 l/min storing up to 3000 records in memory. A cleaning routine was considered to improve the regular quality of measurements (every 15 days).
The GPS coordinates were retrieved for the measurements performed with the Lighthouse particle counter being located in the proximity of the four RNMCA stations. Monitoring activities were organized between 8.00 and 11.00 a.m. (considered as rush hours with higher intensity of movement) stationing 30 min at each point. The instrument was placed on a tripod at 1.50 m height away from obstructions that may affect wind currents—Figure S5 [30]. The instrument was moved from site to site using randomized routes and timings to ensure a better assessment of the pattern.
2.4. Timeline of COVID-19 Lockdown and Associated Periods
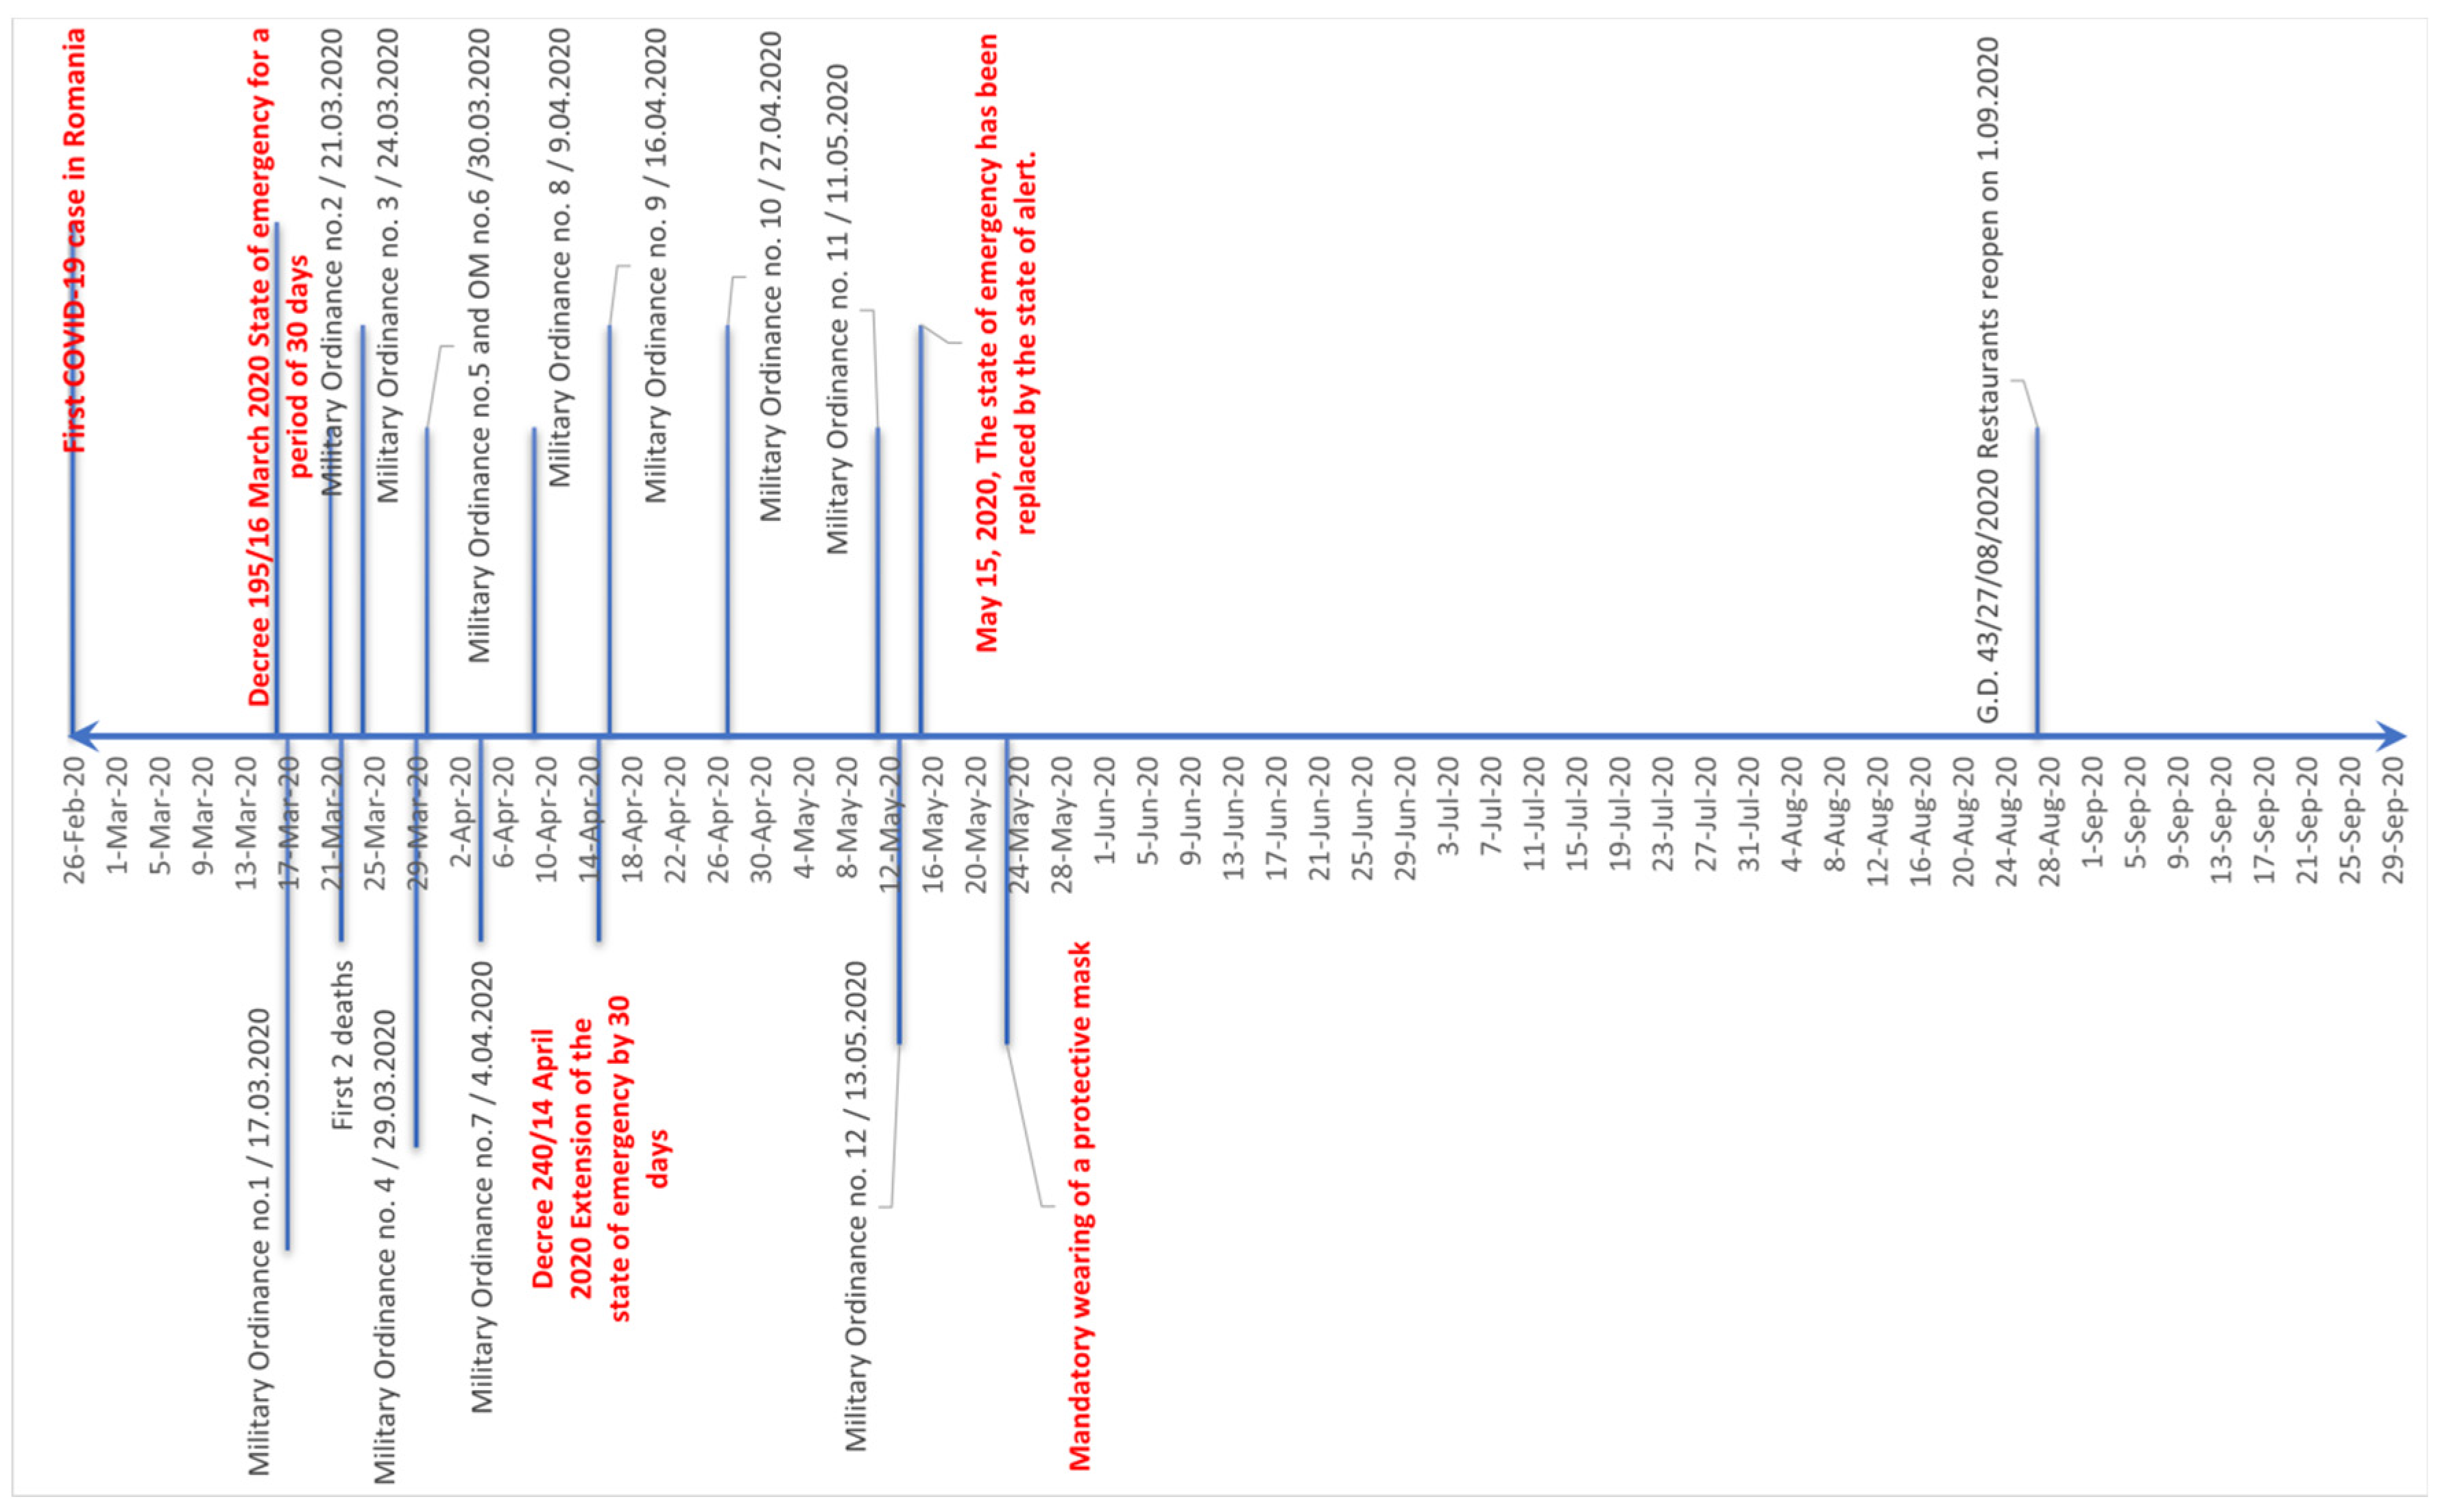
On 26th February 2020, the first case of COVID-19 was detected and reported in Romania. Figure 2 presents the timeline of the main events during and following the lockdown in 2020. Figure S6 presents the evolution of COVID-19 cases in Prahova County, both new cases per day and cumulated cases during the year 2020.
The COVID-19 pandemic has had several effects on people affected by the SARS-CoV-2 virus infection, including a high number of deaths, leading to a sharp increase in the overall mortality rate. In 2020, according to the data reported by the National Institute of Statistics, 17,166 people (7.75‱) total, with 10,174 (9.41‱) belonging to the male gender and 6992 (6.17‱) to the female gender, died in Romania because of COVID-19. Regarding the areas of residence, 11,065 (8.86‱) were from urban and 6101 (6.32‱) were from rural areas. Most deaths belonged to the age groups over 60–64 years of age. In the whole country, the life years potentially lost by deaths caused by COVID-19 were 187,214.5 [31]. The distribution at the county level of life years potentially lost through deaths caused by COVID-19 was uneven. The highest number of years of life lost was in the following counties: Bucharest, Suceava, Brașov, Bihor, Sibiu, and also in Prahova (7.94‱), which includes Ploiesti city [31].
For a better assessment of the air quality fluctuations during the COVID-19 lockdown, we used the time moments usually presented in the literature, e.g., Table 3 from [35] including the dates for the state of emergency declaration, key military ordinances that imposed citizens’ movement restrictions (M.O.s 2 and 3), Catholic Easter, Orthodox Easter, state of alert replacing the state of emergency, and the lifting of transportation restrictions. The effective lockdown in Romania may be considered between March 24 (M.O.3) and 15 May 2020, when the state of emergency was replaced with the state of alert that eliminated the transportation restrictions over a 30 km area around the cities without explicative documents. This period consisted of 53 days.
2.5. Analysis and Statistics
Data processing and time series analysis were performed using SPSS software (SPSS Inc., Chicago, IL, USA, 2011). The dataset variability for continuous time series was established based on descriptive statistics (average, coefficient of variation, skewness, kurtosis, etc.). Two tests of normality (Kolmogorov–Smirnov and Shapiro–Wilk tests) were employed to test the normal distribution based on Sig. values. A non-parametric Mann–Whitney U test was used to compare the differences between two independent groups of unequal size to test whether two samples (time series with a different number of samples due to data gaps) are likely to derive from the same population (H0: the populations are equal versus H1: the populations are not equal) [36]. The test ranks all of the dependent values and then uses the sum of the ranks for each group in the calculation of the test statistic [30]. For establishing a general trend for the city, the measurements performed during campaigns, and the PM10 time series provided by the automatic stations were averaged. The linear trend lines of the PM time series were compared based on R2. Interpolation maps were obtained using the IDW algorithm [30] in ArcGIS Desktop 10.8.2.
3. Results
Particulate Matter Load
The particle number concentration monitoring provided a screening of the evolution of the number of particles from 0.3 to 10 microns (PN/cm3) during the lockdown period.
Table 1 presents the results for the key moments compared to a day with common concentrations (<15 μg m−3 PM2.5 24 h average) after the lockdown period (typical day) and a high PM episode (>30 μg m−3 PM2.5 24 h average) recorded in 2022. The lowest number of 0.3 micron particles (217,043.3) was recorded on 24 March 2020 (M.O.3—restriction of citizens’ movement), which was 5.8-times lower than a typical day and 21.5-times lower than the PM episode. The other remaining sizes (0.5–10 microns) showed the minimum values during the same date.
The trend of the sizes from 0.3 to 10 microns showed that the number of particles declined from the moment when schools and the university were closed up to the restriction of mobility (21 March) when the traffic rose because of the people’s mobility to prepare for the restrictions. Then, a new rise occurred on March 24, probably for the same reasons, as preparation for the restrictions on citizens’ movements (24 March). Then, a new increase occurred on Orthodox Easter (19 April). After this day, the particle number concentration increased for all sizes up to June 6, two weeks after the lifting of transportation restrictions, approaching almost half of the values corresponding to a typical day.
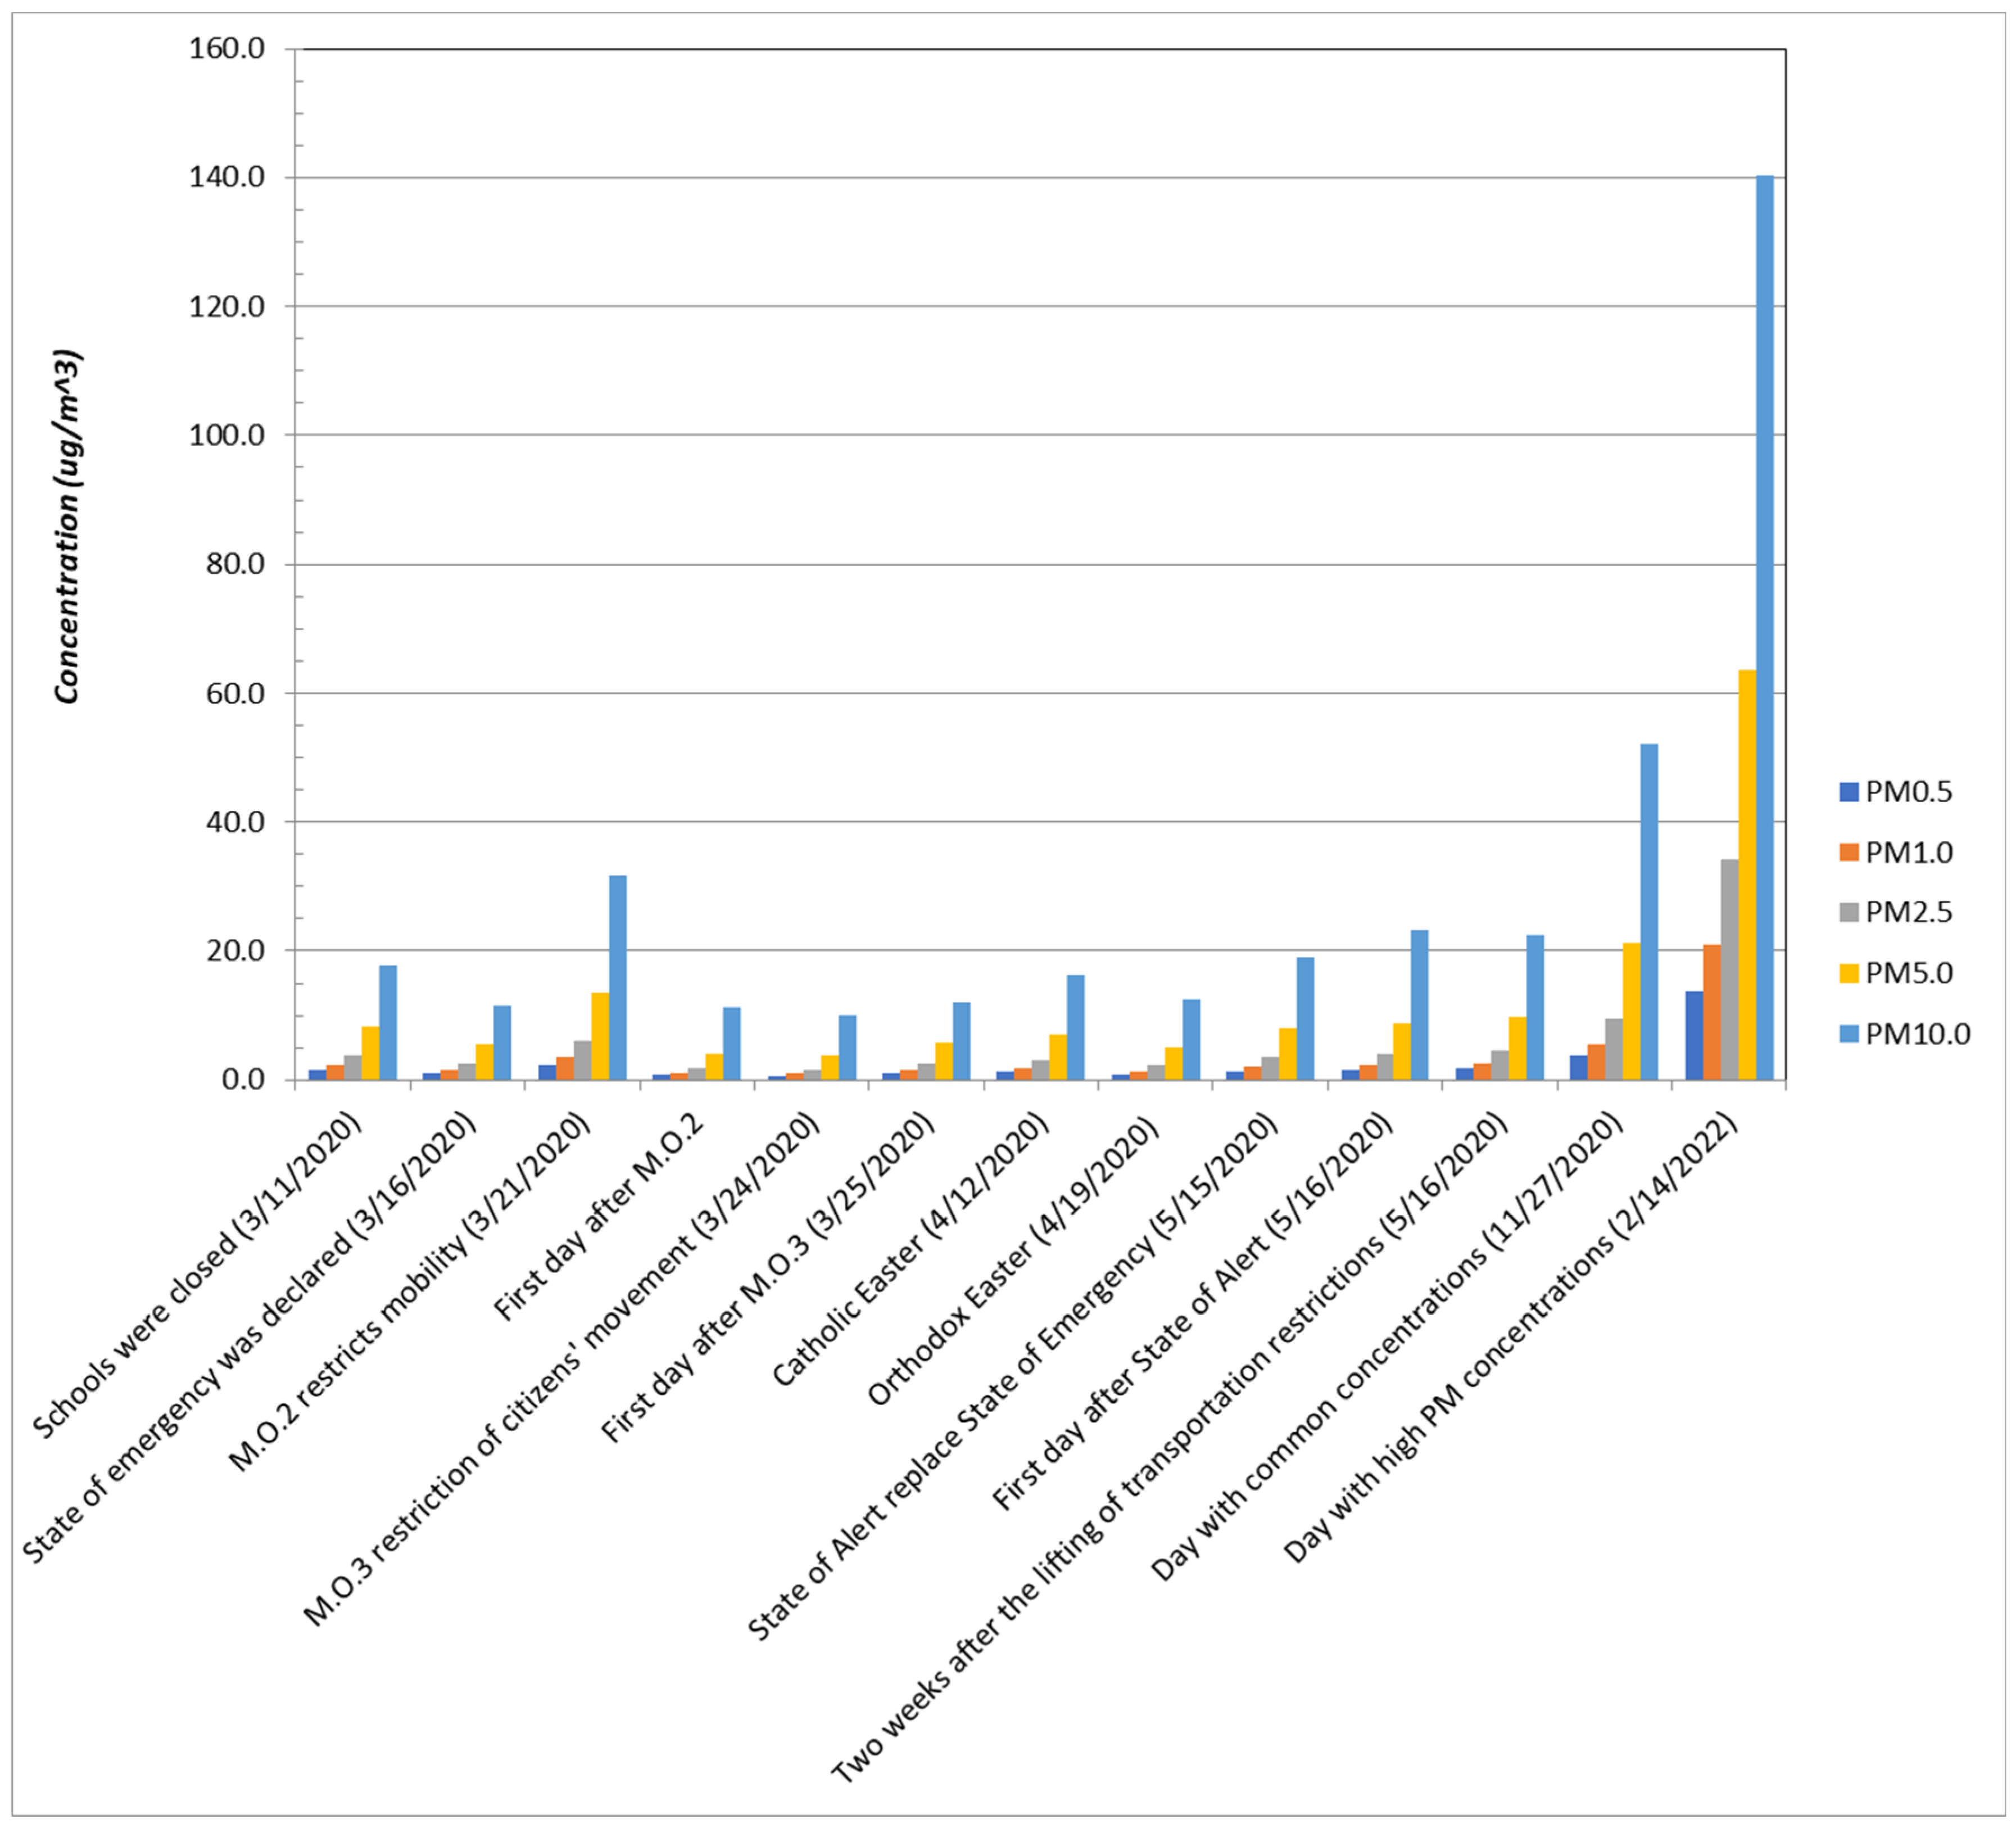
Figure 3 presents the concentrations of the size-segregated mass fractions of particulate matter (μg m−3) recorded with the Lighthouse HH 3016 IAQ between 8 and 11 a.m. The results showed low concentrations for all fractions during the lockdown and the following period. These concentrations could be attributed to the industrial emissions since the traffic was partially restricted and domestic heating was reduced during this period. During the lockdown, the concentrations were much lower compared to a typical day with PM10 (~50 μg m−3) and PM2.5 (~20 μg m−3), recorded at below 20 μg m−3 (PM10) and 8 μg m−3 (PM2.5). These are important reductions for the ambient levels of particulate pollution in an hourly interval, which is normally characterized by one of the highest concentrations.
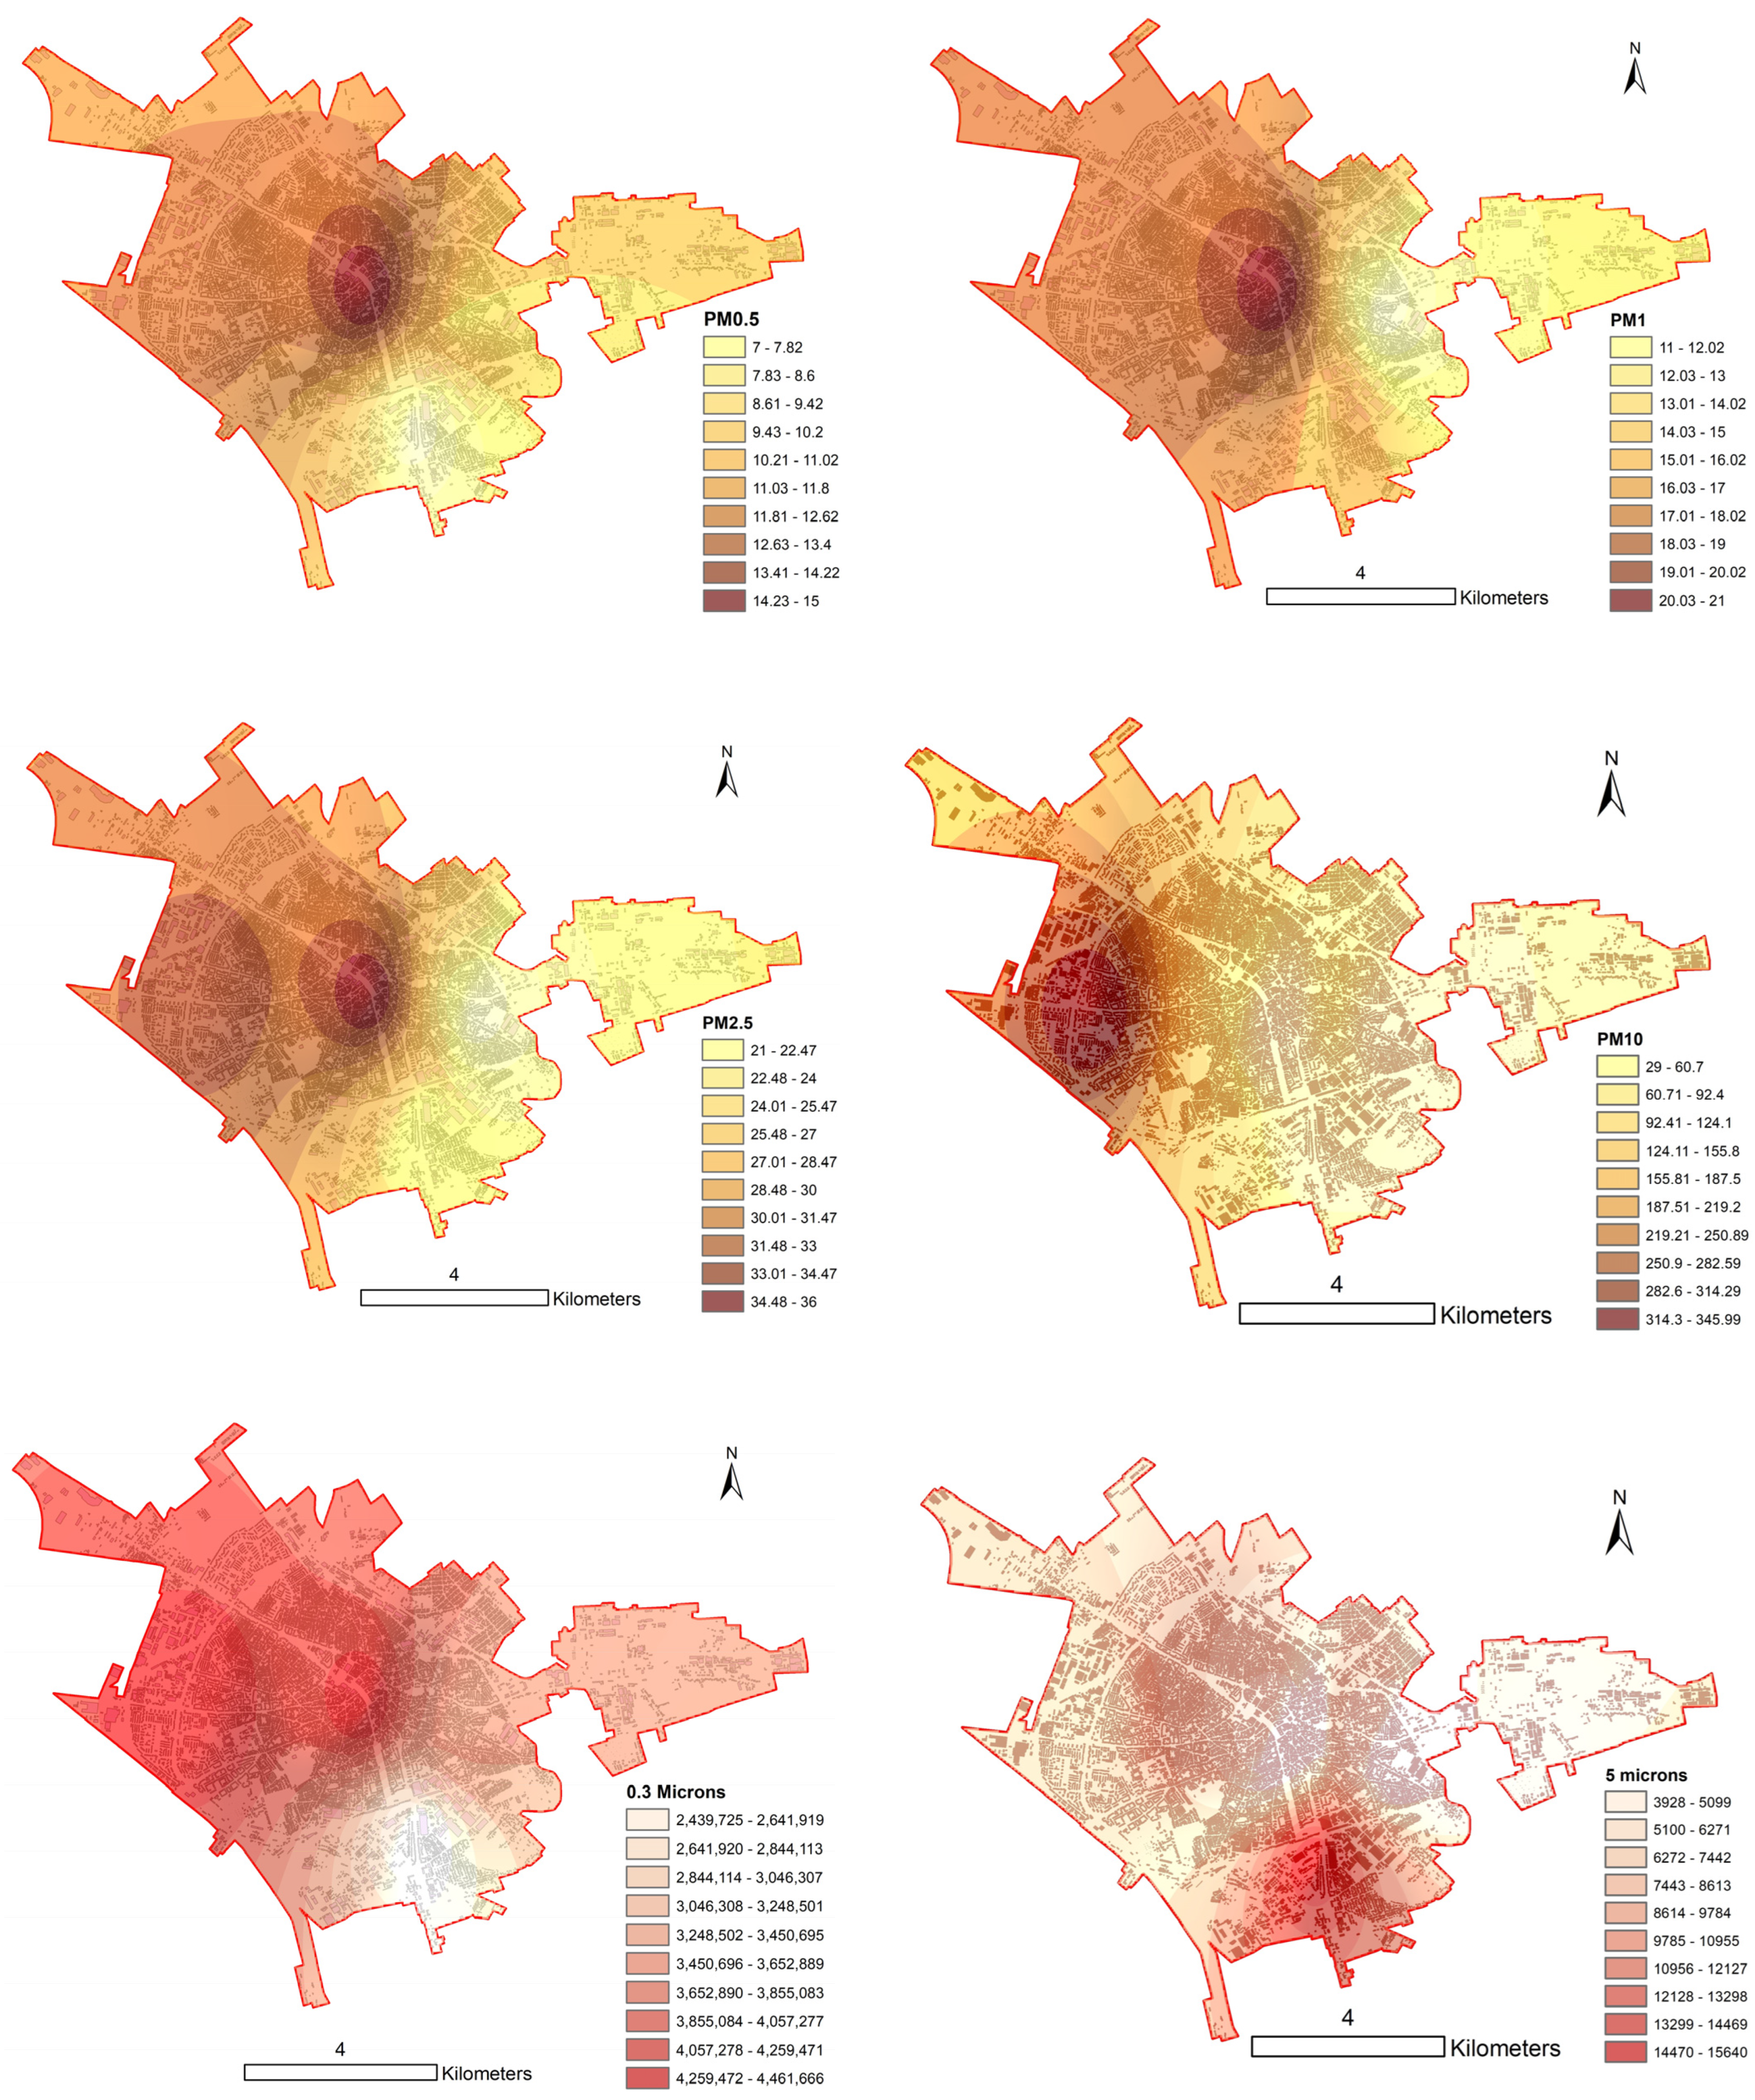
For a better image of the spatial distribution of PM in Ploiesti, interpolation maps were produced using the IDW algorithm, and the situation of a pollution episode was selected for representation both for mass concentrations and particle number concentration.
Figure 4 shows the spatial distribution in the morning of a day with high PM concentrations. PM0.5, PM1, and PM2.5 have higher mass concentrations in the city center and the west part, while PM10 is higher in the west. One possible cause could be related to the intense traffic and the local topography as influenced by the height and configuration of the buildings. An interesting observation is that the particle number concentration for the 5 microns size is higher in the south in contrast with the smallest size (0.3 microns). This could be attributed to the contribution of railway transport that is more present in the south and industrial sources (Figure S2). Overall, the differences between various sectors of the city are not too significant mainly because the city is located on a flat plain, and when wind currents are missing the dispersion of particles is reduced, leading to similar mass concentrations.
This tendency is confirmed by the PM10 data recorded from the automatic stations located in the city. Table 2 contains the descriptive statistics of the PM10 concentrations from 1 March–30 June 2020, and for the lockdown period from 24 March–15 May 2020. The PM10 means ranged from 16.07 to 17.03 μg m−3 with no significant differences between stations and similar coefficients of variations (41.5–46.8%). However, the maximum concentration (82.33 μg m−3) was recorded in the center of the city (PH-2 station). Similar concentrations were observed during the lockdown, but it should be noted that it is PH-6 station, located in the east of the city, that also monitors the impact of the largest oil refinery, where an average of 11.39 μg m−3 was computed in the conditions of a lower available number of observations (83.9%). It is possible that during the lockdown, the intensity of industrial activities diminished.
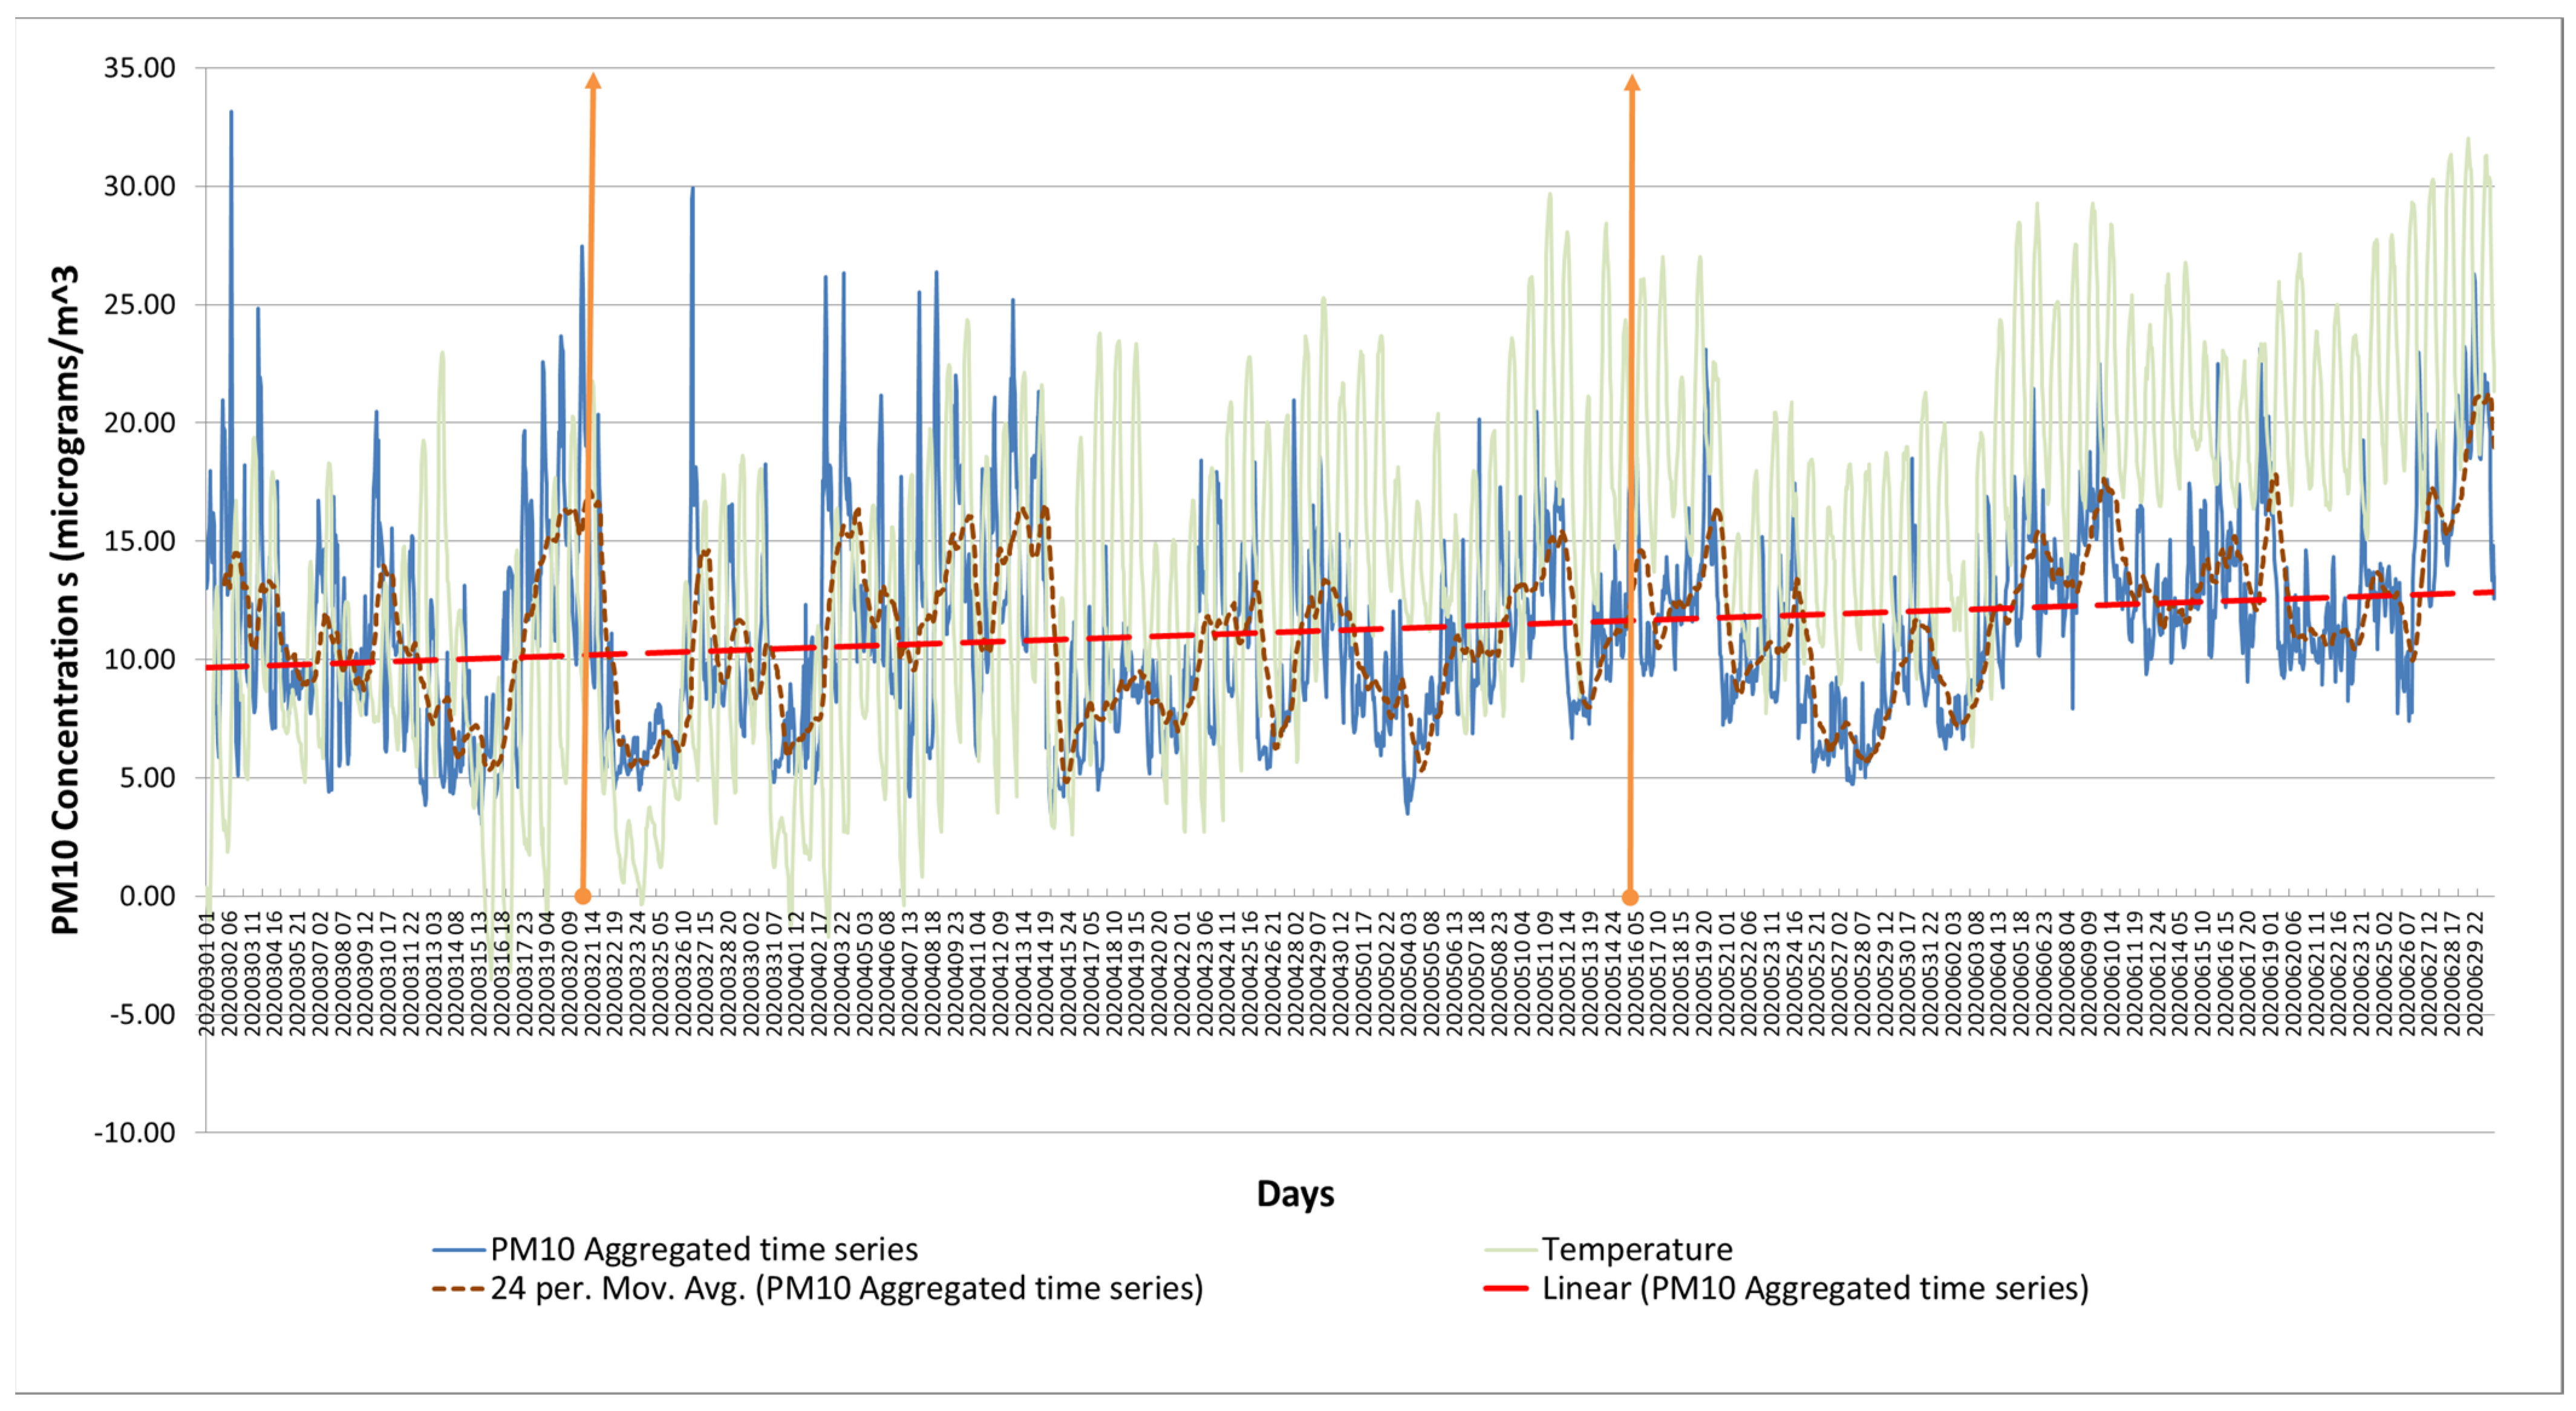
Figure 5 resumes the PM10 data from the automatic stations by presenting the aggregated time series, the linear trend line showing an increase in the concentrations over time, and the moving average trend line. Based on the fluctuations, many higher values occurred in the late evening, suggesting a contribution from residential heating and industrial activities. For completing the screening of PM10 in Ploiesti city, Figure S6 provides the 2020 annual time series using PM10 hourly values for each station measured by the optical system. It should be noted that some stations had data gaps for shorter or longer periods (i.e., PH-6 station). Consequently, the validation of measurements from the automatic stations is difficult and the local EPA reported officially the annual averages only for two stations located in Ploiesti (PH-1 and PH-2)—Figures S7 and S8. According to these data, the highest annual concentration was observed at PH-5 station (located in the southeast) which was very close to the averages of the remaining stations. Furthermore, the highest number of daily exceedances during 2020 was recorded at PH-5 automatic station (17 occurrences), not reaching the maximum number of 35 exceedances stipulated by the air quality standard (Figure S9). However, these data should be regarded as indicative because of the unfulfilled levels of data capture.
4. Discussion
The studies that highlight the exposure levels and the health impact have clear importance for the urban environments given the protection of the population, which may face negative consequences from morbidity to mortality [37]. For example, the standardized rate of hospitalized morbidity due to asthma in Prahova County in 2020 was 4.02 ‱, among the highest in Romania [31], which may also be related to exposure to air pollutants, especially in urban areas [28].
In some cases, it is possible to have differences of orders of magnitude between the actual and estimated concentrations, depending on the particularities of the source configurations, control equipment, and operating practices. Thus, in all situations where an accurate assessment of emissions of these pollutants is required, source-specific information should be obtained to confirm the existence of specific emitting operations and the types and effectiveness of control measures and to determine the impact of operational practices. Source testing and/or material balance calculations should be considered optimal methods for determining these emissions in real conditions. In Ploiesti, the automatic stations provided measurements only for PM10, and in some periods there were data gaps and the systems tended to underestimate the real concentrations compared to the independent measurements. PM2.5 is measured only at the PH-2 station, but the analyzer functioned for a short period and thus did not achieve the required data capture. Consequently, independent observations are required to establish better assessments for the exposure. Therefore, a new monitoring system consisting of 16 micro-stations that also monitor PM2.5 was employed by Ploiesti City Hall (http://www.ploiesti.ro/calitateaer.php, accessed on 19 February 2023). It is expected that these new sources of information (URAD, Airly, university research programs, etc.) will complete a better assessment of the impact of air pollution together with the official operations.
The presented results bring new insights regarding the dynamics of particulate matter during an uncommon period, the 2020 lockdown, including a rarely reported feature of the PM in Romanian urban agglomerations, respectively, the particle number concentration per unit of volume. At the international level, Slezakova et al. [38] reported significant variations in the ultrafine particles’ number concentration (UFP) in the air of Oporto, Portugal, with medians ranging between 5.1 and 20.0 × 10³ # cm−3 and a maximum of 51.4 × 10³ # cm−3. The highest UFP concentrations were observed at sites near streets with heavy traffic, while the other sites showed UFP levels from 2- to 4-times lower. Utell and Frampton [39] mentioned particulate levels from 5000 to 10,000 particles/cm3 in ambient air increasing up to 300,000 particles/cm3 or even 1,000,000 particles/cm3 on streets with heavy traffic. Seaton et al. [40] reported average levels of 1.7 × 10⁴–2.3 × 10⁴ particles/cm3 (size range: 20 nm–1000 nm) inside trains in the London underground, which were approximately 30–60% lower than those in outdoor environments. In Al Samha, UAE, the hourly particulate number concentration varied widely from 34,035 to 2,085,556 particles/cm−3 with a median of 247,431 particles/cm−3 [41]. Compared to these results, the average particle number concentration for the size of 5 microns in Ploiesti city considering all the key moments during lockdown was 3.3 × 10⁴ particles/cm3, but on a typical day it can reach 10 × 104 particles/cm3, and >35 × 104 particles/cm3 on a day with high PM concentrations.
Li et al. [42] pointed out that particles with a diameter of less than 1 μm had the highest contribution to air pollution caused by particulate matter in urban areas. The sub-micrometric fraction is the most harmful to health [43]. Many challenges are related to measuring particles, and they must be quantified for the efficient control of emissions, which contributes directly to the improvement of the quality of indoor and ambient air [44].
Long-term exposure to PM in conjunction with other dangerous air pollutants including VOCs and heavy metals in urban aerosols can lead to potential adverse effects on the population. Thus, more detailed experiments and continuous assessments taking into account seasonal variation, chemical composition, and source apportionment are required [45,46,47,48,49].
Further studies are required in the area including complex monitoring of the compounds from refineries and dispersion assessments [50].
Overall, the lockdown period was characterized by lower PM concentrations and particle number concentrations because of the movement restrictions that limited both traffic and human activities and thus lower emissions. However, Khomenko et al. [51] reported that about half of European cities exceeded WHO targets for annual PM2.5 in 2020, despite the effect of movement restrictions during lockdown, contributing to an estimated 50,000 premature deaths per year. Furthermore, reports stated that 18% of European cities presented chronic pollution, with 50 or more days in which daily WHO targets (≥25.5 μg m−3) were not met [11]. In Ploiești city, the multiannual mean PM10 and PM2.5 concentrations based on the 2009–2019 recordings from the automatic stations exceed the acceptable limit by 51.75% and 83.4%, respectively. PM2.5 showed a minimum of 8.54 μg m−3, a maximum of 36.87 μg m−3, and an average of 18.34 μg m−3. PM10 presented a minimum of 15.23 μg m−3, a maximum of 53.75 μg m−3, and an average of 30.35 μg m−3 [52].
In this context, our findings showed that the annual average of PM10 mass concentrations based on the recordings of all 4 stations was 23.7 μg m−3, which is much lower than the concentrations reported in other Romanian urban areas and also less than historical data from Ploiesti.
However, our independent measurements pointed out high concentrations of PM smaller fractions during the time intervals with a higher mobility and manufacturing program suggesting that more attention should be given to the exposure assessment studies.
The main limitations were related to the lack of reliable continuous measurements due to the data gaps from the automatic monitoring stations and the parallel monitoring to ensure reliable intercomparisons. Further research should consider a detailed analysis of the synergistic effect with other air pollutants that affects the urban environment (VOCs, PAHs, odor, etc.) by employing reliable data collection also for climate and environmental information for public health assessments [53] and machine learning or other AI methods [54,55] but this requires improved logistics and specific research funding.
5. Conclusions
The results of this study provide new insights regarding the spatial distribution of particle number concentration (particles less than 1 micron) and the PM0.5 fraction, which were rarely reported in Romanian cities. These can sustain better urban air quality planning with benefits to the local population, especially for residents located in the most impacted areas. Regarding the particle count of 0.5 microns during the lockdown, the smallest number was recorded when the restriction of citizens’ movement was declared (24 March 2020), which was 5.8-times lower (17,301.3 particles/cm3) compared to a typical day outside the lockdown period (100,047.3 particles/cm3). Similar results were observed for other particle sizes. Regarding the spatial distribution of the mass concentrations, the smaller fractions were higher in the middle of the city and west (PM0.5, PM1, and PM2.5), while the PM10 was more concentrated in the west. These are strongly related to traffic patterns. The analysis is useful to establish the impact of PM and the assessment of urban exposure and better air quality planning.
Supplementary Materials
The following supporting information can be downloaded at: https://www.mdpi.com/article/10.3390/atmos14040746/s1, Figure S1: estimation provided by IQAir regarding the position of Ploiesti city in the 2021 PM2.5 global ranking; Figure S2: map of the main sources of emissions; Figure S3: daily temperatures extracted from the ERA-5 reanalysis dataset for the center of Ploiesti city in 2020 (weekly scale); Figure S4: daily precipitations extracted from the ERA-5 reanalysis dataset for the center of Ploiesti city in 2020 (weekly scale); Figure S5: lighthouse 3016 IAQ particle counter in operation; Figure S6: incidence of COVID-19 in Prahova County including Ploiesti city; Figure S7: data recorded by the optical sensors of the four monitoring stations located in Ploiesti during 2020 (weekly scale)—PM10 mass concentrations (hourly values); Figure S8: annual averages of PM10 at various stations located in Ploiesti in 2020 and from 2017 to 2021 as reported by the EPA Prahova; Figure S9: number of recorded PM10 concentrations exceeding the daily limit value at various automatic stations located in Ploiesti in 2020 as reported by the EPA Prahova.
Author Contributions
M.S., D.D., S.I. and I.O. developed the monitoring setup and contributed to the writing of the manuscripts. D.D. and A.P. performed the modeling and interpretation of data. M.S., D.D., S.I., L.P. and M.P. contributed to the experimental designs and writing of the manuscript, providing experimental data and helping with the statistical processing of the recorded data sets. All authors have read and agreed to the published version of the manuscript.
Funding
Data processing was supported by a grant from the Romanian National Education Ministry, CNFIS-FDI-2022-0283.
Institutional Review Board Statement
Not applicable.
Informed Consent Statement
Not applicable.
Data Availability Statement
The data presented in this study are available on request from the corresponding authors.
Acknowledgments
The authors want to thank the three anonymous reviewers whose comments have contributed to the improvement of the original manuscript.
Conflicts of Interest
The authors declare no conflict of interest.
References
- Vallero, D. (Ed.) Air Pollution’s Impact on Ecosystems. In Fundamentals of Air Pollution, 5th ed.; Academic Press: Cambridge, MA, USA, 2014; Chapter 14; pp. 341–368. [Google Scholar]
- Lamnabhi-Lagarrigue, F.; Annaswamy, A.; Engell, S.; Isaksson, A.; Khargonekar, P.; Murray, R.M.; Nijmeijer, H.; Samad, T.; Tilbury, D.; Van den Hof, P. Systems & control for the future of humanity, research agenda: Current and future roles, impact and grand challenges. Annu. Rev. Control 2017, 43, 1–64. [Google Scholar]
- Claxton, L.D. The history, genotoxicity, and carcinogenicity of carbon-based fuels and their emissions. Part 3: Diesel and gasoline. Mutat. Res. Mol. Mech. Mutagen. 2015, 763, 30–85. [Google Scholar] [CrossRef] [PubMed]
- Siriopoulos, C.; Samitas, A.; Dimitropoulos, V.; Boura, A.; AlBlooshi, D.M. Health economics of air pollution. In Pollution Assessment for Sustainable Practices in Applied Sciences and Engineering, Butterworth-Heinemann; Mohamed, A.O., Paleologos, E.K., Howari, F.M., Eds.; Elsevier: Amsterdam, The Netherlands, 2021; Chapter 12; pp. 639–679. [Google Scholar] [CrossRef]
- Dunea, D.; Iordache, Ş.; Ianache, C. Relationship between airborne particulate matter and weather conditions in Targoviste urban area during cold months. Rev. Roum. Chim. 2015, 60, 595–601. [Google Scholar]
- Velasco, E.; Retama, A.; Zavala, M.; Guevara, M.; Rappenglück, B.; Molina, L.T. Intensive field campaigns as a means for improving scientific knowledge to address urban air pollution. Atmos. Environ. 2021, 246, 118094. [Google Scholar] [CrossRef]
- Romanian Parliament. Law No. 104 of 15 June 2011 on Ambient Air Quality; Part I, no. 452 of June 28; Official Monitor of Romania: Bucharest, Romania, 2011.
- Oprea, M.; Dunea, D.; Liu, H.-Y. Development of a Knowledge Based System for analyzing particulate matter air pollution effects on human health. Environ. Eng. Manag. J. 2017, 16, 669–676. [Google Scholar] [CrossRef]
- Borghi, F.; Fanti, G.; Cattaneo, A.; Campagnolo, D.; Rovelli, S.; Keller, M.; Spinazzè, A.; Cavallo, D.M. Estimation of the Inhaled Dose of Airborne Pollutants during Commuting: Case Study and Application for the General Population. Int. J. Environ. Res. Public Health 2020, 17, 6066. [Google Scholar] [CrossRef]
- Dunea, D.; Iordache, S.; Radulescu, C.; Pohoata, A.; Dulama, I.D. A multidimensional approach to the influence of wind on the variations of particulate matter and associated heavy metals in Ploiesti city, Romania. Rom. J. Phys. 2016, 61, 1354–1368. [Google Scholar]
- IQAir’s 2021 World Air Quality Report. Available online: https://www.iqair.com/world-most-polluted-cities/world-air-quality-report-2021-en.pdf (accessed on 5 April 2022).
- Rodrigues, V.; Gama, C.; Ascenso, A.; Oliveira, K.; Coelho, S.; Monteiro, A.; Hayes, E.; Lopes, M. Assessing air pollution in european cities to support a citizen centered approach to air quality management. Sci. Total Environ. 2021, 799, 149311. [Google Scholar] [CrossRef]
- Basagaña, X.; Jacquemin, B.; Karanasiou, A.; Ostro, B.; Querol, X.; Agis, D.; Alessandrini, E.; Alguacil, J.; Artiñano, B.; Catrambone, M.; et al. Short-term effects of particulate matter constituents on daily hospitalizations and mortality in five South-European cities: Results from the MED-PARTICLES project. Environ. Int. 2015, 75, 151–158. [Google Scholar] [CrossRef]
- Mücke, H.G.; Wagener, S.; Werchan, M.; Bergmann, K.C. Measurements of particulate matter and pollen in the city of Berlin. Urban Clim. 2014, 10, 621–629. [Google Scholar] [CrossRef]
- Michaelides, S.; Karacostas, T.; Sánchez, J.L.; Retalis, A.; Pytharoulis, I.; Homar, V.; Romero, R.; Zanis, P.; Giannakopoulos, C.; Bühl, J.; et al. Reviews and perspectives of high impact atmospheric processes in the Mediterranean. Atmos. Res. 2018, 208, 4–44. [Google Scholar] [CrossRef]
- Volná, V.; Blažek, Z.; Krejčí, B. Assessment of air pollution by PM10 suspended particles in the urban agglomeration of Central Europe in the period from 2001 to 2018. Urban Clim. 2021, 39, 100959. [Google Scholar] [CrossRef]
- Tuygun, G.T.; Gündoğdu, S.; Elbir, T. Estimation of ground-level particulate matter concentrations based on synergistic use of MODIS, MERRA-2 and AERONET AODs over a coastal site in the Eastern Mediterranean. Atmos. Environ. 2021, 261, 118562. [Google Scholar] [CrossRef]
- Martins, V.; Faria, T.; Diapouli, E.; Manousakas, M.I.; Eleftheriadis, K.; Viana, M.; Almeida, S.M. Relationship between indoor and outdoor size-fractionated particulate matter in urban microenvironments: Levels, chemical composition and sources. Environ. Res. 2020, 183, 109203. [Google Scholar] [CrossRef] [PubMed]
- Shi, W.; Wong, M.S.; Wang, J.; Zhao, Y. Analysis of airborne particulate matter (PM2.5) over Hong Kong using remote sensing and GIS. Sensors 2012, 12, 6825–6836. [Google Scholar] [CrossRef]
- Iorga, G.; Balaceanu Raicu, C.; Stefan, S. Annual air pollution level of major primary pollutants in Greater Area of Bucharest. Atmos. Pollut. Res. 2015, 6, 824–834. [Google Scholar]
- Proorocu, M.; Odagiu, A.; Oroian, I.G.; Ciuiu, G.; Dan, V. Particulate matter status in Romanian urban areas: PM10 pollution levels in Bucharest. Environ. Eng. Manag. J. 2014, 13, 3115–3122. [Google Scholar] [CrossRef]
- Olaru, E.A.; Offer, Z.Y.; Ruta, F.; Udrea, I. Chemical and micromorphological properties of TSP and PM10 particles: Case study in Bucharest urban area. Environ. Monit. Assess. 2012, 184, 4737–4745. [Google Scholar] [CrossRef]
- Bodor, K.; Szép, R.; Bodor, Z. The human health risk assessment of particulate air pollution (PM2.5 and PM10) in Romania. Toxicol. Rep. 2022, 9, 556–562. [Google Scholar] [CrossRef]
- Roba, C.; Ştefănie, H.; Török, Z.; Kovacs, M.; Roşu, C.; Ozunu, A. Determination of volatile organic compounds and particulate matter levels in an urban area from Romania. Environ. Eng. Manag. J. 2014, 13, 2261–2268. [Google Scholar] [CrossRef]
- Iordache, S.; Dunea, D.; Radulescu, C.; Dulama, I.D.; Ianache, R.; Predescu, M. Investigation of heavy metals content in Airborne Particles from Ploiesti, Romania. Rev. Chim. 2017, 68, 879–885. [Google Scholar] [CrossRef]
- Michael, S.; Montag, M.; Dotta, W. Pro-inflammatory effects and oxidative stress in lung macrophages and epithelial cells induced by ambient particulate matter. Environ. Pollut. 2013, 183, 19–29. [Google Scholar] [CrossRef] [PubMed]
- Beelen, R.; Raaschou-Nielsen, O.; Stafoggia, M.; Andersen, Z.J.; Weinmayr, G.; Hoffmann, B.; Wolf, K.; Samoli, E.; Fischer, P.; Nieuwenhuijsen, M.; et al. Effects of long-term exposure to air pollution on natural-cause mortality: An analysis of 22 European cohorts within the multicentre ESCAPE project. Lancet 2014, 383, 785–795. [Google Scholar] [CrossRef]
- Liu, H.-Y.; Dunea, D.; Iordache, S.; Pohoata, A. A Review of Airborne Particulate Matter Effects on Young Children’s Respiratory Symptoms and Diseases. Atmosphere 2018, 9, 150. [Google Scholar] [CrossRef]
- Hoek, G.; Krishnan, R.M.; Beelen, R.; Peters, A.; Ostro, B.; Brunekreef, B.; Kaufman, J.D. Long-term air pollution exposure and cardio-respiratory mortality: A review. Environ. Health 2013, 12, 43. [Google Scholar] [CrossRef] [PubMed]
- Dunea, D.; Liu, H.-Y.; Iordache, S.; Buruleanu, L.; Pohoata, A. Liaison between exposure to sub-micrometric particulate matter and allergic response in children from a petrochemical industry city. Sci. Total Environ. 2020, 745, 141170. [Google Scholar] [CrossRef] [PubMed]
- INSP–National Institute of Public Health, Romania–National Report of Population’s Health Status. 2020. Available online: https://insp.gov.ro/2021/12/29/raportul-national-al-starii-de-sanatate-a-populatiei-2020/ (accessed on 2 April 2022).
- WHO, Maintaining Essential Health Services: Operational Guidance for the COVID-19 Context, Interim Guidance. 1 June 2020. Available online: https://www.who.int/publications/i/item/WHO-2019-nCoV-essential_health_services-2020.2 (accessed on 5 April 2020).
- Lee, A.; Morling, J. COVID19: The need for public health in a time of emergency. Public Health 2020, 182, 188–189. [Google Scholar] [CrossRef]
- Lighthouse. Available online: https://www.golighthouse.com/en/airborne-particle-counters/handheld-3016-iaq (accessed on 2 April 2022).
- Iovanovici, A.; Avramoni, D.; Prodan, L. A dataset of urban traffic flow for 13 Romanian cities amid lockdown and after ease of COVID19 related restrictions. Data Brief 2020, 32, 106318. [Google Scholar] [CrossRef]
- Predescu, L.; Dunea, D. Performance Evaluation of Particulate Matter and Indoor Microclimate Monitors in University Classrooms under COVID-19 Restrictions. Int. J. Environ. Res. Public Health 2021, 18, 7363. [Google Scholar] [CrossRef]
- Adam, M.G.; Tran, P.T.M.; Balasubramanian, R. Air quality changes in cities during the COVID-19 lockdown: A critical review. Atmos. Res. 2021, 264, 105823. [Google Scholar] [CrossRef]
- Slezakova, K.; Pereira, M.C.; Morais, S. Ultrafine particles: Levels in ambient air during outdoor sport activities. Environ. Pollut. 2020, 258, 113648. [Google Scholar] [CrossRef] [PubMed]
- Utell, M.J.; Frampton, M.W. Acute health effects of ambient air pollution: The ultrafine particle hypothesis. J. Aerosol Med. 2000, 13, 355–359. [Google Scholar] [CrossRef] [PubMed]
- Seaton, A.; Cherrie, J.; Dennekamp, M.; Donaldson, K.; Hurley, J.F.; Tran, C.L. The London Underground: Dust and Hazards to Health. Occup. Environ. Med. 2005, 62, 355–362. [Google Scholar] [CrossRef] [PubMed]
- Al-Jallad, F.; Rodrigues, C.; Al-Thani, H. Ambient Levels of TSP, PM10, PM2.5 and Particle Number Concentration in Al Samha, UAE. J. Environ. Prot. 2017, 8, 1002–1017. [Google Scholar] [CrossRef]
- Li, Y.; Chen, Q.; Zhao, H.; Wang, L.; Tao, R. Variations in PM10, PM2.5 and PM1.0 in an Urban Area of the Sichuan Basin and Their Relation to Meteorological Factors. Atmosphere 2015, 6, 150–163. [Google Scholar] [CrossRef]
- Grana, M.; Toschi, N.; Vicentini, L.; Pietroiusti, A.; Magrini, A. Exposure to ultrafine particles in different transport modes in the city of Rome. Environ. Pollut. 2017, 228, 201–210. [Google Scholar] [CrossRef]
- Amaral, S.S.; De Carvalho, J.A., Jr.; Costa, M.A.M.; Pinheiro, C. An Overview of Particulate Matter Measurement Instruments. Atmosphere 2015, 6, 1327–1345. [Google Scholar] [CrossRef]
- Jandacka, D.; Durcanska, D. Seasonal Variation, Chemical Composition, and PMF-Derived Sources Identification of Traffic-Related PM1, PM2.5, and PM2.5–10 in the Air Quality Management Region of Žilina, Slovakia. Int. J. Environ. Res. Public Health 2021, 18, 10191. [Google Scholar] [CrossRef]
- Jain, S.; Sharma, S.K.; Mandal, T.K.; Saxena, M. Source apportionment of PM10 in Delhi, India using PCA/APCS, UNMIX and PMF. Particuology 2018, 37, 107–118. [Google Scholar] [CrossRef]
- Pant, P.; Harrison, R.M. Estimation of the contribution of road traffic emissions to particulate matter concentrations from field measurements: A review. Atmos. Environ. 2013, 77, 78–97. [Google Scholar] [CrossRef]
- Jandacka, D.; Durcanska, D. Differentiation of Particulate Matter Sources Based on the Chemical Composition of PM10 in Functional Urban Areas. Atmosphere 2019, 10, 583. [Google Scholar] [CrossRef]
- Soleimani, M.; Amini, N.; Sadeghian, B.; Wang, D.; Fang, L. Heavy metals and their source identification in particulate matter (PM2.5) in Isfahan City. Iran. J. Environ. Sci. 2018, 72, 166–175. [Google Scholar] [CrossRef] [PubMed]
- Sanda, M.; Onutu, I. Air pollution with compounds from refineries. Case study Petroleum-Gas University of Ploieşti, Romania. In Proceedings of the 4th International Colloquium Energy and Environmental Protection, Ploiesti, Romania, 4–6 November 2020. [Google Scholar]
- Khomenko, S.; Cirach, M.; Pereira-Barboza, E.; Mueller, N.; Barrera-Gómez, J.; Rojas-Rueda, D.; de Hoogh, K.; Hoek, G.; Nieuwenhuijsen, M. Premature mortality due to air pollution in European cities: A health impact assessment. Lancet Planet. Health 2021, 5, 121–134. [Google Scholar] [CrossRef] [PubMed]
- Bodor, K.; Szép, R.; Bodor, Z. Time series analysis of the air pollution around Ploiesti oil refining complex, one of the most polluted regions in Romania. Sci. Rep. 2022, 12, 11817. [Google Scholar] [CrossRef] [PubMed]
- Ceccato, P.; Ramirez, B.; Manyangadze, T.; Gwakisa, P.; Thomson, M.C. Data and tools to integrate climate and environmental information into public health. Infect. Dis. Poverty 2018, 7, 126. [Google Scholar] [CrossRef]
- Oprea, M.; Ianache, C.; Mihalache, S.F.; Dragomir, E.G.; Dunea, D.; Iordache, S.; Savu, T. On the development of an intelligent system for particulate matter air pollution monitoring, analysis and forecasting in urban regions. In Proceedings of the 19th International Conference on System Theory, Control and Computing (ICSTCC), Cheile Gradistei, Romania, 14–16 October 2015; pp. 711–716. [Google Scholar]
- Oprea, M.; Dunea, D. SBC-MEDIU: A multi-expert system for environmental diagnosis. Environ. Eng. Manag. J. 2010, 9, 205–213. [Google Scholar] [CrossRef]
Figure 1.
Map of Ploiesti city presenting the sampling points near the official monitoring stations from the Romanian national network (RNMCA)—https://calitateaer.ro/public/home-page/?__locale=en (accessed on 19 February 2023).
Figure 1.
Map of Ploiesti city presenting the sampling points near the official monitoring stations from the Romanian national network (RNMCA)—https://calitateaer.ro/public/home-page/?__locale=en (accessed on 19 February 2023).

Figure 2.
Timeline of COVID-19 2020 outbreak in Romania.

Figure 3.
Time series of the concentrations of the size-segregated mass fractions of particulate matter (μg m−3) recorded in Ploiesti in 2020 during various important moments that characterized the lockdown period compared to a typical day without/with PM significant load.
Figure 3.
Time series of the concentrations of the size-segregated mass fractions of particulate matter (μg m−3) recorded in Ploiesti in 2020 during various important moments that characterized the lockdown period compared to a typical day without/with PM significant load.

Figure 4.
Interpolation maps estimating the spatial distribution of the concentrations of various PM fractions (μg m−3) and particle number concentration (between 0.3 and 5 micron particles—particle number/cm3) in the morning for a day, characterized by a PM pollution episode (>30 μg m−3 PM2.5 24 h average) and based on the measurements performed with the particle counter during the monitoring campaigns.

Figure 5.
Aggregated PM10 time series, its moving average and trend line between 1 March and 30 June 2020, including the main lockdown period (between the orange lines) resulted from the data recorded by the automatic stations (LSPM10 Unitec optical analyzers) located in Ploiesti, and hourly temperature (°C) retrieved from the ERA 5 reanalysis dataset.


Table 1.
Particle number concentration assessment using the Lighthouse HH 3016 IAQ (averages of measurements performed between 8.00 and 11.00 a.m. in the locations of the monitoring stations)—particle number concentration PN/cm3 ∆ delta—differential (* the counting efficiency for the 0.3 microns is 50% according to the manufacturer); average temperature and precipitation during the day were retrieved from ERA 5 reanalysis dataset.
| Date | Event | 0.3 Microns * | 0.5 Microns | 1.0 Microns | 2.5 Microns | 5.0 Microns | 10.0 Microns | Average Temperature (°C) | Precipitations—Average of Day (mm) |
|---|---|---|---|---|---|---|---|---|---|
| 11 March 2020 | Schools were closed | 492,491.6 | 39,258.2 | 6300.4 | 1886.6 | 979.0 | 135.2 | 9.6 | 0.5 |
| 16 March 2020 | State of emergency was declared | 321,550.9 | 25,631.9 | 4113.6 | 1231.7 | 639.2 | 88.3 | 3.9 | 0 |
| 21 March 2020 | M.O.2 restricts mobility | 798,169.5 | 63,624.9 | 10,210.9 | 3057.5 | 1586.6 | 219.1 | 12.6 | 0 |
| 22 March 2020 | First day after M.O.2 | 244,498.5 | 19,489.8 | 3127.8 | 936.6 | 486.0 | 67.1 | 14.1 | 1.3 |
| 24 March 2020 | M.O.3—restriction of citizens’ movement | 217,043.3 | 17,301.3 | 2776.6 | 831.4 | 431.4 | 59.6 | 1.6 | 2.8 |
| 25 March 2020 | First day after M.O.3 | 335,847.8 | 26,771.6 | 4296.5 | 1286.5 | 667.6 | 92.2 | 1.9 | 0.5 |
| 12 April 2020 | Catholic Easter | 407,654.2 | 32,495.5 | 5215.1 | 1561.6 | 810.3 | 111.9 | 12.5 | 0 |
| 19 April 2020 | Orthodox Easter | 292,766.7 | 23,337.4 | 3745.3 | 1121.5 | 581.9 | 80.4 | 15.9 | 2.4 |
| 15 May 2020 | State of Alert replaces the State of Emergency | 473,894.9 | 37,775.8 | 6062.5 | 1815.3 | 942.0 | 130.1 | 20.6 | 0 |
| 16 May 2020 | First day after the State of Alert | 520,882.7 | 41,521.4 | 6663.6 | 1995.3 | 1035.4 | 143.0 | 18.8 | 0.4 |
| 15 June 2020 | Two weeks after the lifting of transportation restrictions | 582,058.2 | 46,397.9 | 7446.2 | 2229.7 | 1157.0 | 159.8 | 21.7 | 4.9 |
| 27 November 2020 | Day with common concentrations (<15 μg m−3 PM2.5 24 h average) | 1,255,087.1 | 100,047.3 | 16,056.2 | 4807.8 | 2494.8 | 344.6 | 0.5 | 0 |
| 14 February 2022 | Day with high PM concentrations (>30 μg m−3 PM2.5 24 h average) | 4,661,690 | 364,031 | 54,191 | 12,053 | 3928 | 337 | 6.3 | 0 |
Table 2.
Descriptive statistics of the PM10 concentrations (μg m−3) recorded at the 4 automatic stations during 2 periods i.e., 1 March–30 June 2020 and 24 March–15 May 2020 (lockdown).
Table 2.
Descriptive statistics of the PM10 concentrations (μg m−3) recorded at the 4 automatic stations during 2 periods i.e., 1 March–30 June 2020 and 24 March–15 May 2020 (lockdown).
| Station | Position | % Valid obs. | Mean | Geometric | Median | Minimum | Maximum | Std. Dev. | Coef. Var. | Skewness | Kurtosis |
|---|---|---|---|---|---|---|---|---|---|---|---|
| 1 March 2020–30 June 2020 | |||||||||||
| PH-1 | West | 100 | 16.78 | 15.52 | 15.39 | 5.00 | 69.41 | 6.97 | 41.53 | 1.48 | 4.18 |
| PH-2 | Center | 94.8 | 17.03 | 15.46 | 16.29 | 3.24 | 82.33 | 7.35 | 43.14 | 0.97 | 3.28 |
| PH-5 | Southeast | 97.0 | 16.90 | 15.64 | 15.67 | 5.32 | 73.63 | 7.02 | 41.55 | 1.53 | 4.56 |
| PH-6 | East | 73.4 | 16.09 | 13.98 | 15.52 | 1.00 | 44.61 | 7.54 | 46.88 | 0.34 | −0.20 |
| Aggregated | - | 91.3 | 16.70 | 15.15 | 15.72 | 3.64 | 67.50 | 7.22 | 43.28 | 1.08 | 2.95 |
| 24 March 2020–15 May 2020 (lockdown) | |||||||||||
| PH-1 | West | 100 | 16.31 | 15.29 | 15.14 | 6.27 | 69.41 | 6.23 | 38.18 | 1.56 | 6.21 |
| PH-2 | Center | 95.6 | 15.97 | 14.39 | 14.64 | 4.14 | 82.33 | 7.50 | 46.99 | 1.57 | 7.09 |
| PH-5 | Southeast | 100 | 16.42 | 15.45 | 15.38 | 5.63 | 59.50 | 6.01 | 36.58 | 1.32 | 3.71 |
| PH-6 | East | 83.9 | 11.39 | 9.75 | 10.71 | 1.00 | 36.04 | 6.00 | 52.70 | 0.85 | 0.91 |
| Aggregated | - | 94.9 | 15.02 | 13.72 | 13.97 | 4.26 | 61.82 | 6.44 | 43.61 | 1.33 | 4.48 |
Disclaimer/Publisher’s Note: The statements, opinions and data contained in all publications are solely those of the individual author(s) and contributor(s) and not of MDPI and/or the editor(s). MDPI and/or the editor(s) disclaim responsibility for any injury to people or property resulting from any ideas, methods, instructions or products referred to in the content. |
© 2023 by the authors. Licensee MDPI, Basel, Switzerland. This article is an open access article distributed under the terms and conditions of the Creative Commons Attribution (CC BY) license (https://creativecommons.org/licenses/by/4.0/).
Share and Cite
MDPI and ACS Style
Sanda, M.; Dunea, D.; Iordache, S.; Predescu, L.; Predescu, M.; Pohoata, A.; Onutu, I. Recent Urban Issues Related to Particulate Matter in Ploiesti City, Romania. Atmosphere 2023, 14, 746. https://doi.org/10.3390/atmos14040746
AMA Style
Sanda M, Dunea D, Iordache S, Predescu L, Predescu M, Pohoata A, Onutu I. Recent Urban Issues Related to Particulate Matter in Ploiesti City, Romania. Atmosphere. 2023; 14(4):746. https://doi.org/10.3390/atmos14040746
Chicago/Turabian StyleSanda, Mia, Daniel Dunea, Stefania Iordache, Laurentiu Predescu, Mirela Predescu, Alin Pohoata, and Ion Onutu. 2023. "Recent Urban Issues Related to Particulate Matter in Ploiesti City, Romania" Atmosphere 14, no. 4: 746. https://doi.org/10.3390/atmos14040746
Note that from the first issue of 2016, this journal uses article numbers instead of page numbers. See further details here.