Article

A Study of Elemental Composition and Risk Assessment Due to Exposure to Indoor PM10 in Two Residences in Mexico City

by
Salvador Reynoso-Cruces
,
Javier Miranda-Martín-del-Campo
* and
Juan Carlos Pineda-Santamaría
Departamento de Física Nuclear y Aplicaciones de la Radiación, Instituto de Física, Universidad Nacional Autónoma de México, Circuito Investigación Científica S/N, Ciudad Universitaria, Coyoacán, Ciudad de México 04510, Mexico
*
Author to whom correspondence should be addressed.
Atmosphere 2023, 14(4), 734; https://doi.org/10.3390/atmos14040734
Submission received: 28 March 2023 / Revised: 16 April 2023 / Accepted: 17 April 2023 / Published: 19 April 2023
(This article belongs to the Special Issue Indoor Air Quality and Health Risk)

Abstract

:
Samples of airborne particles with aerodynamic diameters smaller than 10 µm (PM10) were collected in 2021 at two households in the Metropolitan Area of Mexico City. Both sites are in areas with different characteristics (residential or industrial zones). Simultaneous sampling indoors and outdoors was carried out at the two locations, using low-volume samplers. The study aimed to determine the indoor and outdoor gravimetric mass and elemental concentrations, identify emitting sources and possible penetration towards the households enhanced by natural ventilation, and assess risks to human health due to inhalation, ingestion, and dermal absorption, through hazard quotients. Al, Si, P, S, Cl, K, Ca, Ti, V, Cr, Mn, Fe, Ni, Cu, Zn, Br, Se, and Pb concentrations were measured with X-ray fluorescence. Mass concentrations were higher indoors than outdoors, and most elemental concentrations had similar values in both environments. Cluster analysis was applied to identify possible emitting sources. The results showed a strong penetration of geogenic and industrial emissions at the Iztapalapa site, while only particles of industrial origin entered the interior of the Tlalnepantla dwelling, in both cases caused by the natural ventilation of the households. Health risks due to exposure to particles containing Fe, Ni, Cu, Zn, and Mn are not significant, and Pb and Cr only pose a risk via ingestion for men and women, although for children, there is a risk due to ingestion of all these elements.

1. Introduction

In the last decades, people have spent more time in closed environments than outdoors, up to 90% [1]. This situation has intensified since 2020 because of the COVID-19 pandemic, becoming up to 100% in several places, and altered behavioral, learning, and eating habits, among other effects [2]. However, the air quality in homes worldwide attracted interest much earlier [3,4,5,6,7,8]. Among other pollutants, particulate matter (PM) is very important, especially respirable particles, such as those with an aerodynamic diameter smaller than 10 µm (PM10) and 2.5 µm (PM2.5), as they can reach the upper respiratory tract and the lungs, respectively [9]. A review of the origin, composition, and health effects of PM in households was recently published by Zhang et al. [10]. Langer et al. [11] analyzed the relationship between indoor air quality and building design. McCormack et al. [12] studied the effect of daily activities on indoor particulate matter concentrations. Kwan et al. [13] observed the presence of fungi and bacteria in North American houses. The seasonal variations in indoor and outdoor aerosol concentrations were studied by Massey et al. [14]. All these works emphasize the necessity of carrying out studies to determine the mass concentration and composition and assess the risk due to exposure to PM10 and PM2.5 in indoor environments.
An important factor influencing the concentration of indoor pollutants in households is ventilation, which can occur as mechanical ventilation, natural ventilation, and infiltration [15,16]. While mechanical ventilation can be carried out with air conditioning systems or fans, natural ventilation occurs through windows and doors. Infiltration means an uncontrolled flow of air through leaks in the household walls or roofs [16]. All of them allow an exchange of indoor/outdoor air, including chemical species produced either inside the households or by external sources [10]. Thus, meteorological variables, such as weather, wind velocity, temperature, humidity, and solar radiation, may influence indoor PM10 concentrations, composition, and secondary aerosol formation [17,18]. In particular, several authors have demonstrated that natural ventilation may reduce the risk of health effects, such as asthma in children [19] and chronic obstructive pulmonary disease [20].
It has been found that certain elements present in PM10 may have effects on human health. For example, Rosas-Pérez et al. [21] demonstrated (through in vitro experiments) that the cytotoxicity of airborne particles is linked to the combination of the elements S, K, Ca, Ti, Fe, Mn, Zn, and Pb, while the protein p53 expression, related to the development of cancer, is affected by high concentrations of industrial emissions containing Cl, Cr, Ni, and Cu. Moreover, exposure to Mn may induce motor alterations [22]. The oxidative potential of the particles was found to correlate with the Cu/Zn content [23]. In contrast, the presence of geogenic elements, such as Al and Si, has not been correlated with any health risks. Therefore, determining the elemental concentrations in airborne particles is necessary to assess possible health risks.
In Mexico, very little investigation has been performed about indoor air quality. Báez and coworkers measured concentrations of carbonyl in several closed environments, such as homes and office buildings [24,25]; Tovalín-Ahumada et al. [26] determined the exposure of workers both in outdoor and indoor environments; Zuk et al. [27] and Carabalí et al. [28] carried out extensive studies related to the emissions of wood stoves in rural houses; Reynoso-Cruces et al. [29] published a paper about the elemental composition of PM10 and PM2.5 in an electrostatic particle laboratory, including a risk assessment.
With this in mind, the present work aimed to measure mass and elemental concentrations of PM10 at two households in the Metropolitan Area of Mexico City (MAMC), comparing outdoor and indoor values from samples collected simultaneously. X-ray fluorescence (XRF) was used for the elemental analyses. Using these results, it should be possible to find out if the airborne particles were produced inside the houses or were transported from the outer environment. Moreover, a risk assessment is presented for the inhalation, ingestion, and dermal absorption of several elements. It is necessary to emphasize that the analysis of PM10 is more convenient in the present kind of studies than only PM2.5 because ingestion and dermal absorption are also considered, not only inhalation.

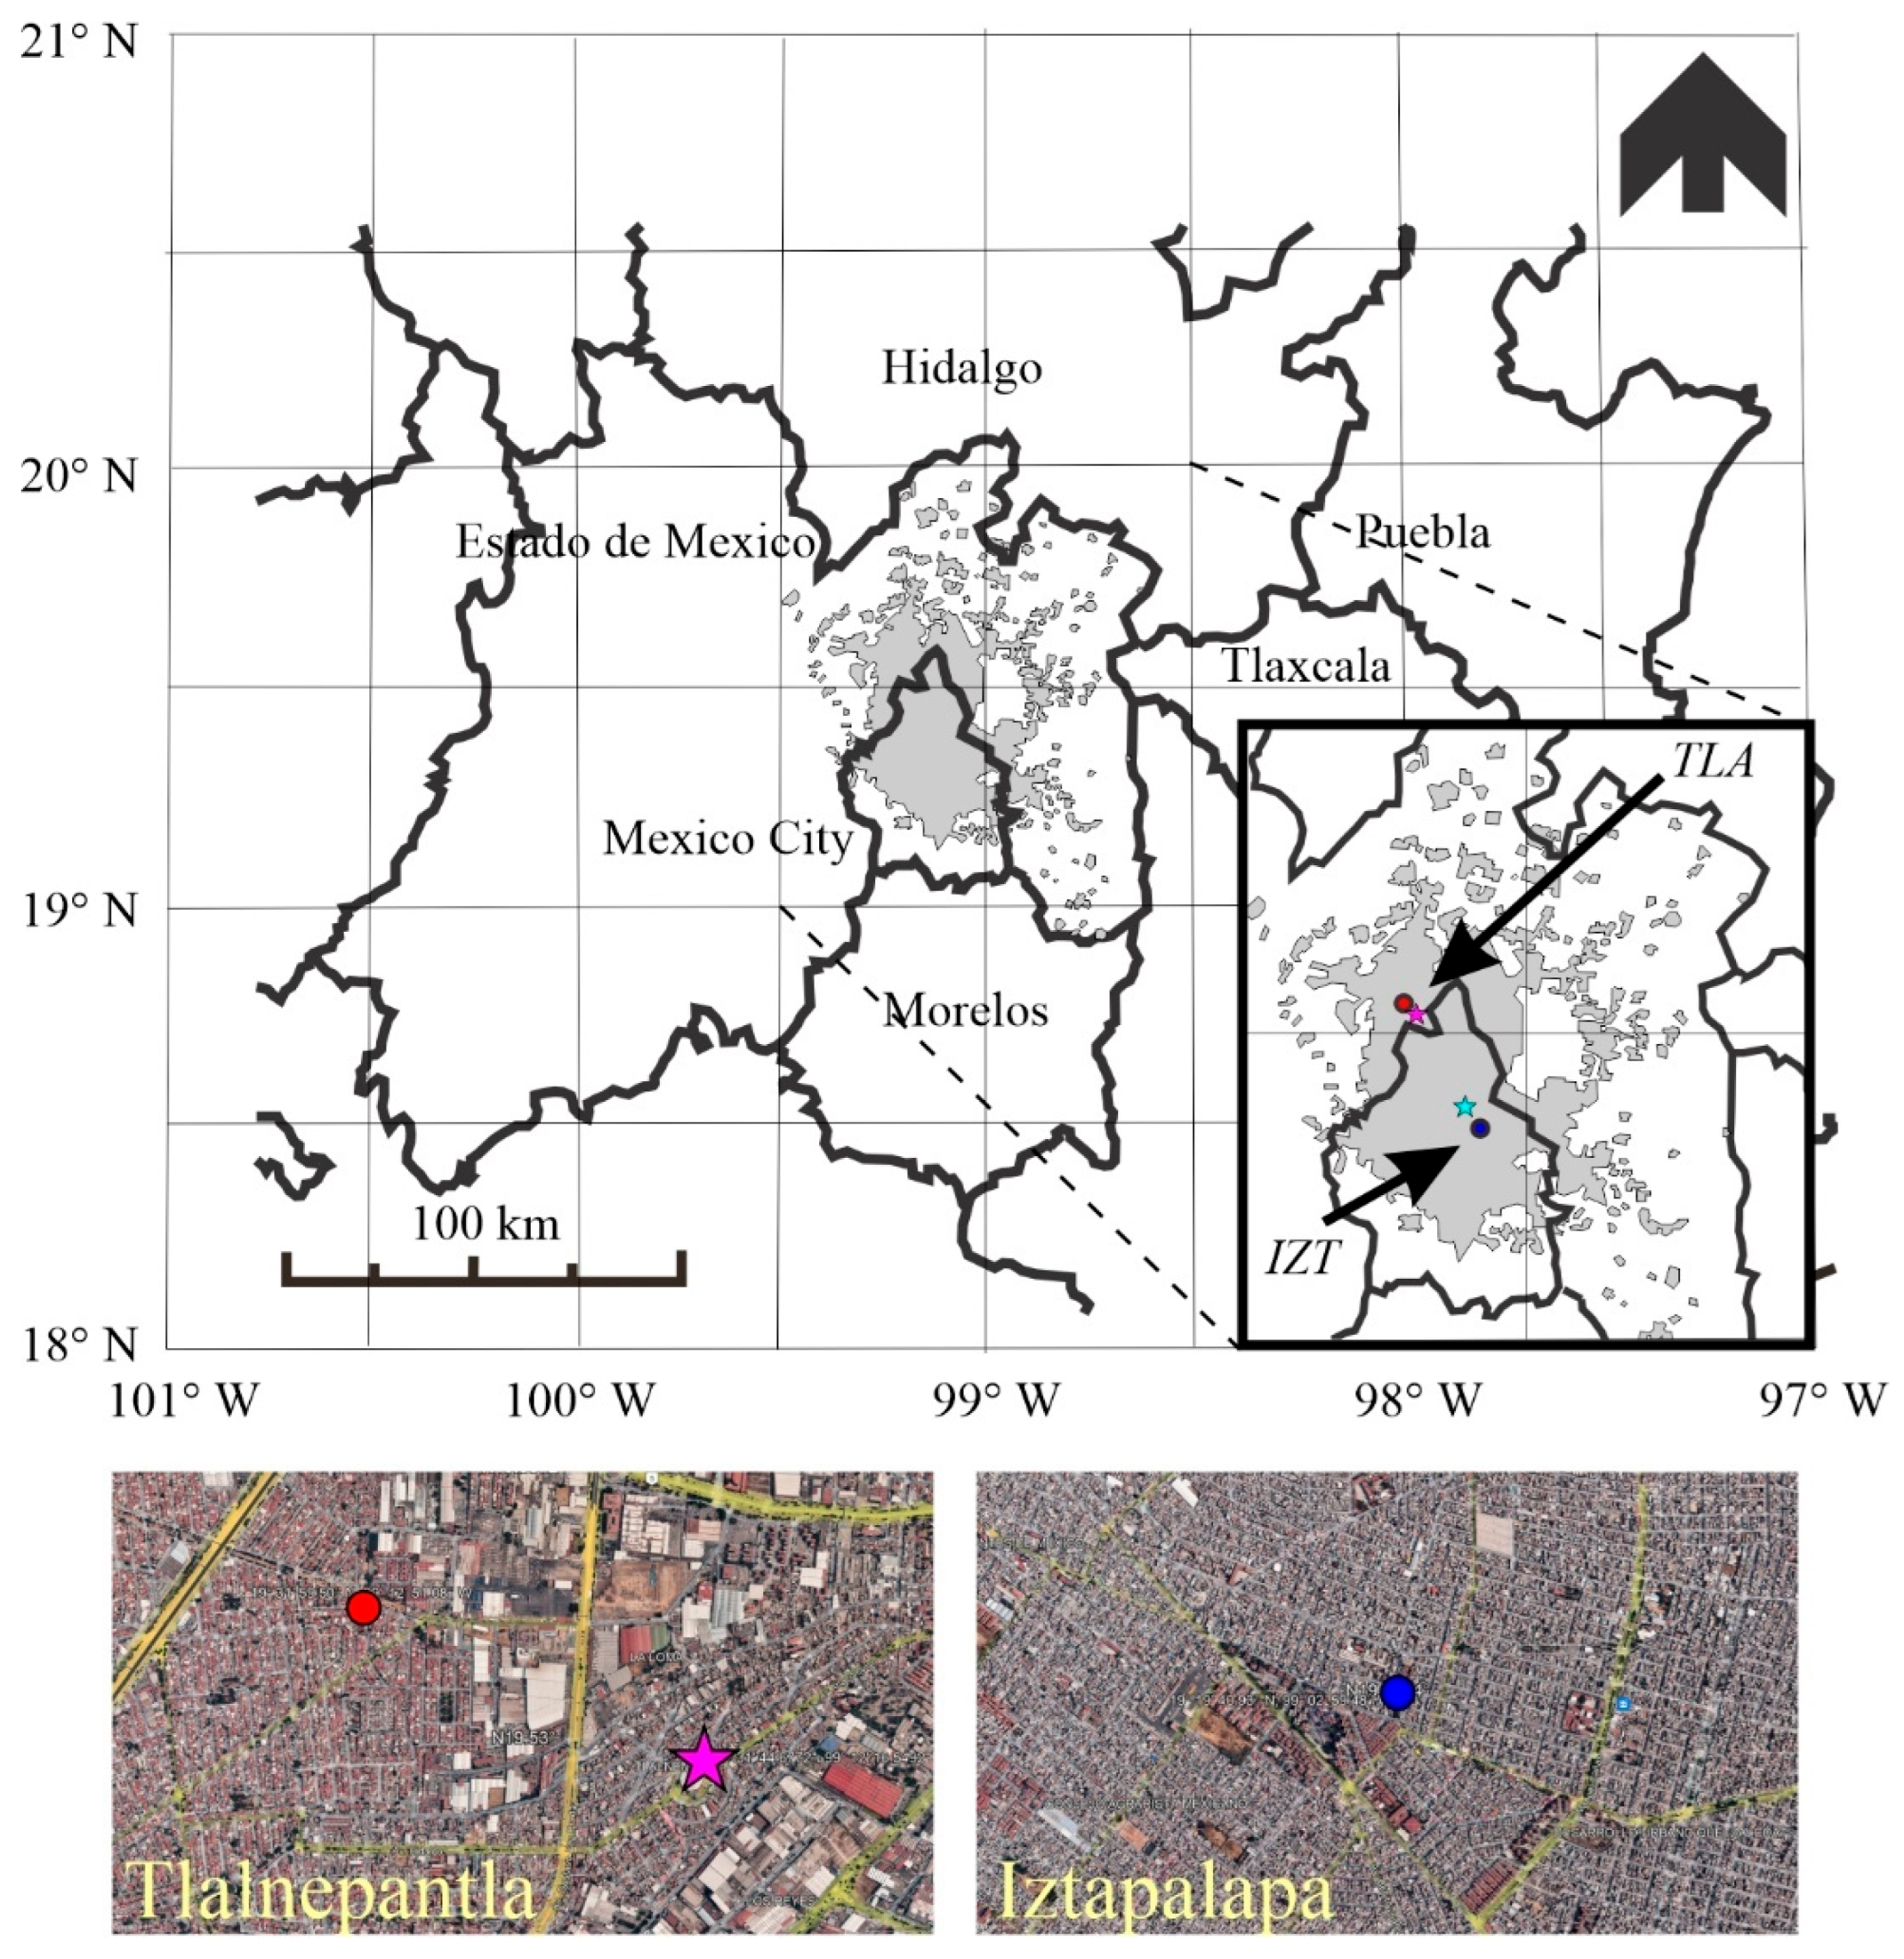
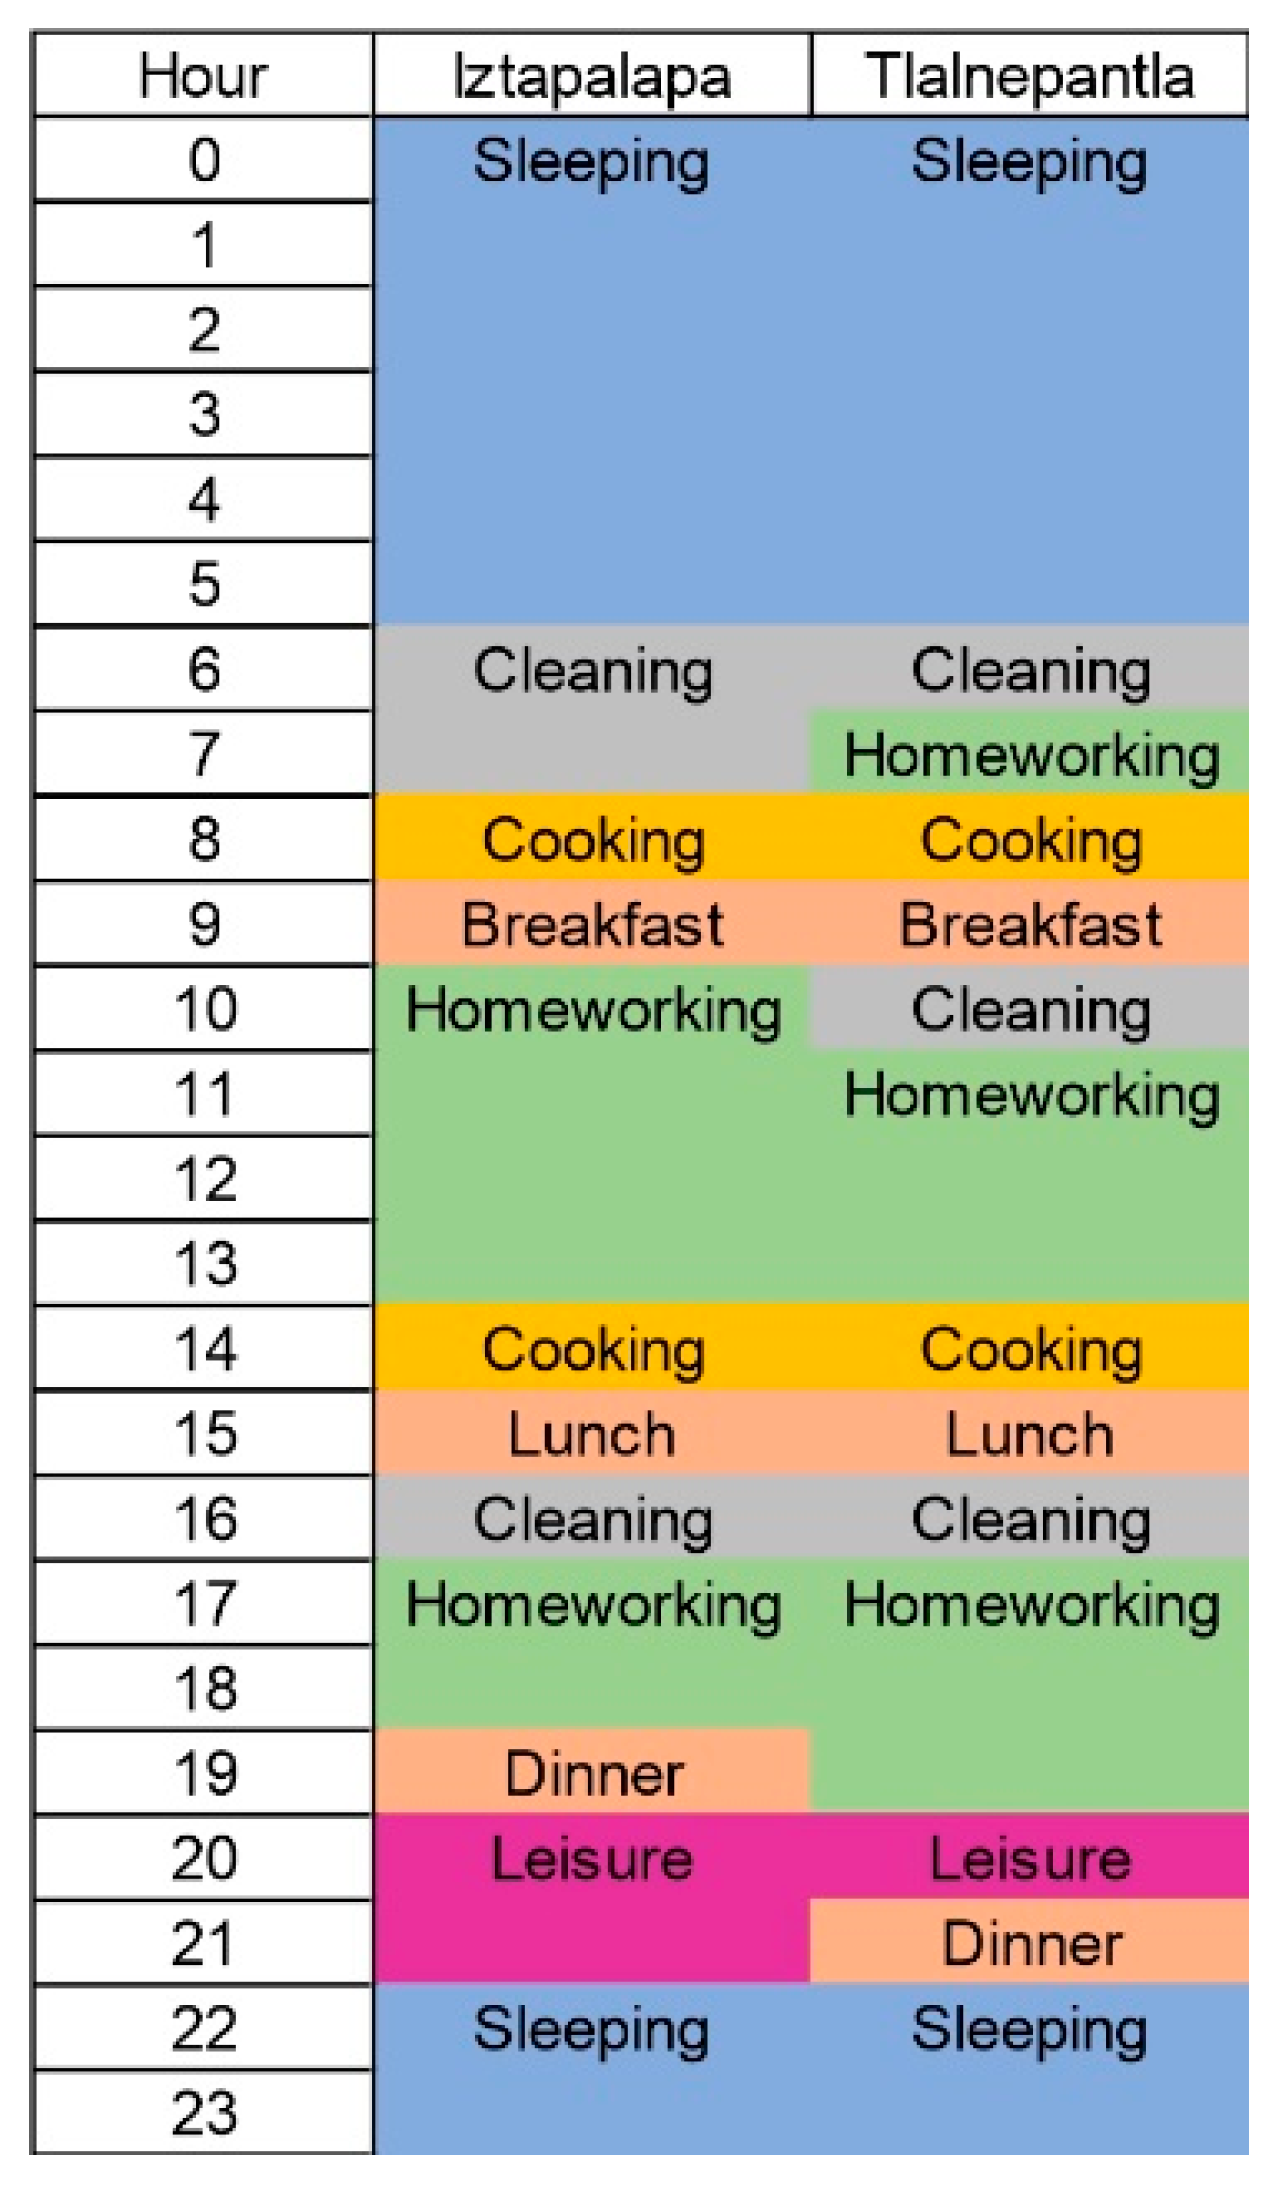
2. Materials and Methods

2.1. Sampling and Analysis

Samples of PM10 were collected using portable MiniVol TAS 5.0 air samplers (Airmetrics, USA), which operate at an air flux of 5 L min−1, on 47 mm polycarbonate filters with 0.4 µm pore size (Whatman, Florham Park, NJ, USA). The filters were pre- and post-weighed with a GA200D Ohaus electrobalance (resolution: 10 µg).
The sample sites were located at two households in different regions of the MAMC: Iztapalapa, in the eastern part, and Tlalnepantla, in the northwestern area. Figure 1 presents further details of the locations, while Table 1 describes characteristics of the residences, habits of the inhabitants, traffic in nearby avenues, and other possible contributing point sources next to the sites. As seen in Figure 1, the Tlalnepantla site is located between a residential and a heavily industrialized area, and the Iztapalapa site lies in the middle of a residential area. Both dwellings have natural ventilation; windows and doors were built in compliance with the Mexican official standard [30]. In addition, Figure 2 displays the typical activity schedule in each household from Monday to Friday; during weekends, the homeworking activities did not occur, being replaced by cleaning or leisure.
The MiniVol samplers were placed inside the living room of each residence and on the rooftop to carry out simultaneous indoor and outdoor sampling. The campaigns took place from 31 May to 2 August 2021, with a pause from July 6 to 19 (Iztapalapa) and from 9 August to 29 September 2021 (Tlalnepantla), exposing the filters during 23 h 50 min, from 8:00 h of the starting day until 7:50 h of the next day. The campaigns occurred during the rainy season of the MAMC [31].
In Iztapalapa, the sampler was placed in the middle of the house’s first floor, on a concrete column, at 1.3 m from the nearest window and 1.6 m in height. Outside, the sampler was placed 1.6 m above the roof of the house and approximately 9 m from street level; the household is located 1 km away from tall buildings. In the Tlalnepantla household, the sampler was in the middle of the living room, at 1.6 m in height. Regarding the outdoor sampling, the device was placed 1.6 m above the roof and nearly 5 m above ground level. The site is at least 350 m away from tall buildings and 450 m from heavy-traffic avenues.
Elemental analysis was performed with XRF, employing the spectrometer built at the Instituto de Física, Universidad Nacional Autónoma de México, operated at the Laboratorio de Aerosoles [32,33]. This analysis is based on an X-ray tube with Rh anode (Oxford Instruments, Mountain View, CA, USA), operated at 50 keV and 750 µA, and an Amptek 123-FastSDD spectrometer with a resolution of 120 eV at 5.9 keV. The filters were irradiated at a high vacuum (10−4 Pa). The XRF spectra were collected for 900 s and then integrated with the quantitative X-ray analysis system (QXAS) [34]. The experimental uncertainties were evaluated as explained by Espinosa et al. [35].
The detection system efficiency was determined with thin film standards (MicroMatter Co., Vancouver, BC, Canada), irradiating each one in triplicate for 300 s under the same operating conditions as those used for the filters. Moreover, the accuracy verification was achieved through the analysis of the NIST standard reference material 2783, Air Particulate on Filter Media; the results can be found in the works by Mejía-Ponce et al. [36] and Hernández-López et al. [37].
Also, meteorological data (wind speed and direction and relative humidity) and PM10 gravimetric mass concentrations were obtained from the “Red Automática de Monitoreo Atmosférico” (RAMA, its acronym in Spanish) website [38]. The stations were chosen according to the closeness to their sampling sites: for Iztapalapa, the UAM station (located at 4.4 km west of the site), while for the second site, data from Tlalnepantla (TLA) station were used (1.5 km southeast of the sampling site), as displayed in Figure 1.

2.2. Statistical Analysis

The Shapiro–Wilk test for normality was applied to each measured variable (mass and elemental concentrations) at a p = 0.05 significance level. In case the distributions were not normal, the non-parametric Kolmogorov–Smirnov test was employed to determine if the means or medians for each variable were significantly different, using the same significance level. The Keiser–Meyer–Olkin (KMO) and Bartlett’s sphericity tests were applied to the datasets to determine if they were suitable for principal component analysis (PCA). Additionally, cluster analysis (CA), based on Ward’s method of amalgamation and Pearson’s correlation coefficients, was employed to identify possible sources of the detected elements. All the statistical tests were carried out with the Stata® 15 package (StataCorp., College Station, TX, USA).

2.3. Health Risk Assessment

As an indicator of the health risk caused by elements in PM10 that may be enriched indoors, the hazard quotient (HQ) was evaluated for men, women, and children. A useful guide to applying this quantity is the US EPA criteria [39], which state that if HQ < 1, non-cancerous effects are not highly probable. In case HQ ≥ 1, adverse health effects might occur. Similarly, if HQ > 10, there is a high chronic risk to human health. Furthermore, the US EPA determines a tolerable risk limit between 1 × 10⁻⁴ and 1 × 10⁻⁶ [39].
According to Embiale et al. [40], HQ can be calculated using the following equations:
D i n h = C × I n h R × E D × E F B W × A T
D i n g = C × I n g R × E D × E F B W × A T × 10 6
D d e r = C × A F × S A × A B S × E D × E F B W × A T × 10 6
H Q = D R f D
Here, C is the elemental concentration (mg m−3); ED represents the exposure duration (years); Dinh gives daily doses, Ding and Dder, for inhalation, ingestion, and dermal absorption (mg kg−1 d−1), respectively; InhR corresponds to the inhalation rate (m3 d−1); EF denotes the exposure frequency (d year−1); BW is the body weight (kg); AT symbolizes the averaging time (years); IngR is the ingestion rate(mg d−1); AF represents the skin adherence factor (mg cm−2 d−1); ABS indicates the dermal absorption factor (dimensionless); SA is the skin surface area of an average man or woman (cm2); RfD is the reference dose corresponding to each intake path (mg kg−1 d−1), used to approximate the upper limit for determining if the daily exposure has a low probability of presenting adverse health effects.
In the present study, InhR takes different values for children (7.6 m−3 d−1), women (11.2 m−3 d−1), and men (15.3 m−3 d−1) [19,28]. The data were extrapolated from the sampling periods, which lasted nearly two months to one year. During the lockdown due to the COVID-19 pandemic, people spent virtually all their time indoors. Thus, EF = 1 d y−1 and ED = 1 y. Average body weight for children is taken as 15 kg, 60 kg for women, and 70 kg for men [39], AT = 365 d, for extrapolating to one year, while IngR = 100 mg d−1; SA is equal to 2011 cm2 for men, 1694 cm2 for women, and 1078 cm2 for children [40], and ABS = 0.01. Finally, RfD takes different values for each element.

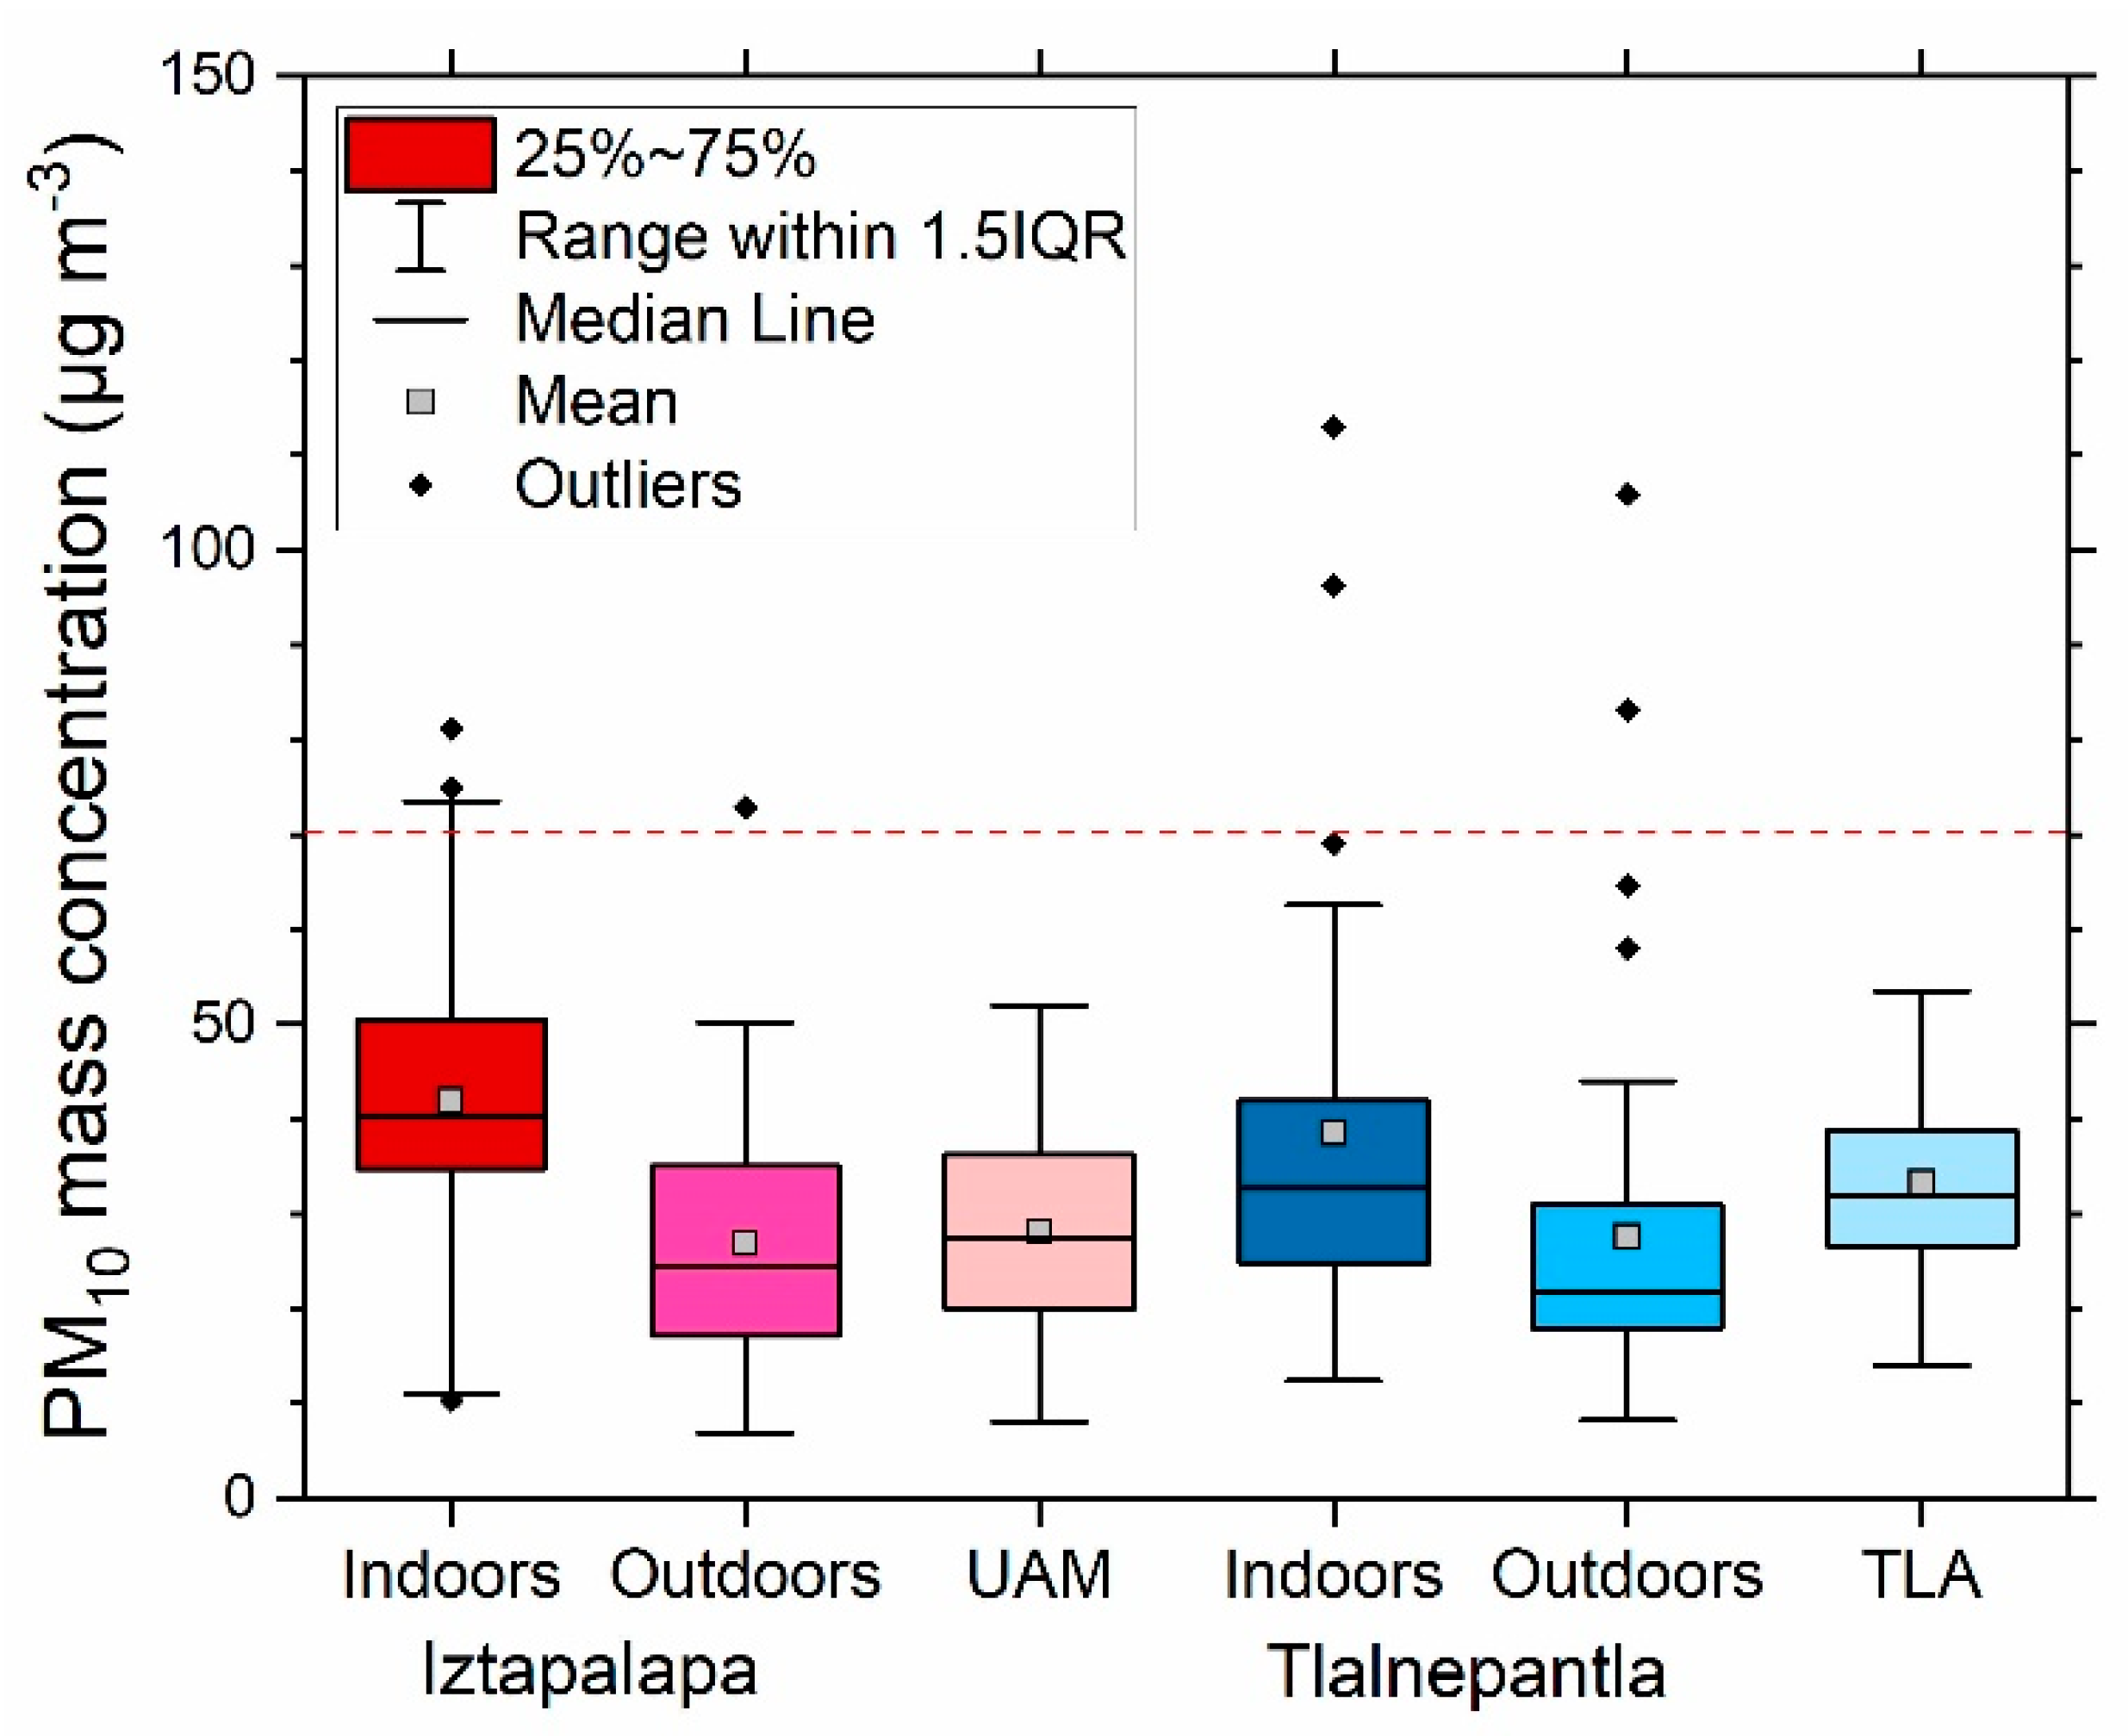
3. Results and Discussion

3.1. Gravimetric Mass

A total of 96 samples (48 indoors and 48 outdoors) were collected at the Iztapalapa site, and 100 samples at the Tlalnepantla site (50 each, indoors and outdoors). As a first result, the mass concentration measured at the sampling sites outdoors was compared with the data from the RAMA stations, measured simultaneously. Pearson’s correlation coefficient r for the first site was 0.730, and for the latter sampling site was 0.510; both are highly significant, as the probability that the gravimetric mass concentrations were not correlated was less than 1 [41].
In addition, the mean gravimetric mass concentrations measured at both sites (indoors and outdoors) are presented in Table 2. The Shapiro–Wilk test showed that the distributions were not normal, so the Kolmogorov–Smirnov test was employed to compare the mean gravimetric mass for each case. Figure 3 presents the corresponding Tukey diagrams: the means for the outdoor sampling and RAMA data in both sites are equal (that is, the null hypothesis of equal means is not discarded); on the contrary, the means of the indoor samplings are significantly higher. This result indicates that, even when considering the possibility of penetration from the exterior towards the households by natural ventilation, certain indoor activities contributed importantly, so the PM10 concentrations are higher. The explanation of these differences was attained through elemental analyses. Additionally, in Figure 3, the Mexican official standard for a PM10 24 h average (70 µg m−3) is included, demonstrating that it was exceeded only on a few occasions during the entire study.

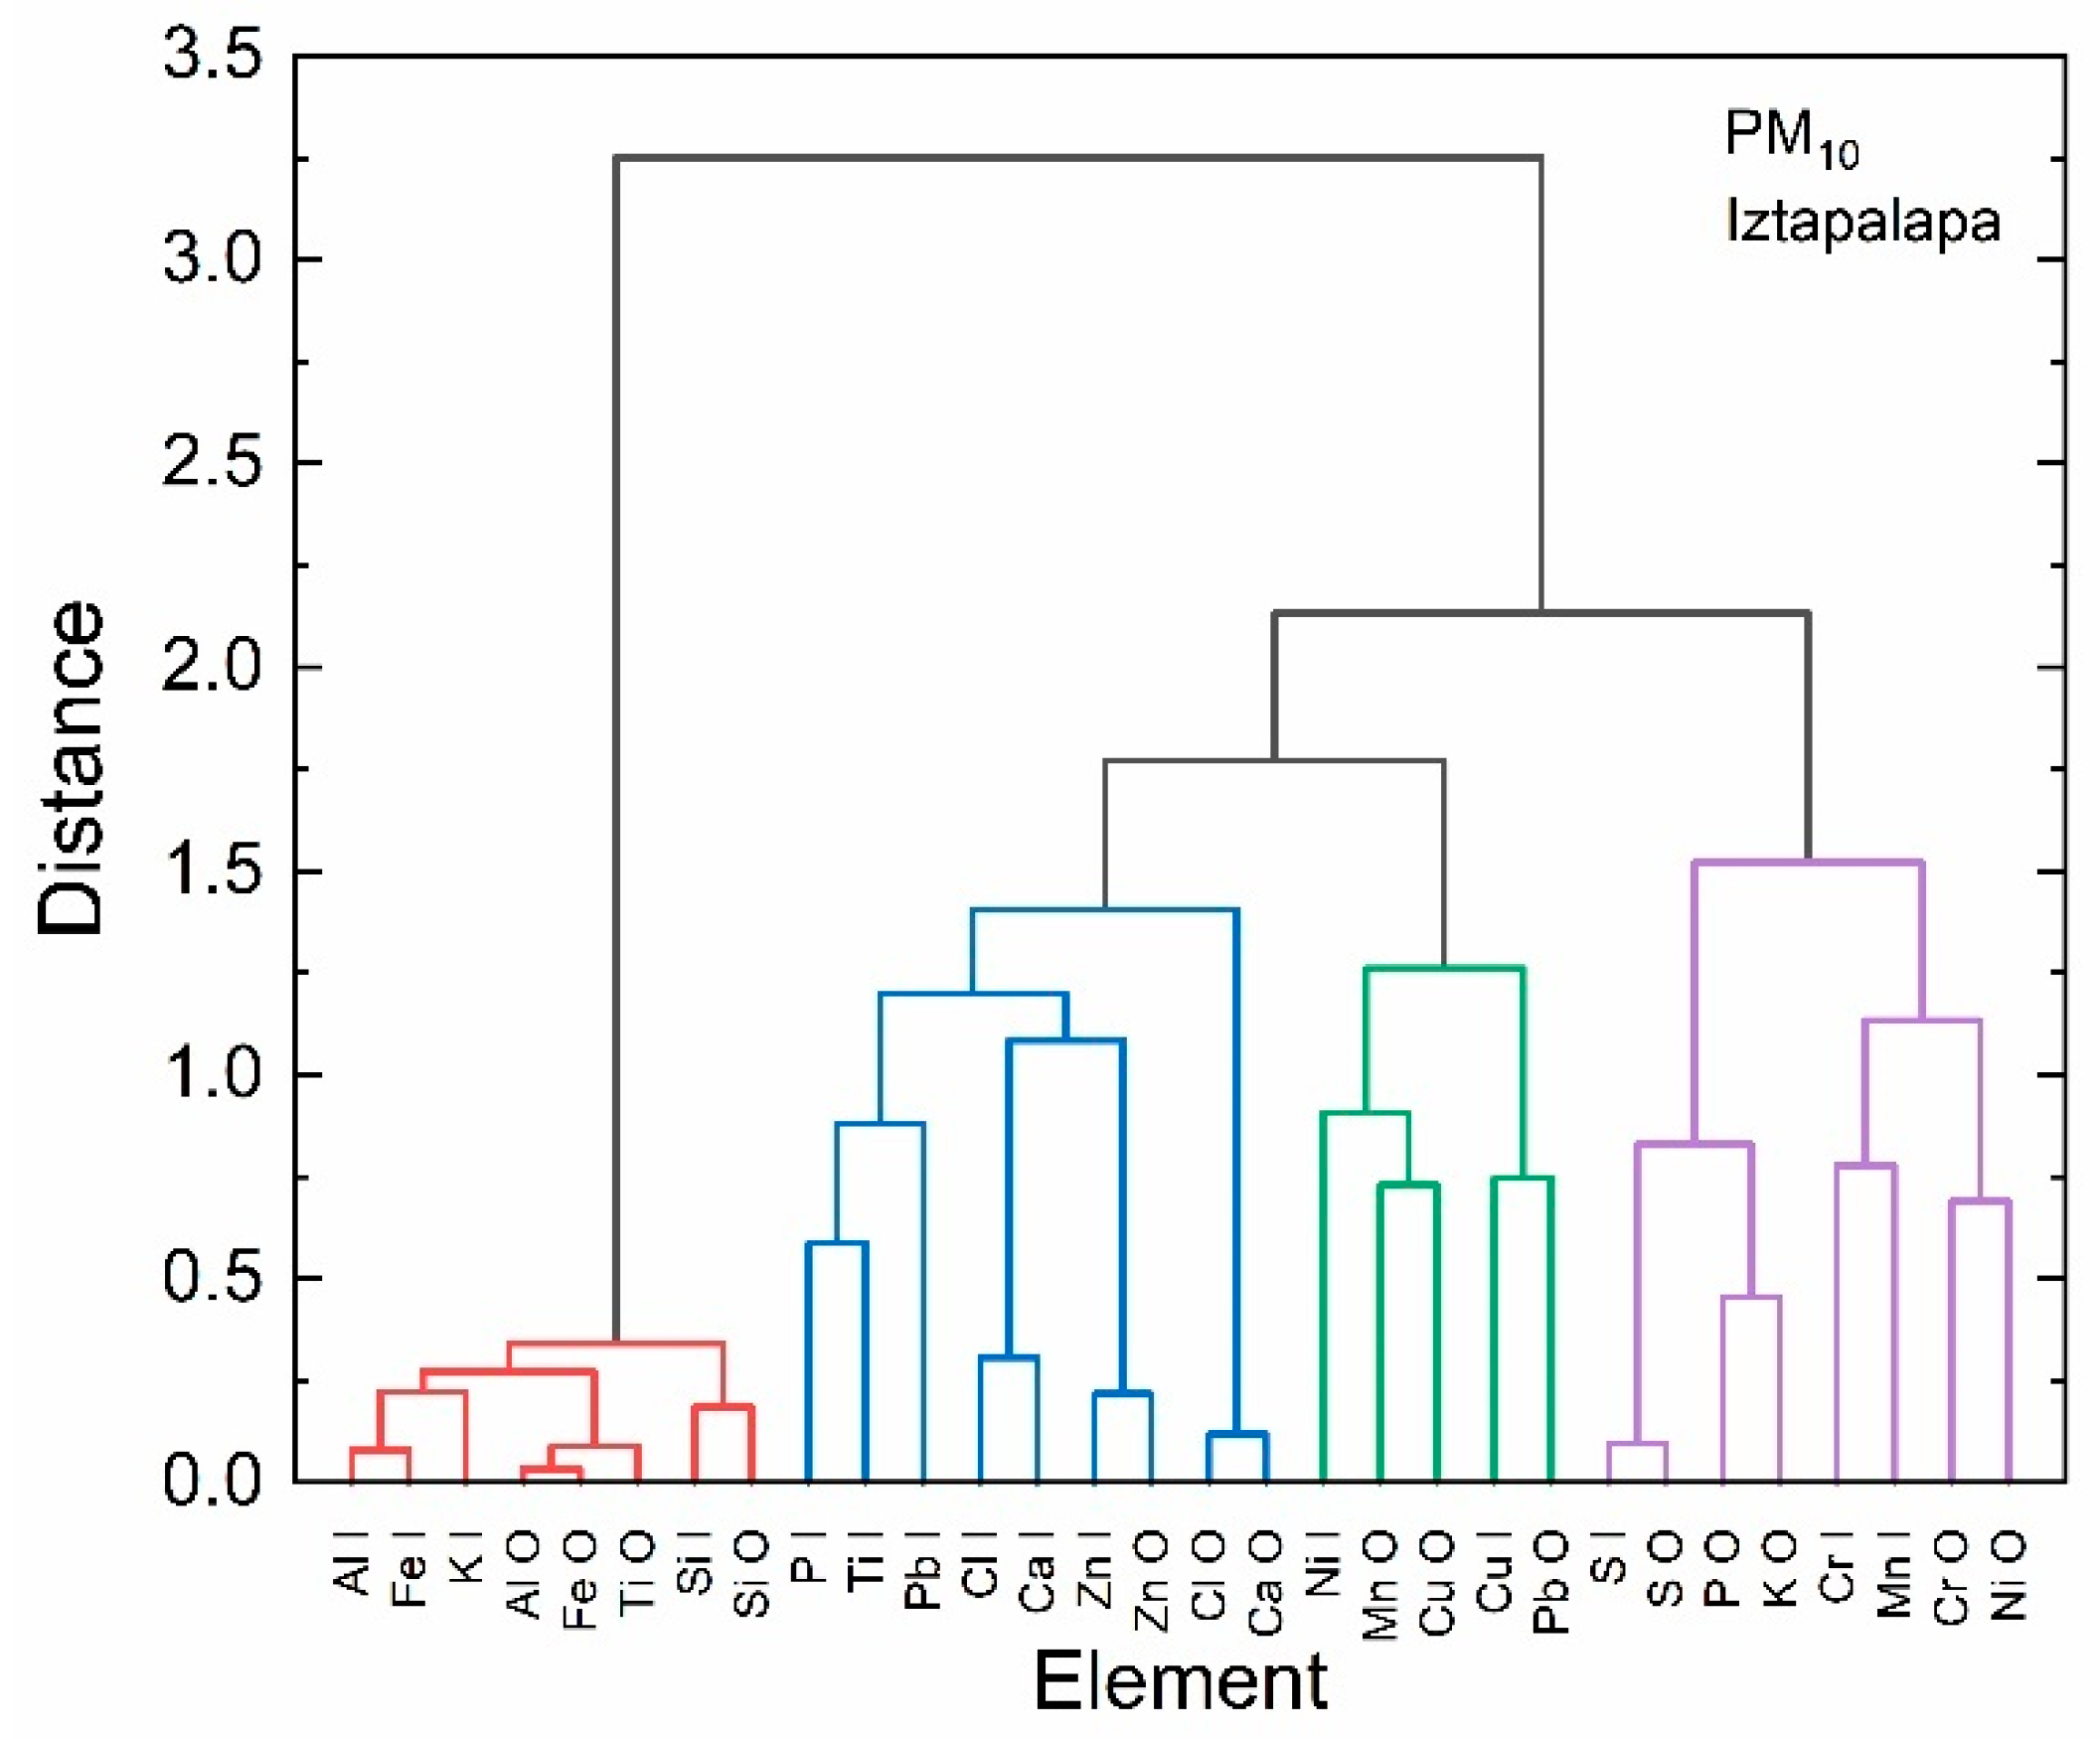
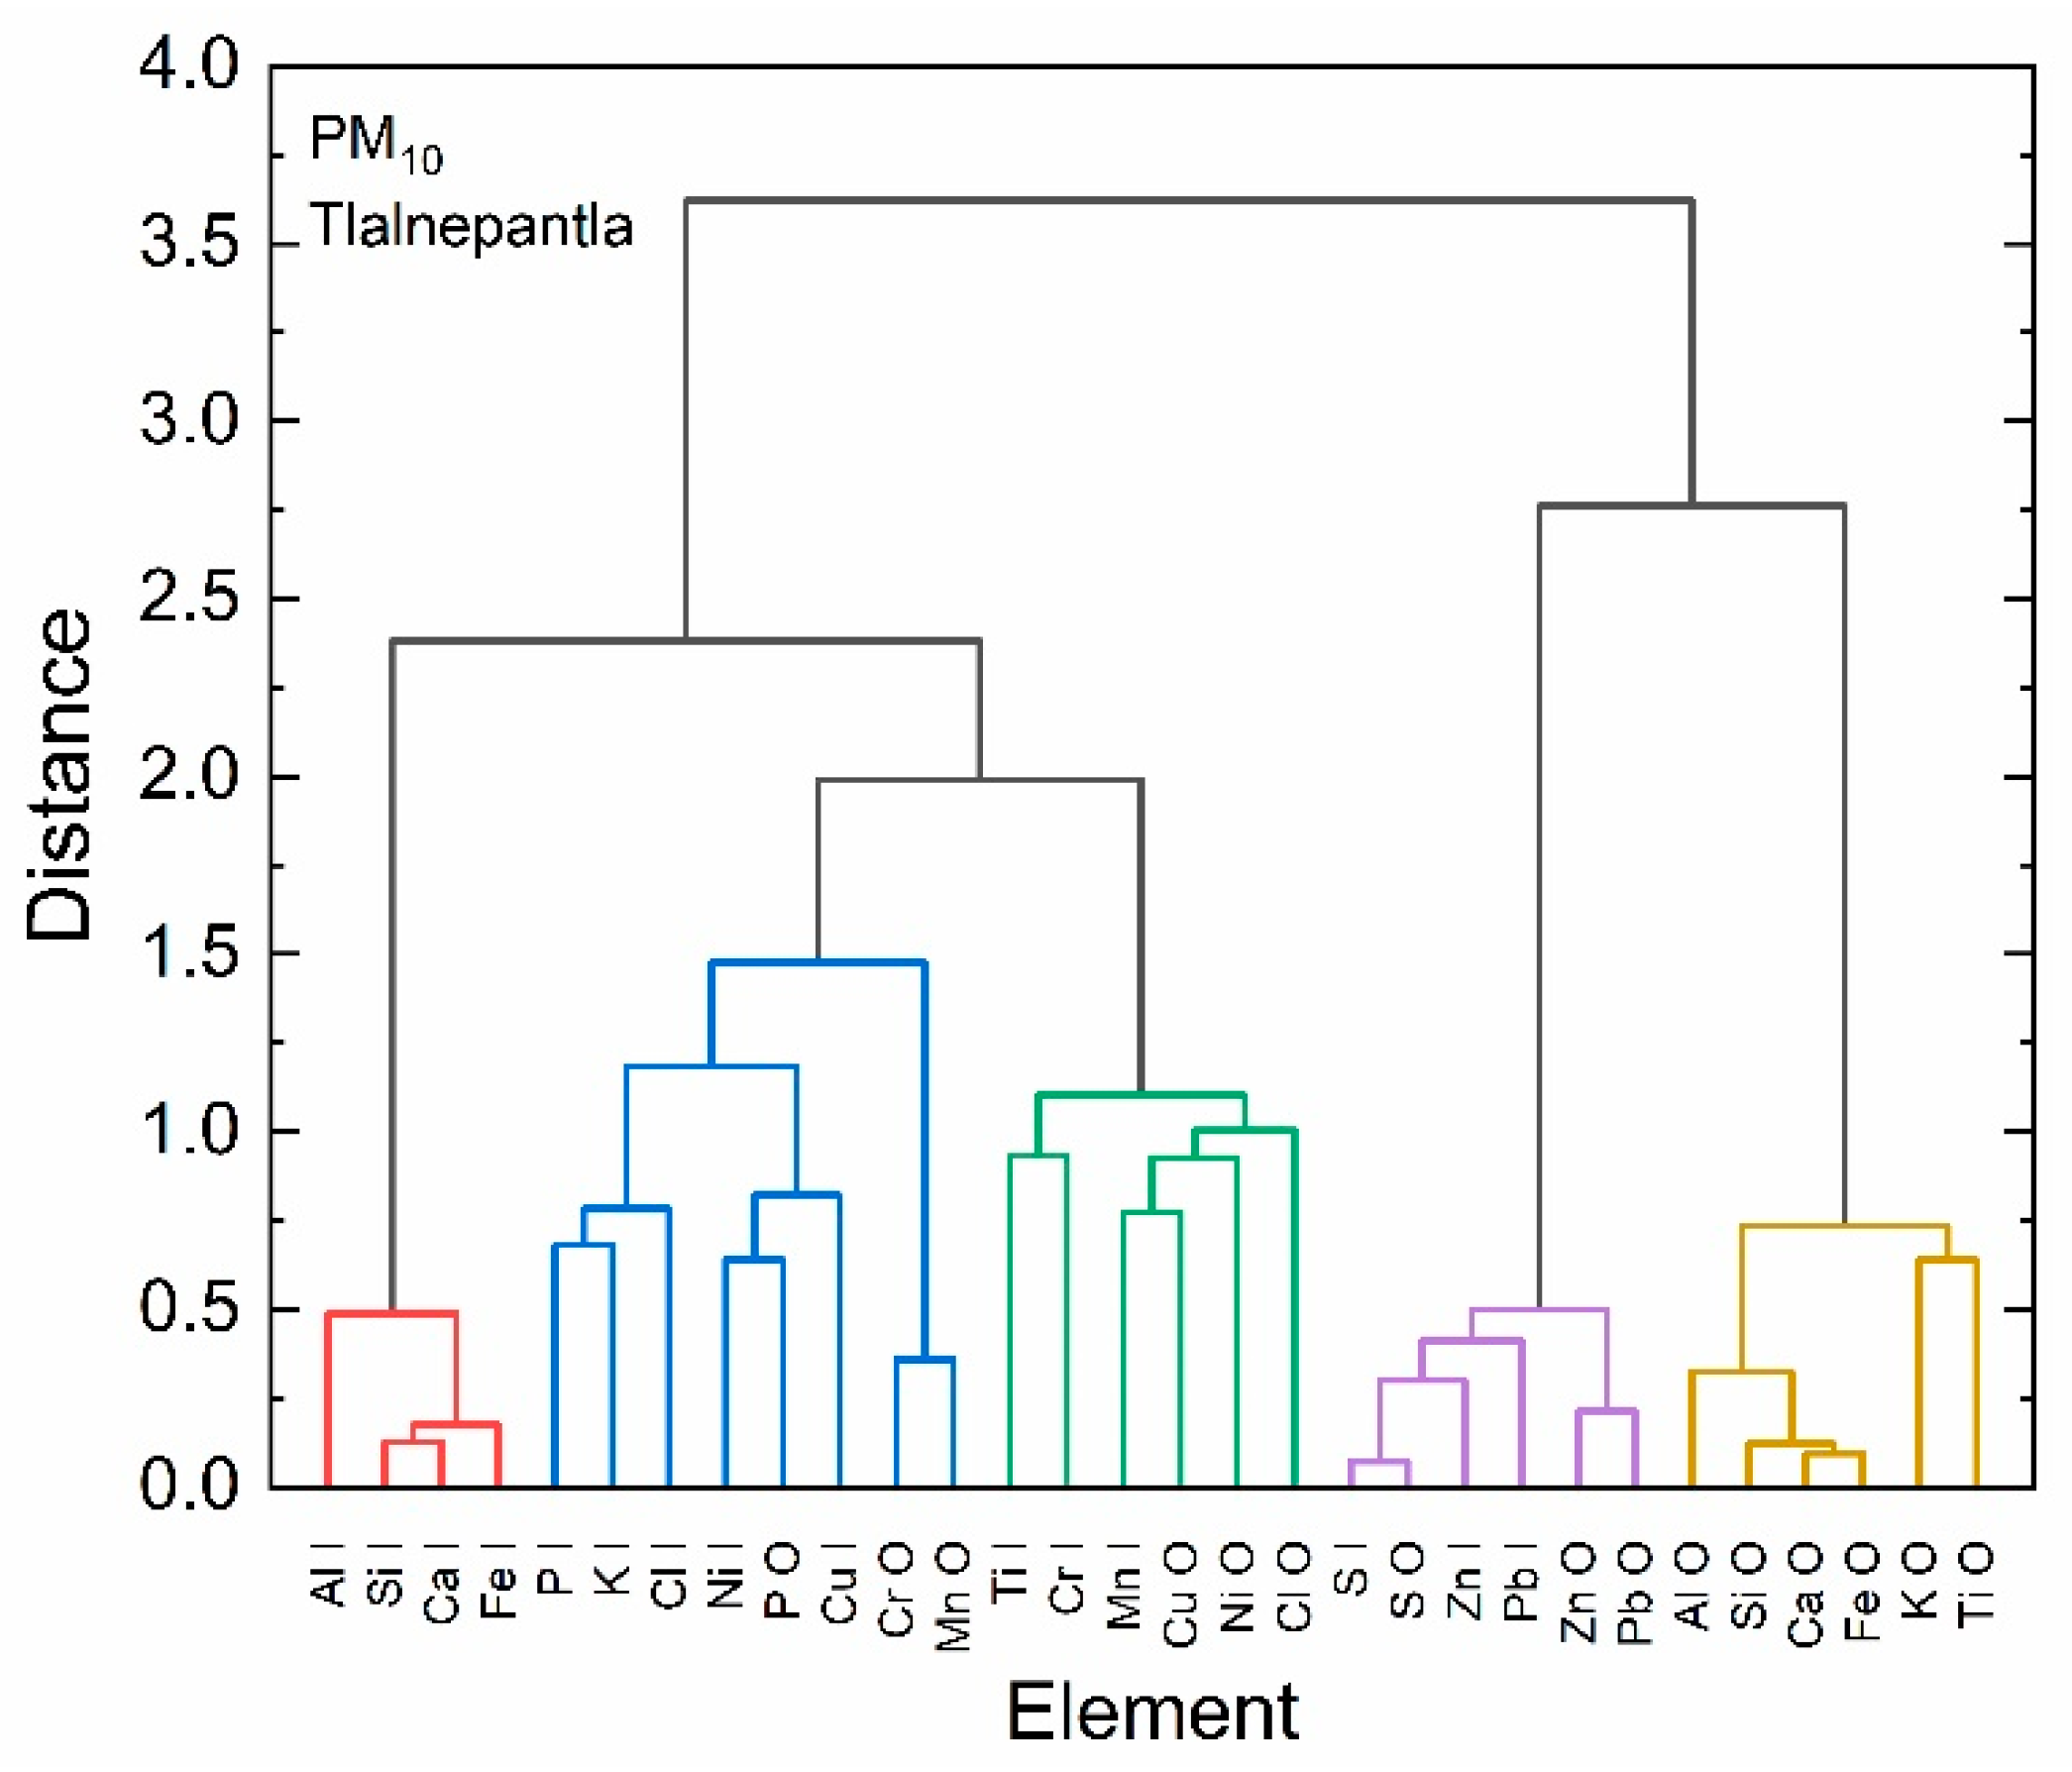
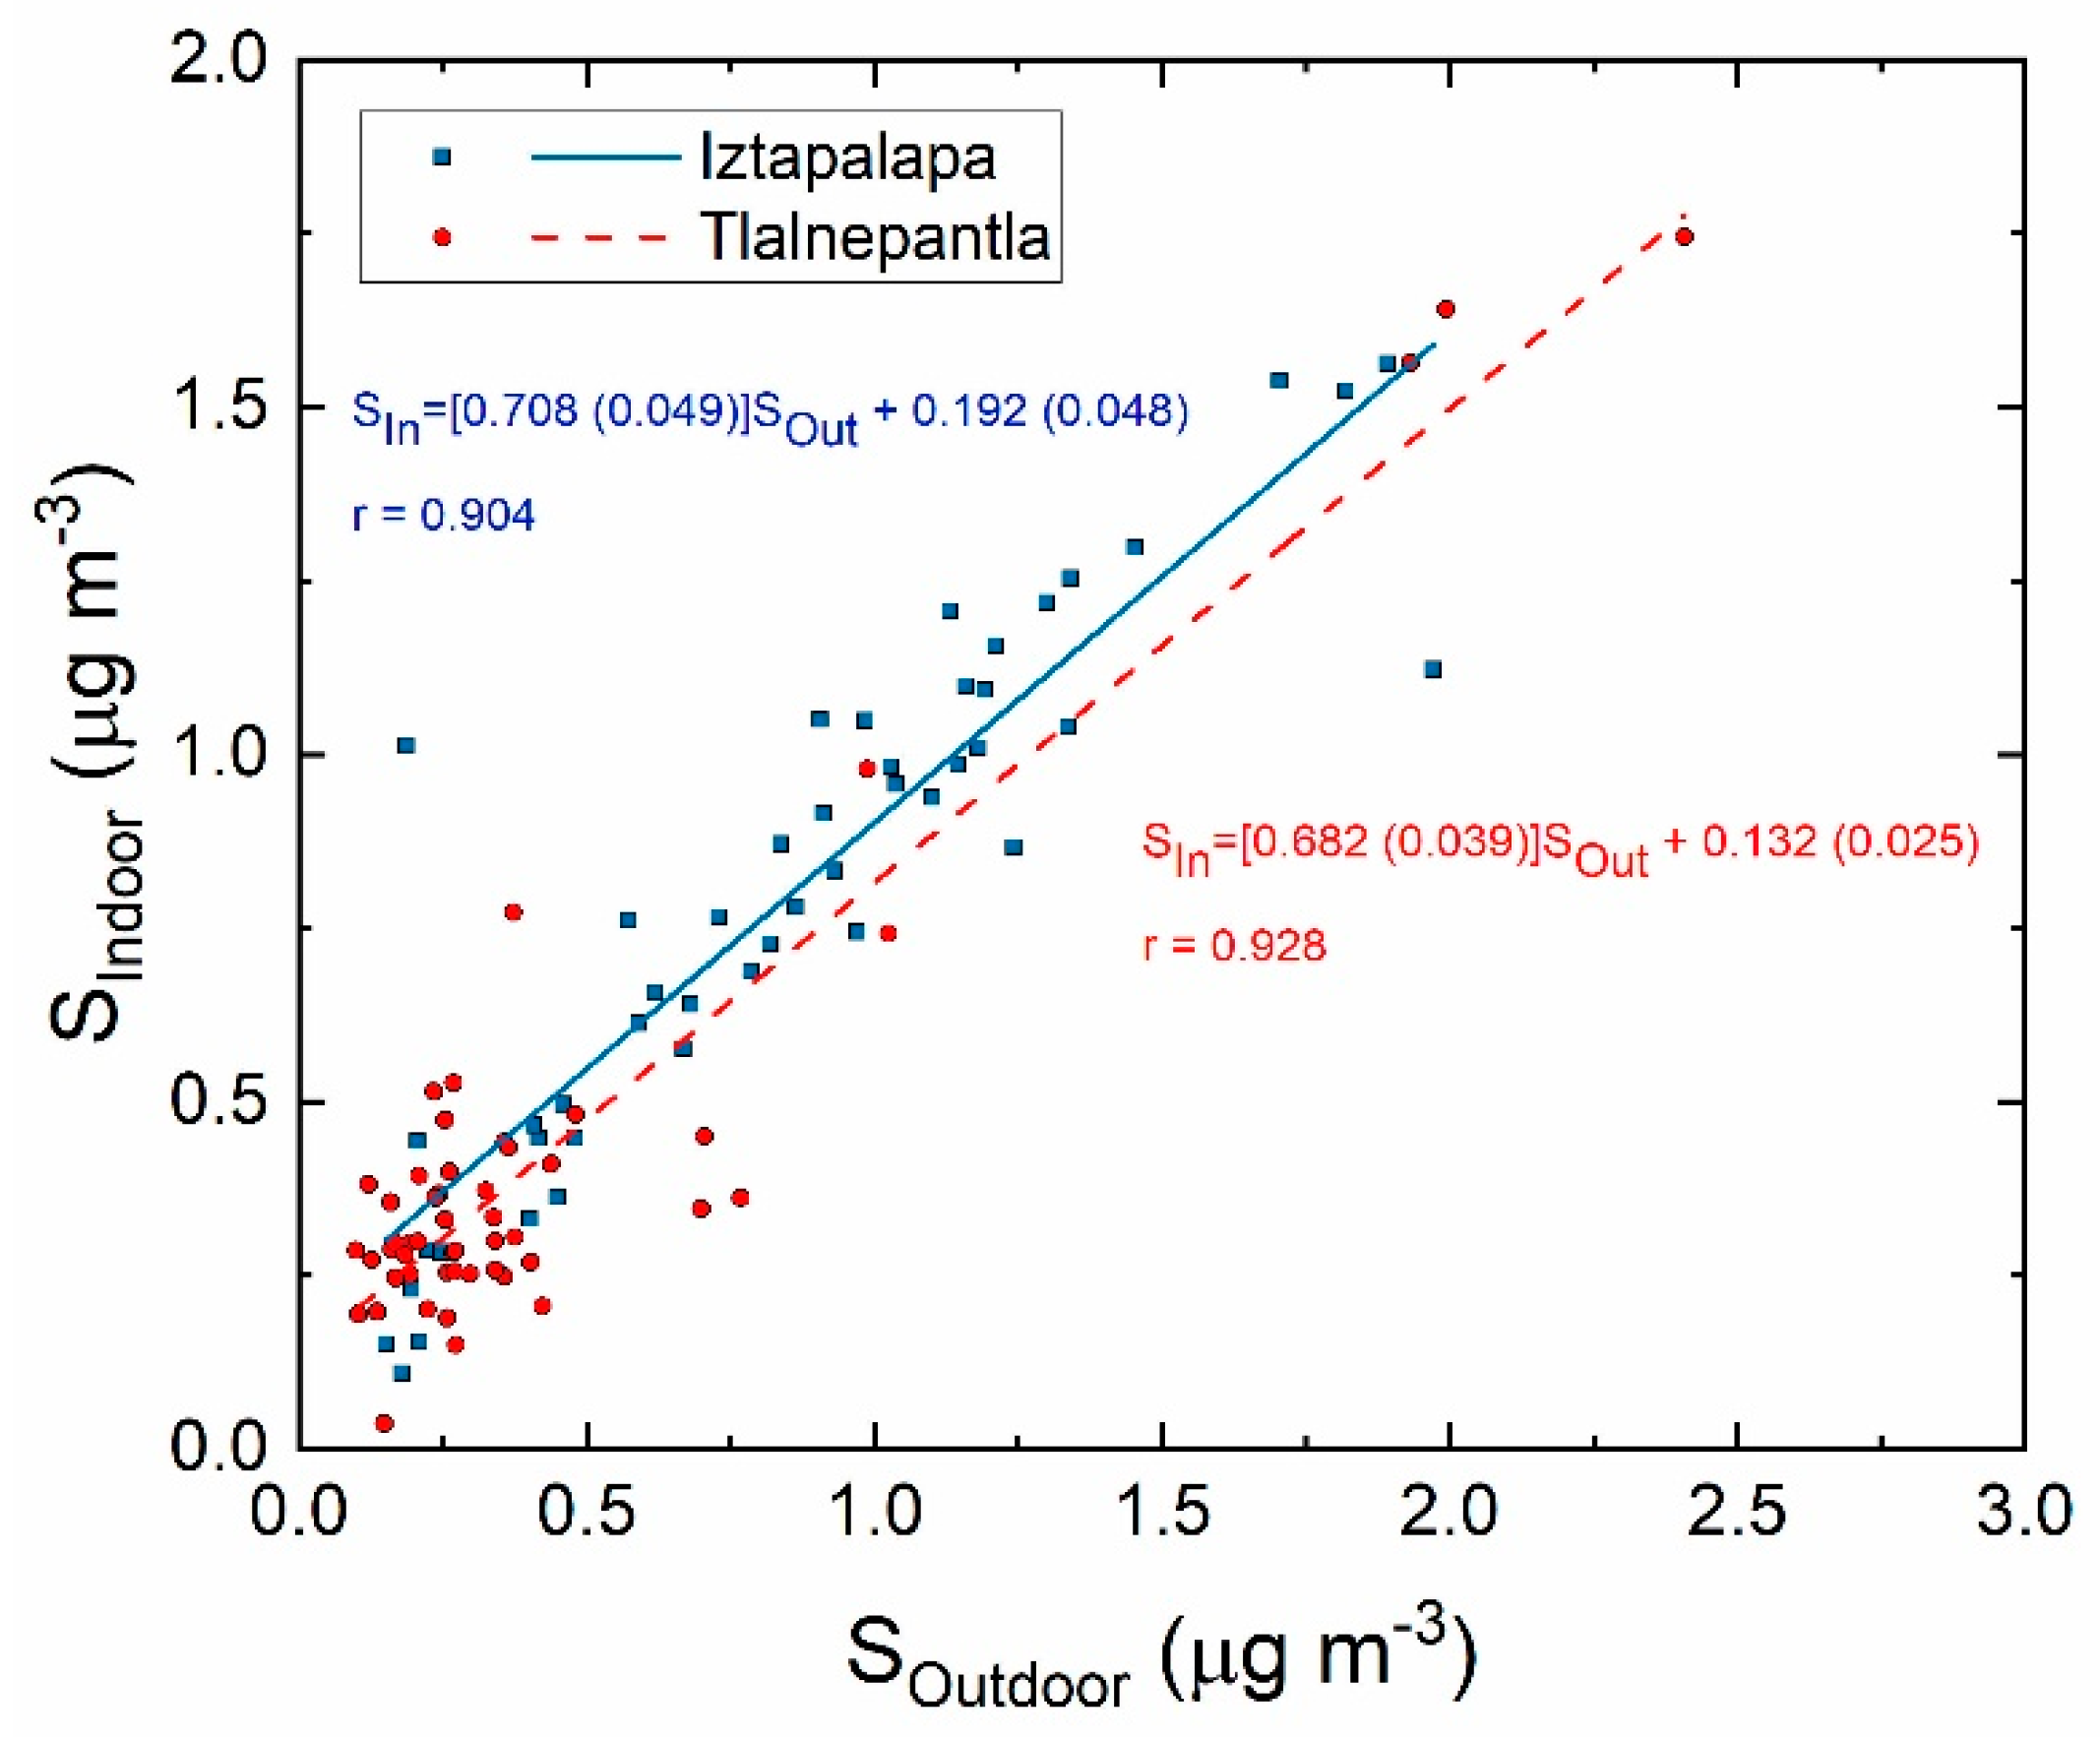
3.2. Elemental Concentrations

A total of 18 elements (Al, Si, P, S, Cl, K, Ca, Ti, V, Cr, Mn, Fe, Ni, Cu, Zn, Br, Se, and Pb) could be observed in the PM10 samples using XRF. The mean concentrations and combined uncertainties defined in the official Joint Committee for Guides in Metrology document [42] are presented in Table 2. Again, the Shapiro–Wilk test was applied, and it was found that most of the elemental concentration distributions were not normal. Therefore, the Kolmogorov–Smirnov test was used for all the elements to establish differences between indoor and outdoor values. According to Table 2, in Iztapalapa, most of the elements had mean concentrations that were significantly equal indoors and outdoors, except for Al, Cr, Mn, and Fe, which may have an industrial contribution. In contrast, only P was significantly higher in the interior environment at Tlalnepantla, while geogenic elements (Al, Si, K, Ca, Ti, Mn, and Fe) had higher concentrations outdoors, suggesting that there may be a limited transport of soil dust towards the interior of the dwelling. In addition, Zn had a higher value outdoors, possibly due to an industrial contribution [43]. It is necessary to note that, as most elemental concentrations are similar indoors and outdoors, the observed difference in total mass must be attributed to other chemical species, probably organic, whose concentrations cannot be measured with XRF and that are released inside the households. Examples are emissions from cooking activities [44,45], volatile organic compounds (VOC), or formaldehyde related to furniture or cleaning products [46].
Furthermore, a brief study at the Iztapalapa site (indoors) during the 2021 dry–warm season showed no significant difference in average PM10 concentration (39.9 (11) µg m−3) as compared to the present work [47]. Recent data are not available for PM10 mass and elemental concentrations in the Tlalnepantla area; however, the results published by Barrera et al. [48] during the dry season of the year 2009 at a nearby site were useful for comparison. During 2009, the mean PM10 mass concentration was 71.1 (3.8) µg m−3, while in this work, the outdoor mean value at Tlalnepantla was 27.6 (7.0) µg m−3. Lower values were also observed for the elemental concentrations. The reason may be a combination of the precipitation during the present study (carried out during the rainy season) and the lockdown due to the pandemic.
Average relative humidity (RH) was 66% for Iztapalapa (ranging from 39% to 98%) and 62% for Tlalnepantla (in a 37% to 97% interval). The relationship of gravimetric mass and elemental concentrations with relative humidity was analyzed through the evaluation of Pearson’s correlation coefficients, and no significant values were found. Namely, RH had no influence on any of the concentrations measured in this study. This can be understood because the campaigns were conducted during the rainy season when RH is higher, and as reported by Wang et al. [49], dry deposition occurs and no correlation is observed with PM10 or elemental concentrations.
The KMO and Bartlett’s sphericity tests showed that none of the elemental concentration datasets were suitable for the application of PCA. Hence, cluster analysis (CA) was utilized to identify possible sources of the registered elements, including the indoor and outdoor concentrations. Elements with an occurrence of less than 60% were not included. The resulting dendrograms are presented in Figure 4 and Figure 5 for Iztapalapa and Tlalnepantla, respectively. Regarding the Iztapalapa results, it can be seen that the geogenic elements (Al, Si, Ti, and Fe) from indoors and outdoors are grouped in the same cluster, demonstrating there was a penetration of soil-derived particles towards the interior of the dwelling; the contribution of indoor sources was not observed for these elements. A similar case occurred for S and Zn: the particles with S are usually associated with ammonium sulfate, and those with Zn are either related to industrial or traffic sources [36]. The remaining elements seemed to be produced by different indoor and outdoor sources. For instance, the indoor Pb may have originated from paintings and Ca from construction materials or indoor cleaning activities [12,45].
In Tlalnepantla, the geogenic particles were differentiated between the indoor and outdoor samples. This is also supported by the fact that the mean concentrations of these elements (Al, Si, K, Ca, Ti, Mn, and Fe) were significantly higher outdoors, as seen in Table 2. Thus, there were different origins for these soil-derived particles. Cleaning activities and construction materials may explain the indoor presence of geogenic particles [45]. Additionally, the cluster formed by indoor and outdoor S, Zn, and Pb indicates there was transport toward the dwelling; these elements are usually present in the fine fraction of PM10, so this penetration is more probable. Regarding the other two clusters, there must have been a mixture of airborne particles that originated either indoors or outdoors. The proximity of an extensive industrial area explains the presence of elements such as Cr, Mn, and Ni.
Figure 6 illustrates the significantly high correlation between S concentrations outdoors and indoors, meaning that there was not a significant source inside the house. An important issue to be pointed out is that the correlation between indoor and outdoor concentrations is frequently not considered [3,50,51]. The results obtained in the present work demonstrate that it is feasible to simply identify penetrating chemical species without the need to appeal for high-quality models developed to describe the outdoor-to-indoor transport of pollutants [52,53]. However, a model application might enrich the present data [54].
These results are in good agreement with meteorological data. The wind roses for both sites are given in the Supplementary Material (Figures S1 and S2). In the case of Iztapalapa, the regimes change between June and July; however, in both months, there are sources related to soil dust, explaining the presence of geogenic material, while S is virtually ubiquitous around the MAMC [48]. For Tlalnepantla, the predominant winds came from the northwest of the sampling site, an area with heavy industry, justifying the presence of the aforementioned elements in the household, including the penetration through windows and doors.
To estimate if the measured elemental concentrations are comparable to those determined in households from other urban areas around the world, Table 3 contains results published in previous works for PM10 and five elements whose concentrations are commonly measured [3,50,51,55,56]. It can be noted that the indoor values determined in the present study were lower or of the same order of magnitude as compared to the other urban areas, regardless of the difference in the MAMC size and the consequent number of possible contributing sources. Therefore, aside from the observed penetration of particles from the outdoors, a possible similarity among the indoor activities seems to strongly influence the elemental concentrations.

3.3. Risk Assessment

The risk was assessed for only seven elements: Fe, Ni, Cu, Zn, Mn, Pb, and Cr. Table 4 shows the parameters specific to each element required to calculate the HQ values. It is necessary to mention that the IRIS database [39] does not contain RfD for all the elements (such as Pb), so the values were extracted from other works [40,57].
Finally, the resulting HQ values are presented in Table 5 for men, women, and children. It can be seen that, despite exposure to all these elements, most of them posed no apparent health risk. However, there may be a risk due to Pb ingestion by men/women, as the HQ values were greater than 1. The origin of this element in the dwellings may be, in addition to contribution by transport from the outdoor environment, due to some building materials or paintings [58]. Nevertheless, Pb was not observed in all the samples (38 at Iztapalapa and 16 at Tlalnepantla), so the risk might be reduced. Cr may also pose a risk as the HQ values were greater than 1, particularly for children. However, it would be necessary to conduct a further chemical speciation analysis of this element, as only Cr(VI) is known to harm human health. Additionally, adverse health effects might occur for children due to the ingestion of all these elements, as seen in Table 5, because HQ > 1 in both of the studied sites. Of consequence are the high Ding values, which are of the order of 0.015 mg kg−1 d−1 for Cr in men and women and up to 2 mg kg−1 d−1 for children, for all the elements. This points out the need for deeper studies to determine the indoor sources of these elements and organic compounds to reduce the possible risks caused by ingestion by children.
As a final issue, it is important to mention that the present study has several limitations. First, as XRF gives only information about the concentrations of several elements, it is impossible to determine the contribution of organic compounds. It is convenient to use other complementary analytical techniques to gather more data. Second, the sampling campaigns lasted only about two months, so it was necessary to extrapolate the results to one year. Moreover, the use of low-volume samplers did not allow for a better resolution, which is useful to distinguish the contribution of indoor activities. Lastly, the campaigns had to be carried out during the rainy season, as starting during the dry–warm season was impossible. There are three seasons in the MCMA: dry–warm (from February to May), rainy (from May to October), and dry–cool (from November to February). The rainy season presents lower levels of particulate matter pollution [59].

4. Conclusions

This work represents the first effort to measure the elemental concentration of PM10 in households in the MAMC together with a risk assessment due to the exposure to these particles via inhalation, ingestion, or dermal absorption.
Although the gravimetric mass concentrations were higher indoors than outdoors, the elemental concentrations were generally very similar. Thus, it was demonstrated that an important contribution to the indoor particles must contain compounds not detectable by X-ray fluorescence, pointing out the need to complement the analyses with other techniques. In the studied sites, it was determined that geogenic and industrial emissions were the principal contributors.
The high correlations between indoor and outdoor concentrations for several elements proved that there was an important penetration of the particles towards the households, while in other cases, it was possible to deduce that indoor sources are more important, such as geogenic particles in Tlalnepantla. It was shown that using cluster analysis for indoor and outdoor elemental concentrations allows for the identification of chemical species detected indoors that were produced outdoors.
As a final point, no significant risk to human health was found due to the exposure to the elements present in PM10 in either household, except for Pb and Cr via ingestion of the airborne particles by women and men. Nevertheless, an important risk due to ingestion was found for children. It is important to emphasize the advantage of studying PM10 instead of PM2.5 for this kind of investigation, as not only inhalation is considered. Moreover, as the study was carried out during the rainy season, higher concentrations and, consequently, higher risks can be expected during the dry–warm and dry–cold seasons. All these findings may be important for public health, as adults are not threatened by the studied pollutants, despite the long time spent at the dwellings. At the same time, it is necessary to perform deeper studies to identify indoor sources to prevent exposure to these pollutants and the derived risk to children.

Supplementary Materials

The following supporting information can be downloaded at: https://www.mdpi.com/article/10.3390/atmos14040734/s1, Figure S1: Wind rose for Iztapalapa during the sampling period; Figure S2: Wind rose for Tlalnepantla during the sampling period.

Author Contributions

Conceptualization, S.R.-C. and J.M.-M.-d.-C.; Data curation, J.M.-M.-d.-C.; Formal analysis, S.R.-C. and J.M.-M.-d.-C.; Funding acquisition, J.M.-M.-d.-C.; Methodology, S.R.-C., J.M.-M.-d.-C. and J.C.P.-S.; Project administration, J.M.-M.-d.-C.; Validation, J.C.P.-S.; Writing—original draft, J.M.-M.-d.-C.; Writing—review and editing, S.R.-C. and J.C.P.-S. All authors have read and agreed to the published version of the manuscript.

Funding

This work was supported in part by Dirección General de Asuntos del Personal Académico, Universidad Nacional Autónoma de México, under grant IN-101021. SRC recognizes the support of CONACyT through a scholarship.

Institutional Review Board Statement

Not applicable.

Informed Consent Statement

Not applicable.

Data Availability Statement

The datasets used and/or analyzed during the current study are available from the corresponding author upon reasonable request.

Conflicts of Interest

The authors declare that they have no competing interest.

References

  1. Rivas, I.; Fussell, J.C.; Kelly, F.J.; Querol, X. Indoor Sources of Air Pollutants. In Indoor Air Pollution; Hester, R.E., Harrison, R.M., Eds.; The Royal Society of Chemistry: London, UK, 2019; pp. 1–34. [Google Scholar]
  2. Jaimes Torres, M.; Aguilera Portillo, M.; Cuerdo-Vilches, T.; Oteiza, I.; Navas-Martín, M.Á. Habitability, resilience, and satisfaction in Mexican homes to COVID-19 pandemic. Int. J. Environ. Res. Public Health 2021, 18, 6993. [Google Scholar] [CrossRef] [PubMed]
  3. Chao, C.Y.; Wong, K.K. Residential indoor PM10 and PM2.5 in Hong Kong and the elemental composition. Atmos. Environ. 2002, 36, 265–277. [Google Scholar] [CrossRef]
  4. Martuzevicius, D.; Grinshpun, S.A.; Lee, T.; Hu, S.; Biswas, P.; Reponen, T.; LeMasters, G. Traffic-related PM2.5 aerosol in residential houses located near major highways: Indoor versus outdoor concentrations. Atmos. Environ. 2008, 42, 6575–6585. [Google Scholar] [CrossRef]
  5. See, S.W.; Balasubramanian, R. Chemical characteristics of fine particles emitted from different gas cooking methods. Atmos. Environ. 2008, 42, 8852–8862. [Google Scholar] [CrossRef]
  6. Fuller, C.H.; Brugge, D.; Williams, P.L.; Mittleman, M.A.; Durant, J.L.; Spengler, J.D. Estimation of ultrafine particle concentrations at near-highway residences using data from local and central monitors. Atmos. Environ. 2012, 57, 257–265. [Google Scholar] [CrossRef]
  7. Tang, C.H.; Garshick, E.; Grady, S.; Coull, B.; Schwartz, J.; Koutrakis, P. Development of a modeling approach to estimate indoor-to-outdoor sulfur ratios and predict indoor PM2.5 and black carbon concentrations for Eastern Massachusetts households. J. Expo. Sci. Environ. Epidemiol. 2018, 28, 125–130. [Google Scholar]
  8. Siponen, T.; Tarja, Y.-T.; Tiittanen, P.; Taimisto, P.; Pekkanen, J.; Salonen, R.O.; Lanki, T. Wood stove use and other determinants of personal and indoor exposures to particulate air pollution and ozone among elderly persons in a Northern Suburb. Indoor Air 2019, 29, 413–422. [Google Scholar] [CrossRef]
  9. Madureira, J.; Slezakova, K.; Silva, A.I.; Lage, B.; Mendes, A.; Aguiar, L.; Pereira, M.C.; Teixeira, J.P.; Costa, C. Assessment of indoor air exposure at residential homes: Inhalation dose and lung deposition of PM10, PM2.5 and ultrafine particles among newborn children and their mothers. Sci. Total Environ. 2020, 717, 137293. [Google Scholar] [CrossRef]
  10. Zhang, L.; Ou, C.; Magana-Arachchi, D.; Vithanage, M.; Vanka, K.S.; Palanisami, T.; Masakorala, K.; Wijesekara, H.; Yan, Y.; Bolan, N.; et al. Indoor Particulate Matter in Urban Households: Sources, Pathways, Characteristics, Health Effects, and Exposure Mitigation. Int. J. Environ. Res. Public Health 2021, 18, 11055. [Google Scholar] [CrossRef]
  11. Langer, S.; Ramalho, O.; Derbez, M.; Ribéron, J.; Kirchner, S.; Mandin, C. Indoor environmental quality in French dwellings and building characteristics. Atmos. Environ. 2016, 128, 82–91. [Google Scholar] [CrossRef]
  12. McCormack, M.C.; Breysse, P.N.; Hansel, N.N.; Matsui, E.C.; Tonorezos, E.S.; Curtin-Brosnan, J.; Diette, G.B. Common household activities are associated with elevated particulate matter concentrations in bedrooms of inner-city Baltimore pre-school children. Environ. Res. 2008, 106, 148–155. [Google Scholar] [CrossRef] [PubMed]
  13. Kwan, S.E.; Shaughnessy, R.; Haverinen-Shaughnessy, U.; Kwan, T.A.; Peccia, J. The impact of ventilation rate on the fungal and bacterial ecology of home indoor air. Build. Environ. 2020, 177, 106800. [Google Scholar] [CrossRef]
  14. Massey, D.; Kulshrestha, A.; Masih, J.; Taneja, A.B.E.J. Seasonal trends of PM10, PM5.0, PM2.5 & PM1.0 in indoor and outdoor environments of residential homes located in North-Central India. Build. Environ. 2012, 47, 223–231. [Google Scholar]
  15. Guo, H.; Morawska, L.; He, C.; Gilbert, D. Impact of ventilation scenario on air exchange rates and on indoor particle number concentrations in an air-conditioned classroom. Atmos. Environ. 2008, 42, 757–768. [Google Scholar] [CrossRef]
  16. Chen, C.; Zhao, B. Review of relationship between indoor and outdoor particles: I/O ratio, infiltration factor and penetration factor. Atmos. Environ. 2011, 45, 275–288. [Google Scholar] [CrossRef]
  17. Ścibor, M.; Bokwa, A.; Balcerzak, B. Impact of wind speed and apartment ventilation on indoor concentrations of PM10 and PM2.5 in Kraków, Poland. Air Qual. Atmos. Health 2020, 13, 553–562. [Google Scholar] [CrossRef]
  18. Kim, H.; Kim, J.S.; Lee, J.; Kim, D. The effect of ventilation on reducing the concentration of hazardous substances in the indoor air of a Korean living environment. Anal. Sci. Technol. 2020, 33, 49–57. [Google Scholar]
  19. Fan, X.J.; Yang, C.; Zhang, L.; Fan, Q.; Li, T.; Bai, X.; Norback, D. Asthma symptoms among Chinese children: The role of ventilation and PM10 exposure at school and home. Int. J. Tuberc. Lung Dis. 2017, 21, 1187–1193. [Google Scholar] [CrossRef]
  20. Rojas-Bracho, L.; Suh, H.H.; Koutrakis, P. Relationships among personal, indoor, and outdoor fine and coarse particle concentrations for individuals with COPD. J. Expo. Sci. Environ. Epidemiol. 2000, 10, 294–306. [Google Scholar] [CrossRef]
  21. Rosas-Pérez, I.; Serrano, J.; Alfaro-Moreno, E.; Baumgardner, D.; García-Cuéllar, C.; Miranda, J.; Raga, G.B.; Castillejos, M.; Drucker, R.; Osornio-Vargas, A.R. Relations between PM10 composition and cell toxicity: A multivariate and graphical approach. Chemosphere 2007, 67, 1218–1228. [Google Scholar] [CrossRef]
  22. Rodríguez-Agudelo, Y.; Riojas-Rodríguez, H.; Ríos, C.; Rosas, I.; Pedraza, E.S.; Miranda, J.; Siebe, C.; Texcalac, J.L.; Santos-Burgoa, C. Motor alterations associated with exposure to manganese in the environment in Mexico. Sci. Total Environ. 2006, 368, 542–556. [Google Scholar] [CrossRef] [PubMed]
  23. Quintana, R.; Serrano, J.; Gómez, V.; De Foy, B.; Miranda, J.; García-Cuéllar, C.; Vega, E.; Vázquez-López, I.; Molina, L.T.; Manzano-León, N.; et al. The oxidative potential and biological effects induced by PM10 were obtained in Mexico City and at a receptor site during the MILAGRO Campaign. Environ. Pollut. 2011, 159, 3446–3454. [Google Scholar] [CrossRef] [PubMed]
  24. Báez, A.; Padilla, H.; García, R.; Torres, M.C.; Rosas, I.; Belmont, R. Carbonyl levels in indoor and outdoor air in Mexico City and Xalapa, Mexico. Sci. Total Environ. 2003, 302, 211–226. [Google Scholar] [CrossRef] [PubMed]
  25. Báez, A.P.; Padilla, H.G.; García, R.; Belmont, R.D.; Torres, M.C. Measurements of carbonyls in a 13-story building. Environ. Sci. Pollut. Res. 2004, 11, 400–404. [Google Scholar] [CrossRef] [PubMed]
  26. Tovalin-Ahumada, H.; Whitehead, L.; Blanco, S. Personal exposure to PM2.5 and element composition—A comparison between outdoor and indoor workers from two Mexican cities. Atmos. Environ. 2007, 41, 7401–7413. [Google Scholar] [CrossRef]
  27. Zuk, M.; Rojas, L.; Blanco, S.; Serrano, P.; Cruz, J.; Ángeles, F.; Tzintzun, G.; Armendáriz, C.; Edwards, R.D.; Johnson, M.; et al. The impact of improved wood-burning stoves on fine particulate matter concentrations in rural Mexican homes. J. Expo. Sci. Environ. Epidemiol. 2007, 17, 224–232. [Google Scholar] [CrossRef] [PubMed]
  28. Carabalí, G.; Castro, T.; De la Cruz, W.; Peralta, O.; Varela, A.; Amelines, O.; Rivera, M.; Ruiz-Suárez, G.; Torres-Jardón, R.; Martínez-Quiroz, E.; et al. Morphological and chemical characterization of soot emitted during flaming combustion stage of native-wood species used for the cooking process in western Mexico. J. Aerosol. Sci. 2016, 95, 1–14. [Google Scholar] [CrossRef]
  29. Reynoso-Cruces, S.; Hernández-López, A.E.; Miranda, J.; Mejía-Ponce, L.V. Elemental characterization and risk assessment of indoor aerosols in an electrostatic particle accelerator laboratory. Environ. Pollut. Bioavailab. 2021, 33, 334–346. [Google Scholar] [CrossRef]
  30. Mexican Official Standard NMX-R-060-SCFI-2013; Windows and Architectural Products for the External Closure of Facades-Classifications and Specifications. Ministry of Economy: Mexico City, Mexico, 2014.
  31. Molina, L.T.; de Foy, B.; Martínez, O.V.; Páramo Figueroa, V.H. Air quality, weather and climate in Mexico City. World Meteorol. Organ. (WMO) Bull 2009, 58, 48. [Google Scholar]
  32. Espinosa, A.A.; Reyes-Herrera, J.; Miranda, J.; Mercado, F.; Veytia, M.A.; Cuautle, M.; Cruz, J.I. Development of an X-ray fluorescence spectrometer for environmental science applications. Inst. Sci. Technol. 2012, 40, 603–617. [Google Scholar] [CrossRef]
  33. Mejía-Ponce, L.V.; Hernández-López, A.E.; Reynoso-Cruces, S.; Pineda, J.C.; Mendoza-Flores, J.A.; Miranda, J. Improvements to the X-ray Spectrometer at the Aerosol Laboratory, Instituto de Física, UNAM. J. Nucl. Phys. Mater. Sci. Radiat. Appl. 2018, 6, 57–60. [Google Scholar]
  34. IAEA. Quantitative X ray Analysis System; Computer Manual Series No. 21; International Atomic Energy Agency: Vienna, Austria, 2007; p. 138. [Google Scholar]
  35. Espinosa, A.A.; Miranda, J.; Pineda, J.C. Evaluation of uncertainty in correlated quantities: Application to elemental analysis of atmospheric aerosols. Rev. Mex. Física 2010, 56, 134–140. [Google Scholar]
  36. Mejía-Ponce, L.V.; Hernández-López, A.E.; Miranda-Martín-del-Campo, J.; Pineda-Santamaría, J.C.; Reynoso-Cruces, S.; Mendoza-Flores, J.A.; Espinosa-Guzmán, A.A. Elemental analysis of PM10 in southwest Mexico City and source apportionment using positive matrix factorization. J. Atmos. Chem. 2022, 79, 167–198. [Google Scholar] [CrossRef]
  37. Hernández-López, A.E.; Miranda-Martín-del-Campo, J.; Mugica-Álvarez, V.; Hernández-Valle, B.L.; Mejía-Ponce, L.V.; Pineda-Santamaría, J.C.; Reynoso-Cruces, S.; Mendoza-Flores, J.A.; Rozanes-Valenzuela, D. A Study of PM2.5 Elemental Composition in Southwest Mexico City and Development of Receptor Models with Positive Matrix Factorization. Rev. Int. Contam. Amb. 2021, 37, 67–88. [Google Scholar] [CrossRef]
  38. SEDEMA. Databases of the Automatic Atmospheric Monitoring Network. In Red Automática de Monitoreo Atmosférico, RAMA; Secretaría de Medio Ambiente: Mexico City, Mexico, 2021. [Google Scholar]
  39. EPA. Exposure Factors Handbook: Edition; EPA/600/R-09/052F; U.S. Environmental Protection Agency: Washington, DC, USA, 2011. Available online: http://www.epa.gov/ncea/efh (accessed on 1 September 2020).
  40. Embiale, A.; Chandravanshi, B.S.; Zewge, F.; Sahle-Demessie, E. Health risk assessment of trace elements through the exposure of particulate matter-10 during the cooking of Ethiopian traditional dish sauces. Toxicol. Environ. Chem. 2020, 102, 151–169. [Google Scholar] [CrossRef]
  41. Taylor, J.R. An Introduction to Error Analysis, 2nd ed.; University Science Books: Sausalito, CA, USA, 1997; p. 327. [Google Scholar]
  42. JCGM. Evaluation of Measurement Data—Guide to the Expression of Uncertainty in Measurement; Joint Committee for Guides in Metrology: Geneva, Switzerland, 2008; p. 134. [Google Scholar]
  43. Miranda, J.; Cahill, T.A.; Morales, J.R.; Aldape, F.; Flores, M.J.; Díaz, R.V. Determination of elemental concentrations in atmospheric aerosols in Mexico City using proton induced X-ray emission, proton elastic scattering, and laser absorption. Atmos. Environ. 1994, 28, 2299–2306. [Google Scholar] [CrossRef]
  44. Kang, K.; Kim, H.; Kim, D.D.; Lee, Y.G.; Kim, T. Characteristics of cooking-generated PM10 and PM2.5 in residential buildings with different cooking and ventilation types. Sci. Total Environ. 2019, 668, 56–66. [Google Scholar] [CrossRef]
  45. Park, S.; Song, D.; Park, S.; Choi, Y. Particulate matter generation in daily activities and removal effect by ventilation methods in residential building. Air Qual. Atmos. Health 2021, 14, 1665–1680. [Google Scholar] [CrossRef]
  46. Canha, N.; Lage, J.; Candeias, S.; Alves, C.; Almeida, S.M. Indoor air quality during sleep under different ventilation patterns. Atmos. Pollut. Res. 2017, 8, 1132–1142. [Google Scholar] [CrossRef]
  47. Reynoso-Cruces, S. A Study of the Atmospheric Aerosol Present in Indoor in Environments at the Mexico Valley Metropolitan Area. Master’s Thesis, Universidad Nacional Autónoma de México, Mexico City, Mexico, 2022. [Google Scholar]
  48. Barrera, V.A.; Miranda, J.; Espinosa, A.A.; Meinguer, J.; Martínez, J.N.; Cerón, E.; Morales, J.R.; Miranda, P.A.; Días, J.F. Contribution of soil, Sulfate, and Biomass burning sources to the elemental composition of PM10 from Mexico City. Int. J. Environ. Res. 2012, 6, 597–612. [Google Scholar]
  49. Wang, J.; Ogawa, S. Effects of meteorological conditions on PM2.5 concentrations in Nagasaki, Japan. Int. J. Environ. Res. Public Health 2015, 12, 9089–9101. [Google Scholar] [CrossRef] [PubMed]
  50. Satsangi, P.G.; Yadav, S.; Pipal, A.S.; Kumbhar, N. Characteristics of trace metals in fine (PM2.5) and inhalable (PM10) particles and its health risk assessment along with in-silico approach in indoor environment of India. Atmos. Environ. 2014, 92, 384–393. [Google Scholar] [CrossRef]
  51. Srithawirat, T.; Latif, M.T.; Sulaiman, F.R. Indoor PM10 and its heavy metal composition at a roadside residential environment, Phitsanulok, Thailand. Atmósfera 2016, 29, 311–322. [Google Scholar] [CrossRef]
  52. Chen, C.; Yao, M.; Luo, X.; Zhu, Y.; Liu, Z.; Zhuo, H.; Zhao, B. Outdoor-to-indoor transport of ultrafine particles: Measurement and model development of infiltration factor. Environ. Pollut. 2020, 267, 115402. [Google Scholar] [CrossRef]
  53. Santiago, J.L.; Rivas, E.; Buccolieri, R.; Martilli, A.; Vivanco, M.G.; Borge, R.; Carlo, O.S.; Martín, F. Indoor-outdoor pollutant concentration modeling: Comprehensive urban air quality and exposure assessment. Air Qual. Atmos. Health 2022, 15, 1583–1608. [Google Scholar] [CrossRef]
  54. Li, Y.; Chen, Z. A balance-point method for assessing the effect of natural ventilation on indoor particle concentrations. Atmos. Environ. 2003, 37, 4277–4285. [Google Scholar] [CrossRef]
  55. Pekey, B.; Bozkurt, Z.B.; Pekey, H.; Doğan, G.; Zararsiz, A.; Efe, N.; Tuncel, G. Indoor/outdoor concentrations and elemental composition of PM10/PM2.5 in urban/industrial areas of Kocaeli City, Turkey. Indoor Air 2010, 20, 112–125. [Google Scholar]
  56. Rohra, H.; Tiwari, R.; Khandelwal, N.; Taneja, A. Mass distribution and health risk assessment of size segregated particulate in varied indoor microenvironments of Agra, India-A case study. Urban Clim. 2018, 24, 139–152. [Google Scholar] [CrossRef]
  57. Cheng, X.; Huang, Y.; Zhang, S.P.; Ni, S.J.; Long, Z.J. Characteristics, Sources, and Health Risk Assessment of Trace Elements in PM10 at an Urban Site in Chengdu, Southwest China. Aerosol Air Qual. Res. 2018, 8, 357–370. [Google Scholar] [CrossRef]
  58. Dingle, J.H.; Kohl, L.; Khan, N.; Meng, M.; Shi, Y.A.; Pedroza-Brambila, M.; Chow, C.-W.; Chan, A.W. Sources and composition of metals in indoor house dust in a mid-size Canadian city. Environ. Pollut. 2021, 289, 117867. [Google Scholar] [CrossRef]
  59. Retama, A.; Ramos-Cerón, M.; Rivera-Hernández, O.; Allen, G.; Velasco, E. Aerosol optical properties and brown carbon in Mexico City. Environ. Sci. Atmos. 2022, 2, 315–334. [Google Scholar] [CrossRef]
Figure 1. Map showing the location of the sites (Iztapalapa and Tlalnepantla) where the present study was conducted. The shaded region represents the urbanized surface in the Metropolitan Area of Mexico City, and the stars show where the Red Automática de Monitoreo Atmosférico (RAMA) UAM Iztapalapa and Tlalnepantla reference stations are located.
Atmosphere 14 00734 g001
Figure 2. Typical activities schedule of the occupants of both households.
Atmosphere 14 00734 g002
Figure 3. Tukey diagram for PM10 gravimetric mass concentrations measured at both sampling sites and the nearest RAMA stations (UAM for Iztapalapa and TLA for Tlalnepantla). The dashed line represents the 70 µg m−3 Mexican official standard.
Atmosphere 14 00734 g003
Figure 4. Dendrogram for indoor (I) and outdoor (O) elemental concentrations measured in Iztapalapa.
Atmosphere 14 00734 g004
Figure 5. Dendrogram for indoor (I) and outdoor (O) elemental concentrations measured in Tlalnepantla.
Atmosphere 14 00734 g005
Figure 6. Sulfur concentrations measured indoors as a function of the sulfur concentrations measured outdoors. The numbers between parentheses represent the uncertainty of the fitted parameters.
Atmosphere 14 00734 g006
Table 1. Characteristics of the sampling sites.
ItemIztapalapaTlalnepantla
Coordinates19°19′40.93″ N, 99°02′59.48″ W19°31′59.50″ N, 99°12′51.08″ W
Building materialsBrick, gypsum covered, paintedBrick, gypsum covered, painted
Number of levels21
Floor coveringCeramicsCeramics
Constructed area108 m2132 m2
Area of the studied room29 m2
Number of inhabitants54
CookingGasGas
SmokingNoNo
VentilationNatural, windows and doors open at least 12 h dailyNatural, windows and doors open at least 12 h daily
Distance to major avenues300 m450 m
Table 2. Mean gravimetric mass and elemental concentrations (ng m−3) measured in the sampling sites.
ElementIztapalapaTlalnepantla
IndoorsnOutdoorsnIndoorsnOutdoorsn
Mass a41.9 (6.9) b4826.9 (6.9) c4838.5 (7.1)5027.6 (7.1)50
Al311 (44)44447 (56)46146 (30)33272 (42)49
Si1170 (80)481510 (10)48402 (34)50967 (68)50
P43.2 (5.0)4840.1 (4.7)4884.8 (7.8)5071.9 (6.9)50
S786 (48)48833 (50)48423 (27)50425 (27)50
Cl640 (39)48551 (34)48440 (28)50404 (26)50
K234 (19)48278 (22)48183 (16)50222 (18)50
Ca1470 (91)481280 (80)48324 (25)50883 (57)50
Ti63.0 (7.2)4766.8 (7.3)4731.3 (4.5)3845.1 (5.9)49
V9.8 (2.1)1713.0 (2.5)199.1 (2.1)199.1 (1.9)20
Cr23.1 (3.2)4828.0 (3.6)4726.1 (3.5)5025.8 (3.4)50
Mn21.0 (2.9)4426.1 (3.3)4719.1 (2.7)4524.4 (3.2)47
Fe372 (24)48518 (32)48175 (13)50422 (27)50
Ni14.0 (2.1)3815.6 (2.3)4114.4 (2.1)4415.9 (2.3)43
Cu53.4 (4.9)4831.5 (3.6)4824.5 (3.1)4721.5 (2.7)48
Zn69.2 (5.9)4770.1 (6.0)4867.1 (5.7)49101 (7.9)50
Se32.8 (3.7)2822.8 (3.2)3063.3 (5.9)2371.0 (6.5)31
Br17.9 (2.7)2723.1 (3.1)2571.6 (6.6)2570.1 (6.5)32
Pb75.5 (9.2)3878.6 (9.1)4519.1 (1.6)1627.1 (2.0)15
a Values in µg m−3. b Values in bold typeface are significantly higher. c Numbers between parentheses represent the combined uncertainty.
Table 3. Comparison of PM10 elemental concentrations (µg m−3) determined in households from different urban areas.
SiteMass (µg m−3)FeNiCuZnPb
Iztapalapa, Mexico a41.9 (16.1)0.370.0140.0530.0690.076
Tlalnepantla, Mexico a38.5 (26.3)0.180.0140.0240.0670.19
Phitsanulok, Thailand b88.3 (11.7)2.70.31.11.31.7
Pune, India c138.2 (68.2)80.30.80.03-
Kocaeli, Turkey d56.9 (24.3)0.2130.0040.0880.1610.125
Agra, India e263 (127)180.1552.462.980.89
Hong Kong, China f63.3 0.4080.0020.0190.1710.105
a This work; b Satsangui et al. [50]; c Srithawirat et al. [51]; d Pekey et al. [55]; e Rohra et al. [56]; f Chao and Wong [3].
Table 4. Parameters used for risk assessment and indoor PM10 elemental concentrations.
Element RfD IURSFG
mg kg−1 d−1
InhalationIngestionAbsorption
FeNA a0.7 c1 cNANANA
Ni0.00005 c0.02 b0.04 c0.00240.0000840.04
Cu0.04 c0.4 c1 cNANANA
Zn0.91 b0.3 b1 cNANANA
Mn0.00005 b0.14 b1 cNANANA
Pb0.0035 c0.1 c1 c0.000080.281
Cr0.000008 b0.003 b0.025 b0.0120.50.025
a Not available. b Values from Integrated Risk Information System (IRIS); USEPA [39]. c Reference values obtained from other authors [40,57].
Table 5. Risk assessment results for inhalation, ingestion, and dermal absorption of PM10 at the Iztapalapa and Tlalnepantla households.
Element HQ inhHQ ingHQ der
MenWomenChildrenMenWomenChildrenMenWomenChildren
FeIzt2.97 × 10−13.47 × 10−12.77 × 1001.02 × 10−31.19 × 10−31.36 × 10−3
Tla1.40 × 10−11.63 × 10−11.30 × 1004.79 × 10−45.59 × 10−46.39 × 10−4
NiIzt1.67 × 10−41.44 × 10−43.89 × 10−43.91 × 10−14.57 × 10−13.65 × 1009.59 × 10−41.12 × 10−31.28 × 10−3
Tla1.71 × 10−46.89 × 10−74.00 × 10−44.03 × 10−14.70 × 10−13.76 × 1003.95 × 10−54.60 × 10−55.26 × 10−5
CuIzt7.94 × 10−76.89 × 10−71.85 × 10−67.46 × 10−18.71 × 10−16.97 × 1001.46 × 10−41.71 × 10−41.95 × 10−4
Tla3.67 × 10−73.92 × 10−88.50 × 10−73.42 × 10−14.00 × 10−13.20 × 1001.68 × 10−31.96 × 10−32.24 × 10−3
ZnIzt4.52 × 10−83.92 × 10−81.06 × 10−71.29 × 10−11.51 × 10−11.20 × 1001.90 × 10−42.21 × 10−42.53 × 10−4
Tla4.39 × 10−82.17 × 10−41.02 × 10−71.25 × 10−11.46 × 10−11.17 × 1001.84 × 10−42.14 × 10−42.45 × 10−4
MnIzt2.50 × 10−42.17 × 10−45.83 × 10−48.39 × 10−29.79 × 10−27.83 × 10−15.75 × 10−56.71 × 10−57.67 × 10−5
Tla2.27 × 10−41.11 × 10−55.30 × 10−47.63 × 10−28.90 × 10−27.12 × 10−15.23 × 10−56.11 × 10−56.98× 10−5
PbIzt1.28 × 10−51.11 × 10−52.99 × 10−54.22 × 10−14.93 × 10−13.94 × 1002.07 × 10−42.41 × 10−42.76 × 10−4
Tla3.25 × 10−51.49 × 10−37.58 × 10−51.07 × 1001.25 × 1009.97 × 1005.23 × 10−46.11 × 10−46.98 × 10−4
CrIzt1.72 × 10−31.49 × 10−34.01 × 10−34.30 × 1005.02 × 1004.02 × 10+12.53 × 10−42.95 × 10−43.38 × 10⁻⁴
Tla1.94 × 10−31.68 × 10−34.53 × 10−34.87 × 1005.68 × 1004.54 × 10+17.15 × 10−58.34 × 10−59.53 × 10⁻⁵
Disclaimer/Publisher’s Note: The statements, opinions and data contained in all publications are solely those of the individual author(s) and contributor(s) and not of MDPI and/or the editor(s). MDPI and/or the editor(s) disclaim responsibility for any injury to people or property resulting from any ideas, methods, instructions or products referred to in the content.

